


Abstract
Urban mobility systems generate large volumes of heterogeneous geospatial data that differ in temporal resolution, spatial coverage, update frequency, and semantic structure, making integrated near-real-time analysis difficult. This paper presents a geospatial big-data framework for integrating and analyzing multimodal urban mobility data from the Norwegian transport ecosystem, including public transport, micromobility, road infrastructure, weather sensing, and civil aviation. The framework is implemented as a modular pipeline for data ingestion, source-specific normalization, temporal alignment, and analytical processing, enabling minute-level comparison across heterogeneous operational feeds. The proposed approach preserves source-level semantics while supporting unified spatiotemporal analysis across transport modes with different operational characteristics. The framework is evaluated through analytical scenarios focused on peak and off-peak mobility dynamics, weather-related multimodal variability, and spatial autocorrelation of public transport activity and delay across four analysis windows and six Norwegian cities. The results show that mobility–weather relationships vary across transport modes and temporal windows, particularly in public transport activity, cycling behavior, and delay patterns, and that spatial clustering of public transport activity and delay is itself city- and window-dependent, with some cities showing strong, stable clustering and others showing none. The findings indicate that multimodal urban mobility should be interpreted as a context-dependent and interconnected spatiotemporal system rather than through isolated modal indicators. The study demonstrates how geospatial big-data integration can support near-real-time urban mobility monitoring and operational analytics in smart-city environments.
1. Introduction
Cities generate increasing amounts of transport and mobility data from sources such as buses, trains, bike-sharing systems, roads, airports, IoT sensors, and other digital urban services. As cities grow and travel demand rises, transport networks become more interconnected and harder to manage. To tackle these challenges, traffic management and smart-city platforms are increasingly using data analytics to monitor operations, improve sustainability, and plan mobility services [1,2,3].
Even though Intelligent Transport Systems (ITS) research has made progress, most studies still focus on one transport mode or on specific infrastructure, like predicting bus arrivals, forecasting traffic, or analyzing local congestion. These works show useful applications of machine learning and big data, but they usually use historical data only and do not reveal how different transport modes interact across the whole city [1,4].
The growing availability of geospatial data opens new possibilities for analyzing urban mobility over time and space. Mobility datasets now come from IoT sensors, smart cards, vehicle telemetry, road sensors, APIs, and third-party platforms, each with different formats, update frequencies, and structures. These differences make it difficult to combine data directly and to perform consistent cross-modal analysis, especially in near-real-time settings where timing is critical for monitoring and decision-making [5].
These issues are particularly evident in national-scale mobility ecosystems like Norway, where public APIs provide data from multiple transport operators and modes, and road and aviation systems add further spatial context. Properly integrating these heterogeneous data streams can reveal system-level patterns that are not visible when examining transport modes separately, including multimodal transfers, peak-time bottlenecks, and weather-sensitive behaviors [6].
However, few existing frameworks combine continuous multimodal ingestion, source-specific normalization, temporal alignment, and joint analytical processing within a unified operational workflow. This gap limits the ability of urban planners and transport operators to evaluate system behavior under different temporal and environmental conditions, including peak and off-peak periods, seasonal variability, and changing weather conditions. To address these challenges, this study proposes a geospatial big-data framework for near-real-time multimodal urban mobility analysis using publicly available data from the Norwegian urban mobility ecosystem, including national public transport feeds, road infrastructure services, shared bicycle systems, weather sensing, and civil aviation data. This approach integrates data from multiple urban transport systems into a common framework that enables time-aligned comparison and analysis across different transport modes. The focus is on operational monitoring and reliable integration of heterogeneous multimodal mobility data under real-world conditions.
2. Related Work
Recent research increasingly looks at transport systems as interconnected rather than separate networks. To understand how buses, trains, bike-sharing systems, and roads interact, many studies use network-based or spatio-temporal models [7,8,9]. Besides technical integration, practical factors like timetables, coordination between operators, and data-sharing rules also influence multimodal analysis [10,11,12]. Open mobility datasets and analytical tooling have matured considerably, enabling broader experimentation with multimodal transport analysis, urban sensing, and system-level monitoring [13]. Rather than focusing on passenger-flow optimization or network-topology design, this study concentrates on an earlier operational step: continuous integration and temporal alignment of heterogeneous mobility data streams in near-real-time [14].
Some projects have looked at combining different urban mobility datasets. For instance, the ILU project in Lisbon integrated public transport and active mobility data to analyze traffic across modes and support urban planning [6]. Studies comparing subway and taxi data showed that multimodal analysis can uncover differences, complementary relationships, and spatial imbalances that single-mode studies would miss [15]. Tools like TraDyssey enable interactive exploration of multimodal trips, highlighting travel time, coverage, and service quality [16]. However, most of these approaches remain retrospective, relying on historical or aggregated data instead of supporting near-real-time operational analysis.
Analytics that work in real time or near real time are becoming more important in smart-city mobility systems. Recent work using graph neural networks, transformers, and other spatiotemporal learning methods combines multiple transport modes to improve congestion prediction and travel time forecasting [17,18]. Research on door-to-door travel time estimation also shows that routing and mobility data often need extra calibration before they can be meaningfully compared across different transport modes [19]. These findings reinforce a practical issue that remains central in multimodal mobility research: data availability alone does not guarantee analytical comparability across heterogeneous transport sources.
Real-time and near-real-time analytics have become increasingly important in smart-city mobility systems due to advances in IoT platforms, sensing technologies, and scalable stream-processing infrastructures. Existing frameworks combining IoT, AI, and predictive analytics demonstrate how different mobility datasets can support adaptive traffic management, route optimization, and operational decision support [20]. A substantial part of this research focuses on traffic optimization through reinforcement learning and predictive control methods that dynamically adjust traffic signals using live traffic conditions and short-term forecasts [21]. Other studies investigate UAV-based traffic monitoring systems that extend the spatial coverage of conventional sensing infrastructure and support real-time situational awareness through edge-based analytics [22]. Review studies consistently identify real-time processing and AI-assisted analytics as important components of adaptive traffic management systems [23]. However, many of these approaches remain centered on road traffic optimization, localized monitoring, or vehicle-centric scenarios rather than broader multimodal operational analytics.
From a systems perspective, extensive research has addressed scalable big-data architectures for intelligent transportation systems. Existing work commonly proposes layered architectures that separate data ingestion, storage, processing, and analytics components to support heterogeneous transport data at scale [24]. Survey-based studies also highlight the need to combine batch and stream processing in order to support both historical analysis and near-real-time operational tasks while dealing with interoperability, latency, and scalability issues [25]. Big-data frameworks based on technologies such as Hadoop, Spark, and Kafka have been widely applied to traffic prediction, congestion monitoring, visualization, and connected-vehicle analytics [26]. Related studies on real-time urban mobility analytics similarly highlight the importance of scalable infrastructures and continuous processing capabilities for smart-city traffic management [27]. Additional research on distributed big data analytics architectures highlights how scalable and modular stream-processing frameworks can enhance real-time responsiveness, data management efficiency, and fault tolerance in intelligent transportation environments characterized by continuously generated vehicle sensor data and fluctuating processing demands [28]. Cloud-based smart transportation architectures further extend this direction by supporting large-scale data integration, distributed analytics, and scalable computational services for real-time traffic monitoring, intelligent mobility management, and predictive transportation applications [29].
Across these architectural approaches, the literature shows that big-data technologies and real-time analytics can be successfully applied to transportation systems at scale. However, a closer look reveals a persistent fragmentation between analytical goals, the characteristics of the data, and how integration workflows are designed.
Many current implementations focus on single-mode traffic scenarios, prediction-oriented pipelines, or simulation-based environments. Multimodal normalization and temporal alignment are often treated as secondary preprocessing steps rather than central components of the analysis [14,26,28]. Comparative and multilayer perspectives do offer useful frameworks for representing multimodal infrastructure and the interactions between different transport modes at the network level [13]. Yet they still fall short of addressing the operational challenge of continuously integrating heterogeneous geospatial mobility feeds in near real time.
Compared to these approaches, the framework proposed here differs in scope and operational focus. Prior integration efforts such as the ILU project [6] and subway-taxi comparisons [15] focus on planning-oriented analysis using historical or batch-processed data rather than continuous ingestion. TraDyssey [16] supports interactive multimodal trip exploration but does not address the underlying integration of heterogeneous live data feeds. Generic layered big-data architectures [24,25,26,28,29] address ingestion, storage, and analytics at a system level, but are largely mode-agnostic and do not resolve the semantic heterogeneity across operationally distinct feeds such as scheduled public transport, dockless bike-sharing, flight operations, and road-sensor data. In contrast, this study combines five heterogeneous, operator-specific data sources spanning public transport, micromobility, road infrastructure, weather sensing, and civil aviation within a single near-real-time pipeline, applying source-specific normalization prior to temporal alignment so that mode-level semantics are preserved rather than flattened into a generic schema. What remains largely unexplored is a framework that unifies continuous multimodal ingestion, source-specific normalization, spatiotemporal alignment, and analytical processing within a single operational pipeline suitable for complex, real-world urban transport systems.
3. Materials and Methods
3.1. System Architecture Overview
This study uses a system designed to integrate different types of urban mobility and environmental data in near real time. The framework brings together public transport feeds, bike-sharing systems, road and air traffic data, and weather observations. These data are processed in a pipeline that normalizes formats, aligns timestamps, and allows for comparisons across transport modes.
The system uses a layered structure that separates data ingestion, processing, and analysis. This supports consistent handling of heterogeneous mobility data while allowing both historical and near-real-time analysis. Incoming data are processed through a central pipeline where records are normalized, temporally aligned, and prepared for multimodal analytics.
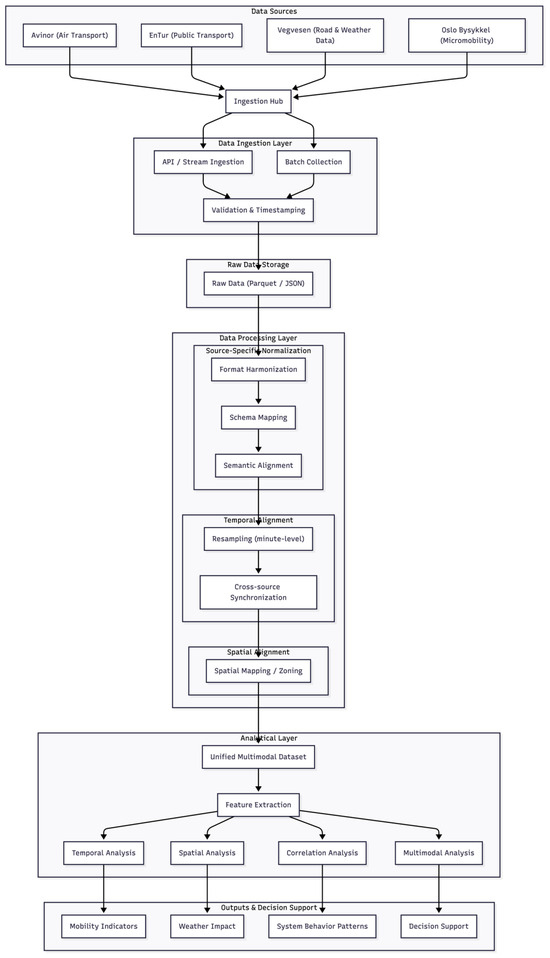
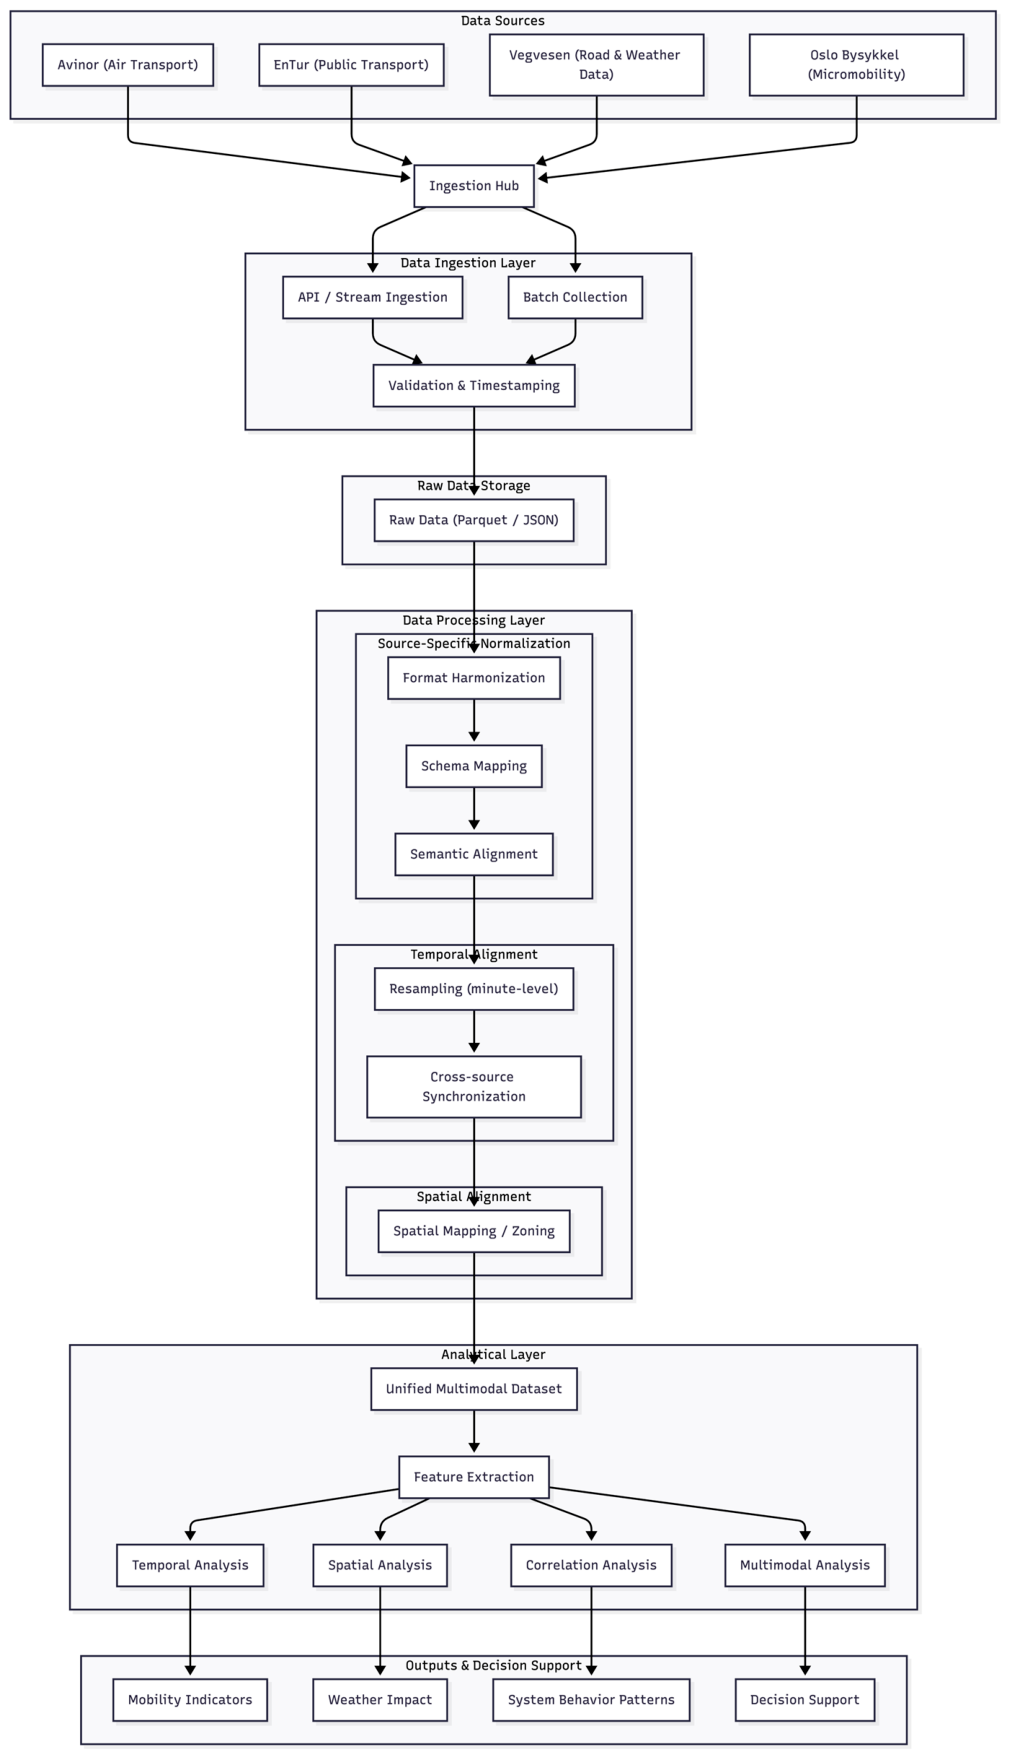
The architecture is designed to interoperate with other urban services when needed. However, the focus of this work is limited to the components directly involved in data integration and analysis. Figure 1 provides an overview of the main architectural layers and data flows. It illustrates how heterogeneous geospatial mobility streams are transformed into a unified spatio-temporal analytical representation of urban mobility conditions.
Figure 1.
Overview of the main architectural layers and the data flow between them.
3.2. Data Sources
Data ingestion in this study spans the Norwegian national mobility ecosystem. The spatiotemporal analysis presented in Section 4 combines an Oslo-specific bicycle signal with nationally aggregated weather and public transport data; Section Spatial Autocorrelation of Public Transport Activity and Delay Across Norwegian Cities, extends the analysis further, applying the same nationally aggregated data sources to five additional Norwegian cities. Public transport and aviation feeds are collected at national scale, covering all 26 Entur code space operators and all airports served by Avinor. However, the analytical scenarios in this study draw on data within the Oslo metropolitan bounding box (59.85–60.00° N, 10.60–10.85° E): shared bicycle data are Oslo-specific by design, road-surface weather sensing and the public transport indicators discussed in the results are national aggregates, drawn from all Vegvesen stations and all Entur operators, respectively.
The proposed framework integrates multiple heterogeneous geospatial data sources related to urban mobility in Norway. The selected datasets cover public transport operations, air traffic activity, road-network conditions, environmental sensing, and shared mobility services. Data are collected through publicly available and operator-provided APIs using either near-real-time streaming or frequent periodic updates.
Public transport data are obtained through the Entur API [30], which serves as the national platform for public transport information in Norway. The system collects data from 26 transport operators, identified by their respective Entur code space identities (AKT, ATB, AVI, BNR, BRA, FIN, FLT, GJB, GOA, INN, KOL, MOR, NBU, NOR, NSB, OST, RUT, SJN, SKY, SOF, TEL, TRO, VKT, VOT, VYB, VYG, VYX). These data include scheduled timetables, real-time vehicle positions, service updates, and delay information across multiple transport modes, such as buses, trams, trains, ferries, and regional services. The Entur API is based on standardized formats, including General Transit Feed Specification (GTFS) and GTFS-Realtime, which facilitates systematic integration while still requiring normalization across operators. The inclusion of multiple operators ensures broad geographic coverage and reflects the diversity of operational practices within the national public transport system.
Air traffic data are retrieved from the Avinor API [31], which provides both static and real-time information for civil aviation in Norway. The collected data include flight schedules for departures and arrivals, flight status indicators such as on-time performance, delays, and cancelations, as well as airport metadata with standardized airport codes. These data enable air transport to be considered alongside surface-based modes when analyzing multimodal travel chains and temporal dependencies, particularly for long-distance and interregional mobility.
Road traffic and environmental conditions are captured using open data services provided by Statens Vegvesen, the Norwegian Public Roads Administration [32]. Traffic situation data are collected through DATEX II, a European standard for exchanging traffic and travel information, and include information on road works, incidents, disruptions, and traffic restrictions. Measured travel time data provide segment-level travel durations, supporting the analysis of congestion patterns and temporal variability on the road network. Weather-related data are obtained from roadside sensors and include meteorological measurements relevant to driving conditions. Together, these datasets offer a dynamic view of road transport performance and external factors affecting mobility.
Shared bicycle data are obtained from the Oslo Bysykkel system [33] through a General Bikeshare Feed Specification (GBFS) interface. The system integrates three main endpoints: system information, station information, and station status. These data provide details on operator metadata, station locations and capacities, and near-real-time availability of bicycles and docking points. This data source represents an active mobility mode and supports the analysis of short-distance and last-mile transport dynamics within the urban area.
In addition to their operational role, these datasets represent different forms of geospatial urban sensing. Public transport feeds provide network-scale movement dynamics, roadside infrastructure sensors capture localized environmental and traffic conditions, aviation feeds contribute interregional mobility context, while bike-sharing systems reflect fine-grained urban activity patterns. Their integration enables a unified spatio-temporal perspective on multimodal urban behavior across multiple spatial and temporal scales.
The combination of these sources results in a large-scale multimodal geospatial dataset characterized by differences in temporal resolution, spatial granularity, update frequency, and semantic structure. These characteristics motivate the development of a dedicated spatio-temporal integration workflow capable of supporting continuous ingestion, normalization, and comparative urban analytics across heterogeneous urban sensing streams.
3.3. Data Ingestion and Normalization
Because the urban sensing sources differ widely in structure, update frequency, spatial detail, and meaning, we first apply a dedicated spatio-temporal normalization step before combining them for cross-modal analysis. The inputs include environmental sensors, bike-sharing data, flight operations, public transport delays, road travel times, and traffic events. As they come, these datasets cannot be directly combined, and they need harmonization first.
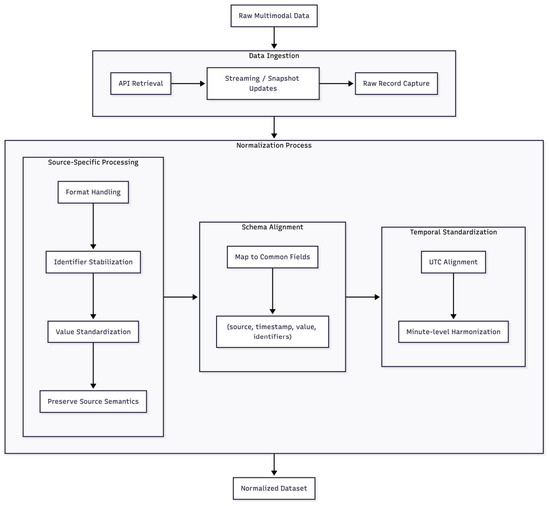
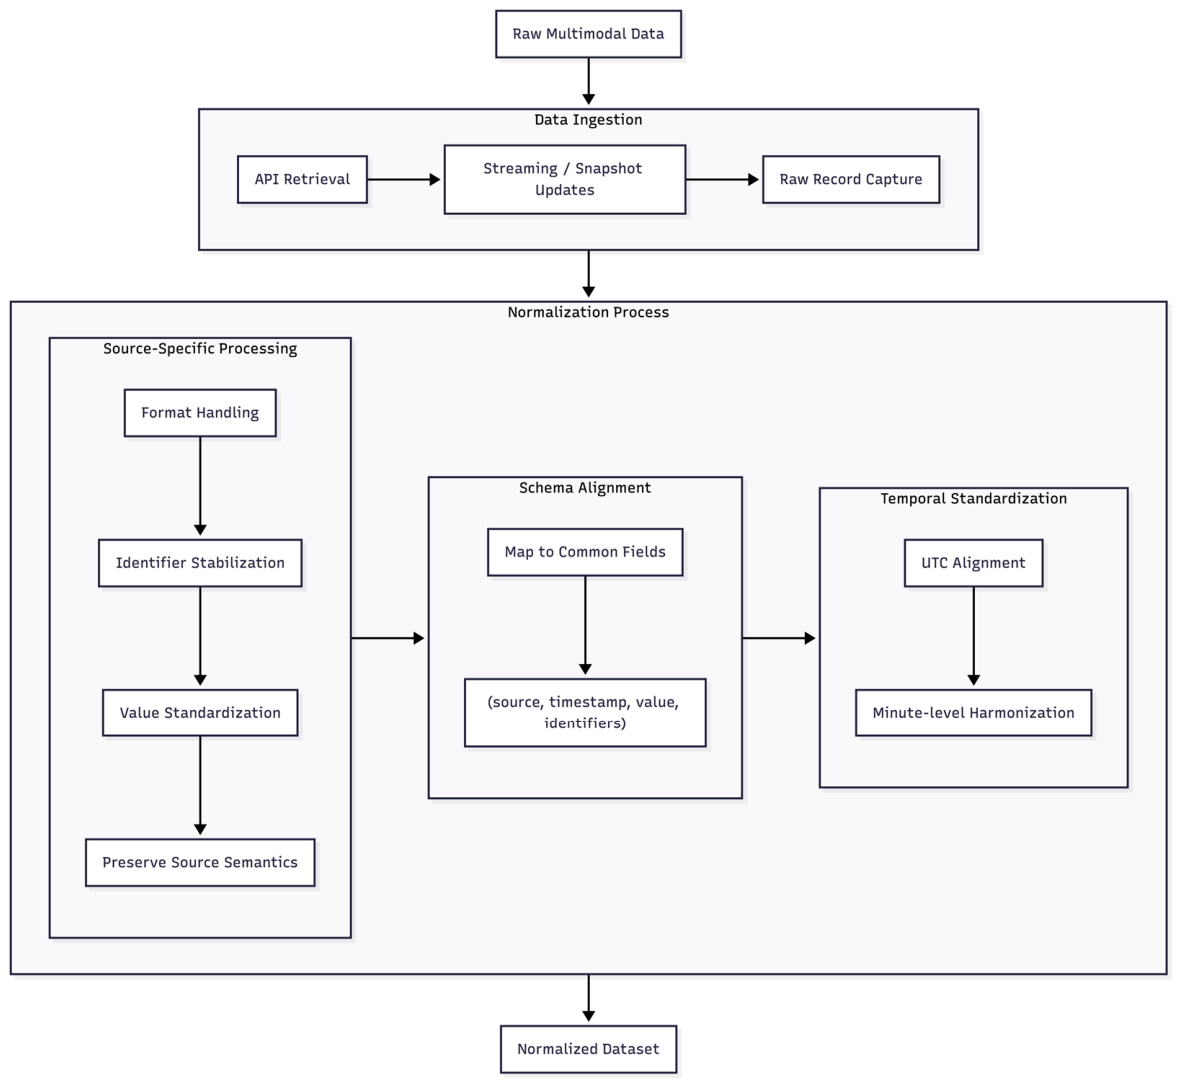
Our pipeline handles this in two stages: first, source-specific preprocessing, and then schema alignment. This sequence is intentional: each dataset is cleaned and standardized according to its own logic before being mapped to a common structure. During normalization, timestamps are standardized, identifiers are stabilized, numeric values are cast consistently, and source-specific meanings are preserved. Figure 2 illustrates this workflow.
Figure 2.
Data ingestion and normalization workflow for multimodal mobility data.
A common temporal policy is used throughout the pipeline. All records are aligned to UTC time, and analysis-facing datasets are prepared for minute-level compatibility to support robust temporal joins under near-real-time conditions. This minute granularity provides a practical compromise between retaining short-term dynamics and reducing sensitivity to asynchronous API update cycles. For persistence and reproducibility, normalized outputs are stored as date-partitioned Parquet files (normalized/YYYY-MM-DD/<source>normalized<run_timestamp>.parquet), enabling efficient retrospective retrieval and controlled reprocessing.
At the record level, the normalized datasets follow a common structure that includes source label, timestamp, observed metric value, and source-specific identifiers such as station, trip, route, or location reference. This makes it possible to combine and compare data across sources while still preserving the meaning of individual mobility indicators. In cases where raw feeds do not provide directly usable indicators, additional features are derived from the available fields for analytical purposes.
Schema alignment is performed after source-level transformations so that changes in upstream formats or missing fields do not interrupt later stages of the analysis pipeline. This is important in operational mobility systems, where public APIs and feed structures often change over time. The normalization layer therefore supports both batch and near-real-time processing while allowing additional data sources and indicators to be added when needed.
The layered organization follows interoperability principles commonly discussed in multimodal ITS and geospatial big-data architectures, where heterogeneous urban sensing streams are integrated through modular ingestion, harmonization, and analytical processing layers [14,34].
Table 1 summarizes the main normalization procedures applied across the integrated mobility and infrastructure data sources. Source-specific transformations were adapted to differences in temporal structure, update frequency, and operational semantics while preserving comparability within the unified analytical framework.
Table 1.
Normalization procedures applied across data sources.
Timestamps and core record fields are standardized across all sources, while each dataset still preserves the information specific to its transport mode and operational context. This supports cross-modal analysis without removing important source-specific differences.
3.4. Data Processing and Analytical Procedure
After normalization, each dataset is processed according to its spatial coverage, update frequency, and role within the urban sensing context. Environmental observations from roadside sensors serve as contextual variables, while public transport, shared mobility, and aviation data indicate urban mobility activity. This separation ensures that each data type can be aggregated and analyzed appropriately. For public transport (PT) specifically, two indicators are derived from normalized Entur SIRI-ET records: PT activity, defined as the number of stop-level updates recorded within a given time interval, and PT delay, defined as the mean stop-level delay within the same interval. Both indicators are computed at the city level for the temporal analysis in Section 4.1 and Section 4.2, and at the zone level for the spatial comparison in the Section Spatial Autocorrelation of Public Transport Activity and Delay Across Norwegian Cities.
For cross-modal analysis, all datasets are aligned to a common temporal reference and aggregated into one-minute intervals. Environmental measurements are averaged, while mobility indicators are represented through counts and sums. This helps reduce noise caused by irregular updates while retaining near-real-time temporal patterns. Aggregated datasets are then combined using time-based joins, with weather data as a temporal baseline due to its continuous coverage and influence across modes.
The workflow supports two analyses. First, it examines time-of-day mobility patterns, comparing peak (weekday commuting hours, 07:00–09:59 and 15:00–17:59 UTC) and off-peak activity using minute-level aggregated indicators. Second, it evaluates weather effects by correlating road surface temperature with multimodal mobility indicators using Pearson correlation coefficients, considering only intervals with valid data for both variables.
For public transport, stop-level activity and delay are additionally aggregated into spatial zones to test for spatial autocorrelation across Norwegian cities (Section Spatial Autocorrelation of Public Transport Activity and Delay Across Norwegian Cities). Separately, the multimodal index aggregates bicycle and PT activity into a single per-minute value, representing intra-urban mobility intensity. Flight activity is analyzed separately throughout this study, rather than folded into the index, since airport infrastructure is not present in every urban zone and its inclusion would mix hub-scale aviation effects with intra-urban travel patterns. Since these indicators operate on different scales, each is min-max normalized within its analysis window before summation:
where is the set of modes included (bicycle and public transport), is the raw value of mode at minute , and missing values are set to zero before scaling. All modes are weighted equally, and PT delay is excluded from the index. Zero imputation is justified differently for each mode. For bicycle activity, missing minutes reflect the source’s own ~180 s refresh cycle, confirmed empirically from observed timestamps, rather than lost data. For PT activity, the vast majority of missing minutes (98%) fall in the overnight hours (01:00–05:00 UTC) when Norwegian PT service is genuinely minimal; the small remainder occurring during active daytime hours is more likely explained by brief feed-level gaps, as spot-checking against Entur’s live schedule confirmed real departures were running at one such minute despite no record being captured. Given how small and infrequent this second category is, its influence on the reported results is expected to be minor. Since normalization is performed separately for each window, index values are only comparable within a given period; pooled comparisons across windows reflect relative activity concentration rather than absolute mobility levels. Because missing values for individual modes are set to zero before summation, the multimodal index has a valid value for every minute in the window; its sample size is therefore larger than that of any individual mode, which only includes minutes with an actual observation. As a robustness check, we additionally computed the index including flight activity (bike + PT + flight, the composition used in earlier stages of this analysis); results for both versions are reported in Section 4.1 and Section 4.2. The workflow is designed to be reproducible and extensible, allowing new mobility sources or environmental data to be integrated without altering core normalization and alignment processes, supporting scalable, multimodal urban analytics under real-world conditions.
4. Results
4.1. Spatio-Temporal Multimodal Mobility Patterns
To analyze multimodal mobility patterns across space and time, peak and off-peak activity were compared across four defined time windows: W-A1 (20–27 December 2025), W-A2 (28 December 2025–4 January 2026), W-B (31 January–7 February 2026), and W-C (7–14 Mar 2026). PT activity, as defined in Section 3.4, was aggregated at the city level across these four windows using the peak/off-peak definition introduced in Section 3.4. Beyond this city-level temporal comparison, we also test whether peak-hour concentration is spatially structured within cities, using Global Moran’s I on zone-level data across six Norwegian cities (reported at the end of this section).
All temporally aligned multimodal datasets were aggregated into one-minute intervals to ensure consistent comparisons across modes. To quantify time-of-day effects, peak/off-peak ratios were calculated as the mean activity during peak periods divided by the mean activity during off-peak periods. Values above 1 indicate a higher concentration of activity during commuting hours, while values close to 1 suggest a more uniform intraday pattern.
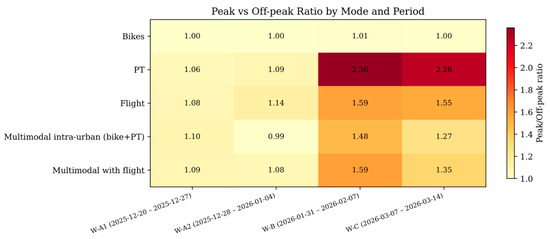
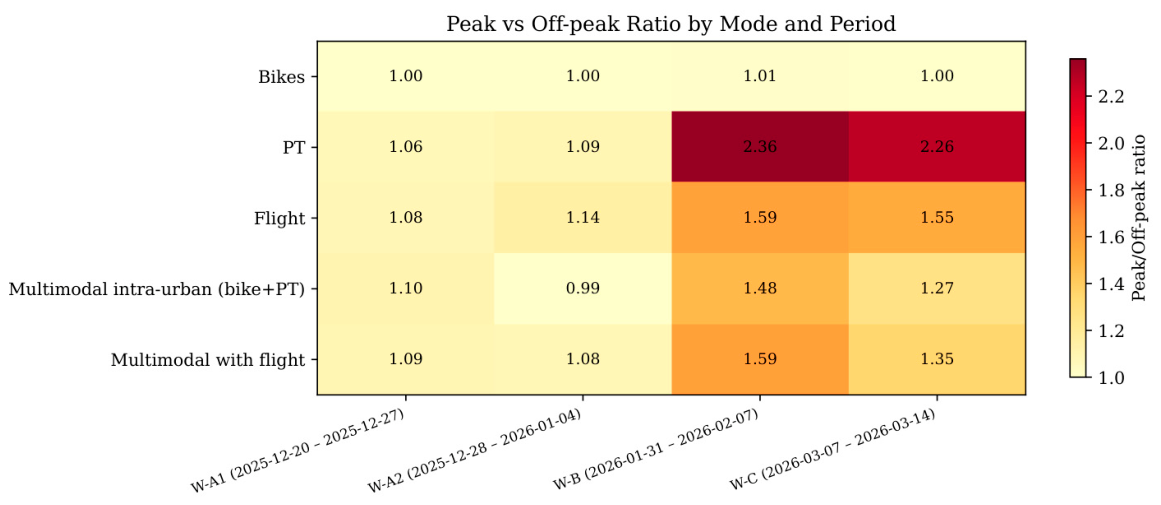
Figure 3 shows mode-specific temporal dynamics. PT activity displays relatively weak peak concentration during the winter holiday windows (W-A1 and W-A2), but substantially higher concentration during commuting hours in late-winter periods (W-B and W-C). Shared bicycle activity remains nearly constant across all windows, while flight activity shows moderate peak amplification. The intra-urban multimodal index (bike + PT) follows a broadly similar pattern to PT, though somewhat dampened, reflecting bicycle activity’s near-flat contribution to the sum.
Figure 3.
Peak/off-peak activity ratio by mode and period heatmap.
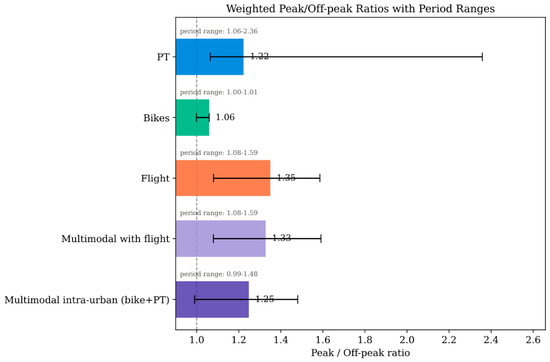
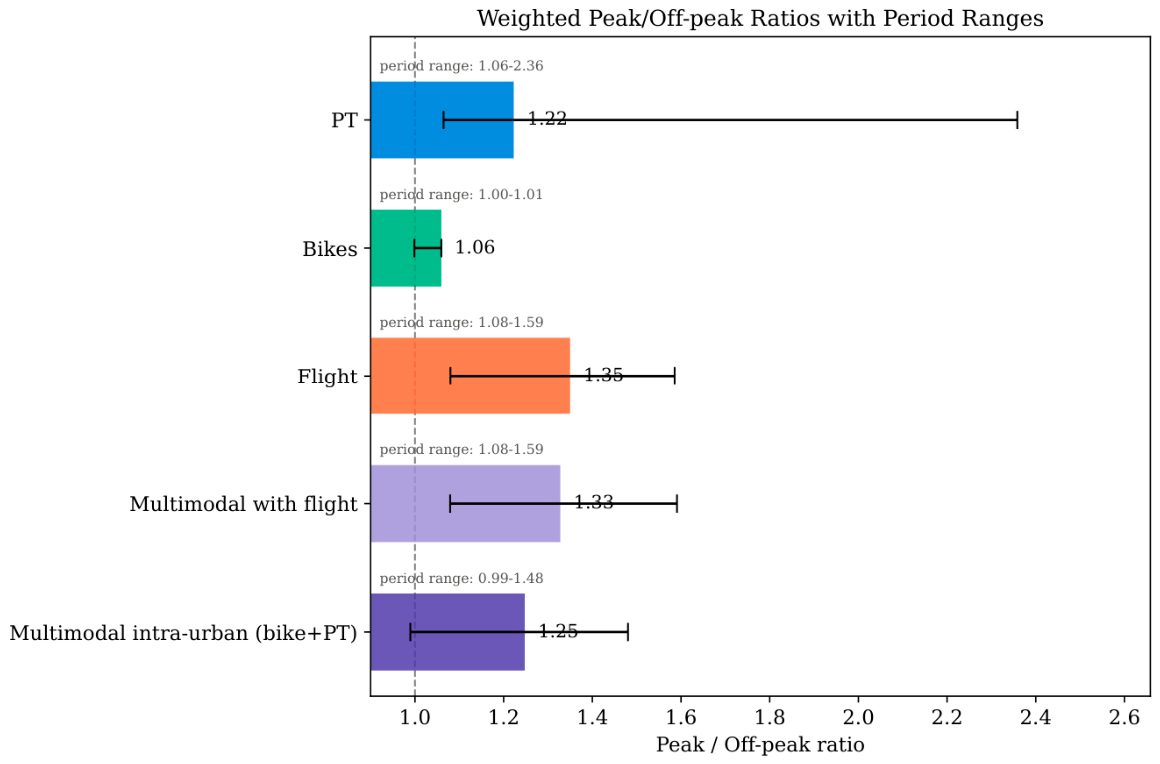
As shown in Figure 4, pooled peak/off-peak ratios across all periods indicate the strongest concentration for flights (1.35), followed by PT activity (1.22). Bicycle activity remains largely flat (1.06). The intra-urban multimodal index (bike + PT) shows a moderate pooled ratio of 1.25, close to but somewhat higher than PT alone, reflecting bicycle’s dampening effect on the combined signal. Including flight activity in the index (bike + PT + flight) raises this to 1.33, consistent with flights’ own strong peak concentration. PT also exhibits the greatest variation across windows, from nearly flat holiday periods (ratio 0.99–1.10) to strongly peak-driven late-winter periods (ratio 2.36).
Figure 4.
Minute-weighted peak/off-peak activity ratios by transport mode, with period-specific ranges (W-A1, W-A2, W-B, W-C). The dashed vertical line at 1.0 marks no difference between peak and off-peak activity; bars extending further right indicate stronger peak-hour concentration.
Table 2 gives the sample sizes, means, ratios, and Welch’s t-test results behind these pooled numbers. Significance and effect size do not always agree; bicycle activity in W-A1 and W-A2 has a ratio of essentially 1 (0.999), yet for p < 0.001, the large n from minute-level sensing makes even a negligible difference “significant”. PT activity shows the reverse pattern in W-B and W-C: both the ratio (2.26–2.36) and the p-value (<0.001) point to a real, substantial peak-hour effect, not a sample-size artifact.
Table 2.
Peak vs. off-peak activity by mode and window (Welch’s t-test).
PT delay also stands out in the holiday windows. Delay is lower during peak hours in W-A1 (ratio 0.829, p = 0.050) and W-A2 (ratio 0.750, p < 0.001)—the opposite of the later-season pattern. A likely explanation is reduced road traffic in Oslo over the Christmas period, leaving PT services less exposed to congestion-related delay even during nominal commuting hours. This has not been tested directly here and is offered as a plausible factor rather than a confirmed one.
The two multimodal index variants in Table 2 show a consistent robustness pattern: the aviation-inclusive version has a somewhat stronger peak effect throughout (e.g., W-B ratio 1.591 vs. 1.480; W-C ratio 1.354 vs. 1.265), consistent with flight activity itself being more concentrated during commuting hours. The overall temporal pattern-flat in the holiday windows, strongly peak-driven in W-B and W-C-holds for both variants.
Pairwise correlations among mobility modes were computed to assess whether modes move together or substitute for one another (Table 3). PT and flight activity stand out as the most consistent pair, positively correlated in three of the four windows (r = 0.28–0.30, p < 0.001 in W-A1, W-B, W-C). Notably, this relationship disappears in W-A2 (r = −0.088, p = 0.141)—even the most stable pair in the dataset is not immune to the context-dependence seen throughout the rest of the results.
Table 3.
Pairwise Pearson correlations among mobility modes, by window *.
Every other pairwise relationship shifts across windows, often reversing sign. Bike-PT is weakly positive in W-A1 (0.085, n.s.), turns negative in W-A2 (−0.118, marginal), and is essentially zero in W-B and W-C. Bike-flight follows a similar path, becoming significantly negative in W-A2 (−0.134) before flattening out later in the season. PT-delay shows the sharpest reversal: negative and significant in W-A1 (−0.196) but positive and significant in W-A2 (0.124), despite the two windows falling in consecutive weeks. By W-B and W-C, this correlation has faded to near zero.
This instability, including the brief disappearance of the one otherwise-consistent PT-flight relationship, argues against a fixed set of cross-modal rules governing urban mobility. Instead, it supports treating multimodal mobility as a context-dependent system, the interpretation this study argues for throughout.
To add a spatial dimension to this temporal analysis, we computed the same peak/off-peak ratio for PT activity at the zone level, using a grid-based zoning scheme with queen contiguity spatial weights (described in full in Section Spatial Autocorrelation of Public Transport Activity and Delay Across Norwegian Cities), and tested for spatial clustering with Global Moran’s I (Table 4).
Table 4.
Global Moran’s I for zone-level PT activity peak/off-peak ratio, by city and window.
Spatial clustering of the peak/off-peak ratio varies considerably by city and window. Oslo and Bergen show significant clustering in both windows, but the strength roughly quadruples from W-B to W-C; Trondheim moves from marginal to null; and Tromsø’s coefficient changes sign entirely, though it is not significant in either window. Kristiansand is the only city with a stable, significant result across both windows (I ≈ 0.25–0.30, p < 0.03), and Stavanger shows no significant clustering in either. Taken at face value, this instability is consistent with this study’s broader finding: even where peak-hour travel behavior is spatially structured, that structure is not a fixed property of a city but can shift substantially between observation windows just weeks apart. Given this instability, we treat the result as suggestive rather than conclusive and note it as a direction for further investigation with a longer observation period.
4.2. Weather-Related Effects in Multimodal Urban Mobility
Road surface temperature, measured by Vegvesen roadside sensors, was used as a contextual environmental variable to investigate weather-related effects on multimodal mobility. Measurements were aggregated into one-minute averages across all available stations.
Mobility indicators were constructed separately for each transport mode. Bicycle activity was measured as the total number of bicycles in use, PT activity through minute-level Entur updates, aviation activity through the number of flight-related events per minute, and multimodal activity through a combined index of temporally aligned mode streams. PT delay was expressed as the mean delay within each minute interval.
Associations between road surface temperature and mobility indicators were quantified using Pearson correlation coefficients calculated on temporally aligned one-minute intervals containing valid observations for both variables (Table 5).
Table 5.
Pearson correlations between road surface temperature and mobility indicators across analysis windows.
Table 5 shows that across windows, bicycle activity shows the strongest temperature sensitivity, including a strong negative association in W-A2 (r = −0.709, p < 0.001, n = 755) and a moderate positive association in W-A1 (r = 0.425, p < 0.001, n = 614). Both correlations are precisely estimated, with 95% confidence intervals well clear of zero. PT activity correlations remain small across all windows (r = 0.026–0.090), reaching significance in W-A1, W-B, and W-C due to large sample sizes, but with confidence intervals close to zero throughout. Flight activity shows a similarly small but significant negative correlation in W-B (r = −0.148, p < 0.001), while W-A1 and W-C show no association at all (p > 0.9).
The two multimodal index variants in Table 5 diverge more than in the peak/off-peak comparison. The intra-urban index (bike + PT) is mostly small and non-significant (r = −0.036 to 0.027), but including flight activity flips the picture at two windows: W-A1 shifts from a weak negative association (r = −0.036, p = 0.076) to a weak positive one (r = 0.024, p = 0.237), and W-C shifts from a small but significant positive association (r = 0.027, p = 0.029) to a non-significant one (r = 0.006, p = 0.613). This indicates that including aviation activity can mask or alter the underlying intra-urban signal, reinforcing our decision to treat flight activity separately rather than folding it into a single composite index.
As shown in Table 6, sensitivity analysis using winsorized and log-transformed delay values shows that the delay-temperature relationship depends on how extreme delay values are handled. In W-A1 and W-A2, the three treatments agree closely, and the raw correlation is not an artifact of outliers. In W-B and W-C, the picture changes: the raw correlation is small and non-significant (r = 0.018–0.019, p > 0.1), but winsorizing and log-transforming reveal a clear positive association (up to r = 0.280, p < 0.001 for log1p in W-C). This points to a small number of extreme delay values masking an otherwise real relationship in the raw data for these two windows, rather than the reverse.
Table 6.
Pearson correlation between road surface temperature and mean public transport delay under alternative treatments of the delay series, by analysis window.
Mean road surface temperature also varies substantially across analysis windows (W-A1: −0.7 °C; W-A2: −4.6 °C; W-B: −6.9 °C; W-C: 4.1 °C), providing additional context for interpreting the observed differences between periods.
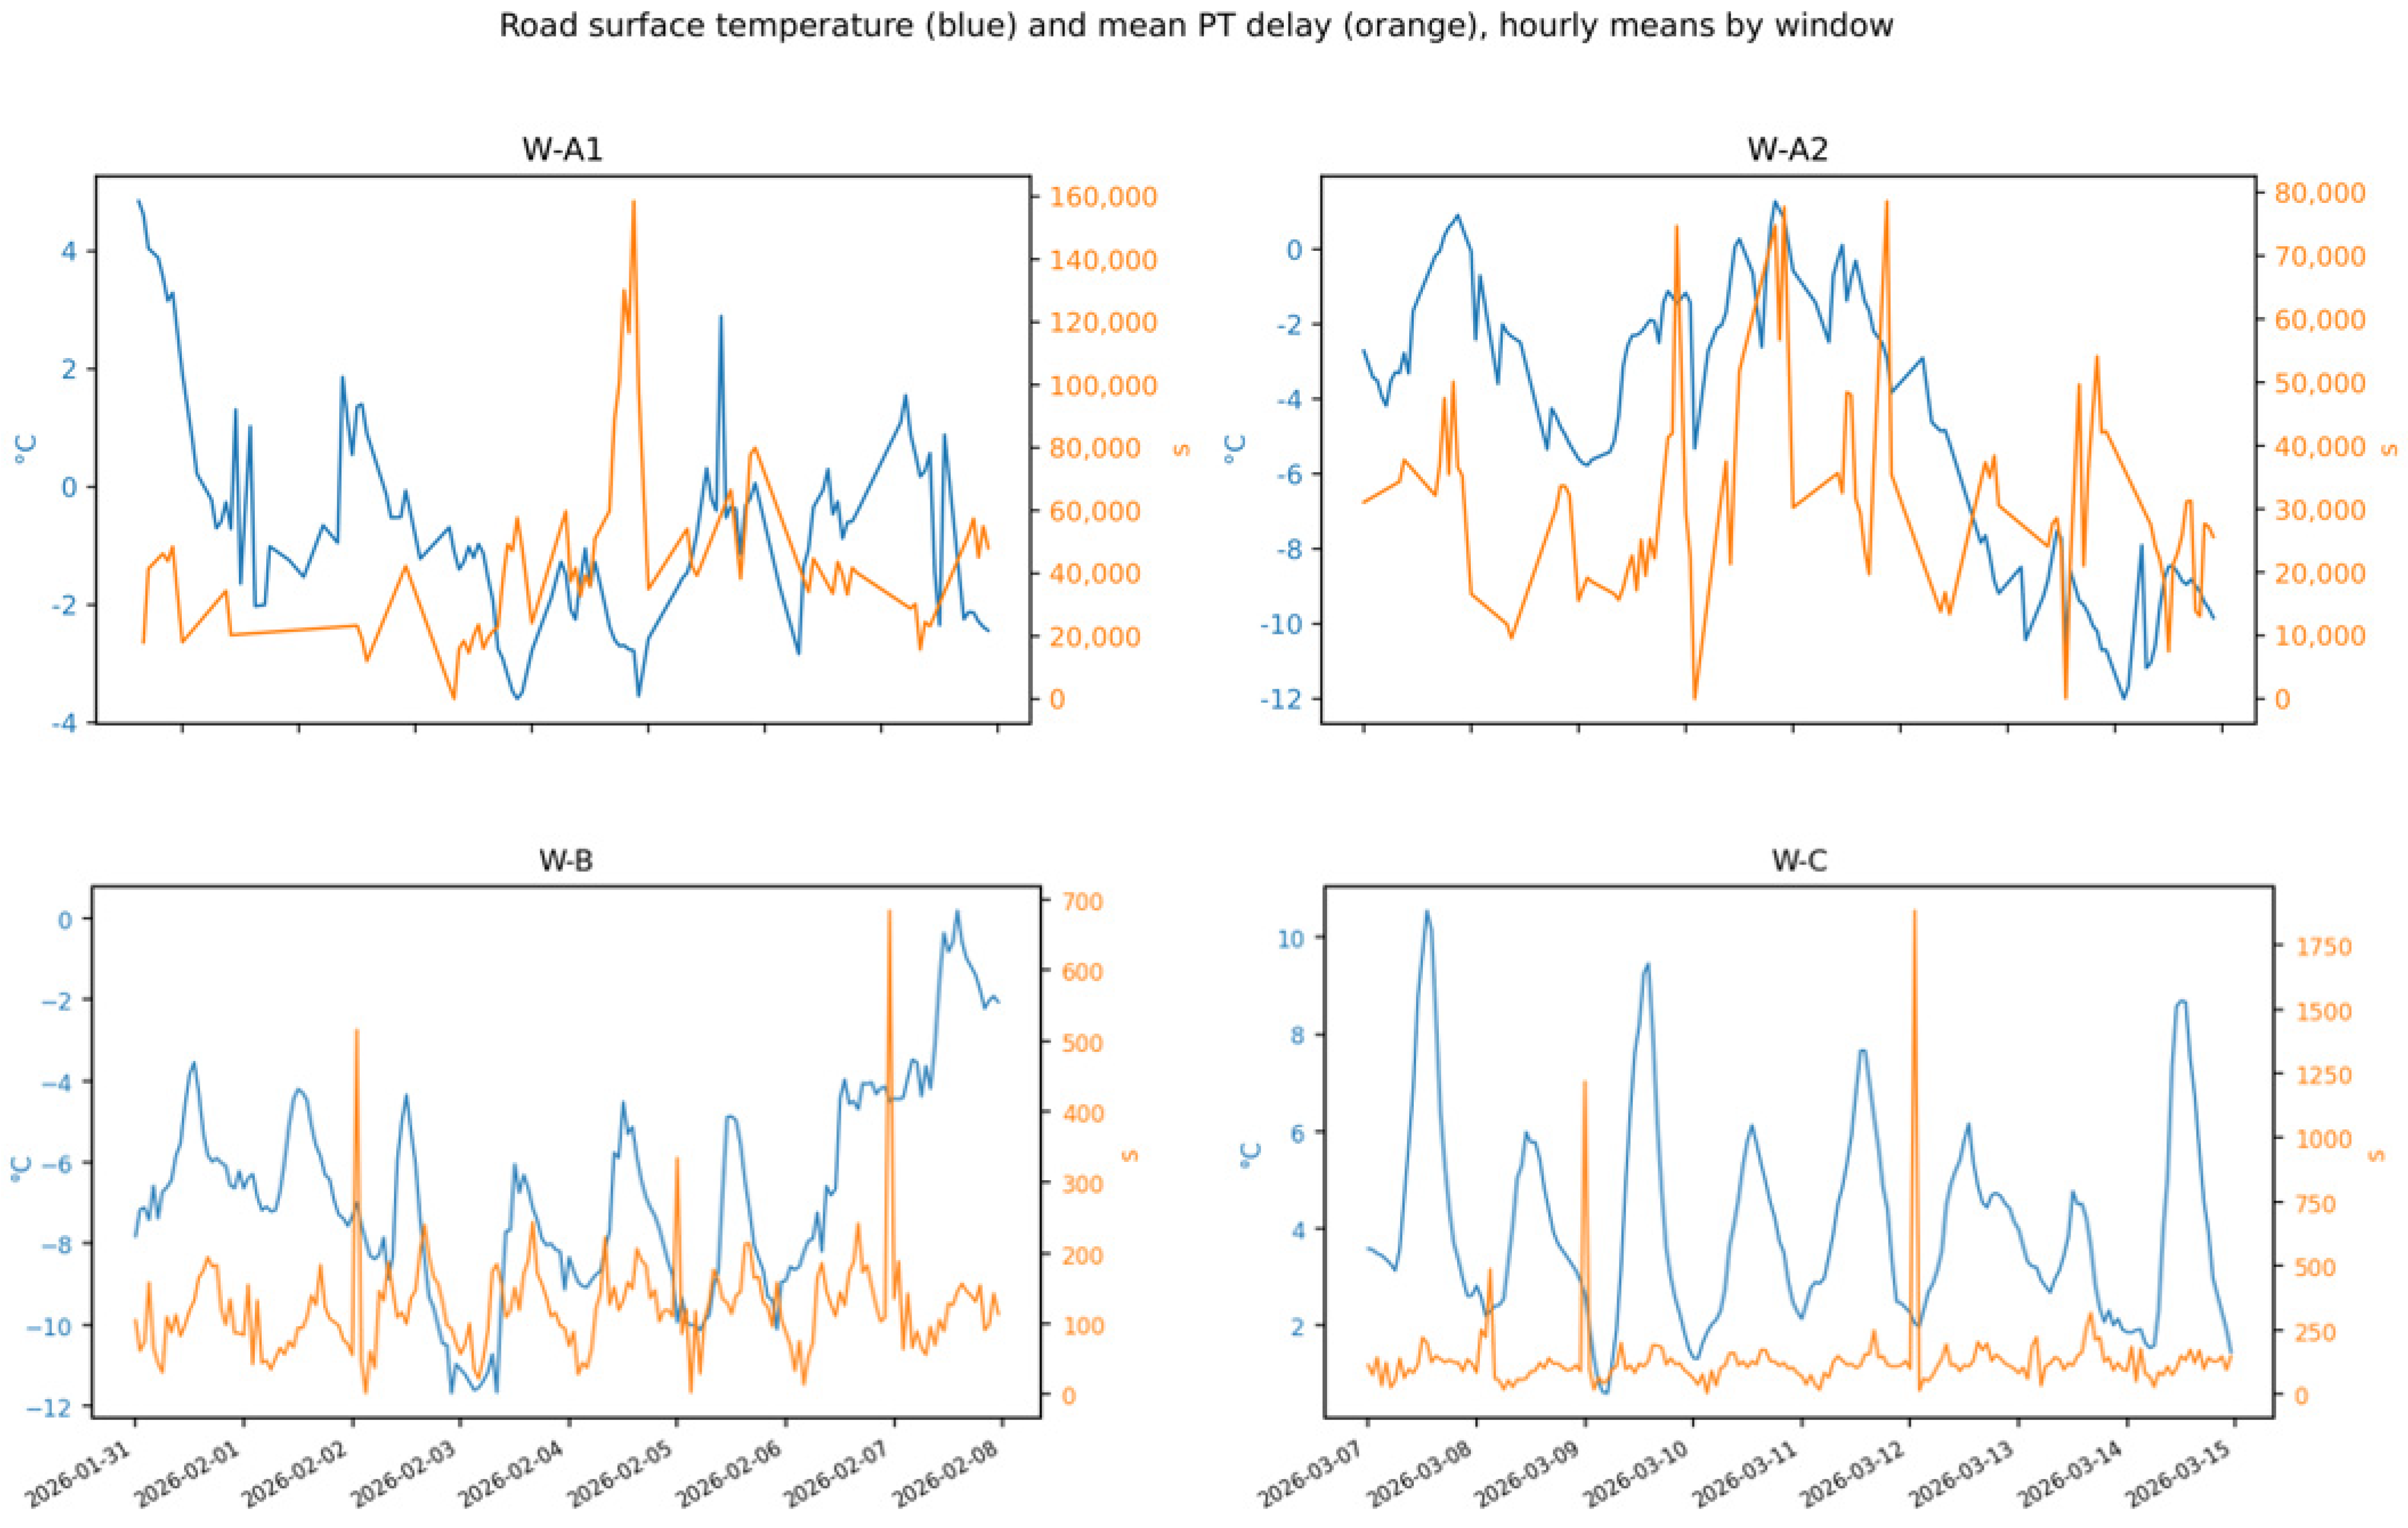
Figure 5 illustrates the spatio-temporal co-variation between road-surface temperature and PT delay across the four observation windows. Road temperature generally evolves smoothly over time, while delay patterns are characterized by short-duration spikes and irregular variability. Visual comparison supports the interpretation that delay dynamics are influenced by multiple operational factors beyond weather conditions alone.
Figure 5.
Time series of road surface temperature (°C) and mean public transport delay (s) for the four analysis windows.
Spatial Autocorrelation of Public Transport Activity and Delay Across Norwegian Cities
Section 4.2 shows that the relationship between weather and mobility is not a single city-wide coefficient: correlation strength and even sign vary depending on when the relationship is measured. This section asks a complementary geo-spatial question, extending the analysis toward genuine spatial statistics: does public transport activity and delay itself cluster spatially, and is that clustering consistent across Norwegian cities, or is it-like the weather relationship-context-dependent?
To answer this, stop-level public transport data are analyzed across six Norwegian cities, chosen for geographic spread across the country and confirmed stop-level data density: Oslo (RUT), Bergen (SKY, Skyss), Trondheim (ATB, AtB), Stavanger (KOL, Kolumbus), Kristiansand (AKT, Agder Kollektivtrafikk), and Tromsø (TRO, Troms fylkestrafikk). The Entur SIRI-ET collector already polls all Norwegian regional transport operators, not only Ruter, and stops are geocoded via the same nationally aggregated static GTFS feed (Entur stops-and-timetable-data service [35]) that covers the whole country (158,707 stops nationally) rather than Oslo alone-so no additional data collection was required for this extension.
Stops are grouped into spatial zones using a regular 1 km × 1 km grid over each city’s extent, retaining only cells with at least 15 GTFS stops (85 zones for Oslo, 43 for Bergen, 41 for Trondheim, 25 for Stavanger, 25 for Kristiansand, 23 for Tromsø; 242 zones in total). A grid-based scheme is used because Moran’s I and LISA require a well-defined neighbor structure between zones, with grid cells that share an edge or corner treated as neighbors.
For each zone, two metrics are computed as whole-window aggregates (rather than the per-minute values used for the temperature correlation in Section 4.2): PT activity, the total count of stop-level SIRI-ET updates recorded at stops in that zone over the analysis window, and PT delay, the mean arrival delay across those updates. Spatial weights use queen contiguity (shared edge or corner) between grid cells, computed separately per city; because the six cities are hundreds of kilometers apart, cross-city weights are correctly zero without any additional distance cutoff. A minority of cells (varying by city) have no queen-adjacent neighbor that also cleared the 15-stop threshold; these are connected to their two nearest zones by centroid distance, the standard treatment for isolated units in spatial-weights construction. Even with this correction, the resulting weights matrix is not always a single connected graph-several cities’ grids split into 2–6 disconnected spatial components (sub-clusters of adjacent zones with no path to the rest of the city’s grid)-which does not invalidate Global or Local Moran’s I but is noted here as a limitation of grid-based zoning over irregularly built-up areas.
Global Moran’s I (999-permutation test) is computed separately for each city, rather than pooled across all 242 zones nationally: because the cities are spatially disconnected from one another, a single pooled statistic would be dominated by Oslo’s much larger zone count and would not be informative about between-city variation, which is precisely the comparison of interest. Local Moran’s I (LISA) is computed per zone and classified as High-High (hot spot), Low-Low (cold spot), High-Low or Low-High (spatial outliers), or not significant, at α = 0.05; because LISA is inherently local, results from all six cities can be shown together without the pooling problem that affects the global statistic.
As in Section 4.2, stop-level SIRI-ET records are unavailable for W-A1 and W-A2 (the collector relied on the GTFS-Realtime trip-updates format during that period rather than SIRI-ET, which lacks a comparable timestamp field), so this analysis is limited to W-B and W-C.
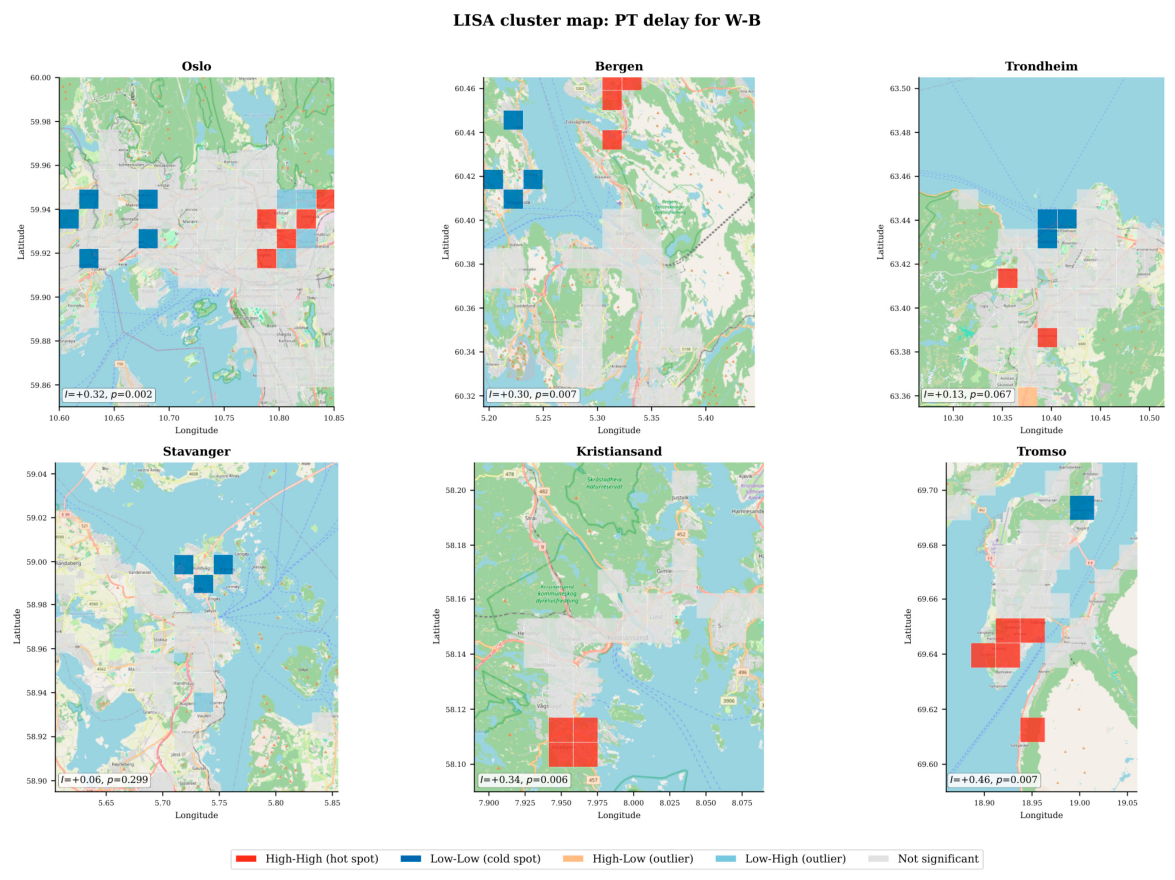
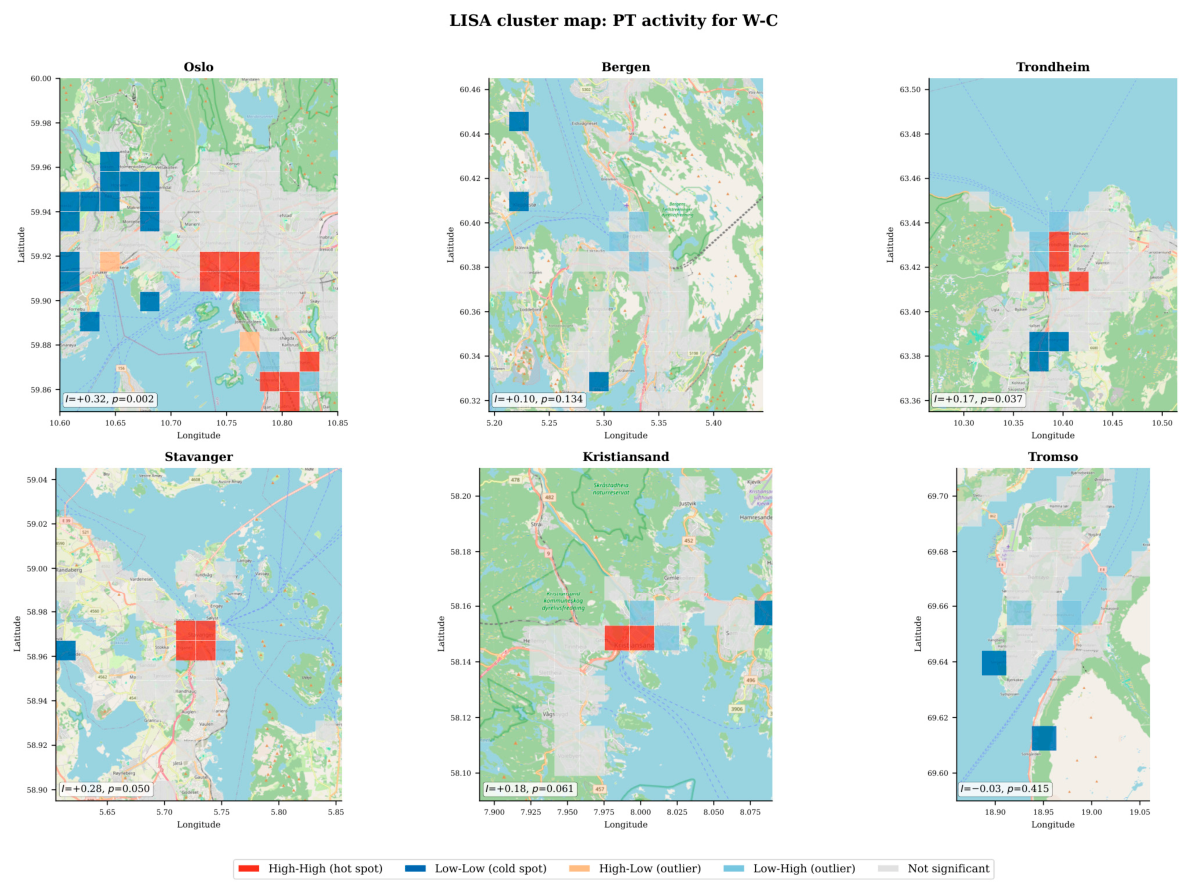
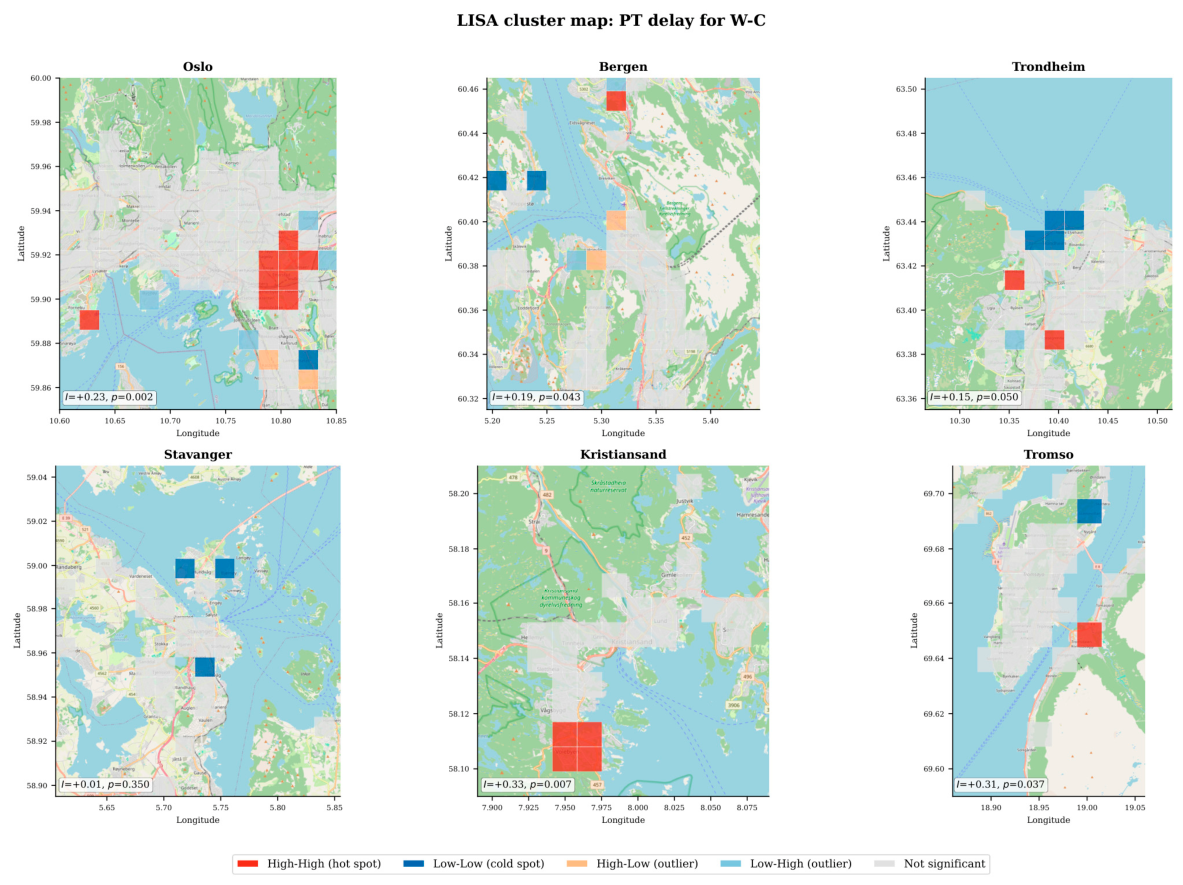
Table 7 shows that which metric exhibits significant spatial clustering, and how strongly, differs by city-echoing the context-dependence already found for the weather relationship in Section 4.2, now at the level of cities rather than time windows. Oslo is the only city with significant clustering in both metrics in both windows (activity I = 0.32–0.36, delay I = 0.23–0.32, p = 0.002 throughout). Bergen, Kristiansand, and Tromsø show significant clustering in delay only (I = 0.19–0.46, p ≤ 0.05), with activity not reaching significance. Stavanger shows the reverse pattern: significant activity clustering (I ≈ 0.28, p ≤ 0.05) but not delay. Trondheim is borderline in both metrics (p = 0.04–0.07). Tromsø’s activity result is a genuine null: I is slightly negative and far from significant in both windows (I = −0.03, p ≈ 0.41), indicating no detectable spatial structure in where PT activity concentrates within the city, even though its delay pattern is one of the strongest in the sample. All results are stable in sign and similar in magnitude between the independent W-B and W-C windows, which supports treating them as a real citywide feature rather than sampling noise.
Table 7.
Global Moran’s I for PT activity and PT delay, by city and window (999 permutations; n = number of grid-cell zones clearing the 15-stop threshold).
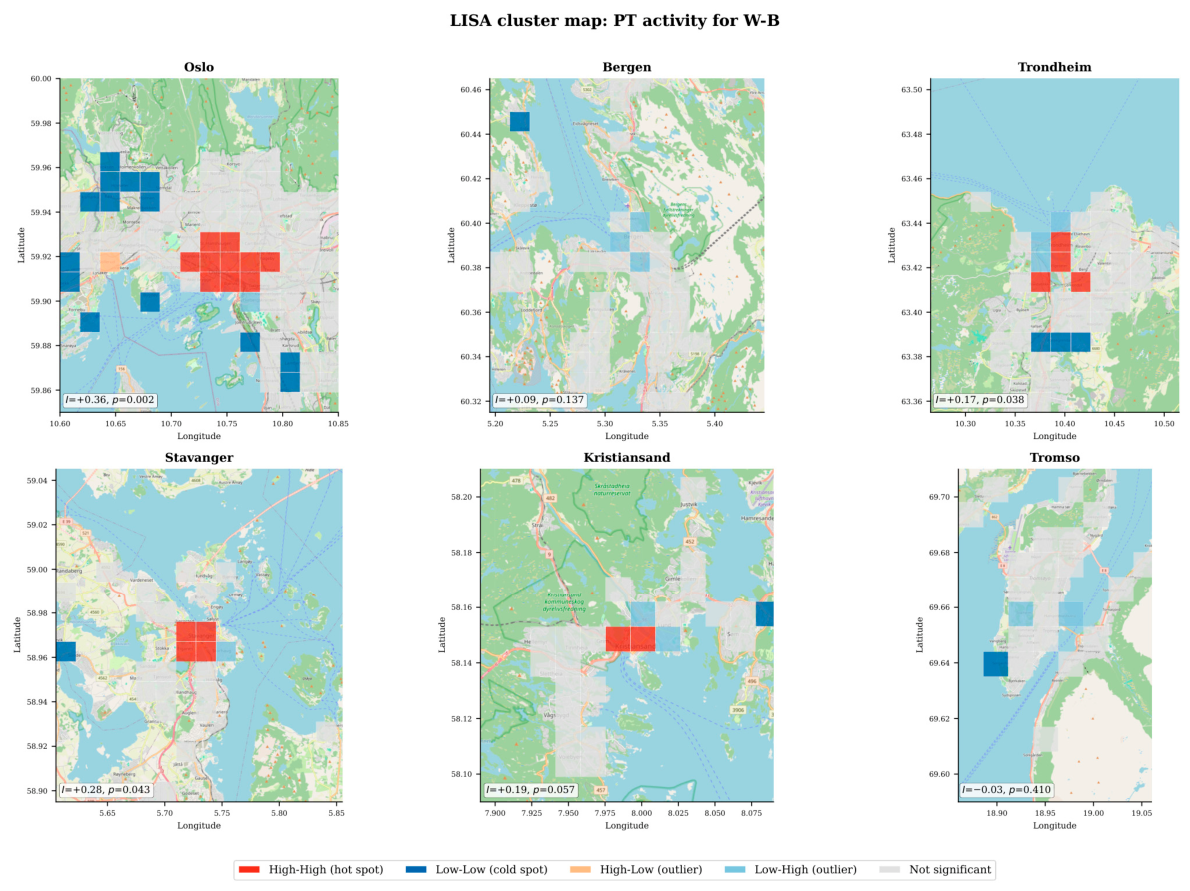
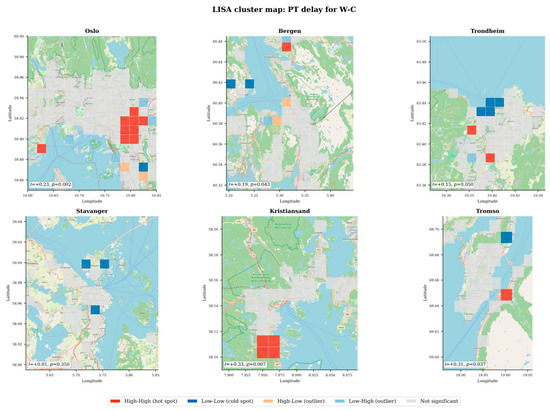
The LISA maps (Figure 6, Figure 7, Figure 8 and Figure 9) localize where each city’s clustering occurs. Oslo’s activity hot spots (High-High, red) sit in the east/southeast of the bounding box, with cold spots (Low-Low, blue) concentrated in the northwest-a clear west-to-east gradient across the city. Kristiansand’s single delay hot spot sits in the same central grid cell in both W-B and W-C, suggesting a stable, location-specific bottleneck rather than a window-specific artifact. Tromsø’s delay hot spot(s) sit near the city center and are more extensive in W-B (three adjacent cells) than W-C (one cell), consistent with the stronger winter-window delay effects observed city-wide in Section 4.2.
Figure 6.
LISA cluster map of PT activity across the six cities for W-B, one panel per city on an OpenStreetMap basemap; grid cells are colored by LISA classification (High-High, Low-Low, High-Low, Low-High, not significant).
Figure 7.
LISA cluster map of PT activity across the six cities for W-C, same encoding as Figure 6.
Figure 8.
LISA cluster map of PT delay across the six cities for W-B, same encoding as Figure 6.
Figure 9.
LISA cluster map of PT delay across the six cities for W-C, same encoding as Figure 6.
Together with Section 4.2, this points to a two-level version of the same conclusion: not only does the strength of the weather-mobility relationship depend on when it is measured, but whether PT activity or PT delay shows any spatial structure at all-and where that structure is located-depends on which Norwegian city is being examined. Neither a single temporal coefficient nor a single spatial pattern generalizes across the network.
4.3. Pipeline Performance and Robustness
To assess whether the framework supports its near-real-time claim, ingestion latency, throughput, and pipeline robustness were evaluated using the collected data logs.
In Table 8, it is visible that ingestion robustness varied sharply between windows. During the holiday periods (W-A1, W-A2), all four sources experienced repeated outages of several hours, up to 8.6 h for Entur in W-A2. In the later windows (W-B, W-C), robustness improved substantially: Avinor, Bysykkel, and Vegvesen recorded zero outages exceeding 10× the expected interval, and Entur, while still showing some gaps, saw the outage count drop from 50–74 to 23–29. This pattern is consistent with reduced operational load and infrastructure stability outside the holiday period, and illustrates that pipeline robustness in an operational, non-laboratory setting is not uniform across time.
Table 8.
Ingestion robustness by source and window (gap between consecutive pulls).
As shown in Table 9, Avinor throughput is reported as an aggregate across active airports per polling cycle (13.2–25.4 airports, depending on window), rather than per airport, since a single polling cycle returns one file per airport. Vegvesen shows the highest sustained throughput (183–285 records/min), followed by Entur, which varies more widely across windows (41.5–269.0 records/min) depending on active vehicle and trip counts. Bysykkel throughput is stable near 55 records/min throughout, reflecting a fixed station count. Avinor throughput is lowest overall but increases substantially in W-B (70.8 records/min), consistent with higher flight activity during that period.
Table 9.
Ingestion throughput by source and window (records per minute).
As shown in Table 10, end-to-end latency was extracted for PT data. Latency could not be computed for W-A1 and W-A2, as the collector relied on the GTFS-Realtime trip-updates format during this period rather than SIRI-ET, which lacks a comparable timestamp field.
Table 10.
End-to-end latency, Entur SIRI-ET (RecordedAtTime to collection time).
Median end-to-end latency was approximately 2–3 min, consistent with the 60–180 s polling interval used by the pipeline, supporting the framework’s near-real-time processing claim under typical conditions. A subset of records showed substantially higher latency (p95 ≈ 48 min), which reflects delayed reporting at the data source rather than pipeline-induced delay. Storage footprint was also assessed using the normalized, partitioned Parquet outputs described in Section 3.3. The normalized dataset for a representative 7–8 day analysis window occupies approximately 357 MB, giving a total normalized storage footprint of roughly 1.4 GB across the four analysis windows used in this study. This confirms that the columnar, partitioned storage format keeps per-window storage overhead modest relative to the ingestion volumes reported above.
These results characterize the pipeline’s observed performance under the workload present during the four analysis windows; they do not constitute a systematic scalability test in which data volume, ingestion rate, number of sources, or geographic coverage is deliberately increased. Evaluating throughput, latency, and robustness under deliberately scaled conditions (more cities, more concurrent sources, or higher polling frequency) is left for future work.
5. Discussion
This study examined a near-real-time multimodal urban analytics framework that integrates heterogeneous geospatial mobility data, including public transport, micromobility, roadside sensing, environmental observations, and aviation activity, into a unified minute-level analytical view. The main finding is not the existence of a single universal relationship between temperature and mobility, but a consistent pattern of context-dependent behavior: observed associations vary across transport modes, analysis windows, and, in the case of public transport, across urban zones. These results suggest that urban mobility should be interpreted as a dynamic and interconnected system whose behavior changes across time periods and spatial contexts, rather than as a set of isolated transport modes. Related multimodal urban transportation studies similarly emphasize integrated operation across transport modes, real-time information exchange, and multimodal coordination as central themes in smart-city mobility systems [36].
Unlike many existing multimodal studies centered on prediction or network optimization, this work focuses on the operational problem of continuously integrating heterogeneous geospatial mobility feeds into a temporally aligned analytical framework suitable for near-real-time multimodal analysis. Studies on airport transit connectivity and air-rail intramodality provide behaviorally informed connectivity metrics and route-level interpretation but focus on network transfer performance under static or schedule-centric assumptions [37]. In contrast, our framework emphasizes continuous data harmonization across operational feeds and cross-domain monitoring at minute resolution. Rather than optimizing one subsystem, the proposed pipeline enables concurrent observation of multiple urban modes under shared temporal constraints.
Within the broader context of urban sensing and multimodal data fusion [38], this study focuses primarily on the integration and monitoring layer. We emphasize reproducible ingestion, schema normalization, and minute-level temporal alignment, rather than predictive modeling or end-to-end learning approaches. The proposed framework is intended to support reliable cross-modal analytics under operational near-real-time conditions.
Relative to multimodal recommendation research (e.g., crowding-aware QoE/QoS balancing) [39], our work addresses a different layer of the stack. Recommendation systems are decision engines that require calibrated objective functions and user-level preferences. Our framework instead provides the data-integration and monitoring substrate needed to support such engines in practice: timestamp alignment, schema normalization, robust aggregation, and comparative indicators across modes. This distinction is important for deployment: reliable recommendation or control logic depends on upstream analytical consistency, especially under heterogeneous update cycles.
Our findings are also consistent with prior studies on bikesharing-metro integration that identified distinct spatio-temporal usage typologies and strong synchronization between cycling and metro demand across stations [40]. Peak/off-peak asymmetry and period-dependent correlations observed in this study further support the importance of temporal regimes as a structural dimension of urban mobility systems [41]. At the same time, the observed effects extend beyond intraday variation. Across the multi-day windows (W-A1, W-A2, W-B, W-C), both the direction and strength of weather-related associations change noticeably. This suggests that relying solely on aggregated coefficients could hide meaningful, context-specific patterns in mobility behavior.
The spatial autocorrelation analysis (Section Spatial Autocorrelation of Public Transport Activity and Delay Across Norwegian Cities) adds a genuinely geographic dimension to our interpretation and extends the context-dependence finding from a single city to a national comparison. Global Moran’s I shows that whether PT activity or PT delay exhibits significant spatial clustering-and how strongly-differs by city: Oslo shows significant clustering in both metrics, Stavanger only in activity, three cities only in delay, and Tromsø shows no detectable activity clustering at all despite having one of the strongest delay clustering results in the sample. This mirrors, at the spatial level, the same pattern already seen across time windows in Section 4.2: neither a single coefficient nor a single spatial pattern generalizes across the network. For multimodal interpretation, this means that even the choice of which indicator to monitor spatially, not just how it behaves, needs to be made on a city-by-city basis: a fixed monitoring approach designed around one city’s spatial structure is unlikely to transfer directly to another.
From a smart-city and geospatial analytics perspective, these results align with broader multimodal urban sensing literature [38], where analytical value emerges from integrating noisy and asynchronous data streams into a coherent spatio-temporal context. The proposed framework supports practical near-real-time urban monitoring tasks, including diagnostics, comparative mobility analysis, and operational prioritization. At the same time, the framework intentionally avoids assumptions of automated control or causal inference, which reflects the realities of operational public-data environments characterized by schema evolution, missing attributes, and uneven sampling density.
Finally, the emphasis on regime-dependent and window-specific behavior is consistent with broader urban analytics research showing that transport-system performance and analytical behavior are strongly context-dependent rather than universally stable [42]. This observation is also compatible with multiscale urban modeling perspectives that stress comparability across spatial and temporal resolutions when linking large-scale mobility structure with localized operational dynamics [43]. In the present framework, resolution is reflected through minute-level temporal alignment and mode-specific mobility indicators. However, the broader implication remains the same: urban mobility patterns should be interpreted within the specific temporal and spatial context in which they are observed.
This study has several important limitations that should be stated explicitly. The weather-mobility results are based on correlations and should be read as exploratory associations rather than evidence of causal mechanisms. The spatial autocorrelation analysis carries its own sources of uncertainty: stop-to-coordinate mapping, the 15-stop minimum threshold for including a grid cell, and the disconnected spatial components noted in Section Spatial Autocorrelation of Public Transport Activity and Delay Across Norwegian Cities for several cities. Results should therefore be read as indicative of city-level spatial structure rather than a fully resolved map of it, particularly for the smaller cities in the sample, where fewer zones clear the density threshold and the resulting small sample sizes reduce the statistical power of the global test. Minute-level aggregation improves cross-modal comparability, but it inevitably smooths sub-minute variability and can obscure fine-grained delay dynamics. The implementation and empirical validation are anchored in the Norwegian public-data ecosystem (APIs, operators, and feed conventions), which limits direct claims about transferability to other urban contexts without re-tuning and re-validation. Similarly, the performance evaluation in Section 4.3 reflects observed behavior under current operational load rather than a controlled scalability test; how the pipeline behaves under deliberately increased data volume, source count, or geographic coverage remains untested. Finally, the pipeline is built around openly accessible feeds and therefore does not, by itself, solve cross-operator data governance problems; where privacy, contracts, or proprietary restrictions prevent central pooling of raw microdata, federated learning has been proposed as a complementary route for multimodal demand forecasting without requiring a single centralized repository of sensitive records [44].
Several extensions of the proposed framework remain possible. One direction is the integration of predictive and regime-aware forecasting models on top of the normalized multimodal analytical grid [42]. Another is the inclusion of user behavior, transfer dynamics, and contextual movement patterns to support intervention-oriented urban mobility analysis [37]. Spatial extensions are also important, particularly broader zonal coverage, richer geospatial representations, and transfer-oriented urban partitions that may improve interpretability for planning and operational scenarios [40]. Overall, these extensions could evolve the framework from descriptive multimodal monitoring into a more adaptive system, capable of supporting policy-relevant geospatial urban analytics.
6. Conclusions
This paper tackles a recurring challenge in smart urban mobility research: how to integrate heterogeneous near-real-time transport data streams into a single analytical framework that allows for consistent comparisons across different mobility modes. The proposed contribution is a modular pipeline for data ingestion, source-specific normalization, minute-level temporal alignment, and multimodal analytical processing. The focus on normalization and temporal alignment comes from a practical problem in operational mobility systems, where cross-modal analysis depends on the reliable integration of heterogeneous and asynchronously updated data sources.
The empirical results indicate that multimodal mobility indicators follow clear temporal patterns, with noticeable differences between peak and off-peak periods. At the same time, weather-related associations are not uniform, and they vary across transport modes, analysis windows, and spatial zones. Instead of showing stable relationships across all periods and modes, the results indicate that multimodal urban mobility should be interpreted within its operational and spatio-temporal context. The spatial autocorrelation analysis further shows that PT activity and PT delay cluster spatially in some cities but not others, and that which indicator shows clustering (and where) differs by city, extending the same context-dependence finding from the temporal to the spatial and national dimension.
Overall, our findings support the use of unified, temporally aligned analytical frameworks for near-real-time multimodal monitoring and operational decision-making. The proposed architecture is designed primarily for integration and monitoring tasks rather than fully automated control or prediction. The correlation analyses should therefore be interpreted as exploratory indicators that help identify sensitivity to external conditions and evaluate cross-modal consistency rather than as evidence of causal relationships.
The findings should be interpreted in the context of the Norwegian mobility ecosystem and the practical limitations of heterogeneous near-real-time public data sources.
Future work should extend the framework with predictive models, additional geospatial datasets, and broader validation across different urban environments. Further improvements could also include richer behavioral and spatial analysis of multimodal mobility patterns.
Supplementary Materials
The following supporting information can be downloaded at https://www.mdpi.com/article/10.3390/ijgi15080374/s1: Tables S1–S6: Detailed normalization specifications for all integrated data sources. The following supporting information is available online: Project repository containing implementation details, preprocessing workflows, and dataset access instructions (https://github.com/bobanda87/multimodal-mobility-pipeline (accessed on 9 May 2026)). Additional implementation details and normalized datasets are available through the public project repository and accompanying AWS S3 data archive.
Author Contributions
Conceptualization, Boban Davidovic and Dusan Barac; methodology, Boban Davidovic; software, Boban Davidovic; validation, Boban Davidovic and Dusan Barac; formal analysis, Boban Davidovic; investigation, Boban Davidovic; data curation, Boban Davidovic; writing-original draft preparation, Boban Davidovic; writing-review and editing, Boban Davidovic and Dusan Barac; visualization, Boban Davidovic; supervision, Dusan Barac. All authors have read and agreed to the published version of the manuscript.
Funding
This research received no external funding.
Data Availability Statement
The normalized datasets supporting the findings of this study are available through the project repository and accompanying AWS S3 archive described in the Supplementary Materials. The datasets were derived from publicly accessible Norwegian mobility and infrastructure APIs, including Entur, Avinor, Statens vegvesen, and Oslo Bysykkel services.
Acknowledgments
The authors acknowledge the publicly available mobility and infrastructure data services provided by Entur, Avinor, Statens vegvesen, and Oslo Bysykkel, which enabled the multimodal analyses presented in this study. During the preparation of this manuscript, the authors used generative AI tools for language refinement and editorial assistance. All text was reviewed and revised by the authors prior to submission.
Conflicts of Interest
The authors declare no conflicts of interest.
References
- Hassan, M.; Mahin, H.D.; Nafees, A.A.; Paul, A.; Shraban, S.S. Big Data Applications in Intelligent Transport Systems: A Bibliometric Analysis and Review. Discov. Civ. Eng. 2025, 2, 49. [Google Scholar] [CrossRef] [Scilit]
- Bulková, Z.; Brumerčíková, E.; Buková, B.; Mihalik, T. Concept of an Integrated Urban Public Transport System Linked to a Railway Network Based on the Principles of a Timed-Transfer Timetable in the City of Prievidza. Systems 2025, 13, 543. [Google Scholar] [CrossRef] [Scilit]
- Chang, Y.S.; Jo, S.J.; Lee, Y.T.; Lee, Y. Population Density or Populations Size. Which Factor Determines Urban Traffic Congestion? Sustainability 2021, 13, 4280. [Google Scholar] [CrossRef] [Scilit]
- Medina-Salgado, B.; Sánchez-DelaCruz, E.; Pozos-Parra, P.; Sierra, J.E. Urban Traffic Flow Prediction Techniques: A Review. Sustain. Comput. Inform. Syst. 2022, 35, 100739. [Google Scholar] [CrossRef] [Scilit]
- Oladimeji, D.; Gupta, K.; Kose, N.A.; Gundogan, K.; Ge, L.; Liang, F. Smart Transportation: An Overview of Technologies and Applications. Sensors 2023, 23, 3880. [Google Scholar] [CrossRef] [Scilit] [PubMed]
- Lemonde, C.; Arsenio, E.; Henriques, R. Integrative Analysis of Multimodal Traffic Data: Addressing Open Challenges Using Big Data Analytics in the City of Lisbon. Eur. Transp. Res. Rev. 2021, 13, 64. [Google Scholar] [CrossRef] [Scilit]
- Strano, E.; Shai, S.; Dobson, S.; Barthelemy, M. Multiplex Networks in Metropolitan Areas: Generic Features and Local Effects. J. R. Soc. Interface 2015, 12, 20150651. [Google Scholar] [CrossRef] [Scilit] [PubMed]
- Kivelä, M.; Arenas, A.; Barthelemy, M.; Gleeson, J.P.; Moreno, Y.; Porter, M.A. Multilayer Networks. J. Complex Netw. 2014, 2, 203–271. [Google Scholar] [CrossRef] [Scilit]
- Cats, O.; Jenelius, E. Dynamic Vulnerability Analysis of Public Transport Networks: Mitigation Effects of Real-Time Information. Netw. Spat. Econ. 2014, 14, 435–463. [Google Scholar] [CrossRef] [Scilit]
- Babić, D.; Kalić, M.; Janić, M.; Dožić, S.; Kukić, K. Integrated Door-to-Door Transport Services for Air Passengers: From Intermodality to Multimodality. Sustainability 2022, 14, 6503. [Google Scholar] [CrossRef] [Scilit]
- Babić, D.; Colovic, A.; Dožić, S.; Kalić, M.; Simić, T.K.; Kukić, K.; Ottomanelli, M.; Pilone, S.G. How to Build a More Sustainable Passenger Air Transport System: Multimodal Experience. Transp. Eng. 2024, 16, 100245. [Google Scholar] [CrossRef] [Scilit]
- Cannon, R.; Hiselius, L.W.; Zhao, C.; Camporeale, R. The Organisation and Regulation of Door-to-Door Journeys Involving Public Transport: Lessons from Four Countries. In Transport Research Arena Conference; Springer Nature: Cham, Switzerland, 2024; pp. 392–397. [Google Scholar]
- Alessandretti, L.; Orozco, L.G.N.; Saberi, M.; Szell, M.; Battiston, F. Multimodal Urban Mobility and Multilayer Transport Networks. Environ. Plan. B Urban Anal. City Sci. 2023, 50, 2038–2070. [Google Scholar] [CrossRef] [Scilit]
- Golpayegani, F.; Malekjafarian, A.; Farooq, M.; Ghanadbashi, S.; Afraz, N. Adaptive System Architecture for Intelligent Multimodal Transport: Challenges and Fundamental Design Aspects. IEEE Open J. Intell. Transp. Syst. 2025, 6, 1298–1324. [Google Scholar] [CrossRef] [Scilit]
- Zhang, H.; Cui, Y.; Jia, J. Mining Multimodal Travel Mobilities with Big Ridership Data: Comparative Analysis of Subways and Taxis. Sustainability 2024, 16, 4305. [Google Scholar] [CrossRef] [Scilit]
- Deng, Z.; Chen, H.; Lu, Q.L.; Su, Z.; Schreck, T.; Bao, J.; Cai, Y. Visual Comparative Analytics of Multimodal Transportation. Vis. Inform. 2025, 9, 18–30. [Google Scholar] [CrossRef] [Scilit]
- Wang, C. Towards Effective Fusion and Forecasting of Multimodal Spatio-Temporal Data for Smart Mobility. In Proceedings of the 33rd ACM International Conference on Information and Knowledge Management (CIKM ’24), Boise, ID, USA, 21–25 October 2024; pp. 5483–5486. [Google Scholar]
- Zhang, J.; Chen, Y.; Wang, T.; Xie, C.-Z.T.; Tian, Y. Mixture of Spatial–Temporal Graph Transformer Networks for Urban Congestion Prediction Using Multimodal Transportation Data. Expert Syst. Appl. 2025, 268, 126108. [Google Scholar] [CrossRef] [Scilit]
- Miotti, M.; Hellweg, S. Efficient and Representative Door-to-Door Travel Time Estimation for Planning and Policy. Transportation 2026, 1–38. [Google Scholar] [CrossRef] [Scilit]
- Reis, M.J.C.S. Internet of Things and Artificial Intelligence for Secure and Sustainable Green Mobility: A Multimodal Data Fusion Approach to Enhance Efficiency and Security. Multimodal Technol. Interact. 2025, 9, 39. [Google Scholar] [CrossRef] [Scilit]
- Skoropad, V.N.; Deđanski, S.; Pantović, V.; Injac, Z.; Vujičić, S.; Jovanović-Milenković, M.; Jevtić, B.; Lukić-Vujadinović, V.; Vidojević, D.; Bodolo, I. Dynamic Traffic Flow Optimization Using Reinforcement Learning and Predictive Analytics: A Sustainable Approach to Improving Urban Mobility in the City of Belgrade. Sustainability 2025, 17, 3383. [Google Scholar] [CrossRef] [Scilit]
- Bakirci, M. Internet of Things-Enabled Unmanned Aerial Vehicles for Real-Time Traffic Mobility Analysis in Smart Cities. Comput. Electr. Eng. 2025, 123, 110313. [Google Scholar] [CrossRef] [Scilit]
- Gheorghe, C.; Soica, A. Revolutionizing Urban Mobility: A Systematic Review of AI, IoT, and Predictive Analytics in Adaptive Traffic Control Systems for Road Networks. Electronics 2025, 14, 719. [Google Scholar] [CrossRef] [Scilit]
- Khan, Z.; Anjum, A.; Soomro, K.; Tahir, M.A. Towards Cloud Based Big Data Analytics for Smart Future Cities. J. Cloud Comput. 2015, 4, 2. [Google Scholar] [CrossRef] [Scilit]
- Jan, M.A.; Adil, M.; Brik, B.; Harous, S.; Abbas, S. Making Sense of Big Data in Intelligent Transportation Systems: Current Trends, Challenges and Future Directions. ACM Comput. Surv. 2025, 57, 197. [Google Scholar] [CrossRef] [Scilit]
- Lee, D.; Camacho, D.; Jung, J.J. Smart Mobility with Big Data: Approaches, Applications, and Challenges. Appl. Sci. 2023, 13, 7244. [Google Scholar] [CrossRef] [Scilit]
- Lv, Y.; Duan, Y.; Kang, W.; Li, Z.; Wang, F.-Y. Traffic Flow Prediction with Big Data: A Deep Learning Approach. IEEE Trans. Intell. Transp. Syst. 2014, 16, 865–873. [Google Scholar] [CrossRef] [Scilit]
- Alexakis, T.; Peppes, N.; Demestichas, K.; Adamopoulou, E. A Distributed Big Data Analytics Architecture for Vehicle Sensor Data. Sensors 2023, 23, 357. [Google Scholar] [CrossRef] [Scilit] [PubMed]
- Asaithambi, S.P.R.; Venkatraman, R.; Venkatraman, S. MOBDA: Microservice-Oriented Big Data Architecture for Smart City Transport Systems. Big Data Cogn. Comput. 2020, 4, 17. [Google Scholar] [CrossRef] [Scilit]
- Entur Real-Time API. Available online: https://developer.entur.org/pages-real-time-api (accessed on 9 May 2026).
- Avinor API. Available online: https://partner.avinor.no/en/services/flight-data/ (accessed on 9 May 2026).
- Statens Vegvesen API. Available online: https://www.vegvesen.no/fag/teknologi/apne-data/ (accessed on 9 May 2026).
- Oslo Bysykkel API. Available online: https://oslobysykkel.no/apne-data (accessed on 9 May 2026).
- Brochado, Â.F.; Rocha, E.M.; Costa, D. A Modular IoT-Based Architecture for Logistics Service Performance Assessment and Real-Time Scheduling towards a Synchromodal Transport System. Sustainability 2024, 16, 742. [Google Scholar] [CrossRef] [Scilit]
- Stops and Quays Dataset. Available online: https://storage.googleapis.com/marduk-production/tiamat/Current_latest-gtfs.zip (accessed on 9 July 2026).
- Umrigar, N.; Pitroda, J.R. Multimodal Urban Transportation System for Medium Size Cities. J. Inst. Eng. India Ser. A 2023, 104, 1005–1021. [Google Scholar] [CrossRef] [Scilit]
- Li, S.; Shi, L.; Song, H. Transit Connectivity Evaluation of Hub Airports Considering Passenger Path Choice and Air–Rail Intermodality. Appl. Sci. 2026, 16, 3855. [Google Scholar] [CrossRef] [Scilit]
- Sadiq, T.; Omlin, C.W. Sensing in Smart Cities: A Multimodal Machine Learning Perspective. Smart Cities 2025, 9, 3. [Google Scholar] [CrossRef] [Scilit]
- Caro, A.D.; Falco, I.; Furno, A.; Zimeo, E. Optimizing Urban Public Transportation with a Crowding-Aware Multimodal Trip Recommendation System. Smart Cities 2025, 8, 190. [Google Scholar] [CrossRef] [Scilit]
- Sun, X.; Cui, X.; Gao, Y. How Urban Form Shapes Bike-Metro Integration: A Multidimensional Typology of Usage Patterns and Accessibility Inequities. Travel Behav. Soc. 2025, 41, 101080. [Google Scholar] [CrossRef] [Scilit]
- Arif, I.; Ullah, F.; Qayyum, S.; Jafari, M. Towards a Temporal City: Time of Day as a Structural Dimension of Urban Accessibility. Smart Cities 2026, 9, 67. [Google Scholar] [CrossRef] [Scilit]
- Atef, S. Comparative Evaluation of Traffic Load Prediction Models for Intelligent Transportation Systems Using High-Resolution Urban Data. Smart Cities 2026, 9, 56. [Google Scholar] [CrossRef] [Scilit]
- Schuhmann, F.; Nguyen, N.A.; Schweizer, J.; Huang, W.C.; Lienkamp, M. Creating and Validating Hybrid Large-Scale, Multi-Modal Traffic Simulations for Efficient Transport Planning. Smart Cities 2025, 8, 2. [Google Scholar] [CrossRef] [Scilit]
- Li, C.; Liu, W. Multimodal Transport Demand Forecasting via Federated Learning. IEEE Trans. Intell. Transp. Syst. 2024, 25, 4009–4020. [Google Scholar] [CrossRef] [Scilit]

Disclaimer/Publisher’s Note: The statements, opinions and data contained in all publications are solely those of the individual author(s) and contributor(s) and not of MDPI and/or the editor(s). MDPI and/or the editor(s) disclaim responsibility for any injury to people or property resulting from any ideas, methods, instructions or products referred to in the content. |
© 2026 by the authors. Published by MDPI on behalf of the International Society for Photogrammetry and Remote Sensing. Licensee MDPI, Basel, Switzerland. This article is an open access article distributed under the terms and conditions of the Creative Commons Attribution (CC BY) license.