


Abstract
Head-Up Display (HUD) systems are widely used in vehicles to overlay navigation prompts in the driver’s field of view, thereby reducing eyes-off-road time. However, suboptimal information presentation may impose extra cognitive demands and lead to driver distraction. To quantify the effects of key HUD navigation design factors on navigation task performance and cognitive workload, a 2 × 2 within-subjects experiment was conducted, manipulating display position (upper vs. lower visual field) and the presence of textual navigation information (with vs. Without text). Thirty university students with driving experience completed navigation tasks under four conditions in a single-lane urban driving simulation. Each task lasted 2–4 min and included six turning prompts. Task performance (accuracy, mean reaction time, and total driving time), subjective workload (PAAS), and eye-tracking measures (mean fixation duration, mean pupil diameter, fixation count, and fixation count proportion) were collected and analyzed using repeated-measures ANOVA. Results showed that display position significantly affected driving efficiency and subjective workload: lower-field displays produced shorter reaction times and lower PAAS scores, while accuracy and total driving time showed no significant differences. Eye-tracking results indicated higher fixation counts and fixation ratios for lower displays. A significant interaction between display position and text was observed for mean fixation duration, whereas mean pupil diameter showed no significant effects. These findings indicate that display position is a critical factor in HUD navigation design, while textual information primarily influences visual inspection patterns rather than overall navigation task performance.
1. Introduction
In recent years, with the development of intelligent vehicles and smart cockpits, the Head-up Display (HUD) has been increasingly adopted in automobiles and is regarded as a key component of future automotive human–machine interface (HMI) [1,2]. Automotive HUDs can present critical driving information such as vehicle speed and navigation cues within the driver’s immediate forward field of view [3], thereby reducing head-down glances during information acquisition; however, achieving reliable legibility requires careful visual design (e.g., luminance/contrast and text format) and remains a key technical challenge in vehicle-mounted AR-HUD commercialization [4]. Such HUD designs may facilitate information acquisition and potentially support driving safety and user experience under appropriate task and environmental conditions. Among the various types of information displayed on HUDs, navigation—as a high-frequency function that directly influences driving decisions—its information presentation mode plays a crucial role in drivers’ attention allocation and operational responses.
It is worth noting that HUDs do not necessarily lead to safer navigation task performance. Drivers’ cognitive resources are limited; if a HUD presents excessive information or adopts an unreasonable organization mode, it may occupy additional cognitive resources and induce attention distraction [5]. Navigation and other content displayed on HUDs may also interfere with the primary driving task, resulting in visual and cognitive distraction [6], and inappropriate interface design may even have adverse effects on driving safety. Relevant studies have also indicated that while HUD information can facilitate hazard prompts and responses, as the visual complexity of displayed content increases, drivers’ cognitive load may rise accordingly, thereby impairing information processing efficiency [7]. In navigation scenarios, early research suggested that HUDs used to provide concise route guidance do not significantly distract drivers or reduce navigation task performance [8], but other studies have found that while HUD navigation improves certain performance indicators, it may induce specific negative behaviors [9]. These inconsistent findings indicate that the presentation mode of HUD navigation information still needs to be optimized through more refined design and stricter empirical evaluation. However, beyond these empirical inconsistencies, there is still a lack of a clear theoretical explanation regarding how specific interface design factors shape drivers’ cognitive load and visual attention allocation during navigation tasks.
From the perspective of cognitive mechanisms, driving is a typical multi-task information processing process, in which drivers are required to continuously complete links such as environmental perception, information comprehension, decision-making, and control execution in a dynamic traffic environment. When external information load or task demands exceed the capacity of working memory, the cognitive system will experience overload, manifesting as attention distraction, slowed reaction, and decreased control ability [10]. Therefore, the key to the design of HUD navigation interfaces lies not in increasing the amount of information, but in reducing unnecessary extraneous cognitive load through appropriate presentation methods, enabling drivers to quickly and accurately extract navigation cues while maintaining attention to the road environment. From this perspective, HUD interface design can be understood as a process of optimizing the distribution of visual attention and managing cognitive load within the driver’s limited processing capacity.
Existing studies suggest that the display position of HUD navigation information can influence drivers’ cognitive processing [8], and presenting information in the upper versus lower visual field may yield different effects. A lower-field display typically overlays navigation symbols near the roadway ahead of the driver and is considered beneficial for reducing gaze shifts and maintaining continuous attention to the road surface [11]. However, virtual elements may occlude or overlap with real-world targets (e.g., vehicles and pedestrians), resulting in visual clutter and additional cognitive demands [12]. The upper display places navigation information in the sky or the upper area of the visual field, which can avoid occluding road targets to a certain extent [13] and may reduce interference caused by background complexity. Nevertheless, prompts continuously located in the peripheral visual field may also weaken the immediate perceptibility of information or induce attention distraction [14]. In addition, different drivers have inconsistent preferences for the location of HUD information presentation. Existing studies have indicated that drivers often hope HUD information is positioned outside the foveal visual field to facilitate quick scanning and acquisition [15]. Overall, there is still a lack of quantitative comparative evidence based on subjective and objective indicators in controlled driving tasks regarding which display position—upper or lower—is more conducive to reducing cognitive load and improving navigation efficiency. More importantly, existing studies rarely examine how spatial layout interacts with drivers’ attentional strategies during real-time navigation tasks.
Regarding navigation text on HUDs, prior studies indicate that the format of textual presentation can affect attentional resource allocation and performance in visual search tasks [16]. When graphic cues are sufficient to convey meaning, adding text may introduce redundancy, unnecessarily consuming attentional resources, increasing cognitive load, and impairing task performance [17,18]. In driving contexts, dense textual content may further draw drivers’ attention toward the display and away from monitoring critical road cues [19,20]. By contrast, when graphic symbols are semantically ambiguous or insufficiently familiar, brief supplemental text can improve comprehension accuracy and shorten response time, thereby enhancing information extraction efficiency and reducing interpretive ambiguity [21]. Since most existing conclusions are derived from different tasks and contexts, and systematic comparative studies targeting HUD navigation scenarios remain limited, there is still a need to further verify whether navigation text information should be presented in HUDs and whether text information produces different cognitive effects under different display positions. Thus, how textual cues interact with spatial display location to influence drivers’ cognitive load and visual attention allocation remains an open question in HUD interface research.
Based on the aforementioned inconsistencies in existing research, this study focuses on two key variables in the design of automotive HUD navigation information, exploring the mechanisms through which different navigation information display positions (upper vs. lower visual field) and navigation text presentation modes (text present vs. absent) influence drivers’ cognitive load and navigation performance. The study will verify these relationships through simulated driving experiments combined with eye-tracking technology, simultaneously collecting task performance data, subjective cognitive load ratings, and eye-tracking metrics in controlled driving tasks to achieve a multi-dimensional characterization of cognitive load and information processing processes. Compared with existing studies that mostly examine a single interface factor in isolation, this study jointly incorporates display position and text information into a unified experimental framework. By integrating behavioral performance, subjective workload, and eye-movement evidence, this research aims to provide a more comprehensive understanding of how HUD interface design influences drivers’ cognitive load regulation and visual attention allocation during navigation tasks. It aims to provide more targeted empirical evidence, offer data support for the optimization of HUD navigation information presentation modes, and deliver an actionable research basis for enhancing driving safety and interactive experience.
Guided by the aforementioned theories and research progress, this study formulates testable predictions regarding the effects of the key variables and proposes the following hypotheses:
H1.
Different HUD navigation information display positions have a significant impact on drivers’ cognitive load and navigation efficiency.
H2.
Different HUD navigation text information presentation modes have a significant impact on drivers’ cognitive load and navigation efficiency.
H3.
There is a significant interaction effect between HUD navigation information display position and text information presentation mode, i.e., their combinations will exert different effects on drivers’ cognitive load and navigation efficiency.
2. Materials and Methods
2.1. Participants
Thirty college students were randomly recruited as participants in this study (age range: 22–26 years, M = 23.60, SD = 0.97). The sample included 11 males and 19 females. All participants held valid driving licenses and reported regular driving experience. After screening, all participants were confirmed to have normal or corrected-to-normal vision, no color blindness or color weakness, and no history of neurological or psychiatric disorders. All participants signed an informed consent form prior to the experiment and received monetary compensation of RMB 10 upon completion of the experiment.
2.2. Experimental Design
This study adopted a 2 (navigation information display position: upper, lower) × 2 (navigation text information: With text, Without text) within-subjects experimental design to isolate the primary effects of display position and text presence under controlled conditions. Each participant completed all four experimental conditions to minimize the impact of individual differences on the results. The same simulated driving scenario was used for the four tasks, and the experimental sequence was pseudo-randomized to counteract the practice effect. The laboratory environment was kept consistent to control the interference of irrelevant variables.
2.2.1. Independent Variable Settings
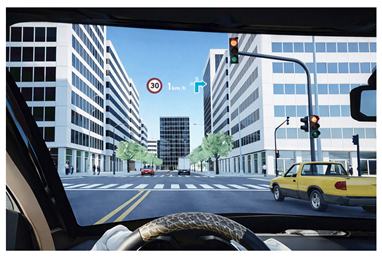
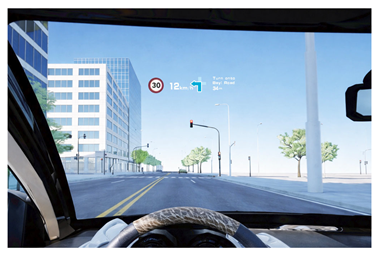
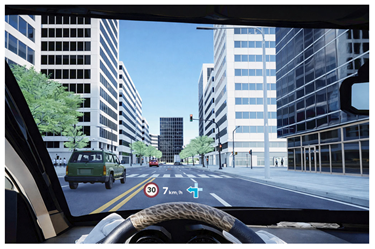
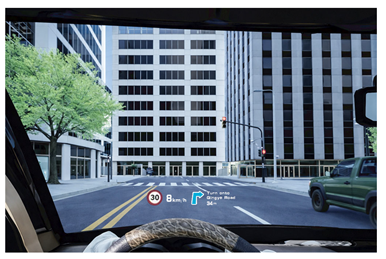
The independent variables comprised two factors: navigation information display position and navigation text presentation. Display position had two levels—upper and lower. The upper display presented navigation guidance in the upper region of the driver’s field of view (i.e., the upper windshield area near the sky), whereas the lower display presented navigation information in the lower region (i.e., the lower windshield area near the roadway). In the simulated system, HUD navigation cues were rendered as screen overlays on a unified display canvas. Driving scenes and HUD information were presented on a 16:9 monitor. Across the four experimental conditions, the HUD cue scale, element size, and layout were held constant; only the vertical screen position and the presence/absence of text were manipulated to avoid confounds arising from interface scaling or aspect-ratio changes. Specifically, the upper HUD position was set to (−380, −625) and the lower HUD position to (−380, −40), corresponding to an approximate vertical offset of 10° relative to the driver’s horizontal line of sight and aligning more closely with typical placements in real-world HUD navigation products. Navigation text presentation also had two levels: With text and Without text. In the with-text condition, navigation prompts included textual elements (e.g., road names, distance, or turning instructions), whereas in the without-text condition, prompts contained no text and conveyed direction solely via graphical symbols such as arrows.
2.2.2. Dependent Variable Selection
To characterize the cognitive load and navigation efficiency during driving in a more robust manner, this study simultaneously collected three types of indicators: task performance, eye movement metrics, and subjective scales. Research on driving load generally recommends combining subjective, behavioral, and physiological cues (such as eye movement) to reduce the deviation of a single indicator and form cross-validation [22]. Specifically:
Task Performance Indicators Included Accuracy Rate, Average Reaction Time, and Total Driving Time
Average Reaction Time: Reaction time is a commonly used sensitive behavioral indicator in driving tasks, which can reflect the speed of information processing and performance fluctuations under changes in cognitive load, and is thus suitable for comparing the effects of different interface presentation conditions on navigation efficiency [23]. In this study, the participants’ reaction time was obtained through frame-by-frame screen recording analysis, calculated as the time difference between the moment when turn guidance information appeared and the moment when the participant initiated verbal reporting. The average reaction time refers to the mean value of all reaction time data, reflecting the participants’ response speed to HUD navigation prompts. It should be noted that reaction time in this study reflects the speed of cue recognition and decision formation rather than motor vehicle control execution.
Accuracy: The combination of accuracy rate and reaction time can reduce the interpretation bias caused by the speed-accuracy trade-off [24]. In this study, the accuracy rate was calculated by dividing the number of correct verbal reports by the number of turn guidance presentations; incorrect or missed reports were defined as inaccurate responses, reflecting the participants’ accuracy in judging navigation information.
Total Driving Time: Total driving time can serve as a comprehensive reflection of overall efficiency and potential compensatory strategies (e.g., slowing down the overall driving pace to maintain safety when the cognitive load increases) [24]. In the present study, this indicator was mainly used to capture the overall efficiency of completing the navigation task rather than detailed longitudinal or lateral vehicle control performance. Automatically recorded by the experimental program, the total driving time refers to the duration required to complete one driving task, reflecting the overall task efficiency.
Eye Movement Metrics Included Mean Fixation Duration, Mean Pupil Diameter, Fixation Count, and Fixation Count Proportion
All eye movement metrics in this study were calculated within the Area of Interest (AOI). The AOI was defined as the region of the HUD navigation information module, covering the area of navigation direction graphics and their corresponding text information; it excluded the area displaying vehicle speed and speed limit information (this part remained consistent across all experimental conditions and was not an experimental variable). Gaze point identification utilized Tobii Pro Lab’s default gaze detection algorithm, with unstable gaze samples excluded prior to analysis. Across the four experimental conditions, the AOI’s area and shape remained constant, undergoing only overall translation based on the display’s vertical position. Under the four experimental conditions, the area and shape of the AOI were kept unchanged, with only an overall translation according to the upper/lower display positions.
Mean Fixation Duration: Fixation duration is a commonly used eye-tracking indicator of workload, reflecting attentional allocation and processing states under different task or interface conditions, and it may vary across stages of cognitive load [24]. In this study, Mean Fixation Duration was defined as the average fixation duration within the AOI and was used to quantify cognitive resource allocation to the HUD AOI as well as the ease or difficulty of information extraction.
Mean Pupil Diameter: Mean Pupil Diameter primarily reflects the physiological effort and arousal associated with information processing and typically increases as task demands rise, thereby indexing workload intensity [24]. In driving and (semi-)automated driving research, pupil-related metrics have been widely used as objective indicators of mental workload and attentional effort [25]. In the present study, Mean Pupil Diameter was defined as the average pupil diameter within the AOI under controlled lighting and identical display conditions across all experimental trials. Given the within-subjects design and constant visual environment, mean pupil diameter was used to compare relative workload differences between HUD conditions while minimizing confounding effects of luminance variation, in line with methodological recommendations in cognitive pupillometry research [26].
Fixation Count: Fixation count is often used to depict differences in information acquisition strategies and attention allocation, and it can serve as an explicit cue for task processing and attention distribution [27]. Fixation count refers to the total number of fixations falling within a specific AOI, reflecting the frequency of observation on that region.
Fixation Count Proportion: Fixation count proportion is the ratio of fixation counts within the AOI to the total fixation counts across the entire scene. It is used to reflect the relative attention paid to the AOI and can reduce, to a certain extent, the impact of overall fixation differences caused by individual variations.
The Indicator of Subjective Cognitive Load Was the PAAS Scale
Subjective rating scales are among the most widely used approaches in cognitive load research because they allow rapid data collection in repeated-measures designs and can be triangulated with behavioral and physiological measures for cross-validation [28,29]. In this study, the PAAS was used to capture participants’ perceived cognitive load during task completion, focusing on their overall experience of task difficulty and mental effort [30]. PAAS scale uses a 9-point rating format with two items (mental effort and task difficulty), and the mean of these two ratings was computed as the subjective cognitive load score.
2.3. Experimental Apparatus and Materials
2.3.1. Simulated Driving System
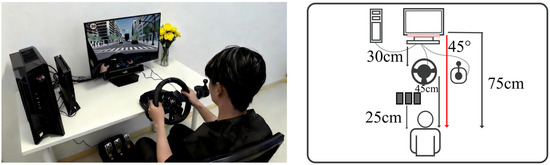
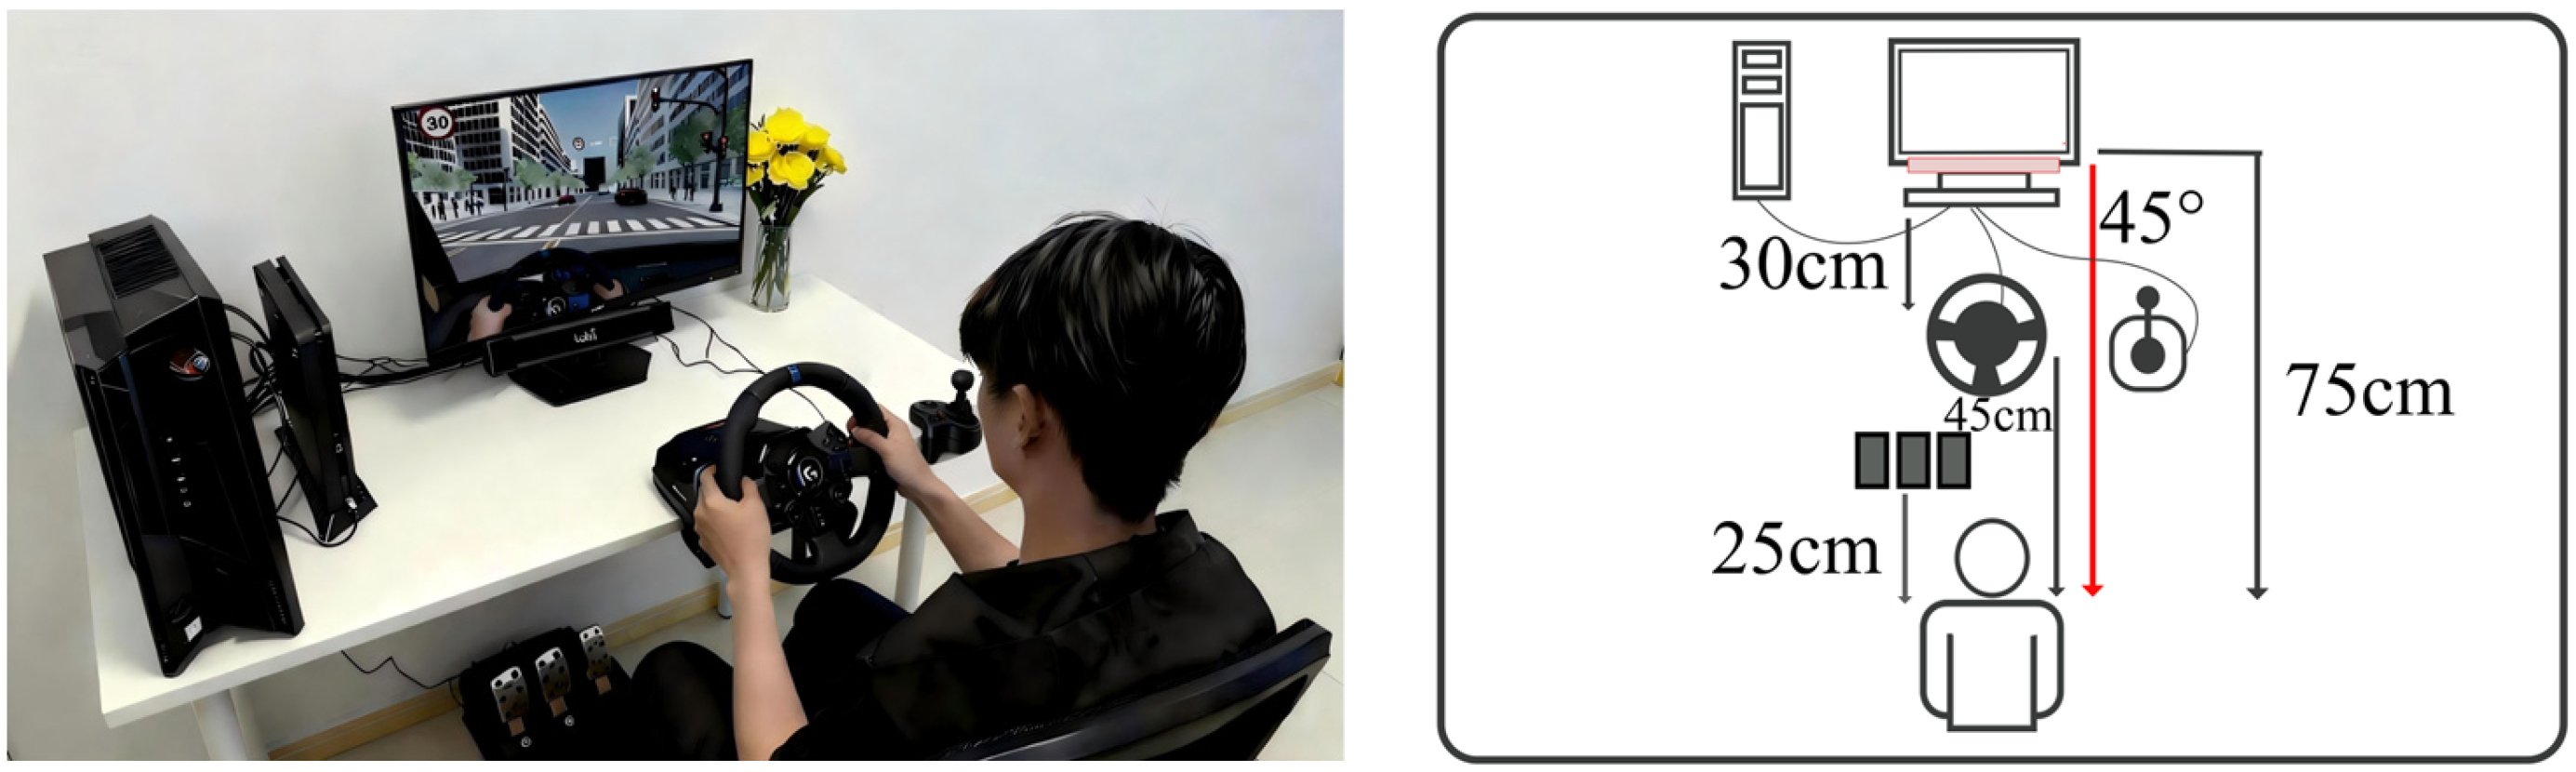
The experiment was conducted on a fixed simulated driving platform constructed in the laboratory, which consisted of both hardware and software components. In terms of hardware, a Logitech G29 steering wheel and pedal set (Logitech International S.A., Lausanne, Switzerland) was adopted as the driving controller, equipped with a steering wheel, accelerator and brake pedals, and featured force feedback functionality to deliver a realistic driving experience (as shown in Figure 1). The experimental scenarios and HUD interface information were presented on a 27-inch Dell P2719H liquid crystal display (LCD) (Dell Technologies, Round Rock, TX, USA) with a refresh rate of 60 Hz and a resolution of 1920 × 1080 pixels. The computer used in the experiment had sufficient performance to ensure the smooth rendering of simulated driving images. Participants sat on an adjustable seat, faced the display screen, and performed driving tasks using the steering wheel and pedals. In terms of software, the simulated driving scenarios and interactive functions were developed on the Unreal Engine 4 platform, Version 4.27. Developed by Epic Games (Cary, NC, USA), this engine is capable of simulating driving environments in a highly efficient and realistic manner. The HUD graphical interface elements required for the experiment were designed using Adobe Illustrator (Adobe Inc., San Jose, CA, USA) before being imported into UE4 to achieve overlay display. Eye movement data were recorded and presented in real time using Tobii Pro Lab (Tobii AB, Stockholm, Sweden). The entire system underwent pre-testing and calibration to guarantee stable operation and accurate data recording during the formal experiment. Environmental lighting was kept constant during all experimental sessions, and monitor brightness settings were fixed to minimize luminance-induced pupil variations.
Figure 1.
Experimental scenario and schematic diagram.
2.3.2. Eye-Tracking Device
The experiment adopted a Tobii X2-60 remote eye tracker (Tobii AB, Stockholm, Sweden) to monitor the participants’ eye movements. This device is a compact and portable screen-based eye tracker with a sampling rate of 60 Hz. The eye tracker was connected to the experimental host computer via USB and fixedly mounted on the lower edge of the display screen. Prior to the experiment, a standard nine-point calibration was performed for each participant to ensure the accuracy of data collection. During the experiment, the eye tracker synchronously recorded the participants’ eye movement trajectories, pupil diameter, and other related data, providing an objective basis for subsequent analysis.
2.3.3. HUD Interface and Experimental Materials
To examine the effects of navigation information display position and the presence/absence of text, four HUD navigation interface variants were created (upper display With text, upper display Without text, lower display With text, and lower display Without text), as summarized in Table 1. Across all variants, navigation prompts followed common in-vehicle HUD conventions: an arrow indicated the required turning direction, and text (shown only in the with-text condition) provided the road name or the remaining distance to the upcoming turn. The interface also displayed vehicle speed and the posted speed limit; these elements were identical in content and format across all conditions.
Table 1.
Experimental materials.
The visual design of the arrows and text was benchmarked against commercially available high-end HUD products and standardized across conditions. Specifically, text was rendered in a high-contrast white sans-serif font, and font size and spacing were refined in a pilot test to ensure rapid legibility. In the upper-display conditions, HUD navigation information was positioned slightly above the driver’s forward line of sight; in the lower-display conditions, it was positioned slightly below, corresponding to an approximate vertical separation of 10° in viewing angle. Apart from display position and text presence, all other interface components and the driving scene were held constant.
Task scenarios and routes were also controlled to be identical across the four HUD conditions. The route was set in an urban road environment dominated by straight segments connected by at-grade intersections, forming a complete path. Each drive included six navigation prompts (three left turns and three right turns), with the same turn locations and sequence across conditions. To mitigate fatigue from repeated trials, each driving task was limited to approximately 2–4 min.
3. Experimental Procedures
3.1. Practice Session
To enable participants to quickly familiarize themselves with the simulated driving system and HUD interface operations, a 5 min practice driving session was arranged prior to the formal experiment. The practice scenario was similar to that of the formal experiment but with a different route, so as to avoid participants’ performance in the subsequent experiment being affected by route memorization. The HUD navigation prompts presented during the practice session covered all combinations of experimental conditions (including upper/lower display positions and with/Without text information), ensuring that participants understood all types of prompt formats and task requirements. After the practice session, the experimenter confirmed that participants had no further questions before initiating the formal experiment.
3.2. Calibration and Instructions
Before the start of the formal experiment, the experimenter first explained the task requirements and precautions to participants in detail, and displayed brief written instructions on the screen. For example: “Please drive in accordance with the HUD navigation prompts displayed on the windshield. When a turn instruction appears, please verbally report the turning direction as soon as possible.” The experimenter also emphasized the above requirements verbally. The verbal-report task was adopted as a minimally intrusive response method to isolate perceptual-cognitive processing without altering steering behavior. This design allowed us to isolate the perceptual and attentional effects of HUD variables while maintaining continuous driving as the primary task.
After participants clearly understood the task, eye tracker calibration was conducted. During the calibration process, participants were required to maintain a proper sitting posture and keep their heads stable, and fixate on the calibration points that appeared sequentially on the screen to complete the standard nine-point calibration, so as to ensure the accurate collection of eye movement data.
3.3. Formal Experimental Procedure
Participants initiated the simulated driving task and drove from the starting point to the destination in accordance with the navigation guidance provided by the HUD. During driving, participants were required to abide by virtual traffic rules (e.g., stopping at red lights) and avoid vehicles and pedestrians, so as to simulate the scenario of real urban road driving. Each driving task was set in a single-lane urban road scenario and lasted approximately 2–4 min.
Multiple navigation turn prompts appeared during the driving process (with 6 fixed turn instructions in each driving task). Whenever a turn prompt with arrow symbols (with or without accompanying text) appeared on the HUD displayed on the windshield, participants were required to verbally report the turning direction as quickly and accurately as possible (e.g., responding promptly with “turn left” or “turn right”). The experimenter measured the participants’ reaction time through frame-by-frame analysis of synchronized video and audio recordings and judged the accuracy of their verbal reports accordingly.
Participants continued driving until they reached the predetermined destination, thus completing the route task. Upon the completion of each driving task, the system automatically recorded the total driving time. Immediately after the task, participants filled in the subjective cognitive load scale (PAAS) to report their perceived subjective cognitive load during the task. Meanwhile, the objective behavioral data and eye movement data generated during the experiment were synchronously recorded for subsequent analysis. Each participant was required to complete driving tasks under all four HUD interface conditions. After finishing the task under one condition, participants could take an appropriate break to prevent fatigue from affecting their performance in subsequent tasks.
After the entire experiment was completed, the collected data were subjected to statistical analysis. IBM SPSS Statistics 26.0 software was used to conduct a repeated measures analysis of variance (ANOVA) on each indicator, so as to examine whether the main effects and interaction effects of the two independent variables (navigation information display position and text information presence) were significant. The significance level was set at α = 0.05. Assumptions of normality and sphericity were examined prior to analysis, and effect sizes (partial η2) were reported to indicate the magnitude of observed effects. Normality was assessed using the Shapiro–Wilk test, and the sphericity assumption was examined using Mauchly’s test. When the sphericity assumption was violated, the Greenhouse–Geisser correction was applied.
4. Results
Table 2 presents the descriptive statistical results (mean and standard deviation) of all indicators under the four HUD conditions.
Table 2.
Descriptive statistics of all indicators under four HUD conditions (M, SD; N = 30).
4.1. Task Performance
4.1.1. Accuracy Rate
A repeated-measures ANOVA indicated that the main effect of display position was not significant, F(1, 29) = 0.088, p = 0.768, ηp2 = 0.003; the main effect of text presentation was not significant, F(1, 29) = 2.378, p = 0.134, ηp2 = 0.076; and the interaction effect was not significant, F(1, 29) = 0.088, p = 0.768, ηp2 = 0.003.
4.1.2. Average Reaction Time
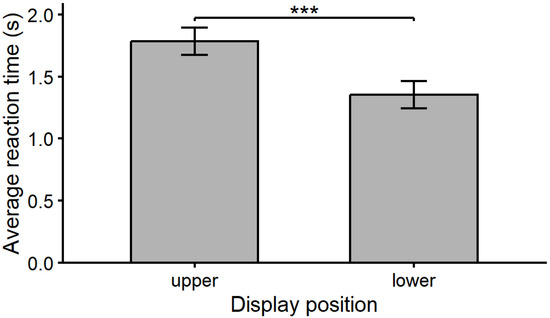
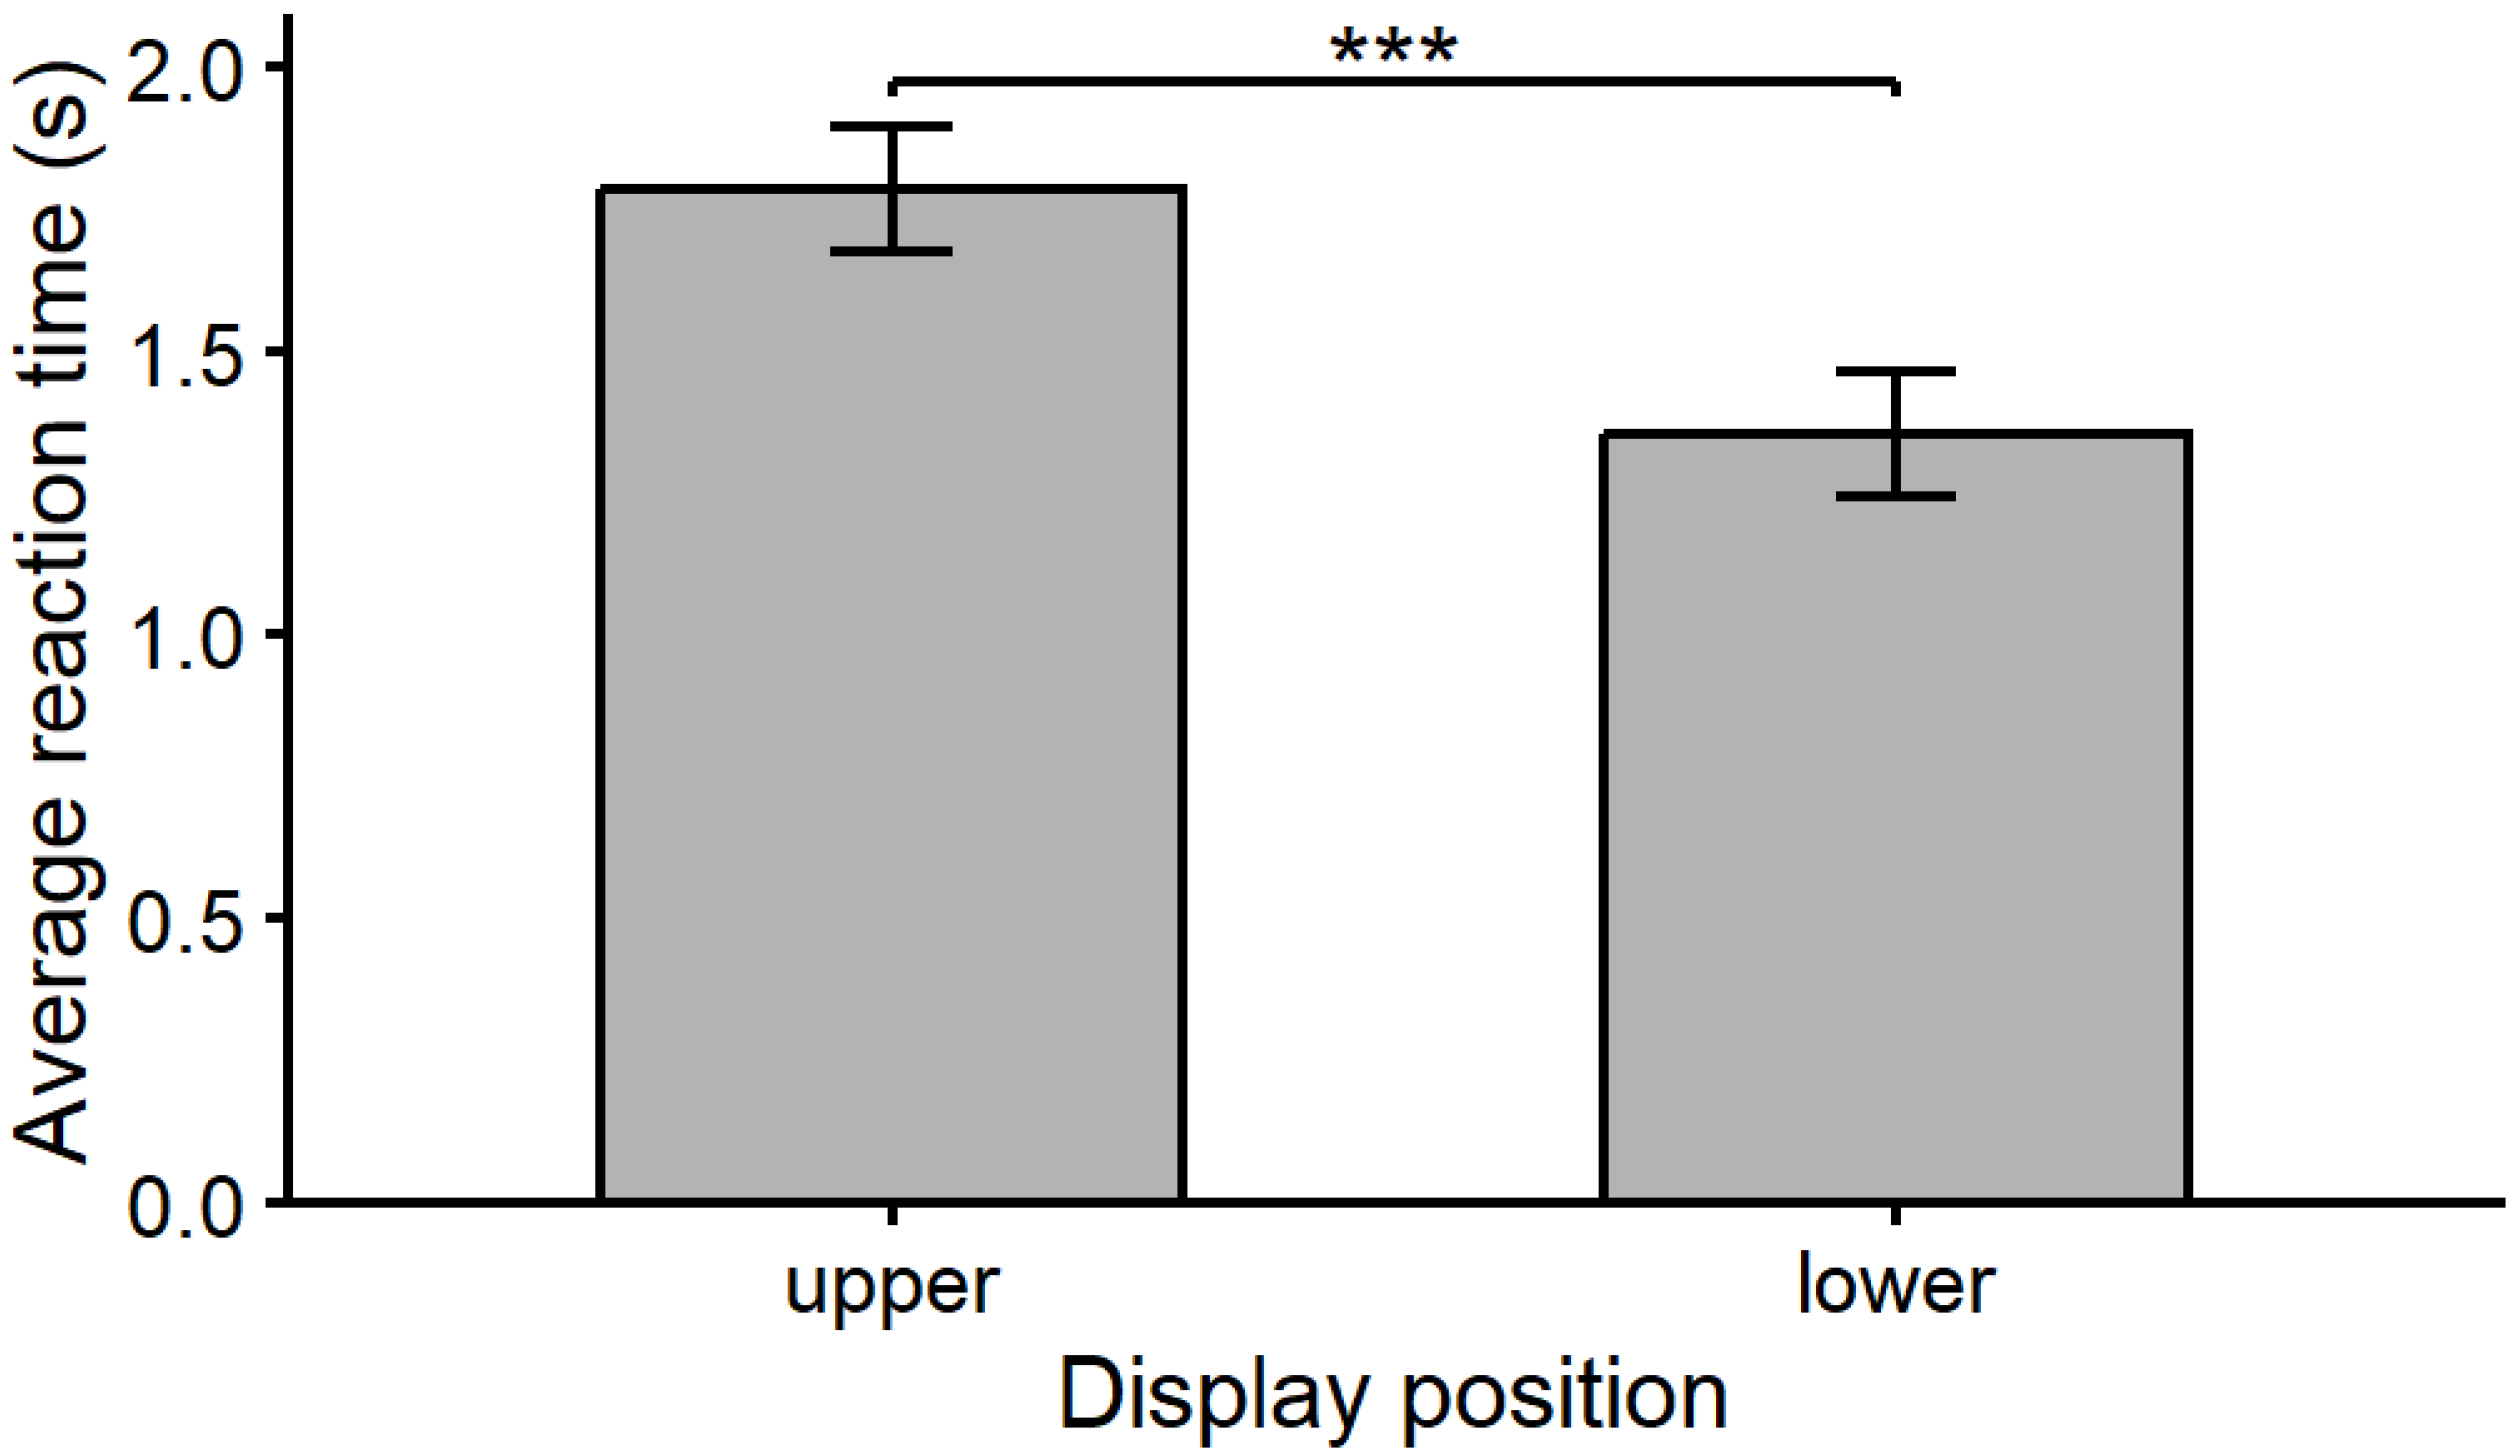
Reaction time differed significantly by display position (Figure 2), F(1, 29) = 15.552, p < 0.001, ηp2 = 0.349, whereas the main effect of text presentation was not significant, F(1, 29) = 1.238, p = 0.275, ηp2 = 0.041. The interaction between display position and text presentation was also not significant, F(1, 29) = 0.258, p = 0.616, ηp2 = 0.009. Pairwise comparisons further indicated that reaction time was significantly shorter for the lower display than for the upper display (MD = 0.430 s, SE = 0.109, 95% CI [0.21, 0.65], p < 0.001).
Figure 2.
Average reaction time by display position. Bars show mean reaction time (s) for the upper and lower display positions, averaged across text conditions. Error bars indicate the standard error for the paired upper–lower comparison (SE = 0.109, N = 30). *** p < 0.001.
4.1.3. Total Driving Time
A repeated-measures ANOVA showed that the main effect of display position was not significant, F(1, 29) = 0.391, p = 0.537, ηp2 = 0.013; the main effect of text presentation was not significant, F(1, 29) = 2.141, p = 0.154, ηp2 = 0.069; and the interaction effect was not significant, F(1, 29) = 2.857, p = 0.102, ηp2 = 0.090.
4.2. Subjective Cognitive Load
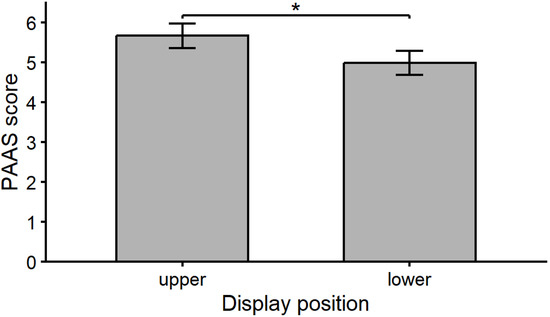
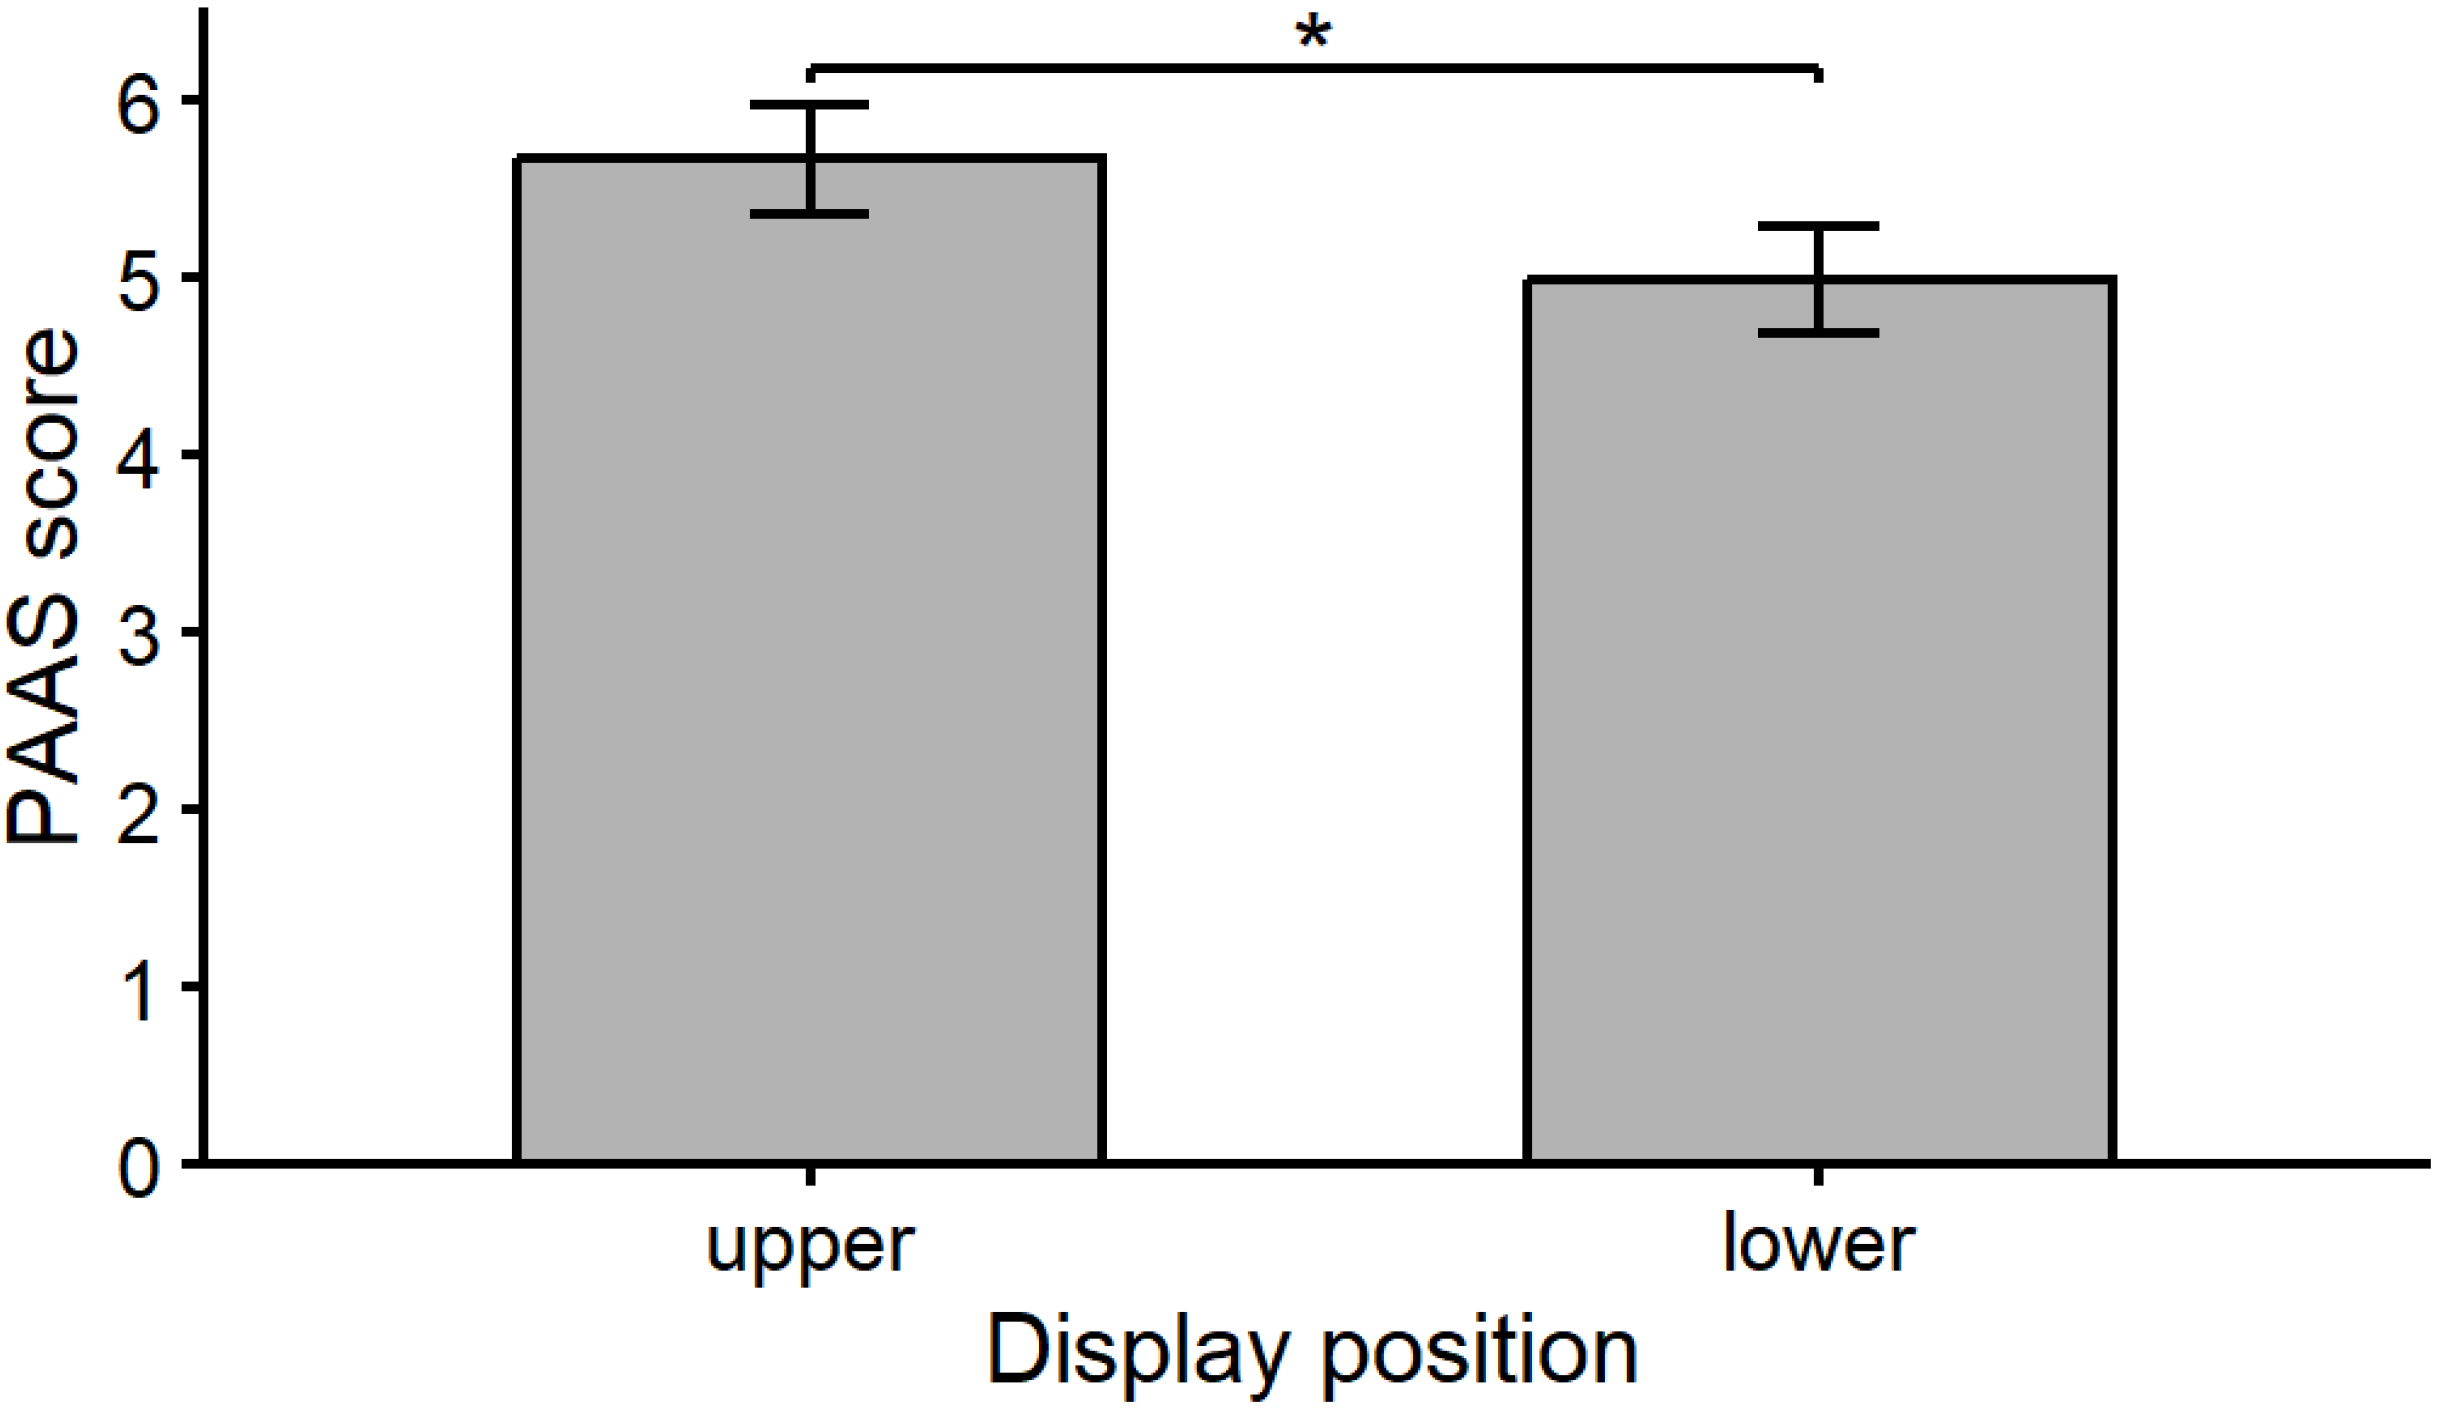
A repeated-measures ANOVA revealed a significant main effect of display position (Figure 3), F(1, 29) = 5.024, p = 0.033, ηp2 = 0.148, whereas the main effect of text presentation was not significant, F(1, 29) = 3.447, p = 0.074, ηp2 = 0.106. The interaction between display position and text presentation was not significant, F(1, 29) = 0.048, p = 0.828, ηp2 = 0.002. Pairwise comparisons further showed that PAAS scores were significantly higher for the upper display than for the lower display (MD = 0.683, SE = 0.305, 95% CI [0.06, 1.31], p = 0.033).
Figure 3.
PAAS score by display position. Bars show mean PAAS scores for the upper and lower display positions, averaged across text conditions. Error bars indicate the standard error for the paired upper–lower comparison (SE = 0.305, N = 30). * p < 0.05.
4.3. Eye Movement Metrics
4.3.1. Mean Fixation Duration
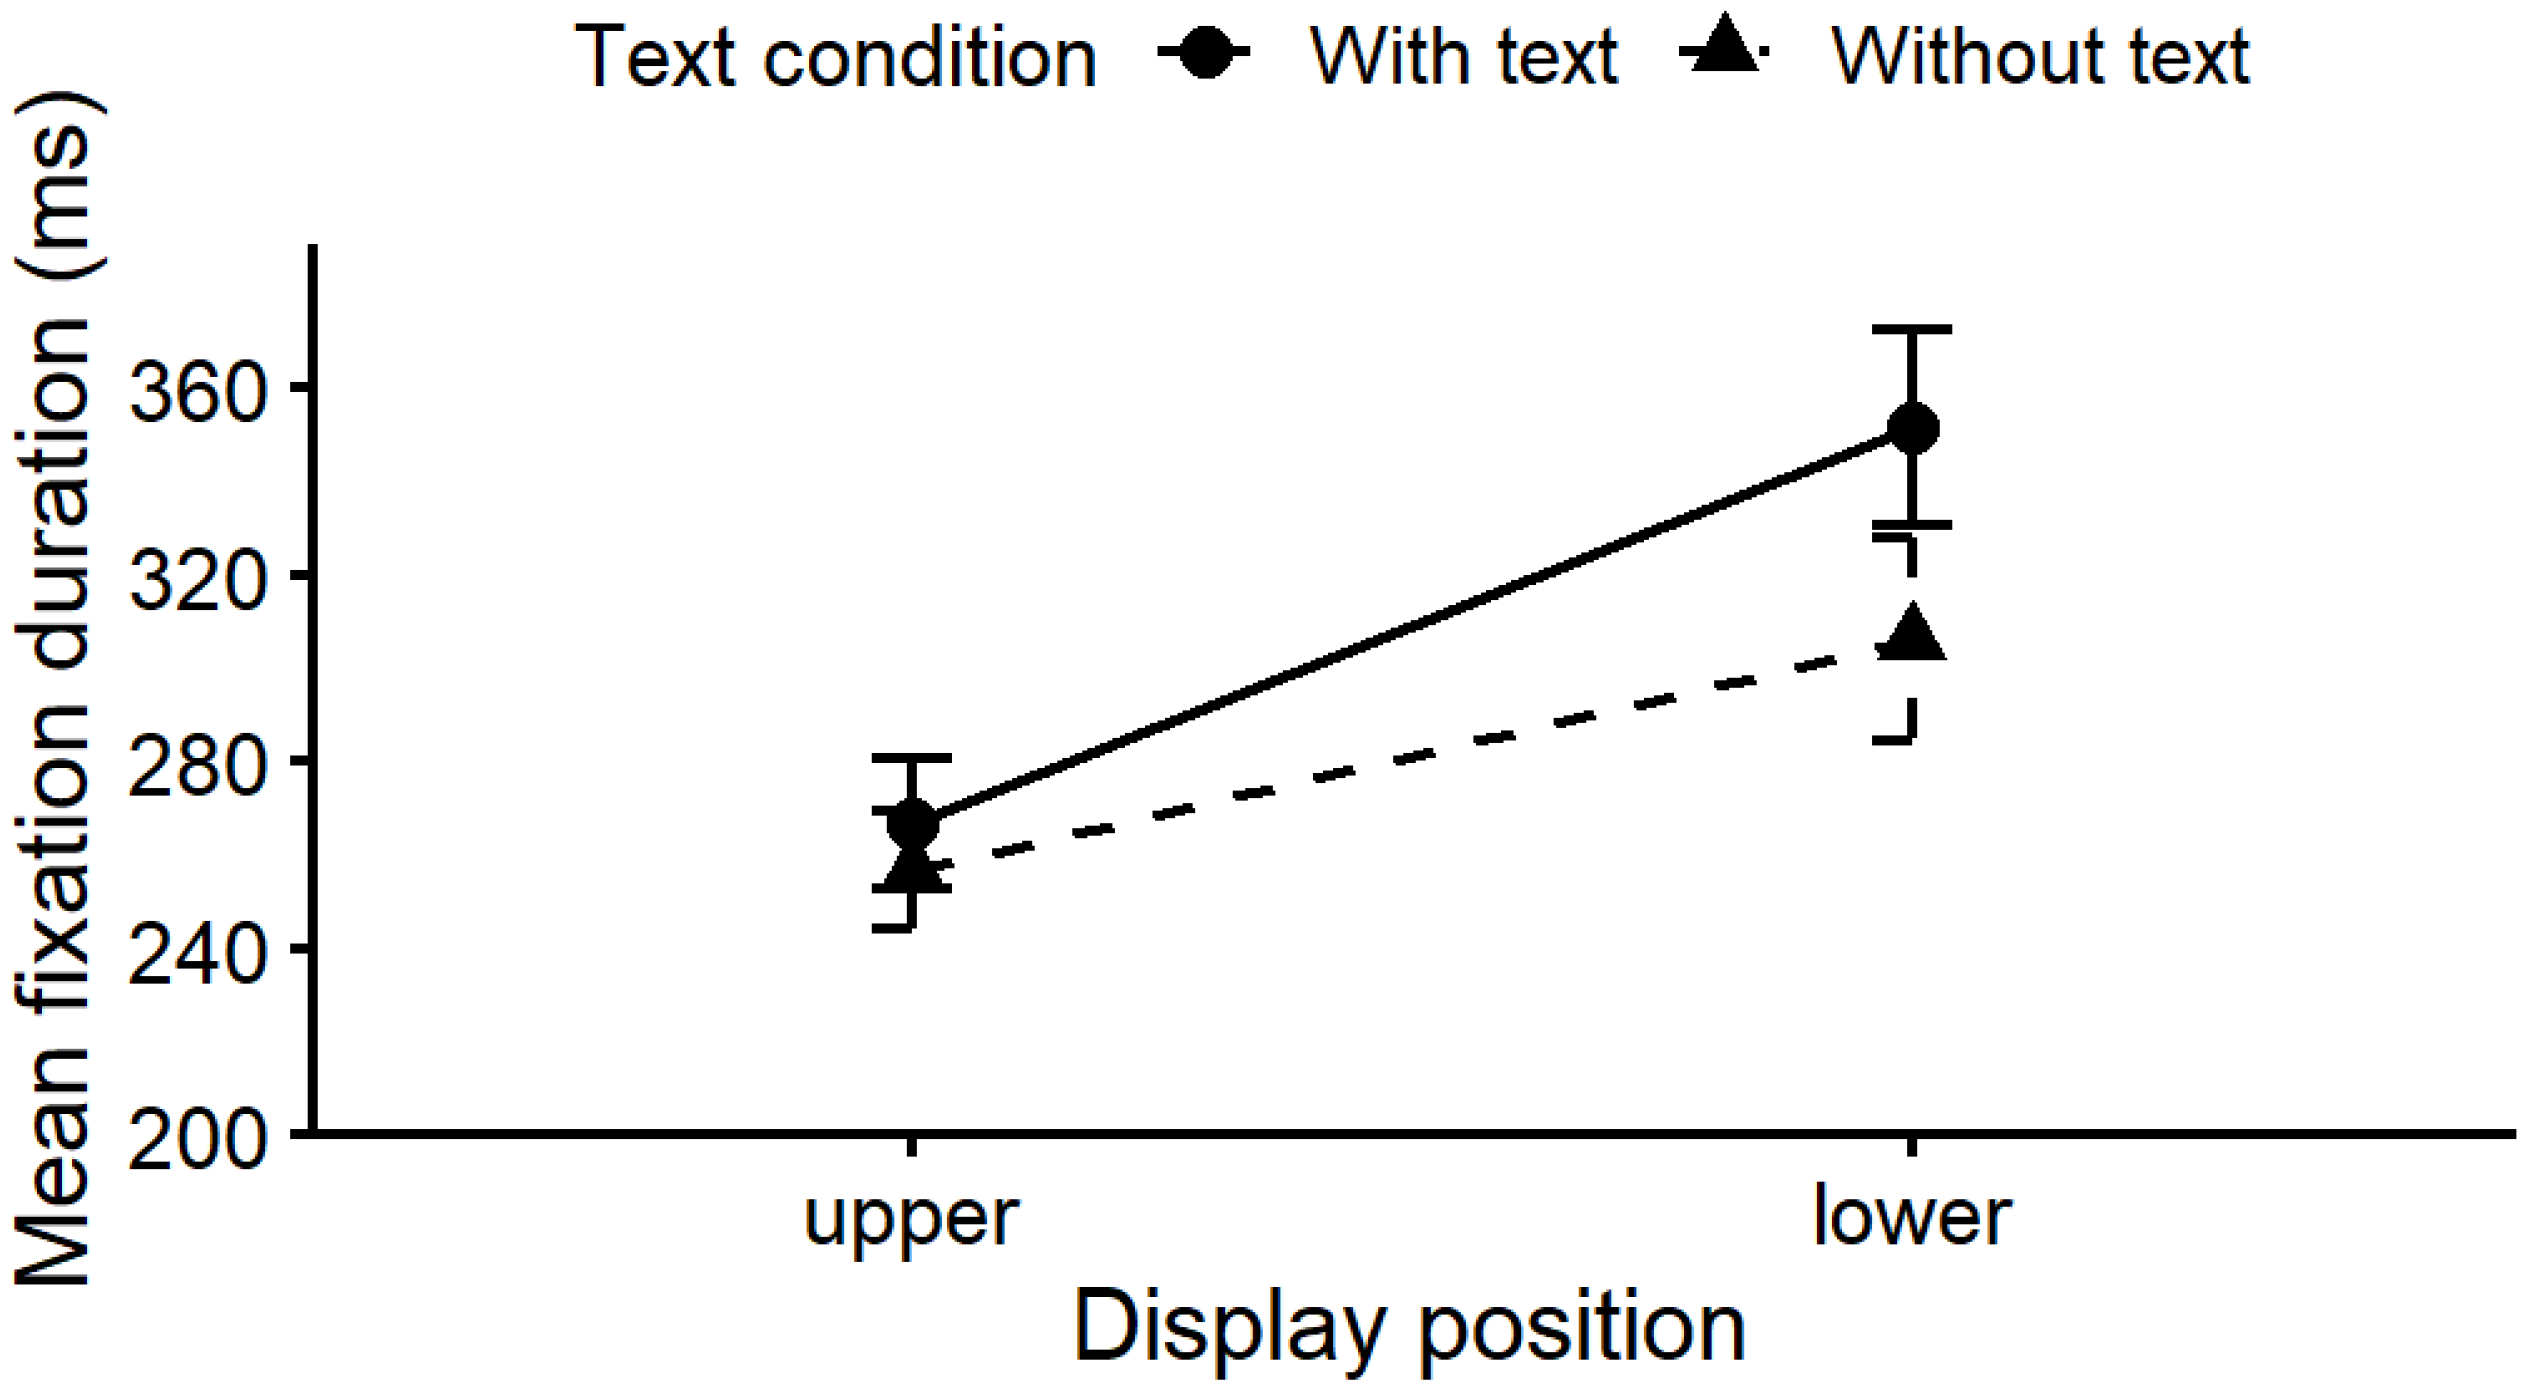
A repeated-measures ANOVA showed significant main effects of display position, F(1, 29) = 13.084, p = 0.001, ηp2 = 0.311, and text presentation, F(1, 29) = 11.571, p = 0.002, ηp2 = 0.285, as well as a significant interaction between display position and text presentation, F(1, 29) = 4.410, p = 0.045, ηp2 = 0.132. Pairwise comparisons for the main effects indicated longer fixations for the lower display than for the upper display (MD = −67.083 ms, SE = 18.546, 95% CI [−105.01, −29.15], p = 0.001), and longer fixations in the with-text condition than in the without-text condition (MD = 27.783 ms, SE = 8.168, 95% CI [11.08, 44.48], p = 0.002).
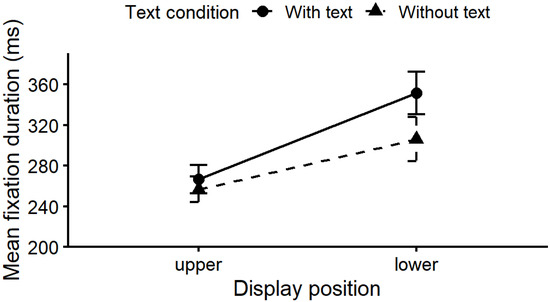
Simple-effects analyses (Figure 4) further showed that the lower display elicited longer fixations than the upper display both when text was present (MD = −84.800 ms, SE = 20.417, 95% CI [−126.55, −43.05], p < 0.001), and when text was absent (MD = −49.367 ms, SE = 20.332, 95% CI [−90.96, −7.78], p = 0.022). Within the upper display, fixation duration did not differ significantly between the with-text and without-text conditions (MD = 10.067 ms, SE = 9.703, 95% CI [−9.77, 29.91], p = 0.308), whereas within the lower display, fixation duration was significantly longer With text than Without text (MD = 45.500 ms, SE = 13.477, 95% CI [17.94, 73.06], p = 0.002).
Figure 4.
Mean fixation duration by display position and text condition. Points show condition means, and error bars represent ±1 SEM (N = 30). Lines connect means across display positions within each text condition. The interaction between display position and text condition was significant (p = 0.045).
4.3.2. Mean Pupil Diameter
A repeated-measures ANOVA indicated that the main effect of display position was not significant, F(1, 29) = 0.001, p = 0.972, ηp2 = 0.000; the main effect of text presentation was not significant, F(1, 29) = 0.518, p = 0.477, ηp2 = 0.018; and the interaction effect was not significant, F(1, 29) = 1.332, p = 0.258, ηp2 = 0.044.
4.3.3. Fixation Count
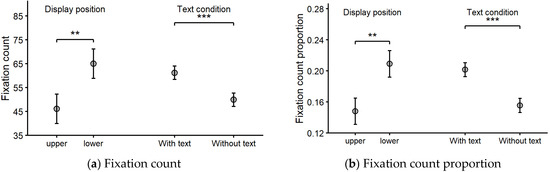
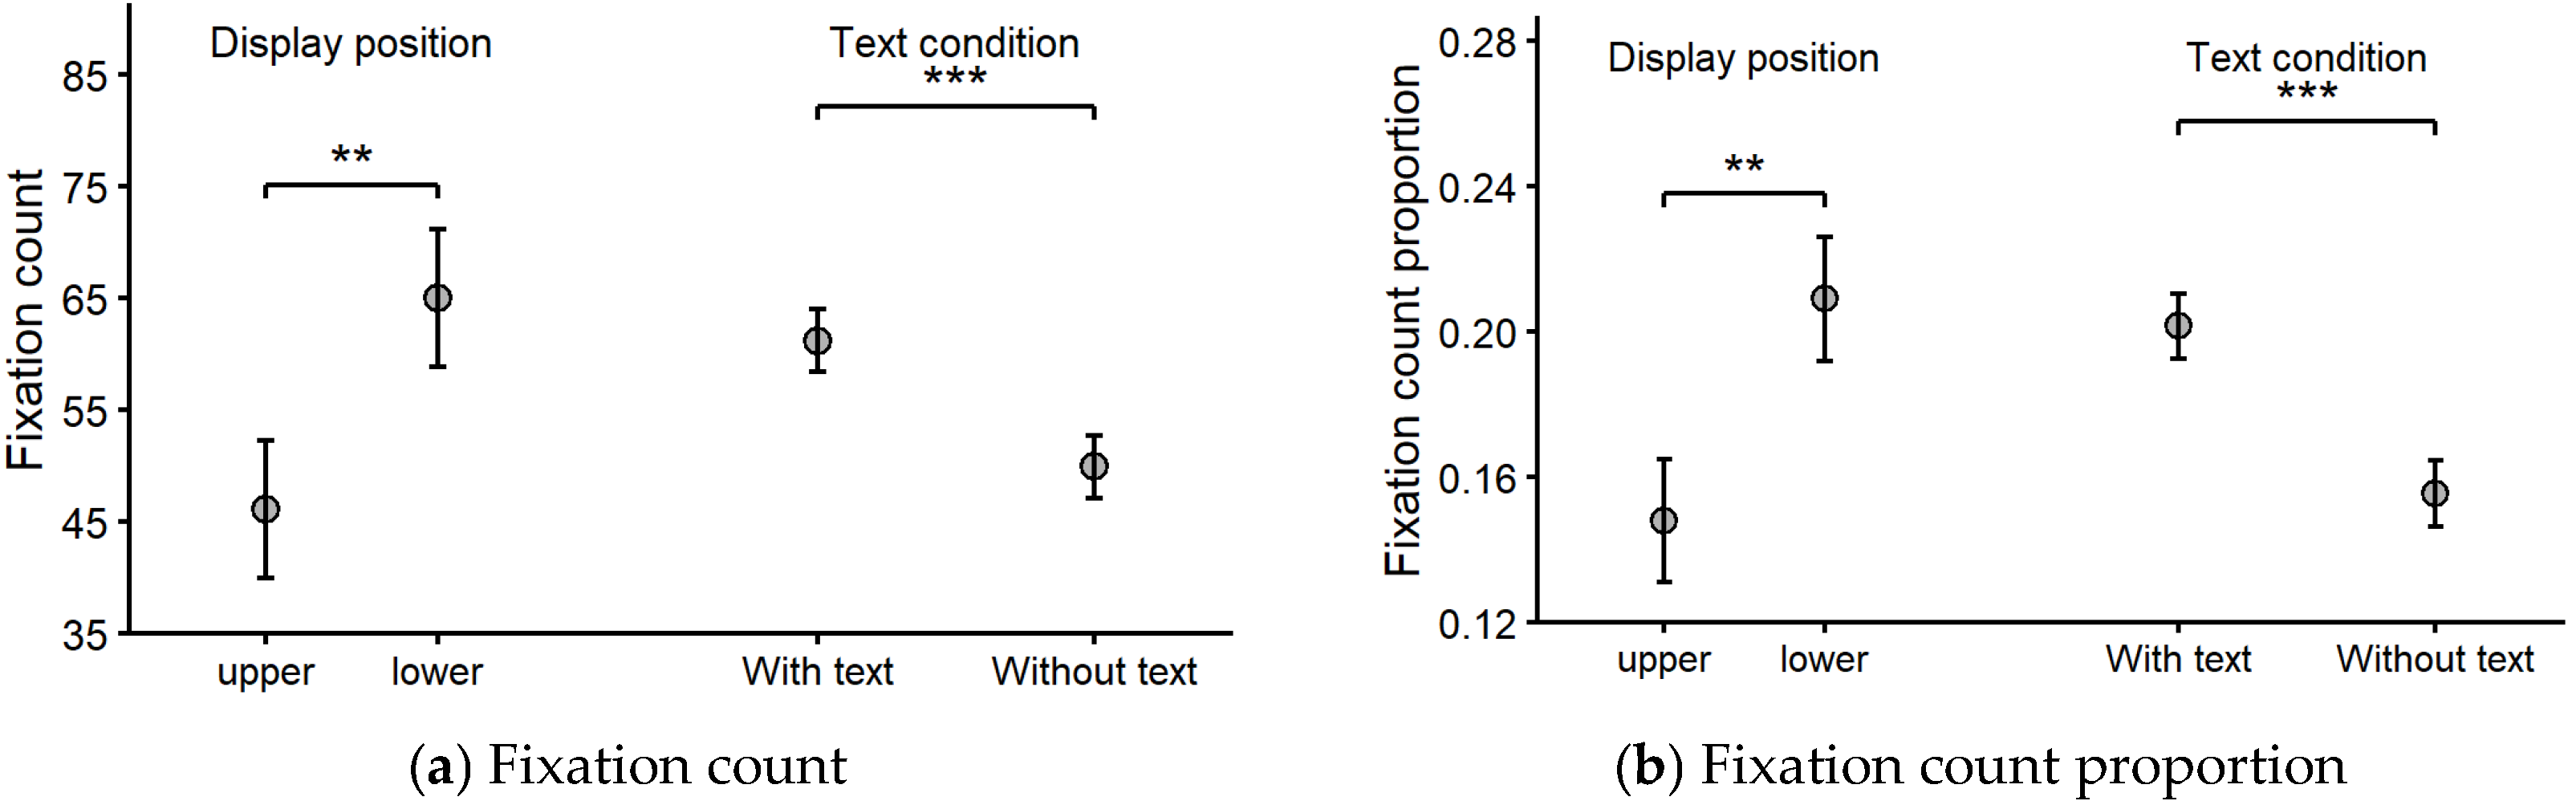
A repeated-measures ANOVA (Figure 5a) showed significant main effects of display position, F(1, 29) = 9.402, p = 0.005, ηp2 = 0.245, and text presentation, F(1, 29) = 16.490, p < 0.001, ηp2 = 0.362, whereas the interaction was not significant, F(1, 29) = 0.608, p = 0.442, ηp2 = 0.021. Pairwise comparisons indicated that fixation count was significantly higher for the lower display than for the upper display (MD = −18.867, SE = 6.153, 95% CI [−31.45, −6.29], p = 0.005) and significantly higher in the with-text condition than in the without-text condition (MD = 11.300, SE = 2.783, 95% CI [5.61, 16.99], p < 0.001).
Figure 5.
Main effects of display position and text condition on fixation metrics. Points show marginal means, and error bars indicate the standard error for the paired comparisons (N = 30). ** p < 0.01; *** p < 0.001.
4.3.4. Fixation Count Proportion
A repeated-measures ANOVA (Figure 5b) revealed significant main effects of display position, F(1, 29) = 12.533, p = 0.001, ηp2 = 0.302, and text presentation, F(1, 29) = 27.759, p < 0.001, ηp2 = 0.489, with no significant interaction, F(1, 29) = 0.000, p = 0.987, ηp2 = 0.000. Pairwise comparisons further showed that fixation count proportion was significantly higher for the lower display than for the upper display (MD = −0.062, SE = 0.017, 95% CI [−0.097, −0.027], p = 0.001) and significantly higher With text than Without text (MD = 0.046, SE = 0.009, 95% CI [0.028, 0.064], p < 0.001).
5. Discussion
5.1. Display Position Mode
5.1.1. Effects on Task Performance
The results of average reaction time revealed a significant main effect of display position, with the average reaction time for upper-field display being significantly longer than that for lower-field display. This indicates that lower-field display can shorten the reaction time to navigation information during driving, suggesting more efficient information acquisition and processing. Existing studies have suggested that drivers’ gaze is mostly concentrated on the road area; thus, overlaying HUD information near the road makes it easier to capture, which may also reduce mental stress and the cost of information acquisition [31,32]. In contrast, upper-field display overlays information on the sky area, while traditional Head-up Displays (HUDs) are located inside the cockpit—both of which may increase the cost of gaze deviation and gaze switching to a certain extent.
In terms of accuracy rate and total driving time, there were no significant main effects of display position. This suggests that different display positions do not significantly alter participants’ judgment accuracy of turning instructions, and tasks can be completed with high accuracy across all conditions. This result may be related to the characteristics of the experimental task. For instance, the direction judgment task in this study did not set strict time limits, making the accuracy rate insensitive to differences between conditions. Meanwhile, total driving time is a relatively macroscopic indicator, which may not be sufficient to reflect the subtle effects caused by differences in display position.
5.1.2. Subjective Scale Scores
Cognitive load scores can reflect participants’ subjective cognitive perceptions during task completion. Combining subjective and objective indicators helps to understand and analyze the results of other metrics. The results showed that the cognitive load score for upper-field display was significantly higher than that for lower-field display. This indicates that subjectively, participants perceived that the lower-field display mode consumed fewer cognitive resources and induced lower cognitive load during task performance. It should be noted that PAAS primarily reflects drivers’ overall perceived mental effort and task difficulty; therefore, the observed differences mainly represent global workload perception rather than detailed multidimensional workload components.
5.1.3. Effects on Eye Movement Metrics
The Mean Fixation Duration was significantly longer in the lower-field display than in the upper-field display. Fixation duration can index both the ease of information processing and the attentional allocation strategy shaped by interface design. When considered alongside the shorter reaction times and lower PAAS scores observed for the lower-field display in this study, the longer fixations are more plausibly interpreted as reflecting increased willingness to verify the navigation cue because it is positioned closer to the driving line of sight, rather than increased processing difficulty. At the same time, this difference may partly reflect drivers’ natural tendency to maintain gaze near the forward roadway region, since the lower-field HUD spatially aligns more closely with habitual road-centered gaze patterns. Prior work has noted that cognitive load and perceptual load may influence fixation duration in opposite directions, such that fixation duration should not be treated as a direct proxy for workload magnitude [24]. Accordingly, fixation duration here is interpreted primarily as an indicator of attention allocation rather than a linear measure of cognitive load intensity.
Both fixation count and fixation count proportion were significantly higher in the lower-field display condition, indicating more frequent HUD checking behavior and suggesting that lower-field cues are more likely to fall within the driver’s attentional window during driving. This pattern is consistent with the tendency for drivers’ gaze to be concentrated near the roadway region and converges with the finding of shorter reaction times under the lower-field display. Fixation count and fixation count proportion can thus provide complementary evidence for drivers’ attention allocation to the information region and task intent [33].
No significant difference was found in Mean Pupil Diameter between the two display positions. Although pupil size is widely used as an index of processing effort, it is also susceptible to external factors such as luminance; consequently, differences may not emerge under tasks that impose only moderate workload levels [34]. In the present study, the navigation prompts were intentionally concise and comparable to most commercially available HUD navigation designs, providing no global route overview and only delivering guidance at specific moments [35]. Moreover, both display positions were configured to keep the cues near the forward field of view, which likely reduced processing demands and may have attenuated position-related effects on pupil diameter.
Combining the results of task performance, subjective scores, and eye movement metrics, lower-field display demonstrated higher response efficiency, lower subjective load, and was accompanied by more frequent HUD-related fixation behaviors in the context of this study. It should be noted that these findings primarily reflect improvements in navigation information processing efficiency rather than direct evidence of enhanced driving safety, since safety-related navigation task performance indicators such as lane keeping or driving errors were not included in the present study. Meanwhile, the potential advantage of upper-field display lies in less occlusion; however, it also carries the risk of failing to capture attention promptly or incurring the cost of attentional allocation. Existing studies have also shown inconsistencies regarding the advantages and disadvantages of different display positions. For instance, some studies have indicated that overlaying navigation paths on the road may overlap with real objects such as vehicles and pedestrians, resulting in visual clutter and increased cognitive load, whereas displaying navigation information in the sky area is more reasonable and may facilitate turning maneuvers [36]. Meanwhile, other studies have pointed out that continuously highlighting paths in the peripheral visual field may divert drivers’ attention [35]. Therefore, against the backdrop of potential increases in HUD information volume in future applications, display position layout still needs to strike a balance between information accessibility and the risk of visual interference [37].
5.2. Text Display Mode
Taken together, task performance (accuracy, average reaction time, and total driving time) and subjective ratings showed no significant main effect of text presentation. However, this absence of statistical significance should be interpreted cautiously. The relatively moderate task complexity, short driving duration, and sample size may have limited the sensitivity to detect subtle text-related effects. This suggests that, under the controlled task complexity and information amount in the present experiment, the presence versus absence of text did not measurably change participants’ overall perceived workload or their macro-level performance. Notably, the mean PAAS scores across conditions were approximately 5 on the 9-point scale, corresponding to a moderate level of perceived cognitive load. This indicates that the task imposed a manageable but non-trivial demand, which may have constrained the observable impact of textual manipulation on global performance indicators.
By contrast, the eye-tracking metrics indicated that Mean Fixation Duration, Fixation Count, and Fixation Count Proportion were all significantly higher when text was present than when it was absent. Importantly, fixation-based measures are not determined solely by processing difficulty; they are also shaped by information-search and retrieval strategies [24]. In this study, textual elements provided additional details (e.g., road names and distance-to-turn cues), requiring participants to read and map the text onto the driving context. The resulting increase in fixation duration and more frequent glances toward the HUD therefore likely reflects a shift toward a real-time visual checking (or confirmation) strategy—that is, a task-driven information-sampling process in which drivers repeatedly consult the display to confirm and update their situational understanding—rather than a clear increase in subjectively experienced workload [38].
Nevertheless, adding text inevitably increases the amount and complexity of information that must be processed while driving. Higher text density can elevate the risk of visual clutter and distraction, particularly in time-varying driving tasks where additional reading demands may compete with the attentional resources needed for road monitoring [38]. When a HUD presents excessive information—especially in text form—it may also induce cognitive capture [20], whereby drivers’ responses to external hazards are delayed or attenuated during interface processing, potentially compromising safety. Consistent with this account, Recarte et al. reported that engaging in cognitively demanding activities such as text processing or complex conversations can reduce event detection performance and decrease attention to the road center [39]. More broadly, different forms of in-vehicle information interaction have been shown to alter drivers’ behavior and attention allocation, thereby increasing distraction risk [40], which aligns with the gaze-pattern differences observed here.
Overall, the present findings indicate that text presence may have limited impact on global performance and subjective workload under relatively constrained navigation demands, yet it systematically changes drivers’ gaze behavior. It remains plausible that under higher workload conditions—such as more complex traffic environments, higher traffic density, multi-lane navigation tasks, denser text presentation, or longer exposure durations—the additional processing demands introduced by text could translate into measurable increases in subjective workload and observable performance decrements. It should be noted that the textual manipulation reflected realistic HUD navigation prompts with relatively limited information density; more substantial text variations or prolonged driving exposure may yield stronger workload effects.
5.3. Analysis of the Interaction Effect Between Display Position and Text Presentation
A significant interaction between display position and text presentation was observed for Mean Fixation Duration. With respect to display position, the lower-field display yielded significantly longer Mean Fixation Duration than the upper-field display regardless of whether text was present, consistent with the main-effect pattern. This suggests that navigation cues placed closer to the roadway region are more likely to be incorporated into drivers’ visual attention and to receive sustained verification.
The interaction further clarified how text influenced fixation behavior across positions. For the upper-field display, Mean Fixation Duration did not differ significantly between the text-present and text-absent conditions. Given that upper-field cues elicited fewer fixations overall and were less likely to attract attention, it is plausible that participants engaged with the upper-field navigation information only intermittently; consequently, adding text did not produce a measurable change in fixation duration at this position. In contrast, for the lower-field display, Mean Fixation Duration was significantly longer when text was present than when it was absent. A likely explanation is that text introduces additional informational elements (e.g., road name and distance), increasing the amount and complexity of content that must be read and integrated, thereby prolonging gaze dwell time on the HUD and encouraging more thorough on-the-fly checking.
These findings have practical implications for HUD navigation design. Prior research has suggested that excessive textual content on HUDs can reduce drivers’ attention allocation to the route and surrounding traffic environment, thereby undermining situational awareness and driving safety [41]. Overly dense text may also interfere with the acquisition of critical road cues and increase potential risk [42]. Accordingly, when navigation prompts are placed in locations that are likely to receive sustained attention (e.g., the lower-field display), particular care should be taken in controlling the amount, length, and presentation of text to avoid unnecessary reading demands and attentional capture. When text is required, concise wording, clear visual hierarchy, and rapidly legible layout should be prioritized to preserve informational value while minimizing interference with the primary driving task.
6. Conclusions
Based on a simulated driving platform, this study systematically examined how HUD navigation information display position and navigation text presentation influence navigation task performance and workload-related measures. The results indicate that display position exerts a more direct and robust effect on both information acquisition efficiency and subjective experience. Specifically, compared with the upper-field display, the lower-field display significantly shortened reaction time to navigation prompts and reduced PAAS scores, suggesting that placing cues closer to the roadway region facilitates rapid information capture and decision-making while supporting sustained road monitoring.
In contrast, under the controlled task difficulty and information amount used in this study, text presence did not produce significant differences in macro-level task performance or subjective workload. However, text presentation showed a consistent modulation of fixation behavior within the HUD AOI and interacted with display position. This pattern implies that the role of text is more likely expressed through online visual checking and verification processes (e.g., changes in dwell and re-checking strategies) rather than necessarily translating into measurable differences in overall performance or subjective ratings. Overall, the lower-field display was associated with shorter reaction times and lower perceived workload in the present task, suggesting relatively more efficient navigation information acquisition under the experimental conditions. Moreover, within the lower-field display, adopting text-free graphical prompts helped reduce unnecessary visual dwell time on the HUD and potential interference, thereby maintaining high navigation efficiency while improving interface simplicity and controllability.
Despite the contributions of this study, several limitations should be acknowledged. First, the participant sample consisted only of young university students with driving experience, which may limit the generalizability of the findings to other driver populations, particularly older or highly experienced drivers. Second, the experiment was conducted in a fixed-base driving simulator with predefined scenarios, which may limit ecological validity compared with real-world driving conditions. The relatively short and repeated driving tasks may also have introduced potential learning effects and may not fully capture cognitive load and fatigue changes that occur during prolonged driving. Third, this study examined only two levels of display position and text presentation, while other interface parameters (e.g., layout geometry, typography, and visual density) were held constant.
On the basis of these findings, we recommend prioritizing the placement of critical HUD navigation information in regions closer to the driver’s roadway gaze channel, while carefully assessing the necessity and limiting the amount of text to reduce distraction risk and optimize usability. Future work should validate these conclusions under more complex road scenarios, higher information density, and more representative driver populations, and further evaluate optimal layout strategies under dynamic traffic conditions and richer cue designs (e.g., multi-level prompts and three-dimensional markers) using higher-fidelity simulations or real-world driving tests.
Author Contributions
Conceptualization, Hao Fang; methodology, Nai Yang; software, Dawu Nie; validation, Hongyun Guo; formal analysis, Dawu Nie; investigation, Dawu Nie; resources, Hao Fang; data curation, Kim Un; writing—original draft preparation, Dawu Nie; writing—review and editing, Hongyun Guo; visualization, Hongyun Guo; supervision, Nai Yang; project administration, Kim Un; funding acquisition, Hao Fang. All authors have read and agreed to the published version of the manuscript.
Funding
This research was funded by the Open Fund of Key Research Base of Humanities and Social Sciences in Regular Colleges and Universities of Hubei Province—Ecological Environment Design Research Center [grant number 2025RWSKPTCXJJ23].
Institutional Review Board Statement
This study was approved by the Research Ethics Committee of Wuhan Institute of Technology (Approval No. A2025003).
Informed Consent Statement
Informed consent was obtained from all participants involved in the study prior to the experiment.
Data Availability Statement
The data presented in this study are available on request from the corresponding author. The data are not publicly available as they are currently being used for ongoing research.
Acknowledgments
The authors would like to thank Ying Ran and Haoyu Gong for their valuable assistance in revising this manuscript.
Conflicts of Interest
The authors declare no conflicts of interest.
Abbreviations
The following abbreviations are used in this manuscript:
| AOI | Area of Interest |
| ANOVA | Analysis of Variance |
| HDD | Head-down display |
| HMI | Human–Machine Interface |
| HUD | Head-up display |
| LCD | Liquid Crystal Display |
| UE4 | Unreal Engine 4 |
References
- Zhong, X.; Cheng, Y.; Yang, J.; Tian, L. Evaluation and Optimization of In-Vehicle HUD Design by Applying an Entropy Weight-VIKOR Hybrid Method. Appl. Sci. 2023, 13, 3789. [Google Scholar] [CrossRef] [Scilit]
- Xiaohua, Z.; Xuewei, L.I.; Yu, Z.; Zhenlong, L.I.; Haijian, L.I.; Jianhua, Z. Review and Prospect of Human Factor Testing of Automotive Head up Displays in Connected Environment. J. Automot. Saf. Energy 2022, 13, 225. [Google Scholar]
- Guo, W.; Yan, D.; Liu, T.; Zhang, Z. Technical Challenge and Solution for Vehicle-Mounted AR-HUD Mass Commercial Application. In Proceedings of the International Conference on Optoelectronic and Microelectronic Technology and Application; SPIE: Bellingham, WA, USA, 2020; Volume 11617, pp. 964–974. [Google Scholar]
- Li, K.; Geng, Y.; Yöntem, A.Ö.; Chu, D.; Meijering, V.; Dias, E.; Skrypchuk, L. Head-up Display with Dynamic Depth-Variable Viewing Effect. Optik 2020, 221, 165319. [Google Scholar] [CrossRef] [Scilit]
- Zhu, Y.; Jing, Y.; Jiang, M.; Zhang, Z.; Wang, D.; Liu, W. A Experimental Study of the Cognitive Load of In-Vehicle Multiscreen Connected HUD. In Design, User Experience, and Usability: Design for Contemporary Technological Environments; Soares, M.M., Rosenzweig, E., Marcus, A., Eds.; Lecture Notes in Computer Science; Springer International Publishing: Cham, Switzerland, 2021; Volume 12781, pp. 268–285. ISBN 978-3-030-78226-9. [Google Scholar]
- de Oliveira Faria, N. Evaluating Automotive Augmented Reality Head-up Display Effects on Driver Performance and Distraction. In Proceedings of the 2020 IEEE Conference on Virtual Reality and 3D User Interfaces Abstracts and Workshops (VRW); IEEE: New York, NY, USA, 2020; pp. 553–554. [Google Scholar]
- Wang, Y.; Song, J.; An, X.; Ma, S.; Li, H.; Wang, D.; Yang, Z. Head-Up Display Graphic Warning to Support Collision Avoidance: Effect of Graphic Animation and Border on Driving Behavior and Eye Movement Pattern. Transp. Res. Rec. J. Transp. Res. Board 2023, 2677, 636–652. [Google Scholar] [CrossRef] [Scilit]
- Ye, M.; Yin, J. Spatial Plane Positioning of AR-HUD Graphics: Implications for Driver Inattentional Blindness in Navigation and Collision Warning Scenarios. Electronics 2025, 14, 4768. [Google Scholar] [CrossRef] [Scilit]
- Ma, X.; Jia, M.; Hong, Z.; Kwok, A.P.K.; Yan, M. Does Augmented-Reality Head-up Display Help? A Preliminary Study on Driving Performance through a VR-Simulated Eye Movement Analysis. IEEE Access 2021, 9, 129951–129964. [Google Scholar] [CrossRef] [Scilit]
- Engström, J.; Markkula, G.; Victor, T.; Merat, N. Effects of Cognitive Load on Driving Performance: The Cognitive Control Hypothesis. Hum. Factors 2017, 59, 734–764. [Google Scholar] [CrossRef] [Scilit]
- Kim, S.; Dey, A.K. Simulated Augmented Reality Windshield Display as a Cognitive Mapping Aid for Elder Driver Navigation. In Proceedings of the SIGCHI Conference on Human Factors in Computing Systems, Boston, MA, USA, 4–9 April 2009; ACM: New York, NY, USA, 2009; pp. 133–142. [Google Scholar]
- Bark, K.; Tran, C.; Fujimura, K.; Ng-Thow-Hing, V. Personal Navi: Benefits of an Augmented Reality Navigational Aid Using a See-Thru 3D Volumetric HUD. In Proceedings of the 6th International Conference on Automotive User Interfaces and Interactive Vehicular Applications, Seattle, WA, USA, 17–19 September 2014; ACM: New York, NY, USA, 2014; pp. 1–8. [Google Scholar]
- Chen, W.; Song, J.; Wang, Y.; Wu, C.; Ma, S.; Wang, D.; Yang, Z.; Li, H. Inattentional Blindness to Unexpected Hazard in Augmented Reality Head-up Display Assisted Driving: The Impact of the Relative Position between Stimulus and Augmented Graph. Traffic Inj. Prev. 2023, 24, 344–351. [Google Scholar] [CrossRef] [Scilit]
- Lee, J.; Lee, N.; Ju, J.; Chae, J.; Park, J.; Ryu, H.S.; Cho, Y.S. Visual Complexity of Head-Up Display in Automobiles Modulates Attentional Tunneling. Hum. Factors 2024, 66, 1879–1892. [Google Scholar] [CrossRef] [Scilit]
- Tretten, P.; Garling, A.; Nilsson, R.; Larsson, T.C. An On-Road Study of Head-Up Display: Preferred Location and Acceptance Levels. Proc. Hum. Factors Ergon. Soc. Annu. Meet. 2011, 55, 1914–1918. [Google Scholar] [CrossRef] [Scilit]
- Kim, H.; Gabbard, J.L. Assessing Distraction Potential of Augmented Reality Head-Up Displays for Vehicle Drivers. Hum. Factors 2022, 64, 852–865. [Google Scholar] [CrossRef] [Scilit]
- Li, J.; Chen, K.; Chen, M. The Influence of Information Redundancy on Driving Behavior and Psychological Responses Under Different Fog and Risk Conditions: An Analysis of AR-HUD Interface Designs. Appl. Sci. 2025, 15, 11072. [Google Scholar] [CrossRef] [Scilit]
- Phongphaew, N.; Jiamsanguanwong, A. Text-Based Information Design for in-Vehicle Displays: A Systematic Review. Transp. Res. Part F Traffic Psychol. Behav. 2024, 103, 442–459. [Google Scholar] [CrossRef] [Scilit]
- Leshed, G.; Velden, T.; Rieger, O.; Kot, B.; Sengers, P. In-Car Gps Navigation: Engagement with and Disengagement from the Environment. In Proceedings of the SIGCHI Conference on Human Factors in Computing Systems, Florence, Italy, 5–10 April 2008; ACM: New York, NY, USA, 2008; pp. 1675–1684. [Google Scholar]
- Bossi, L.; Ward, N.; Parkes, A. The Effect of Simulated Vision Enhancement Systems on Driver Peripheral Target Detection and Identification. In Proceedings of the 12th Triennial Congress of the International Ergonomics Association; Human Factors Association of Canada: Vaughan, ON, Canada, 1994; pp. 192–195. [Google Scholar]
- Hung, Y.-H.; Tan, Y. How Symbol and Text Combine to Promote Sign Comprehension: Evidence from Eye-Tracking. Displays 2024, 83, 102709. [Google Scholar] [CrossRef] [Scilit]
- Brookhuis, K.A.; De Waard, D. Monitoring Drivers’ Mental Workload in Driving Simulators Using Physiological Measures. Accid. Anal. Prev. 2010, 42, 898–903. [Google Scholar] [CrossRef] [Scilit]
- Paxion, J.; Galy, E.; Berthelon, C. Mental Workload and Driving. Front. Psychol. 2014, 5, 1344. [Google Scholar] [CrossRef] [Scilit]
- Liu, J.-C.; Li, K.-A.; Yeh, S.-L.; Chien, S.-Y. Assessing Perceptual Load and Cognitive Load by Fixation-Related Information of Eye Movements. Sensors 2022, 22, 1187. [Google Scholar] [CrossRef] [Scilit]
- Chen, W.; Sawaragi, T.; Hiraoka, T. Comparing Eye-Tracking Metrics of Mental Workload Caused by NDRTs in Semi-Autonomous Driving. Transp. Res. Part F Traffic Psychol. Behav. 2022, 89, 109–128. [Google Scholar] [CrossRef] [Scilit]
- Mathôt, S.; Vilotijević, A. Methods in Cognitive Pupillometry: Design, Preprocessing, and Statistical Analysis. Behav. Res. Methods 2022, 55, 3055–3077. [Google Scholar] [CrossRef] [Scilit] [PubMed]
- Orquin, J.L.; Loose, S.M. Attention and Choice: A Review on Eye Movements in Decision Making. Acta Psychol. 2013, 144, 190–206. [Google Scholar] [CrossRef] [Scilit]
- Klepsch, M.; Seufert, T. Understanding Instructional Design Effects by Differentiated Measurement of Intrinsic, Extraneous, and Germane Cognitive Load. Instr. Sci. 2020, 48, 45–77. [Google Scholar] [CrossRef] [Scilit]
- Paas, F.; Tuovinen, J.E.; Tabbers, H.; Van Gerven, P.W. Cognitive Load Measurement as a Means to Advance Cognitive Load Theory. In Cognitive Load Theory; Routledge: London, UK, 2016; pp. 63–71. [Google Scholar]
- Paas, F.G. Training Strategies for Attaining Transfer of Problem-Solving Skill in Statistics: A Cognitive-Load Approach. J. Educ. Psychol. 1992, 84, 429. [Google Scholar] [CrossRef]
- Liu, Y.-C.; Wen, M.-H. Comparison of Head-up Display (HUD) vs. Head-down Display (HDD): Driving Performance of Commercial Vehicle Operators in Taiwan. Int. J. Hum.-Comput. Stud. 2004, 61, 679–697. [Google Scholar]
- Gish, K.W.; Staplin, L.; Stewart, J.; Perel, M. Sensory and Cognitive Factors Affecting Automotive Head-Up Display Effectiveness. Transp. Res. Rec. J. Transp. Res. Board 1999, 1694, 10–19. [Google Scholar] [CrossRef] [Scilit]
- Bauerfeind, K.; Drüke, J.; Bendewald, L.; Baumann, M. How Does Navigating with Augmented Reality Information Affect Drivers’ Glance Behaviour in Terms of Attention Allocation? Front. Virtual Real. 2022, 3, 930117. [Google Scholar] [CrossRef] [Scilit]
- Gorin, H.; Patel, J.; Qiu, Q.; Merians, A.; Adamovich, S.; Fluet, G. A Review of the Use of Gaze and Pupil Metrics to Assess Mental Workload in Gamified and Simulated Sensorimotor Tasks. Sensors 2024, 24, 1759. [Google Scholar] [CrossRef] [Scilit] [PubMed]
- Medenica, Z.; Kun, A.L.; Paek, T.; Palinko, O. Augmented Reality vs. Street Views: A Driving Simulator Study Comparing Two Emerging Navigation Aids. In Proceedings of the 13th International Conference on Human Computer Interaction with Mobile Devices and Services, Stockholm, Sweden, 30 August–2 September 2011; ACM: New York, NY, USA, 2011; pp. 265–274. [Google Scholar]
- Bobis, J.; Sweller, J.; Cooper, M. Cognitive Load Effects in a Primary-School Geometry Task. Learn. Instr. 1993, 3, 1–21. [Google Scholar] [CrossRef] [Scilit]
- Betancur, J.A.; Vargas, H.; Sanchez, C.; Merienne, F. Visual Guidelines Integration for Automotive Head-up Displays Interfaces. Int. J. Interact. Des. Manuf. 2025, 19, 2841–2852. [Google Scholar] [CrossRef] [Scilit]
- Yamin, P.A.; Park, J.; Kim, H.K. In-Vehicle Human–Machine Interface Guidelines for Augmented Reality Head-up Displays: A Review, Guideline Formulation, and Future Research Directions. Transp. Res. Part F Traffic Psychol. Behav. 2024, 104, 266–285. [Google Scholar] [CrossRef] [Scilit]
- Recarte, M.A.; Nunes, L.M. Mental Workload While Driving: Effects on Visual Search, Discrimination, and Decision Making. J. Exp. Psychol. Appl. 2003, 9, 119. [Google Scholar] [CrossRef] [Scilit]
- Zhong, Q.; Zhi, J.; Xu, Y.; Gao, P.; Feng, S. Assessing Driver Distraction from In-Vehicle Information System: An on-Road Study Exploring the Effects of Input Modalities and Secondary Task Types. Sci. Rep. 2024, 14, 20289. [Google Scholar] [CrossRef] [Scilit] [PubMed]
- Winkler, M.; Soleimani, M. A Review of Augmented Reality Heads Up Display in Vehicles: Effectiveness, Application, and Safety. Int. J. Hum.-Comput. Interact. 2025, 41, 11405–11420. [Google Scholar] [CrossRef] [Scilit]
- Ahlström, C.; Kircher, K.; Nyström, M.; Wolfe, B. Eye Tracking in Driver Attention Research—How Gaze Data Interpretations Influence What We Learn. Front. Neuroergonomics 2021, 2, 778043. [Google Scholar] [CrossRef] [Scilit] [PubMed]

Disclaimer/Publisher’s Note: The statements, opinions and data contained in all publications are solely those of the individual author(s) and contributor(s) and not of MDPI and/or the editor(s). MDPI and/or the editor(s) disclaim responsibility for any injury to people or property resulting from any ideas, methods, instructions or products referred to in the content. |
© 2026 by the authors. Published by MDPI on behalf of the International Society for Photogrammetry and Remote Sensing. Licensee MDPI, Basel, Switzerland. This article is an open access article distributed under the terms and conditions of the Creative Commons Attribution (CC BY) license.