


Abstract
Driving style, reflected in recurrent patterns of acceleration, braking, speed selection, following distance, gear use, and lane-changing behavior, plays an important role in road safety and is also associated with fuel consumption, emissions, passenger comfort, and vehicle wear. This paper presents a structured review of recent research on driving style analysis, with particular emphasis on its relationship with road-safety outcomes and risk indicators. Following a PRISMA-oriented methodology, studies published between 2015 and 2025 were identified, screened, and synthesized to examine how driving styles are defined, detected, classified, and evaluated. The review shows a clear shift toward data-driven approaches, including feature-based machine learning and representation-learning methods using support vector machines, ensemble models, convolutional neural networks, recurrent neural networks, and hybrid deep learning architectures. Common data sources include smartphone inertial and GNSS signals, CAN/OBD vehicle data, telematics platforms, naturalistic driving datasets, and camera-based perception systems. Safety impact is most often assessed through crashes, near-miss events, traffic conflicts, time-to-collision measures, harsh maneuvers, and composite risk scores. Across the reviewed literature, aggressive and unstable driving patterns are generally associated with reduced safety margins and increased risk, although comparability remains limited by inconsistent label definitions, heterogeneous datasets, indirect safety proxies, and varied validation protocols. The paper also proposes a reproducible database architecture linking drivers, trips, driving events, and safety events to support transparent analysis, benchmark development, and future implementation in fleet monitoring, driver feedback, and connected vehicle applications.
1. Introduction
Road transport systems are undergoing rapid changes driven by growing demand for mobility, vehicle electrification, and the implementation of connected and automated driving features. These changes increase the number of situations in which human behavior must be interpreted by vehicles, infrastructure, and safety-management systems. Despite technological advances, traffic accidents remain a major social challenge because of their human and economic costs. Driver behavior remains an important contributor to crash risk; consequently, understanding stable driving patterns and the conditions under which they become unsafe is central to road-safety research and practice [1].
In this context, driving style analysis has become a multidisciplinary field at the intersection of psychology (risk perception, decision-making, and attention), automotive and transportation engineering (vehicle dynamics, ADAS, and connected-vehicle functions), and data science (measurement, feature extraction, and modeling). In this review, driving behavior is the broad set of observable actions, whereas driving style denotes relatively recurrent patterns across maneuvers, trips, or contexts. Observable maneuvers such as acceleration, braking, and turning can be captured with smartphone sensors for automatic detection [2].
Driving style must also be distinguished from driver state. Distraction, fatigue, drowsiness, emotional arousal, and alcohol impairment are transient conditions that can alter behavior during a limited interval; they are not persistent styles. State-focused studies are retained only as a secondary safety-related evidence stratum when they link measurable behavior to a road-safety outcome, and their findings are reported separately from style-classification evidence.
A common way to approach this topic is to distinguish between aggressive, defensive, or preventive, and eco-friendly or economical driving styles. Aggressive driving is a risk-oriented style characterized by sudden acceleration and braking, tailgating, risky passing, frequent and abrupt lane changes, and inadequate signaling; these behaviors reduce safety margins, increase exposure to traffic conflicts, and may limit the driver’s available reaction time in unexpected situations. Defensive driving is a safety-oriented style based on anticipation, stability, compliance with traffic rules, safe following distance, speed adaptation to road and traffic conditions, avoidance of distractions, and controlled maneuvers. Eco-driving is an efficiency-oriented style focused on reducing fuel or energy consumption, emissions, and operating costs through steady speed, limited idling, and avoidance of unnecessary acceleration and braking. These categories are not always mutually exclusive, and their interpretation may vary depending on the study, road type, vehicle type, traffic density, and labeling strategy, such as self-reports, questionnaires, expert annotations, rule-based thresholds, or data-driven clustering algorithms [3,4]. Consequently, research and practice increasingly focus on understanding and influencing driving style not only to prevent accidents, but also to improve comfort, reduce emissions or energy consumption, and lower fleet operating costs [5,6].
Recent studies demonstrate the practical relevance of driving style analysis using widely available sensing and connectivity technologies. Telematics, smartphone sensors, CAN/OBD signals, and infrastructure connectivity enable continuous measurement under everyday conditions, while feedback, training, insurance, and fleet-management platforms translate measurements into interventions [7]. Connected-vehicle and vehicle-to-infrastructure applications can support safety- and environment-oriented trajectory guidance, and ADAS can personalize warnings or assistance thresholds using estimates of recurrent driver behavior [8,9]. These uses also create governance risks because location histories, video, physiological signals, and persistent driver profiles can reveal sensitive information; privacy, data minimization, access control, and fairness therefore form part of the review scope. Current inputs include inertial and GNSS signals, in-vehicle networks, telematics, and driver- or road-facing cameras, supporting both offline analysis and real-time feedback [8,10].
Although driving style research is extensive, the preceding diversity of sensors and applications has produced fragmented terminology, measurement methods, validation protocols, and safety endpoints. Reported relationships with safety also depend on road type, traffic density, vehicle, weather, and transient driver state. The review therefore synthesizes: (i) definitions and operational labels; (ii) data sources and behavioral indicators; (iii) recognition methods and validation practices; (iv) relationships with direct and surrogate safety outcomes; and (v) implementation, privacy, and feedback requirements. The objective is to identify comparable evidence, expose limitations, and support integration with ADAS, connected vehicles, and fleet applications.
This review focuses on recurrent driving style and its road-safety relevance. The five analytical dimensions—definitions/taxonomies, features, sensing architectures, modeling approaches, and safety indicators—were selected because they correspond to the consecutive decisions required to reproduce a study: define the construct, measure it, acquire the data, estimate the construct, and evaluate its safety meaning. The proposed database framework follows the same chain so that each result can be traced from raw observation to label and safety endpoint.
This review is guided by the following research questions:
- What methods are used to identify and classify driving styles?
- What data sources and detection architectures are used to analyze driving behavior?
- How do driving styles affect road-safety indicators and risk-related outcomes?
The questions map to the analytical dimensions as follows: RQ1 covers definitions, features, and models; RQ2 covers sensing and acquisition architectures; and RQ3 covers direct and surrogate safety indicators. Implementation, privacy, and database requirements cut across all three questions because they determine whether results can be reproduced and compared.
Unlike reviews centered primarily on recognition algorithms or intelligent-vehicle control [11,12], this study connects sensing modalities, behavioral taxonomies, model families, validation choices, safety endpoints, and implementation constraints in one evidence chain. Its additional contribution is an author-proposed, explicitly conceptual data architecture derived from the fields repeatedly required across the 80 included studies; the architecture is intended as a testable recommendation for benchmark development, not as a validated standard.
2. Methodology
2.1. Review Design and Scope
This systematic review followed PRISMA 2020 [13]. The PRISMA 2020 checklist is provided in Supplementary File S1. The primary object was driving style, defined as recurrent patterns across maneuvers, trips, or contexts. The broader term driving behavior was used only for observable actions from which style is inferred. Studies of transient driver state were eligible only as a separately coded, safety-related stratum, and simulator studies were eligible when they analyzed empirical human driving behavior and reported an explicit safety outcome or surrogate indicator.
Before screening, the author team defined the research scope, eligibility criteria, search concepts, screening procedure, extraction fields, and narrative synthesis plan. The protocol was not prospectively registered. The 80-study synthesis was restricted to the 2015–2025 eligibility window; later or earlier contextual references cited in the Introduction or Discussion were not counted as included studies.
2.2. Information Sources and Search Strategy
A comprehensive literature search was conducted across four major bibliographic databases: IEEE Xplore, Scopus, Web of Science, and ScienceDirect. These databases were selected to ensure broad interdisciplinary coverage, encompassing transportation engineering, intelligent systems, and data science.
The search strategy was designed to capture three key conceptual dimensions:
- (i)
- driving behavior or driving style,
- (ii)
- road safety or accident risk, and
- (iii)
- detection and classification methods, particularly those based on data-driven techniques.
Search queries were adapted to the syntax of each database. Database-specific search fields and Boolean strings are summarized in Table 1. A representative query is provided below:
Table 1.
Database-specific search fields and Boolean strings used for the review.
(“driving style” OR “driving behavior” OR “driver behavior”) AND (“road safety” OR “accident risk”) AND (“classification” OR “detection”) AND (“machine learning” OR “telematics” OR “CAN bus” OR “smartphone”)
Filters restricted the synthesis to English-language, peer-reviewed journal or conference publications from 1 January 2015 through 31 December 2025. Searches covered title, abstract, author–keyword, or topic fields as available in each platform. The original access-date log was not preserved; therefore, an exact day of database execution cannot be reported retrospectively, and this is now identified as a reproducibility limitation. No supplementary backward/forward citation search contributed records to the 80-study synthesis; citation chaining was used only to identify contextual references for interpretation.
2.3. Eligibility Criteria
Studies were selected based on predefined inclusion and exclusion criteria aligned with the objectives of the review.
Studies were eligible when they were peer-reviewed journal articles or conference papers published in English from 2015 through 2025 and analyzed empirical driving behavior using real-world, naturalistic, instrumented, or human-in-the-loop simulator data. Each included study also had to report a safety outcome or a safety-relevant indicator, such as a crash, near-miss, conflict, time-to-collision measure, violation, harsh maneuver, or risk score. Reviews and dataset papers were retained only when they contributed directly to the prespecified synthesis fields and were coded by study type.
Studies were excluded when they did not address driving behavior in transportation, lacked an empirical human-driving component, did not report a safety-relevant endpoint, duplicated another database record, or lacked sufficient methodological information for extraction. Simulator studies were not excluded solely because of setting; instead, simulator-only evidence was flagged during appraisal and was not treated as proof of real-world effectiveness.
2.4. Study Selection Process
The study selection process followed the PRISMA 2020 framework and is summarized in Figure 1.
Figure 1.
PRISMA 2020 flow diagram for identification, screening, full-text assessment, and inclusion. The retained screening record preserves the aggregate number of full-text exclusions (n = 47), but not a mutually exclusive reason-level count; unsupported category totals are therefore not reconstructed.
The database search identified 1634 records. Before title/abstract screening, 657 records were removed: 256 duplicates and 401 records outside the prespecified year, document-type, or language limits. Of 977 screened records, 850 were excluded as outside the scope, and 127 reports underwent full-text assessment. Forty-seven full texts failed one or more criteria concerning transportation-focused driving behavior, an empirical human-driving component, or a safety-relevant endpoint; 80 studies entered the qualitative synthesis. Because the original log did not retain one mutually exclusive primary reason for each of the 47 reports, category-specific totals and an inter-rater coefficient cannot be reconstructed without inventing data.
2.5. Data Extraction and Coding
Three authors participated in screening and data extraction using a shared form covering publication type, data source, sensing modality, style or state construct, feature representation, model, validation, performance metric, and safety endpoint. Keyword rules supported initial discovery of candidate fields, but every included record was manually checked against the available full text. Uncertain classifications were discussed by the author team and resolved by consensus. Initial independent decisions were not retained in a form that permits a defensible retrospective Cohen’s kappa or percentage-agreement calculation; this absence is reported as a limitation rather than replaced by a post hoc estimate.
In addition, key feature representations were extracted, including variables such as speed variability, acceleration and deceleration intensity, jerk, lane positioning, and lane-change behavior. Information on modeling approaches, ranging from classical machine learning methods to deep learning and explainable artificial intelligence, was also documented, along with evaluation protocols and performance metrics.
Safety-related outcomes were systematically recorded, including accident occurrence, near-misses, traffic conflicts, and surrogate safety indicators or risk scores.
2.6. Risk of Bias and Study Limitations
Because the included publications span classification experiments, naturalistic analyses, simulator studies, telematics investigations, reviews, and dataset papers, a single intervention-style risk-of-bias instrument would not be valid across the full evidence set. The revision therefore reports a study-level applicability and reporting appraisal, rather than implying a homogeneous causal-effect risk-of-bias score.
Each study was appraised on five reproducible items that could be verified from the extraction record: (1) data source reported; (2) real-world or naturalistic evidence available rather than simulator-only evidence; (3) modeling method reported; (4) driving style or driver-state construct explicitly identified; and (5) safety endpoint specified beyond a generic road-safety claim. One point was assigned per item (0–5). Table A1 reports every study’s score and limitation flags: DS, data source not reported; SIM, simulator-only setting; M, method not reported; C, construct not reported; and S, safety endpoint nonspecific. This appraisal found 36 studies (45.0%) with higher completeness/applicability scores (4–5), 19 (23.8%) with a score of 3, and 25 (31.3%) with lower scores (0–2). The score supports interpretation of reporting transparency and applicability; it is not a substitute for a design-specific causal risk-of-bias assessment.
2.7. Data Synthesis
Due to the heterogeneity in definitions of driving behavior, sensing technologies, feature representations, and safety outcome measures, a quantitative meta-analysis was not feasible.
Instead, a narrative synthesis approach was adopted. The results are presented through descriptive analysis and supported by summary tables that facilitate comparison across studies. These tables map relationships between data sources and modeling approaches, driving style classifications and behavioral indicators, and safety assessment methods and reported outcomes.
Table A1 provides a structured overview of the included studies, enabling the identification of trends, methodological patterns, and research gaps.
2.8. Reproducibility and Data Availability
For traceability, the authors maintained a broader working bibliography that includes contextual and early-access publications outside the strict 2015–2025 synthesis window. Only the 80 studies listed in Table A1 contribute to study-level frequencies and percentages. The extraction table and screening decisions are available from the corresponding author on reasonable request.
3. Results
The qualitative synthesis included 80 studies. Forty-five studies addressed recurrent style categories, 35 addressed at least one transient state, and nine included both; nine records did not provide a sufficiently specific style/state label in the extraction table. Because categories can overlap, all subsequent percentages use 80 studies as the denominator and are explicitly study-level rather than keyword-occurrence counts.
3.1. Integrated Framework for Driving Style Detection
Across the included studies, driving style recognition generally followed five stages: acquisition, preprocessing/segmentation, feature construction or representation learning, model estimation, and evaluation. Feature-based studies used interpretable kinematic summaries such as speed variability, acceleration, braking intensity, jerk, following distance, and lane-change measures; Carlos et al. showed that representation choice materially affects smartphone-based aggressive driving recognition [4]. Representation-learning studies instead learned temporal or visual features, including CNN-based highway detection [3], CRNN eye-behavior analysis [14], and hybrid CNN-LSTM distraction detection [15].
At study level, CNNs appeared in 15 of 80 studies (18.8%), SVMs in 12 (15.0%), random forests in 11 (13.8%), clustering in 11 (13.8%), RNN/LSTM models in 10 (12.5%), gradient boosting in nine (11.3%), XAI in four (5.0%), and transformers in two (2.5%); studies could contribute to multiple categories. Khanfar et al. used unsupervised learning to derive behavior classes at signalized intersections [16], whereas Chen et al. combined clustering and LSTM components for aggressive driving detection in a simulator [17], illustrating both methodological breadth and the need to distinguish setting-specific validation from real-world generalization.
Recurrent style labels included aggressive (18 studies; 22.5%), normal (10; 12.5%), cautious (four; 5.0%), defensive (one; 1.3%), and eco-friendly (one; 1.3%); 23 studies (28.8%) used a general or continuous driving style construct. Transient-state evidence was coded separately: fatigue/drowsiness appeared in 27 studies (33.8%), distraction in 15 (18.8%), and driver emotion/state in one (1.3%). These overlapping frequencies describe what each study analyzed and do not redefine transient states as styles.
3.1.1. Data Sources and Detection Channels
Modeling depends on each detection channel’s sampling rate, coverage, and contextual resolution. Smartphone studies offer scalable kinematics but require orientation and placement control [2,4]; CAN/OBD studies provide vehicle-specific signals suitable for event and fleet analysis [18,19]; camera systems capture maneuvers, scene context, and visible driver cues but face lighting, occlusion, and privacy constraints [20,21]; and naturalistic or telematics sources support longitudinal exposure but often restrict access [22,23,24]. Multimodal systems can improve context awareness while increasing synchronization, governance, and validation demands.
Vehicle data obtained from the CAN bus or OBD-II can provide high-frequency signals, such as speed, engine load, throttle position, and braking-related indicators. These signals enable event detection (e.g., sudden braking, rapid acceleration) and continuous driving style assessment, and are well-suited for fleet scenarios where instrumentation is feasible.
Smartphones provide accelerometers, gyroscopes, and GPS data that can estimate longitudinal and lateral dynamics, speed profiles, and route context at a low cost. However, these introduce additional challenges, such as variability in device placement, changes in orientation, and sensor noise, which necessitate the normalization and robust design of features or representation learning.
In terms of perception and visualization, camera-based approaches estimate driving style indirectly through maneuvers, interactions, and scene context (e.g., vehicle tracking, lane changes, and near-miss situations) and can also support the estimation of the driver’s state. Vision-based systems often rely on CNN-based feature extraction and may require careful analysis of lighting, occlusion, and privacy [20].
Dedicated telematic systems and observational datasets on driving behavior provide long-term, real-world driving trajectories that reflect behavioral diversity. Their primary value lies in their ecological validity, but access is often restricted, and labeling can vary across providers. This contributes to a lack of standardized benchmarks and limits comparability between studies [22,23].
The study-level distribution was: video camera, 18/80 (22.5%); driving simulator, 8/80 (10.0%); smartphone IMU/GNSS, 6/80 (7.5%); CAN/OBD, 6/80 (7.5%); telematics, 2/80 (2.5%); and explicitly labeled naturalistic driving, 1/80 (1.3%). Categories overlap, and many reports were coded as unspecified, so totals do not amount to 80. Simulator studies are retained as empirical, setting-limited evidence and are flagged SIM in Table A1.
3.1.2. Classification Methods
Across the 80 reviewed studies, five main methodological categories were identified:
- Rule-based scoring and thresholding, including counts of harsh events, safety margins, and composite style indices [24,25,26].
- Classical supervised learning, including SVM, logistic regression, k-NN, decision trees, random forests, and boosting [9,19,27,28,29].
- Deep learning for time series and vision, including CNN encoders, LSTM/RNN sequence models, and multimodal fusion [3,14,15,30,31].
- Unsupervised pattern discovery, including clustering of latent styles, trajectories, or maneuvers [16,32,33,34].
- Explainability and personalization, including feature attribution, interpretable rules, driver-specific adaptation, and personalized recommendations [9,35,36,37].
3.1.3. Preprocessing, Segmentation, Representation, and Evaluation
Driving style detection converts raw sensor observations into labels or scores at the maneuver, trip-segment, trip, or driver level. The included study set comprises 80 publications. Detection tasks include binary classification (e.g., aggressive versus non-aggressive), multi-class classification, continuous scoring, and event detection. Results may be computed per fixed window or maneuver and then aggregated. Because safety-oriented studies often use surrogate indicators rather than rare crash events, endpoint definitions and thresholds materially affect interpretation [11].
Raw signals typically require synchronization, noise removal, coordinate normalization (especially for smartphone IMUs), and missing data handling. Segmentation is usually implemented through trip-level partitioning or rule-based maneuver separation (e.g., acceleration/deceleration events and lane changes). Event-based representations can improve interpretability and facilitate safety mapping (e.g., counting severe events or measuring time-distance violations), but they can also introduce sensitivity to threshold choices and sensor noise.
Segmentation and preprocessing details were not reported consistently enough in the extraction table to support defensible study-level prevalence estimates. The earlier keyword-occurrence counts have therefore been removed. The synthesis instead distinguishes fixed windows, trip partitions, and maneuver/event segmentation qualitatively and identifies missing segmentation detail as a reporting limitation.
Feature-based approaches summarize segments using statistics and domain indicators such as speed profiles, acceleration/braking intensity, jerk, and lane-change frequency [4,25,32]. These features are interpretable and practical on constrained hardware. Representation-learning approaches learn latent features from raw time series or images [3,14,15], while multimodal fusion combines vehicle kinematics with scene, map, or physiological context [38,39,40].
Evaluation practices vary by study, reflecting differences in tasks and label definitions. Reported performance is often summarized using accuracy and class-based metrics [11,12].
AUC/ROC—Area Under the Curve/Receiver Operating Characteristic—is used in some binary classification settings. Cross-validation (e.g., k-fold) is common, but it can be misleading when samples from the same driver appear in both the training and test sets; independent splits of drivers are more suitable for generalization claims. From a safety perspective, special attention is required for class imbalance (rare high-risk events), calibration, and cost-sensitive errors (false negatives vs. false positives).
At study level, the principal model families were CNN (15/80; 18.8%), SVM (12/80; 15.0%), random forest (11/80; 13.8%), clustering (11/80; 13.8%), RNN/LSTM (10/80; 12.5%), and gradient boosting (9/80; 11.3%). Reported accuracy or class metrics remain difficult to compare because tasks, labels, splits, and datasets differ. Practical systems must also report latency, energy use, sensor-placement robustness, calibration, and false-negative costs. Edge processing can reduce data transfer and support privacy, whereas cloud processing supports heavier models but requires stronger governance [10,20,41].
Privacy is treated here as a cross-cutting implementation requirement introduced in Section 1, rather than as an isolated keyword count. Performance claims should be interpreted together with the sensing channel, label source, driver independence of the evaluation, direct versus surrogate safety endpoint, and deployment architecture. These dimensions motivate the traceable database proposal in Section 4.1.
3.2. Driving Style and Road Safety
This section synthesizes safety evidence from the 80 included studies, separating recurrent driving styles from transient states and distinguishing direct outcomes from surrogate indicators.
3.2.1. Extracted Safety-Outcome Taxonomy
The extracted safety endpoints form an objective result taxonomy. Direct outcomes include crashes and collisions, whereas more frequent surrogate indicators include TTC, traffic conflicts, harsh events, violations, and composite risk scores. Transient states such as distraction or fatigue were coded as potential risk mediators, not as style categories [32,42,43,44,45]. The following groups summarize the endpoints found across the studies:
- Involvement in accidents or collisions (when available from records, insurance claims, or real-world datasets).
- Traffic conflicts and proxy safety measures (e.g., TTC, safety margins related to the time and space a driver has in front of the vehicle).
- Harsh events (sudden braking, sudden acceleration) and speed-related indicators.
- Lane-changing behavior and interaction markers (intersections, short intervals, rapid lane changes).
- Driver state and safety-related contextual factors (distraction, fatigue/drowsiness).
At study level, 59/80 studies (73.8%) reported an accident/collision endpoint, 17/80 (21.3%) reported a risk or hazard score, 11/80 (13.8%) made only a nonspecific road-safety claim, four (5.0%) reported speeding or excessive speed, and one study each (1.3%) explicitly reported TTC, traffic conflicts, or sudden braking/acceleration in the extraction table. Categories overlap. These percentages replace repeated-term counts and represent the prevalence of coded study-level endpoints.
3.2.2. Styles Associated with Increased Risk
Across the reviewed literature, aggressive driving is consistently associated with increased safety risk, although the strength of this relationship varies depending on the dataset, road context, labeling strategy, and safety indicator used. Aggressive driving is typically characterized by greater speed variability, frequent and intense acceleration and braking, shorter following distances, and riskier lane-changing or passing behavior. These patterns can reduce available reaction time and increase the likelihood of traffic conflicts, particularly in dense traffic and at intersections [46,47,48].
Alcohol impairment, distraction, fatigue, and emotion can elevate risk, but they are transient driver states rather than recurrent styles. They may produce observable consequences—delayed responses, inconsistent lane keeping, or impaired distance judgment—and are therefore relevant to safety monitoring [43,44,45,49]. In the included set, 35 studies analyzed at least one transient state, 45 analyzed recurrent style, and nine addressed both; results from one construct should not be generalized to the other without longitudinal evidence.
3.2.3. Interpretation Challenges and Implications for Prevention
Several methodological issues complicate the interpretation of the impact on safety. First, many safety parameters are indirect indicators (proxies) rather than direct outcomes of accidents, and indirect indicators can be sensitive to the selection of scenarios and the choice of thresholds. Second, labels can be noisy or circular (for example, defining “aggressive” partly through severe events and then correlating severe events with risk). Third, confounding factors (road geometry, traffic density, weather, time of day, vehicle type, and driver demographics) can influence both driving style estimates and safety outcomes. Finally, evaluation protocols sometimes combine data from the same driver across training and test sets, which can inflate performance and weaken claims of generalizability. These limitations call for careful reporting of study design, driver-independent evaluation, and, where possible, causal or quasi-experimental approaches [50].
Despite heterogeneity, the evidence supports targeting harsh maneuvers, short following distances, unstable speed control, and unsafe interactions. Monitoring and feedback can operationalize these targets, and style-aware prediction can help ADAS anticipate maneuvers [9,24,48]. However, incompatible labels, missing metadata, and heterogeneous proxies prevent direct pooling. These limitations are precisely the information losses addressed by the author-proposed traceability architecture in Section 4.1.
4. Discussion, Proposed Data Architecture, and Future Directions
Despite the rapid growth of driving style analysis, several gaps remain that limit comparability, readiness for implementation, and the relevance of safety conclusions. This section highlights recurring limitations and presents research directions that can improve reproducibility and practical impact. A persistent problem is the absence of standardized, widely accepted benchmarks with consistent driving style taxonomies and safety assessment criteria. Studies often define the terms “aggressive,” “normal,” or “conservative” differently and rely on incompatible thresholds or labeling criteria. This complicates meta-analysis and undermines generalizability across studies. Concerted efforts are needed to publish reference datasets and provide clear definitions of labels, annotation guidelines, and mapping rules between taxonomies [3,8,43,47].
Many evaluations are based on restricted samples, short data collection periods, or controlled contexts. Real-world implementation requires coverage of diverse drivers, vehicles, road types, traffic conditions, and weather conditions, as well as longitudinal observations to capture behavioral adaptation. Broader access to naturalistic and fleet-scale data, combined with transparent reporting of contextual variables, would improve external validity [50].
Although many studies discuss real-time monitoring, few offer fully validated systems that account for latency, feedback stability, driver acceptance, and behavioral change over time. Real-time models must also handle rare critical events and avoid harmful false reassurances. Future studies should report on implementation constraints, conduct field tests, and evaluate how feedback affects both safety and secondary outcomes, such as fuel/energy consumption [20,24,45].
4.1. Proposed Reproducible Database Architecture Derived from the Review
The review repeatedly identified the same sources of non-comparability: inconsistent labels, variable sensor metadata, unclear segmentation, heterogeneous validation units, and safety endpoints that cannot be traced to the behavior or signal window that generated them. The following architecture is proposed by the authors as a conceptual recommendation derived from those recurring extraction fields. It is not a database architecture reviewed in prior publications and has not yet been validated as a reference standard.
4.1.1. Derivation and Design Principles
The minimal structure uses Driver, Trip, Driving Event, and Safety Event because these represent the stable participant, exposure/context unit, behavioral observation unit, and safety-outcome unit found across the reviewed evidence. Supporting tables for Sensor Stream, Feature Schema, Model Run, and Label Definition preserve provenance without forcing modality-specific data into the four core entities. Alternative normalized or event-stream designs remain possible; the selected structure prioritizes auditability and cross-study mapping over high-throughput optimization.
The proposed database architecture is guided by five design principles intended to support reproducible, privacy-aware, and safety-oriented analysis of driving behavior. First, the database should ensure traceability by preserving the links between raw or lightly processed measurements, extracted features, model outputs, and final driving style or safety labels. This makes it possible to audit how a given classification or risk estimate was obtained. Second, the structure should support multi-level analysis, allowing results to be examined at the level of individual driving events, complete trips, and drivers while maintaining the relationships between these levels. Third, the framework should allow mode-agnostic data ingestion, meaning that different sensing channels, such as smartphone sensors, CAN/OBD data, telematics units, and vision-derived signals, can be represented in a common structure while preserving device-specific metadata. Fourth, the database should maintain safety alignment by linking behavioral events to direct safety outcomes, when available, and to surrogate safety indicators such as near-misses, conflicts, harsh maneuvers, time-to-collision values, or composite risk scores. Finally, privacy should be incorporated by design through pseudonymized identifiers, data minimization, controlled access, and the retention of only the information required for analysis, validation, and audit.
The core cardinalities are Driver 1:N Trip, Trip 1:N Driving Event, and Trip 1:N Safety Event. A Safety Event may reference zero or one preceding Driving Event, while a Driving Event may be associated with zero to many Safety Events. This optional event link avoids claiming causality while preserving temporal association. The architecture improves comparability by requiring the same provenance fields—sensor, unit, sampling rate, window, feature schema, model version, label source, endpoint definition, and context—even when studies use different modalities or taxonomies.
4.1.2. Core Entities and Relational Structure
To operationalize the design principles described above, the proposed database is organized around four core entities: Driver, Trip, Driving Event, and Safety Event. These entities separate stable participant information, trip-level context, behavior-related events, and safety-related outcomes, while preserving explicit links between them. This structure supports longitudinal analysis, driver-independent validation, comparison across studies, and traceability from sensor data to model outputs and safety indicators.
The Driver entity stores stable, pseudonymized driver-level metadata required for stratified analysis and longitudinal monitoring. The use of a pseudonymized driver_id allows multiple trips and events to be linked to the same participant without exposing direct identity. Optional fields such as license category, years of driving experience, age group, gender, and fleet affiliation may be included only when they are relevant to the study objectives and ethically justified. Consent version and consent timestamp should also be retained to ensure auditability and compliance with data governance requirements. Driver-level metadata is particularly important because driving experience, demographic characteristics, and fleet context may influence driving style and safety outcomes [6,21,22,23,51,52]. Table 2 summarize the proposed fields for the Driver entity.
Table 2.
Proposed fields for the Driver table in the reproducible driving behavior database.
The Trip entity stores information about each continuous driving episode. It links a pseudonymized driver to a specific driving context, including time, duration, vehicle, road environment, weather, lighting conditions, and aggregate trip-level indicators. This level is useful for summarizing exposure, comparing driving conditions, and preventing data leakage when model evaluation requires separation by driver or trip. Trip-level records also provide the contextual layer needed to interpret detected maneuvers and safety events [1,4,16,22,23]. Table 3 summarizes the proposed fields for the Trip entity.
Table 3.
Proposed fields for the Trip table in the reproducible driving behavior database.
The Driving Event entity stores detected maneuvers or analysis windows used to characterize driving behavior. Examples include acceleration events, braking events, lane changes, following-distance episodes, cornering events, or fixed-length signal windows. This entity provides the main connection between raw sensor data, extracted features, and driving style labels. Each event should include its temporal boundaries, event type, contextual or geometric information, derived features, assigned style label, model confidence, and label source. This information is essential for comparing rule-based, expert-annotated, self-reported, clustering-based, and machine learning-based labeling approaches [1,2,3,4,16,22,23,25,32,52]. Table 4 summarizes the proposed fields for the Driving Event entity.
Table 4.
Proposed fields for the Driving Event table in the reproducible driving behavior database.
The Safety Event entity records direct safety outcomes and surrogate safety indicators linked to a trip and, where possible, to a preceding driving event (Table 5). It may include crashes, collisions, near-misses, traffic conflicts, violations, speeding episodes, harsh deceleration, time-to-collision values, critical headway, or composite risk scores. This entity is necessary because safety outcomes may be rare, while surrogate indicators can provide more frequent evidence of safety-relevant behavior. Linking Safety Events to Driving Events enables analysis of how specific maneuvers, style labels, or model outputs relate to safety-relevant outcomes [6,22,23,25,51,52]. Table 5 summarizes the proposed fields for the Safety Event entity.
Table 5.
Proposed fields for the Safety Event table in the reproducible driving behavior database.
4.1.3. Operational Specification, Integrity, and Versioning
A minimum relational implementation uses UUID primary keys for driver_id, trip_id, event_id, and safety_event_id; TIMESTAMP WITH TIME ZONE for trip and event times; VARCHAR-backed controlled vocabularies for event_type, style_label, label_source, safety_event_type, unit, and data_source; DECIMAL values for confidence and surrogate measures; SMALLINT for ordinal severity; and JSON only for versioned feature payloads whose schema is identified by feature_schema_id. Foreign keys are NOT NULL except linked_event_id. Integrity checks require end_time > start_time, t_end > t_start, confidence between 0 and 1, nonnegative duration/exposure values, a unit for every numeric surrogate, and containment of event intervals within the parent trip.
Versioning is append-only: raw streams receive an immutable source checksum; feature_schema_version, model_version, label_definition_version, and code_commit identify every derived result; created_at, valid_from, and valid_to preserve history; and corrections create a new version rather than overwriting prior analytical records. Composite indexes on (driver_id, start_time), (trip_id, t_start), and (trip_id, timestamp) support longitudinal and event-sequence queries. Deletion or retention rules cascade only to derived records after governance approval, while audit logs record access and transformation events.
Implementation example: a pseudonymized Driver D01 is linked to Trip T01; a synchronized CAN/IMU window is stored under an immutable stream checksum; Driving Event E01 records a braking interval, feature schema v2.1, model v1.4, label ‘aggressive’, confidence 0.87, and label source ‘model’; Safety Event S01 records a minimum TTC of 1.2 s and optionally links to E01. This chain allows another researcher to reproduce the feature extraction, reinterpret the label under a different taxonomy, or compare the same event against another safety threshold. Validation should proceed through schema mapping on independent datasets, inter-laboratory exchange, query-based reproducibility tests, and comparison with alternative designs; until then, the schema remains a proposed framework with limited external validation.
4.1.4. Privacy, Governance, and Intended Scope
Large-scale analysis of driving behavior raises privacy concerns, particularly regarding location data and video footage. There is also a risk of unfair results if the models encode demographic or contextual biases [20].
Driving behavior data is sensitive, particularly when linked to location history or video footage. The proposed database should implement: (i) pseudonymization (removing identifying information from analysis tables), (ii) location aggregation or device-level aggregation when detailed location data is not required, (iii) strict access controls and audit logs, and (iv) retention policies aligned with informed consent and applicable regulations. For visual data, alternatives that preserve privacy should be considered, such as storing only derived trajectories or bounding box paths rather than raw video clips, whenever possible [10].
Future work should include privacy-preserving data management (pseudonymization, aggregation, and on-device minimization), transparent governance, and fairness assessment, particularly for applications affecting individuals, insurance, employment, and law enforcement [44].
Figure 2 consolidates the conceptual pathway through which observable driving behavior can be interpreted in terms of road-safety relevance. Starting from measurable actions such as acceleration, braking, lane keeping, speed adaptation, and interaction with surrounding traffic, the figure shows how raw behavioral traces are transformed into indicators of driving style and then connected to safety mechanisms. This representation is useful because it links detection-oriented variables with practical outcomes, including risk exposure, conflict generation, crash avoidance, and the possibility of adaptive feedback. In this way, the figure clarifies that driving style analysis should not remain limited to classification labels, but should support interventions that improve driver awareness, vehicle assistance functions, and evidence-based traffic safety strategies.
Figure 2.
From observable driving behavior to safety mechanisms, outcomes, and adaptive responses.
Figure 3 presents the proposed reproducible database structure as a relational framework that connects drivers, trips, behavioral events, and safety outcomes. The driver level stores stable pseudonymized information, while the trip level captures contextual and temporal conditions under which behavior is observed. Driving events provide the operational layer where maneuvers, signal windows, extracted features, and style labels can be recorded, whereas safety events document outcomes or proxy indicators such as conflicts, harsh maneuvers, warnings, or incidents. By separating these entities while preserving explicit links between them, the database can support longitudinal analysis, comparison across studies, transparent model evaluation, and future integration of multimodal data sources without compromising reproducibility or privacy requirements.
Figure 3.
Reproducible driving behavior database linking drivers, trips, behavioral events, and safety outcomes. Solid arrows denote the one-to-many Driver–Trip, Trip–Driving Event, and Trip–Safety Event relationships. The dotted arrow denotes the optional association between a Driving Event and a Safety Event through linked_event_id; it indicates temporal association, not causation. PK: primary key; FK: foreign key.
4.2. Existing ADAS Directions and Future Integration
Driving style research is already active in ADAS and connected vehicles rather than being an entirely unaddressed gap. Martinez et al. reviewed style recognition for intelligent control and driver assistance [12], and Mei et al. synthesized classification methods for connected-vehicle control [11]. Existing directions include personalized assistance thresholds using SVM-based style estimates [9]; proactive cut-in, lane-change, intersection, and collision-risk prediction that combines style with surrounding-vehicle interaction [33,46,49,53,54]; multimodal real-time monitoring and risk assessment [31,39,55]; and personalized explainable recommendations [36]. Future work should therefore emphasize external validation, calibration, safe control transitions, driver acceptance, privacy, and demonstrated safety benefit rather than simply proposing additional classifiers. Broader applications of artificial intelligence and fuzzy logic to road-safety systems are discussed by Ango et al. [7].
4.3. Future Research Priorities for Evidence Consolidation and Deployment
Taken as a whole, the gaps identified across the included studies relate to three levels: standardization of definitions and datasets, validation under real-world conditions, and responsible integration into technical systems with feedback or partial autonomy. These three levels must be addressed together for driving style analysis to yield verifiable practical benefits.
Future research should prioritize the development of standardized datasets and taxonomies with clearly documented label definitions, including:
- the collection of more extensive, diverse, and longitudinal real-world data;
- the implementation of rigorous generalization assessments across driver-, vehicle-, and domain-level contexts;
- the validation of real-time, human-in-the-loop interventions through field studies; and
- the integration of these approaches with ADAS and connected/autonomous driving systems, supported by governance frameworks that prioritize privacy, transparency, and fairness.
5. Conclusions
This systematic review synthesized 80 studies on recurrent driving style and road-safety relevance, while separately coding transient driver-state evidence. Driving style was most often represented by patterns in speed selection, longitudinal control, and lateral behavior and mapped to categories such as aggressive, normal, cautious/defensive, or continuous risk/comfort indices [3,32].
From a methodological perspective, the field is largely converging toward data-driven research that combines preprocessing and segmentation with either designed behavioral indicators or representation learning, followed by supervised classification/regression or unsupervised pattern discovery. Data sources include smartphones (IMU and GNSS), in-vehicle networks (CAN/OBD), telematics devices, and camera-based detection. Each modality introduces distinct trade-offs between cost, coverage, fidelity, privacy, and implementation feasibility [51].
The review on road safety suggests that aggressive and erratic driving patterns are consistently associated with increased risk due to reduced safety margins, more aggressive maneuvers, and more frequent conflicts. However, strong safety claims remain constrained by the heterogeneity of labels and evaluation criteria and the frequent use of surrogate safety measures rather than direct crash outcomes. Consequently, the interpretation of performance and safety impact must account for the detection channel, label construction, evaluation protocol (particularly driver-independent testing), and contextual variables [46,50,52].
To improve reproducibility, Section 4.1 proposes a conceptual Driver–Trip–Driving Event–Safety Event architecture with explicit data types, cardinalities, constraints, provenance, and versioning. The framework is derived from recurring extraction fields and is intended to make sensors, features, labels, model versions, and safety endpoints traceable. It is not yet a validated standard; independent dataset mappings and inter-laboratory reproducibility tests are required before such a claim can be made.
Compared with existing reviews, the contribution is twofold. First, it separates recurrent style from transient state and connects sensing, labels, model families, validation design, and direct or surrogate safety endpoints within one synthesis. Second, it translates the recurrent causes of non-comparability into a testable, privacy-aware data architecture. These additions extend algorithm-centered reviews [11,12] by focusing on the credibility, provenance, and deployability of safety conclusions, while the reported search-log and appraisal limitations define the boundaries of the evidence.
Supplementary Materials
The following supporting information can be downloaded at: https://www.mdpi.com/article/10.3390/electronics15184077/s1, File S1: PRISMA 2020 checklist.
Author Contributions
Conceptualization, T.G. and R.G.B.; methodology, R.G.B.; software, M.D.; validation, M.D. and R.G.B.; formal analysis, T.G.; investigation, T.G.; resources, M.D.; data curation, T.G.; writing—original draft preparation, T.G.; writing—review and editing, R.G.B.; visualization, M.D.; supervision, M.D.; project administration, R.G.B.; funding acquisition, M.D. All authors have read and agreed to the published version of the manuscript.
Funding
This work was supported by a grant of the Ministry of Research, Innovation and Digitization, CNCS-UEFISCDI, project number PN-IV-P2-2.1-TE-2023-1434, within PNCDI IV.
Data Availability Statement
The data presented in this study are available on request from the corresponding author.
Conflicts of Interest
The authors declare no conflicts of interest.
Abbreviations
The following abbreviations are used in this manuscript:
| ADAS | Advanced Driver Assistance Systems |
| AUC | Area Under the Curve |
| CAN | Controller Area Network |
| CRNN | Convolutional Recurrent Neural Network |
| CNN | Convolutional Neural Network |
| DOI | Digital Object Identifier |
| DMS | Driver Monitoring System |
| DISC | Driving Styles In Simulated Crashes |
| ECU | Electronic Control Unit |
| EEG | Electroencephalogram |
| GMM | Gaussian Mixture Models |
| GNSS | Global Navigation Satellite System |
| GPS | Global Positioning System |
| IEEE | Institute of Electrical and Electronics Engineers |
| I-DBSCAN | Incremental Density-Based Spatial Clustering of Applications with Noise |
| IMU | Inertial Measurement Unit |
| IPFS | Interplanetary File System |
| AI | Artificial Intelligence |
| LSTM | Long Short-Term Memory |
| ML | Machine Learning |
| NDS | Naturalistic Driving Study |
| OBD-II | On-Board Diagnostics II |
| POD | Probability of Detection |
| PRISMA | Preferred Reporting Items for Systematic Reviews and Meta-Analyses |
| RNN | Recurrent Neural Network |
| SHRP 2 | Strategic Highway Research Program 2 |
| SVM | Support Vector Machine |
| TTC | Time to Collision |
| V2X | Vehicle-to-Everything |
| XAI | Explainable Artificial Intelligence |
| YOLO | You Only Look Once |
Appendix A
Table A1.
Study-level synthesis of the 80 included publications, including data source, method, construct, safety endpoint, and structured applicability/reporting appraisal.
References
- Pourkhaksar, A.; Golroo, A.; Mesbah, M.; Arbabpour, M.; Amani, M.J.; Honarjoo, M.; Suratgar, A.; Hajikarimi, P. Detection of Driver Maneuvers Using a Modular, Low-Cost Sensor Device. Measurement 2026, 257, 118864. [Google Scholar] [CrossRef] [Scilit]
- Amer, N.E.; El-Mahdy, A.; Khamis, M.; Gomaa, W.; Shoukry, A. On-Edge Driving Maneuvers Detection in Challenging Environments from Smartphone Sensors. In Proceedings of the 2022 10th International Japan-Africa Conference on Electronics, Communications, and Computations (JAC-ECC); IEEE: Piscataway, NJ, USA, 2022; pp. 158–163. [Google Scholar] [CrossRef] [Scilit]
- Aissaoui, M.; Bouchenafa, F.; Annad, O.; Boughaleb, S.E.A. Detecting Aggressive Driving Behaviors on Highways Using 1D Convolutional Neural Networks. In Modeling, Simulation and Computer Technology; Communications in Computer and Information Science; Springer: Cham, Switzerland, 2025; Volume 2606, pp. 249–260. [Google Scholar] [CrossRef] [Scilit]
- Carlos, M.R.; González, L.C.; Wahlström, J.; Ramírez, G.; Martínez, F.; Runger, G. How Smartphone Accelerometers Reveal Aggressive Driving Behavior?—The Key Is the Representation. IEEE Trans. Intell. Transp. Syst. 2020, 21, 3377–3387. [Google Scholar] [CrossRef] [Scilit]
- Bose, B.; Dutta, J.; Ghosh, S.; Pramanick, P.; Roy, S. D&RSense: Detection of Driving Patterns and Road Anomalies. In Proceedings of the 2018 3rd International Conference On Internet of Things: Smart Innovation and Usages (IoT-SIU); IEEE: Piscataway, NJ, USA, 2018; pp. 1–7. [Google Scholar] [CrossRef] [Scilit]
- Ferreira, L.; Valente, A.; Salgado, P.; Boaventura, J. Advances on Risky Driver Behaviour Detection in Road Vehicles: A Systematic Literature Review. Artif. Intell. Rev. 2026, 59, 93. [Google Scholar] [CrossRef] [Scilit]
- Ango, R.; Mohana, R.M.; Thakur, M.S.; Chinthala, K.K.R. Enhancing Road Safety through Artificial Intelligence and Fuzzy Logic-Based Intelligent Systems. In Artificial Intelligence and Fuzzy Logic for Next-Generation Intelligent Transportation Systems; CRC Press: Boca Raton, FL, USA, 2026; pp. 186–209. [Google Scholar] [CrossRef] [Scilit]
- Arumugam, S.; Bhargavi, R. Road Rage and Aggressive Driving Behaviour Detection in Usage-Based Insurance Using Machine Learning. Int. J. Softw. Innov. 2023, 11, 1–29. [Google Scholar] [CrossRef] [Scilit]
- Hwang, G.; Jung, D.; Goh, Y.; Chung, J.-M. Personal Driving Style-Based ADAS Customization in Diverse Traffic Environments Using SVM for Public Driving Safety. In Proceedings of the 2022 13th International Conference on Information and Communication Technology Convergence (ICTC); IEEE: Piscataway, NJ, USA, 2022; pp. 1938–1940. [Google Scholar] [CrossRef] [Scilit]
- Rizzo, N.; Sprissler, E.; Hong, Y.; Goel, S. Privacy Preserving Driving Style Recognition. In Proceedings of the 2015 International Conference on Connected Vehicles and Expo (ICCVE); IEEE: Piscataway, NJ, USA, 2015; pp. 232–237. [Google Scholar] [CrossRef] [Scilit]
- Mei, P.; Karimi, H.R.; Ou, L.; Xie, H.; Zhan, C.; Li, G.; Yang, S. Driving Style Classification and Recognition Methods for Connected Vehicle Control in Intelligent Transportation Systems: A Review. ISA Trans. 2025, 158, 167–183. [Google Scholar] [CrossRef] [Scilit] [PubMed]
- Martinez, C.M.; Heucke, M.; Wang, F.Y.; Gao, B.; Cao, D. Driving Style Recognition for Intelligent Vehicle Control and Advanced Driver Assistance: A Survey. IEEE Trans. Intell. Transp. Syst. 2018, 19, 666–676. [Google Scholar] [CrossRef] [Scilit]
- Page, M.J.; McKenzie, J.E.; Bossuyt, P.M.; Boutron, I.; Hoffmann, T.C.; Mulrow, C.D.; Shamseer, L.; Tetzlaff, J.M.; Akl, E.A.; Brennan, S.E.; et al. The PRISMA 2020 Statement: An Updated Guideline for Reporting Systematic Reviews. BMJ 2021, 372, n71. [Google Scholar] [CrossRef] [Scilit] [PubMed]
- Kiran, J.S.; Sunitha, G.; Sireesha, M.; Mahender, U.; Madhavi, K.R.; Rudra, S.; Kumar, V.N. CRNN-Based Eye Behavior Analysis for Drowsiness Detection. In Proceedings of Fifth International Conference on Computer and Communication Technologies; Lecture Notes in Networks and Systems; Springer: Singapore, 2024; pp. 391–399. [Google Scholar] [CrossRef] [Scilit]
- Kothuri, S.R.; Sujay, V.; Sreedhar, S.S.; Juyal, P.; Prasad, M.J.; Bhuvaneshwari, R. Hybrid CNN-LSTM Machine Learning Algorithm for Driver Distraction Detection. In Proceedings of the 2024 International Conference on Integrated Circuits and Communication Systems (ICICACS); IEEE: Piscataway, NJ, USA, 2024; pp. 1–5. [Google Scholar] [CrossRef] [Scilit]
- Khanfar, N.O.; Elhenawy, M.; Ashqar, H.I.; Hussain, Q.; Alhajyaseen, W.K.M. Driving Behavior Classification at Signalized Intersections Using Vehicle Kinematics: Application of Unsupervised Machine Learning. Int. J. Inj. Control Saf. Promot. 2023, 30, 34–44. [Google Scholar] [CrossRef] [Scilit] [PubMed]
- Chen, H.; Hegde, S.; Bonfitto, A. Aggressive Driving Behavior Detection Using Integrated I-DBSCAN and LSTM Neural Network. In Proceedings of the ASME 2024 International Design Engineering Technical Conferences and Computers and Information in Engineering Conference; Volume 1: 26th International Conference on Advanced Vehicle Technologies (AVT); ASME: New York, NY, USA, 2024; Paper V001T01A020. [Google Scholar] [CrossRef] [Scilit]
- Oxendine, A.; Alamleh, H.; Pulatov, D. Dude, Who’s Driving My Car? Detecting Familiar and Unfamiliar Drivers Using CAN Bus Data. In Proceedings of the 2025 10th International Conference on Smart and Sustainable Technologies (SpliTech); IEEE: Piscataway, NJ, USA, 2025; pp. 1–6. [Google Scholar] [CrossRef] [Scilit]
- Qibtiah, R.M.; Hashim, A.H.M.; Hafila, K.Z.; Sharif, N.A.; Rizal, F. Intelligent Automation of Driver Behavior Analysis Using Machine Learning: CAN Bus Signals. In Proceedings of the 2025 IEEE 6th International Conference in Robotics and Manufacturing Automation (ROMA); IEEE: Piscataway, NJ, USA, 2025; pp. 12–17. [Google Scholar] [CrossRef] [Scilit]
- Ameksa, M.; Elassad, Z.E.A.; Mousannif, H. An Efficient Driver Monitoring: Road Crash and Driver Behavior Analysis. In Artificial Intelligence, Data Science and Applications; Lecture Notes in Networks and Systems; Springer: Cham, Switzerland, 2024; pp. 587–593. [Google Scholar] [CrossRef] [Scilit]
- Afridi, A.S.; Kafy, A.; Moon, M.N.N.; Shakil, M.S. A Multi-Class Driver Behavior Dataset for Real-Time Detection and Road Safety Enhancement. Data Brief 2025, 60, 111529. [Google Scholar] [CrossRef] [Scilit] [PubMed]
- National Academies of Sciences, Engineering, and Medicine. Naturalistic Driving Study: Field Data Collection; The National Academies Press: Washington, DC, USA, 2014. [Google Scholar] [CrossRef] [Scilit] [PubMed]
- National Academies of Sciences, Engineering, and Medicine. Naturalistic Driving Study: Linking the Study Data to the Roadway Information Database; The National Academies Press: Washington, DC, USA, 2015. [Google Scholar] [CrossRef] [Scilit] [PubMed]
- Koti, S.L.; Koti, A.; Khare, P.; Khare, A. SmartYatra: A Dynamic Driver Profiling and Vehicle Condition Monitoring Safety Shield for Accident Prevention. Urban Plan. Transp. Res. 2025, 13, 2602326. [Google Scholar] [CrossRef] [Scilit]
- Kenkar, Z.; AlHalawani, S. Event-Based Driving Style Analysis. In Advances in Data Science, Cyber Security and IT Applications; Communications in Computer and Information Science; Springer: Cham, Switzerland, 2019; pp. 170–182. [Google Scholar] [CrossRef] [Scilit]
- Sreekumar, S.; Pawar, P.M.; Muthalagu, R.; Panthakkan, A.; Amin, S.A. A Driver Rating System Based on Driving Pattern. In Proceedings of the 2024 7th International Conference on Signal Processing and Information Security (ICSPIS); IEEE: Piscataway, NJ, USA, 2024; pp. 1–6. [Google Scholar] [CrossRef] [Scilit]
- Al-Gburi, S.H.; Al-Sammak, K.A.; Almosa, N.A.A.; Suciu, G.; Alsammak, N.A.H. Comparative Analysis of Logistic Regression and SVM Models for Drowsiness Detection in Drivers. In Intelligent and Fuzzy Systems; Lecture Notes in Networks and Systems; Springer: Cham, Switzerland, 2025; pp. 227–234. [Google Scholar] [CrossRef] [Scilit]
- Khalid, N.W.; Abdullah, W.D. Enhancing Road Safety with Smartphone-Based Machine Learning Driver Behavior Classification and Aggressive Driving Detection Using Feature Reduction Methods. In Innovative Computing and Communications; Lecture Notes in Networks and Systems; Springer: Singapore, 2024; pp. 111–139. [Google Scholar] [CrossRef] [Scilit]
- Thongsri, S.; Bunchen, K.; Poochaya, S. Enhancing Thailand Road Safety through Personal Driving Style Classification Using Machine Learning Model. In Proceedings of the 2024 International Conference on Power, Energy and Innovations (ICPEI); IEEE: Piscataway, NJ, USA, 2024; pp. 29–33. [Google Scholar] [CrossRef] [Scilit]
- Cınar, I. Deep Learning and LSTM Integration for Analyzing Driver Behaviors. Turk. J. Math. Comput. Sci. 2025, 17, 191–211. [Google Scholar] [CrossRef] [Scilit]
- Han, L.; Abdel-Aty, M.; Yu, R.; Wang, C. LSTM + Transformer Real-Time Crash Risk Evaluation Using Traffic Flow and Risky Driving Behavior Data. IEEE Trans. Intell. Transp. Syst. 2024, 25, 18383–18395. [Google Scholar] [CrossRef] [Scilit]
- Dixit, A.; Jain, M. Trajectory Data Driven Driving Style Recognition for Autonomous Vehicles Using Unsupervised Clustering. Commun. Appl. Nonlinear Anal. 2024, 31, 715–723. [Google Scholar] [CrossRef] [Scilit]
- Kushwaha, A.K.; Kumar, H.; Arora, H.; Kumar, B.A. A deep embedded clustering method for location-specific driving safety profiling using trajectory data. Sci. Rep. 2025, 15, 41635. [Google Scholar] [CrossRef] [Scilit] [PubMed]
- Zhu, Y.; Jiang, M.; Yamamoto, T.; Ding, N.; Shinkai, H.; Aoki, H.; Shimazaki, K. A Framework for Combining Lateral and Longitudinal Acceleration to Assess Driving Styles Using Unsupervised Approach. IEEE Trans. Intell. Transp. Syst. 2024, 25, 638–656. [Google Scholar] [CrossRef] [Scilit]
- Feng, Z.; Wei, X.; Bi, Y.; Zhu, D.; Huang, Z. An integrated framework for driving risk evaluation that combines lane-changing detection and an attention-based prediction model. Traffic Inj. Prev. 2025, 26, 198–206. [Google Scholar] [CrossRef] [Scilit] [PubMed]
- Sellal, F.A.; Bellachia, A.A.; Dif, M.M.; De Rautlin De La Roy, E.; Bouchiha, M.A.; Ghamri-Doudane, Y. XAI-Driven Machine Learning System for Driving Style Recognition and Personalized Recommendations. In Proceedings of the 2025 IEEE 102nd Vehicular Technology Conference (VTC2025-Fall); IEEE: Piscataway, NJ, USA, 2025; pp. 1–7. [Google Scholar] [CrossRef] [Scilit]
- Islam, M.R.; Ahmed, M.U.; Begum, S. Interpretable Machine Learning for Modelling and Explaining Car Drivers’ Behaviour: An Exploratory Analysis on Heterogeneous Data. In Proceedings of the 15th International Conference on Agents and Artificial Intelligence; SCITEPRESS: Setúbal, Portugal, 2023; pp. 392–404. [Google Scholar] [CrossRef] [Scilit]
- Kanagamalliga, S.; Nath, S.S.; Nivetha, T.; Shalini, M.B. Enhancing Heavy Vehicle Safety with Intelligent Driver Behaviour Monitoring via Multi-Sensor Fusion and Embedded Systems. In Proceedings of the 2024 International Conference on System, Computation, Automation and Networking (ICSCAN); IEEE: Piscataway, NJ, USA, 2024; pp. 1–5. [Google Scholar] [CrossRef] [Scilit]
- Vyas, D.A.; Chaturvedi, M.; Kumar, N.; Kamath, K.; Gupta, P.; Dwivedi, A. Experimental Study on Designing Advanced Driver Assistance System for Two-Wheelers Using Mobility and Physiological Sensors. In Proceedings of the 2024 IEEE International Conference on Vehicular Electronics and Safety (ICVES); IEEE: Piscataway, NJ, USA, 2024; pp. 1–6. [Google Scholar] [CrossRef] [Scilit]
- Wang, L.; Song, F.; Zhou, T.H.; Hao, J.; Ryu, K.H. EEG and ECG-Based Multi-Sensor Fusion Computing for Real-Time Fatigue Driving Recognition Based on Feedback Mechanism. Sensors 2023, 23, 8386. [Google Scholar] [CrossRef] [Scilit] [PubMed]
- Debbarma, T.; Pal, T.; Debbarma, N. Detecting Inattentive and Aggressive Driver Behavior Using Deep Learning: Recent Advances, Challenges with Performance Evaluation. In Intelligent System and Data Analysis; Smart Innovation, Systems and Technologies; Springer: Singapore, 2025; Volume 398, pp. 125–136. [Google Scholar] [CrossRef] [Scilit]
- Uddin, M.A.; Hossain, N.; Ahamed, A.; Islam, M.M.; Khraisat, A.; Alazab, A.; Ahamed, M.K.U.; Talukder, M.A. Abnormal Driving Behavior Detection: A Machine and Deep Learning Based Hybrid Model. Int. J. Intell. Transp. Syst. Res. 2025, 23, 568–591. [Google Scholar] [CrossRef] [Scilit]
- AbouOuf, A.; Sobh, I.; Nasser, M.; Alsaqa, O.; Elezaby, O.; Zaki, J.F.W. Multimodel System for Driver Distraction Detection and Elimination. IEEE Access 2022, 10, 72458–72469. [Google Scholar] [CrossRef] [Scilit]
- Chitteti, C.; Sravika, M.; Ayesha, S.; Naik, D.S.; Kumar, V.A.; Kumar, M.P. Real-Time Driver Drowsiness Detection Using Mobile Net for Road Safety Enhancement. In Proceedings of the 2025 3rd International Conference on Disruptive Technologies (ICDT); IEEE: Piscataway, NJ, USA, 2025; pp. 692–697. [Google Scholar] [CrossRef] [Scilit]
- Ajay, A.; Ashok, N.K.; Balajiram, G.; Tamizhselvan, A.; Thangavel, S.K.; Somasundaram, K. Deep Learning Based Driver Drowsiness Detection in Real Time Environment—An Enhanced Approach. In Proceedings of the 2025 4th International Conference on Sentiment Analysis and Deep Learning (ICSADL); IEEE: Piscataway, NJ, USA, 2025; pp. 1068–1075. [Google Scholar] [CrossRef] [Scilit]
- Xu, D.; Lyu, N.; Yang, L. A Proactive Risk Prediction Framework for Cut-In Maneuvers Incorporating Inherent Driving Styles. IEEE Trans. Intell. Transp. Syst. 2025, 26, 23084–23099. [Google Scholar] [CrossRef] [Scilit]
- Dixit, S.; Goel, S.; Jaiswal, S.; Goyal, P.K. Driver Behaviour Analysis to Improve Road Safety: A Comprehensive Study. In Proceedings of the 2024 International Conference on Computing, Sciences and Communications (ICCSC); IEEE: Piscataway, NJ, USA, 2024; pp. 1–5. [Google Scholar] [CrossRef] [Scilit]
- Masmoudi, M.; Shakrouf, Y.; Omar, O.H.; Shikhli, A.; Abdalla, F.; Alketbi, W.; Alsyouf, I.; Cheaitou, A.; Jarndal, A.; Siam, A.I. Driver Risk Classification for Transportation Safety: A Machine Learning Approach Using Psychological, Physiological, and Demographic Factors with Driving Simulator. Eng. Appl. Artif. Intell. 2025, 162, 112585. [Google Scholar] [CrossRef] [Scilit]
- Huang, J.; Huang, X. An integrated active–passive safety strategy for automobiles based on driver state recognition and injury risk prediction. Accid. Anal. Prev. 2025, 223, 108271. [Google Scholar] [CrossRef] [Scilit] [PubMed]
- Zhu, Y.; Jiang, M.; Yamamoto, T. Does a Cautious Driving Style Reduce the Crash Risk of Older Drivers? An Analysis Using a Novel Driving Style Recognition Method. Transp. Res. Part F Traffic Psychol. Behav. 2024, 104, 72–87. [Google Scholar] [CrossRef] [Scilit]
- Dentamaro, V.; Di Maggio, L.; Galantucci, S.; Impedovo, D.; Pirlo, G. Safety in Smart Cities—Automatic Recognition of Dangerous Driving Styles. Information 2026, 17, 44. [Google Scholar] [CrossRef] [Scilit]
- Chen, K.-T.; Chen, H.-Y.W. Modeling the Impact of Driving Styles on Crash Severity Level Using SHRP 2 Naturalistic Driving Data. Safety 2022, 8, 74. [Google Scholar] [CrossRef] [Scilit]
- Yan, Y.; Zhou, X.; Tang, Z.; Zhou, M.; Wang, Y.; Wang, W.; Zhang, X. Proactive risk prediction in on-ramp merging with driving style recognition and multi-vehicle interaction analysis. J. Transp. Saf. Secur. 2025. [Google Scholar] [CrossRef] [Scilit]
- Zhang, Y.; Chen, Y.; Gu, X.; Sze, N.N.; Huang, J. A proactive crash risk prediction framework for lane-changing behavior incorporating individual driving styles. Accid. Anal. Prev. 2023, 188, 107072. [Google Scholar] [CrossRef] [Scilit] [PubMed]
- Bouhsissin, S.; Sael, N.; Benabbou, F.; Soultana, A.; Jannani, A. SafeSmartDrive: Real-Time Traffic Environment Detection and Driver Behavior Monitoring With Machine and Deep Learning. IEEE Access 2024, 12, 169499–169517. [Google Scholar] [CrossRef] [Scilit]
- Deng, B.; Zhou, Y.; Li, D.; Liang, W.; Zhao, Y.; Gao, H.; Zhang, L. Design of Driver DMS Algorithm Based on Human Posture Prediction. Proc. SPIE 2025, 13780, 137800N. [Google Scholar] [CrossRef] [Scilit]
- Zhou, T.; Zhang, X.; Chen, H. A Dangerous Driving Behavior Detection Method Based on Improved YOLOv8s. Eng. Lett. 2025, 33, 721–731. Available online: https://www.engineeringletters.com/issues_v33/issue_3/EL_33_3_19.pdf (accessed on 5 September 2026).
- Pan, Y.; Zhu, D.; Ding, W.; Song, N.; Zhang, W. A high-resolution trajectory data driven approach for vehicle conflict risk prediction considering driving style. Proc. Inst. Mech. Eng. Part D J. Automob. Eng. 2025, 09544070251390448. [Google Scholar] [CrossRef] [Scilit]
- Rani, S.; Raj, U. A machine learning framework for real-time turn detection for enhancing driving safety using smartphone sensors. Eng. Res. Express 2025, 7, 045236. [Google Scholar] [CrossRef] [Scilit]
- Ritu; Vijarania, M.; Malik, M.; Yadav, P. A Review to Enhance Driving Behavior Through Advanced Drowsiness Detection Systems: Integrating Deep Learning and Machine Learning Techniques. In Computation of Artificial Intelligence and Machine Learning; Communications in Computer and Information Science, vol 2184; Springer: Cham, Switzerland, 2025; pp. 302–311. [Google Scholar] [CrossRef] [Scilit]
- Liu, Z.-F.; Wei, D. Abnormal Driver Behavior Recognition and Quantification Based on Mix-up Hybrid Contrastive Learning. China J. Highw. Transp. 2025, 38, 113–124. [Google Scholar] [CrossRef]
- Nell, I.; Gilroy, S. Classification of Driver Behaviour Using External Observation Techniques for Autonomous Vehicles. In Proceedings of the 2025 13th International Conference on Control, Mechatronics and Automation (ICCMA); IEEE: Piscataway, NJ, USA, 2025; pp. 593–599. [Google Scholar] [CrossRef] [Scilit]
- Maji, A.; Shah, A.; Ghosh, I. Development of a Driver Safety Reward System Incorporating You Only Look Once (YOLO)-Based Traffic Violation Detection at Roundabouts under Highly Heterogeneous Traffic. Transp. Res. Rec. 2025, 2679, 774–790. [Google Scholar] [CrossRef] [Scilit]
- Kumar, S.S.S.; Thalapanane, S.; Peethambari, G.N.A.D.; SriHari, S.; Zheng, L.; Lin, M.C. DISC: Dataset for Analyzing Driving Styles in Simulated Crashes for Mixed Autonomy. In Proceedings of the 2025 IEEE International Conference on Robotics and Automation (ICRA); IEEE: Piscataway, NJ, USA, 2025; pp. 8442–8448. [Google Scholar] [CrossRef] [Scilit]
- Lee, M.; Choi, J.; Kim, S.; Yang, J.H. Driver Behavior Analysis in Simulated Jaywalking and Accident Prediction Using Machine Learning Algorithms. Int. J. Automot. Technol. 2025, 26, 1–12. [Google Scholar] [CrossRef] [Scilit]
- Gamal, R.; Al-Qutt, M.; Khaled, H.; Fayez, M.; Ghoniemy, S. Driver Behavior Classification: A Novel Approach Using Auto-Encoders and Motif Extraction. Stat. Optim. Inf. Comput. 2025, 13, 2000–2010. [Google Scholar] [CrossRef] [Scilit]
- AlAhmadi, S. Drivers’ Distraction Detection Using Machine Learning in Smart Computing Era. In Proceedings of the 2025 International Conference on Intelligent Computing and Virtual & Augmented Reality Simulations (ICVARS); IEEE: Piscataway, NJ, USA, 2025; pp. 36–42. [Google Scholar] [CrossRef] [Scilit]
- Gandhi, R.; Sharma, A.; Mohanta, A. Drowsiness Detection Through Physical Cues Using Machine Learning. In Proceedings of Data Analytics and Management; Lecture Notes in Networks and Systems; Springer: Singapore, 2025; pp. 317–327. [Google Scholar] [CrossRef] [Scilit]
- Maktoubian, J.; Tran, S.N.; Shillabeer, A.; Amin, M.B.; Sambrooks, L. Enhance Statistical Features with Changepoint Detection for Driver Behaviour Analysis. In PRICAI 2024: Trends in Artificial Intelligence; Lecture Notes in Computer Science; Springer: Singapore, 2025; pp. 231–242. [Google Scholar] [CrossRef] [Scilit]
- Visconti, P.; Rausa, G.; Del-Valle-Soto, C.; Velázquez, R.; Cafagna, D.; De Fazio, R. Innovative Driver Monitoring Systems and On-Board-Vehicle Devices in a Smart-Road Scenario Based on the Internet of Vehicle Paradigm: A Literature and Commercial Solutions Overview. Sensors 2025, 25, 562. [Google Scholar] [CrossRef] [Scilit] [PubMed]
- Verma, M.; Sharma, B. Road Accident Analysis Using Machine Learning Algorithm. In Proceedings of International Conference on Communication and Computational Technologies; Lecture Notes in Networks and Systems; Springer: Singapore, 2025; pp. 493–501. [Google Scholar] [CrossRef] [Scilit]
- Bruno, D.; Martins, W.; Berri, R.; Osório, F. Robotic Visual Attention Architecture for ADAS in Critical Embedded Systems for Smart Vehicles. In Proceedings of the 20th International Joint Conference on Computer Vision, Imaging and Computer Graphics Theory and Applications; SCITEPRESS: Setúbal, Portugal, 2025; pp. 871–878. [Google Scholar] [CrossRef] [Scilit]
- Tungaturthi, S.; Gayathri, N.P.; Balaji, D.R.V.; Mohan, V.K. Smart Collision Detection and Mitigation: Harnessing Machine Learning for Safety. In Proceedings of the Third International Conference on Cognitive and Intelligent Computing, Volume 2; Cognitive Science and Technology; Springer: Singapore, 2025; pp. 353–361. [Google Scholar] [CrossRef] [Scilit]
- Balla, M.; Reddy, G.S.; Dharshini, U.; Abhinav, M. Smart Fuel Consumption Prediction and Driver Profiling using Machine Learning and ECU Data Analysis. In Proceedings of the 2025 3rd International Conference on Inventive Computing and Informatics (ICICI); IEEE: Piscataway, NJ, USA, 2025; pp. 577–583. [Google Scholar] [CrossRef] [Scilit]
- Çeven, S.; Albayrak, A.; Bayır, R. Towards Safer and Greener Roads: A Hybrid Eco-safe Driving Assessment Using Fuzzy Logic and Machine Learning Algorithms. Int. J. Fuzzy Syst. 2025. [Google Scholar] [CrossRef] [Scilit]
- Tyagi, K.; Garg, H.; Arya, J.; Pundhir, P. VahakAI Driver Monitoring System. In Proceedings of the 2025 Second International Conference on Networks and Soft Computing (ICNSoC); IEEE: Piscataway, NJ, USA, 2025; pp. 409–414. [Google Scholar] [CrossRef] [Scilit]
- Mase, J.M.; Chapman, P.; Figueredo, G.P. A Review of Intelligent Systems for Driving Risk Assessment. IEEE Trans. Intell. Veh. 2024, 9, 5905–5921. [Google Scholar] [CrossRef] [Scilit]
- Yaqoob, S.; Morabito, G.; Cafiso, S.; Pappalardo, G.; Ullah, A. AI-Driven Driver Behavior Assessment Through Vehicle and Health Monitoring for Safe Driving—A Survey. IEEE Access 2024, 12, 48044–48056. [Google Scholar] [CrossRef] [Scilit]
- Al-Gburi, S.H.; Al-Sammak, K.A.; Marghescu, I.; Oprea, C.C.; Alheeti, K.M.A.; Almosa, N.A.A. Analyzing Different Models for Driver Behavior Detection Using EEG Data. In Proceedings of the 2024 15th International Conference on Communications (COMM); IEEE: Piscataway, NJ, USA, 2024; pp. 1–5. [Google Scholar] [CrossRef] [Scilit]
- Kim, S.-H.; Jung, E.; Shin, H.; Yang, I.-B.; Woo, J. Boosting Weak Learners with Multi-Agent Reinforcement Learning for Enhanced Stacking Models: An Application on Driver Emotion Classification. IEEE Trans. Intell. Transp. Syst. 2024, 25, 20478–20492. [Google Scholar] [CrossRef] [Scilit]
- Mertens, J.S.; Cafiso, S.; Galluccio, L.; Morabito, G.; Pappalardo, G. Cooperative learning by knowledge transfer in vehicular networks for applications with user-environment interactions. In Proceedings of the 2024 7th International Balkan Conference on Communications and Networking (BalkanCom); IEEE: Piscataway, NJ, USA, 2024; pp. 230–235. [Google Scholar] [CrossRef] [Scilit]
- Al-Gburi, S.H.; Al-Sammak, K.A.; Alheeti, K.M.A.; Suciu, G.; Abdulqader, A.G. Driver Behavior Assessment with Different ML Models Using EEG and Physiological Data - A Comparative Study. In Proceedings of the 2024 16th International Conference on Electronics, Computers and Artificial Intelligence (ECAI); IEEE: Piscataway, NJ, USA, 2024; pp. 1–6. [Google Scholar] [CrossRef] [Scilit]
- Pande, A.A.; Wawage, P.S.; Deshpande, Y.D. Driver Behaviour Classification using Neural Networks. In Proceedings of the 2024 4th Asian Conference on Innovation in Technology (ASIANCON); IEEE: Piscataway, NJ, USA, 2024; pp. 1–5. [Google Scholar] [CrossRef] [Scilit]
- Islam, M.S.; Rony, M.A.T.; Safran, M.; Alfarhood, S.; Che, D. Elevating Driver Behavior Understanding With RKnD: A Novel Probabilistic Feature Engineering Approach. IEEE Access 2024, 12, 65780–65798. [Google Scholar] [CrossRef] [Scilit]
- Rajasekaran, R.; M, N.; Solanki, R.; Sanghavi, V.; S, Y. Enhancing Driver Safety: Real-Time Drowsiness Detection through Eye Aspect Ratio and CNN-Based Eye State Analysis. In Proceedings of the 2024 International Conference on Intelligent and Innovative Technologies in Computing, Electrical and Electronics (IITCEE); IEEE: Piscataway, NJ, USA, 2024; pp. 1–7. [Google Scholar] [CrossRef] [Scilit]
- Kumar, S.S.; Vignesh, K.R.N.; Bhuvanesh, V. Enhancing Road Safety: Analyzing Driver Behavior Through AI-Driven Monitoring Techniques. In Proceedings of the 2024 9th International Conference on Communication and Electronics Systems (ICCES); IEEE: Piscataway, NJ, USA, 2024; pp. 1630–1635. [Google Scholar] [CrossRef] [Scilit]
- Al Shafie, R.; Jadaan, K.; El-Badawy, S.; Shwaly, S.; Shahdah, U. Exploring the Utility of Auto-machine Learning in Predicting Traffic Accident Severity in Jordan. Jordan J. Civ. Eng. 2024, 18, 583–595. [Google Scholar] [CrossRef] [Scilit]
- Rastin, Z.; Söffker, D. Multi-Level Feature Extraction and Classification for Lane Changing Behavior Prediction and POD-Based Evaluation. Automation 2024, 5, 310–323. [Google Scholar] [CrossRef] [Scilit]
- Oban, V.; Kaya, M.; Safi, G.; Çimen, I.N.; Çatak, T.; Karadağ, B.; Görmüs, G.; Çandir, A.; Alagöz, F. Profiling Driver Behaviors Using AI-Based Methods and Deep Learning Techniques for Improving Road Safety: A Comparative Study of Algorithms. In Proceedings of the 2024 9th International Conference on Computer Science and Engineering (UBMK); IEEE: Piscataway, NJ, USA, 2024; pp. 955–960. [Google Scholar] [CrossRef] [Scilit]
- Zheng, Y.; Wang, H.; Wang, B.; Yuan, P. Research on Safety Status Recognition Model of Commercial Vehicle Driving Behavior. In Proceedings of the 2024 3rd International Conference on Artificial Intelligence, Human-Computer Interaction and Robotics (AIHCIR); IEEE: Piscataway, NJ, USA, 2024; pp. 73–77. [Google Scholar] [CrossRef] [Scilit]
- Mostafa, R.; Maisha, M.J.; Muhammad, N.; Prity, S.J.; Hossain, M.I. Secure and Transparent Driver Profiling Using Blockchain and IPFS for Smart Cities. In Proceedings of the 2024 2nd International Conference on Information and Communication Technology (ICICT); IEEE: Piscataway, NJ, USA, 2024; pp. 289–293. [Google Scholar] [CrossRef] [Scilit]
- Nandhakumar, C.; A, R.; B, S.; K, V. Survey on Traffic Sign Recognition Using Computer Vision Technologies. In Proceedings of the 2024 5th International Conference on Intelligent Communication Technologies and Virtual Mobile Networks (ICICV); IEEE: Piscataway, NJ, USA, 2024; pp. 240–246. [Google Scholar] [CrossRef] [Scilit]
- Ahmad, K.; Em, P.P.; Ab Aziz, N.A. Utilizing OBD II Time Series Data for Driver Drowsiness Detection: A One-Dimensional CNN Approach. In Proceedings of the 2024 Multimedia University Engineering Conference (MECON); IEEE: Piscataway, NJ, USA, 2024; pp. 1–6. [Google Scholar] [CrossRef] [Scilit]
- Mishra, U.; Rai, S.; Tyagi, S.; Raj, V.; Kanaujia, V.K. Vehicle Colour, Speed and Type Prediction. In Proceedings of the 2024 1st International Conference on Advanced Computing and Emerging Technologies (ACET); IEEE: Piscataway, NJ, USA, 2024; pp. 1–6. [Google Scholar] [CrossRef] [Scilit]
- Sobhana, M.; Rohith, V.K.; Avinash, T.; Malathi, N.; Chowdary Ch, S. AI Enabled Accident Black Spot Alerting Mobile System to Enhance Road Safety Using GMM-SVM. Int. J. Intell. Syst. Appl. Eng. 2023, 11, 734–742. Available online: https://www.ijisae.org/index.php/IJISAE/article/view/3608 (accessed on 5 September 2026).
- Srilakshmi, T.; Reddy, H.; Potluri, Y.; Burra, L.R.; Thota, M.V.; Gundimeda, R. Automated Driver Drowsiness Detection System using Computer Vision and Machine Learning. In Proceedings of the 2023 International Conference on Sustainable Computing and Data Communication Systems (ICSCDS); IEEE: Piscataway, NJ, USA, 2023; pp. 615–621. [Google Scholar] [CrossRef] [Scilit]
- Bouhsissin, S.; Sael, N.; Benabbou, F. Driver Behavior Classification: A Systematic Literature Review. IEEE Access 2023, 11, 14128–14153. [Google Scholar] [CrossRef] [Scilit]
- Li, J.; Lu, C.; Li, P.; Zhang, Z.; Gong, C.; Gong, J. Driver-Specific Risk Recognition in Interactive Driving Scenarios Using Graph Representation. IEEE Trans. Veh. Technol. 2023, 72, 4453–4465. [Google Scholar] [CrossRef] [Scilit]
- Dikbıyık, D.; Alagöz, F. Driving Behavior Classification Using Smartphone Sensor Data. In Proceedings of the 2023 8th International Conference on Computer Science and Engineering (UBMK); IEEE: Piscataway, NJ, USA, 2023; pp. 370–375. [Google Scholar] [CrossRef] [Scilit]
- Oommen, A.B.; George, E.L.; Reji, G.; Sekhar, G.J.; Antony, A. Drowsiness Detection System. In Proceedings of the 2023 9th International Conference on Smart Computing and Communications (ICSCC); IEEE: Piscataway, NJ, USA, 2023; pp. 424–427. [Google Scholar] [CrossRef] [Scilit]
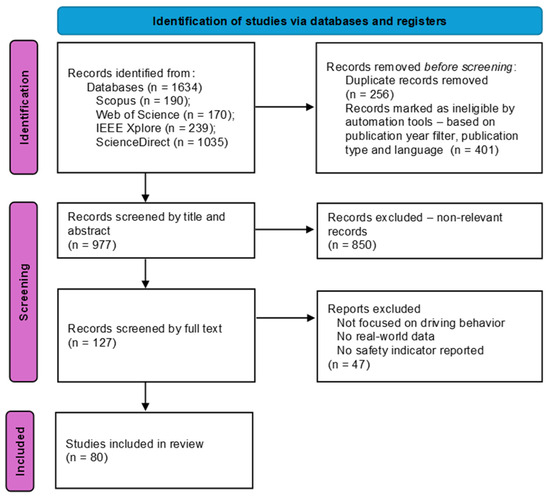
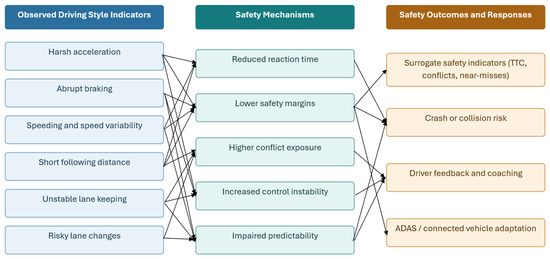
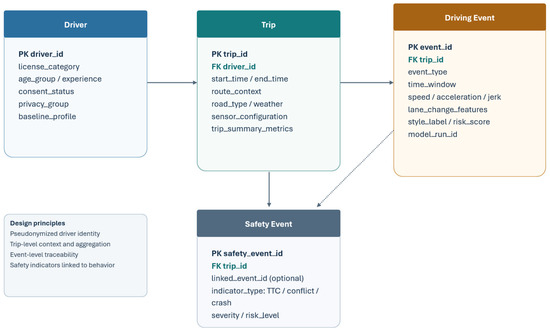
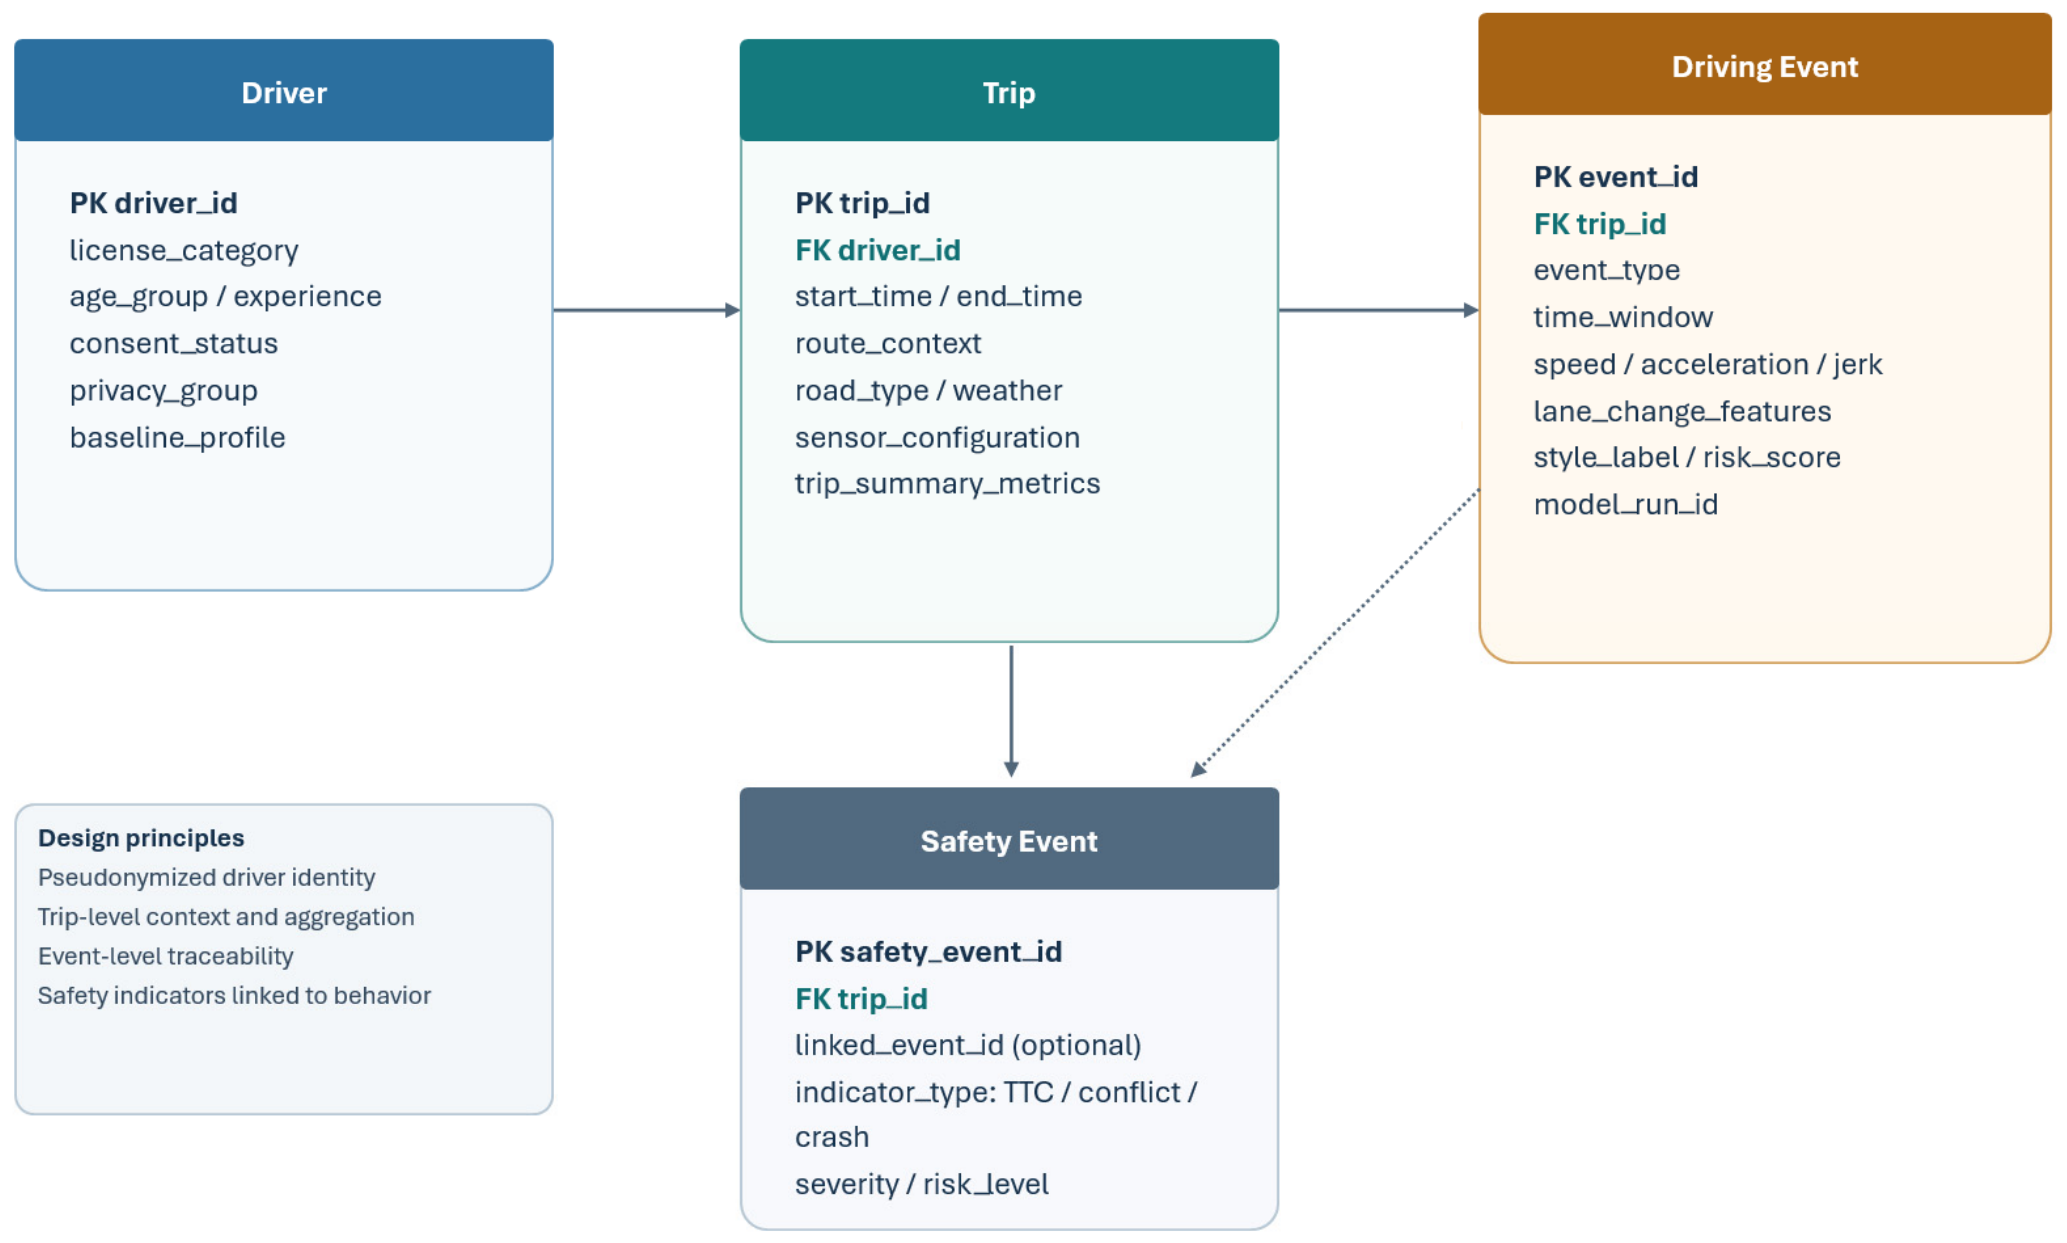

Disclaimer/Publisher’s Note: The statements, opinions and data contained in all publications are solely those of the individual author(s) and contributor(s) and not of MDPI and/or the editor(s). MDPI and/or the editor(s) disclaim responsibility for any injury to people or property resulting from any ideas, methods, instructions or products referred to in the content. |
© 2026 by the authors. Licensee MDPI, Basel, Switzerland. This article is an open access article distributed under the terms and conditions of the Creative Commons Attribution (CC BY) license.