


Abstract
Human kinematic analysis is an increasingly important tool in biomechanics, human performance, and wearable sensing research. Many emerging sensing modalities utilize custom sensors requiring accurate temporal alignment with ground-truth biomechanical movement data. Optical motion capture systems provide high-fidelity kinematic measurements but operate as closed, self-contained systems, making time synchronization with external sensor data non-trivial, particularly in wireless and mobile contexts. This work presents a wireless analog interface system built using commercially available components that enables alignment between analog sensor data (e.g., from custom wearables and Internet-of-Things devices) and a commercial motion capture system. The proposed architecture consists of a wearable data acquisition node and a receiver node interfaced directly with an optical motion capture system, allowing synchronized recording of analog sensor signals alongside kinematic data. Notably, the system reconstructs signals into the commercial hardware interface rather than relying on triggers or sync outputs, resulting in a single data file containing kinematics and sensor readings. Benchtop testing demonstrated a mean end-to-end frame delay of ~6 ms, with 95% of the sample exhibiting delay within 15 ms. Accounting for the typical offset, this leaves a standard deviation of 4 ms, within one motion capture frame of the true timestamp (at 100 Hz). Voltage reconstruction accuracy was within 30 mV across the tested conditions, with gain compression below 2.7%. Adjacent channel crosstalk remained below −83 dB across all test conditions. The use of commercial off-the-shelf components supports replication and adaptation by other research groups and integration with different optical motion capture systems.
1. Introduction
Wearable sensor systems for human kinematic monitoring are increasingly used across a range of applications including sports performance, injury rehabilitation, and clinical movement analysis [1,2,3,4]. As these systems grow in complexity, incorporating inertial measurement units, strain sensors, electromyography, and other modalities, rigorous validation against high-fidelity reference measurements becomes essential for demonstrating the efficacy of the system. Among available reference technologies, optical motion capture is particularly well suited for kinematic validation, providing submillimeter positional accuracy within a defined capture volume. As such, it serves as an established ground truth in standard biomechanics research [5,6].
Although markerless technology is becoming more viable through pose estimation and deep learning [7,8], marker-based optical motion capture (mocap) remains the standard for clinical applications due to its accuracy and reliability [9]. Mocap systems rely on retroreflective markers, which can be easily tracked by a specially equipped camera array. Using this spatially distributed camera array, marker positions can be accurately tracked in a 3D space. By placing these markers on the skin at anatomically relevant locations (e.g., bony locations or joints), body segments can be tracked alongside joint angles derived from adjacent body segments [10]. This system can be utilized for whole-body tracking [6], partial (upper/lower) body tracking [11,12], or discrete localized tracking [13,14]. Mocap has also been used for various applications in both laboratory and field settings, such as ergonomics [15], professional sports [16], and drone control [17].
While mocap provides a prime source for kinematic reference data, integrating external commercial and prototype sensors with optical motion capture platforms presents significant practical challenges [18]. Chief among these challenges is temporal synchronization of all the sensing streams of interest. Wearable sensor systems, particularly those in early development, often run on separate hardware with standalone timestamp sourcing. These independent timestamp sources are prone to drift and offset, both due to hardware and software variations [19]. Without precise temporal alignment, the correlation between sensor measurements and subject kinematics cannot be reliably established, limiting the validity of any derived metrics.
Common synchronization approaches fall into three categories: post hoc alignment, trigger-based alignment, and software-based alignment. Post hoc alignment uses shared signal features or common events in both data streams to align signals after collection. This is a practical approach when no dedicated synchronization system is available, but it is dependent on identifiable shared features and cannot guarantee precise alignment. This manual process extends the post-processing workflow and increases the likelihood of errors. Trigger-based alignment improves on post hoc alignment by injecting a known synchronization event into both systems simultaneously. Kugler et al. [20] demonstrated trigger synchronization of approximately 2 ms. While this precision is excellent for wearable systems, it requires additional hardware modifications and compatible trigger mechanisms. Software-based alignment methods use application layer protocols or shared clock references to align data from independent devices. Shared clock systems such as those presented by Wang et al. [21], or application layer approaches such as those presented by Li et al. [22], allow for sub-millisecond synchronization. These alignment techniques provide excellent temporal alignment but are limited in application to programmable devices. As such, these are difficult to employ when using commercial systems with proprietary infrastructure. In each of these cases, the wearable sensor and motion capture systems remain independent acquisition pipelines that must be reconciled after collection.
A direct attempt at synchronizing external sensors with mocap is the Vicon Lock LabTM system, among others such as Qualisys’ Camera Sync Unit and OptiTrack’s eSync2 systems. The Lock LabTM provides a large array of analog input channels interfaced directly with the Vicon mocap software, allowing external analog sensing streams to be recorded within the same data stream as marker data. This approach sidesteps the software synchronization problem entirely, keeping all signals within the same acquisition pipeline and forcing temporal alignment between sensor and motion capture data at the hardware level. The Lock LabTM supports up to 64 single-ended analog input channels sampled synchronously with the optical motion capture frame rate, accepting voltage signals across a configurable input range [23]. These 64 input channels are separated into blocks of 8 input channels on a spring-loaded terminal block.
While the Lock LabTM enables direct integration of external sensor signals into the mocap data stream, its reliance on hardwired connections limits practical deployment during dynamic human movement. Cable management introduces mechanical loading, restricts range of motion, creates failure points during dynamic tasks, and can interfere with natural human movements. Furthermore, long wires can introduce movement artifacts or couple to ambient power line voltages [24], undermining the measurement validity the system intends to support.
Therefore, the objective was to develop a wireless analog interface that could facilitate the collection of various wearable and Internet-of-Things (IoT) sensing streams that are time-synchronized with mocap kinematic measurements. This work presents a wireless data acquisition architecture that bypasses those aforementioned constraints, thereby enabling direct integration into mocap data streams without modification to existing laboratory infrastructure or data collection workflows. The significance of this work is that the system can be replicated and interfaced with the Vicon Lock LabTM and other similar analog interfaces for mocap systems while enabling simultaneous, time-synchronized data collection from different commercially available and prototype wearable devices. While other systems, even those employed by Vicon such as digital trigger systems, offer better synchronization, this system allows for a single workflow which collects sensor signals and kinematics within the same file. It should be clarified that the system is designed for integration with mocap systems, rather than being used as a standalone wireless sensing node. The system enhances the range and quality of biomechanical studies involving dynamic movement.
The primary contributions of this work are: (1) a wireless analog reconstruction architecture enabling direct integration with commercial motion capture analog inputs, without modification to existing laboratory infrastructure; (2) a systematic bench characterization of end-to-end delay, voltage reconstruction accuracy, crosstalk isolation, and noise floor under controlled conditions; (3) a demonstration of the complete acquisition workflow using a custom piezoresistive strain sensor with simultaneous kinematic data capture, validating the system in a representative real-world scenario; and (4) a single-stream data collection workflow in which sensor and kinematic data are recorded within the same file, eliminating the need for post hoc alignment.
This article continues with the following structure. Section 2 (Materials and Methods) describes the custom hardware architecture, corresponding software implementation, motion capture configuration, and validation testing procedures. Section 3 (Results) presents the measured performance metrics characterizing system timing, voltage reconstruction accuracy, crosstalk isolation, and noise floor. Section 4 (Discussion) discusses these results within the context of existing synchronization approaches and practical deployment considerations. Section 5 (Conclusions) summarizes the key findings and the value the system brings to further research.
2. Materials and Methods
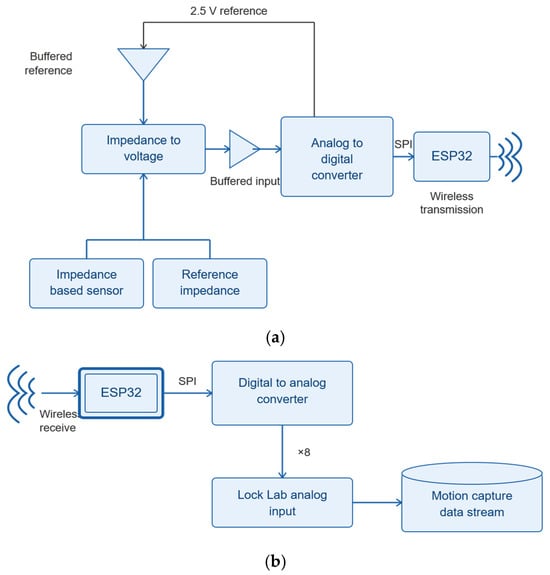
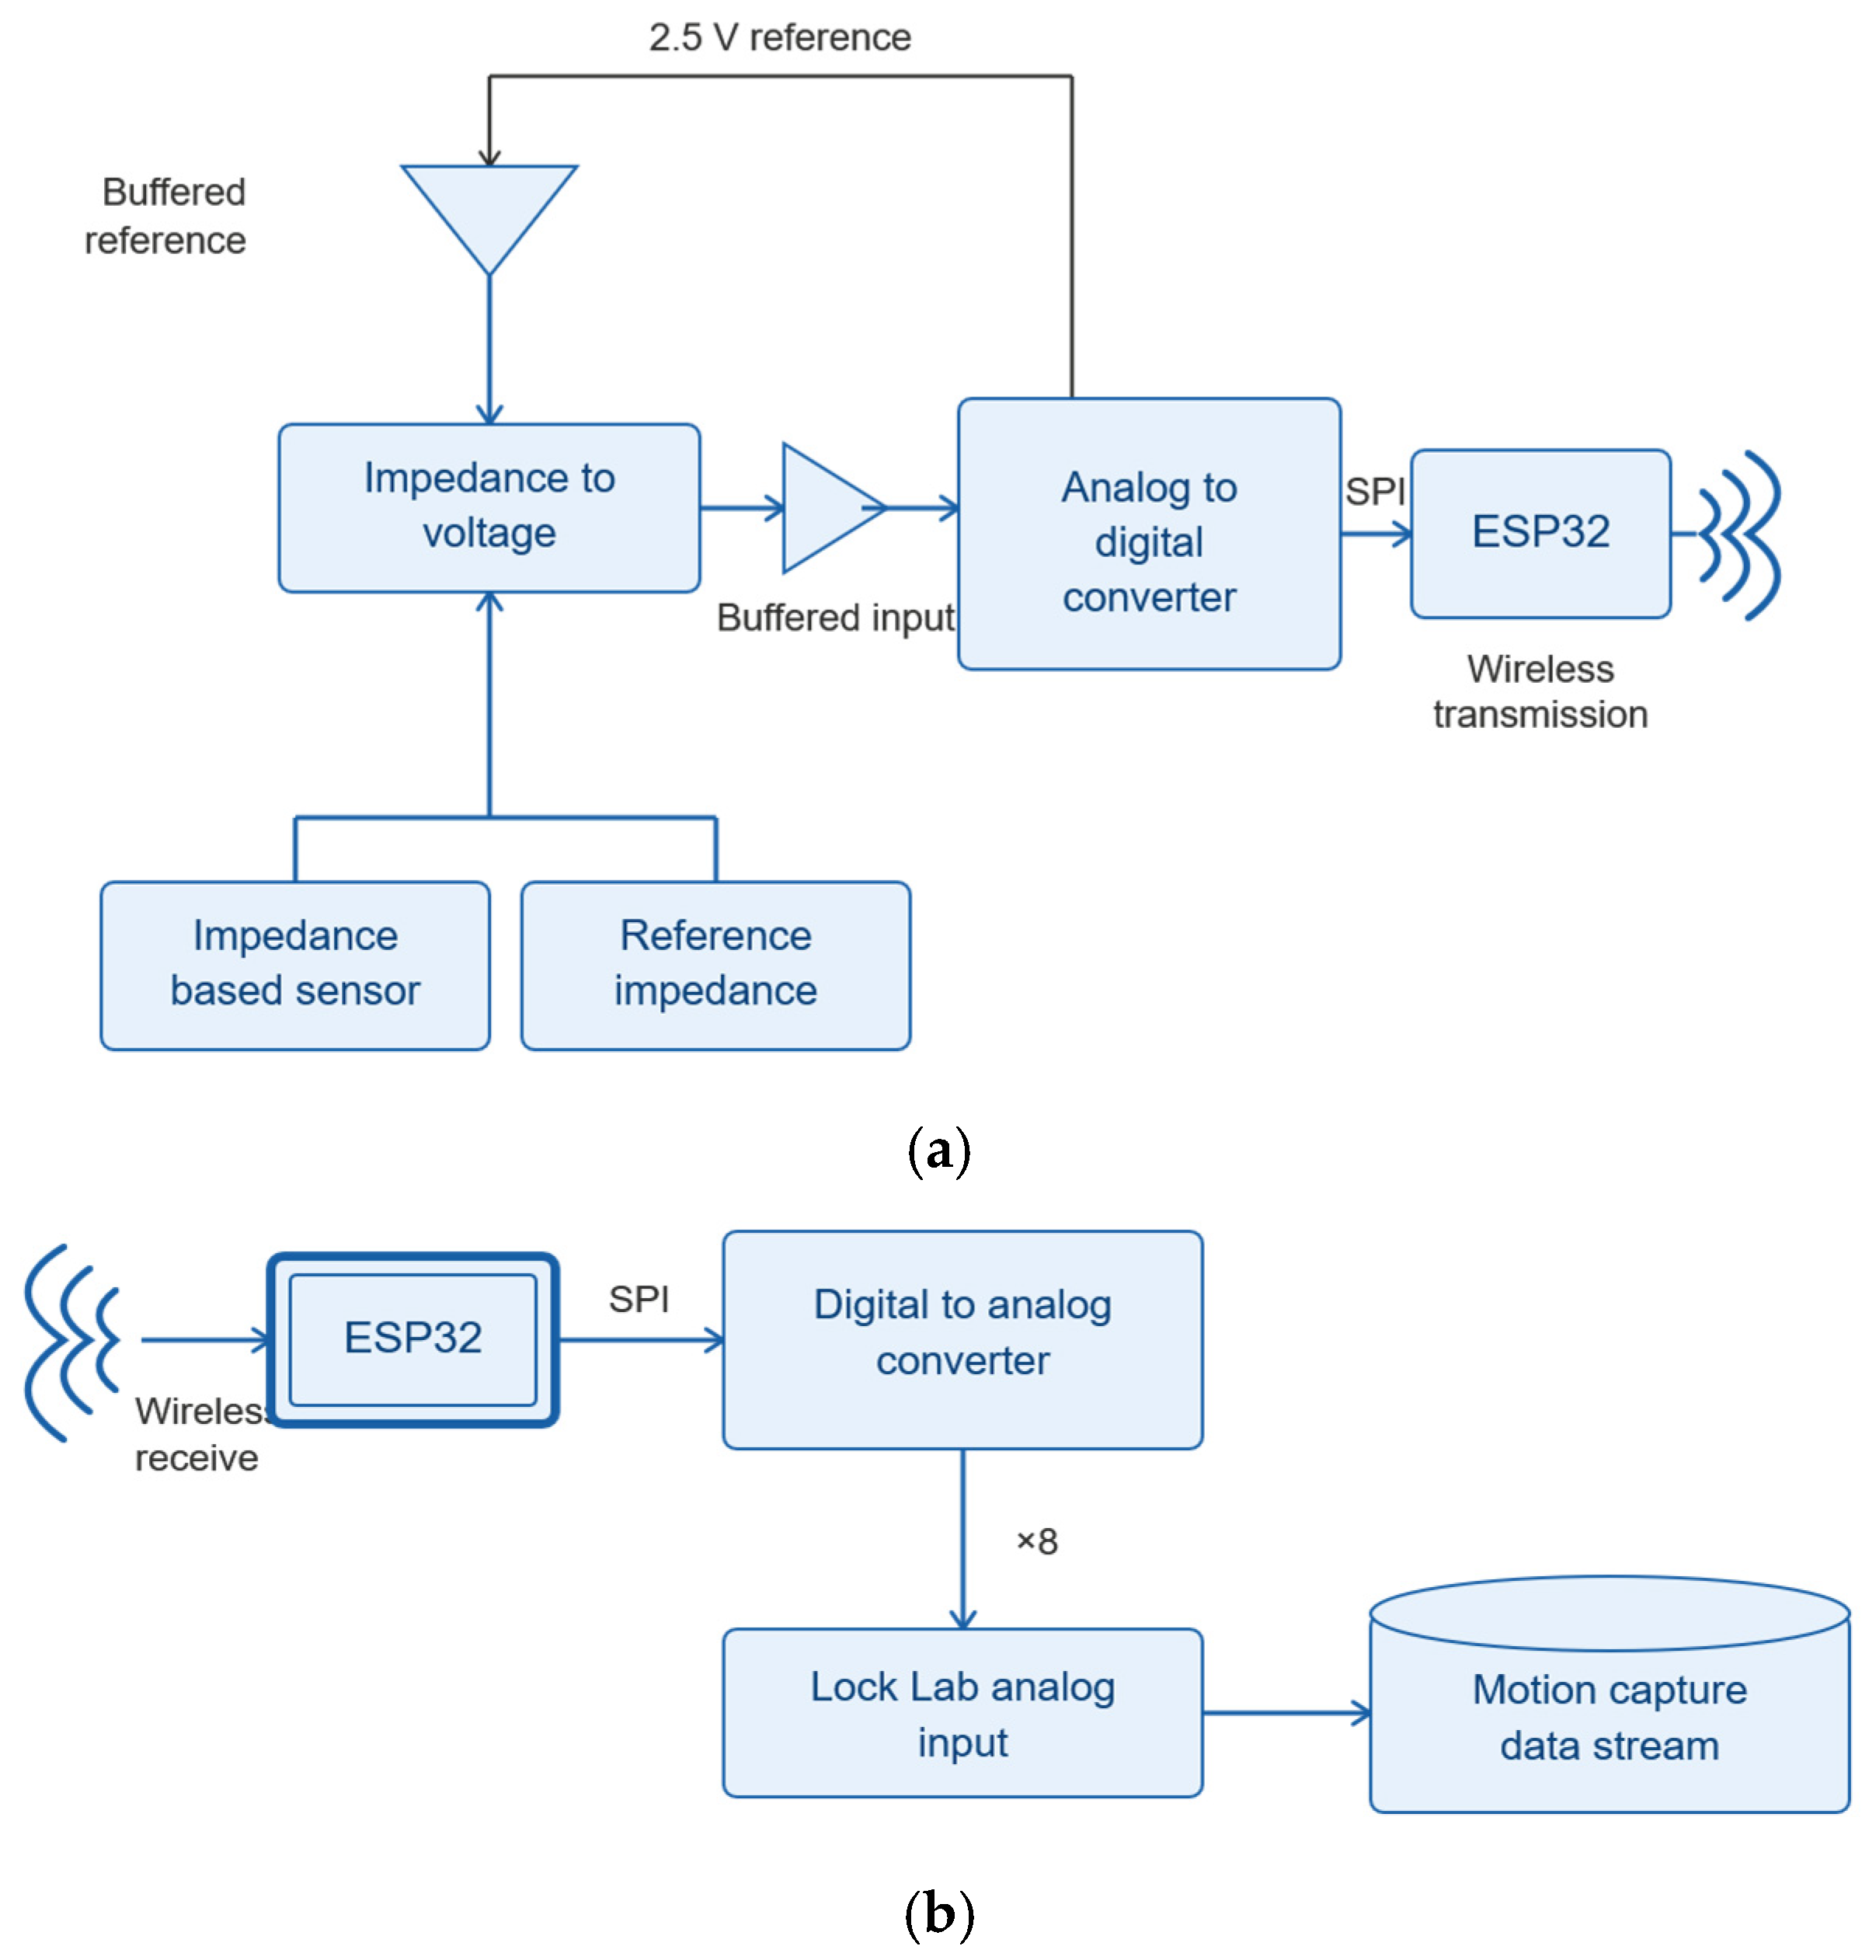
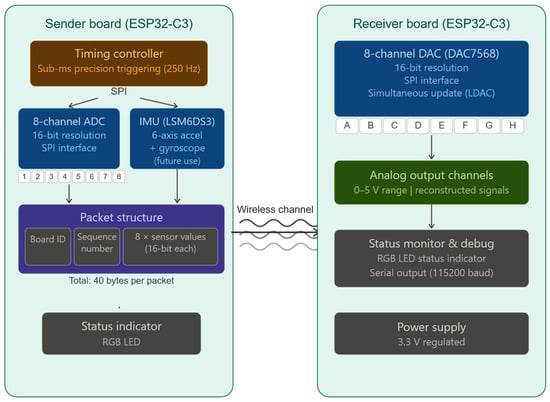
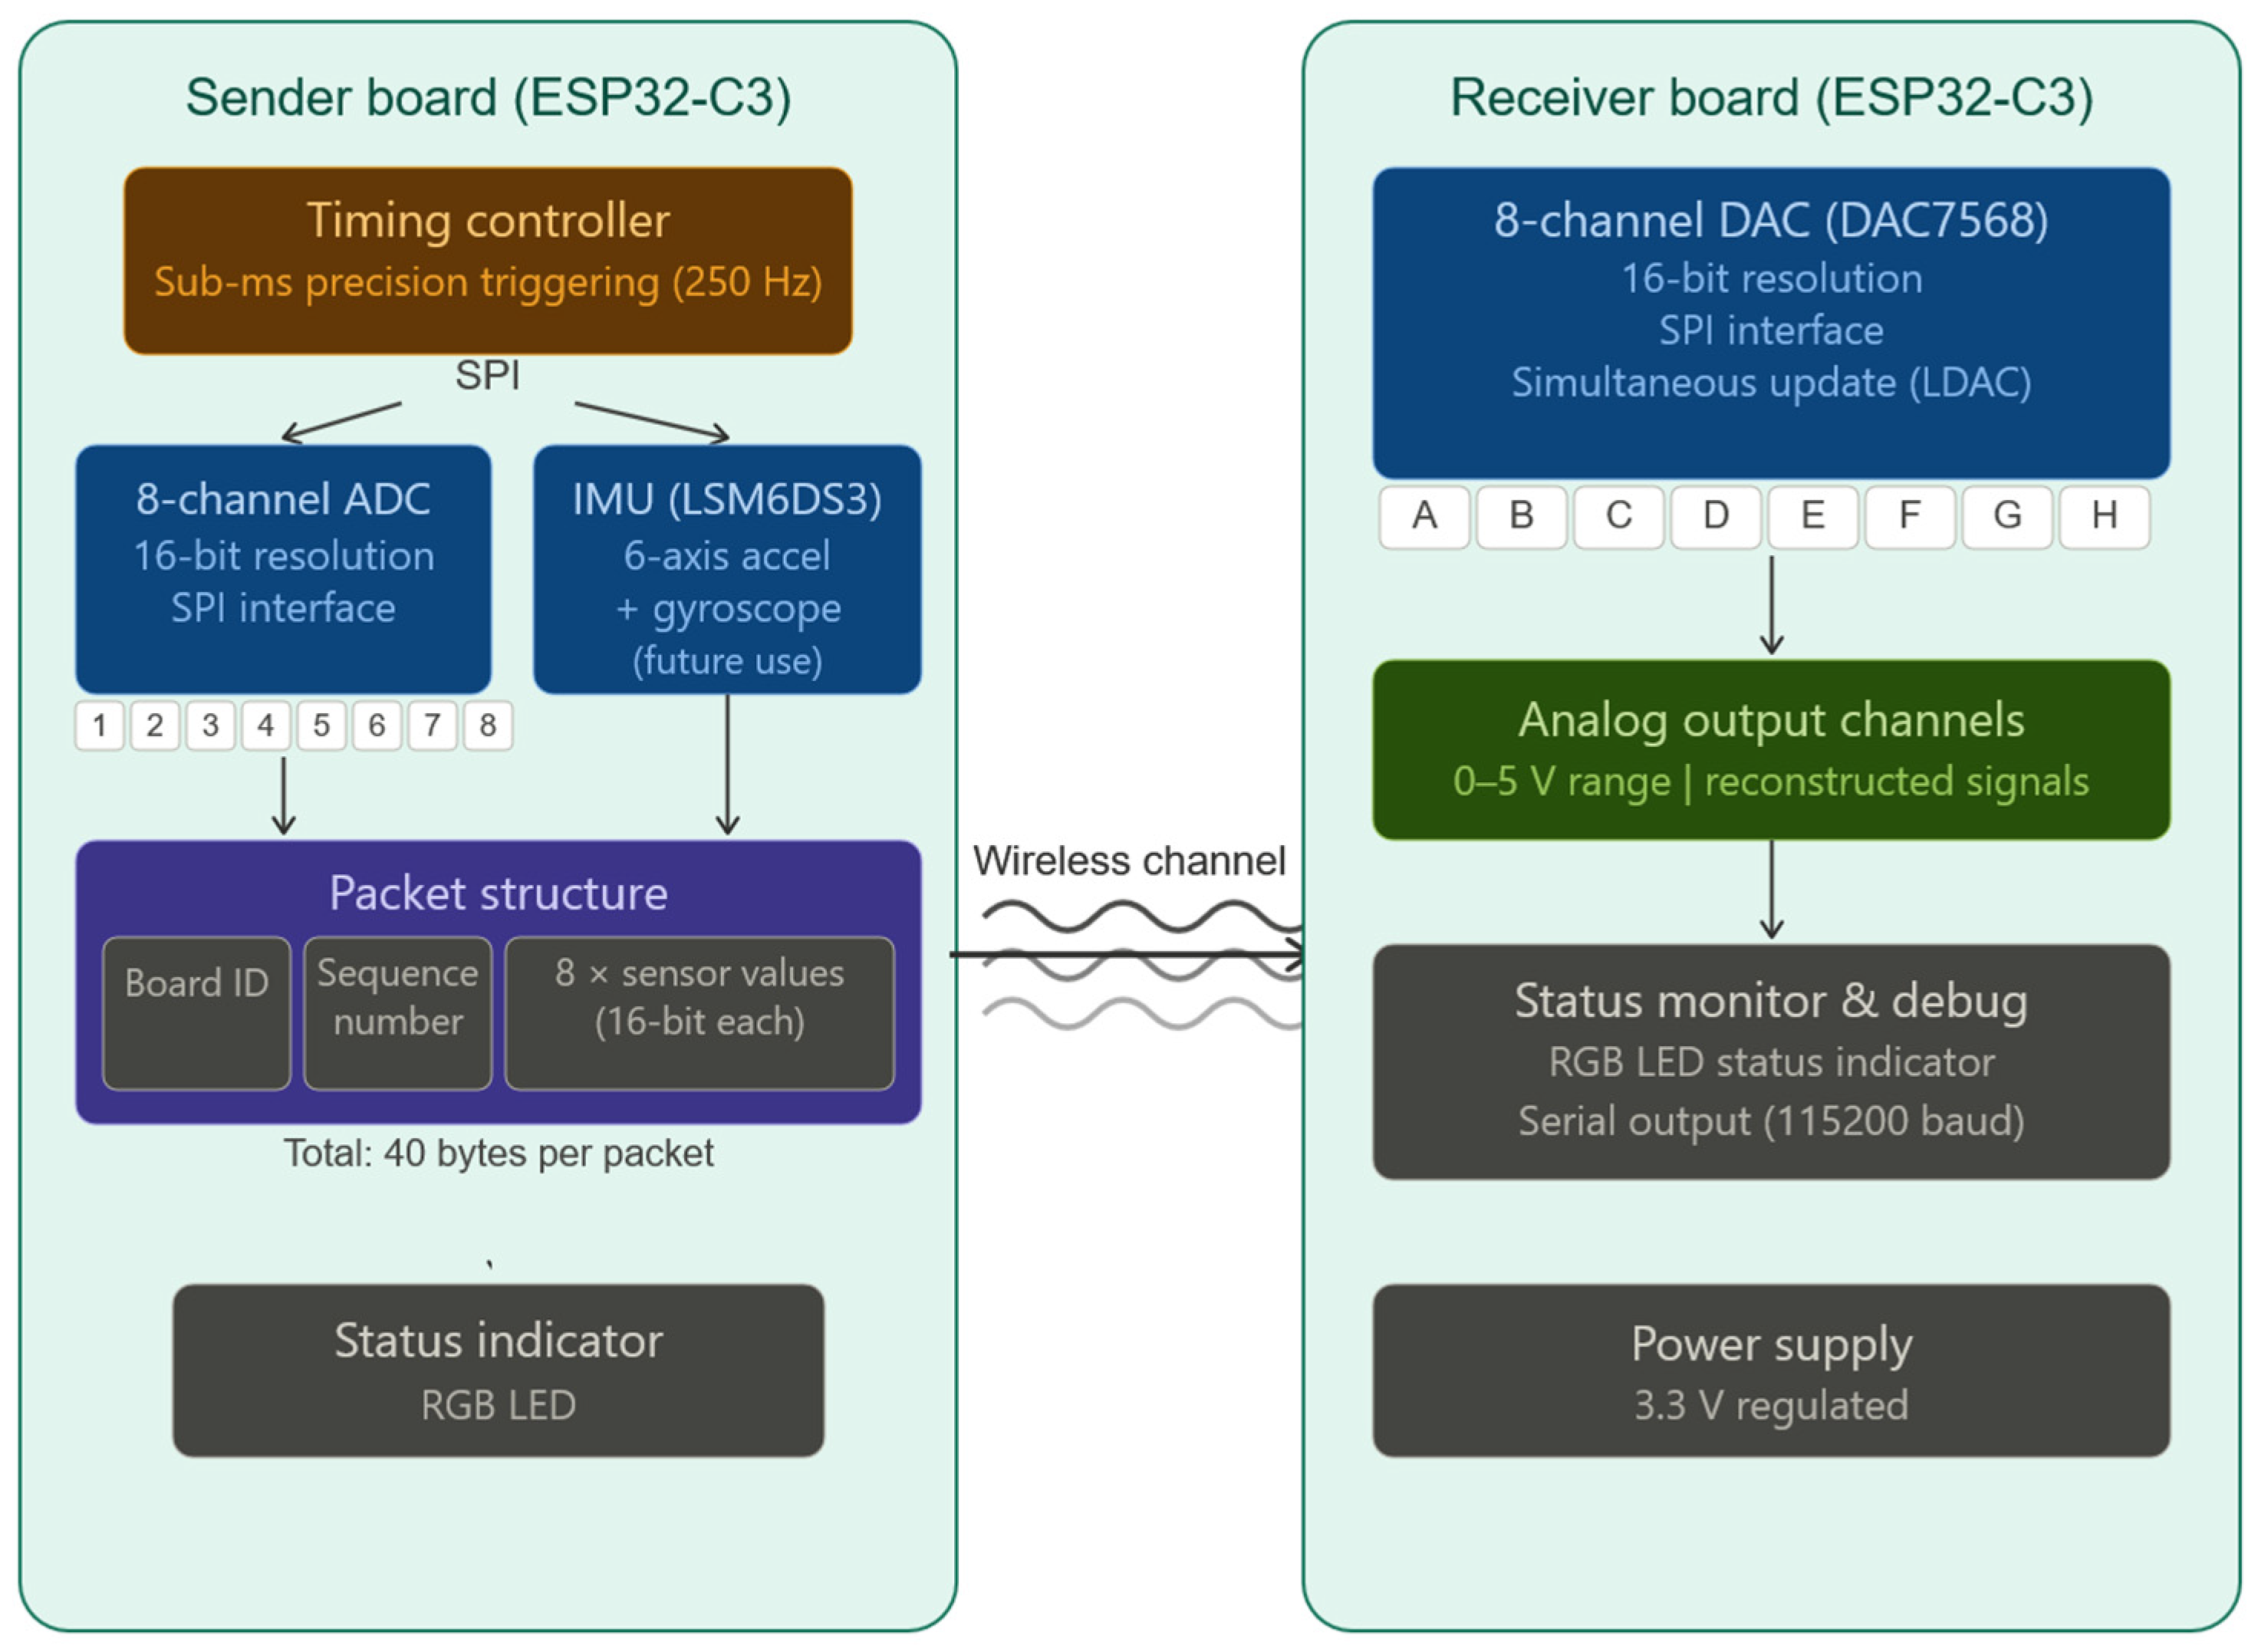
The system consists of two main parts. First, the wearable data acquisition (DAQ) node interfaces with wearable sensors and IoT devices (Figure 1a). Second, the receiver node wirelessly receives the sensing streams from the wearable DAQ node and integrates the sensing streams with mocap data streams (Figure 1b). The details of these two parts are discussed in Section 2.1 and Section 2.2, respectively.
Figure 1.
(a) Wearable node system diagram; (b) diagram of the receiver node system, which interfaces with mocap.
This work defined several practical and functional requirements to support wearable deployment and reliable integration with a commercial mocap platform. The wearable data acquisition node needed to be lightweight and compact for body-mounted use, supporting at least 12-bit analog-to-digital conversion (ADC) resolution (with higher resolution preferred). In addition, the system was designed to accommodate up to eight analog input channels to match the input capacity of the Vicon Lock LabTM hardware terminal blocks. These requirements imposed corresponding constraints on the receiver node, particularly with respect to channel count and signal resolution. To maintain usability within existing laboratory workflows, the receiver node was also designed to operate from a single readily available power source, such as via the universal serial bus (USB) port.
Beyond these functional requirements, the system was intended to be easily replicable and adaptable by others. This motivated the use of commercial off-the-shelf (CoTS) components and a firmware development environment that minimizes implementation complexity. These considerations led to the selection of the ESP32 microcontroller ecosystem as the core platform for both wearable and receiver nodes. The ESP32 family offers a wide range of development boards and module variants, enabling rapid prototyping and iterative hardware development. In addition, many ESP32 packages integrate the radio-frequency front end, reducing the need for custom antenna matching and tuning, which introduce significant design overhead in wireless systems. Collectively, these design choices prioritize robustness, reproducibility, and ease of adoption over platform-specific optimization.
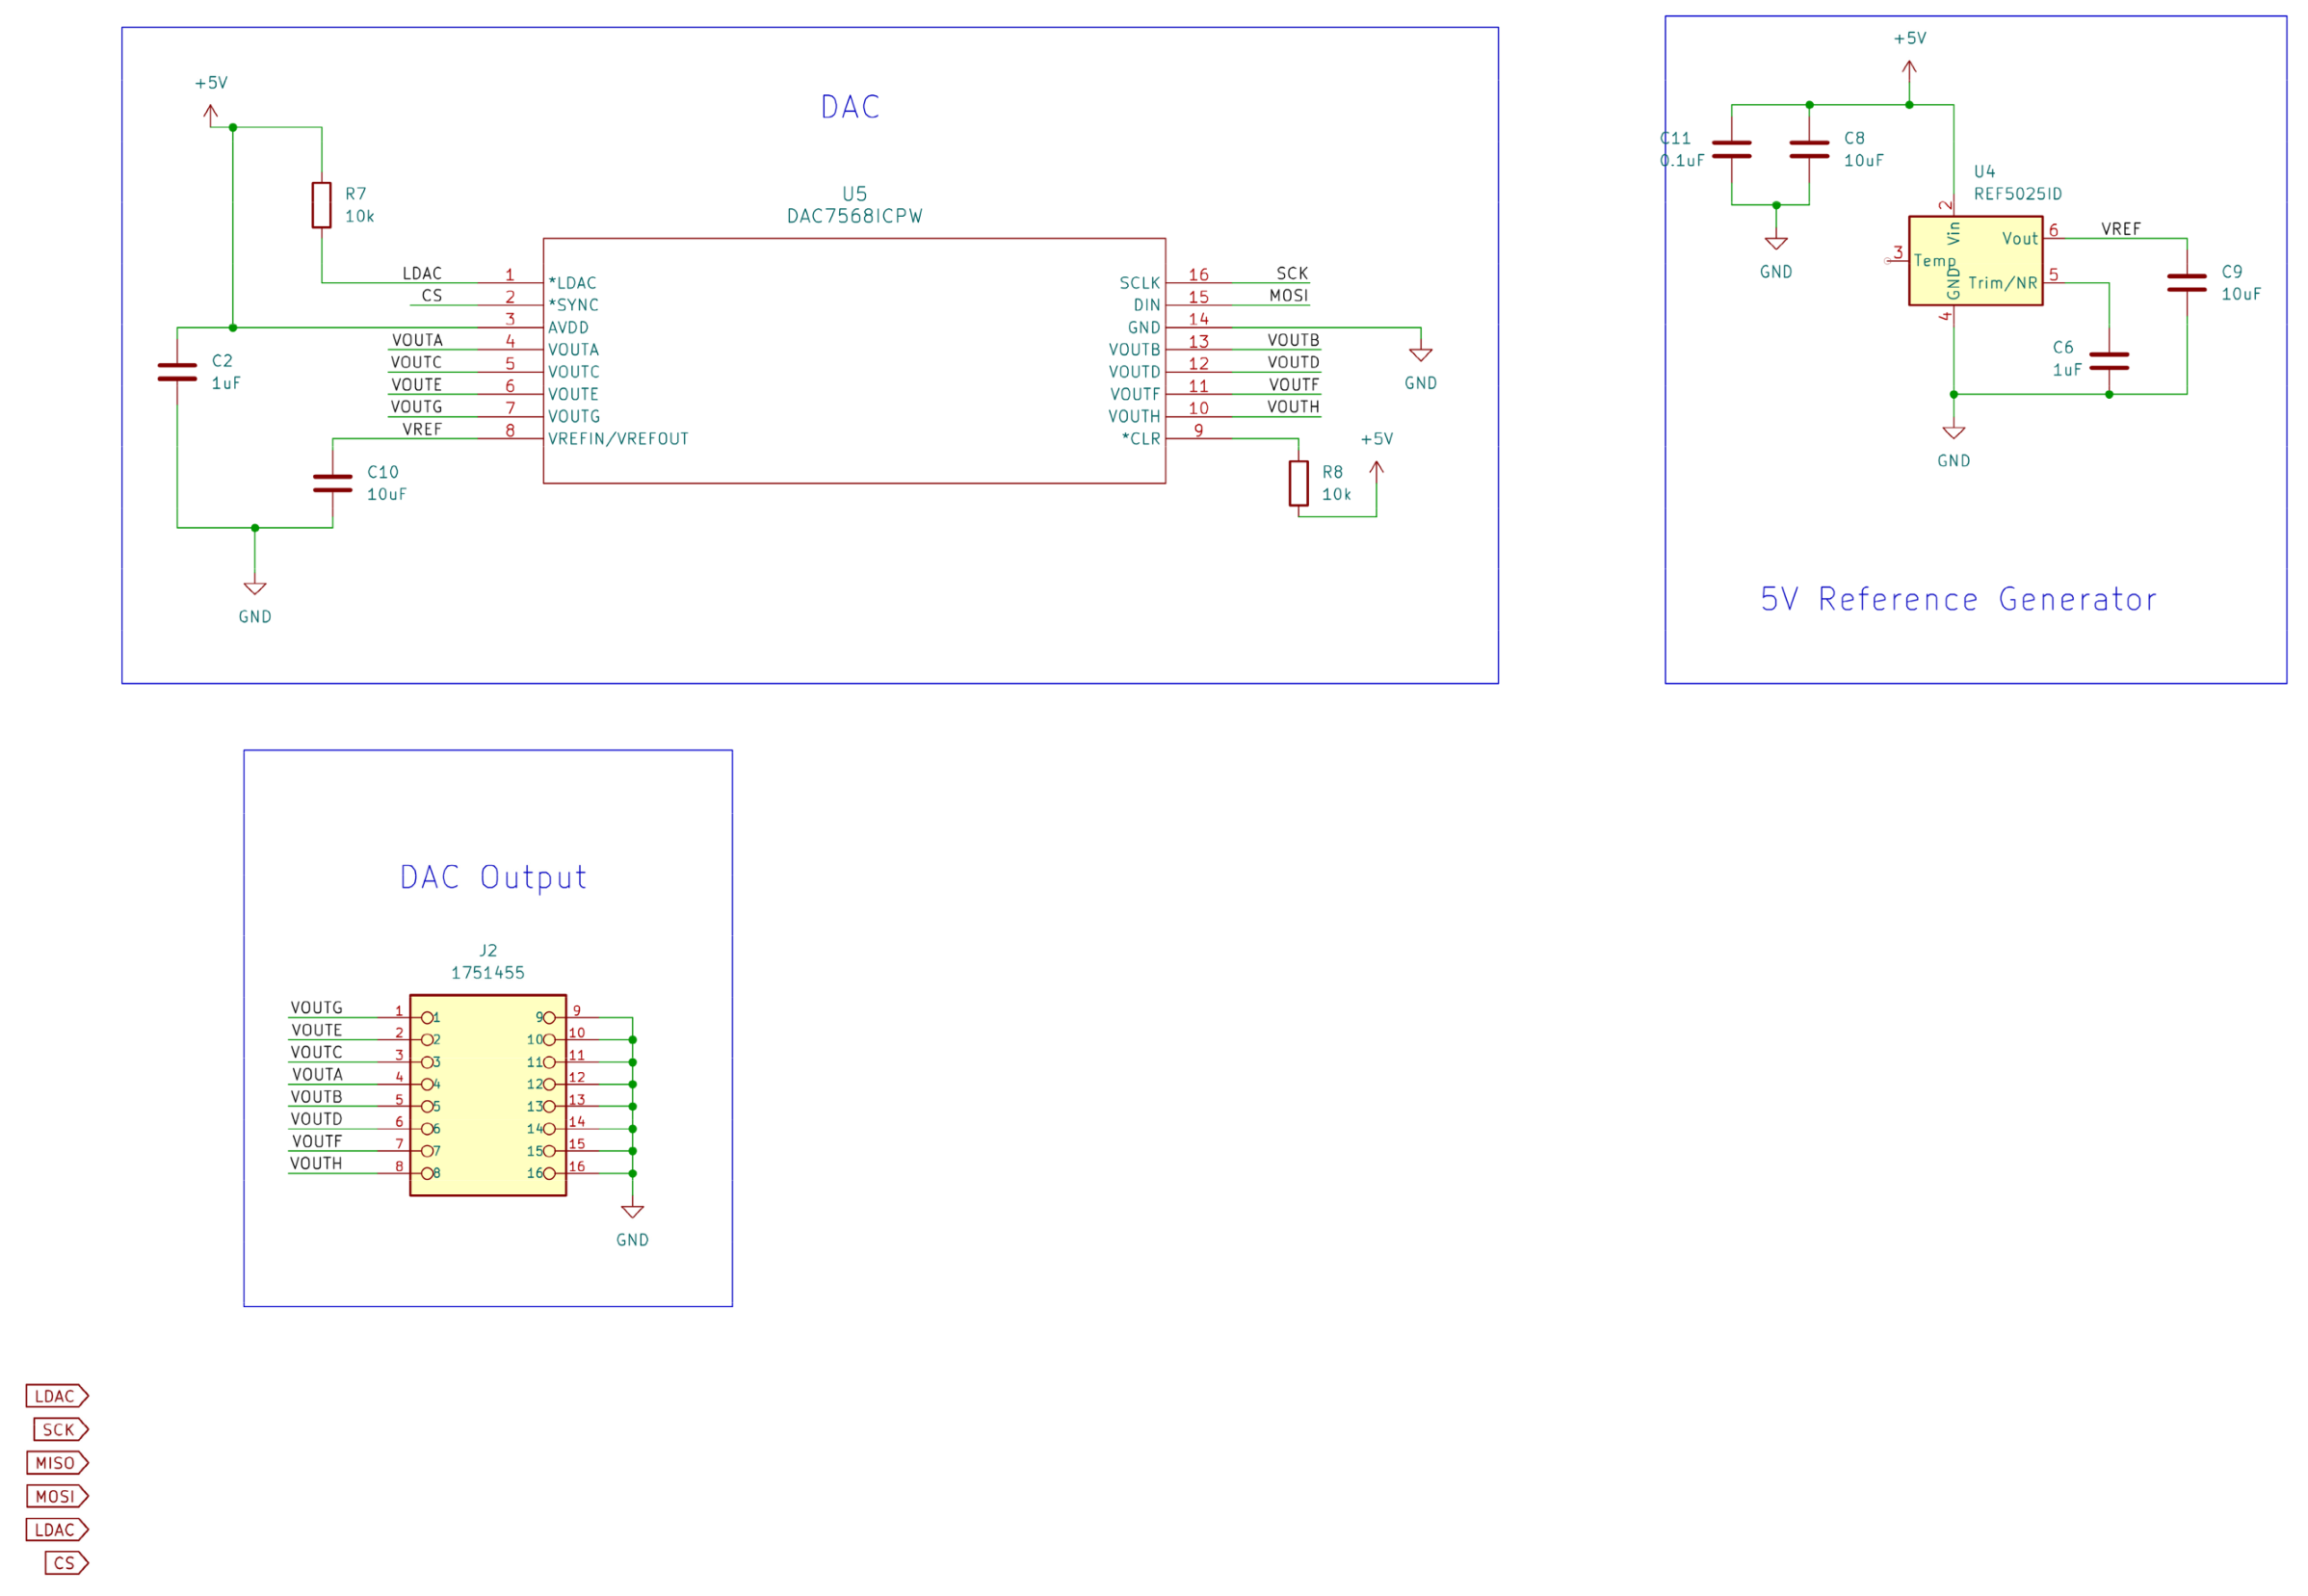
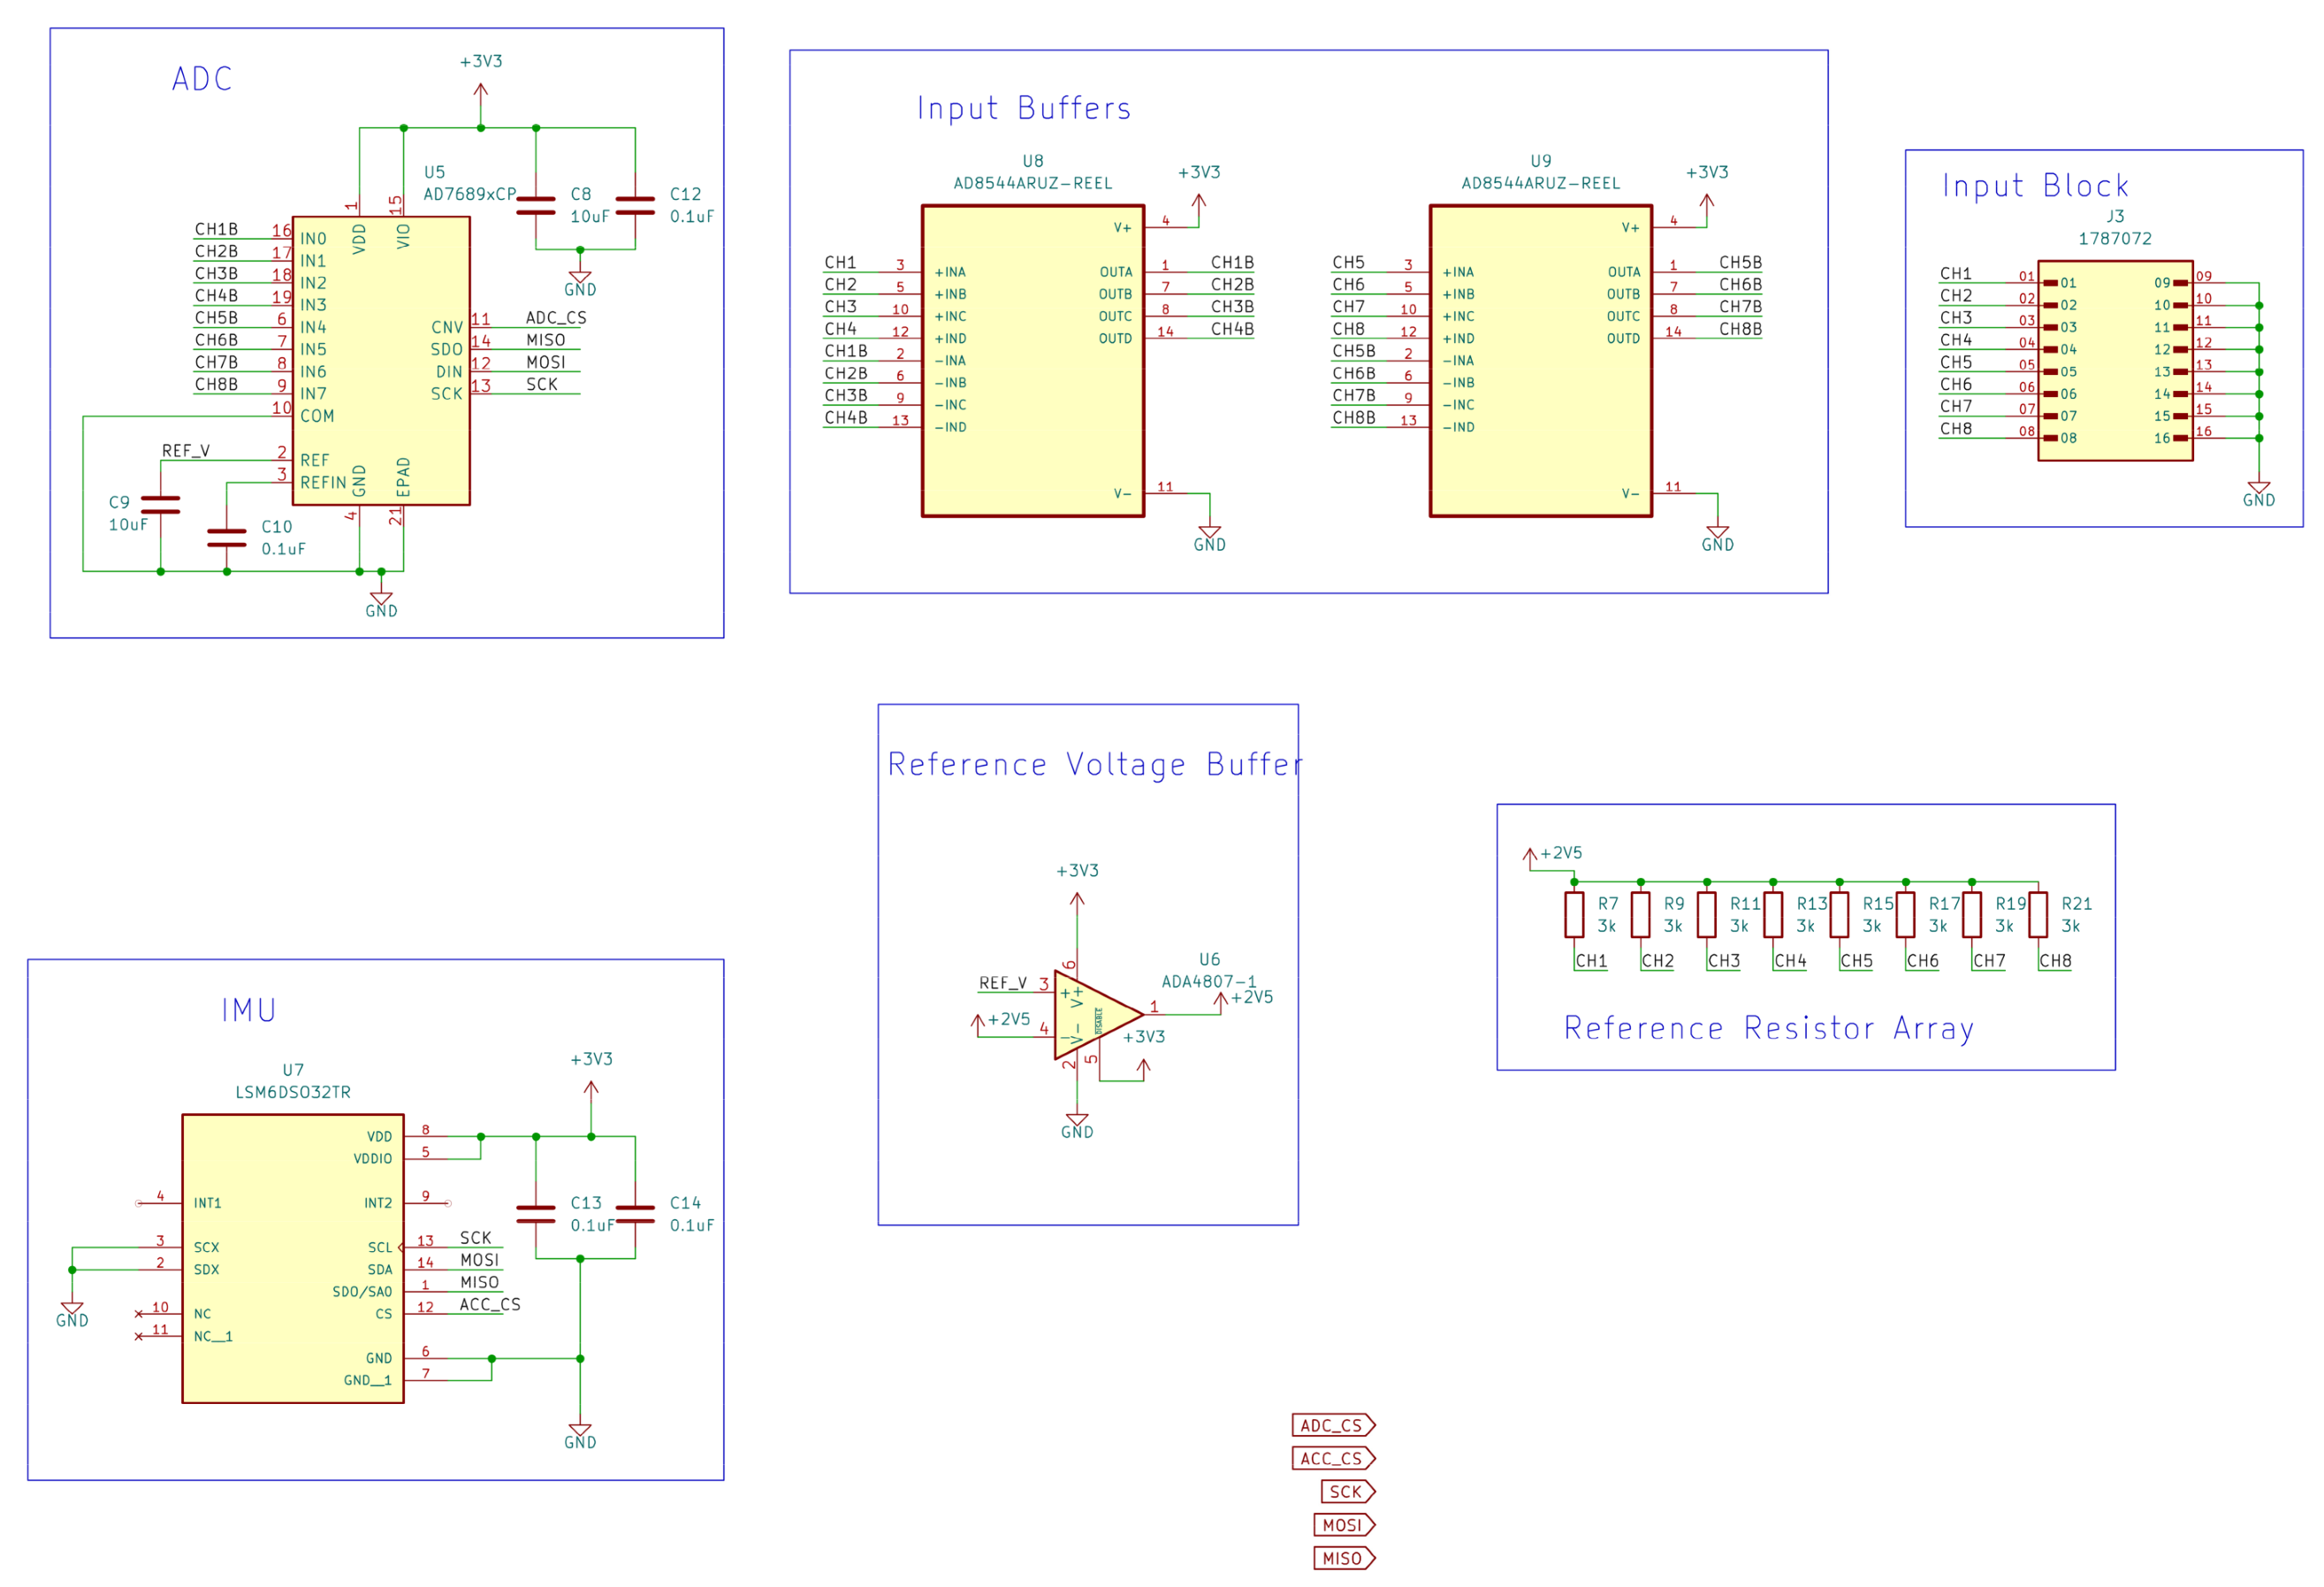
The wireless transmission, digital-to-analog (DAC) reconstruction, and Lock LabTM integration are all sensor-agnostic. Any value representable at a 16-bit integer can be represented as a voltage on the mocap data stream. For example, the existing hardware includes a 6-axis inertial measurement unit (IMU), which can be configured through the software to transmit on any of the eight available channels. The analog inputs of the wearable node, however, are explicitly intended for resistive sensors via a voltage divider input stage. Voltage inputs can be accommodated, provided they range within the 0–2.5 V input range. Other sensor types (such as capacitive or inductive sensors) would require modifications to the input stage or specialized post-processing. It should also be noted that the voltage divider reference resistor should be selected to match the approximate nominal resistance of sensors. This matched selection ensures mid-range operation and maximizes the resistance resolution after conversion from voltage. The existing bill of materials specifies these as 3 kΩ as a default, though the buffered input stage accommodates reference resistors across a wide range without loading effects. Schematics are available in Appendix A.1 and Appendix A.2 and (Figure A1, Figure A2, Figure A3 and Figure A4), as well in the GitHub repository (version 1.0.1), available in Supplementary Materials.
2.1. Wearable DAQ Node Overview
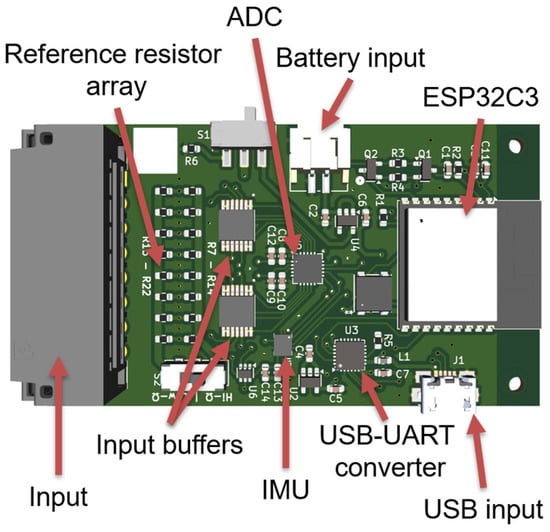
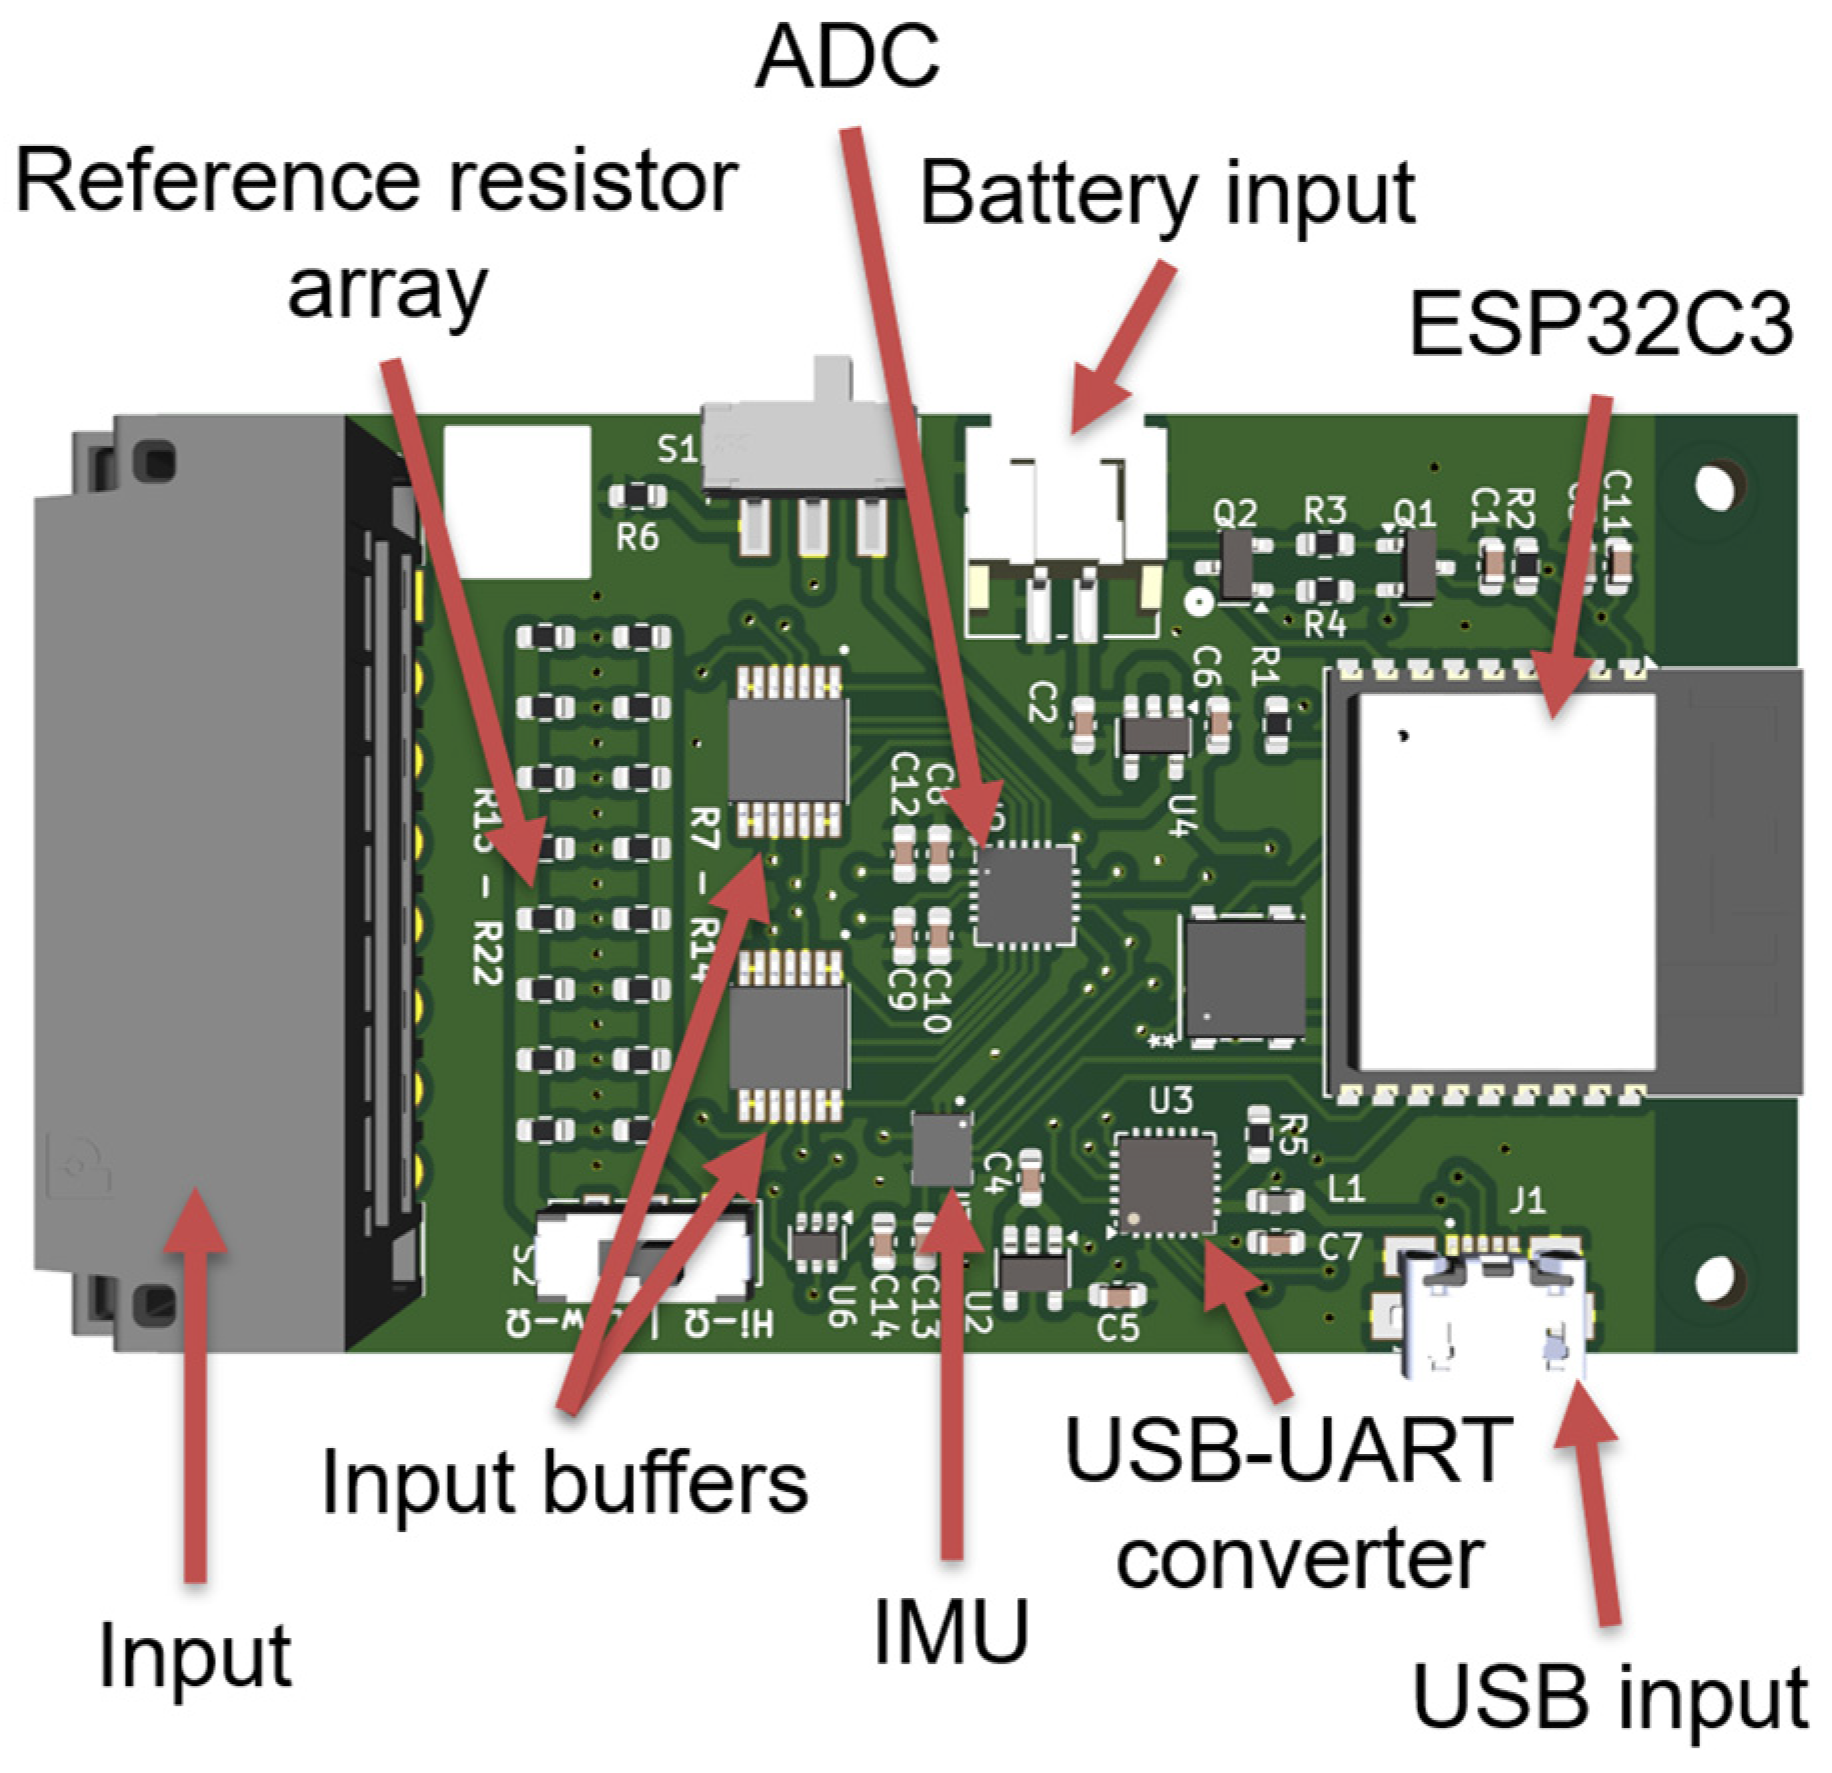
The wearable data acquisition node was designed as a compact, body-mounted device capable of acquiring multiple analog sensor signals while supporting reliable wireless transmission and extended battery-powered operation. The core processing element of the wearable unit is the ESP32-C3-WROOM-02 module (Espressif Systems, Shanghai, China), which provides integrated wireless communication, sufficient processing capability, and a compact footprint suitable for wearable deployment [25]. The availability of development boards and a mature software ecosystem also facilitated early prototyping and iterative development. A render of the final wearable node can be seen in Figure 2.
Figure 2.
Rendering of the wearable printed circuit board (PCB) design.
Although the ESP32 features an on-board 12-bit ADC, an external ADC was selected to improve sampling consistency and reduce sensitivity to input impedance and timing effects. The AD7689 (Analog Devices, Norwood, MA, USA) was chosen due to its flexible configuration, integrated reference voltage, and programmable 8-channel input multiplexer, which significantly simplified the schematic design [26]. The ADC supports throughput rates up to 250 kHz, providing substantial margin relative to the sampling rates typically required for wearable sensing applications. In practical operation, sampling rates of ~7 kHz per channel were achieved, which were sufficient for the targeted sensing modalities.
The AD7689 exhibits low power consumption (~3.5 mW at 2.5 V), resulting in minimal impact on overall system power budget relative to the wireless communication and processing components. To protect the ADC’s internal reference and ensure stable operation, an AD4807 (Analog Devices) amplifier was used as a buffer for the reference voltage output [27]. Two AD8544 (Analog Devices) quad operational amplifiers were employed as input buffers to reduce effective source impedance and mitigate sampling-related artifacts, such as aliasing and charge injection effects [28].
Additional supporting components included a CP2102N (Silicon Labs, Austin, TX, USA) USB-to-UART (universal asynchronous receiver-transmitter) converter to enable firmware flashing and debugging [29]. Linear voltage regulators (MIC5504, Microchip Technology, Chandler, AZ, USA) were used to support both USB-powered and battery-powered operating modes [30]. While the CP2102N includes an internal regulator capable of supplying limited current, an external regulator was incorporated to improve robustness under fault conditions and prevent potential damage during development and deployment. An LSM6DSO32TR (STMicroelectronics, Geneva, Switzerland) 6-axis IMU was also included to support additional, direct, onboard sensing modalities [31]. Standard supporting circuitry, including decoupling capacitors, current-limiting resistors, and reference resistors for sensor interfacing, was incorporated throughout the design. During use, the power draw of the device was measured using a Power Profiler Kit II (Nordic Semiconductor, Trondheim, Norway). Measuring at the battery input, with nominal lithium polymer (LiPo) voltage (3.7 V), the device draws an average of ~170 mA (0.629 W) with transmission spikes of ~440 mA. This equates to an estimated 7 h of battery life using a 1200 mAh LiPo battery (included in the bill of materials), which roughly matches the footprint of the PCB. The full schematic, bill of materials, layout, and firmware are available on the associated GitHub repository (https://github.com/TPierceUCSD/Wireless-motion-capture-data-sycnhronization-system).
2.2. Receiver Node and Motion Capture Interface
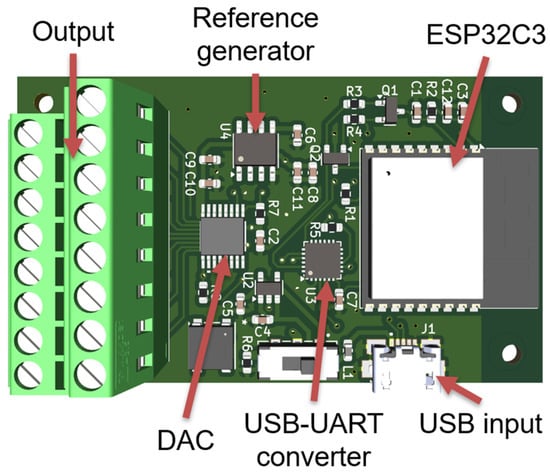
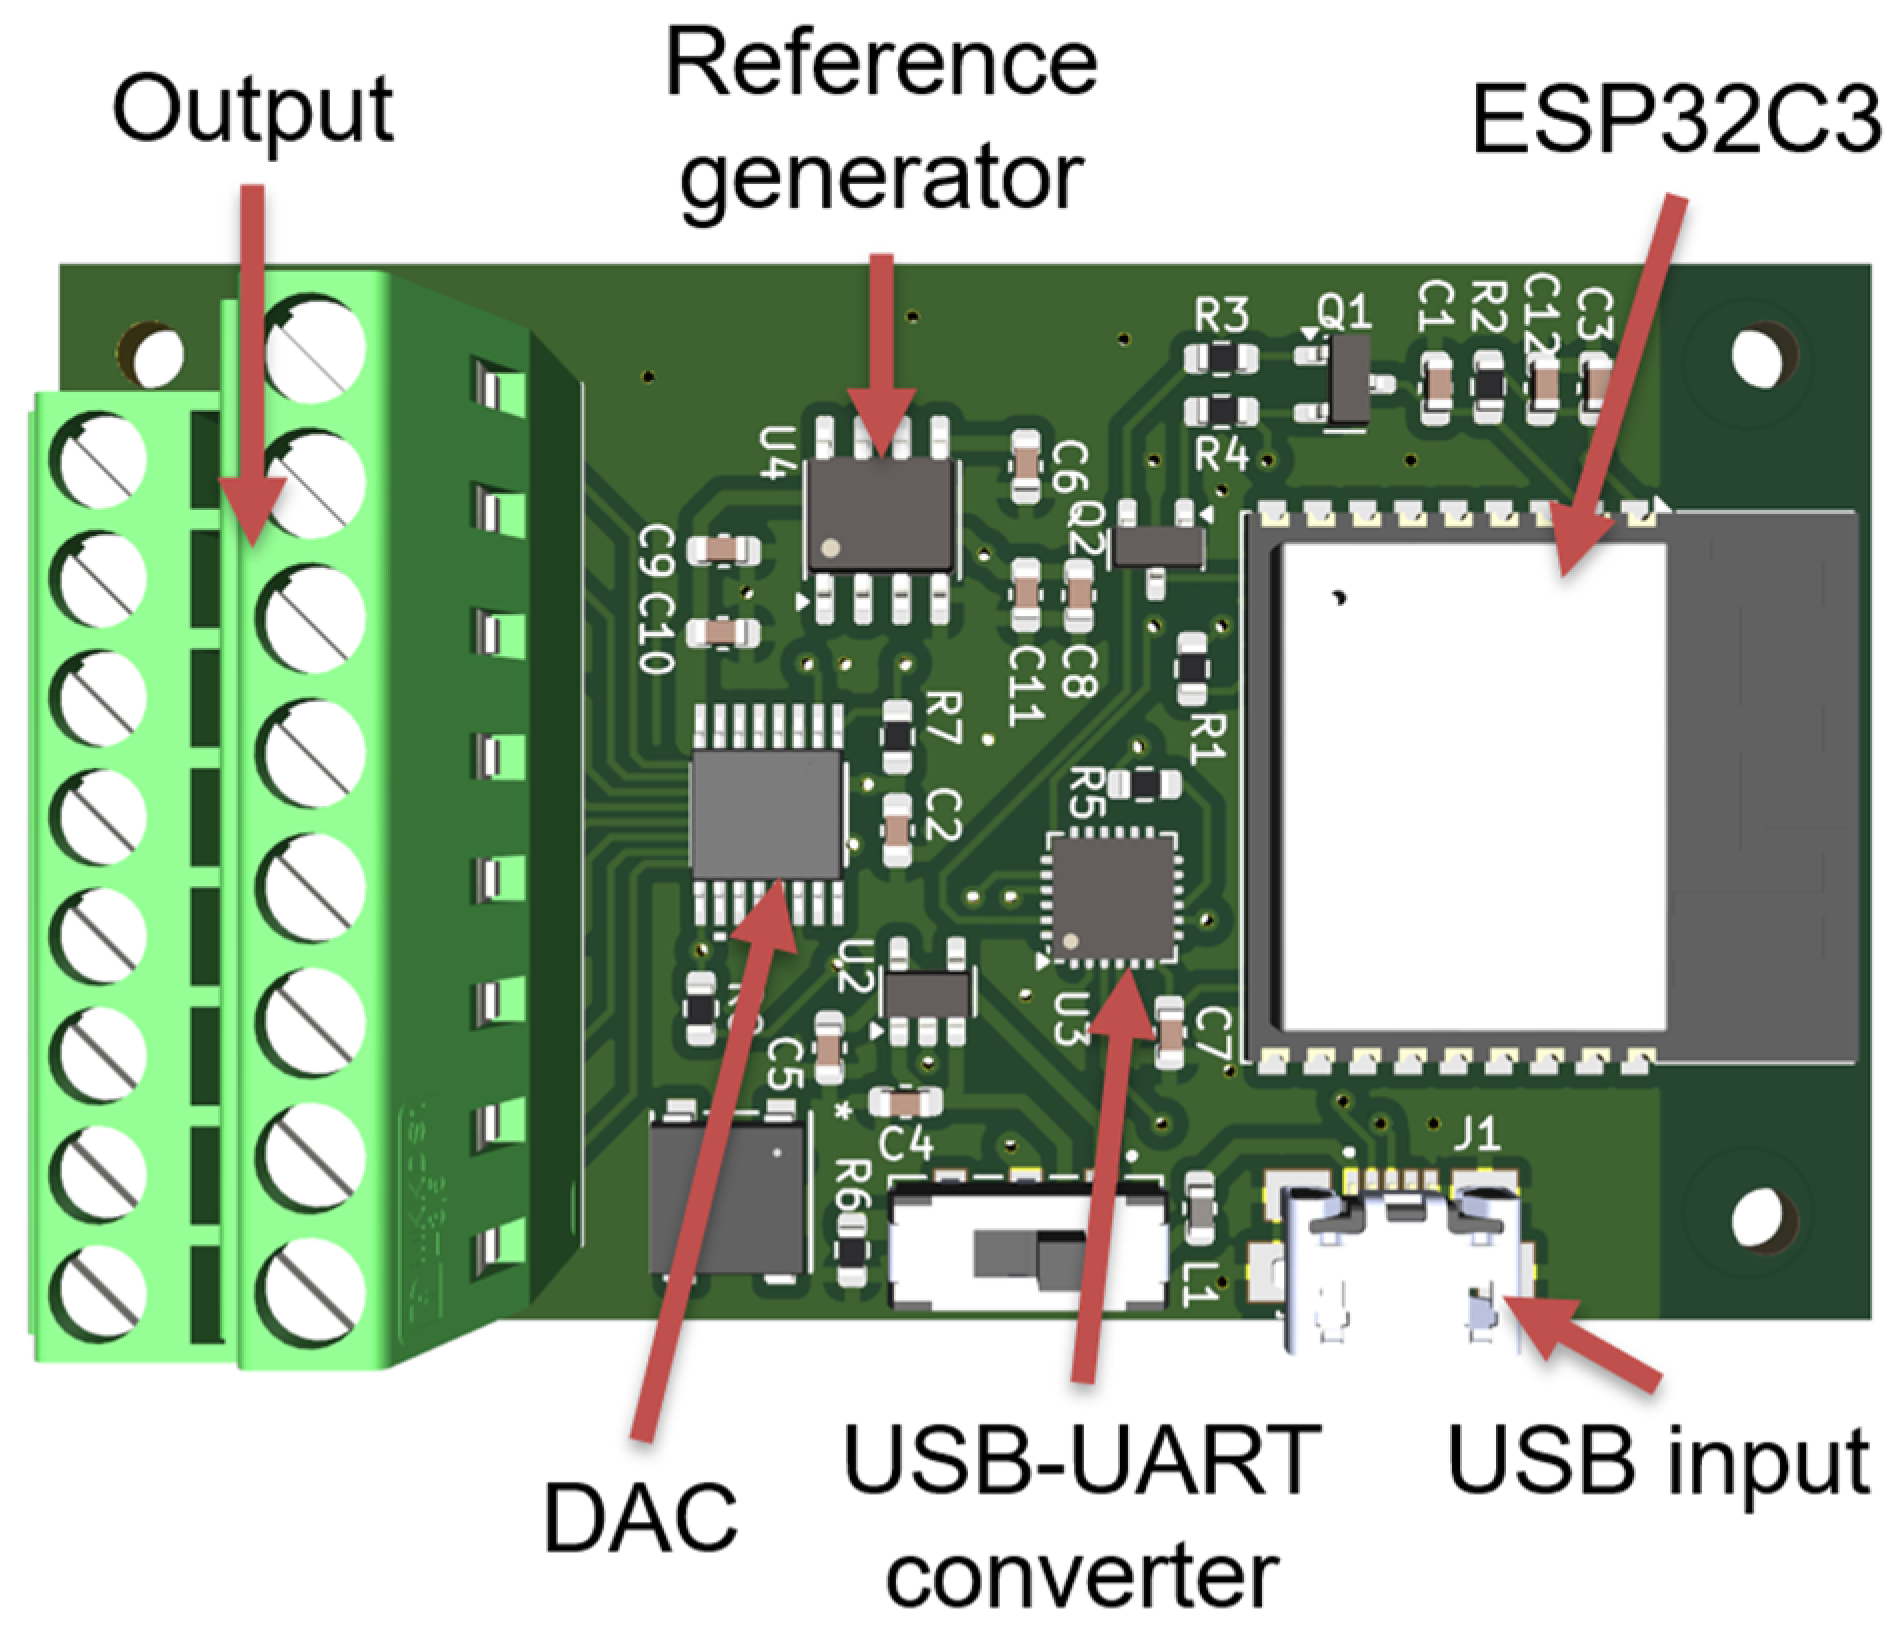
The receiver node employs the same ESP32-C3-WROOM-02 module as the wearable unit, simplifying firmware development and maintaining architectural consistency across the system. The primary function of the receiver is to reconstruct synchronized analog signals from the received wireless data stream for direct input into the mocap data acquisition hardware. A render of the final receiver node can be seen in Figure 3.
Figure 3.
Receiver PCB render.
Digital-to-analog conversion is performed using the DAC8568 (Texas Instruments, Dallas, TX, USA), which provides eight output channels and supports flexible supply voltage configurations [32]. The DAC8568 was selected to match the channel count of the mocap terminal blocks while providing sufficient resolution for accurate signal reconstruction. During development, the availability of a manufacturer-supported evaluation module facilitated rapid prototyping and system verification. Lower-resolution, pin-compatible alternatives, such as the DAC7568 and DAC8168, are also available and may be substituted in applications with reduced resolution requirements.
An REF5025ID (Texas Instruments, Dallas, TX, USA) precision 2.5 V voltage reference was used to supply the DAC reference voltage, which was selected for its low noise characteristics and minimal external component requirements [33]. Output signals are routed through a screw-terminal block, providing a robust and user-friendly interface for connecting to the Vicon Lock LabTM input channels using standard wiring. Power draw over the USB connection was measured at an average of ~135 mA, with transceiver spikes drawing ~465 mA. From the 5 V USB input, this equates to ~0.675 W.
2.3. Software
The wearable and receiver nodes are each supported by custom firmware developed to manage sensor data acquisition, wireless communications, and data reconstruction while maintaining consistent timing behavior. Firmware for both nodes was implemented using the Arduino development environment, leveraging widely available ESP32-compatible libraries to simplify peripheral configuration and wireless communication.
On the wearable DAQ node, firmware execution is organized around a deterministic sampling loop responsible for initiating analog-to-digital conversions, packaging acquired sensor data, and transmitting data packets wirelessly to the receiver node. Sensor samples from multiple channels are collected sequentially and stored in a structured data packet that includes channel identifiers and timing information. Wireless transmission is performed immediately following packet assembly to minimize buffering latency and temporal uncertainty.
The receiver node firmware is responsible for receiving wireless data packets, validating packet integrity, and reconstructing the corresponding analog output signals. Upon receipt, digital sensor values are routed to the appropriate DAC output channels via a serial peripheral interface (SPI). This process enables synchronized analog signal reconstruction suitable for direct input into the mocap data acquisition hardware. Firmware on the receiver node also manages DAC configuration, reference voltage initialization, and output channel updates.
Wireless communication between the wearable and receiver nodes is implemented using an ESP-NOW [34] transmission protocol supported by the ESP32 platform. This approach eliminates the need for external networking infrastructure and enables low-latency data exchange in laboratory environments. Firmware on both nodes incorporates basic error handling and packet sequencing logic to ensure stable operation during extended acquisition periods. It should be noted that the ESP-NOW protocol draws considerably more current than Bluetooth Low Energy implementations, with preliminary tests showing ~60 mA higher average current draw with ESP-NOW. The tradeoff is dramatically increased signal reliability and range.
Overall, the firmware architecture prioritizes simplicity, repeatability, and timing consistency over platform-specific optimization. This design approach facilitates rapid adaptation to new sensing modalities and supports reproducible deployment in experimental motion capture settings. The basic firmware functionality is outlined in Figure 4.
Figure 4.
Timing and data flow.
2.4. Vicon Setup
All data were captured within the Vicon Nexus software, version 2.18. The optical motion capture system was set up in a large 3D space truss frame, mounted with 12 Vero motion capture cameras at various points along the frame. Through the Nexus software, the Lock Lab sampling was set to 1 kHz, with a mocap frame rate of 100 Hz for most tests. Data collected within the Nexus software were then exported to csv (comma-separated values) formats, including frame, sub-frame, voltage values, and marker positions (when relevant).
2.5. Validation Techniques
To evaluate the performance of the proposed wireless synchronization system, a series of bench-top experiments were conducted to quantify (i) analog signal reconstruction accuracy, (ii) end-to-end latency and timing variability, (iii) long-duration timing stability, (iv) multi-channel behavior, (v) noise characteristics, and (vi) custom sensor integration. All validation experiments were performed using the Vicon Lock LabTM analog interface as the reference measurement platform. A programmable signal generator was used to produce repeatable input waveforms that were applied directly to the mocap analog inputs (reference condition) and simultaneously routed through the wearable acquisition node. Both reference and reconstructed signals were recorded simultaneously by the mocap system to ensure identical sampling, logging, and timing conditions. For a majority of these tests, square wave signals were utilized in an effort to provide clear delay metrics and voltage levels. This included 2 Vp-p (peak to peak) square waves with a 0.25 V DC (direct current) offset at 1 Hz (5 min trial), 10 Hz (2 min trial), 10 Hz (30 min trial), and 50 Hz (2 min trial). Furthermore, a 1 Vp-p 10 Hz square wave (2 min trial) was applied to interrogate any voltage dependency in metrics of interest.
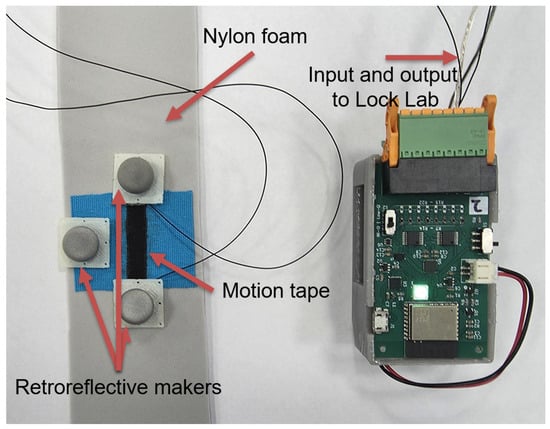
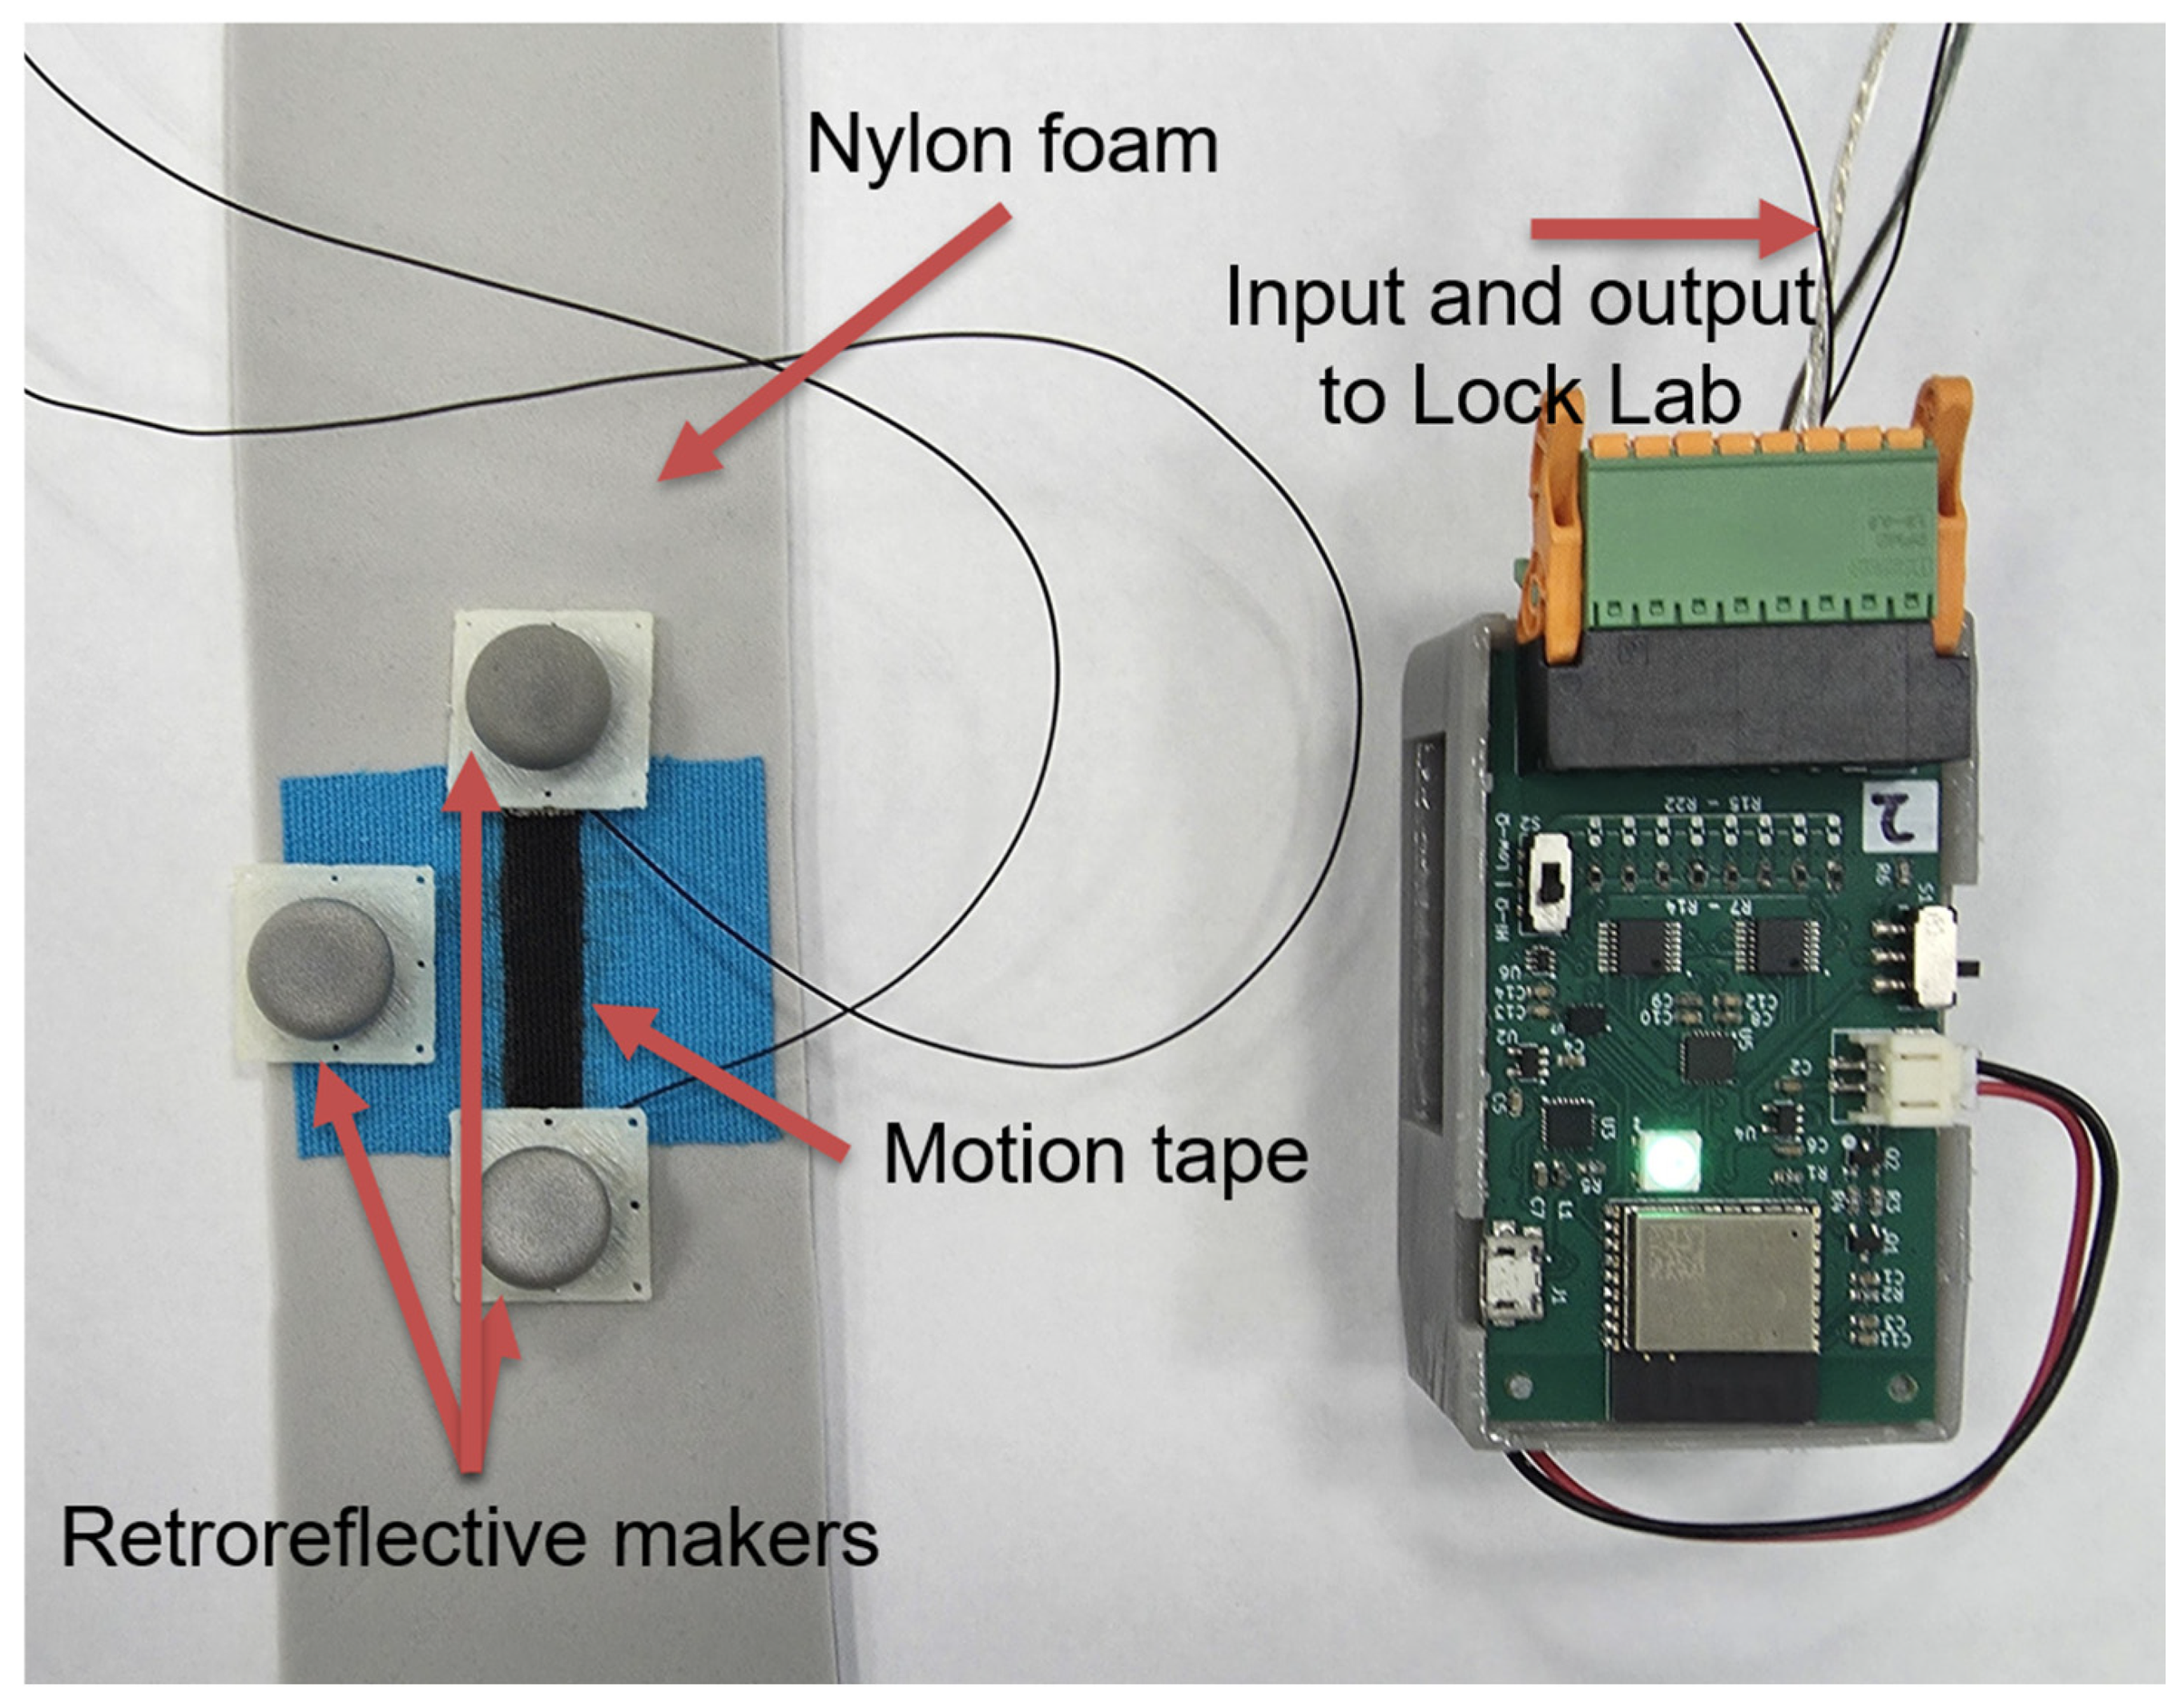
In addition to highly controlled voltage testing, the system was connected to a prototype piezoresistive graphene-based skin-strain sensor called Motion Tape [35,36]. In short, Motion Tape is a self-adhesive elastic fabric wearable sensor that could be applied anywhere on the skin for measuring joint angles, movement, and muscle engagement. The sensor was connected to the wearable node, with additional leads connecting the sensor voltage node and circuit ground directly to the Lock LabTM analog inputs, providing the reference measurement. The sensor itself was adhered to vinyl foam to simulate compliant skin-like deformation, and the foam strip was manually stretched. Optical motion capture retroreflective markers were placed at the end of the skin-strain sensor, such that the position of these markers could be used to calculate the linear strain applied to Motion Tape, with an additional marker for tracking orientation, as shown in Figure 5.
Figure 5.
Custom sensor mounted on nylon foam, with mocap markers for tracking.
It should be noted that the wearable node utilizes a full-scale range of 2.5 V, which gets scaled to 5 V when reconstructed on the receiver node. Thus, there is a 2× discrepancy when comparing voltages, which are applied to the wearable node input and direct to the Lock LabTM input simultaneously. As such, for voltage-dependent factors, the reference voltages are scaled during post-processing to align expected voltages; thus, 2 V input signals appear as 4 V outputs in these tests. This has no impact on actual usage of the system, as this 2× factor is easily accounted for when converting voltage to actual sensor values, but a correction is needed to allow direct comparisons between the systems.
Per default operating settings for the system, the Lock LabTM ADC sampling was set to 1 kHz with the mocap set to 100 Hz. This allows for sub-frame resolution in testing, though direct correlation to mocap would typically involve down-sampling to match the 100 Hz frame rate. Data for each test were exported from the Vicon Nexus software as raw csv files. Generative artificial intelligence (Claude Sonnet 4.6, Anthropic) was utilized in developing a MATLAB (R2024a) script for processing data, calculating metrics, and creating figures. The generated analysis was verified by comparison against raw data traces, validated with synthetic signals of known properties, and cross-referencing of computed metrics for internal consistency and agreement with expected outcomes. All artificial intelligence-assisted outputs were reviewed and validated by the authors prior to use. The various tests utilized in this study are summarized in Table 1.
Table 1.
Test summary.
3. Results
3.1. Analog Reconstruction Accuracy (Voltage-to-Voltage Comparison)
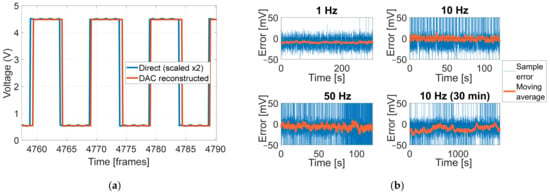
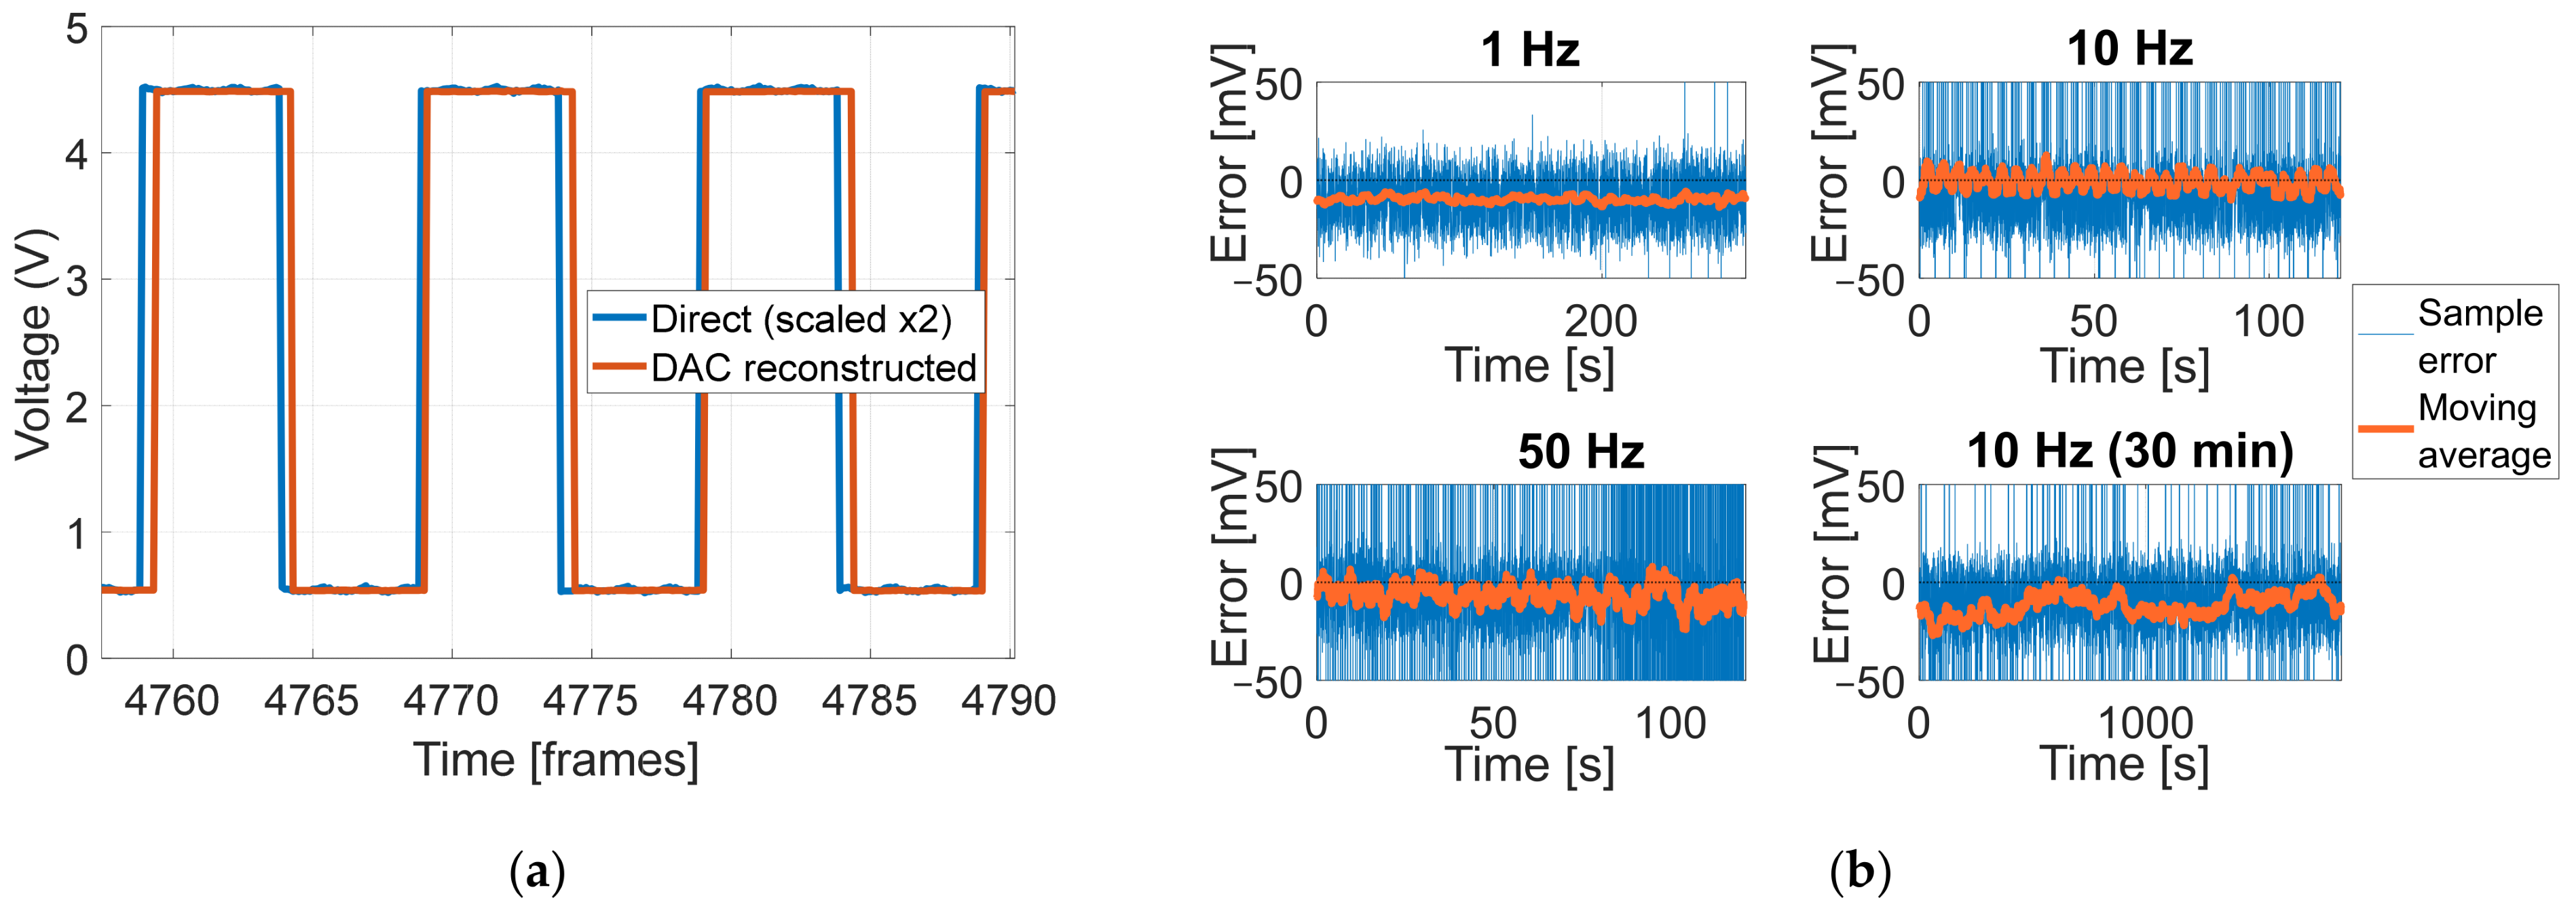
This study analyzed the steady-state voltage levels from the square waves to determine high/low-voltage values and overall offsets. To verify voltage levels, steady-state voltage levels from the square waves were analyzed to determine high-voltage levels, low-voltage levels, and overall offset. As seen in Table 2, the DAC generally trended towards a lower voltage level and ~2.7% gain compression at most. A typical reconstruction path can be seen in Figure 6a. Figure 6b demonstrates sample-by-sample errors, after a 6 ms adjustment per typical behavior discussed in Section 3.2. A moving average is displayed to more clearly demonstrate the errors not contributed by edge artifacts of the square wave reconstruction.
Table 2.
Steady voltage level comparisons.
Figure 6.
(a) Voltage reconstruction sample; (b) moving average of sample-by-sample voltage errors (after 6 ms correction, per typical delay discussed in Section 3.2).
3.2. End-to-End Latency and Timing Variability
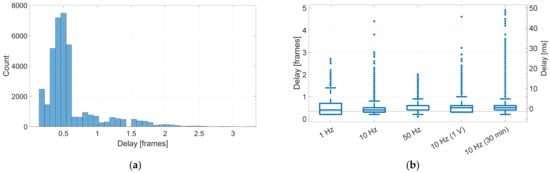
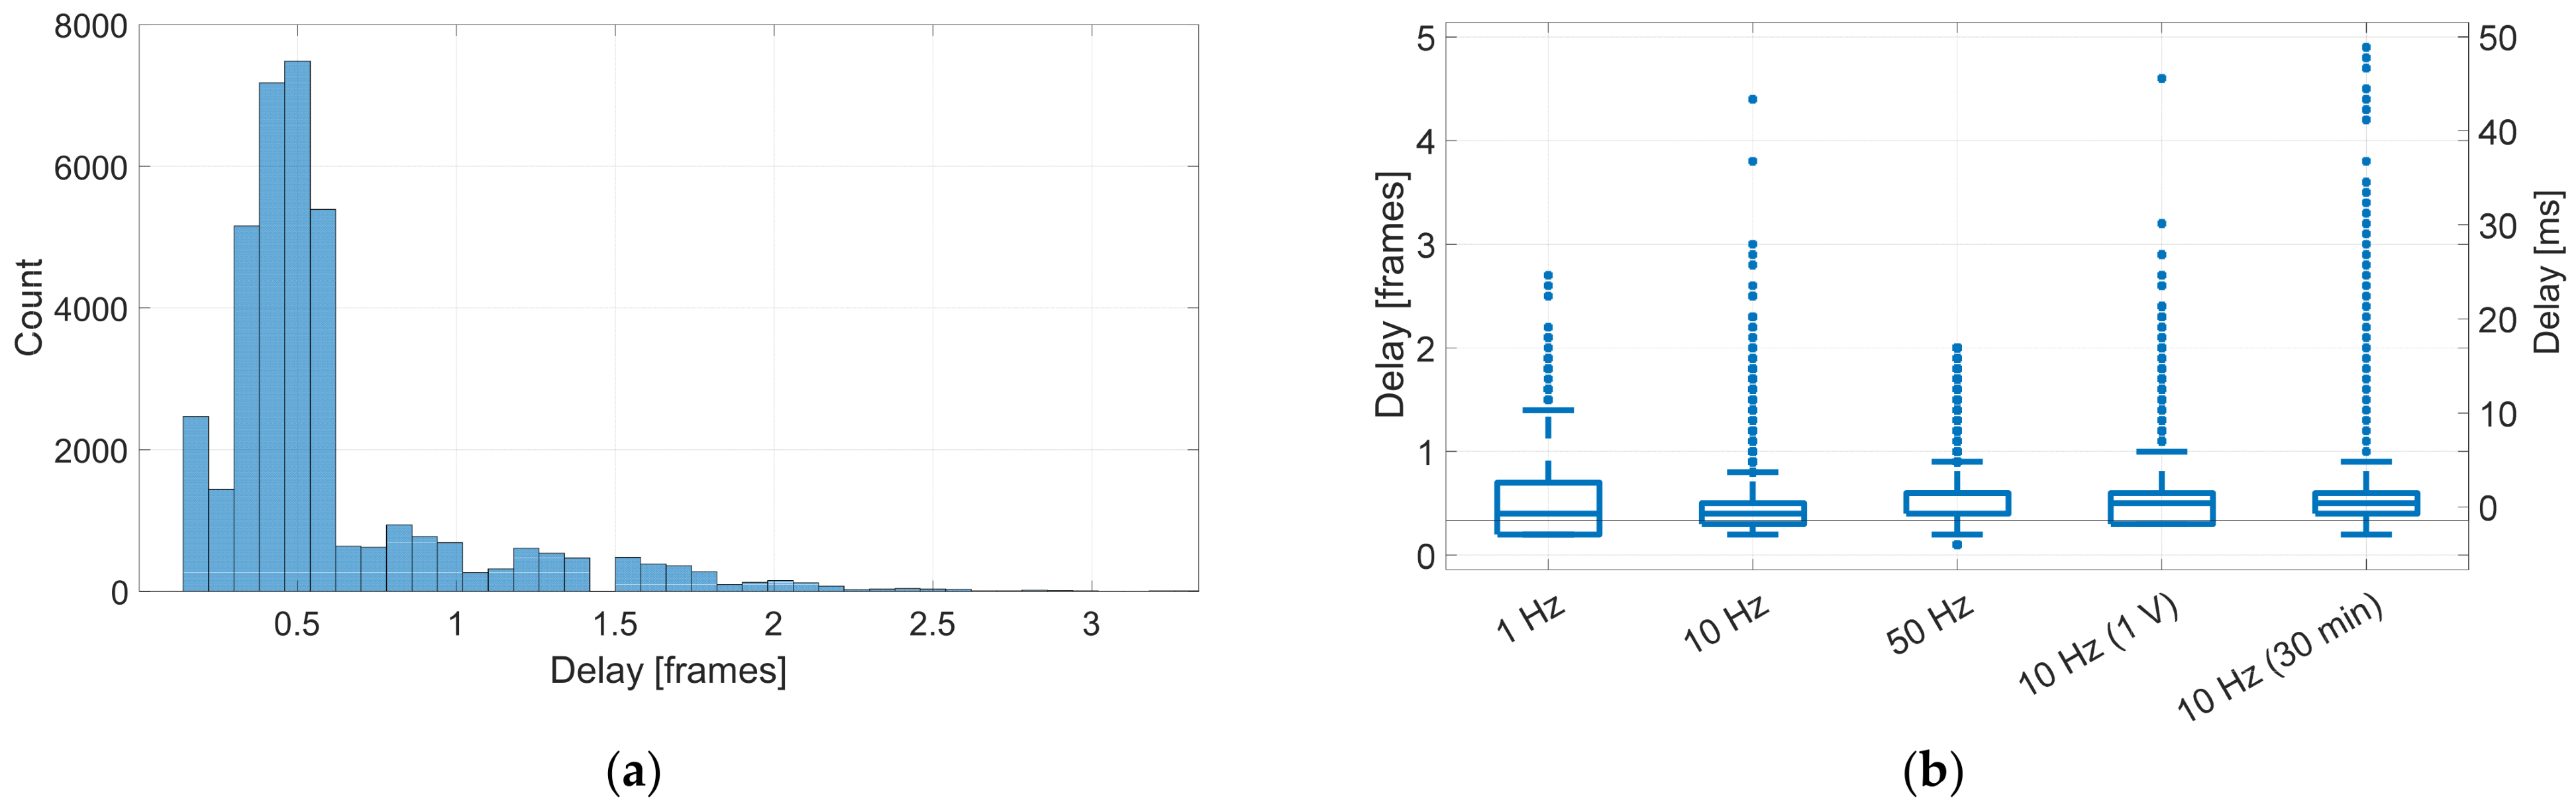
End-to-end system latency was quantified by measuring the temporal offset between reference and reconstructed waveforms at consistent signal features, specifically rising and falling edges of the applied square wave. Signal transitions were identified in both reference and reconstructed channels by applying upper and lower voltage thresholds. For each detected edge in the reference channel, the temporally nearest following edge in the reconstructed channel was identified, with frame delay computed as the difference in their timestamps. Rising and falling edges were processed independently to detect polarity-dependent asymmetry. For each trial, propagation delay was estimated as the mean time difference between corresponding edges across the duration of the acquisition. A sample count versus propagation delay dataset is plotted in Figure 7a. Figure 7b displays the distribution of frame delay across each square wave trial.
Figure 7.
(a) Thirty-minute trial frame delay histogram; (b) boxplot distribution of frame delay for each square wave trial.
Timing variability was characterized by analyzing the distribution of measured delays, including the standard deviation, 95% percentile variation across repeated edge detections, and missed edge percentage. This analysis captured both fixed latency contributions, such as analog-to-digital conversion and digital-to-analog update time, as well as variable contributions introduced by wireless transmission and packet handling. Latency measurements were repeated across each input frequency to ensure robustness against feature-detection artifacts and waveform-dependent effects.
Frame delay results are summarized in Table 3. The system typically achieved a frame delay of ~0.6 frames, with a frequency-dependent top 95% delay (P95). The apparent improvement in P95 delay at higher frequencies is likely a measurement artifact rather than a genuine reduction in variability. At 50 Hz, edges exceeding two frames (one signal period) would fall closer to the following reference edge. This sets an upper measurable bound for this test at two frames and causes a reported P95 to appear lower than it might otherwise be. Despite this, the 50 Hz trail results are consistent with lower-frequency tests, and the missed rate under 1% demonstrates that very few outliers were unaccounted for. The frame statistics were calculated assuming a 100 Hz frame rate. As such, millisecond values can be obtained by scaling these results by a factor of 10.
Table 3.
Frame delay statistics.
3.3. Long-Duration Stability and Drift
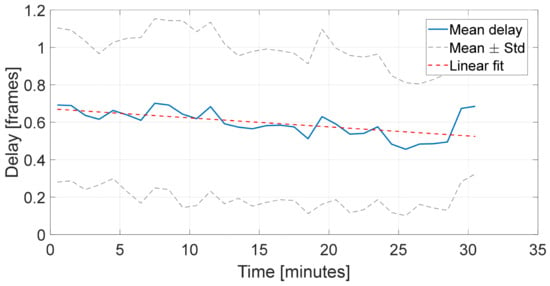
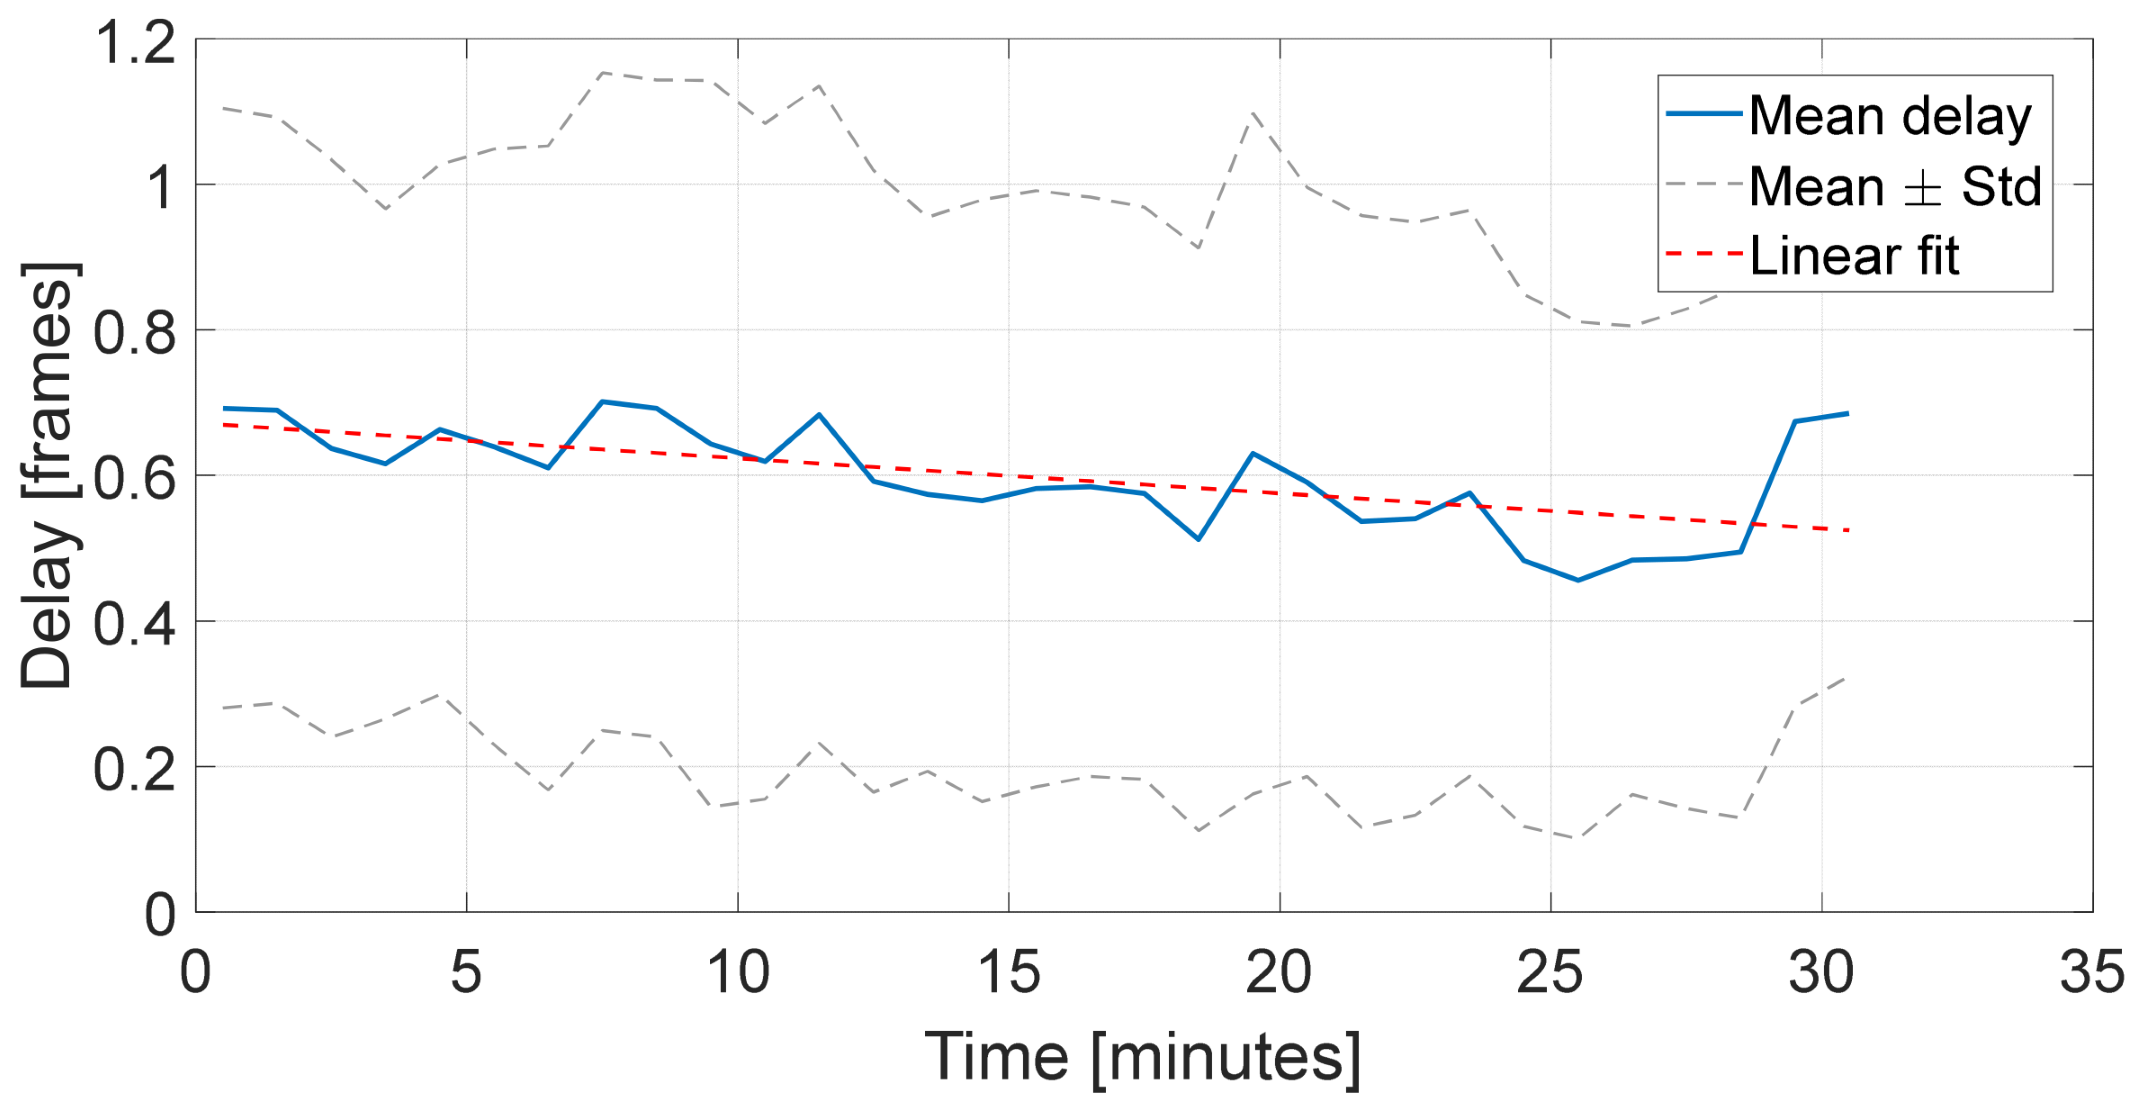
Long-duration timing stability was evaluated by operating the system continuously for 30 min while applying a 10 Hz square wave input. Propagation delay was measured at regular intervals to assess drift and identify any systematic changes in temporal alignment over time. A linear fit to the measured delay yields a drift rate of ~−0.004 frames/min (0.04 ms). This corresponds to an accumulation of under 0.1 frames over the test duration, which is near the system’s measurable resolution and negligible for practical use. This result can be seen in Figure 8, where the linear fit shows an average delay of ~0.7 to ~0.5 frames (7 to 5 ms) after 30 min.
Figure 8.
Signal delay over time.
3.4. Multi-Channel Behavior: Crosstalk
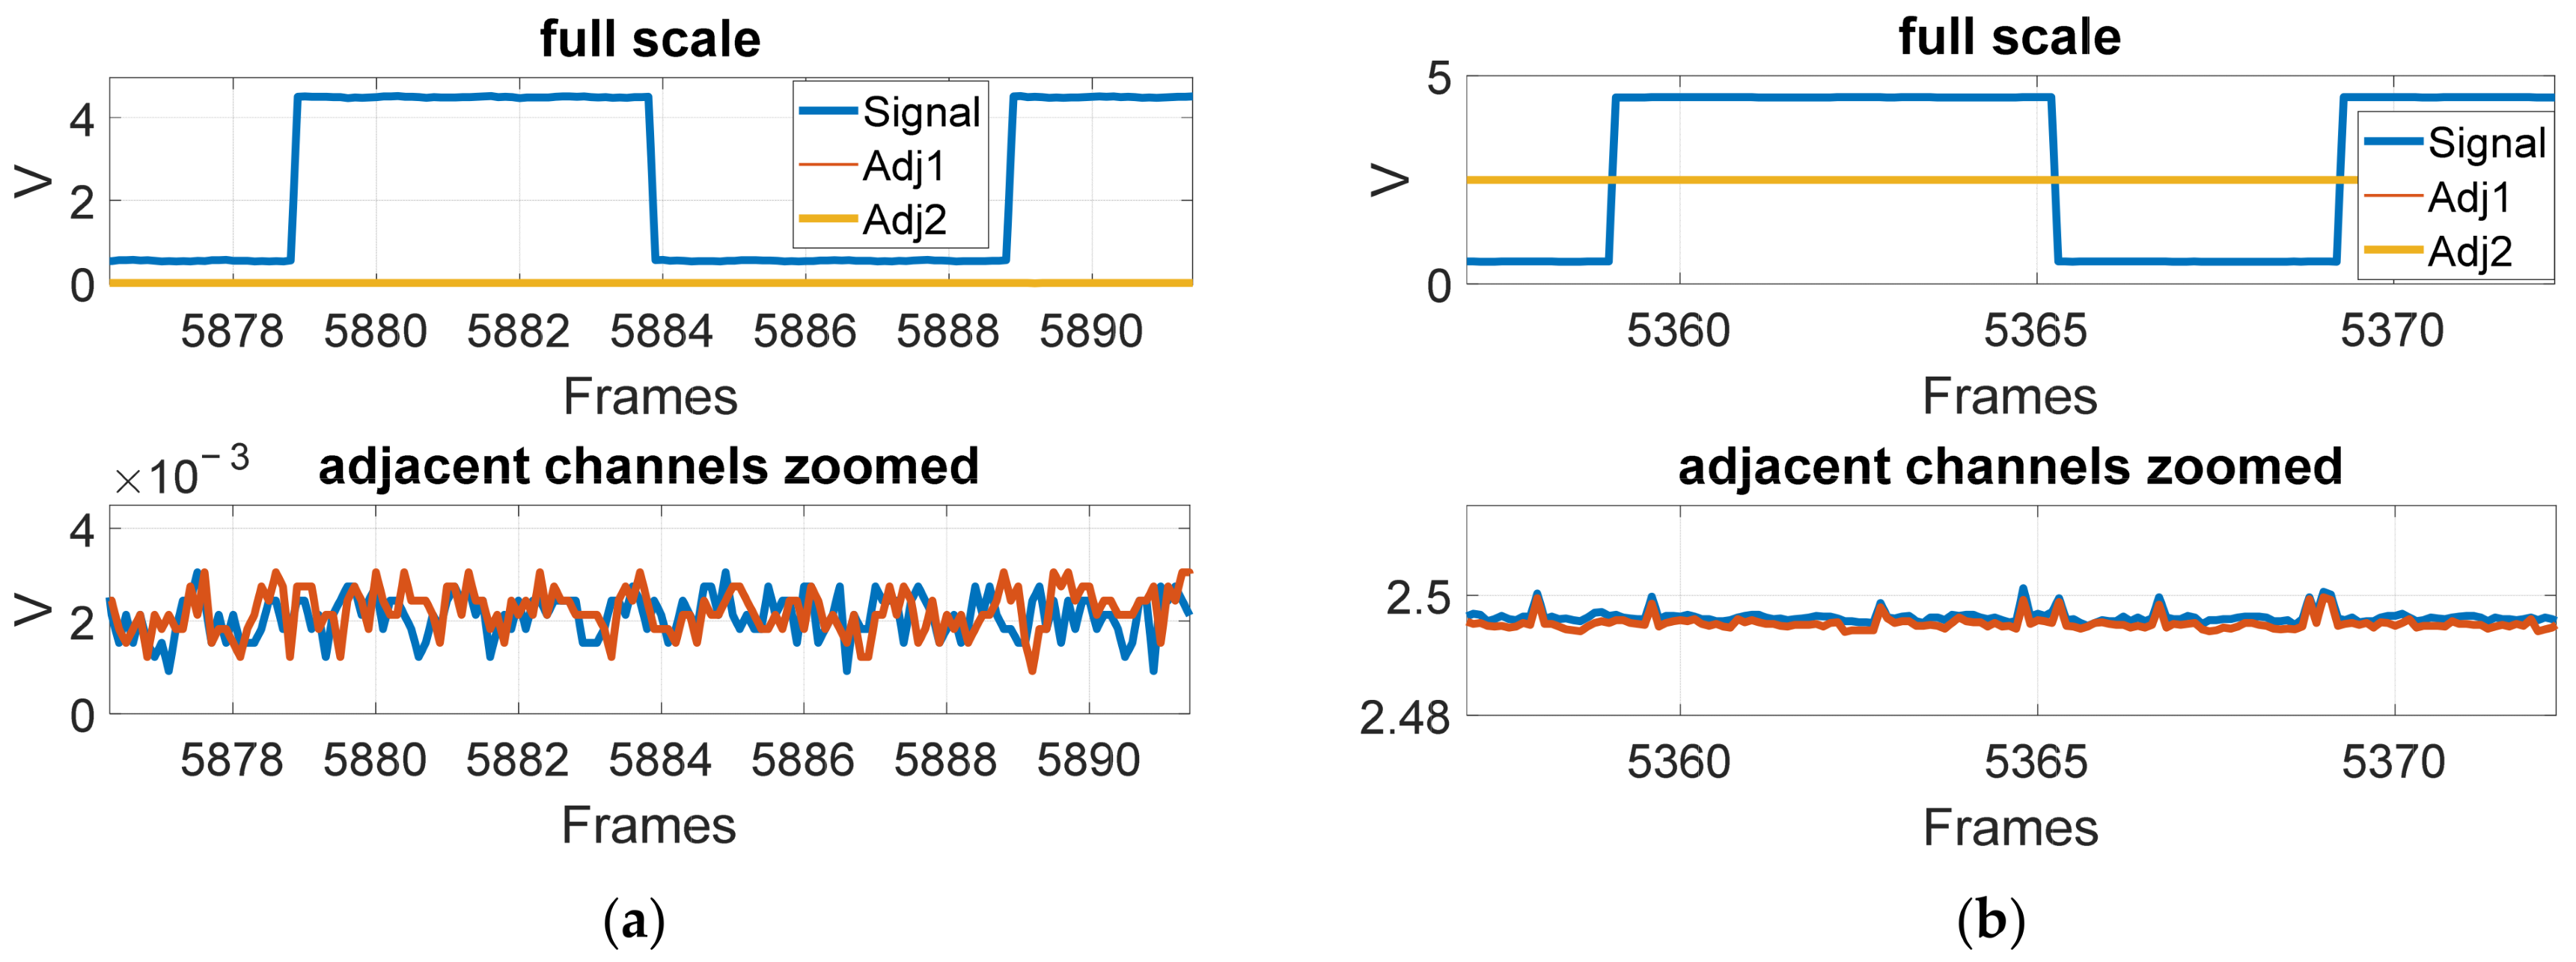
Multi-channel performance was evaluated to assess channel-to-channel consistency, timing skew, and electrical crosstalk. To measure crosstalk, a signal was applied to a single channel, while adjacent channels were held at a constant reference level. Any induced signal on inactive channels was measured at the mocap analog inputs.
Numeric metrics were evaluated by quantifying the presence of the driven signal frequency on adjacent idle channels using a lock-in estimator, isolating signal-frequency coupling from broadband noise contributions. Two adjacent channels were measured for the reference and test system, which are the channel number before the applied channel (adjacent 1) and the channel number after (adjacent 2), respectively.
Figure 9 illustrates crosstalk behavior for both the reference and DAC-reconstructed signal paths. In both cases, the full-scale view shows no meaningful coupling at the signal level. Zooming in on the idle channels, there was still no significant coupling of the input signals. Slightly higher noise spikes were present in the DAC path, though these spikes showed no significant correlation with the input signals. The resulting metrics for all single input crosstalk tests can be seen in Table 4.
Figure 9.
(a) Crosstalk on reference connection; (b) crosstalk on DAC reconstruction.
Table 4.
Crosstalk statistics.
The consistently higher crosstalk observed on adjacent 2 relative to adjacent 1 across trials is consistent with charge injection artifacts from multiplexed inputs of the Lock LabTM hardware, with the residual charge from a channel being carried to the input of the subsequent channel during the scan sequence. The results suggest this is an artifact of the Lock LabTM hardware and improved by the proposed system. Further analysis would be needed to verify the source of this behavior.
Further crosstalk analysis was performed by applying inputs to three adjacent channels simultaneously. To ensure harmonics and intermodulation (IM) products were isolated from the input frequencies, input waves of 7 Hz, 11 Hz, and 17 Hz were applied to separate channels. Input voltages followed previous conventions, 0.25 V to 2.25 V square and sine waves over a two-minute trial. Key metrics analyzed were maximum direct crosstalk (input frequency on alternate input) and IM product arising from the mixing between input frequencies (e.g., 11 Hz − 7 Hz = 4 Hz). Resulting worst-case metrics are summarized in Table 5. This simultaneous input revealed a worst-case crosstalk around −40 dB. Crosstalk metrics were consistently worse among higher-frequency DAC channels (all worst-case metrics resulted from 11 Hz coupling to 17 Hz).
Table 5.
Multi-input crosstalk statistics.
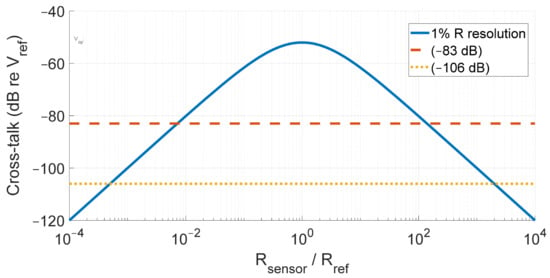
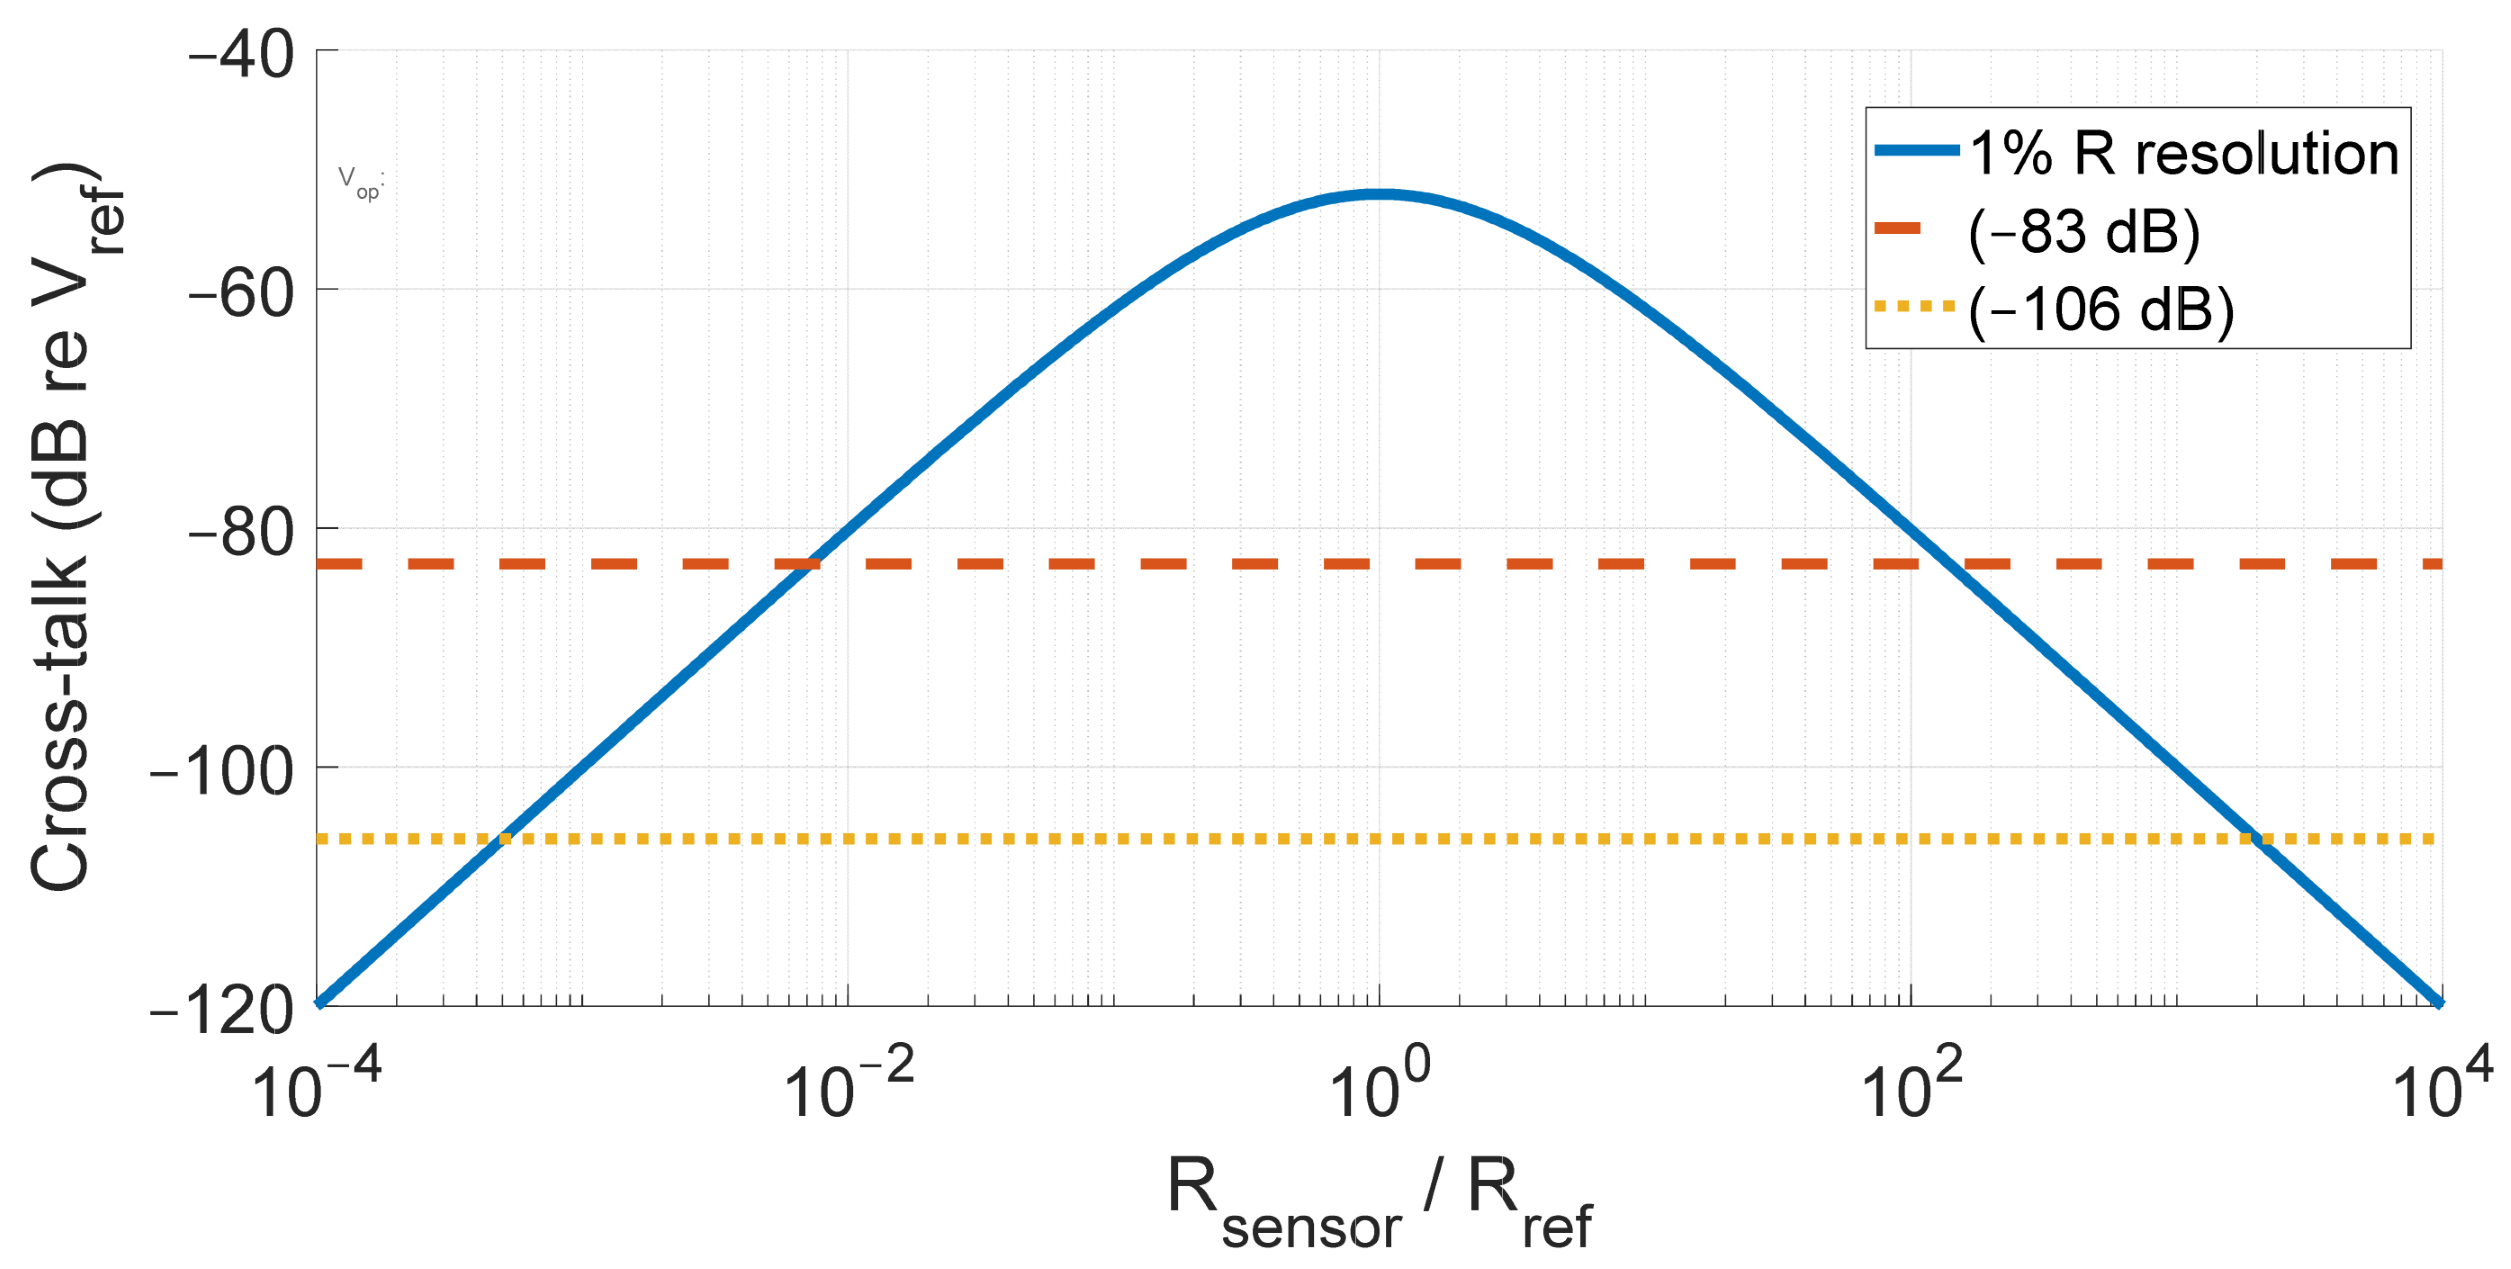
Crosstalk significance was analyzed by looking at effective sensor resolution. Due to the nonlinearity of the voltage divider to resistance conversion, resistor resolution is variable across the voltage range. Larger resistances (relative to the reference resistor) result in lower resistive resolution, forcing a limit on sensor resistance to achieve the desired resolution. Solving for this limit analytically yields Figure 10, assuming a desired 1% resistive resolution.
Figure 10.
Sensor resistance to reference resistance ratio limit for 1% resolution.
Figure 10 shows the 1% resistance resolution budget as a function of sensor resistance to reference resistor ratio, expressed in dB relative to supply voltage (dB re Vref) For this 1% resistance resolution, the result is a limit of ~140:1 ratio between the reference resistor and sensor resistance (the log scale symmetry means this ratio is the upper and lower limit ratio between resistive elements) under the −83 dB coupling observed in single-input trials. For the multi-channel input tests, the DAC reconstruction path does not meet this resolution requirement. It is important to note, however, that this limit is for 1% resolution on the sensor itself. A high-sensitivity sensor lowers the resistive resolution requirements. For a strain sensor with a sensitivity of 10, achieving 1% strain resolution requires only 10% resistance resolution, raising the effective noise budget by 20 dB.
3.5. Noise Characteristics
Output noise was characterized by applying a stable direct current input voltage to the wearable DAQ node and simultaneously recording both the direct and reconstructed signals. A mid-rail (for the wearable node) input of 1.25 V was selected to represent typical operating conditions, with 0.4 V and 2.1 V DC levels also examined. Similarly, a 2 Vp-p sine wave input was applied to each channel in order to demonstrate the pseudo-noise characteristics present in realistic data, such as quantization noise and timing jitter. The power spectral density of each channel was estimated using a Welch’s method with a Hann window, using segment of ~1 s in duration with 50% overlap, yielding a frequency resolution of ~1 Hz [37].
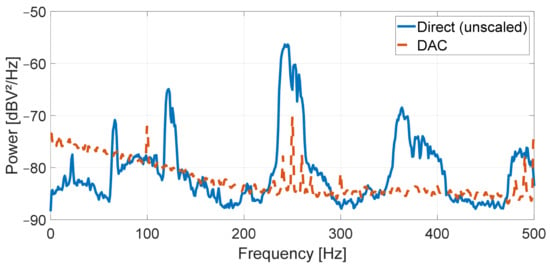
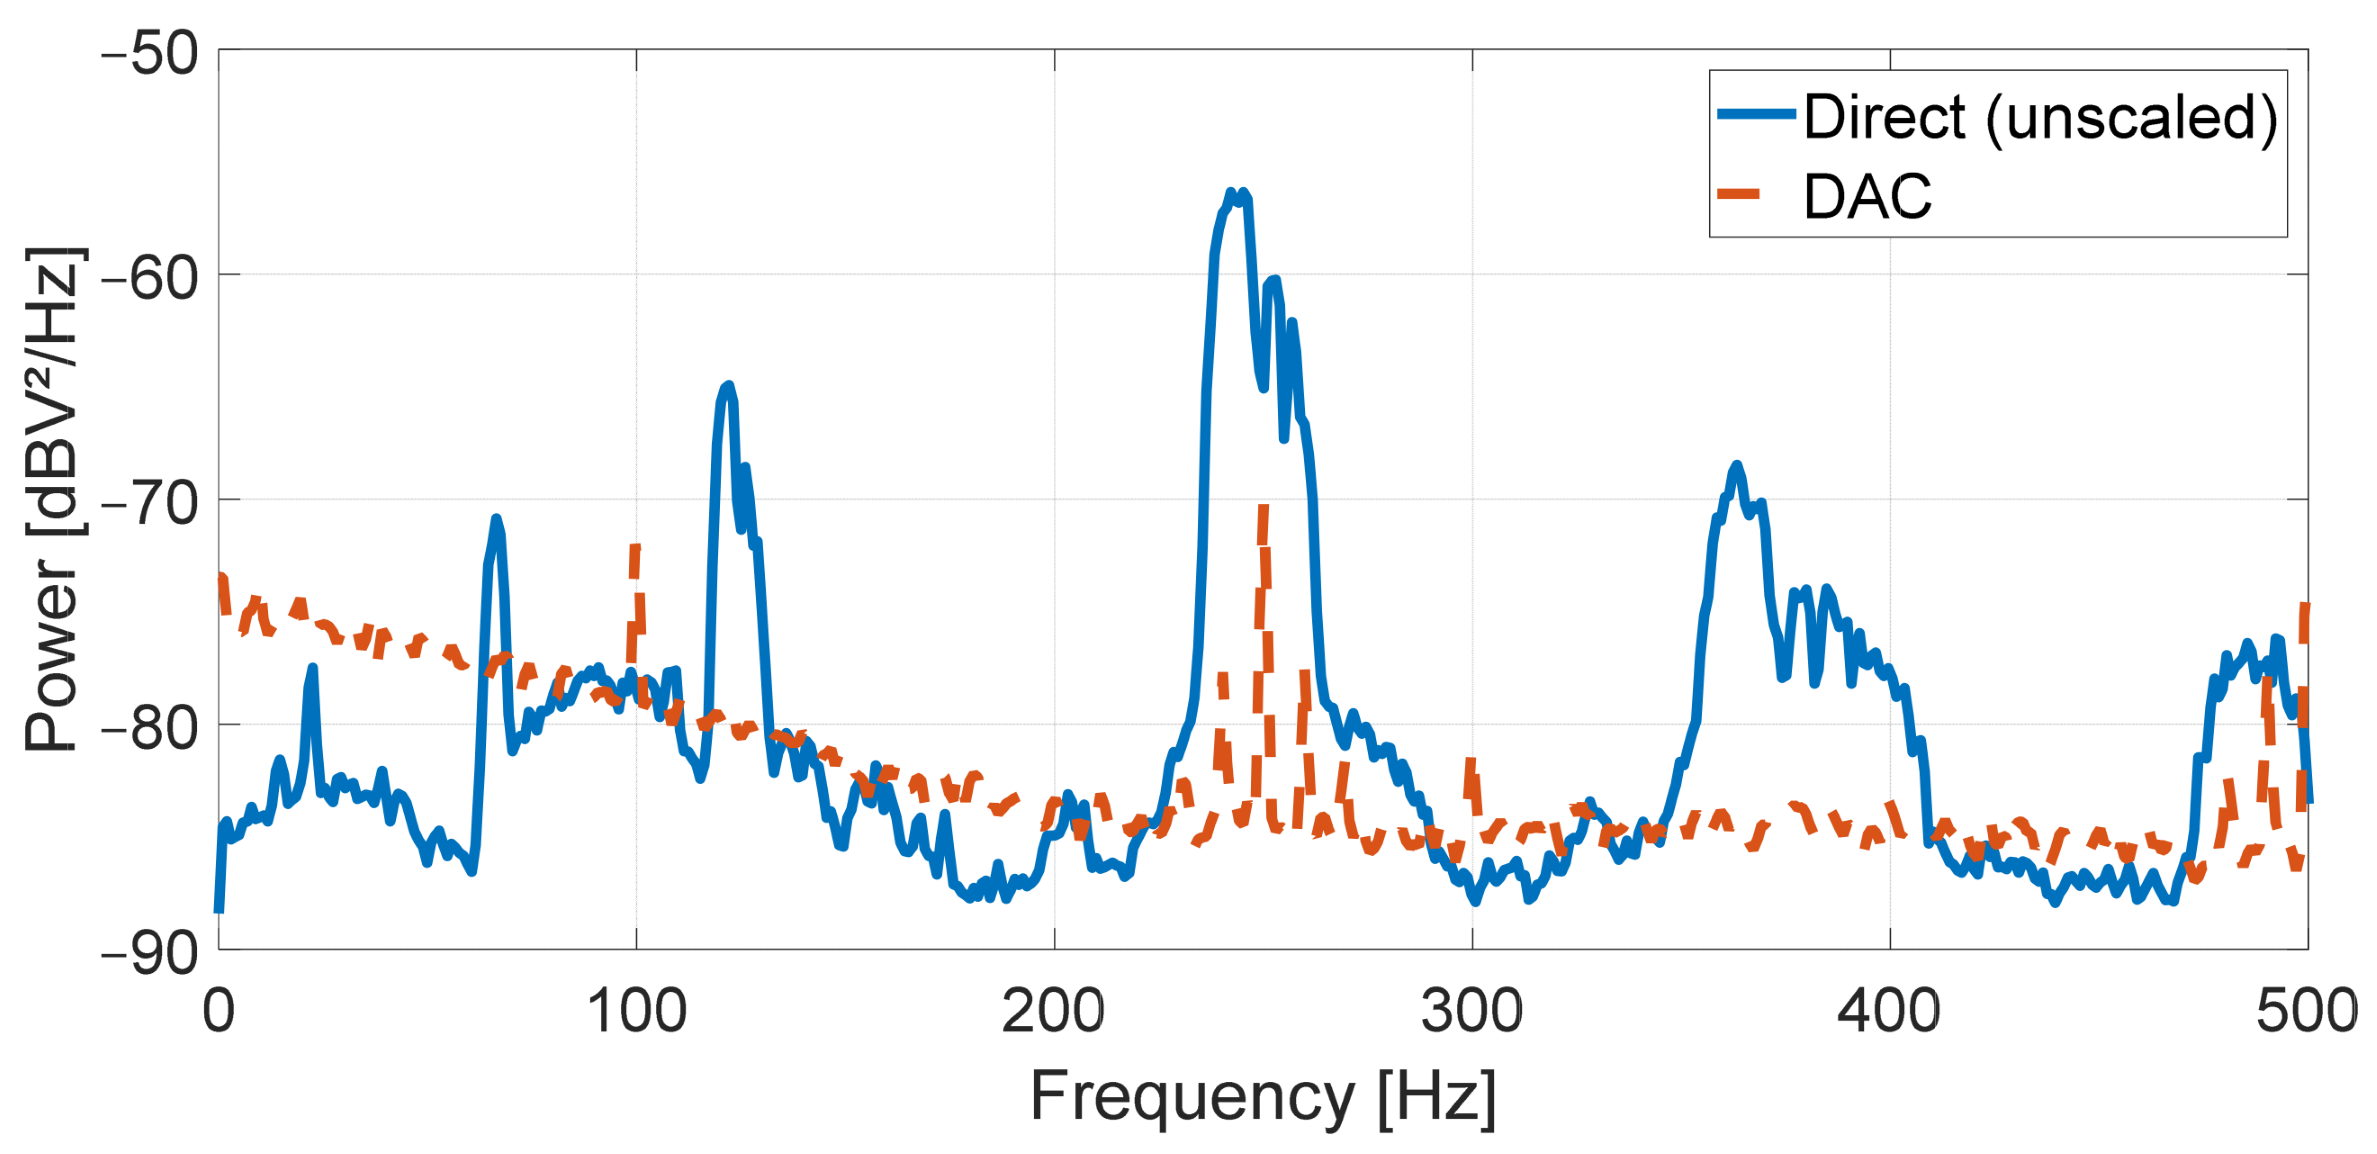
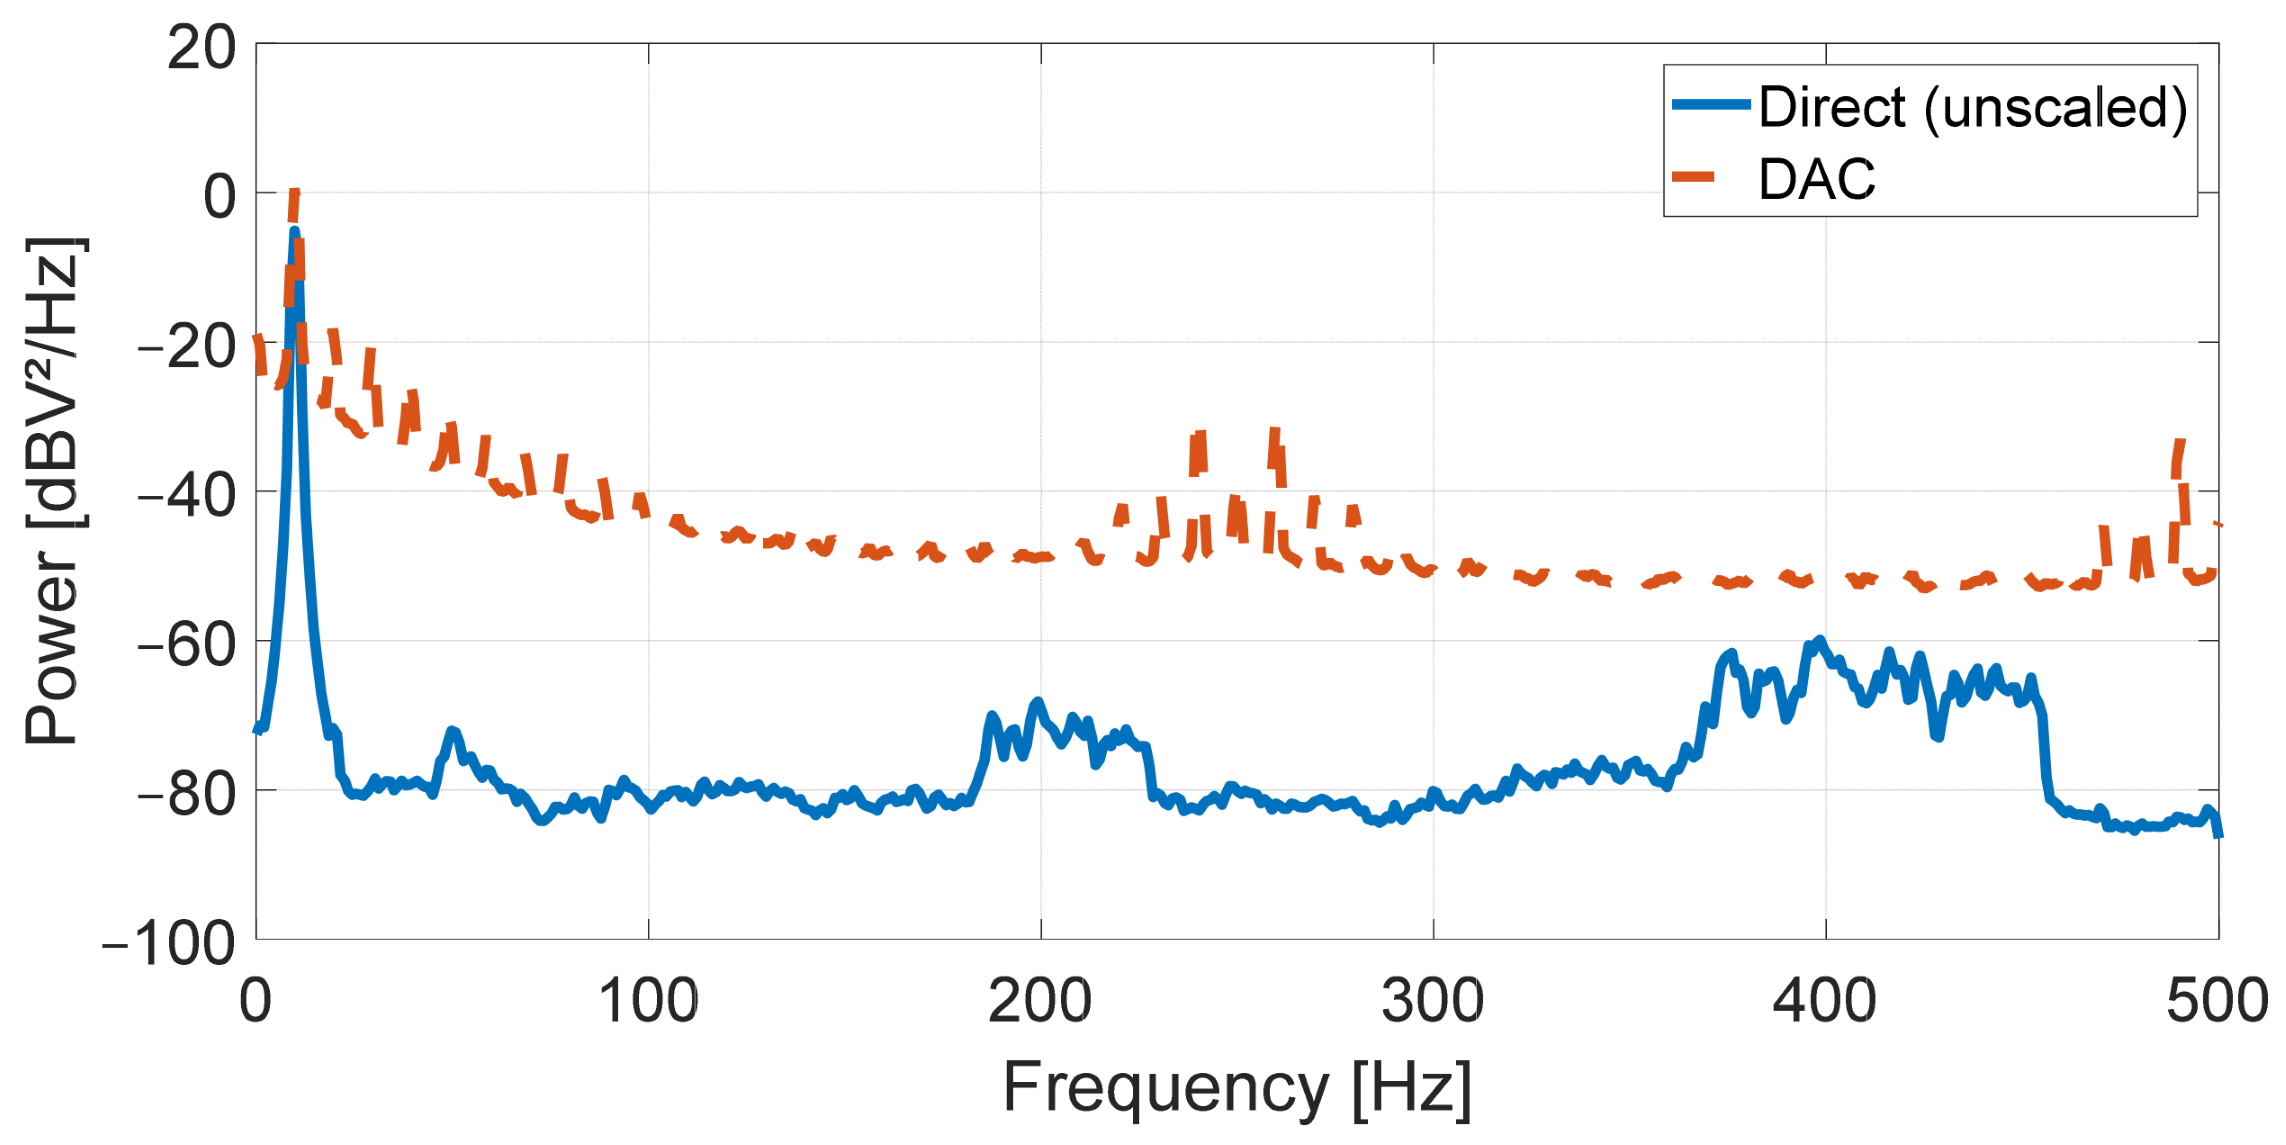
Figure 11 shows the resulting spectra for the direct and DAC-reconstructed channels under DC load. While the direct channel maintains a lower absolute floor of ~−85 dB, additional noise spikes were present. Particularly, these noise spikes are present around 60 Hz and even harmonic in nature, suggesting this noise is likely resulting from mains voltage, which were either artifacts from the power source in the signal generator/Lock LabTM or parasitic coupling from the longer wires used to connect to the Lock LabTM inputs acting similar to an antenna. These spikes were largely absent on the DAC channel, suggesting the DAC was either driving the voltage more effectively or the parasitic coupling was lessened by shorter driving connection length. These characteristics were consistent across voltage levels. Large narrow-band spikes in the DAC spectra were observed at 250 Hz and 100 Hz precisely across each trial, suggesting these are artifacts of the sampling or signal generation process rather than true noise. The sources of these various noise spikes have not been fully examined or verified.
Figure 11.
DC noise spectrum.
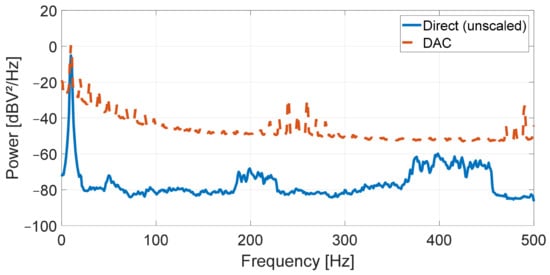
Figure 12 shows the spectra resulting from a 10 Hz sinusoidal input wave for the direct and DAC-reconstructed channels. This result shows a noise floor for the DAC channel of ~−50 dB and ~−85 dB for the direct channel. The higher noise floor compared to DC conditions and the more prominent harmonics are attributed to quantization and timing jitter introduced by the system.
Figure 12.
Ten hertz alternating current (AC) noise spectrum.
3.6. Custom Sensor Integration
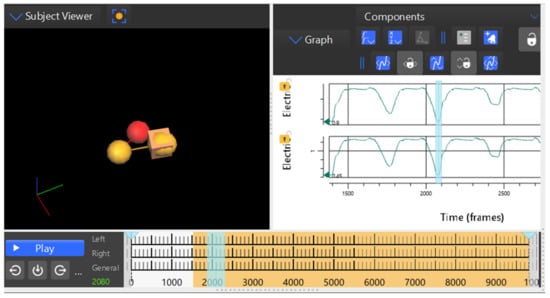
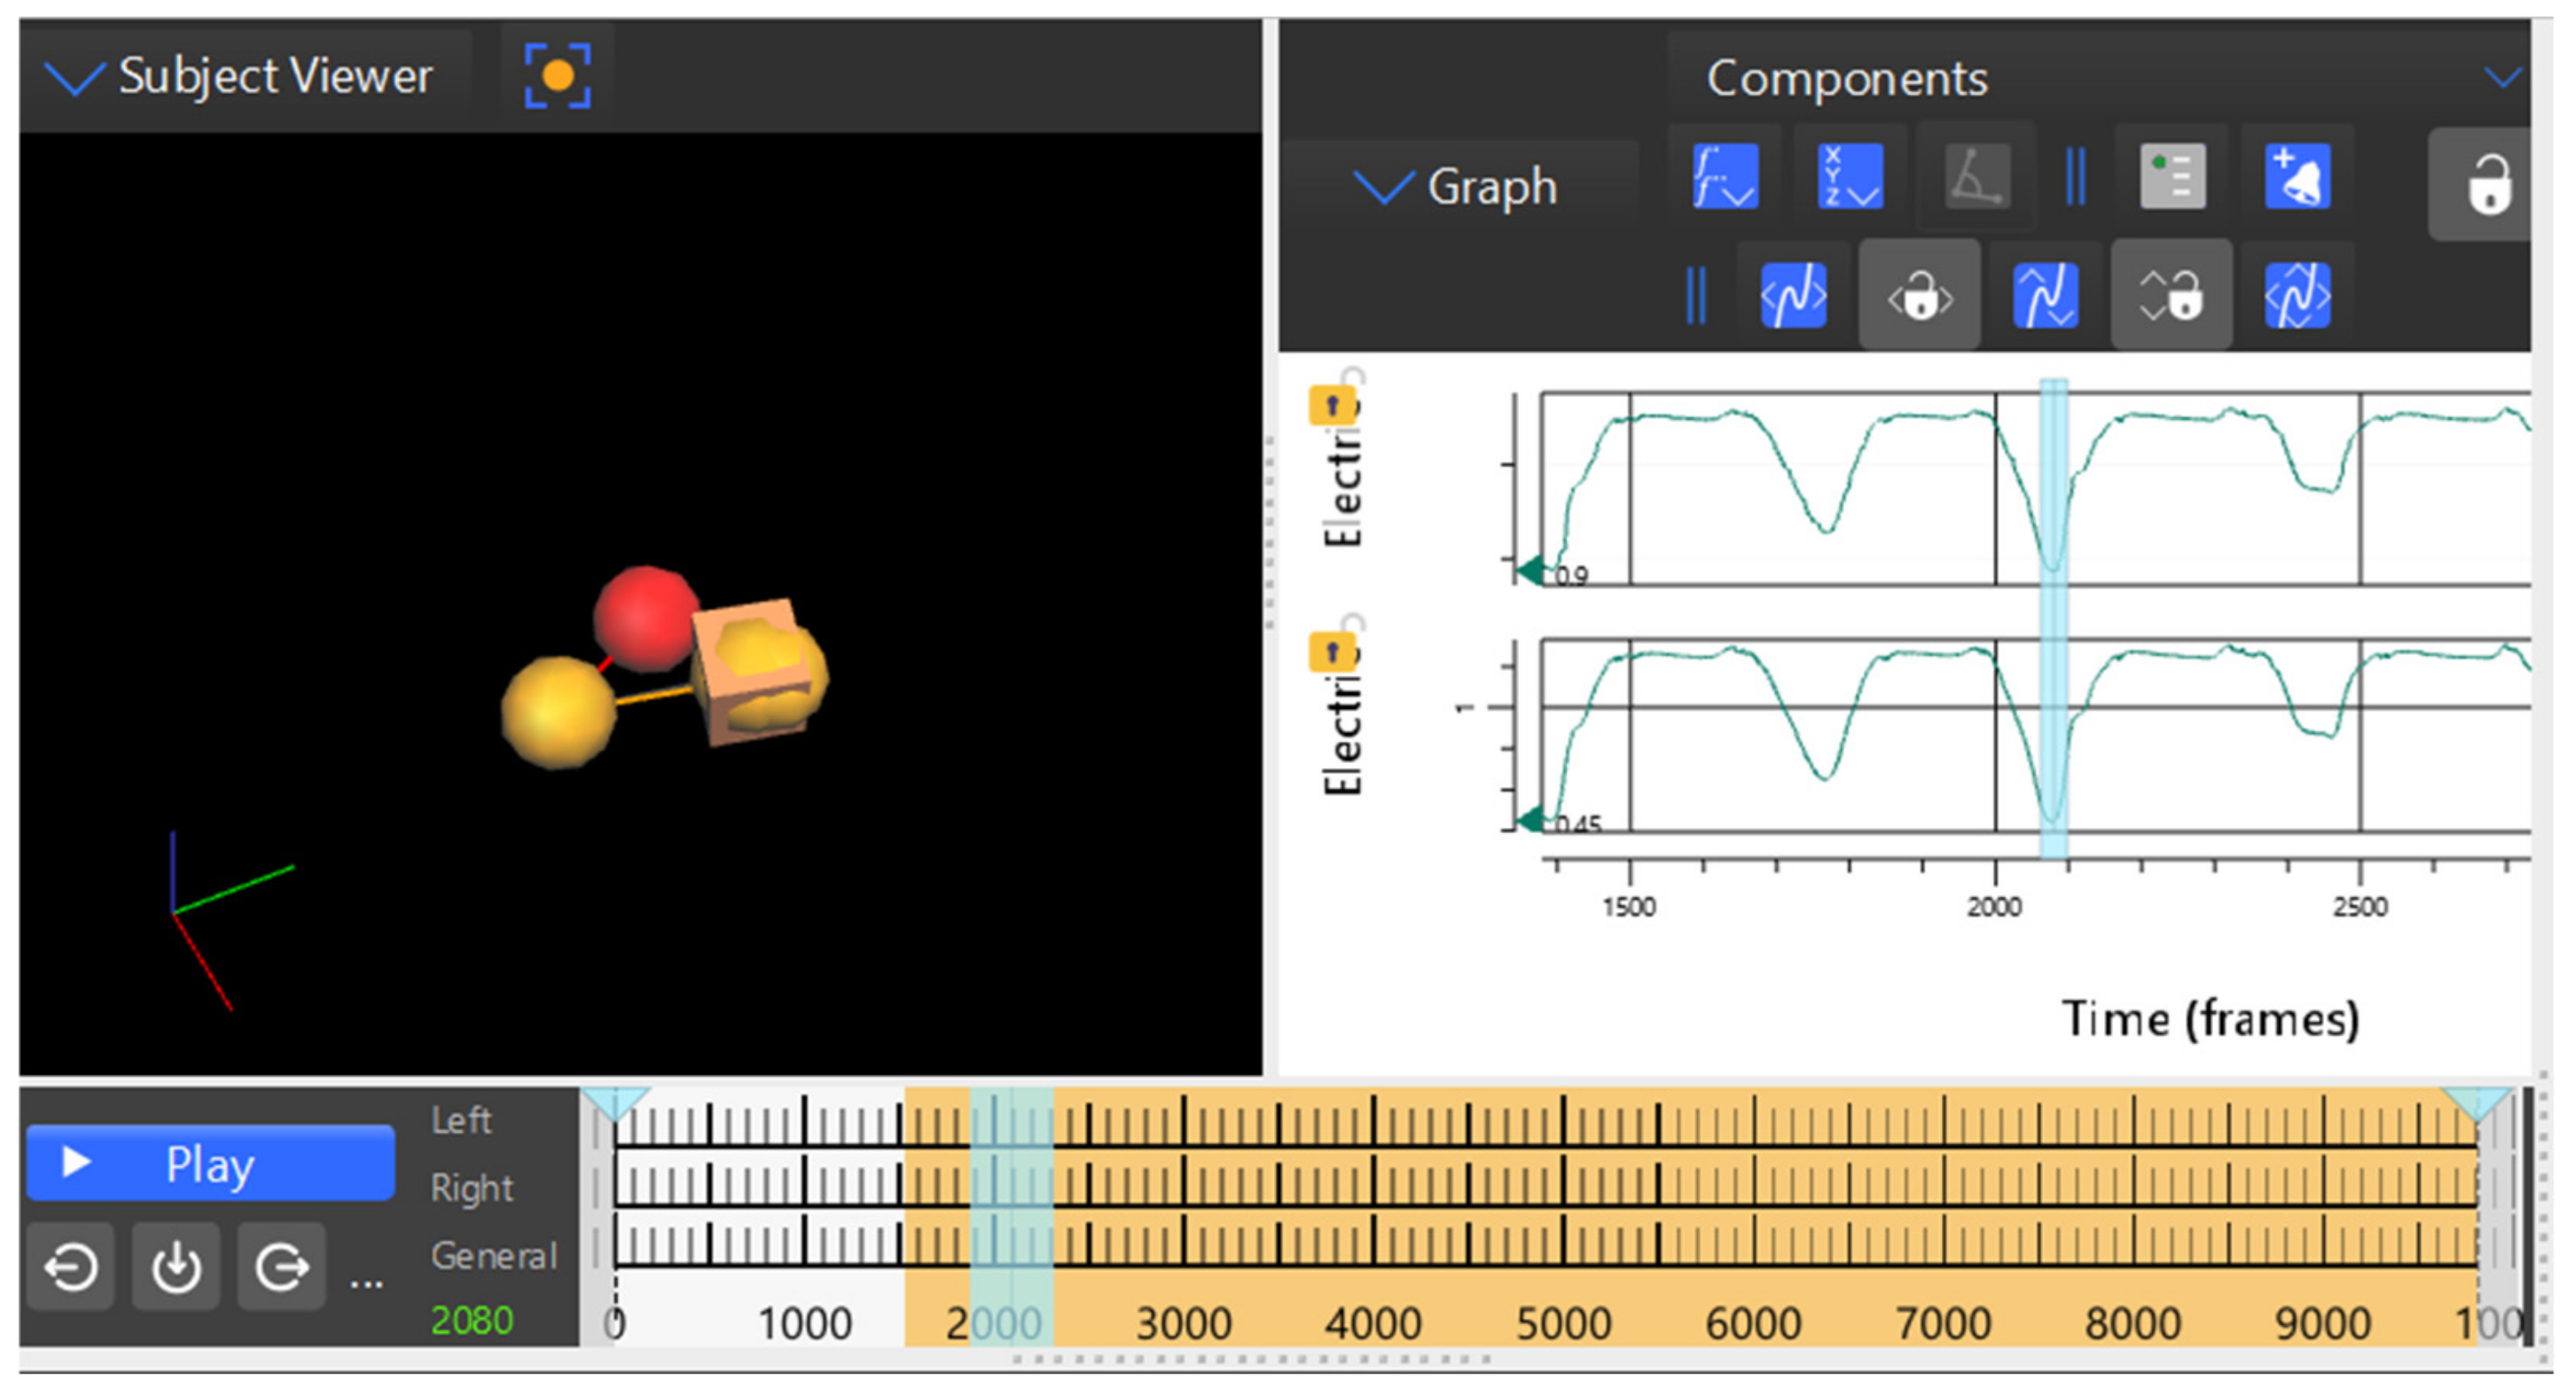
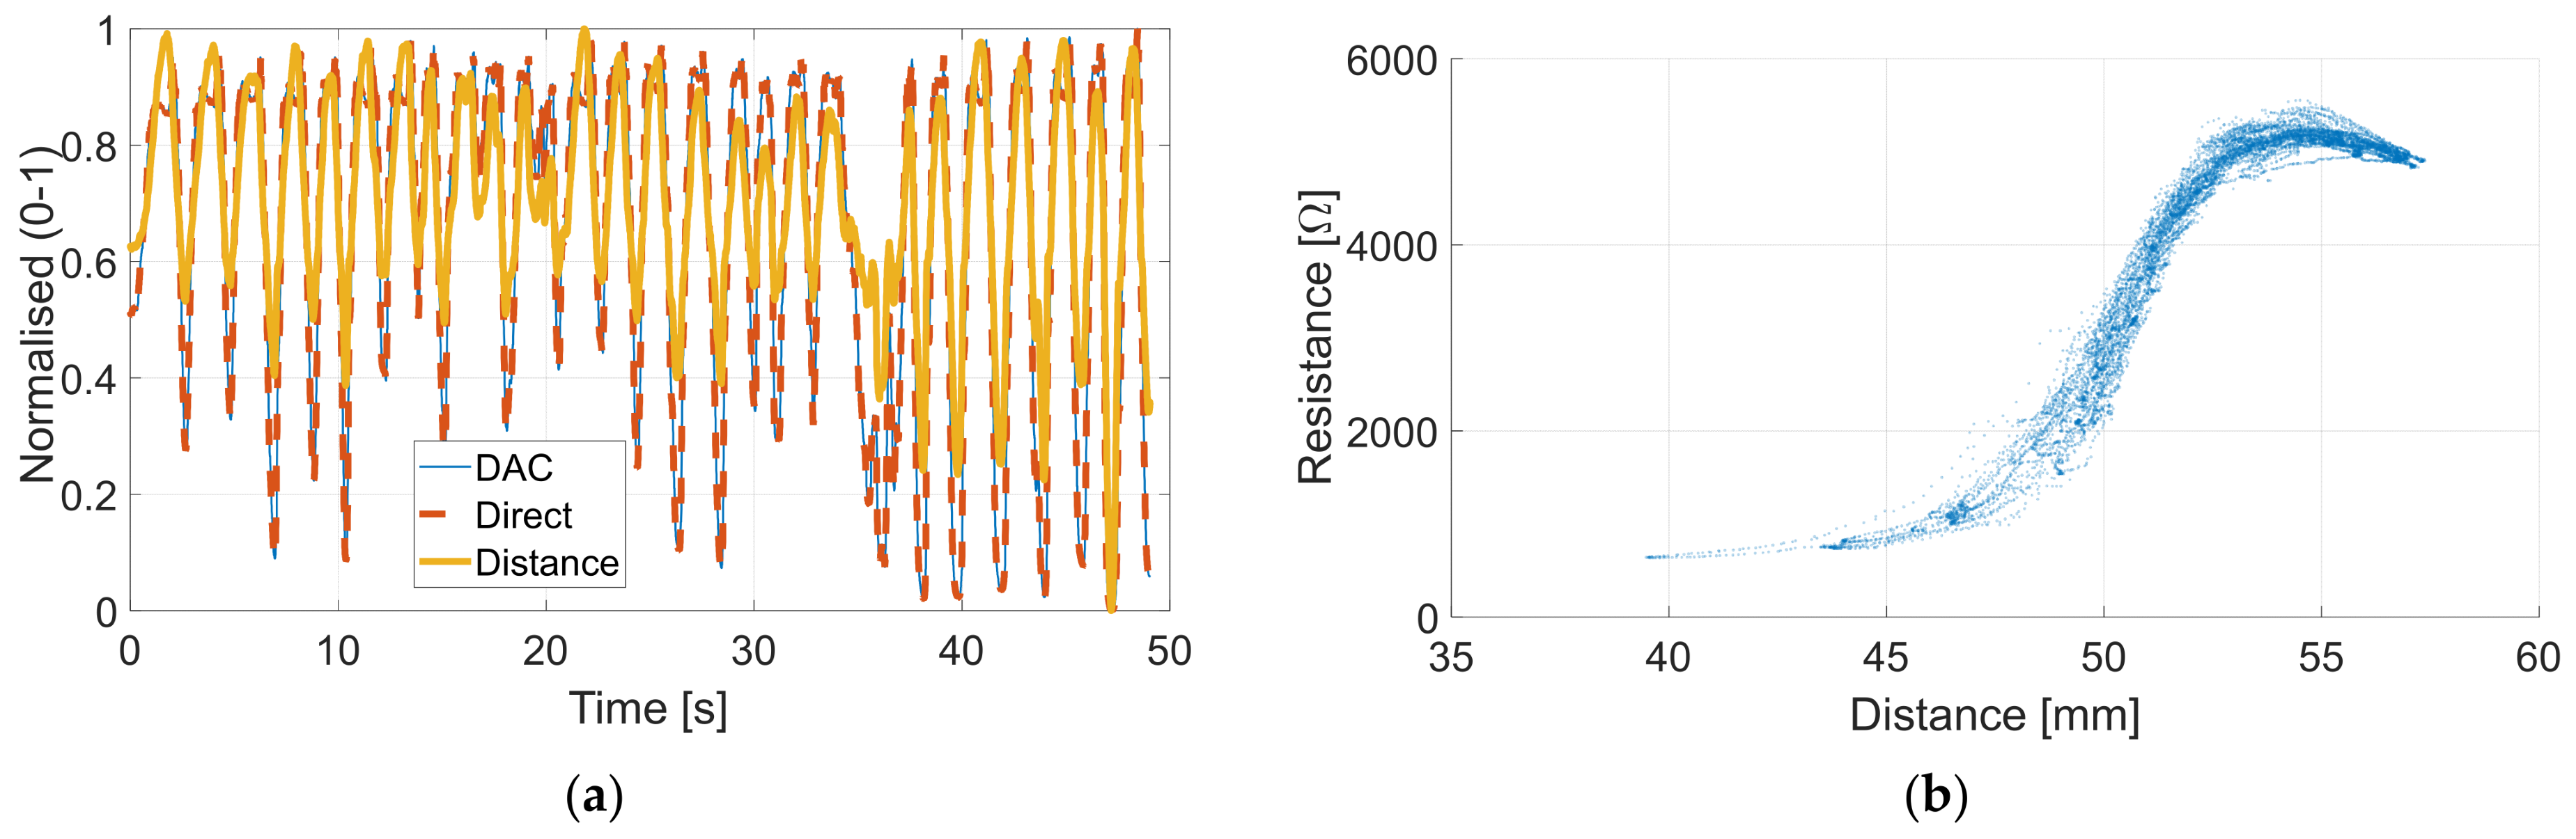
To demonstrate real-world utilization with mocap data, a Motion Tape skin-strain sensor was connected to the wearable node. As a resistive sensor, one end of the sensor was connected to ground of the wearable node, and the other end was connected to the ADC input channel, thus completing the voltage divider circuit. Leads were then tied to these inputs and similarly connected to the Lock LabTM inputs. Retroreflective mocap markers were placed at the edge of the Motion Tape, such that the distance between each marker could be calculated and thus strain could be determined as a function of resistance. Simultaneous optical motion capture tracking and voltage outputs could then be examined in real time or post-experiment. The mocap frame rate was increased to 200 Hz for this test, in order to obtain higher temporal resolution in cross-correlation calculations. A screen capture of the resulting output can be seen in Figure 13.
Figure 13.
Vicon Nexus software visualization during Motion Tape testing. DAC-reconstructed path is shown as the upper signal in the left pane and the direct reference path as the lower signal.
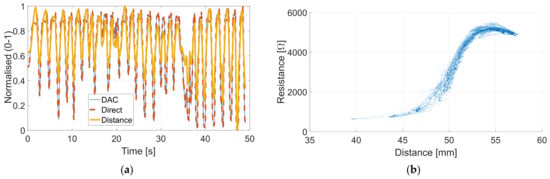
During post-processing, separation distance between the markers at opposite ends of the Motion Tape were calculated using their x, y, and z coordinates. Similarly, resistance values of the sensor could be calculated from the voltages collected. This allowed for correlation analysis between the calculated linear strains from mocap versus Motion Tape outputs [38]. Figure 14a shows an overlay of the Motion Tape signals, as well as the calculated linear strains, during a test when Motion Tape was manually strained in cyclic tension to different, random peak strains. Figure 14b plots the corresponding Motion Tape resistance versus distance between opposite-end retroreflective markers at the end of the sensor. Overall, cross-correlation calculations between strain and voltage measurements indicated a 10 ms lag from the direct line and 15 ms lag in the reconstructed path, with a limited resolution of 5 ms due to the 200 Hz frame rate of the mocap data. This ~5 ms delay between the reference and reconstructed paths is consistent with the results in Section 3.2, while the 10 ms lag from the reference is potentially attributed to mechanical properties of the material and testing methodology [39].
Figure 14.
(a) Calculated resistance and distance over time, normalized from 0 to 1; (b) resistance versus distance using DAC-reconstructed values.
4. Discussion
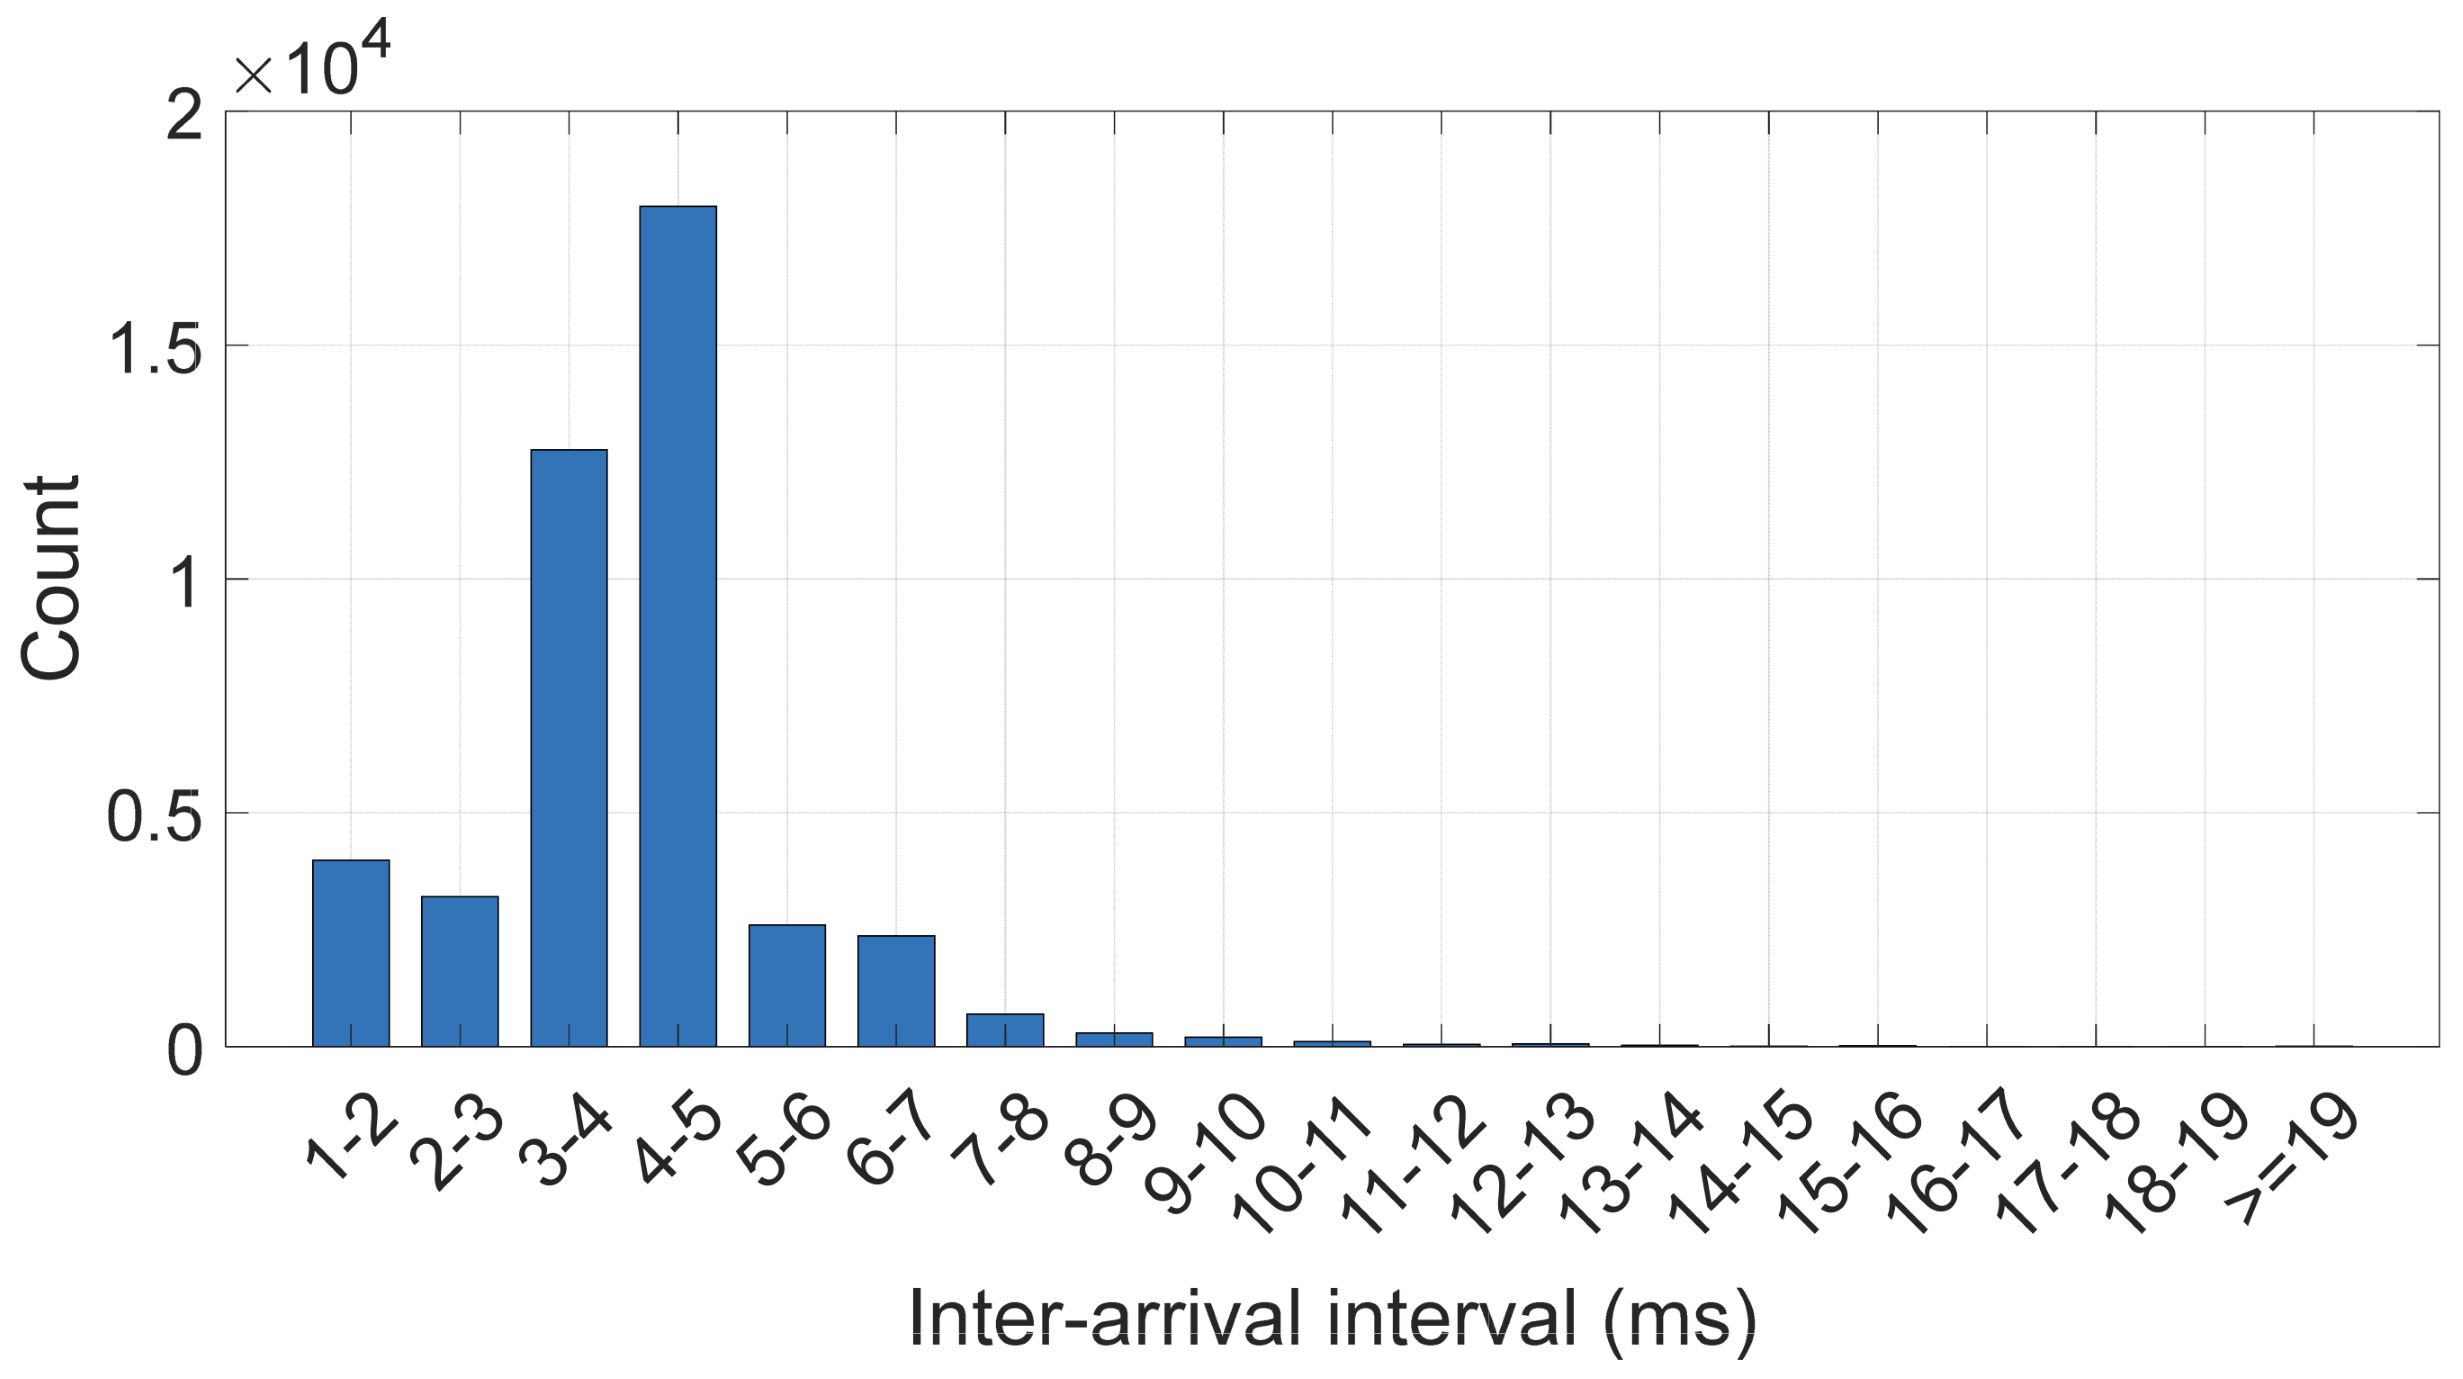
The experimental results demonstrated that the proposed wireless data acquisition and synchronization system was capable of reconstructing analog sensor signals with sufficient fidelity and timing consistency for integration with a commercial optical motion capture platform. Across all trials, the system achieved a mean end-to-end frame delay of approximately 0.6 frames (6 ms), with a 95th percentile delay below 1.5 frames, confirming that the wireless reconstruction path introduces a small and bounded latency suitable for mocap-based time synchronization. This delay was consistent with results found with ESP-NOW field measurements reported by Mutiara et al. [40]. Inter-arrival timing was logged directly on the receiver node, confirming a mean packet interval of 4.05 ms. This is consistent with the programmed 250 Hz sampling rate. The timing histogram is available in Appendix A.3 (Figure A5). A P95 inter-arrival interval of 7 ms was measured, indicating 95% of packets arrived within 3 ms of their nominal schedule. Given the mean 6 ms offset with a standard deviation of approximately 4 ms, post-processing compensation by applying a fixed ms timestamp offset results in 68% of samples aligning within 4 ms and 95% of samples aligning within 8 ms. By comparison, trigger-based synchronization approaches such as that presented by Kugler et al. [20] achieve trigger delays of approximately 2 ms, representing better raw timing performance but requiring additional hardware connections and producing separate data streams. Software approaches such as those presented by Wange et al. [21] and Li et al. [22] achieve sub-millisecond alignment but are constrained to programmable peer devices and are not directly applicable to closed commercial platforms. The proposed system trades raw timing precision for a simplified workflow integration, capturing sensor and kinematic data within a single acquisition stream.
A key advantage of the proposed architecture was its long-term stability, demonstrating a timing drift rate of ~0.004 frames/min, corresponding to a total accumulation of under 0.1 frames over a 20 min run. This effect is negligible in practical applications. This consistent and characterizable frame delay also allows for reliable compensation in post-processing for conditions which require exceptional synchronization. The system’s timing performance therefore aligns well with the requirements of wearable sensor validation and multimodal movement analysis.
Voltage reconstruction accuracy was evaluated by comparing steady-state plateau levels between direct and reconstructed signals. The system exhibited a gain of ~0.98 across tested frequencies, with high and low plateau errors on the order of 10 to 30 mV. This systematic gain compression was consistent with the supply voltage variation at the USB input, affecting the DAC output headroom. This error could likely be mitigated through a more regulated supply or software calibration.
Adjacent channel isolation was evaluated using a lock-in estimator at the driven signal frequency. Crosstalk was notably higher on channels sequentially after input signals (adjacent 2) compared to channels prior to the input signal (adjacent 1), suggesting charge injection as a possible mechanism. This trend was consistent across reference and reconstructed paths. Regardless, crosstalk was negligible in both cases with signal levels around −110 dB on adjacent 1 and −84 dB on adjacent 2. The reconstructed channel produced higher crosstalk on adjacent 1, as much as 10 dB higher, but still it remained below −100 dB. Crosstalk under simultaneous input was significantly higher, with a worst-case crosstalk of approximately −43 dB. While this level of coupling imposes constraints on resistive resolution for low-sensitivity sensors, the resolution budged remains adequate for high-sensitivity transducers such as piezoresistive strain sensors.
For DC inputs, the reconstructed path showed a ~10 dB elevated noise floor at low frequencies, and the absolute noise floor leveled out similar to the reference path at around 200 Hz. Notably, wide-band spikes were much more present in the reference path around 60 Hz harmonics, suggesting increased coupling to mains voltage, possibly resulting from the wire lengths used in testing providing an antenna-like structure. The reconstructed path showed distinct narrow-band spikes at 100 Hz and 250 Hz, with consistency and extremely narrow bands suggesting these spikes resulted from aliasing or other systematic artifacts rather than noise introduced from the system. With a continuous sinusoidal input, the noise floor on the reconstructed path was ~30 dB higher compared to the reference at −50 dB. In addition, harmonics were clearly present in the reconstructed path, which were well suppressed in the reference connection. For typical wearable sensing signal amplitudes, this noise floor remained well below signal level and did not meaningfully limit measurement fidelity.
A complete end-to-end workflow was demonstrated using a custom piezoresistive skin-strain sensor used alongside optical motion capture markers, providing direct correlation between wireless sensor measurements and simultaneously acquired kinematic data. Both acquisition paths showed high correlation with marker-derived distance, with an R value of 0.9161 for the DAC-reconstructed path and 0.9184 for the reference path when comparing distance and sensor resistance. These R values demonstrated that the wireless path introduced no meaningful degradation. This workflow also presented another noise comparison, as both systems utilized the same reference source when connected in this configuration. Under these conditions the DAC maintained a slightly elevated noise floor at ~−67 dB (i.e., 3 dB higher than the reference path).
The use of CoTS components and a modular hardware architecture contributed to the system’s practicality and reproducibility. By leveraging a widely supported microcontroller platform and CoTS analog components, the system can be readily adapted to alternative sensing modalities, channel counts, or sampling requirements. The separation of wearable acquisition and receiver-side reconstruction allowed the wearable node to remain compact and lightweight while preserving compatibility with existing optical motion capture workflows.
Several limitations of the current implementation should be noted. The observed gain compression of 2% and elevated noise floor, while accepted for the intended application, may require calibration for sensing modalities demanding higher voltage precision. The system’s end-to-end delay of approximately 6 ms, with a post-compensation residual standard deviation of 4 ms, limits applicability to signals with frequency content below 50 Hz. This is consistent with most biomechanical and wearable sensing applications but potentially limiting for higher-frequency phenomena. The current prototype implements a single eight-channel receiver node, corresponding to one input connector block of the Lock LabTM system. Applications requiring more than eight simultaneous channels would require addition receiver nodes paired with additional wearable nodes. The analog input stage is specifically designed for resistive sensors via a voltage divider input. Alternative sensor modalities would require modification to the input stage. Under simultaneous multi-channel DAC operation, inter-channel crosstalk increases to ~−43 dB, which may constrain resistive resolution. Surface temperature measurements identified the voltage regulator as the warmest component, at ~45 °C under continuous operation, slightly exceeding the IEC 60601-1 continuous skin contact threshold of 43 °C. The microcontroller reported a die temperature of 47 °C after an extended trial, though this value is not representative of the surface temperature. The reported die temperature should be considered the upper bound for the device. The system is designed for commercial LiPo batteries, which typically provide on-board battery protection. Battery and thermal concerns are not expected to severely limit the usage of the system but should be considered in human subject studies. Separation between the exposed electronics and skin is recommended for extended wearable applications. Finally, all validation was performed under benchtop conditions in a university laboratory environment with high ambient Wi-Fi interference. No packet losses were measured within the lab room, far exceeding the setup range of the motion capture system itself.
While not explored in this study, the wearable node also housed a six-axis IMU. Using a similar process to analog reconstruction, the 16-bit acceleration values can be mapped to voltage levels and recorded in the same manner. This combination allows for a mix of voltage inputs and acceleration values to be tracked simultaneously, with a limitation of eight output channels per receiver node due to available outputs on the DAC. The hardware could be modified to include other peripheral devices as desired, with values mapped to voltage levels on the receiver node and re-calculated in post-processing.
5. Conclusions
This work presented a wireless data acquisition and synchronization platform designed to integrate custom wearable sensors and IoT devices with commercial optical motion capture systems. By combining a compact wearable data acquisition node with a receiver-side digital-to-analog reconstruction architecture, the system enabled synchronized recording of analog sensor data alongside mocap measurements while preserving full subject mobility by eliminating the physical constraints of wired sensor configurations. This study entailed a detailed characterization of system performance. Experimental validation demonstrated a mean end-to-end frame delay of ~0.6 frames with a drift rate below 0.004 frame/min, thereby confirming stable and predictable timing behavior suitable for mocap-based synchronization. Voltage reconstruction accuracy was within 30 mV across the output range, with systematic gain compression attributable to supply voltage variation rather than the fundamental limitations of the reconstruction architecture. Adjacent channel crosstalk was below −83 dB on DAC output channels across all tested frequencies, and output noise remained well below signal levels for typical wearable sensing applications. Overall, the architecture prioritized timing consistency, reproducibility, and ease of integration, making it well suited for wearable sensor validation and multimodal human movement research. The use of commercially available components and flexible firmware architecture allowed the system to be readily adapted to new sensing modalities and experimental requirements. As such, the proposed platform provides a practical and extensible foundation for future studies requiring synchronized wearable sensing and optical motion capture data.
Supplementary Materials
All related files for hardware, firmware, and validation can be found at the corresponding GitHub repository. (https://github.com/TPierceUCSD/Wireless-motion-capture-data-sycnhronization-system.)
Author Contributions
Conceptualization, T.M.P., E.N., and K.J.L.; methodology, T.M.P.; software, T.M.P.; validation, T.M.P.; formal analysis, T.M.P.; investigation, T.M.P., L.D., and J.W.; data curation, T.M.P.; writing—original draft preparation, T.M.P. and E.N.; writing—review and editing, T.M.P., E.N., and K.J.L.; visualization, T.M.P.; supervision, K.J.L.; project administration, K.J.L.; funding acquisition, K.J.L. All authors have read and agreed to the published version of the manuscript.
Funding
This research was supported by the U.S. Office of Naval Research (ONR) under grant numbers N00014-20-1-2208, N00014-25-1-2155, and N00014-23-1-2647.
Data Availability Statement
All schematics, drill files, bill of materials, and KiCAD project files are available in the associated GitHub repository (https://github.com/TPierceUCSD/Wireless-motion-capture-data-sycnhronization-system), Version 1.0.1. includes the files as used in this report, as well as the datasets and associated processing scripts.
Acknowledgments
The authors acknowledge the U.S. National Science Foundation (NSF) Research Experiences for Undergraduates (REU) Program (under grant no. EEC-1757994 and principal investigator Kenneth J. Loh) for supporting Lucas Davis and Jesus Wilkins for participating in this study.
Conflicts of Interest
The authors declare no conflicts of interest.
Abbreviations
The following abbreviations are used in this manuscript:
| AC | Alternating current |
| ADC | Analog-to-digital converter |
| CoTS | Commercial off the shelf |
| csv | Comma-separated values |
| DAC | Digital-to-analog converter |
| DAQ | Data acquisition |
| DC | Direct current |
| IMU | Inertial measurement unit |
| IoT | Internet of Things |
| Mocap | Motion capture |
| P95 | 95th percentile |
| P2P | Peak to peak |
| SPI | Serial peripheral interface |
| USB | Universal serial bus |
Appendix A
Appendix A.1
Figure A1.
Receiver node schematic (page 1).
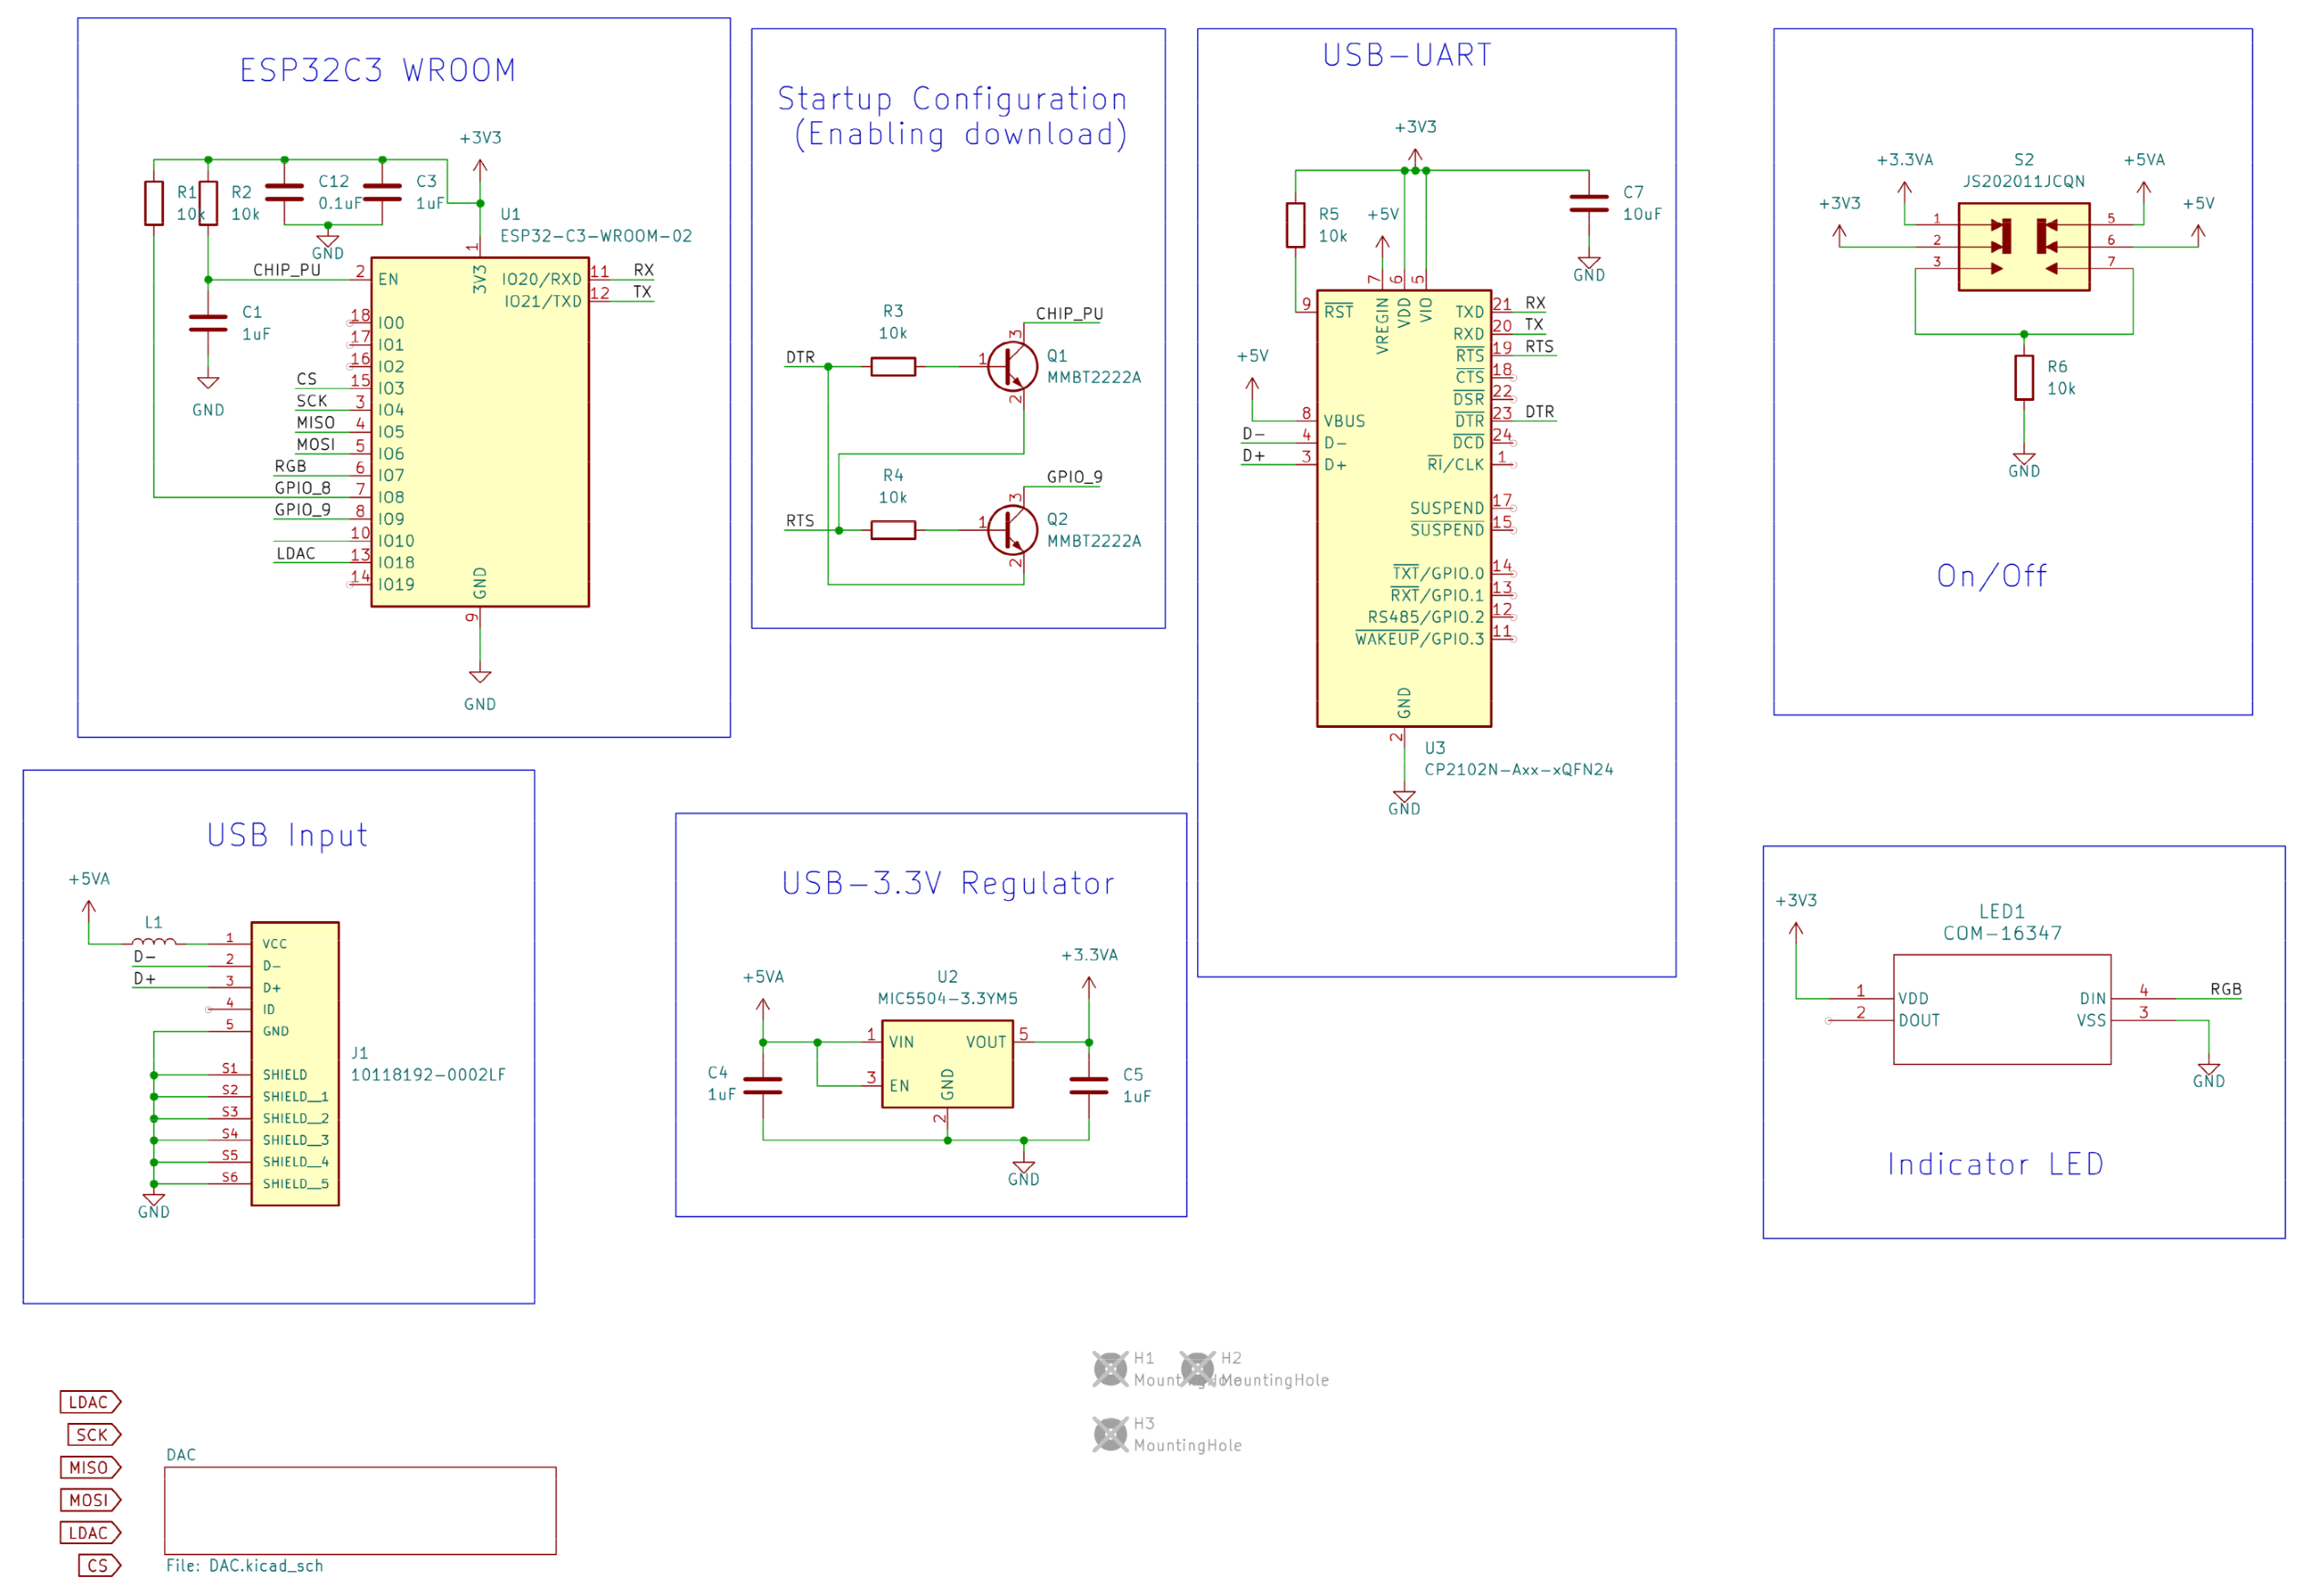
Figure A2.
Receiver node schematic (page 2).
Appendix A.2
Figure A3.
Wearable node schematic (page 1).
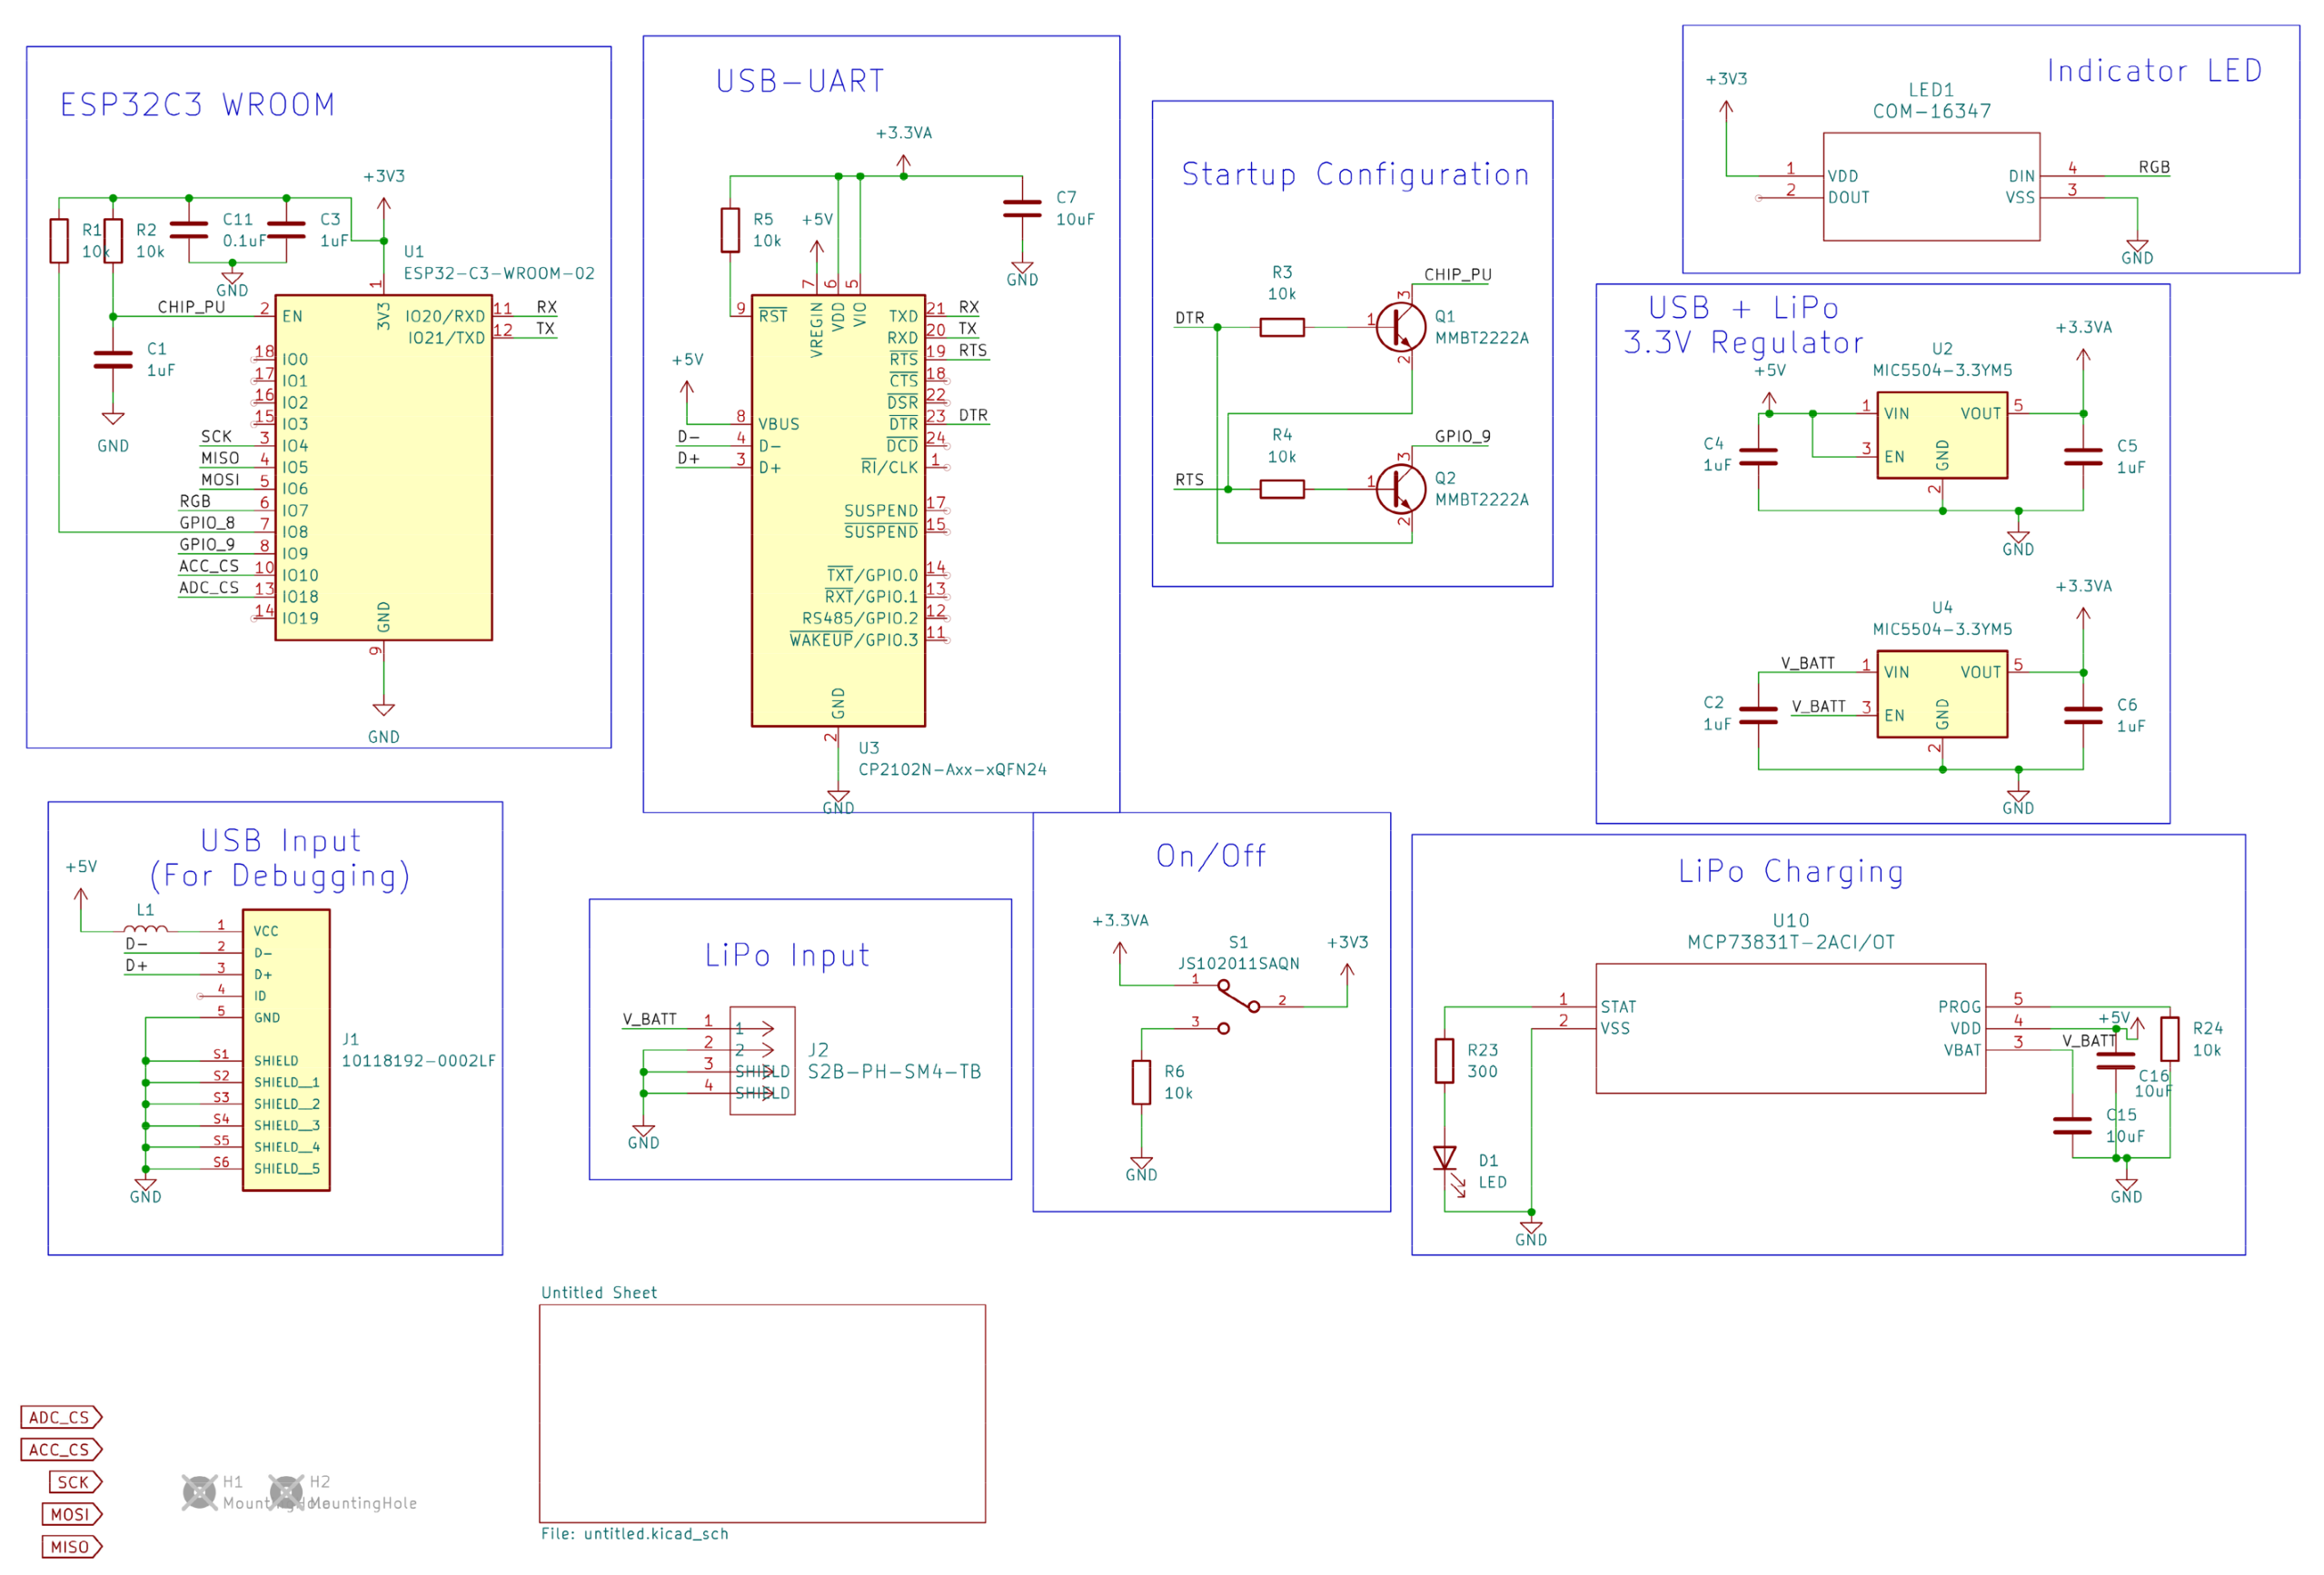
Figure A4.
Wearable node schematic (page 2).
Appendix A.3
Figure A5 presents the timing interval jitter collected from the receiver node. It should be noted that the data processing and serial printing for these data do degrade the performance of the system. As such, these data were collected on an isolated dataset, and the function was disabled for other trials.
Figure A5.
Received packet jitter.
References
- De Fazio, R.; Mastronardi, V.M.; De Vittorio, M.; Visconti, P. Wearable Sensors and Smart Devices to Monitor Rehabilitation Parameters and Sports Performance: An Overview. Sensors 2023, 23, 1856. [Google Scholar] [CrossRef] [Scilit] [PubMed]
- Singh, J.; Wilkins, G.; Manginas, A.; Chishti, S.; Fiori, F.; Sharma, G.D.; Shetty, J.; Santosh, P. A Systematic Review of Wearable Sensors in Rett Syndrome—What Physiological Markers Are Informative for Monitoring Disease States? Sensors 2025, 25, 6697. [Google Scholar] [CrossRef] [Scilit] [PubMed]
- Rana, M.; Mittal, V. Wearable Sensors for Real-Time Kinematics Analysis in Sports: A Review. IEEE Sens. J. 2021, 21, 1187–1207. [Google Scholar] [CrossRef] [Scilit]
- Walmsley, C.P.; Williams, S.A.; Grisbrook, T.; Elliott, C.; Imms, C.; Campbell, A. Measurement of Upper Limb Range of Motion Using Wearable Sensors: A Systematic Review. Sports Med. Open 2018, 4, 53. [Google Scholar] [CrossRef] [Scilit] [PubMed]
- Merriaux, P.; Dupuis, Y.; Boutteau, R.; Vasseur, P.; Savatier, X. A Study of Vicon System Positioning Performance. Sensors 2017, 17, 1591. [Google Scholar] [CrossRef] [Scilit] [PubMed]
- Scataglini, S.; Abts, E.; Van Bocxlaer, C.; Van den Bussche, M.; Meletani, S.; Truijen, S. Accuracy, Validity, and Reliability of Markerless Camera-Based 3D Motion Capture Systems versus Marker-Based 3D Motion Capture Systems in Gait Analysis: A Systematic Review and Meta-Analysis. Sensors 2024, 24, 3686. [Google Scholar] [CrossRef] [Scilit] [PubMed]
- Zago, M.; Luzzago, M.; Marangoni, T.; De Cecco, M.; Tarabini, M.; Galli, M. 3D Tracking of Human Motion Using Visual Skeletonization and Stereoscopic Vision. Front. Bioeng. Biotechnol. 2020, 8, 181. [Google Scholar] [CrossRef] [Scilit] [PubMed]
- D’Souza, S.; Siebert, T.; Fohanno, V. A Comparison of Lower Body Gait Kinematics and Kinetics between Theia3D Markerless and Marker-Based Models in Healthy Subjects and Clinical Patients. Sci. Rep. 2024, 14, 29154. [Google Scholar] [CrossRef] [Scilit] [PubMed]
- van der Kruk, E.; Reijne, M.M. Accuracy of Human Motion Capture Systems for Sport Applications; State-of-the-Art Review. Eur. J. Sport Sci. 2018, 18, 806–819. [Google Scholar] [CrossRef] [Scilit] [PubMed]
- Mündermann, L.; Corazza, S.; Andriacchi, T.P. The Evolution of Methods for the Capture of Human Movement Leading to Markerless Motion Capture for Biomechanical Applications. J. Neuroeng. Rehabil. 2006, 3, 6. [Google Scholar] [CrossRef] [Scilit] [PubMed]
- Valevicius, A.M.; Jun, P.Y.; Hebert, J.S.; Vette, A.H. Use of Optical Motion Capture for the Analysis of Normative Upper Body Kinematics during Functional Upper Limb Tasks: A Systematic Review. J. Electromyogr. Kinesiol. 2018, 40, 1–15. [Google Scholar] [CrossRef] [Scilit] [PubMed]
- Lee, A.; Wyckoff, E.; Farcas, E.; Godino, J.; Patrick, K.; Spiegel, S.; Yu, R.; Kumar, A.; Loh, K.J.; Gombatto, S. Preliminary Validity and Acceptability of Motion Tape for Measuring Low Back Movement: Mixed Methods Study. JMIR Rehabil. Assist. Technol. 2024, 11, e57953. [Google Scholar] [CrossRef] [Scilit] [PubMed]
- Ma’touq, J.; Hu, T.; Haddadin, S. Sub-Millimetre Accurate Human Hand Kinematics: From Surface to Skeleton. Comput. Methods Biomech. Biomed. Eng. 2018, 21, 113–128. [Google Scholar] [CrossRef] [Scilit] [PubMed]
- Xia, Z.; Devaprakash, D.; Cornish, B.M.; Barrett, R.S.; Lloyd, D.G.; Hams, A.H.; Pizzolato, C. Predicting Free Achilles Tendon Strain from Motion Capture Data Using Artificial Intelligence. IEEE Trans. Neural Syst. Rehabil. Eng. 2023, 31, 3086–3094. [Google Scholar] [CrossRef] [Scilit] [PubMed]
- Salisu, S.; Ruhaiyem, N.I.R.; Eisa, T.A.E.; Nasser, M.; Saeed, F.; Younis, H.A. Motion Capture Technologies for Ergonomics: A Systematic Literature Review. Diagnostics 2023, 13, 2593. [Google Scholar] [CrossRef] [Scilit] [PubMed]
- Adlou, B.; Wilburn, C.; Weimar, W. Motion Capture Technologies for Athletic Performance Enhancement and Injury Risk Assessment: A Review for Multi-Sport Organizations. Sensors 2025, 25, 4384. [Google Scholar] [CrossRef] [Scilit] [PubMed]
- Luque-Vega, L.F.; Lopez-Neri, E.; Arellano-Muro, C.A.; González-Jiménez, L.E.; Ghommam, J.; Saad, M.; Carrasco-Navarro, R.; Ruíz-Cruz, R.; Guerrero-Osuna, H.A. UAV-Based Smart Educational Mechatronics System Using a MoCap Laboratory and Hardware-in-the-Loop. Sensors 2022, 22, 5707. [Google Scholar] [CrossRef] [Scilit] [PubMed]
- Schulte, R.V.; Prinsen, E.C.; Schaake, L.; Buurke, J.H. Synchronization of Wearable Motion Capture and EMG Measurement Systems. In Proceedings of the 2022 International Conference on Rehabilitation Robotics (ICORR), Rotterdam, The Netherlands, 25–29 July 2022; pp. 1–6. [Google Scholar]
- Tirado-Andrés, F.; Araujo, A. Performance of Clock Sources and Their Influence on Time Synchronization in Wireless Sensor Networks. Int. J. Distrib. Sens. Netw. 2019, 15, 155014771987937. [Google Scholar] [CrossRef] [Scilit]
- Kugler, P.; Schlarb, H.; Blinn, J.; Picard, A.; Eskofier, B. A Wireless Trigger for Synchronization of Wearable Sensors to External Systems during Recording of Human Gait. In Proceedings of the 2012 Annual International Conference of the IEEE Engineering in Medicine and Biology Society, San Diego, CA, USA, 28 August–1 September 2012; IEEE: New York, NY, USA, 2012; pp. 4537–4540. [Google Scholar]
- Wang, H.; Li, J.; McDonald, B.E.; Farrell, T.R.; Huang, X.; Clancy, E.A. Comparison between Two Time Synchronization and Data Alignment Methods for Multi-Channel Wearable Biosensor Systems Using BLE Protocol. Sensors 2023, 23, 2465. [Google Scholar] [CrossRef] [Scilit] [PubMed]
- Li, J.; Quintin, E.; Wang, H.; McDonald, B.E.; Farrell, T.R.; Huang, X.; Clancy, E.A. Application-Layer Time Synchronization and Data Alignment Method for Multichannel Biosignal Sensors Using BLE Protocol. Sensors 2023, 23, 3954. [Google Scholar] [CrossRef] [Scilit] [PubMed]
- Vicon Motion Systems. ViconLockLabGuide; Vicon Motion Systems: Oxford, UK, 2025. [Google Scholar]
- Boyer, M.; Bouyer, L.; Roy, J.-S.; Campeau-Lecours, A. Reducing Noise, Artifacts and Interference in Single-Channel EMG Signals: A Review. Sensors 2023, 23, 2927. [Google Scholar] [CrossRef] [Scilit] [PubMed]
- Espressif Systems. ESP32-C3-WROOM-02 Datasheet; Espressif Systems: Shanghai, China, 2026. [Google Scholar]
- Analog Devices, Inc. AD7689 16-Bit PulSAR ADC; Analog Devices, Inc.: Norwood, MA, USA, 2026. [Google Scholar]
- Analog Devices, Inc. AD4807 Rail-to-Rail Amplifier; Analog Devices, Inc.: Norwood, MA, USA, 2015. [Google Scholar]
- Analog Devices, Inc. AD8544 CMOS Amplifier; Analog Devices, Inc.: Norwood, MA, USA, 2024. [Google Scholar]
- Silicon Laboratories Inc. CP2102N USB-UART Converter; Silicon Laboratories Inc.: Austin, TX, USA, 2026. [Google Scholar]
- Microchip Technology. MIC5504 3.3V Voltage Regulator; Microchip Technology: Chandler, AZ, USA, 2019. [Google Scholar]
- STMicroelectronics. LSM6DSO32TR Inertial Measurement Unit; STMicroelectronics: Geneva, Switzerland, 2020. [Google Scholar]
- Texas Instruments Inc. DAC8568 Digital to Analog Converter; Texas Instruments Inc: Dallas, TX, USA, 2018. [Google Scholar]
- Texas Instruments Inc. REF5025ID Precision Voltage Reference; Texas Instruments Inc: Dallas, TX, USA, 2025. [Google Scholar]
- ESP-NOW—ESP32—ESP-IDF Programming Guide. Available online: https://docs.espressif.com/projects/esp-idf/en/stable/esp32/api-reference/network/esp_now.html (accessed on 8 April 2026).
- Lin, Y.-A.; Zhao, Y.; Wang, L.; Park, Y.; Yeh, Y.-J.; Chiang, W.-H.; Loh, K.J. Graphene K-Tape Meshes for Densely Distributed Human Motion Monitoring. Adv. Mater. Technol. 2021, 6, 2000861. [Google Scholar] [CrossRef] [Scilit]
- Lin, Y.-A.; Schraefel, M.C.; Chiang, W.-H.; Loh, K.J. Wearable Nanocomposite Kinesiology Tape for Distributed Muscle Engagement Monitoring. MRS Adv. 2021, 6, 6–13. [Google Scholar] [CrossRef] [Scilit]
- Welch, P. The Use of Fast Fourier Transform for the Estimation of Power Spectra: A Method Based on Time Averaging over Short, Modified Periodograms. IEEE Trans. Audio Electroacoust. 1967, 15, 70–73. [Google Scholar] [CrossRef] [Scilit]
- Lin, Y.-A.; Zhao, X.; Silder, A.; Sessoms, P.; Fraser, J.J.; Loh, K.J. Graphene Kinesiology Tape for Monitoring Distributed Human Movements of the Ankle-Foot Complex. In Proceedings of SPIE; SPIE: Bellingham, WA, USA, 2021; Volume 11590, p. 115900U. [Google Scholar]
- Lin, Y.-A.; Mhaskar, Y.; Silder, A.; Sessoms, P.H.; Fraser, J.J.; Loh, K.J. Muscle Engagement Monitoring Using Self-Adhesive Elastic Nanocomposite Fabrics. Sensors 2022, 22, 6768. [Google Scholar] [CrossRef] [Scilit] [PubMed]
- Mutiara; Kusuma, H.A.; Suhendra, T. Field Testing and QoS Analysis of ESP-NOW Communication on ESP32. In Proceedings of the 2024 FORTEI-International Conference on Electrical Engineering (FORTEI-ICEE), Badung, Indonesia, 24–25 October 2024; IEEE: New York, NY, USA, 2024; pp. 82–88. [Google Scholar]

Disclaimer/Publisher’s Note: The statements, opinions and data contained in all publications are solely those of the individual author(s) and contributor(s) and not of MDPI and/or the editor(s). MDPI and/or the editor(s) disclaim responsibility for any injury to people or property resulting from any ideas, methods, instructions or products referred to in the content. |
© 2026 by the authors. Licensee MDPI, Basel, Switzerland. This article is an open access article distributed under the terms and conditions of the Creative Commons Attribution (CC BY) license.