


Abstract
This study used silicate cement as the base material and nano-silica, fly ash, and bentonite as the composite modification components. Through laboratory tests, the engineering characteristics and impermeability and drying shrinkage properties of the modified slurry were systematically investigated. The results showed that the verification test mix proportion of the slurry was a water–binder ratio of 0.7, a nano-silica content of 2%, a fly ash content of 40%, and a bentonite content of 6%. This ratio of the slurry had the best comprehensive performance. Compared with pure cement slurry, the water loss rate decreased by 61.90%; the 3d, 7d, and 28d compressive strengths increased by 30.60%, 36.08%, and 20.08% respectively; the fluidity decreased by 6.38%; and the initial setting time decreased by 9.77%. The anti-seepage pressure of the verification test mix proportion slurry group reached 1.05 MPa, which was 43.84% higher than the pure cement reference group and was superior to each single addition group. Combined incorporation of nano-silica, fly ash, and bentonite remarkably improved the impermeability. The 56d drying shrinkage rate was 1257 × 10−6, which was 19.16% lower than that of the reference group. Based on X-ray diffraction (XRD) and scanning electron microscopy (SEM) tests, the microstructure was analyzed, and the hydration mechanism was discussed. The composite modification did not change the type of hydration products but significantly improved the microstructure. Nano-silica reacted with the hydration product Ca(OH)2 in the early stage of hydration, accelerating the hydration process and promoting the interwoven coating of the hydration product on the calcium aluminosilicate crystals, thereby improving the compactness of the matrix. Fly ash participated in the pozzolanic reaction in the later stage of hydration, adhering to the secondary hydration products on the surface and gradually consuming them, further filling the pores and optimizing the interface structure. Combined with bentonite, nano-silica and fly ash jointly densified the matrix, refining the microstructure of modified samples and forming a continuous integrated hydration product network inside the grout.
1. Introduction
The shield tunnel for water conveyance, with its outstanding features such as high bearing capacity, high water conveyance efficiency, and minimal impact on the surface ecological environment, has gradually become a key structure in the water diversion engineering system [1,2]. Since the diameter of the shield machine’s casing is larger than that of the segments, after the advancement is completed, a circular gap will be formed at the shield tail, causing the underlying strata to temporarily become void. To control the deformation and ensure the stability of the structure, it is necessary to carry out behind-wall grouting promptly [3,4,5]. At present, there is extensive research on the materials used for backfill grouting for shield tunnels. Under different geological conditions, groundwater environments, and construction stages, the grouting materials need to meet differentiated performance requirements. However, the single-liquid grouting materials commonly used in traditional shield construction have several limitations, such as low early strength, poor stability, prone to segregation and stratification, weak water resistance dispersion ability, and poor long-term durability [6,7]. Furthermore, its poor durability also causes the grouting body to experience premature degradation in terms of waterproofing and load-bearing properties under the long-term action of erosive groundwater [8]. The traditional cement–gypsum dual-liquid grouting material has been applied in shield tunneling projects in water-rich strata due to its short gelation time and high early strength. However, this material has a large fluctuation in setting time and is difficult to control. During construction, problems such as pipe blockage and insufficient filling often occur, which affect the project outcome [9,10,11]. With the continuous expansion of the scale of shield tunnel projects and the increasingly complex geological environment they are in, developing a kind of behind-wall grouting material with excellent injectability, controllable setting time, high consolidation strength, good anti-seepage performance, long-term durability stability, and in line with low-carbon and environmental protection requirements has become the current research focus and direction in the field of engineering materials [12].
Based on the above background, this paper uses nano-silica, fly ash and bentonite to conduct composite modification on cement-based grouting materials, aiming to enhance their early strength while effectively improving the water separation and sedimentation characteristics, fluidity of the grout, and improving the impermeability and drying shrinkage performance, thereby enhancing the overall performance of cement-based grouting materials. Through macroscopic and microscopic tests to systematically evaluate the engineering performance of the composite modified grouting slurry, the feasibility of the composite modified grouting slurry technology and the superiority of the slurry performance are demonstrated.
This research is on the application of nano-silica, fly ash and bentonite in cement-based grouting materials. Many studies have also been conducted by scholars both at home and abroad. As a high-performance admixture for cement-based materials, nano-silica has attracted much attention for its favorable comprehensive performance when combined with other active mineral admixtures and for its performance regulation mechanism as a single cement replacement material. Zhang et al. [13] conducted research indicating that the incorporation of nano-silica and silica fume in cement mortar can significantly enhance its resistance to chloride ion penetration. Through MIP analysis, it was found that the pozzolanic effect of nano-silica can optimize the pore structure and effectively reduce the number of harmful pores. Microscopic tests such as SEM and XRD further revealed that both can accelerate the hydration process of the slurry, and their pozzolanic reactions can generate more C-S-H gels. At the same time, due to their small particle size characteristics, they can also exert a grading filling effect, thereby significantly improving the compressive strength. Among them, the combined effect of 4% silica fume and 2% nano-silica was particularly significant, and the addition of nano-silica also helped to reduce the drying shrinkage of the slurry. Bahadori et al. [14] investigated the impact of replacing part of cement with nano-silica on the performance of concrete. The results showed that concrete with 2% nano-silica replacing 20% cement exhibited superior comprehensive performance, with extremely low strength loss, a denser microstructure, and a significantly reduced water absorption rate. This mix ratio not only saved the amount of cement but also effectively enhanced the impermeability and drying shrinkage performance of the concrete. The study also found that as the amount of nano-silica added increased, the density of the concrete showed a downward trend.
Fly ash, as a widely available and highly performing mineral admixture, also exhibits remarkable effects in improving the workability and microstructure of cement-based materials. Related research has gradually delved from macroscopic performance to the microscopic mechanism level. Sharma et al. [15] found that fly ash mainly has three functions: morphological effect, active effect, and micro-aggregate effect. Fly ash can consume Ca(OH)2 in the interface transition zone, thereby promoting the development of the cement hydration process. Jiang Peng et al. [16] confirmed through scanning electron microscopy that the hydration products of fly ash microbeads could crystallize and nucleate in the voids of cement particles, gradually forming fibrous crystals and effectively filling the pores, thereby enhancing the overall strength of the mixture. Wang Qin et al. [17] compared and analyzed the volume fractions of tobermorite crystals and C-S-H gels in ordinary concrete and fly-ash-modified concrete based on BSE images, and found that the addition of fly ash microbeads could significantly increase the content of C-S-H gels. The SEM observation results further indicated that the introduction of fly ash microbeads led to a reduction in the size of tobermorite crystals in the concrete and a more uniform pore distribution. Akmalaiuly et al. [18] systematically investigated the influence of fly ash fineness on the workability of fresh concrete, and pointed out that the morphology, particle size and physical properties of fly ash particles are the key factors for regulating the workability and water requirement of concrete. Maeijer et al. [19] further analyzed the action laws of fly ash microsphere fineness on the rheological behavior of cement-based materials. The results showed that fly ash microspheres could significantly improve the fluidity of paste, mortar and concrete, and delivered favorable workability optimization when used together with high-efficiency water reducers.
Bentonite, as a natural layered silicate mineral, has been experimentally verified for its enhancing effects on the mechanical properties, impermeability and microstructure of cement mortar. Its main component is montmorillonite. Depending on the types of cations adsorbed in the interlayer domain of montmorillonite, it can be classified into various types such as sodium-based, calcium-based, magnesium-based and aluminum-based [20,21]. Hu et al. [22] investigated the influence of bentonite on the pore structure and permeability of cement mortar. The results showed that when the bentonite content was 8%, the compressive strength, flexural strength, and water permeability of the mortar increased by 61.48%, 42.09%, and 76.47%, respectively. Sun et al. [23] studied the effect of basalt fiber (BF) on the rheological properties and mechanical performance of bentonite cement slurry. The results indicated that when the fiber content was 0.6% and the length was 9 mm, the compressive strength and tensile strength of the slurry increased by 19.17% and 28.21%, respectively. BF forms a three-dimensional network structure in the slurry and effectively enhances the mechanical properties of the material through the bridging effect of the fibers. Liu et al. [24] systematically investigated the effects of adding different proportions of sodium-based, calcium-based and magnesium-based bentonite to cement mortar on the workability, mechanical properties and impermeability of the mortar. They also analyzed the mechanism of action by combining microscopic and pore structure analysis. The study found that all three types of bentonite could significantly enhance the compressive strength, flexural strength and impermeability of the mortar. The improvement in performance became more pronounced as the amount of bentonite added increased. Among them, the magnesium-based bentonite had the best impermeability effect.
In conclusion, nano-silica, fly ash and bentonite have significant advantages in enhancing the stability and long-term impermeability and drying shrinkage performance of the slurry. However, most existing studies focus on the application of a single component in conventional mortars. Therefore, this paper, based on engineering practice, investigates the regulatory mechanism of the combined modification of nano-silica, fly ash and bentonite on the performance of grouting materials, aiming to improve the comprehensive performance of the grouting materials behind the wall and providing a basis for the optimized design of grouting materials behind the wall.
2. Materials and Methods
2.1. Materials
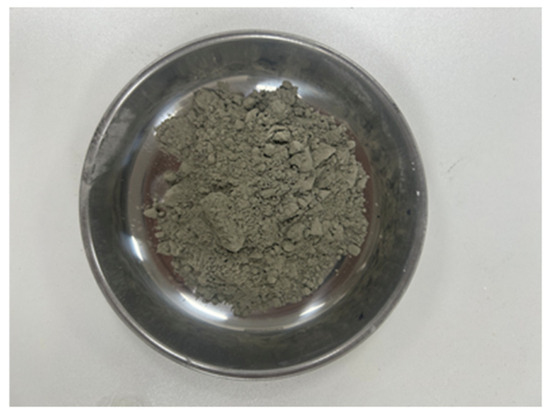
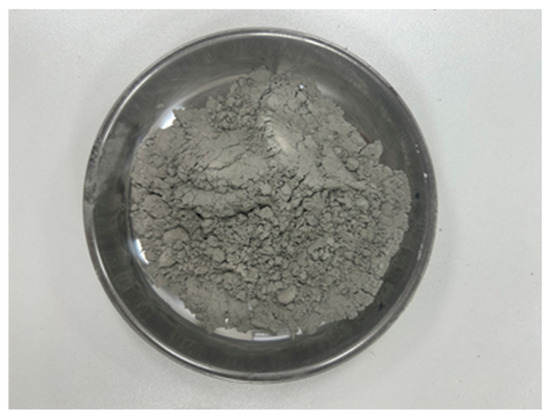
The test used 42.5 grade ordinary silicate cement produced by Jinlong Cement Factory in Zhengzhou City, China. Its main components are shown in Table 1, and the physical picture is presented in Figure 1. The basic physical performance indicators of cement are listed in Table 2.
Table 1.
The main chemical components of cement.
Figure 1.
Ordinary Portland cement.
Table 2.
Basic physical performance indicators of cement.
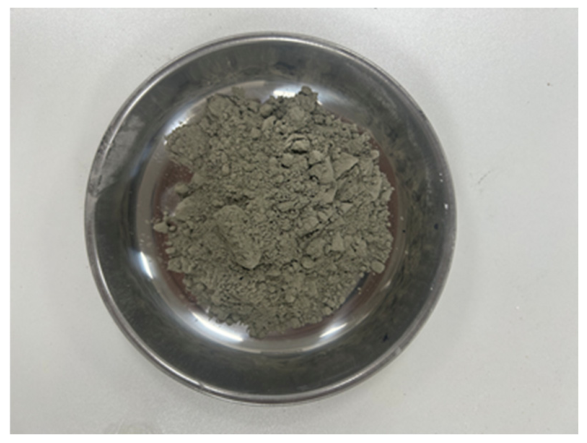
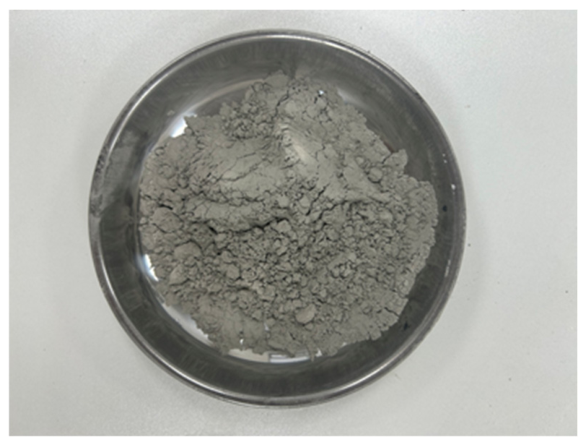
The experiment used the high-purity ultrafine hydrophilic nano-silica powder produced by Shijiazhuang Haocheng New Materials Technology Co., Ltd, Shijiazhuang, China. The main technical indicators are shown in Table 3, and the physical picture is shown in Figure 2.
Table 3.
Main technical indicators of nano-silica.
Figure 2.
Nano-silica.
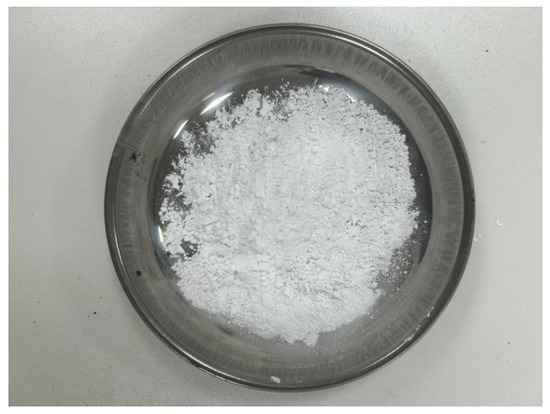
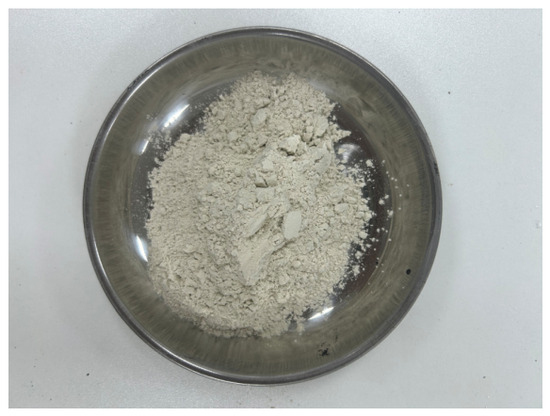
The test used first-grade fly ash produced by Henan Borun Casting Materials Co., Ltd, Gongyi, China. The fly ash adopted in this experiment is Class I fly ash. The standard adopted in this study is GB/T 1596-2017 [25], fly ash used for cement and concrete. The main components of this fly ash are shown in Table 4, and the physical picture is presented in Figure 3. The basic physical performance indicators of fly ash are presented in Table 5.
Table 4.
The main chemical components of fly ash.
Figure 3.
Fly ash.
Table 5.
Basic physical performance indicators of fly ash.
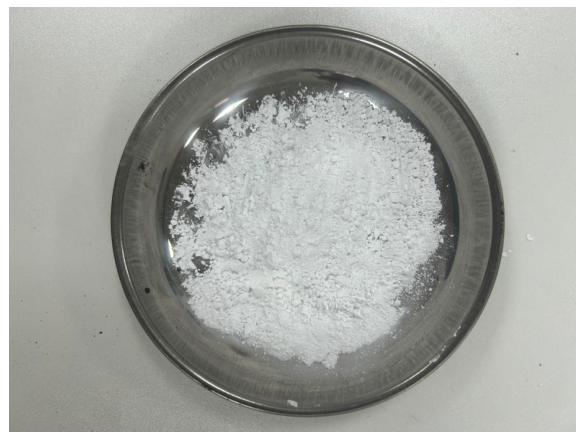
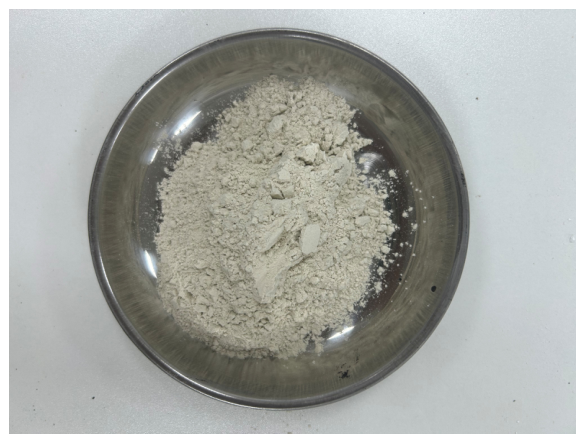
The test used sodium-based bentonite produced by Hengxin Filter Material Factory in Gongyi City, China. The physical picture is shown in Figure 4. The main mineral components of bentonite include montmorillonite, illite, kaolinite, etc. The main technical indicators of bentonite are listed in Table 6.
Figure 4.
Bentonite.
Table 6.
Main technical indicators of bentonite.
Natural fine river sand was adopted in this test, with a fineness modulus of 2.0, which belongs to fine sand. Its physical property indicators are as follows: the apparent density is 2620 kg/m3, the loose bulk density is 1480 kg/m3, and the moisture content is 3.2%.
A liquid polycarboxylate superplasticizer was used in this experiment. Its solid content is 20.1%, density is 1.025 g/cm3, pH value is 6.4, water reduction rate reaches 27%, and air content is 2%.
2.2. Testing Scheme
To conduct a systematic study on the effects of nano-silica, fly ash, bentonite and water–binder ratio on the performance of grouting materials, and to efficiently determine the verification test mix proportion, this experiment adopted the orthogonal experimental design method. Each factor was set at four levels, as follows: the content of nano-silica was 1%, 2%, 3%, and 4%; the content of fly ash was 30%, 40%, 50%, and 60%; the content of bentonite was 6%, 8%, 10%, and 12%; the water–binder ratio was 0.6, 0.7, 0.8, and 0.9. Cement and fly ash collectively form the cementitious binder system. Fly ash is added via equal-mass internal replacement of cement, and its dosage is defined as the mass fraction of replaced cement. Nano-silica and bentonite act as external modifying admixtures, and their dosages are calculated as mass percentages relative to the total mass of cement and fly ash (total binder mass). The mass ratio of total cementitious materials to sand is fixed at 1:1.5. Polycarboxylate superplasticizer is added at a dosage of 0.8% by mass of the total cementitious materials, with a solid content of 20.1%. The factors and corresponding levels of the orthogonal test are summarized in Table 7. The dosages of each material component are shown in Table 8.
Table 7.
Orthogonal experiment factor and level design table.
Table 8.
Table of dosages of each component.
2.3. Specimen Preparation
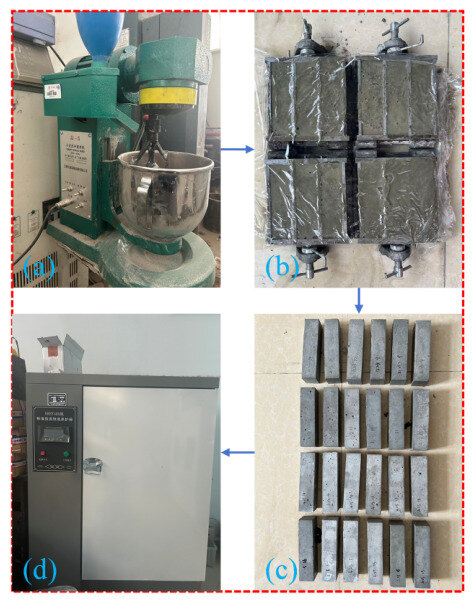
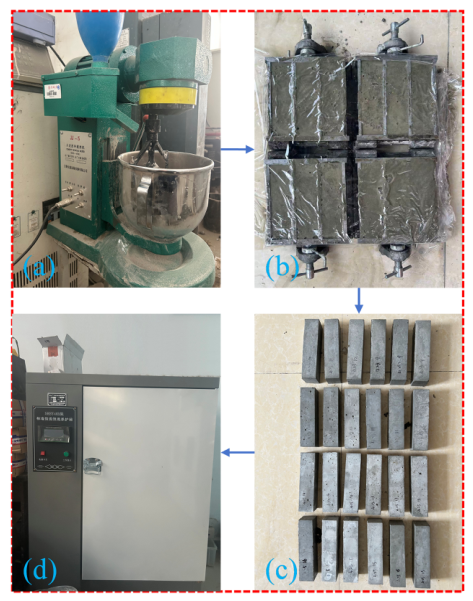
The sample preparation and curing process are shown in Figure 5. According to the mix proportion determined by the orthogonal experimental design, ordinary Portland cement, nano-silica, fly ash, bentonite, river sand, water and superplasticizer were accurately weighed and poured into a mortar mixer. According to the existing research [26], the water reducer can effectively promote the dispersion of fine particles. Based on this, the water reducer was first mixed with water for 1 min. Then, in an environment without wind, the nano-silica was added while stirring, and the mixture was continuously stirred for 3 min to obtain a homogeneous suspension. The cement, fly ash, bentonite and river sand were dry-mixed for 1 min, followed by the addition of the above suspension. The mixture was first stirred at low speed for 3 min. To guarantee the uniformity of the slurry, the mortar adhering to the wall and bottom of the mixing bowl was scraped off with a scraper during a 30 s pause, and then high-speed stirring was carried out for another 2 min, resulting in a total mixing time of 5 min. The prepared mortar was poured into a triple mold of 40 mm × 40 mm × 160 mm in two layers. After filling the first layer, the mold was vibrated on a vibration table until no obvious air bubbles escaped from the surface. The second layer was then filled and fully vibrated again, with each layer accounting for approximately half of the total mold height. After filling and vibration, the top surface of the mold was smoothed with a scraper and covered with a film to stand still and avoid surface water loss. Subsequently, the specimens were placed in a standard curing chamber (20 ± 1 °C, RH ≥ 90%) for 24 ± 2 h. After demolding, they were transferred to a thermostatic water tank at 20 ± 1 °C and cured until the specified ages. The curing water was replaced every 14 days.
Figure 5.
Preparation and curing of mortar specimens: (a) Mortar mixer; (b) Pouring of specimens (Only the first four groups of orthogonal tests are displayed.); (c) Removal of specimens from molds (Only the first eight groups of orthogonal tests are displayed.); (d) Standard constant temperature and humidity curing chamber.
2.4. Testing Methods
2.4.1. Fluidity Test
The test method for the fluidity of the slurry is carried out in accordance with GB/T 50448-2015 “Technical Specification for Application of Cement-based Grouting Materials” [27]. During the test, the test mold is placed at the center of a 500 mm × 500 mm smooth flat plate, and the freshly mixed slurry is injected until it reaches the same level as the upper edge of the mold. Then, the mold is quickly lifted vertically to allow the slurry to freely flow on the plane until it stops spreading. Finally, a straight ruler is used to measure the maximum diameter and the vertical diameter of the slurry after it has spread, and the arithmetic mean of the two is calculated as the single fluidity result. Each batch of slurry is tested three times, and the final result is the average of the three measured values.
2.4.2. Consistency Test
The consistency test of the freshly mixed grouting slurry is conducted in accordance with JGJ/T 70-2009 “Basic Performance Test Methods for Building Mortar” [28]. It is carried out using a consistency tester. Before the formal test, the slider is lightly wiped with lubricating oil to allow it to move freely, and the container for holding the slurry and the surface of the test cone are moistened with a damp cloth. Then, the slurry is filled into the container, with the filling height being approximately 1 cm below the container opening. Next, the slurry is evenly tamped 25 times using a tamper, and the container is gently shaken to make the surface of the slurry smooth. Once the preparations are complete, the container is placed on the base of the consistency tester, the test cone is lowered so that its tip touches the surface of the slurry, the brake screw is tightened, and the pointer is adjusted to zero. Finally, the screw is quickly released to allow the test cone to sink freely into the slurry. After 10 s, the depth of the sink is read as the consistency value.
2.4.3. Bleeding Rate Test
The bleeding rate test of the slurry is conducted in accordance with T/CECS 563-2018 “Technical Regulations for the Application of Synchronous Grouting Materials in Shield Tunneling” [29]. The test uses a 100 mL graduated cylinder as the container. The specific steps are as follows: Pour the freshly mixed slurry into the graduated cylinder until it reaches the 90 mL mark, then seal the cylinder opening with cling film to prevent water evaporation, and place it on a horizontal test bench at room temperature (20 ± 2 °C) for static standing. After 3 h of standing, record the scale values of the slurry surface and the upper bleeding layer surface respectively. The calculation formula for the bleeding rate is shown in (1), where B is slurry water release rate; V0 is the volume of water extracted from the upper layer, and its unit is mL; V is total volume of the slurry, and its unit is mL.
2.4.4. Initial Setting Time Test
The initial setting time of the freshly mixed slurry is tested in accordance with GB/T 1346-2024 “Test Methods for Standard Consistency Water Content, Setting Time and Soundness of Cement” [30], using a Vicat apparatus. The test starts from the moment the powder material comes into contact with the nano-silica suspension. After the slurry is evenly mixed, it is filled into a cylindrical test mold with a height of 40 mm, a top diameter of 65 mm, and a bottom diameter of 75 mm. Then, the test is conducted using the Vicat apparatus. When the setting needle falls freely and its penetration depth reaches 4 mm ± 1 mm from the bottom plate of the test mold, the time elapsed is defined as the initial setting time of the cementitious material. Ellis et al. [31] believe that compared to the final setting time, the initial setting time is more valuable for evaluating the construction characteristics of the slurry. Therefore, this test only measured the initial setting time of the prepared slurry.
2.4.5. Mechanical Property Test
The compressive strength tests of the hardened slurry were conducted in accordance with the relevant provisions of the national standard GB/T 17671-2021 “Test Methods for Cement Mortar Strength (ISO Method)” [32]. The specimens for compressive strength tests are half-length cuboids cut from standard 40 mm × 40 mm × 160 mm prisms, with a total quantity of 48 specimens. The calculation formula for compressive strength is shown in (2), where Rc is compressive strength, and its unit is MPa; Fc is the load applied when the object breaks, and its unit is N; A is the area under pressure, and its unit is mm2.
2.4.6. Impermeability Test
The water resistance performance test was conducted in accordance with the relevant regulations of JGJ/T 70-2009 “Basic Performance Test Methods for Building Mortar” [28]. The size of the mortar water resistance test specimens was a 70 mm × 80 mm × 30 mm cone. The impermeability test specimens were cured for 28 days, with six specimens prepared for each test group. The initial pressure was set at 0.2 MPa and maintained for 2 h, followed by a pressure increase to 0.3 MPa with a 1 h holding period. Subsequently, the pressure was increased by 0.1 MPa at each stage, and each pressure level was held constant for 1 h. A specimen was deemed penetrated once water appeared on its surface. The test was terminated, and the corresponding impermeability pressure was recorded upon water penetration of the third specimen. The calculation formula for the water resistance pressure value is shown in (3), where P is impermeability value, and its unit is MPa; H is the maximum water pressure when the third specimen began to leak water, and its unit is MPa.
2.4.7. Drying Shrinkage Performance Test
The drying shrinkage performance test was conducted according to JCT 603-2004 “Test Method for Dry Shrinkage of Cement Mortar” [33]. The drying shrinkage value of the grouting materials was tested using the BC-300 length measuring instrument. The prepared slurry was poured into a triple mold with dimensions of 25 mm × 25 mm × 280 mm in two layers according to the mix proportion, and each layer was compacted with square tamping rods and notched tamping rods. Three specimens were prepared for each group. The specimens were cured inside a curing chamber at 20 °C ± 1 °C with a relative humidity of no less than 90% for 24 h ± 2 h before demolding. After demolding, the specimens were immersed in water for curing. Two days later, the initial length of each specimen was measured with a length comparator. Subsequently, the specimens were transferred to a drying shrinkage curing chamber for dry curing. Length measurements were repeated at specified curing ages (1d,3d,7d,14d,28d, 56d). The drying shrinkage performance of the material was evaluated by calculating the length change rate. The calculation formula for the drying shrinkage change rate is shown in (4), where St is dry shrinkage rate; L0 is initial length of the specimen, and its unit is mm; Ln is the test length of the specimen at a certain age, and its unit is mm.
2.4.8. XRD Test
To investigate the types of hydration products of the cementitious materials under different mix ratios and the effects of nano-silica and fly ash admixtures on the hydration process, X-ray diffraction (XRD) technology was used to analyze the phase composition of the specimens at the specified ages. Silicate cement slurry and nano-silica modified cement-based composite grouting materials were prepared respectively, and then standard curing was carried out after molding. No river sand was excluded from the samples. At ages of 3d, 7d and 28d, test blocks were cut, and the cross-sections were immersed in ethanol for 24 h to terminate the hydration process. After drying, grinding and passing through a 200-mesh sieve, powder samples were obtained. The XRD test was carried out on a Rigaku/SmartLabSE diffractometer (Rigaku Corporation, Akishima-shi, Tokyo, Japan) with a Cu target as the radiation source. Its operating voltage was 40 kV, tube current was 45 mA, and the scanning rate was 5°/min. The scanning angle ranged from 10° to 60° with a step size of 0.02°.
2.4.9. SEM Test
To analyze the microscopic morphology of the sample, a scanning electron microscope (SEM) was used for observation. The scanning electron microscope model is ZEISS GeminiSEM 360 (Carl Zeiss AG, Oberkochen, Germany), with an acceleration voltage of 5 kV. After the mechanical property tests, fresh internal fracture surfaces of hardened paste specimens cured for 3d, 7d and 28d were collected. The hydration process was terminated by immersing the samples in anhydrous ethanol for 48 h, followed by vacuum drying at 40 °C. Gold coating was then applied on sample surfaces to provide electrical conductivity.
3. Basic Performance Test Results and Analysis
3.1. Fluidity Test
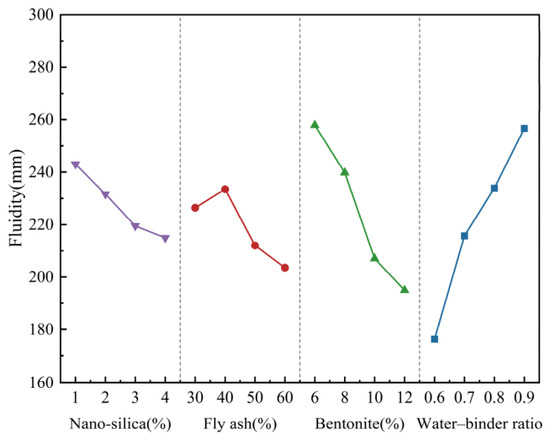
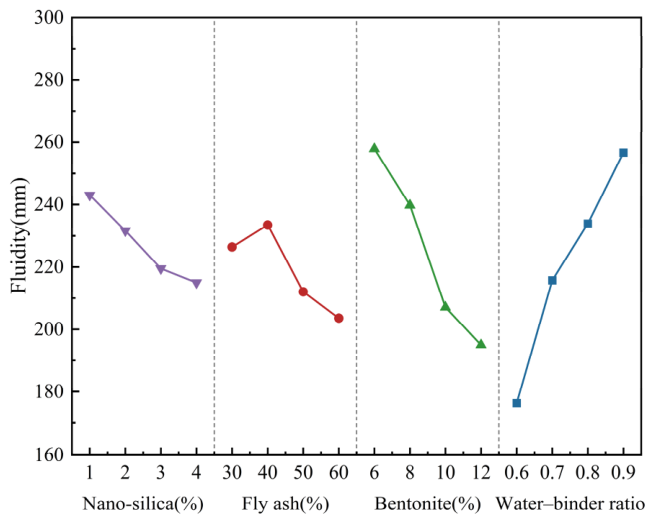
Test results of fluidity are listed in Table 9. The range analysis of slurry fluidity is shown in Table 10. The influence of each factor on the fluidity is in the following order: water-to-binder ratio (D), bentonite content (C), fly ash content (B), and nano-silica content (A). The optimized ratio is A1B2C1D4, that is, 1% nano-silica content, 40% fly ash content, 6% bentonite content, and a water-to-binder ratio of 0.9.
Table 9.
Table of fluidity test results.
Table 10.
Range analysis of slurry fluidity.
As shown in Figure 6, the fluidity of the slurry is positively correlated with the water–binder ratio and negatively correlated with the content of nano-silica and bentonite. An increase in the water–binder ratio reduces the volume concentration of solid particles, decreases the plastic viscosity, and improves the fluidity. Nano-silica has a large specific surface area and adsorbs free water, making the slurry thicker. Bentonite, the main component of which is montmorillonite, has strong hydrophilicity and consumes free water, significantly reducing the fluidity. The influence of fly ash on the fluidity shows a trend of increasing first and then decreasing. When the content is 40%, the fluidity is the greatest. Appropriate spherical glass microbeads play a lubricating role, reducing the friction resistance of the particles, but when the content is too high, the amount of free water decreases, and the fluidity drops.
Figure 6.
The influence of various factors on the fluidity of the slurry.
3.2. Consistency Test
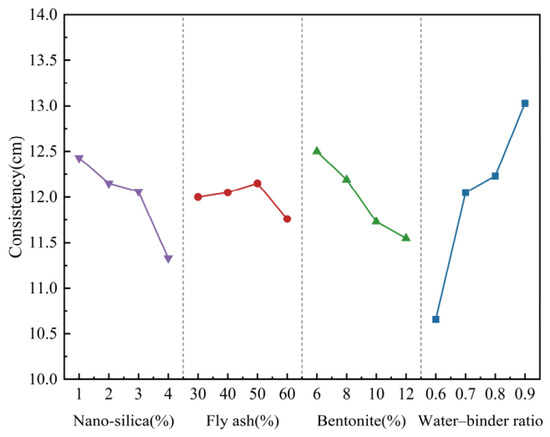
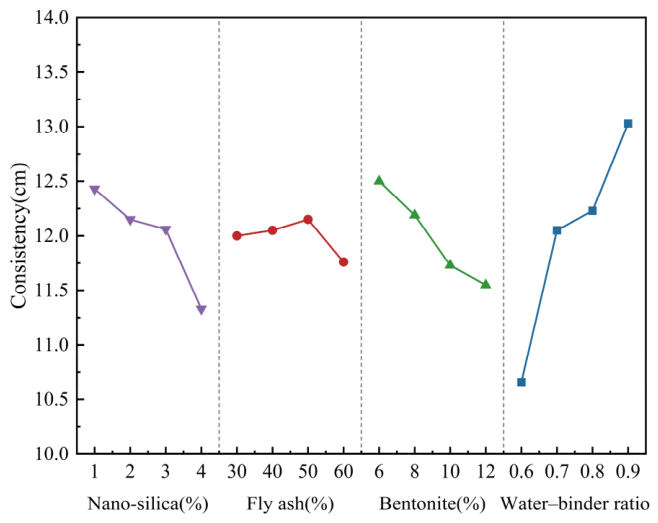
Test results of consistency are listed in Table 11. The range analysis of slurry consistency is shown in Table 12. The influence of each factor on the consistency is in the following order: water-to-cement ratio (D), nano-silica content (A), bentonite content (C), and fly ash content (B). The optimized ratio is A1B3C1D4, that is, nano-silica content 1%, fly ash content 50%, bentonite content 6%, and water-to-cement ratio 0.9.
Table 11.
Table of consistency test results.
Table 12.
Range analysis of slurry consistency.
As shown in Figure 7, the consistency of the slurry increases with the increase in the water–binder ratio. The free water increases, reducing the frictional resistance between the particles. With the increase in the content of nano-silica, the consistency decreases because its high specific surface area adsorbs the free water, making the slurry thicker. With the increase in the content of bentonite, the consistency decreases because its layered structure adsorbs and consolidates the free water, reducing the effective lubricating water. When the content of fly ash is between 30% and 50%, the consistency increases, and the spherical glass microbeads play a lubricating role; when the content is between 50% and 60%, the consistency decreases because the relative concentration of cement decreases, and the early hydration products are insufficient, making the slurry prone to sedimentation and flocculation, and the flow resistance increases.
Figure 7.
The influence of various factors on the consistency of the slurry.
3.3. Bleeding Rate Test
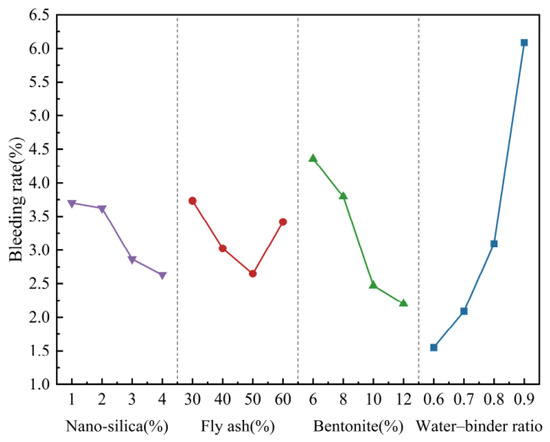
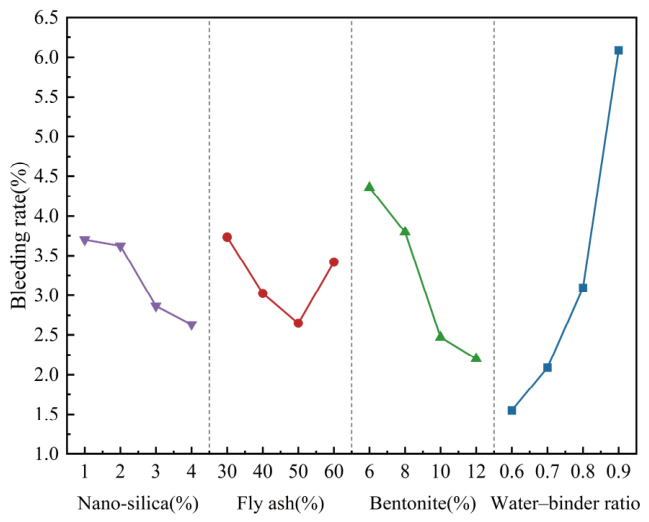
Test results of bleeding rate are listed in Table 13. The range analysis of the slurry bleeding rate is shown in Table 14. The order of influence of each factor on the bleeding rate from greatest to least is water-to-binder ratio (D), bentonite content (C), fly ash content (B), and nano-silica content (A). The optimized ratio is A4B3C4D1, that is, nano-silica content 4%, fly ash content 50%, bentonite content 12%, and water-to-binder ratio 0.6.
Table 13.
Table of bleeding rate test results.
Table 14.
Range analysis of slurry bleeding rate.
As shown in Figure 8, the bleeding rate of the slurry decreases with the increase in the nano-silica content, which is attributed to its micro-filling effect and strong adsorption, thereby inhibiting the migration of free water. With the increase in the content of bentonite, the bleeding rate also decreases, because the montmorillonite component converts free water into interlayer bound water through water absorption and expansion. With the increase in the fly ash content, the bleeding rate first decreases and then increases, reaching the minimum at 50% (a decrease of 29.0% compared to 30%), due to the filling of fine particles in the voids and the improvement of compactness. At 60% content, the bleeding rate has somewhat recovered (still a decrease of 8.4% compared to 30%), because the relative concentration of cement decreases and the early hydration products are insufficient, resulting in a weakened ability to bind moisture.
Figure 8.
The influence of various factors on the bleeding rate of the slurry.
3.4. Initial Setting Time Test
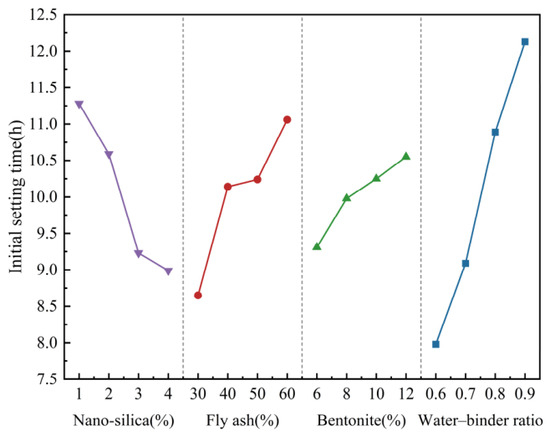
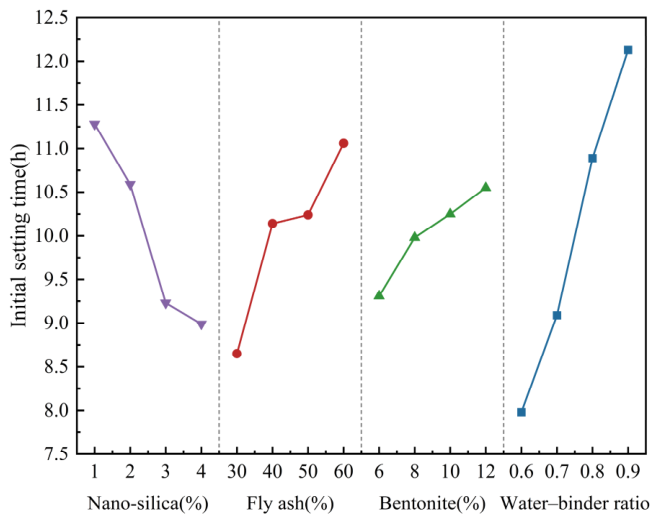
Test results of initial setting time are listed in Table 15. The range analysis of the slurry initial setting time is shown in Table 16. The order of influence of each factor on the initial setting time is as follows: water-to-binder ratio (D), fly ash content (B), nano-silica content (A), and bentonite content (C). Among them, the range of variation of water-to-binder ratio is the largest, reaching 4.2, and it is the main influencing factor. The optimized ratio is A1B4C4D4, that is, nano-silica content 1%, fly ash content 60%, bentonite content 12%, and water-to-binder ratio 0.9.
Table 15.
Table of initial setting time test results.
Table 16.
Range analysis of slurry initial setting time.
As shown in Figure 9, the initial setting time of the slurry decreases with the increase in the content of nano-silica. This is attributed to its nucleation effect and micro-filling effect, which accelerates hydration and reduces free water. With the increase in fly ash content, the initial setting time increases because the early volcanic ash activity is low, and the spherical particles encapsulating the cement delay the hydration. With the increase in bentonite content, the initial setting time increases because the interlayer water absorption expansion consumes a large amount of free water, inhibiting hydration. With the increase in the water–binder ratio, the initial setting time increases because the concentration of cement particles decreases, and the generation rate of hydration products slows down.
Figure 9.
The influence of various factors on the initial setting time of the slurry.
3.5. Mechanical Property Test
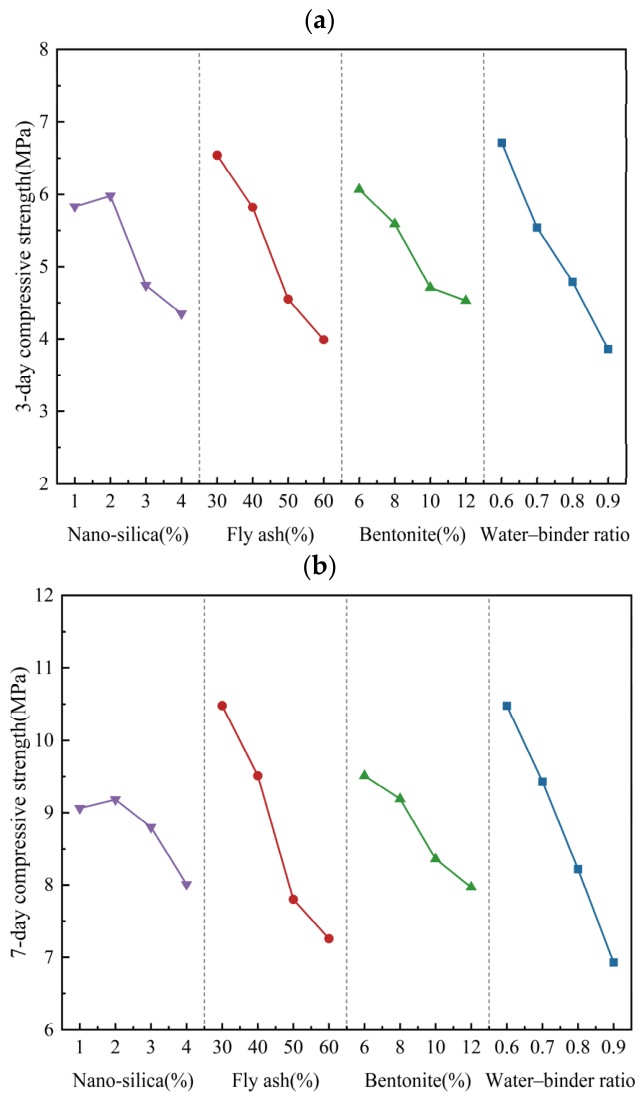
Test results of compressive strength of hardened slurry specimens are listed in Table 17. The range analysis of compressive strength of hardened slurry specimens is shown in Table 18. The influence degree of each factor on the compressive strength of the 3d, 7d and 28d stone bodies was the same, with the water-to-cement ratio being the most significant factor (main factor), followed by the amount of fly ash (secondary factor), and the influence order of the other factors was slightly different. The range of the extreme difference in the water-to-cement ratio was significantly higher than that of other factors at all ages, making it the most important factor affecting the compressive strength. The verification test mix proportion was A2B1C1D1, that is, 2% nano-silica content, 30% fly ash content, 6% bentonite content, and a water-to-cement ratio of 0.6.
Table 17.
Table of compressive strength test results.
Table 18.
Range analysis of compressive strength of hardened slurry.
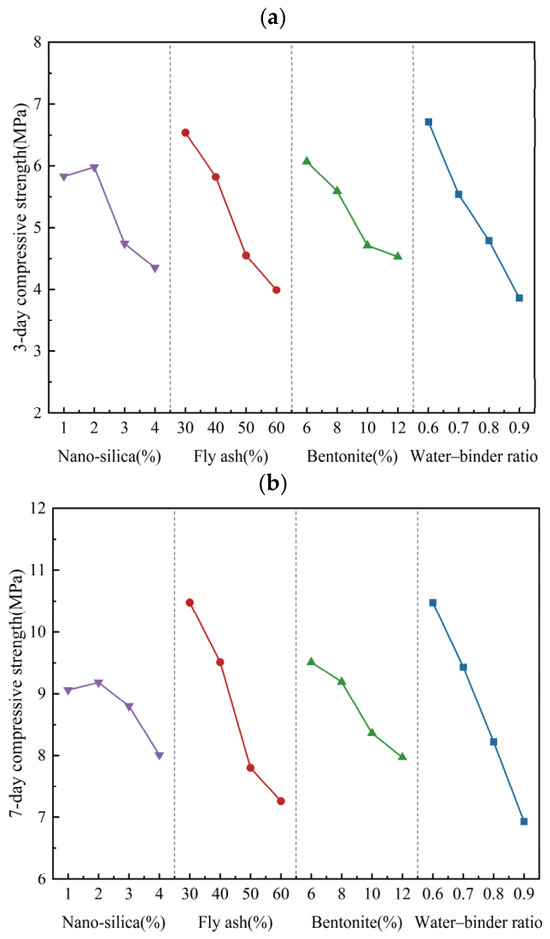
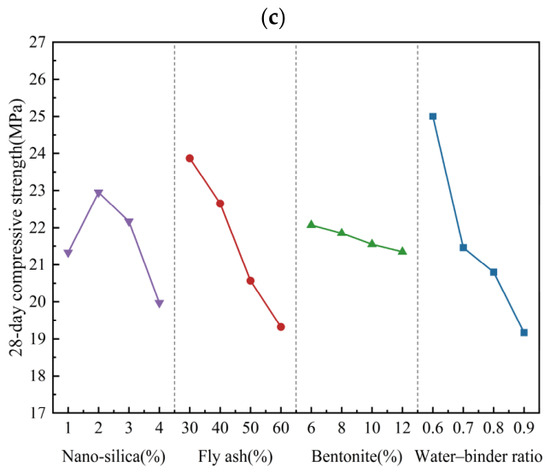
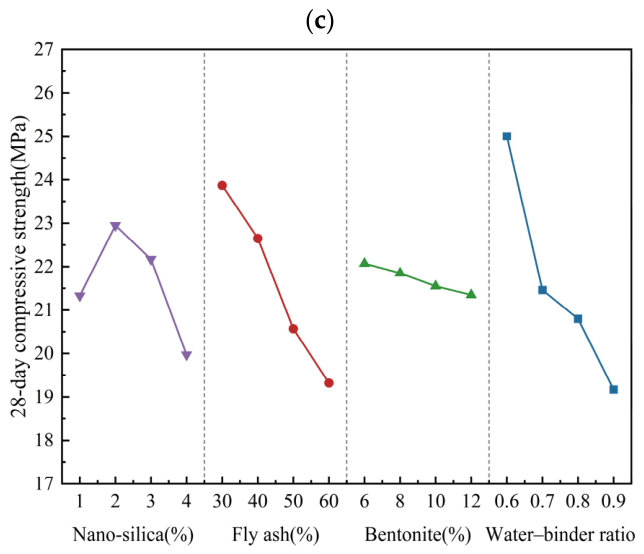
As shown in Figure 10, the compressive strength of the slurry stone body varies significantly with different curing ages (3d, 7d, 28d) and various factors. With the increase in nano-silica content from 1% to 2%, the compressive strength at each age shows an upward trend; however, when the content continues to increase to 4%, the strength gradually decreases. This is attributed to the nucleation effect and secondary hydration of nano-silica at low content, which promotes the formation of hydrated calcium silicate gel, while at high content, particle agglomeration inhibits hydration. As the fly ash content increases from 30% to 60%, the compressive strength at each age continuously decreases. The decrease in 28d strength is significantly greater than that in 3d and 7d, mainly due to the dilution effect of fly ash on the cement components, and the later pozzolanic reaction is unable to fully compensate for the loss of the bonding capacity. With the bentonite content increasing from 6% to 12%, the compressive strength at each age shows a gradually decreasing trend. This is because the water absorption and expansion of bentonite delay the cement hydration process, and its own cementitious activity is relatively low. As the water–binder ratio increases within the range of 0.6 to 0.9, the compressive strength at each age significantly decreases, because the excessive free water content forms more pore defects after hardening, reducing the density of the stone body.
Figure 10.
The influence of various factors on the compressive strength of the hardened slurry at different ages: (a) 3d compressive strength; (b) 7d compressive strength; (c) 28d compressive strength.
3.6. Influence of Nano-Silica on Microscopic Morphology of Cement-Based Materials
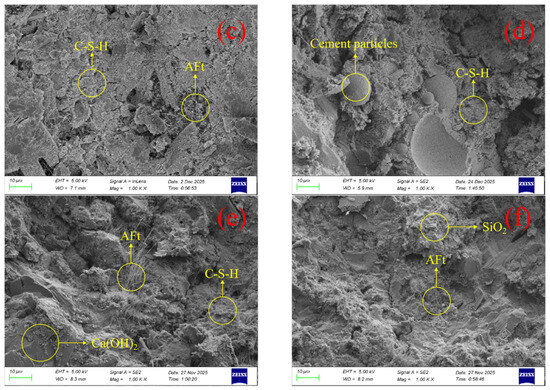
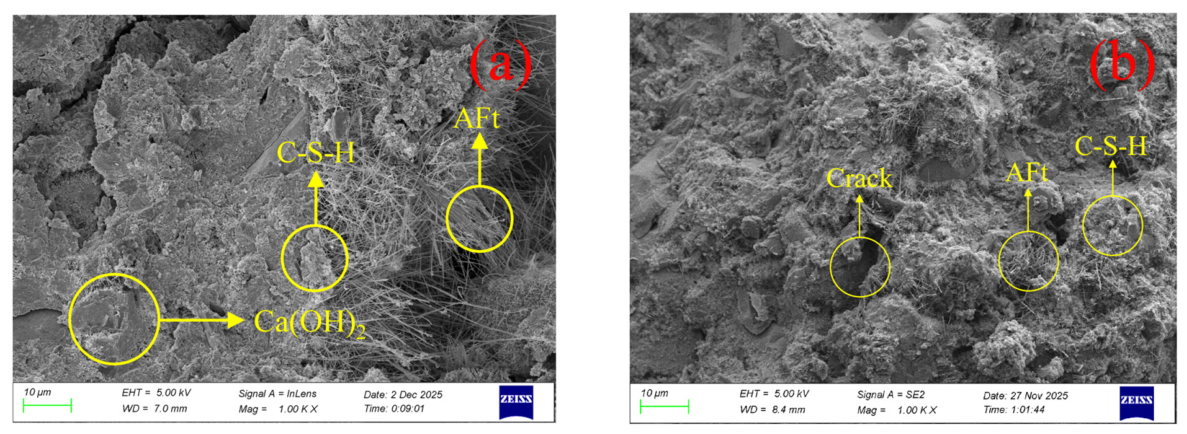
Fly ash and bentonite were incorporated simultaneously with constant dosages: the dosage of fly ash was 40%, bentonite dosage was 6%, the water–binder ratio was 0.7, and the binder–sand ratio was 1:1.5. Specimens incorporated with 0%, 2% and 4% nano-silica respectively were subjected to standard curing. Their micromorphologies at curing ages of 3d and 28d were observed via SEM, and the results are shown in Figure 11. The magnification is 2000 times. It can be seen from Figure 11a,c that a large amount of plate-like calcium hydroxide is generated in the specimen matrix at the curing age of 3d, with acicular and rod-like ettringite and a small amount of calcium silicate hydrate distributed in the gaps, and obvious pores develop inside the specimens. With the increase in nano-silica content, the amount of calcium silicate hydrate hydration products increases continuously, and the compactness of the paste is greatly improved. As shown in Figure 11b,d, when the curing age reaches 28d, the hydration reaction proceeds more sufficiently; the hydration products interweave with each other and wrap the ettringite structures. The addition of nano-silica can further promote the tight bonding of hydration products and continuously optimize the microscopic pore structure. Figure 11e,f indicate that nano-silica with high dosage possesses an excessively large specific surface area, so a small amount of mixing water fails to disperse the particles uniformly. The particles agglomerate to form agglomeration defects, generating numerous tiny interfacial gaps inside. These silica particles have no cementitious property, thus weakening the integrity and structural strength of the hardened grout [34].
Figure 11.
(a) 3d, 0% nano-silica SEM; (b) 28d, 0% nano-silica SEM; (c) 3d, 2% nano-silica SEM; (d) 28d, 2% nano-silica SEM; (e) 3d, 4% nano-silica SEM; (f) 28d 4% nano-silica SEM.
3.7. Slurry Performance of Verification Test Mix Proportion
Determining the mix ratio for the verification test is a multi-objective decision-making process. The influence of various factors on performance indicators often has mutual constraints. Although reducing the water separation rate is beneficial for improving strength, it is prone to cause a decrease in consistency and fluidity, which is not conducive to construction. Therefore, it is necessary to systematically evaluate and distinguish primary and secondary indicators: take 28-day compressive strength and fluidity as the main optimization indicators, and water separation rate and consistency as secondary indicators. Based on the results of the extreme difference analysis of each factor, determine the verification test mix proportion level combination to provide a basis for scientifically determining the slurry ratio.
Based on the primary and secondary positions of each factor in different performance indicators, the optimal level combination is determined as follows: Factor A is the main factor in the consistency index and is a secondary or relatively secondary factor in most strength and setting time indicators. To ensure long-term strength, A2 is selected; Factor B is the main factor in the initial setting time and strength indicators, and a secondary factor in fluidity and bleeding rate. B2 has the optimal fluidity and meets the engineering requirements for strength, so B2 is selected; Factor C is the main factor in fluidity and bleeding rate, and a secondary factor in consistency and 7-day strength. C1 is the best in both workability and strength indicators, so C1 is selected; Factor D is the main factor in all indicators. To balance work performance and strength, D2 is selected.
Through the above comprehensive balance analysis, the verification test mix proportion was determined to be A2B2C1D2, that is, the content of nano-silica is 2%, the content of fly ash is 40%, the content of bentonite is 6%, and the water–binder ratio is 0.7. Dosages of each component in pure cement slurry and verification test mix proportion slurry are shown in Table 19. The performance indicators of the verification test mix proportion slurry and the pure cement slurry were tested, and the basic performance test results are shown in Table 13, and the stone strength test results are shown in Table 14. In accordance with Technical Specification for Application of Simultaneous Grouting Materials for Shield Tunnels (T/CECS 563-2018), the engineering control ranges of single-liquid backfill grouting materials for shield tunnels are specified as follows: the slurry fluidity shall be no less than 160 mm, the consistency shall range from 10 cm to 13 cm, the bleeding rate shall be ≤ 3.5%, the initial setting time shall be 4–12 h, the 3-day compressive strength of hardened grout shall be no less than 0.5 MPa, and the 28-day compressive strength shall be no less than 2.5 MPa. A comparison between all test performances of the comprehensive verification test mix proportion in this study (2% nano-silica, 40% fly ash, 6% bentonite, water–binder ratio of 0.7) and the above engineering indicators show that all performance indicators meet the specification requirements.
Table 19.
Dosages of each component in pure cement slurry and verification test mix proportion slurry.
From Table 20 and Table 21, it can be seen that the verification test mix proportion slurry has a lower fluidity compared to pure cement slurry, with the water loss rate dropping from 4.2% to 1.6%. The stability of the slurry has significantly improved. The initial setting time is slightly shorter, as the active components such as nano-silica accelerate the early hydration process. The 3-day, 7-day, and 28-day compressive strengths of the verification test mix proportion slurry have increased by approximately 30.6%, 36.08%, and 20.08% respectively, indicating that its microstructure is denser, and the strength has significantly improved.
Table 20.
Test results of basic properties of slurry with verification test mix proportion and pure cement slurry.
Table 21.
Test results of compressive strength of slurry with verification test mix proportion and pure cement slurry.
3.7.1. XRD Test
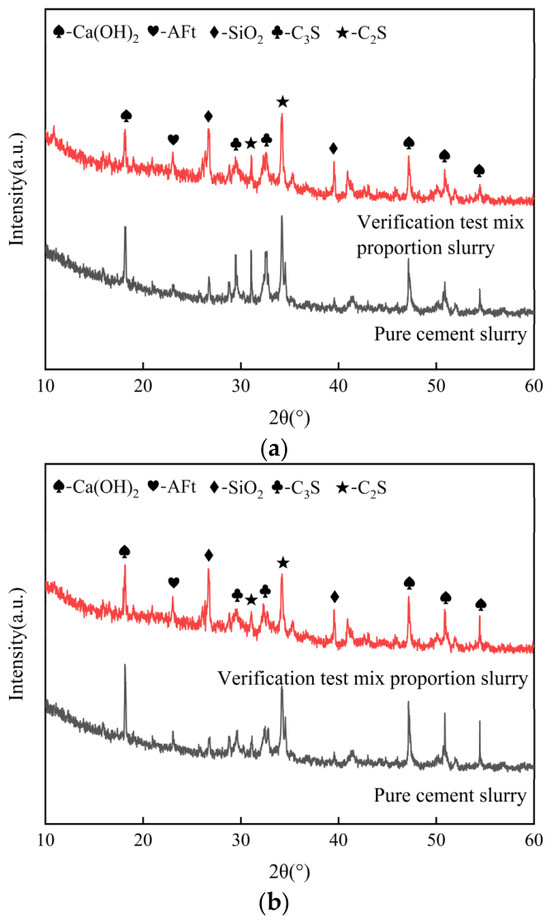
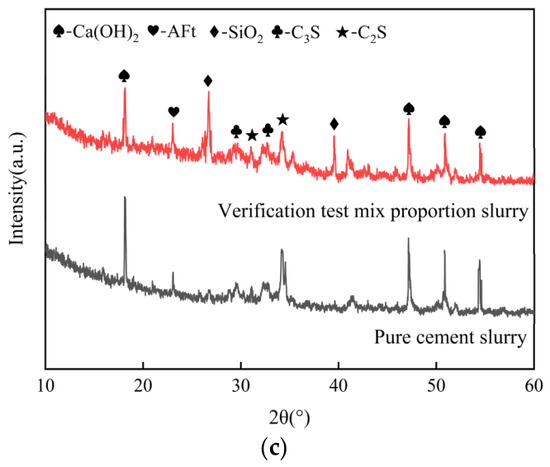
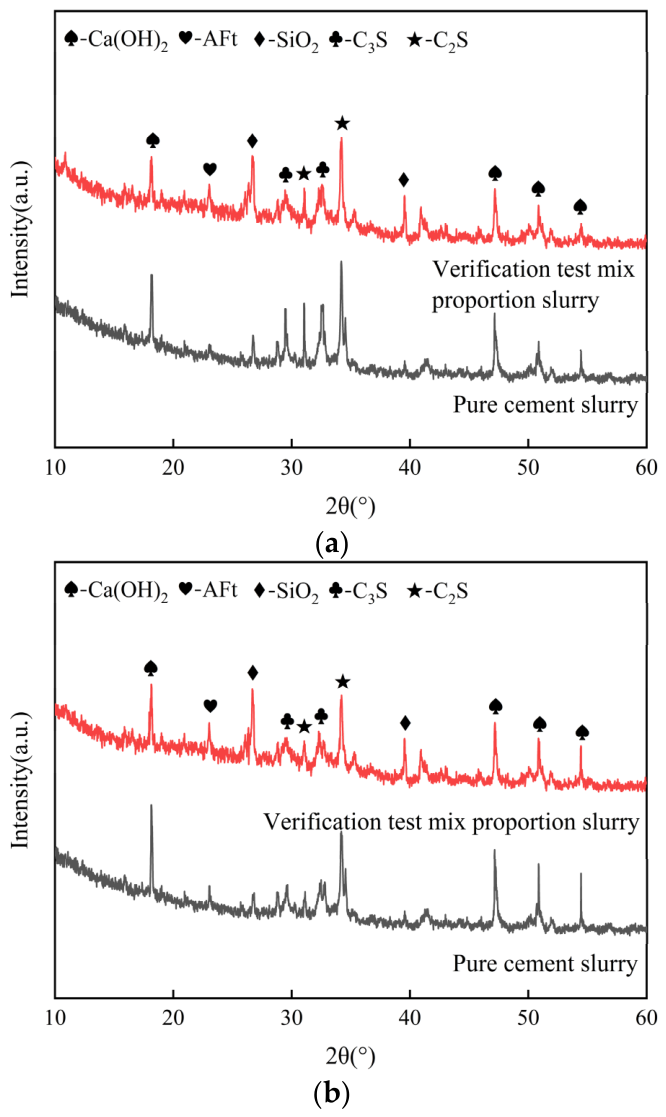
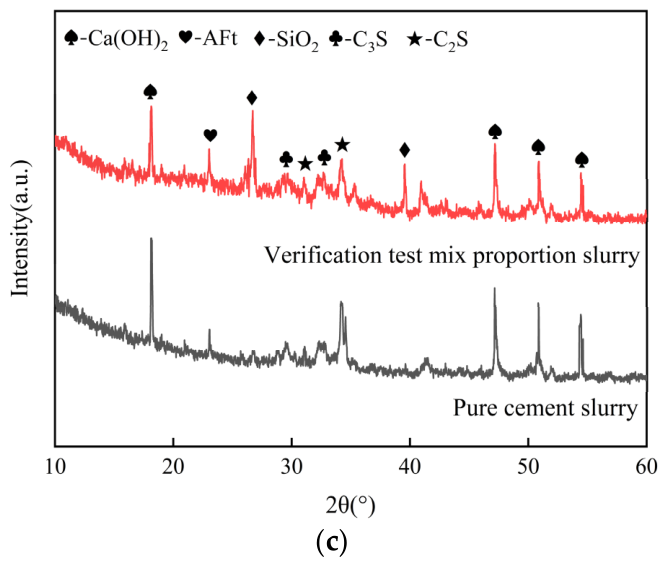
As shown in Figure 12, sharp and intense diffraction peaks of C3S and C2S are observed in pure cement paste at 3d, reflecting a large residual amount of unhydrated cement clinker. The corresponding C3S, C2S and Ca(OH)2 peaks of the composite-modified paste are markedly weaker. This reduction originates jointly from two factors: the 40% fly ash replacement reduces the absolute cement content (dilution effect), and active silica supplied by nano-silica and fly ash consumes portlandite via pozzolanic reactions, shifting the hydration equilibrium and facilitating continuous dissolution of clinker minerals. The AFt diffraction peak intensity rises in the composite system, which is associated with abundant reactive aluminate and sulfate components introduced by fly ash and bentonite. The distinct SiO2 crystalline peak detected mainly corresponds to quartz contained in fly ash, rather than unreacted nano-silica, since the nano-silica employed in this study is predominantly amorphous and exhibits no obvious crystalline diffraction signals.
Figure 12.
(a) 3-day XRD spectra of the verification test mix proportion slurry and the cement slurry; (b) 7-day XRD spectra of the verification test mix proportion slurry and the cement slurry; (c) 28-day XRD spectra of the verification test mix proportion slurry and the cement slurry.
At 7d, the Ca(OH)2 peak intensity rises while C3S and C2S peaks decline for pure cement paste, consistent with ongoing cement hydration. For the composite mixture, sustained pozzolanic consumption of portlandite results in weaker Ca(OH)2, C3S and C2S peaks relative to the control sample, alongside enhanced AFt peaks in both groups. The growth of AFt is driven by continuous hydration and sufficient supply of aluminate and sulfate ions, rather than generalized optimization of C-S-H microstructure.
At 28d, further hydration of pure cement paste leads to increased Ca(OH)2 signals and diminished C3S/C2S peaks. Ca(OH)2 intensity also grows in the modified paste yet remains lower than that of pure cement, owing to persistent pozzolanic reactions that continuously consume calcium hydroxide throughout the curing period. It should be noted that without internal standard quantitative phase analysis, peak intensity variations herein are only used for qualitative comparison of hydration evolution tendencies, and cannot be directly regarded as quantitative evidence of absolute phase-content differences caused solely by hydration extent.
3.7.2. SEM Test
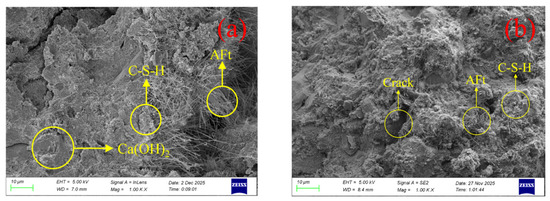
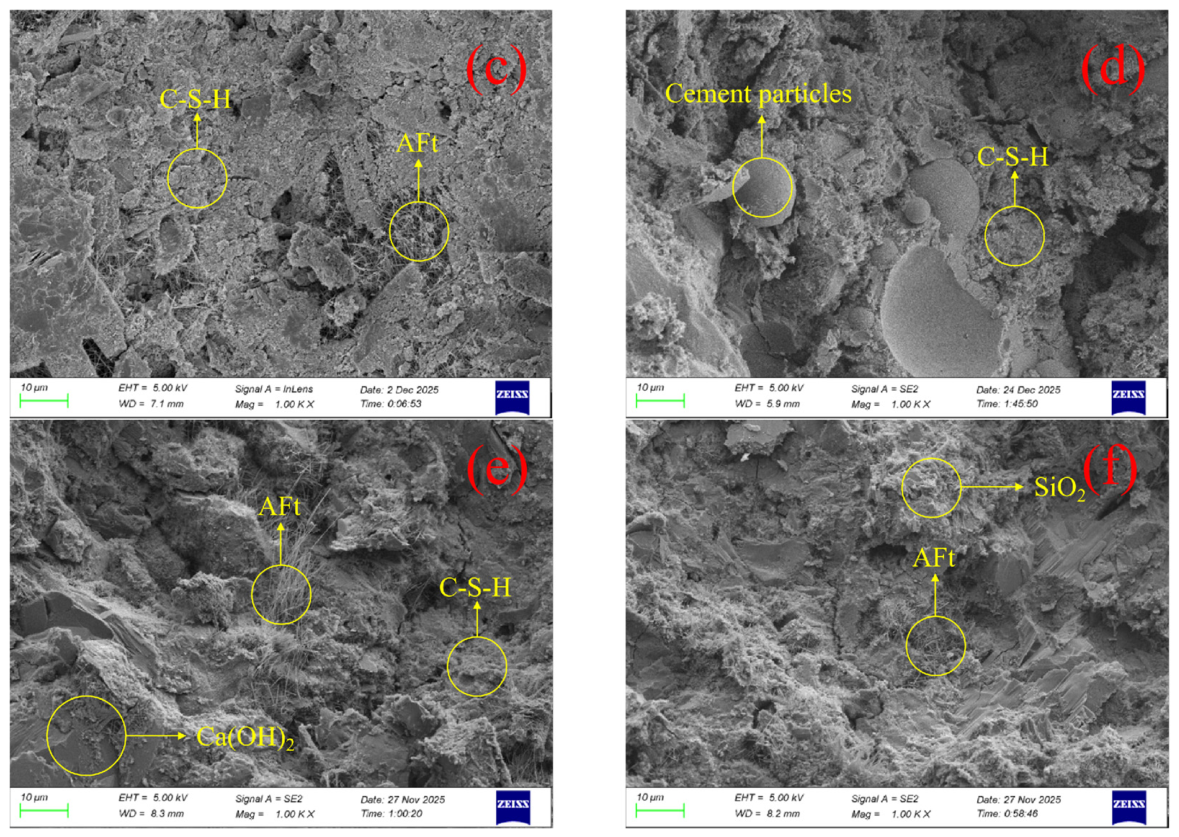
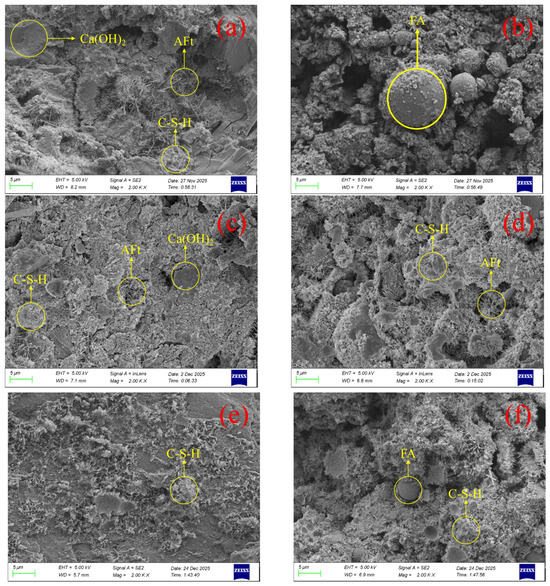
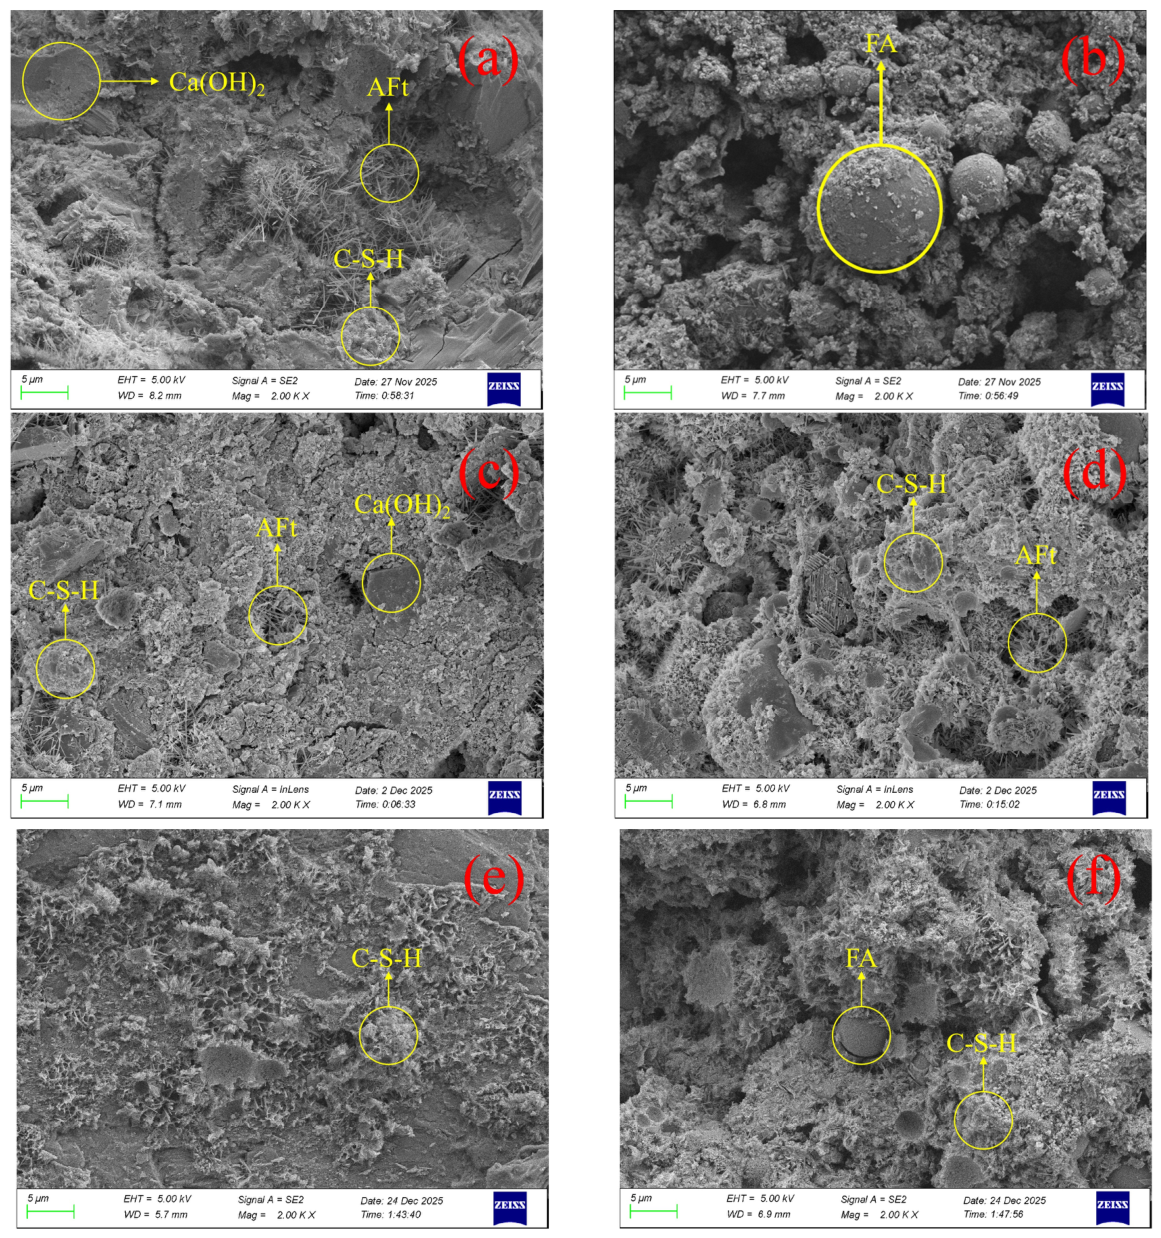
In this experiment, the magnification of the scanning electron microscope was 2000 times. As displayed in Figure 13a,b, the matrix of pure cement paste presents a loose microstructure at 3d. Plate-shaped crystalline substances, needle-like rod phases and a small quantity of flocculent amorphous gel can be observed, alongside abundant visible voids; by contrast, the composite modified matrix possesses a denser overall framework, yet abundant intact fly ash microspheres remain unconsumed. This phenomenon reflects the weak pozzolanic reactivity of fly ash at early curing ages, which matches the adverse influence of fly ash on early mechanical performance.
Figure 13.
(a) 3d pure cement slurry SEM; (b) 3d verification test mix proportion slurry SEM; (c) 7d pure cement slurry SEM; (d) 7d verification test mix proportion slurry SEM; (e) 28d pure cement slurry SEM; (f) 28d verification test mix proportion slurry SEM.
For specimens cured for 7d (Figure 13c,d), more flocculent gel and plate-shaped crystalline substances form within the pure cement matrix, and void volume is slightly reduced; however, distinct pores can still be clearly observed. The composite matrix generates substantially more hydration products that interlock to form an interconnected continuous network, and needle-like rod phases are wrapped by amorphous gel, leading to markedly enhanced matrix compactness. This improvement arises from the high pozzolanic reactivity and nucleation effect of nano-silica rather than synergistic promotion among multiple additives.
At the 28d curing age (Figure 13e,f), the amorphous gel phase further develops and coats crystalline hydration products in both groups, and the compactness of the two matrices is further elevated. Visible surface voids are rarely detected in the composite sample, and more hydration precipitates form on the surface of fly ash microspheres; meanwhile, the quantity of exposed unreacted microspheres declines relative to early ages. This observation suggests partial participation of fly ash in pozzolanic reactions, where fly ash consumes calcium hydroxide to produce supplementary amorphous gel products and optimizes the macroscopic mechanical performance of the matrix.
4. Test Results and Analysis of Impermeability and Drying Shrinkage Performance
To investigate how nano-silica, fly ash and bentonite affect the impermeability and drying shrinkage performance of cement-based grouting materials as composite modifiers, a systematic comparative test scheme was designed. A total of five groups of tests were set up, namely: pure cement slurry group (A), verification test mix proportion slurry group (B), only nano-silica addition group (C), only fly ash addition group (D), and only bentonite addition group (E). At the same time, in order to eliminate the influence of working performance differences on the impermeability and drying shrinkage performance of the materials, the dosage of the water reducer in each group of tests was adjusted to ensure that the fluidity of each slurry was the same. The test ratio is shown in Table 22. The dosages of each component are listed in Table 23. The test results of slurry fluidity are shown in Table 24.
Table 22.
Five sets of test ratios.
Table 23.
Component dosages.
Table 24.
Test results of slurry fluidity.
4.1. Impermeability Test
This experiment measures the impermeability performance of the slurry by using the impermeability pressure value. The test results showing the influence of each group of slurry on its impermeability performance are presented in Table 25.
Table 25.
Permeation resistance pressure.
The results of the water resistance test show that, compared with the pure cement slurry, the water resistance performance of all the other groups has improved except for the group with only fly ash addition. The water resistance pressure of the group with only nano-silica addition (C) is 0.86 MPa, which is 17.81% higher than the benchmark group. This is attributed to its micro-filling effect and the formation of C-S-H gel by the reaction with volcanic ash, which fills the micropores. The water resistance pressure of the group with only fly ash addition (D) is 0.52 MPa, which is 28.77% lower than the benchmark group. This is due to the reduction in effective cementitious materials and insufficient early pozzolanic reaction. The water resistance pressure of the group with only bentonite addition (E) is 0.91 MPa, which is 24.66% higher than the benchmark group. This is because of the expansion filling effect of bentonite and the film-forming water-blocking effect. The verification test mix proportion slurry group (B) has the highest water resistance pressure of 1.05 MPa, which is 43.84% higher than the benchmark group. It significantly outperforms each of the single addition groups, indicating that the combination of nano-silica, fly ash, and bentonite has a significant synergistic water resistance effect.
4.2. Drying Shrinkage Performance Test
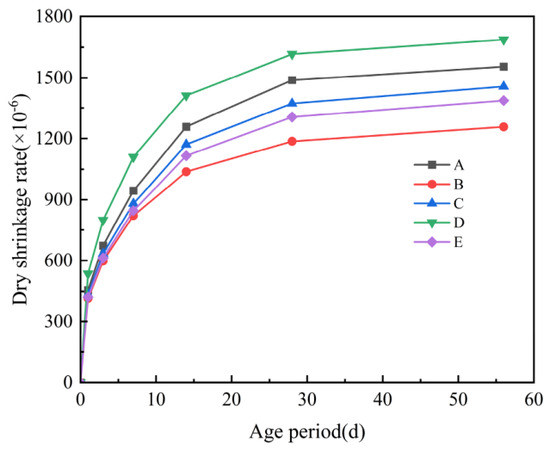
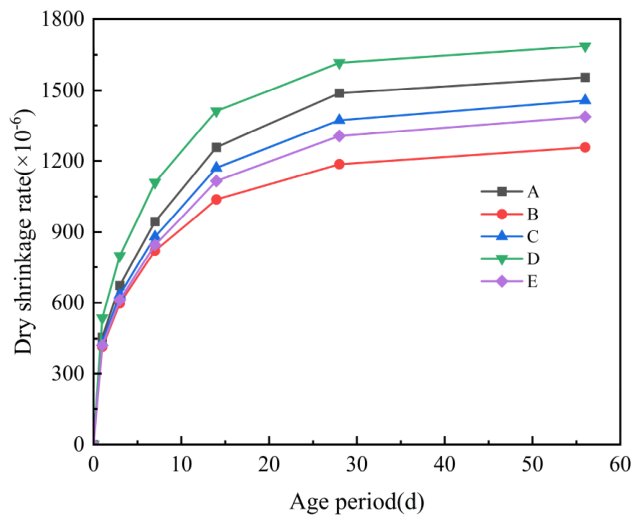
For the drying shrinkage test, three parallel specimens were prepared for each group, with a total of 15 specimens. The test results and corresponding standard deviations are presented in Table 26. As shown in Figure 14, the drying shrinkage values of each group increased with the extension of age, growing rapidly in the early stage and then slowing down in the later stage. The verification test mix proportion slurry group (B) had a drying shrinkage rate of 1257 × 10−6 at 56 days, which was 19.16% lower than that of the pure cement group (A), and was significantly lower than that of each single-component addition group (C, D, E). Its excellent anti-shrinkage property is attributed to the comprehensive modification performance of the three components: nano-silica continuously undergoes pozzolanic reaction to generate low calcium-silica ratio C-S-H gel, filling the capillary pores and refining the pore structure; bentonite, with its layered structure, absorbs water and expands directly to compensate for chemical shrinkage and drying shrinkage; fly ash, with its spherical particles, exerts a micro-aggregate effect and optimizes the particle grading. Due to the single-functionality of each single-component addition group (the pure cement group has a loose structure, the nano-silica group lacks volume compensation, the fly ash group has slow early hydration, and the bentonite group has secondary shrinkage in the later stage), the dry shrinkage values of these groups are all higher than that of the verification test mix proportion compound addition group.
Table 26.
Drying shrinkage rates of five groups of specimens at different curing ages (×10−6).
Figure 14.
The drying shrinkage rate of the sample at different ages.
4.3. Limitations of This Study
In this experiment, the dosage of superplasticizer was adjusted differentially for Groups A to E to unify the fluidity of all slurries. The fluctuation of superplasticizer dosage ranging from 0.70% to 1.00% can alter the pore structure of slurry, thereby exerting additional influences on the drying shrinkage and impermeability of hardened specimens. Therefore, the performance differences among all groups arise from the combined effects of fly ash, nano-silica, bentonite and superplasticizer. The interference induced by superplasticizer cannot be completely eliminated, so the performance variations cannot be solely attributed to mineral-modified components. Meanwhile, the existing macroscopic performance test data fail to quantitatively separate the independent effect of a single component. In this manuscript, we only infer a synergistic improvement trend of the composite system based on the variation of macroscopic properties, and the experimental conditions to directly verify the component synergistic effect are not available at present.
5. Conclusions
This research is based on the actual requirements of the behind-wall grouting materials for shield tunnel construction. Using Portland cement as the base material, nano-silica, fly ash and bentonite are added for composite modification. Through macroscopic and microscopic experiments, the key engineering characteristics and impermeability and drying shrinkage performance of the modified slurry were deeply studied. The main conclusions obtained are as follows:
- (1)
- Through orthogonal experiments combined with the range analysis method, the verification test mix proportion was determined as a water–binder ratio of 0.7, 2% nano-silica, 40% fly ash, and 6% bentonite. This ratio of slurry significantly improved the performance compared to pure cement slurry. The water loss rate decreased by 61.90%, and the 3d, 7d, and 28d compressive strengths increased by 30.6%, 36.08%, and 20.08% respectively. The fluidity slightly decreased by 6.38%.
- (2)
- Through XRD and SEM tests, it was found that the composite modification did not change the type of hydration products but significantly optimized the microstructure. Nano silica accelerated hydration through the early pozzolanic reaction, causing the hydration products to interweave and coat the calcium aluminosilicate crystals, enhancing the compactness of the matrix. Fly ash participated in the reaction in the later stage of hydration to form secondary hydration products, filling the pores and enhancing the interfacial bonding. The two, together with bentonite, worked synergistically to construct a dense and continuous microstructure, providing support for the improvement of macroscopic properties.
- (3)
- Through tests on water impermeability and drying shrinkage, it was confirmed that the verification test mix proportion group outperformed the benchmark group and the single admixture group in terms of impermeability and drying shrinkage performance. The impermeability pressure was increased by 43.84% compared to the benchmark group, and the 56-day dry shrinkage rate was reduced by 19.16%. Through the synergistic mechanism of hydration regulation, pore structure refinement, and water absorption expansion compensation, the material’s impermeability and volume stability were effectively enhanced.
- (4)
- Compared with ordinary cement slurry, this composite grouting material possesses prominent engineering advantages: low drying shrinkage, excellent anti-permeability, stable construction performance of fresh slurry, and superior mechanical properties of hardened stone. Utilizing the solid waste resource of fly ash can reduce the amount of cement used. This paper only verifies the basic performance of the modified slurry through indoor experiments, lacking on-site simulation tests. It only proves from the perspective of indoor material properties that this slurry has application potential, and further on-site verification is still needed for actual engineering applications.
Author Contributions
Methodology, J.Y.; Investigation, Z.Z.; Writing—review and editing, C.Y.; Resources, C.Y.; Supervision, Q.N. and J.Y.; Conceptualization, D.T.; Formal analysis, P.L.; Data curation, J.J.; Project administration, J.J. All authors have read and agreed to the published version of the manuscript.
Funding
This research was funded by Yuehai Yuexi Water Supply Co., Ltd.
Data Availability Statement
The original contributions presented in this study are included in the article. Further inquiries can be directed to the corresponding author.
Acknowledgments
This work was supported by the Yuehai Yuexi Water Supply Co., Ltd. These sources of support are gratefully acknowledged.
Conflicts of Interest
Authors J.J.; D.T.; P.L.; Q.N.; Z.Z. were employed by the company Yuehai Yuexi Water Supply Co., Ltd. The remaining authors declare that the research was conducted in the absence of any commercial or financial relationships that could be construed as potential conflicts of interest.
References
- Karami, M.; Zare, S.; Rostami, J. Tracking of disc cutter wear in TBM tunneling: A case study of Kerman water conveyance tunnel. Bull. Eng. Geol. Environ. 2021, 80, 201–219. [Google Scholar] [CrossRef] [Scilit]
- Hu, J.; Liang, Y.; Hu, Y.; Li, X. Research progress on operation safety assurance technologies for double-layer lined water conveyance tunnels. Hydro-Sci. Eng. 2025, 2025, 111–125. [Google Scholar]
- Wei, X.; Zhang, B.; Lu, L.; Liu, Y.; Zhu, H.; Wang, H. Discussion on several core issues of synchronous grouting in shield tunnels. Mod. Tunn. Technol. 2022, 59, 10–12. [Google Scholar]
- Ye, F.; Xia, T.; Ying, K.; Li, Y.; Liang, X. Optimal method for selecting the compatibility of grouting slurry behind the shield tunnel wall and the ground layer. J. Geotech. Eng. 2022, 44, 2225–2233. [Google Scholar]
- Zhu, C.; Fu, J.; Wang, H.; Xia, Y.; Yang, J.; Wang, S. A review of grout diffusion mechanisms and quality assessment techniques for backfill grouting in shield tunnels. Buildings 2026, 16, 97. [Google Scholar]
- Sha, F.; Yang, N.; Wang, Q.; Liu, F.; Fan, X. Property and applicability of shield grouting material: State of the art and perspectives. Case Stud. Constr. Mater. 2025, 22, e04137. [Google Scholar] [CrossRef] [Scilit]
- Qi, W.; Yang, Z.; Jiang, Y.; Yang, X.; Shao, X.; An, H. Experimental study on fresh state properties of single-liquid semi-inert synchronous grouting for shield tunnels in water-rich sand strata. Arab. J. Sci. Eng. 2022, 47, 4639–4655. [Google Scholar]
- Wang, S.; He, C.; Nie, L.; Zhang, G. Study on the long-term performance of cement-sodium silicate grout and its impact on segment lining structure in synchronous backfill grouting of shield tunnels. Tunn. Undergr. Space Technol. 2019, 92, 103015. [Google Scholar] [CrossRef] [Scilit]
- Du, C.; Shi, K.; Yi, F.; Wang, M.; Jiang, X. Degradation mechanism of cement–sodium silicate hardened grout bodies under ion erosion. Constr. Build. Mater. 2024, 446, 138009. [Google Scholar] [CrossRef] [Scilit]
- Chen, P.; Wang, X.; Zhou, A.; Liu, S.; Wang, J. Research and application of cement-sodium silicate two-component synchronous grouting material in shield tunnel. J. Railw. Sci. Eng. 2024, 21, 5163–5174. [Google Scholar] [CrossRef] [Scilit]
- Wang, D.; Li, Z.; Qi, Y.; Wei, D.; Zhao, X.; Zhang, J.; Min, F. Study on the performance evolution law and microscopic mechanism of cement–sodium silicate grout prepared by seawater. Materials 2026, 19, 971. [Google Scholar] [CrossRef] [Scilit] [PubMed]
- Che, Z.; Wang, T.; Zhou, Z.; Wang, S.; Ma, X. Research on cement-free grouting material for shield tunneling in water-rich karst regions. Materials 2025, 18, 1192. [Google Scholar] [CrossRef] [Scilit] [PubMed]
- Zhang, B.; Tan, H.; Shen, W.; Xu, G.; Ma, B.; Ji, X. Nano-silica and silica fume modified cement mortar used as Surface Protection aterial to enhance the impermeability. Cem. Concr. Compos. 2018, 92, 7–17. [Google Scholar] [CrossRef] [Scilit]
- Bahadori, H.; Hosseini, P. Reduction of cement consumption by the aid of silica nano-particles (investigation on concrete properties). J. Civ. Eng. Manag. 2012, 18, 416–425. [Google Scholar] [CrossRef] [Scilit]
- Sharma, M.; Bhushan, R.; Medepalli, S.; Bishnoi, S. Investigating the physical and chemical contribution of ground low-quality fly ash particles to cementitious composites. Adv. Cem. Res. 2022, 34, 379–387. [Google Scholar] [CrossRef] [Scilit]
- Jiang, P.; Zhang, J.; Zhu, Z. Research on the mechanism of strength increase in fly ash cement soil and its experimental verification. Shanxi Archit. 2019, 45, 31–34. [Google Scholar]
- Wang, Q.; Yin, M.; Huang, T. Image analysis of the strengthening mechanism of glass microspheres on fly ash aerated concrete. New Build. Mater. 2018, 45, 31–34. [Google Scholar]
- Akmalaiuly, K.; Berdikul, N.; Pundienė, I.; Pranckevičienė, J. The effect of mechanical activation of fly ash on cement-based materials hydration and hardened state properties. Material 2023, 16, 2959. [Google Scholar] [CrossRef] [Scilit]
- Maeijer, P.; Craeye, B.; Snellings, R.; Kamyab, H.; Loots, M.; Janssens, K.; Nuyts, G. Effect of ultra-fine fly ash on concrete performance and durability. Constr. Build. Mater. 2020, 263, 120493. [Google Scholar] [CrossRef] [Scilit]
- Wu, F.; Zhu, X.; Miao, X.; Xu, F.; Ma, J. Research on the Anti-seepage and Freeze-Thaw Resistance Properties of Cement-Gasification Slag-Modified Bentonite Vertical Barrier Wall Materials. J. Environ. Eng. Technol. 2026, 16, 272–278. [Google Scholar]
- Chokri, M.; Azougagh, O.; Bojaddayni, I.; Jalafi, I.; Ouardi, Y.; Jilal, I.; Ahari, M.; Salhi, A.; Idrissi, A.; Bendahhou, A.; et al. Progress in bentonite clay modification and enhancing properties to industrial applications: A review. Mater. Chem. Phys. 2025, 337, 130486. [Google Scholar] [CrossRef] [Scilit]
- Hu, Y.; Dong, L.; Lai, Z.; He, Y.; Yan, T.; He, X.; Wu, J.; Lu, Z.; Lv, S. Effects of bentonite on pore structure and permeability of cement mortar. Constr. Build. Mater. 2019, 224, 276–283. [Google Scholar] [CrossRef] [Scilit]
- Sun, P.; Wei, B.; Habiyakare, E.; Bin, B.; Wang, L.; Peng, C.; Ji, W.; Cao, H.; Yang, H. Rheological and mechanical properties of bentonite–cement paste reinforced with basalt fibers. Materials 2023, 16, 3226. [Google Scholar] [CrossRef] [Scilit] [PubMed]
- Liu, M.; Hu, Y.; Lai, Z.; Yan, T.; He, X.; Wu, J.; Lu, Z.; Lv, S. Influence of various bentonites on the mechanical properties and impermeability of cement mortars. Constr. Build. Mater. 2020, 241, 118015. [Google Scholar] [CrossRef] [Scilit]
- GB/T 1596-2017; Fly Ash Used for Cement and Concrete. China Standards Press: Beijing, China, 2017.
- Madani, H.; Bagheri, A.; Parhizkar, T. The pozzolanic reactivity of monodispersed nanosilica hydrosols and their influence on the hydration characteristics of Portland cement. Cem. Concr. Res. 2012, 42, 1563–1570. [Google Scholar] [CrossRef] [Scilit]
- GB/T 50448-2015; Technical Specifications for Application of Cement-Based Grouting Materials. China Building Industry Press: Beijing, China, 2015.
- JGJ/T 70-2009; Basic Performance Test Methods for Building Mortar. China Building Industry Press: Beijing, China, 2009.
- T/CECS 563-2018; Procedures for the Application of Synchronous Grouting Materials in Shield Tunnel Construction. China Building Industry Press: Beijing, China, 2018.
- GB/T 1346-2024; Test Methods for Standard Consistency Water Content, Setting Time and Soundness of Cement. China Standards Press: Beijing, China, 2024.
- Ellis, K.; Silvestrini, R.; Varela, B.; Alharbi, N.; Hailstone, R. Modeling setting time and compressive strength in sodium carbonate activated blast furnace slag mortars using statistical mixture design. Cem. Concr. Compos. 2016, 74, 1–6. [Google Scholar] [CrossRef] [Scilit]
- GB/T 17671-2021; Test Method for Cement Mortar Strength (ISO Method). China Standards Press: Beijing, China, 2021.
- JC/T 603-2004; Cement Mortar Dry Shrinkage Test Method. China Building Industry Press: Beijing, China, 2004.
- Jiao, H.; Chen, H.; Hao, Q.; Gao, M. Static mechanical property test of calcareous sand solidified by nano-silica and ultra-fine Cement. Geotech. Eng. Technol. 2022, 36, 252–258. [Google Scholar]

Disclaimer/Publisher’s Note: The statements, opinions and data contained in all publications are solely those of the individual author(s) and contributor(s) and not of MDPI and/or the editor(s). MDPI and/or the editor(s) disclaim responsibility for any injury to people or property resulting from any ideas, methods, instructions or products referred to in the content. |
© 2026 by the authors. Licensee MDPI, Basel, Switzerland. This article is an open access article distributed under the terms and conditions of the Creative Commons Attribution (CC BY) license.