


Abstract
To improve nitrogen (N) fertilizer management in vineyards and support sustainable production, we conducted field experiments in 2021–2022 to evaluate the effects of reduced N fertilization combined with organic fertilizer (OF) on vine growth, fruit quality, soil fertility, and economic returns in Shine Muscat grapes. Six treatments were established: conventional fertilization (CF), four reduced-N treatments combined with OF (0.9N + OF to 0.6N + OF; i.e., 10–40% N reduction), and a blank control (CK). Yield was significantly increased under 0.8N + OF (18.2% in 2021; 96.0% in 2022) and 0.7N + OF (10.8% in 2021; 47.9% in 2022), with 0.8N + OF also delivering the highest economic returns. Fruit quality analysis showed that 0.8N + OF consistently increased total sugar and the sugar–acid ratio, and improved vitamin C content. Substitution ratios >40% led to a decline in economic benefits. Path analysis indicated that vertical diameter and single-berry weight exerted significant positive effects on total yield. OF substitution also improved fruit quality. Soil available nutrients (N, P, and K) and organic matter were primary factors influencing yield; potassium was the key factor regulating sugar accumulation, with the strongest effect on improving flavor coordination. Reducing N by 20–30% combined with OF (particularly the 0.8N + OF treatment) synergistically enhanced photosynthetic efficiency, N utilization, yield and quality, and soil fertility, representing the optimal fertilization strategy.
1. Introduction
Grapes are the most economically important drought-tolerant crops worldwide and adapt well to diverse environmental stressors [1]. Their global popularity is due to their distinctive taste, flavor profile, and nutritional value. The optimal growth of grapevines relies primarily on nitrogen, potassium, and phosphorus. The availability of these soil nutrients is crucial for determining the productivity and quality of grape yields, highlighting the importance of appropriate fertilizer application [2]. However, driven by economic interests, excessive application of fertilizers during the grape cultivation process is common. This not only leads to considerable waste of nutrient resources, but also causes continuous deterioration of soil quality [3]. With advancements in orchard intensification practices, the strategic management of water and fertilizer resources is increasingly crucial for fruit growers [4]. This mismanagement depletes soil organic matter (SOM) and overall soil fertility, ultimately compromising grape yield and quality [2,5,6], underscoring the need for more sustainable agricultural practices in grape cultivation.
Organic fertilizers (OFs) are pivotal for preserving natural resources, increasing soil organic carbon, improving soil structure, mitigating the adverse environmental effects of mineral fertilizers, and promoting the survival of diverse organisms [7,8,9]. Specifically, OFs effectively enrich soil microbial communities, maintain optimal pH levels, and provide essential minerals [10,11,12]. However, although fertilization can substantially improve fruit weight in crops such as apple and tomato, its effect on grape berry size and size distribution may be limited under certain conditions [13]. Additionally, as base fertilizers, OFs support grape growth and development by providing organic matter and trace elements [14]. However, OFs have lower nutrient concentrations and slower nutrient release rates, which may reduce their short-term effectiveness for grape production [15,16].
Chemical fertilizers typically exhibit increased nutrient analysis but may result in environmental pollution, soil degradation [17], and altered microbial diversity [18]. A balanced approach involving the partial replacement of conventional fertilizers with OFs maintains soil fertility more effectively than the exclusive use of either fertilizer type [17]. Additionally, inorganic–organic compound fertilizers reduce overall fertilizer requirements and enhance long-term agroecosystem sustainability and productivity [12]. Therefore, strategically reducing chemical fertilizer use while increasing OF application may achieve balanced agricultural management.
The synergistic effects of combined N fertilizer and OF on quality parameters have shown an optimization effect for peaches [19], pears [20], grapes [21], and bananas [22]. Specifically, this fertilization regime improves grape quality and production efficiency, enhances soil fertility in vineyards [23], and influences grape juice pH levels by 0.1–0.3 units [21]. Additionally, in peach cultivation, the sugar–acid balance is optimized by increasing the soluble sugar content while reducing titratable acidity [20]. Recent advancements in bio-OFs have demonstrated their potential to enhance apple yield and SOM content while modulating the composition of dominant soil bacterial communities [24]. Thus, existing studies have focused primarily on the effect of fertilizers on fruit quality, frequently neglecting their effects on soil fertility. Consequently, a notable research gap exists regarding the effect of reduced-N fertilizer application combined with varying proportions of OF on grape fruit quality and soil properties.
With the increasing emphasis on sustainable agriculture and optimizing fertilizer efficiency while reducing chemical inputs, we conducted a two-year field experiment with multiple treatments and replications to comprehensively evaluate the effects of OF substitution. In this study, we aimed to (i) assess the effect of partial chemical N replacement with OF on grape agronomic characteristics such as vine growth, leaf chlorophyll content, and biomass accumulation and fruit quality; (ii) investigate the effects of this replacement strategy on soil quality and microbial communities in grape orchards in Hunan, China; and (iii) evaluate the short-term benefits of OF in replacing chemical N fertilizers for yield and economic efficiency. This study provides empirical data for optimizing N fertilization in vineyards, showing that partial OF substitution can maintain yield while improving soil nutrients over 2 years. We hypothesized that partial substitution of chemical N fertilizer with OF would improve grape yield and fruit quality by enhancing soil nutrient availability and optimizing plant physiological traits, and that a moderate substitution rate (20–30%) would achieve the best balance between agronomic performance and economic return.
2. Materials and Methods
2.1. Site Description
The experiment was conducted from October 2020 to September 2022 in the Zhongkang Planting Vineyard, Yongan Town, Liuyang City, Changsha City, Hunan Province (N28.2271, E113.3460). The plantation cultivation mode was continuous steel-frame plastic film greenhouse cultivation with a rain shelter. The region has a humid subtropical monsoon climate with four seasons: wet spring, rainy summer, cold and dry autumn, and winter. The region experiences sufficient heat, a long frost-free period, abundant rainfall, an average annual temperature of 17.3 °C, an average annual sunshine duration of 1670 h, an average annual radiation amount of 106 MJ m−2, an annual frost-free period of 264 days, and an average annual precipitation of 1852 mm. This soil was a red clay field that had been developed from a quaternary red clay parent material. The fundamental physical and chemical characteristics of the soil are as follows: a pH level of 6.23, an organic matter content of 31.25 g kg−1, total N concentration of 0.91 g kg−1, total phosphorus level of 0.26 g kg−1, total potassium concentration of 6.88 g kg−1, alkali-hydrolytic N level of 95.63 mg kg−1, available potassium level of 158.42 mg kg−1, and alkali-hydrolytic nitrogen level 8.15 mg kg−1.
2.2. Experimental Materials
The cultivar used in this study was “Shine Muscat”, a table grape variety. At the time of the experiment, the vines were three years old and grafted onto “Beda” rootstock. The trunk height of approximately 165 cm ensured that the main stem could be properly tied to the trellis, with the fruiting branches distributed evenly along the horizontal wires. The trees were planted in two rows in a wide ditch, with a single tree type, a row distance of 200 × 120 cm, and a cultivation density of 1050 trees ha−1. Steel-frame greenhouses (borrowed from Planting Vineyard, Yongan Town, Liuyang, Hunan, China)were erected beneath the rain shelters. The OF used in this study was commercially available, derived from decomposed livestock manure, with nutrient content of N 1.70%, P2O5 2.40%, and K2O 2.20%, standard urea fertilizer (N content: 46%), calcium magnesium phosphate fertilizer (P2O5 content: 16%), and potassium sulfate (K2O content: 52%). Total N input varied among treatments, with OF being used to replace 10–40% of chemical N while maintaining constant P and K rates.
2.3. Experimental Design and Management
Each plot was 20 m long × 1.2 m wide (Figure S1). Ten grape plants with three replicates (10 plants per replicate) were arranged in a randomized block design, with OF and calcium magnesium phosphate as base fertilizers throughout the year. Urea was applied in split doses, with the proportion of total N applied at each growth stage as follows: base fertilizer, 33.4%; bud burst fertilizer, 15.5%; pre-flowering fertilizer, 13.5%; and berry development fertilizer, 37.6%. Potassium sulfate was applied in batches throughout the year according to a base fertilizer:sprouting fertilizer:pre-flowering fertilizer:swelling fertilizer ratio of 16.0:15.7:11.4:56.9. The first-year trial commenced with the application of the base fertilizer on 18 November 2020, followed by the first topdressing on 15 March 2021 (sprouting fertilizer), the second topdressing on 21 April (pre-flowering fertilizer), and the third topdressing on 20 May (swelling fruit fertilizer). The initial topdressing (sprouting fertilizer) was applied on 7 November 2021, followed by a second topdressing (pre-flowering fertilizer) on 20 March 2022, and a third topdressing (swelling fruit fertilizer) on 25 April. A strip application method was used, with deep strip trenches (20 cm deep × 50 cm wide) for soil fertilization, and fertilizers were applied evenly. Irrigation and pest control were performed as per standard procedures, whereas other field management practices were conducted uniformly.
According to the principles of conventional fertilization (CF) (fertilizer application only), when OF is used as a substitute for a portion of the fertilizer, it is administered as the fundamental fertilizer at a single time point. The quantities of N, P2O5, and K2O applied to the OF were converted to a 31:14:30 ratio to ensure that their total amounts were equivalent to those of CF. Six treatments were established (Table 1): (1) CF, using only fertilizer (urea, calcium magnesium phosphate, and potassium sulfate), with no OF; (2) OF replaced 10% of the fertilizer (N replacement amount, consistent throughout; 0.9N + OF); (3)–(5) OF replaced 20%, 30%, or 40% of the fertilizer (0.8N + OF, 0.7N + OF, or 0.6N + OF, respectively); and (6) CK (no nitrogen or OF applied, with only calcium magnesium phosphate and potassium sulfate supplied as basal nutrients).
Table 1.
Experimental design: fertilization methods and application rates (kg·ha−1).
Fertilizers used in the experiment were urea, calcium magnesium phosphate fertilizer, potassium sulfate, and commercial OF, and the fertilizer substitution rate was calculated as N. Annual amounts of N, P2O5 and K2O for CK were 0, 210, and 450 kg·ha−1 while annual amounts of N, P2O5 and K2O for other treatments were 465, 210, and 450 kg·ha−2, respectively. OF and calcium magnesium phosphate fertilizer were used as base fertilizer year-round. Urea was applied in batches throughout the year according to the ratio of base fertilizer:sprouting fertilizer:pre-flowering fertilizer:swelling fertilizer = 33.4:15.5:13.5:37.6. Potassium sulfate was applied in batches year-round according to the ratio of base fertilizer:sprouting fertilizer:pre-flowering fertilizer:swelling fertilizer = 16.0:15.7:11.4:56.9.
The annual dosages of nitrogen, phosphorus pentoxide (P2O5), and potassium oxide (K2O) for the control (CK) treatment were 0, 210, and 450 kg·ha−1, respectively. The annual concentrations of N, P2O5, and K2O for the remaining treatments were 465, 210, and 450 kg·ha−1, respectively.
2.4. Measurement Methods
2.4.1. Determining Functional Leaf SPAD Values and Leaf Photosynthetic Rate
For each plant, six new fruiting branches were selected. SPAD values were measured on three consecutive functional leaves from the base of each branch using a Minolta SPAD-502 chlorophyll meter (Konica Minolta, Inc., Tokyo, Japan) at the following phenological stages: sprouting (BBCH 07–09), flowering (BBCH 61–69), fruit development (BBCH 71–79), and berry ripening (BBCH 89) [25,26]. The three readings per branch were averaged for statistical analysis.
During the development of fruits, net photosynthetic rate (Pn), stomatal conductance (Gs), intercellular CO2 concentration (Ci), and transpiration rate (Tr) were measured on clear days between 9:00 and 11:30 using a Li-6400 portable photosynthesis system (LI-COR, Lincoln, NE, USA). The cuvette conditions were set as follows: photosynthetically active radiation at 1200 µmol m−2 s−1, flow rate at 500 µmol s−1, reference CO2 concentration at 400 µmol mol−1, and leaf temperature maintained at 25 ± 1 °C.
2.4.2. Measuring Dry Matter Accumulation
Vines were pruned according to standard local practices. Biomass measurements included all pruned branches, leaves, and berry ripening fruits from each plant. Samples were initially oven-dried at 105 °C for 30 min to inactivate enzymes, then dried at 75 °C. The fruit water content was calculated as follows: (fresh weight − dry weight)/fresh weight × 100%. The dry weight was determined after oven-drying to a constant value.
2.4.3. Determining Plant Nutrient Content
Samples of pruned plants at each stage (vines and leaves, flowers and fruits, and ripe fruits, excluding winter-pruned branches and fallen leaves) were collected to determine the total fresh weight. Subsequently, 300 g of branch samples (including ≥100 g stems and fruits) were transported to the laboratory, washed, and placed in an oven. Initially, the plant material was heated at 105 °C for 1 h to inactivate enzyme activity, resulting in cell death, and was subsequently dried at 80–85 °C for 3–4 h. The fruit was dried at 60–70 °C for 1 week. The samples were baked until a constant weight was achieved, after which the dry weight was recorded. The dry-to-fresh weight ratio was calculated, and the total dry weight was converted. The material was then cooled, ground using a grinder, passed through a 40−mesh sieve, and packed in a Ziploc bag. The nutrient content of the shoot was determined by H2SO4–H2O2 digestion. Nitrogen content was determined by Kjeldahl digestion using a KDN-102C apparatus (Shanghai Xianjian Instruments Co. Ltd., Shanghai, China), and nutrient uptake was calculated by multiplying the nutrient content by shoot biomass:
N agronomic efficiency (NAE, kg·kg−1) = (Yield in fertilized plot − Yield in unfertilized plot)/N application rate
Nitrogen use efficiency (NUE, %) = (Aboveground N uptake in fertilized plot −
Aboveground N uptake in unfertilized plot)/N application rate × 100
Aboveground N uptake in unfertilized plot)/N application rate × 100
2.5. Analyzing Grape Yield and Quality
Grapes were collected from several plots on a single occasion during the berry ripening period. An electronic scale was used to determine the yield and calculate the weight of the collected grapes in each district. For yield components, three representative clusters were randomly selected from each plot. From each cluster, ten berries were collected from the top, middle, and bottom positions, respectively, to measure berry weight, longitudinal diameter, and transverse diameter. For fruit quality analysis, ten healthy berries were randomly sampled from each plot, peeled, and homogenized for biochemical assays (vitamin C, soluble solids, etc.). The yield per unit area was converted according to the quality of the selected ears as registered in the district.
Comprehensive analyses of grape fruit quality, including vitamin C (Vc), reducing sugars, soluble proteins, and soluble solids, were conducted using the standard methods of Vc, reducing sugars, soluble proteins, and soluble solids. Ten healthy fruit samples were collected from each experimental plot to assess the fruit quality. The fruits were peeled, cut into small pieces, and homogenized for subsequent biochemical analyses. The Vc content was quantified using the 2,6-dichlorophenol indophenol reagent method according to AOAC (1995) [27]. The method involves extracting Vc from fresh fruit samples with oxalic acid solution, followed by titration with a standardized 2,6-dichlorophenol indophenol solution until a pink color persists. The reducing sugar content was determined following the 3,5-dinitrosalicylic acid method outlined by Song [28]. The soluble protein content was measured using the Coomassie Brilliant Blue G-250 staining method, according to the protocol established by Li et al. [29]. Additionally, soluble solid content was assessed using a portable reflectometer following the procedure described by Wang et al. [30].
2.6. Soil Sampling and Analysis
Soil samples from 0 to 100 cm (with an interval of 20 cm) were collected during the grape ripening periods in 2021 and 2022. At a distance of 25 cm from the main trunk of the grapevine, 5 sampling points were collected using a soil drill in an “S” shape. The soil samples from the same layer were mixed together and then brought back to the laboratory in sealed bags. After the collection was completed, the soil samples were air-dried and underwent a series of preparation steps, including grinding and continuous sieving using 20-mesh and 100-mesh nylon sieves.
The pH of the soil was measured using a ZD-type pH meter (Beijing Zhuochuan Electronic Technology Co., Ltd., Beijing, China) (with a water-to-soil ratio of 2.5:1); the organic matter content of the soil was determined by the potassium dichromate external heating method; the available phosphorus content of the soil was measured by the 0.5 mol·L−1 NaHCO3 extraction molybdenum–selenium anti-colorimetric method; the soil available potassium content was determined using a CH3COONH4 extraction FP6410 flame photometer (Shanghai Precision Scientific Instrument Co., Ltd., Shanghai, China); and the available nitrogen in the soil was quantitatively determined by the alkaline hydrolysis diffusion method.
Phosphorus was extracted using 0.5 molar sodium bicarbonate and determined by the molybdenum–selenium colorimetric method through an EdgeLight UV754 spectrophotometer (Shanghai Precision Scientific Instrument Co., Ltd., Shanghai, China). Available potassium was determined by cold HNO3 extraction flame photometry.
2.7. Statistical Analysis
All statistical analyses were performed using SPSS (version 17.0; IBM Corp., Armonk, NY, USA). A two-way analysis of variance (ANOVA) was conducted with year and treatment as fixed factors. When significant main effects or interactions were detected (p < 0.05), Tukey’s honestly significant difference (HSD) test was used for multiple comparisons to control the family-wise error rate. Path analysis was performed using AMOS (version 26.0; IBM Corp., Armonk, NY, USA) to evaluate the direct and indirect effects of yield components on total yield.
3. Results
3.1. SPAD Values and Dry Matter Accumulation
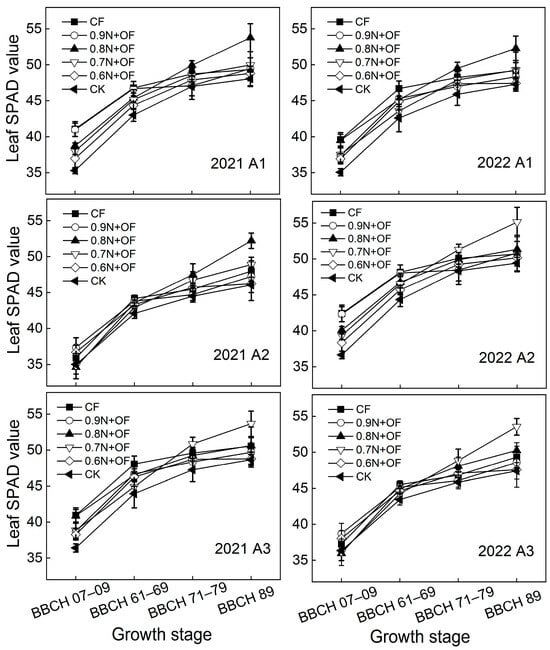
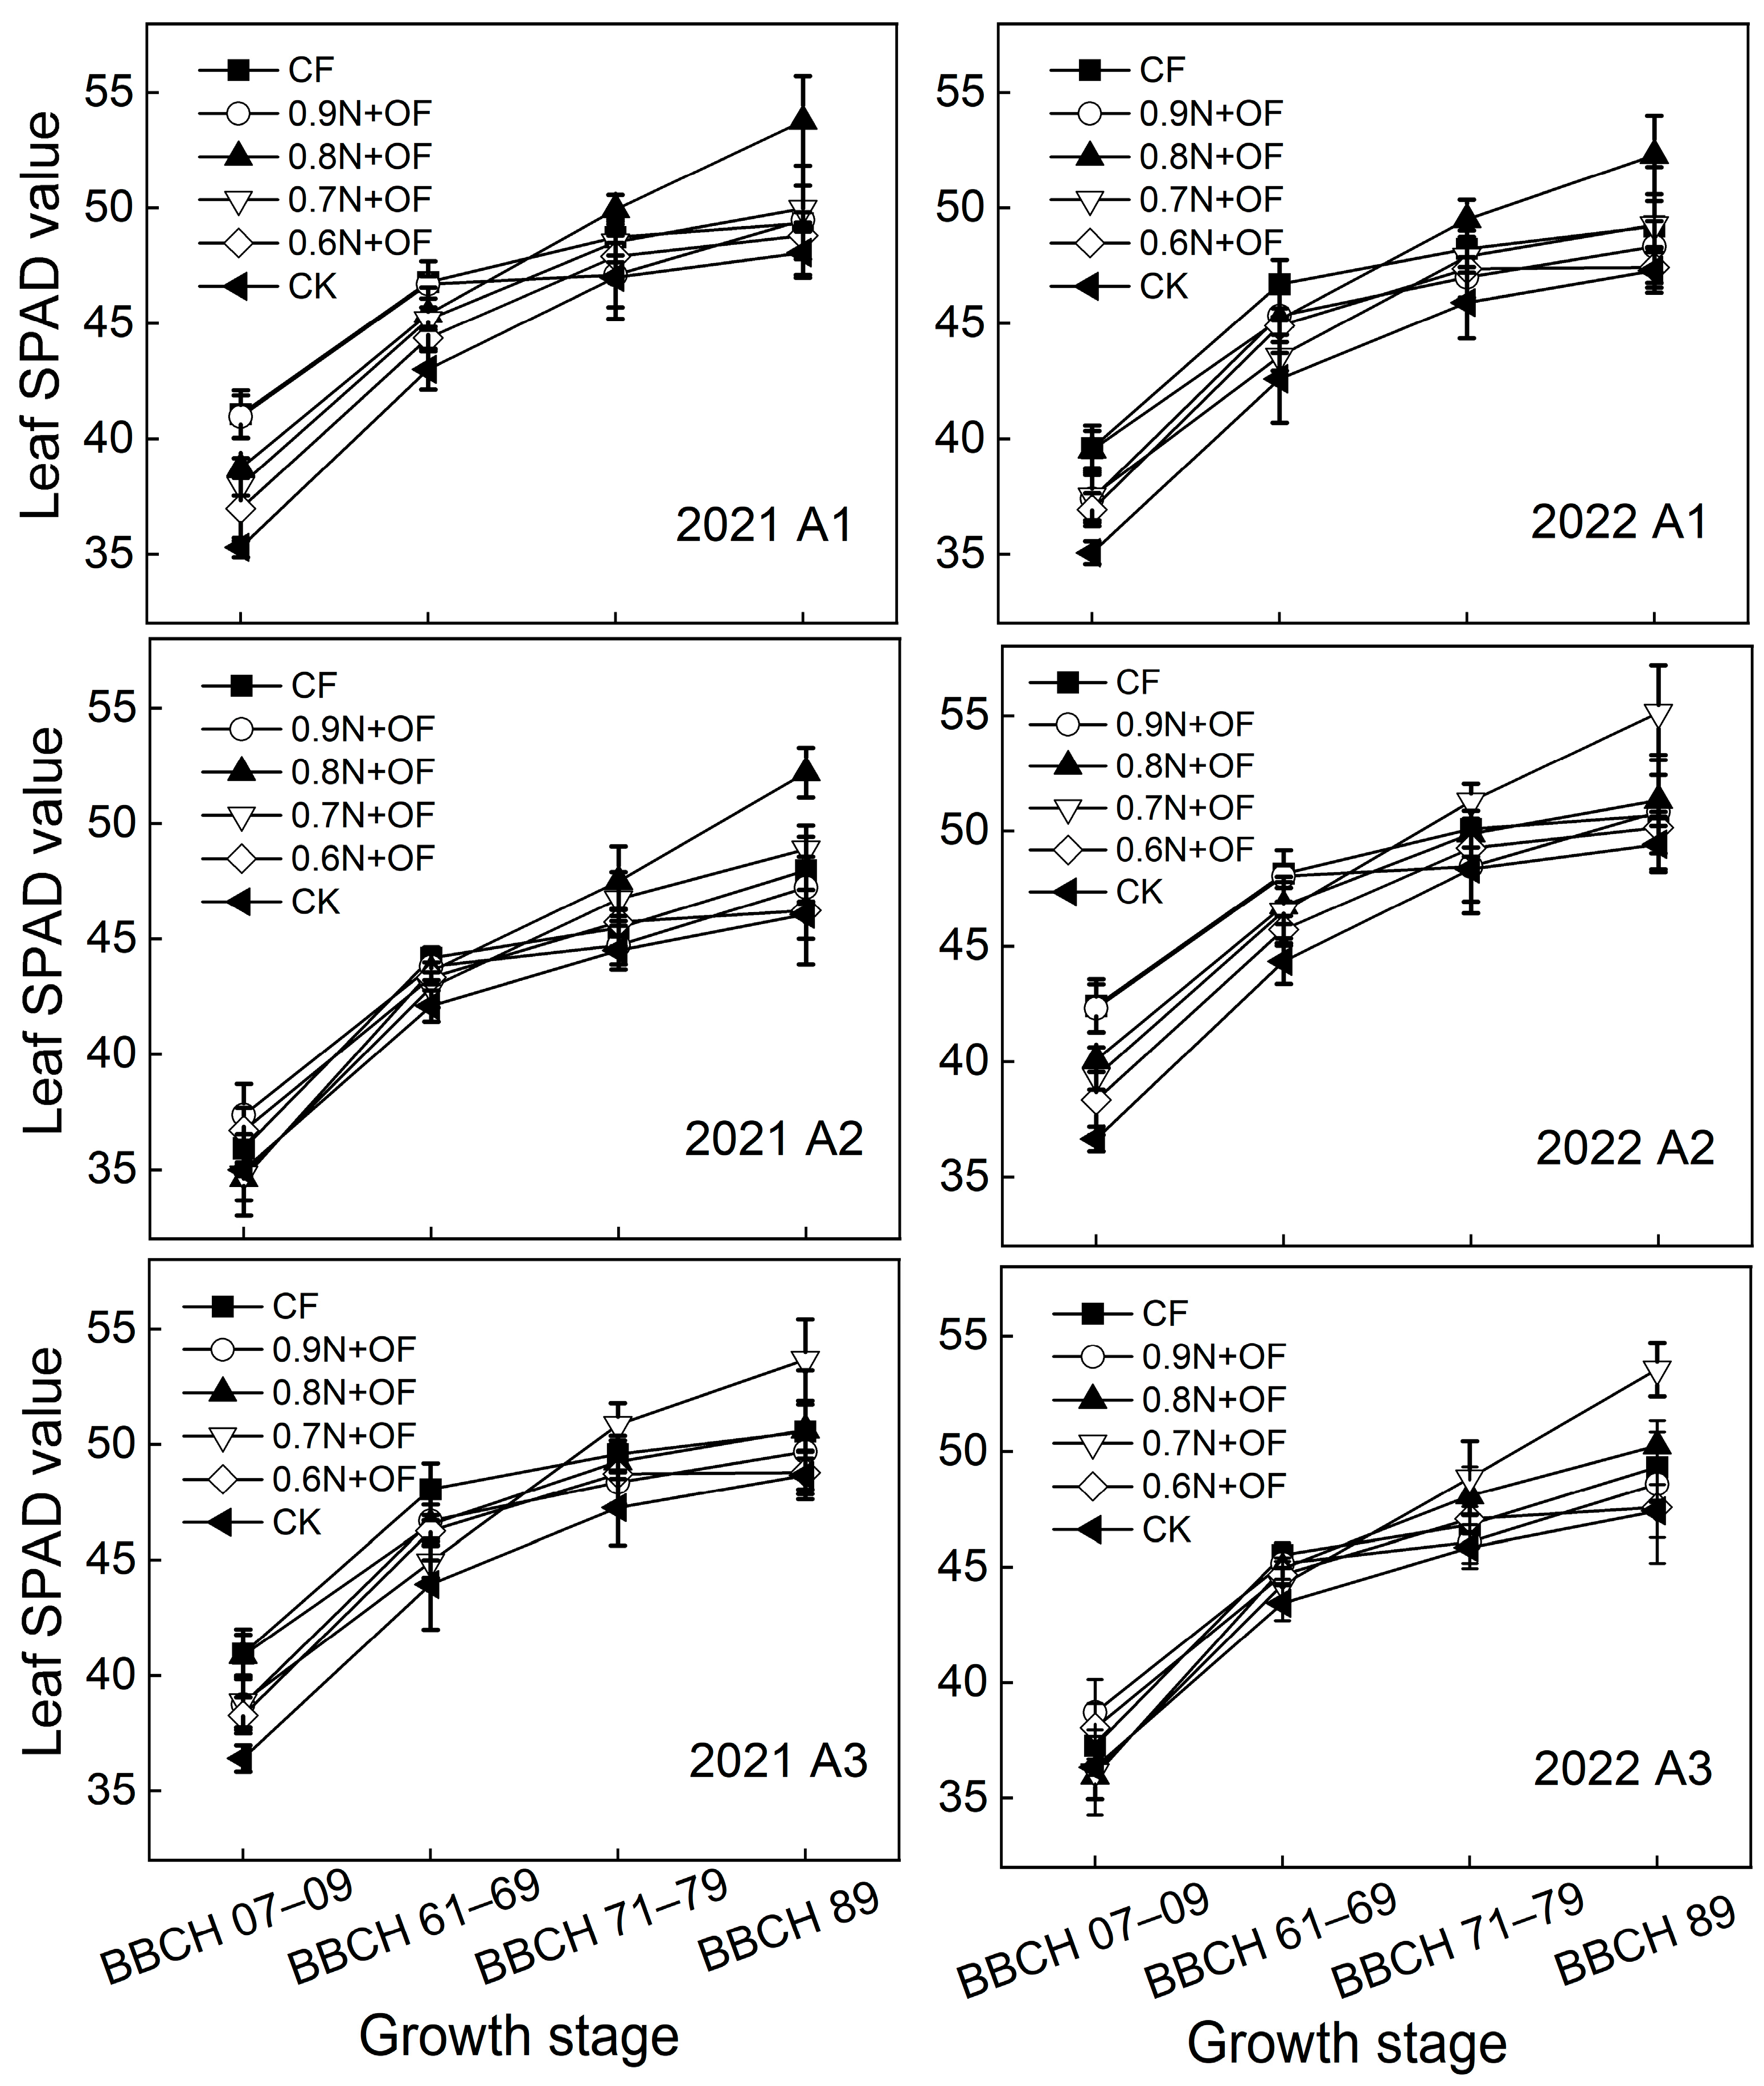
The chlorophyll content of grape leaves at different growth stages decreased in the following order: first > second > third leaf. Compared with those of the CF treatment, the mean table grape leaf SPAD values of the 0.8N + OF and 0.7N + OF treatments increased by 3.16% and 0.51% in 2021 and 3.28% and 0.45% in 2022, respectively. The mean SPAD values of 0.9N + OF and 0.6N + OF table grapes at the berry ripening stage exhibited declines of 1.00% and 2.74% (2021) and 1.00% and 2.74% (2022), respectively. However, the grape leaf SPAD value was highest at the 0.7N + OF fruit and berry ripening stages.
From sprouting to the flowering stage, the leaf SPAD values gradually increased with increasing OF proportion. The leaf SPAD values of the CF and 0.9N + OF treatments were significantly elevated. From the rising stage to the berry ripening stage, the leaf SPAD values initially increased and subsequently decreased with increasing OF proportion. The leaf SPAD values of the 0.7N + OF and 0.8N + OF treatments were relatively high (Figure 1). Therefore, an appropriate proportion of OF improved the leaf chlorophyll content during the fruit development and quality formation.
Figure 1.
Chlorophyll content of table grape leaves at different growth stages under different treatments. (A1) First leaf; (A2) second leaf; (A3) third leaf. CF, conventional fertilization; 0.9N + OF to 0.6N + OF indicate 10%, 20%, 30%, and 40% of chemical N replaced by organic N on an equal − N basis; CK: only calcium magnesium phosphate fertilizer and potassium sulfate were applied. Bars represent the standard deviations (n = 3). BBCH 07–09: Sprouting; BBCH 61–69: Flowering; BBCH 71–79: berry development; BBCH 89: berry ripening.
Two-way ANOVA revealed that the interaction between year and treatment was significant or highly significant for fruit dry matter and yield increase rate (Grapes: p < 0.05; Increasing rate: p < 0.01), while no significant interaction was observed for pruning-related indicators (early pruning, winter pruning) or total dry matter accumulation (p > 0.05). Dry matter accumulation improved following OF application. In 2021, the 0.8N + OF treatment exhibited the most significant increase in total dry matter accumulation compared with that of the CF treatment, reaching 20.21% (p < 0.05), followed by 0.7N + OF. In 2022, the 0.7N + OF treatment had the highest increase (24.40%), followed by 0.8N + OF. Consequently, OF was used to partially substitute chemical nitrogen fertilizers, resulting in a reduced quantity of nitrogen fertilizer, whereas grape biomass showed no significant difference among treatments (Table 2).
Table 2.
Dry matter accumulation of grapes during the whole growth period under different fertilization treatments.
3.2. Photosynthetic Characteristics
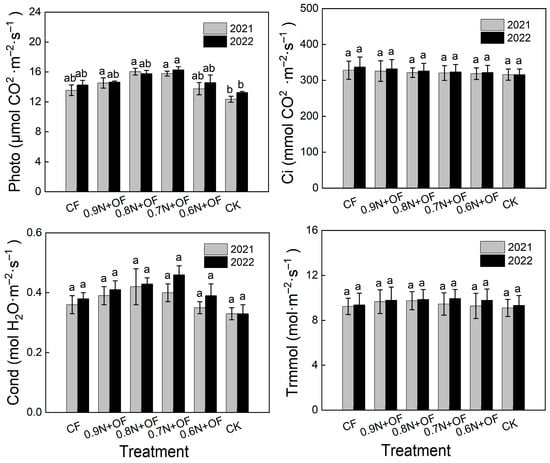
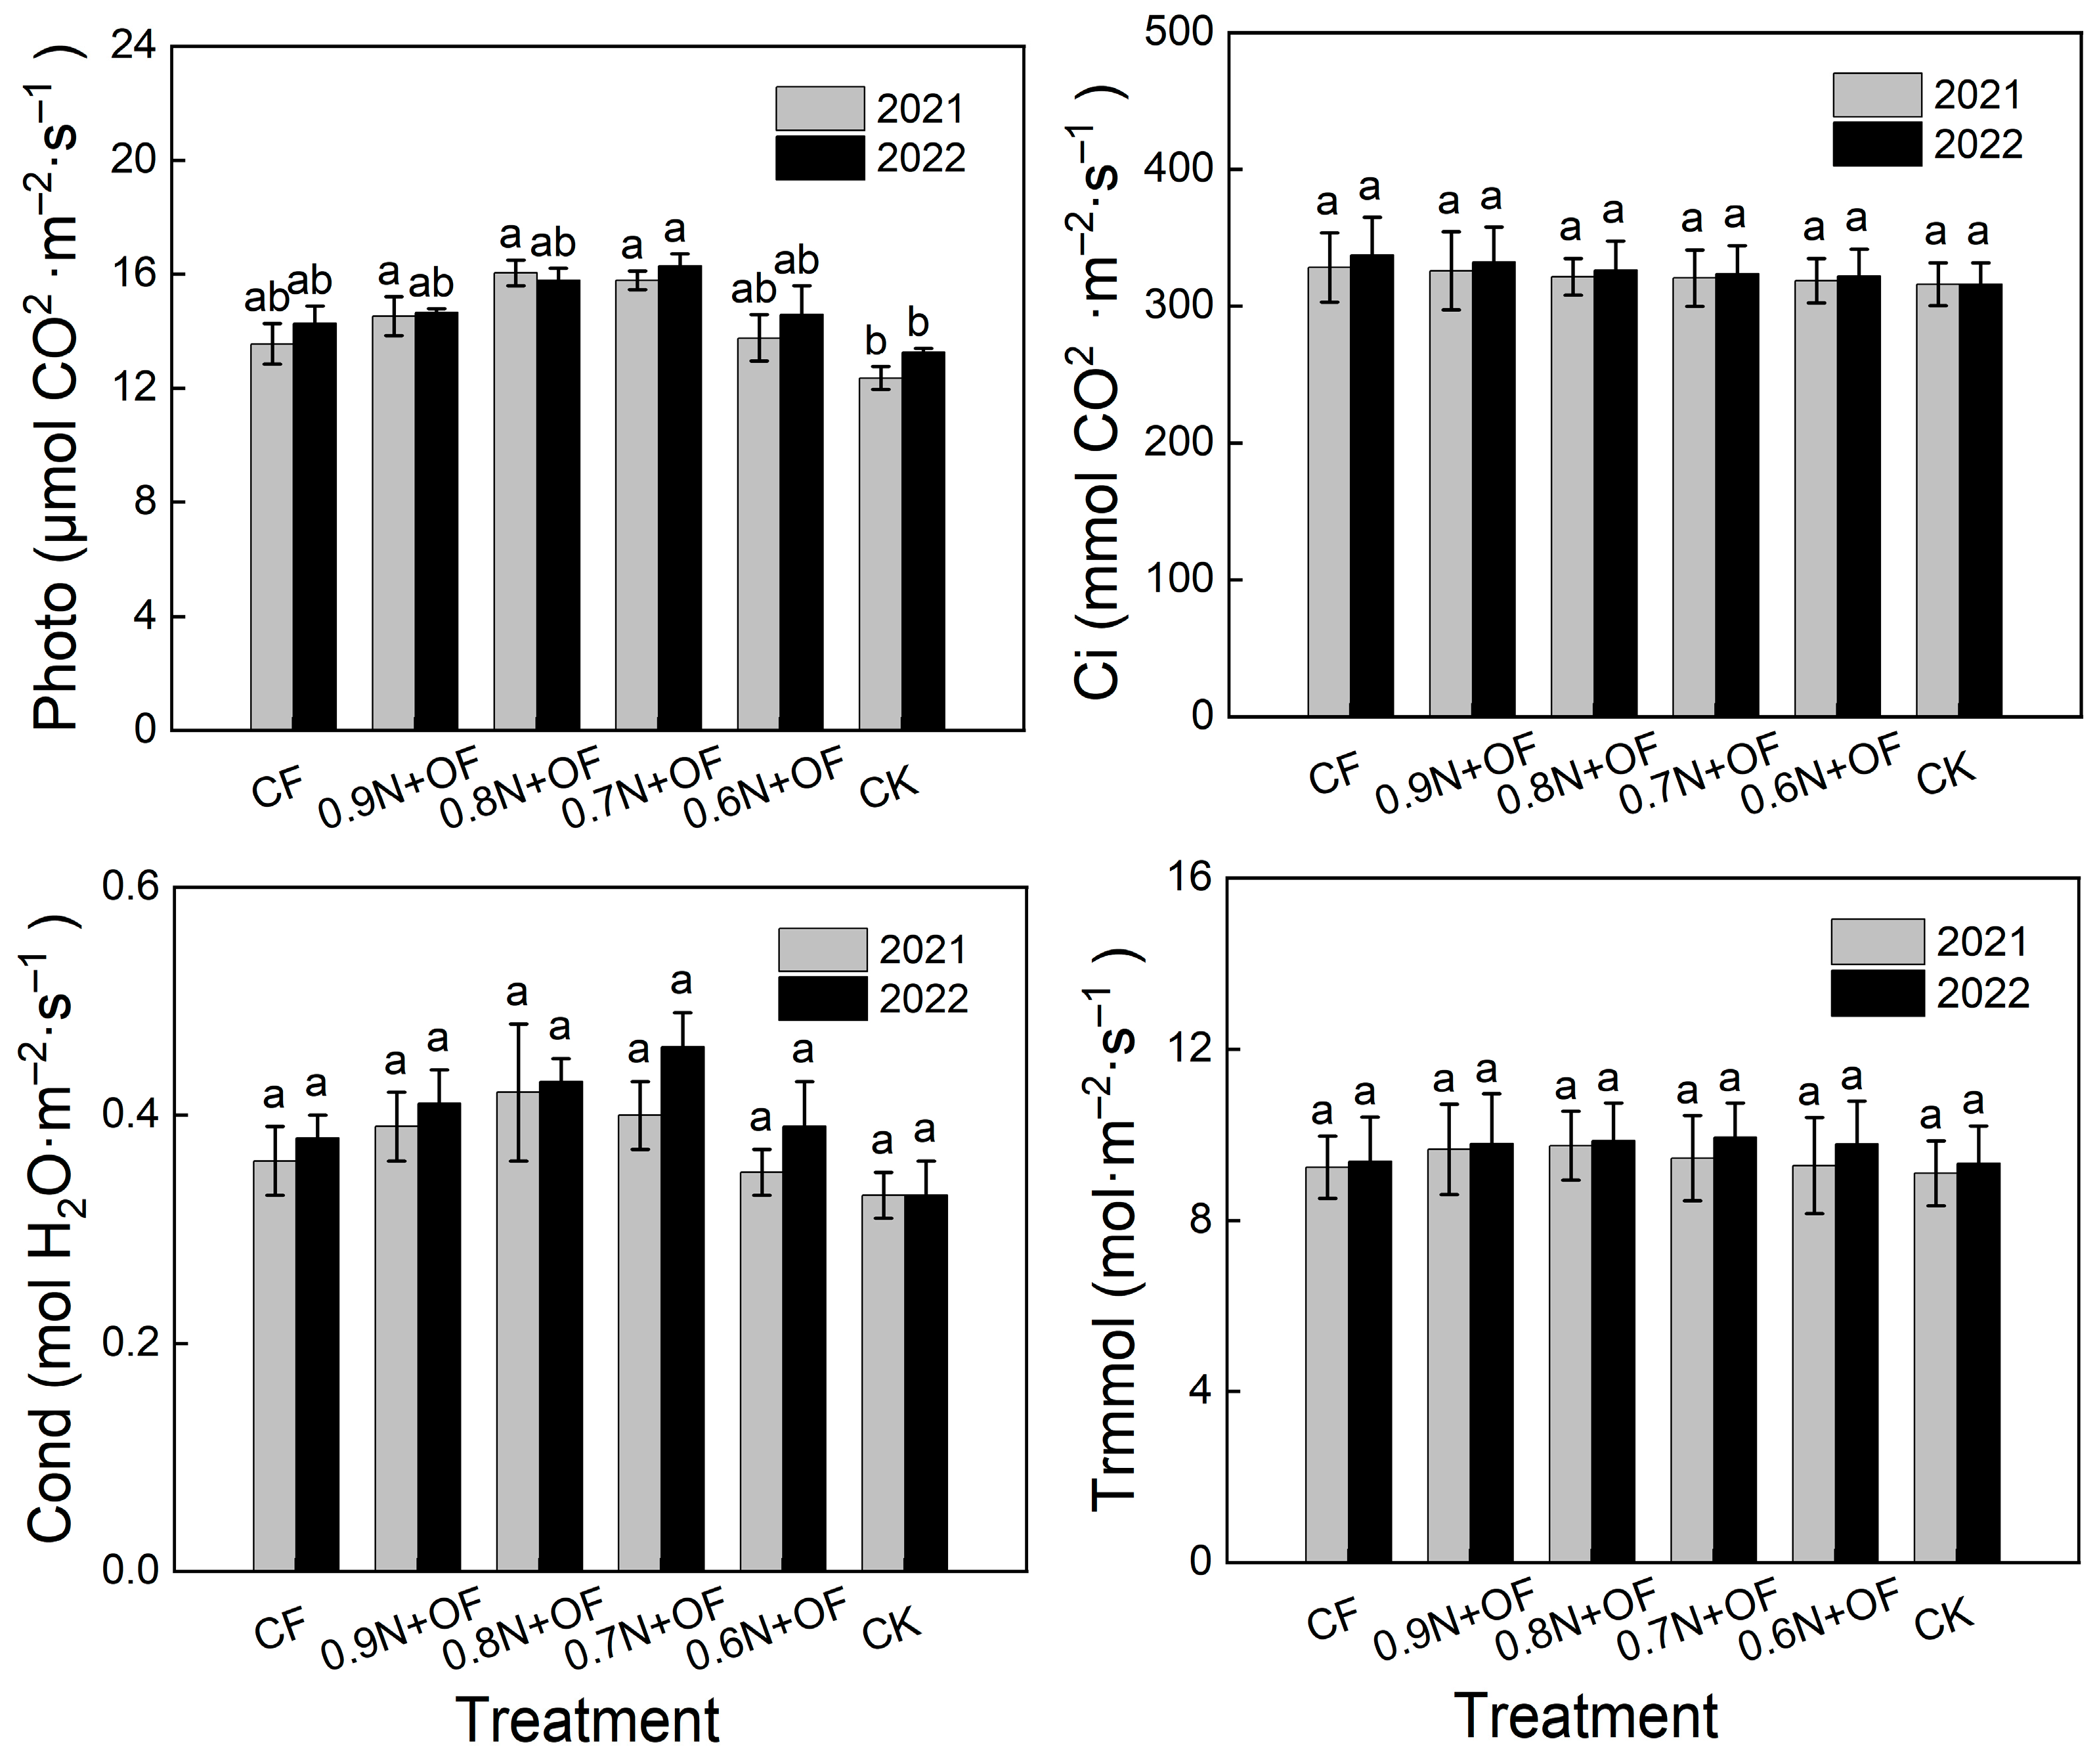
Figure 2 shows the effects of different fertilization treatments on four physiological indicators of plants, namely net photosynthetic rate, stomatal conductance, intercellular CO2 concentration, and transpiration rate. Compared with conventional fertilization (CF), the 0.8N + OF and 0.7N + OF treatments maintained net photosynthetic rate. In 2021, the 0.8N + OF treatment exhibited the highest net photosynthetic rate, followed by the 0.7N + OF treatment. The 0.9N + OF and 0.6N + OF treatments showed no significant differences from CF but were higher than CK (p > 0.05). In 2022, the 0.7N + OF treatment had the highest net photosynthetic rate, followed by the 0.8N + OF treatment. The 0.9N + OF and 0.6N + OF treatments were not significantly different from CF (p > 0.05), while the CK treatment had the lowest net photosynthetic rate (13.27 μmol CO2·m−2·s−1). Stomatal conductance, intercellular CO2 concentration, and transpiration rate showed no significant differences among treatments; however, the 0.8N + OF and 0.7N + OF treatments consistently had numerically higher values than the CF and CK treatments.
Figure 2.
Photosynthetic characteristics of fresh table grape fruit during the expanding stage under different fertilization treatments. CF, conventional fertilization; 0.9N + OF to 0.6N + OF indicate 10%, 20%, 30%, and 40% of chemical N replaced by organic N on an equal − N basis; CK: only calcium magnesium phosphate fertilizer and potassium sulfate were applied. Photo: net photosynthetic rate; Cond: stomatal conductance; Ci: intercellular CO2 concentration; Trmmol: transpiration rate. Different lowercase letters indicate significant differences among treatments within the same year at the 5% level. Values are means ± SE (n = 3).
3.3. Nutrient Accumulation and Nitrogen Use Efficiency (NUE)
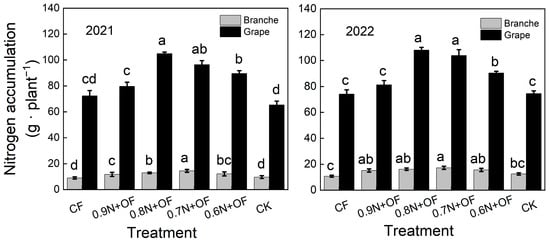
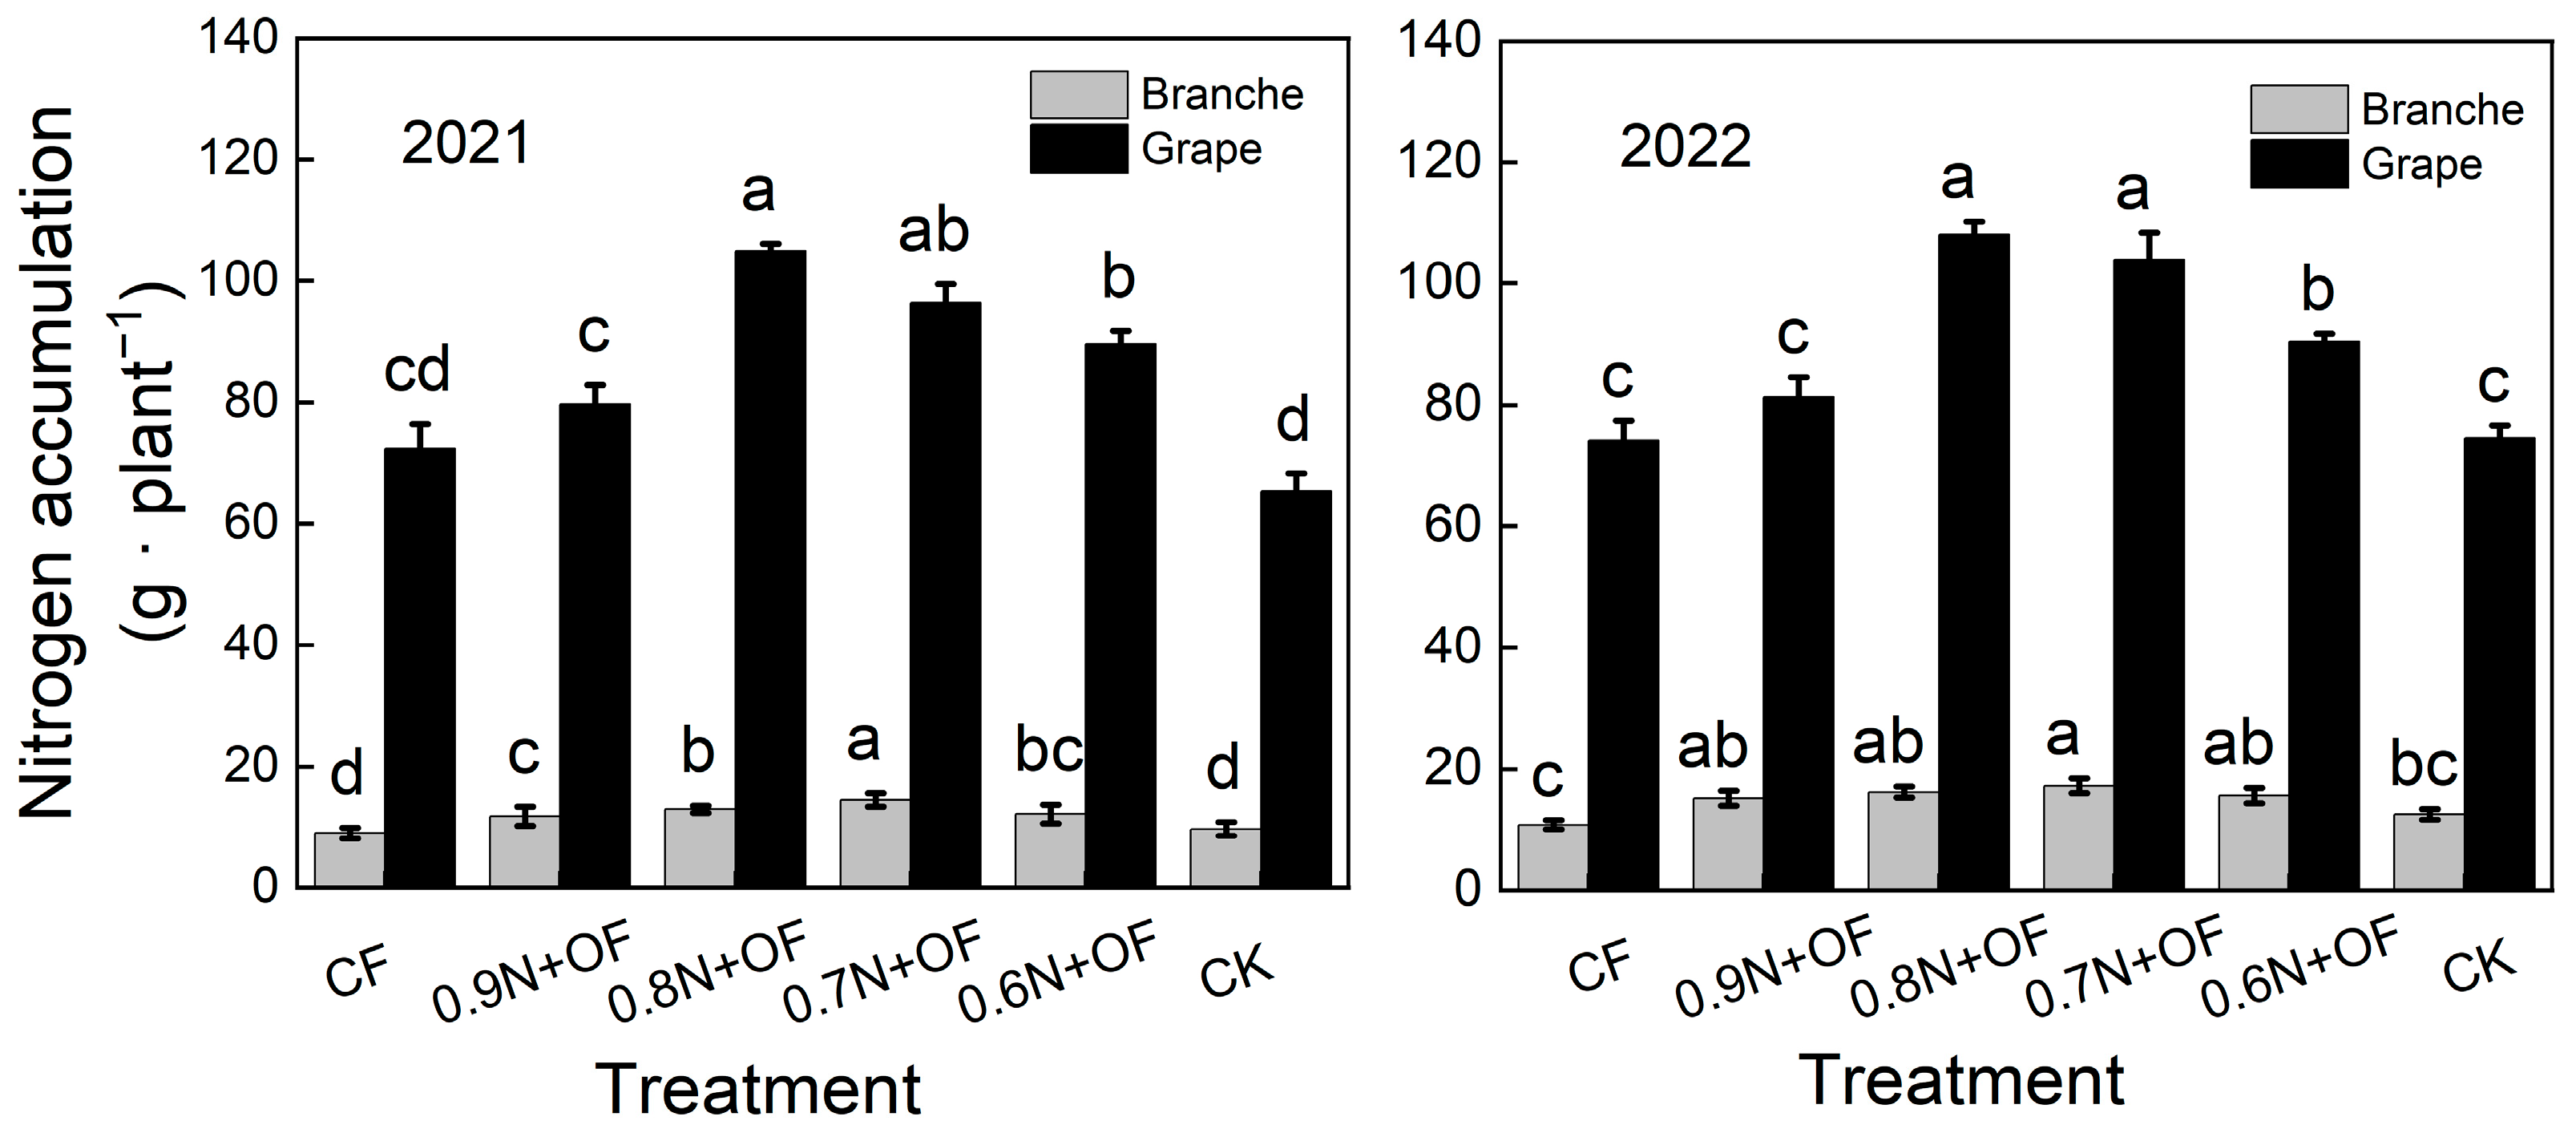
Compared with the CF treatment, the addition of OF treatment increased the N content in fruits by 10.1–45.0% (2021) and 9.6–45.7% (2022). The N accumulation in branches and fruits of the same treatment was generally higher in 2022 than in 2021 (Figure 3). Compared with the CF and CK treatments, the N reduction combined with OF treatment (especially 0.7N + OF and 0.8N + OF) could significantly increase the nitrogen accumulation in branches and fruits (p < 0.05). For both years, the N accumulation in fruits of the 0.8N + OF and 0.7N + OF treatments was always the highest and was significantly higher than the pure N treatment (CF) and the control CK treatment; the N accumulation in fruits of the 0.9N + OF treatment was lower than that of the 0.7N + OF and 0.8N + OF treatments in both years, indicating that excessive N application (such as 0.9N + OF) may not further improve the efficiency of N accumulation in fruits.
Figure 3.
Nitrogen accumulation of vine branches and fruits under different fertilization treatments at the berry ripening stage. CF, conventional fertilization; 0.9N + OF to 0.6N + OF indicate 10%, 20%, 30%, and 40% of chemical N replaced by organic N on an equal − N basis; CK: only calcium magnesium phosphate fertilizer and potassium sulfate were applied. Different lowercase letters indicate significant differences among treatments within the same year at the 5% level. Values are means ± SE (n = 3).
According to the data in the table, the interaction effects between year (Y) and treatment (T) were highly significant for both NAE and NUE (p < 0.01); however, the specific manifestations of these interaction effects differed markedly between the two indicators. For NAE, the ranking of treatments in 2021 was 0.8N + OF ≈ 0.7N + OF > 0.9N + OF ≈ 0.6N + OF > CF, with 0.8N + OF (27.58%) and 0.7N + OF (24.21%) showing no significant difference. In 2022, the order changed to 0.8N + OF (61.53%) > 0.7N + OF (36.19%) > 0.9N + OF (8.09%) ≈ 0.6N + OF (8.89%) > CF (3.71%). For NUE, the treatment ranking remained consistent across both years: 0.8N + OF > 0.7N + OF > 0.9N + OF > 0.6N + OF > CF. In 2021, the NUE values were 23.11%, 20.43%, 17.75%, 13.94%, and 12.22%, respectively; in 2022, they increased to 28.32%, 25.60%, 21.75%, 18.63%, and 16.68%, respectively. The 0.8N + OF treatment achieved the highest NUE in both years, increasing by 22.5% from 2021 to 2022, while the 0.7N + OF treatment increased by 25.3% (Table 3). The 0.8N + OF and 0.7N + OF treatments consistently improved both NAE and NUE compared with CF, with the 0.8N + OF treatment showing the best overall performance across the two years. Compared with the CF treatment, the 0.8N + OF and 0.7N + OF treatments could significantly improve NUE and NAE, among which the 0.8N + OF treatment was the best, and both showed the highest values in both years.
Table 3.
Nitrogen use efficiency and nitrogen agronomic efficiency of grapes under different fertilization treatments.
3.4. Economic Benefits, Fruit Yield, and Components
The ANOVA showed that year (Y) and treatment (T) significantly affected most yield components, and their interaction reached a highly significant level (p < 0.01) for fruit transverse diameter and yield. Specifically, fruit longitudinal diameter was highly significantly influenced by year (p < 0.01) and treatment (p < 0.01), but their interaction was not significant (p > 0.05, Table 4). In 2021, no significant differences in fruit longitudinal diameter were observed among treatments; however, in 2022, the 0.8N + OF treatment exhibited the highest value, significantly exceeding those of CF and CK (p < 0.05). The Y × T interaction for fruit transverse diameter was highly significant (p < 0.01). In 2021, the 0.9N + OF treatment yielded the largest transverse diameter, whereas in 2022, the 0.8N + OF treatment ranked highest; both treatments significantly outperformed CF and CK, indicating that treatment effects on transverse diameter varied between years. For average fruit weight, only the year effect was significant (p < 0.05), with no significant differences among treatments, although the 0.9N + OF and 0.8N + OF treatments showed numerically higher values in 2022. In 2021, the yield of the 0.8N + OF treatment was 27.29 t·ha−1, which was significantly higher than that of CF (23.09 t·ha−1), 0.6N + OF, and CK, but did not differ significantly from that of 0.9N + OF or 0.7N + OF, representing an 18.2% increase compared with CF. In 2022, the yield of the 0.8N + OF treatment was 41.12 t·ha−1, significantly higher than that of CF (20.98 t ha−1), 0.9N + OF, 0.7N + OF, 0.6N + OF, and CK, representing a 96.0% increase compared with CF (p < 0.05). Among them, the 0.8N + OF treatment had the most significant yield increase. Therefore, the application of OF increased grape yield, and the 0.8N + OF treatment had the most significant effect.
Table 4.
Grape fruit yield and its components under different fertilization treatments.
Comprehensive economic benefit analysis for the 2021–2022 period showed that the 0.8N + OF treatment (20% N reduction + organic fertilizer) performed best in both years. In 2021, it increased yield by 18.96%, achieving an economic benefit of 107,500 CNY ha−1; in 2022, yield increased by as much as 95.40%, with an economic benefit of 150,500 CNY ha−1. Compared with CF, this treatment improved economic returns by 18.3% and 93.9%, respectively, and its output-to-input ratios (65.15 and 90.82) were also relatively high. The 0.7N + OF treatment (30% N reduction + organic fertilizer) ranked second, with yield increases of 11.64% and 64.99% in 2021 and 2022, and economic benefits of 100,500 and 112,900 CNY ha−1, respectively, both significantly higher than those of CF. In contrast, although the 0.6N + OF treatment (40% N reduction + organic fertilizer) achieved some yield increase, it exhibited the lowest output-to-input ratios (45.28 and 39.18), and its economic benefits showed no significant difference from those of CF (or were even slightly lower) (Table S1). Analysis of variance indicated that treatment had highly significant effects on yield increase rate, economic benefit, and output-to-input ratio (p < 0.01). Year also had a highly significant effect on yield increase rate (p < 0.01), and the treatment × year interaction was highly significant for yield increase rate (p < 0.01), indicating that treatment performance varied between years. Nevertheless, the 0.8N + OF treatment consistently achieved the highest economic benefits in both years, demonstrating good inter-annual stability and adaptability. In conclusion, the 0.8N + OF treatment represents the optimal fertilization strategy for balancing yield increase, economic returns, and input–output efficiency.
3.5. Pathway Analysis
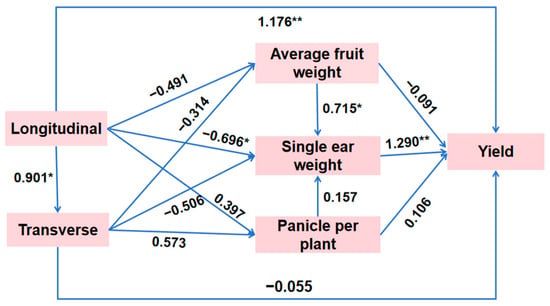
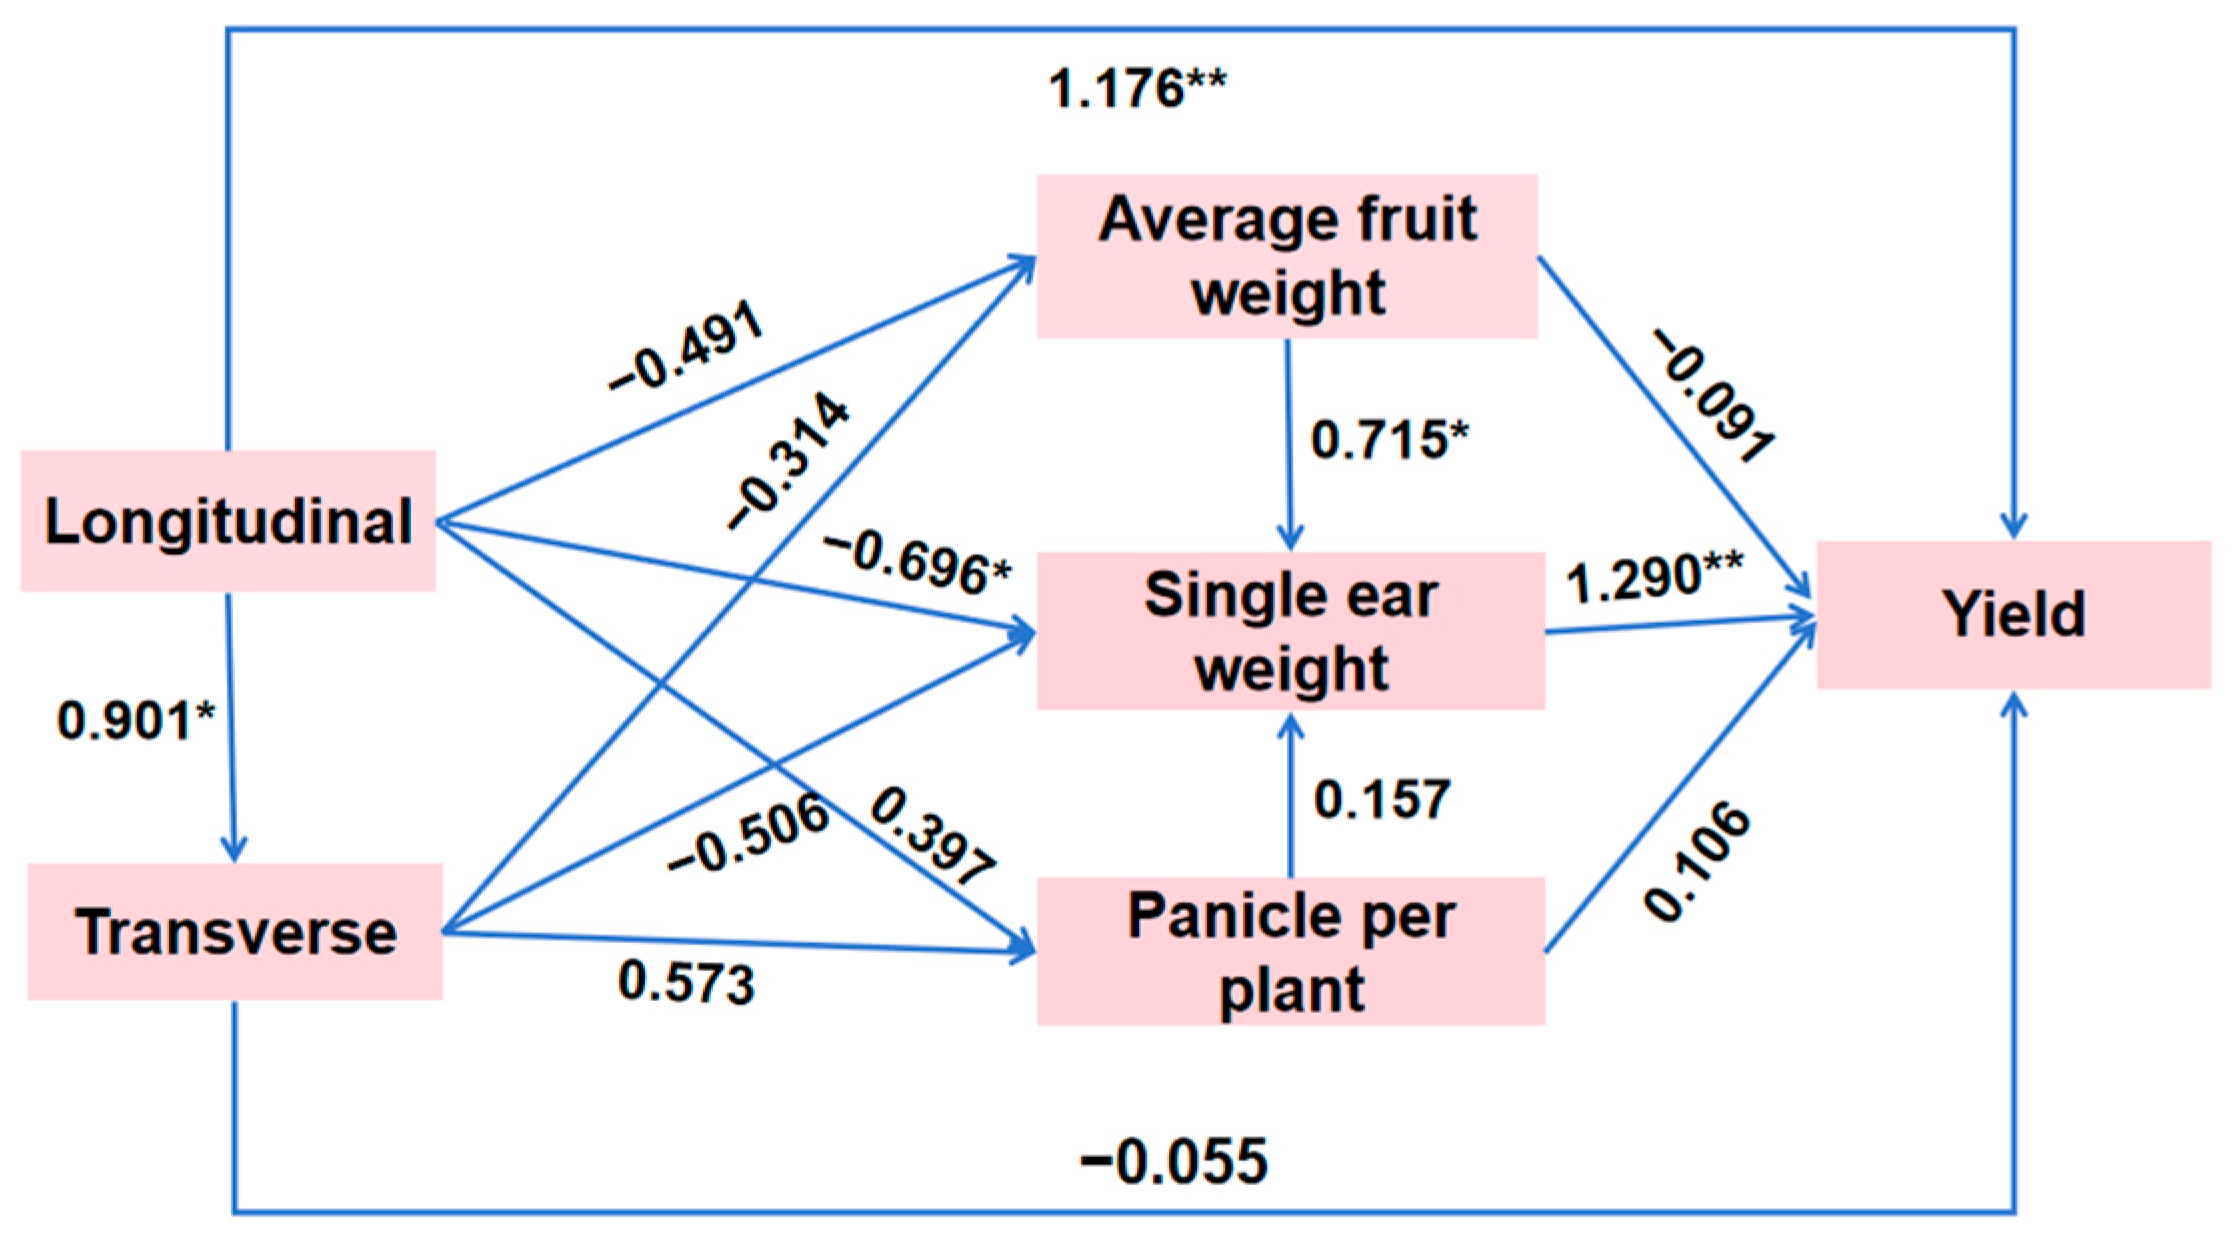
The variables used for fruit diameter analysis in this study include fruit longitudinal diameter, transverse diameter, number of spikes per plant, single spike weight, average single fruit weight, and total yield (Figure 4). The data from 2021 and 2022 show that the longitudinal diameter is the only indicator that is significantly negatively correlated with single spike weight (λ = −0.696, p < 0.05). By contrast, the average single fruit weight is significantly positively correlated with single spike weight (λ = 0.715, p < 0.05) and negatively correlated with total yield, but the correlation did not reach the statistical significance level (λ = −0.091, p > 0.05). Meanwhile, the longitudinal diameter (λ = 1.176, p < 0.001) and single spike weight (λ = 1.290, p < 0.001) both showed extremely significant positive effects on total yield.
Figure 4.
Path analysis indicated hypothesized causal relationships between Longitudinal, Transverse, Bunch per plant, Single ear weight, Average fruit weight, and total yield in 2021 and 2022. Significance levels are as follows: * p < 0.05 and ** p < 0.01.
3.6. Fruit Quality
The ANOVA showed that year had a significant or highly significant effect on titratable acidity, total sugar, solid–acid ratio, and sugar–acid ratio (p < 0.05 or p < 0.01), while treatment significantly affected total sugar, vitamin C, and sugar–acid ratio (p < 0.05). The Year × Treatment interaction was not significant for any quality parameter (p > 0.05), indicating that the effects of treatments on fruit quality were consistent across the two years (Table S2). In 2021, For total sugar, the 0.9N + OF, 0.8N + OF, 0.7N + OF, and 0.6N + OF treatments were all significantly higher than the CF treatment (p < 0.05), with the 0.8N + OF treatment showing the highest value, representing a 45.5% increase compared with CF. The sugar–acid ratio was highest in the 0.8N + OF treatment, which was significantly higher than CF (p < 0.05), while the other treatments did not differ significantly from CF (p > 0.05). In 2022, no significant differences were found among treatments in soluble solids, titratable acidity, or solid–acid ratio (p > 0.05). For total sugar, the 0.9N + OF, 0.8N + OF, 0.7N + OF, and 0.6N + OF treatments were all higher than CF, with the 0.7N + OF treatment showing the highest value. For total vitamin C, the 0.9N + OF and 0.8N + OF treatments were significantly higher than CF (p < 0.05). The sugar–acid ratio was highest in the 0.8N + OF treatment, which was significantly higher than CF treatment (p < 0.05). Among these, the 0.8N + OF treatment exhibited the best overall fruit quality in both years, with good inter-annual stability.
3.7. Correlations Between Soil Nutrients and Grape Yield and Quality Indices
The ANOVA indicated that year (Y) significantly affected alkali-hydrolyzable nitrogen (p < 0.01) and organic matter (p < 0.05), while treatment (T) significantly affected total nitrogen (p < 0.05), alkali-hydrolyzable N (p < 0.01), available phosphorus (p < 0.05), pH (p < 0.01), and organic matter (p < 0.01). The Y × T interaction was not significant for any of the measured parameters (p > 0.05), indicating that the effects of fertilization treatments on soil nutrients were consistent across the two years. Compared with CF, the treatments combining N reduction with organic fertilizer particularly 0.8N + OF significantly improved soil nutrient status in both years. In terms of alkali-hydrolyzable N, the 0.8N + OF treatment significantly increased values by 20.3% in 2021 and by 15.1% in 2022 relative to CF (p < 0.01). For available phosphorus, the 0.8N + OF treatment showed a 13.8% significantly increase in 2021, while the 0.7N + OF treatment showed a 5.1% increase in 2022 (p < 0.01). For available potassium, the 0.8N + OF treatment exhibited an 8.1% increase in 2022. Regarding soil pH, the 0.7N + OF and 0.6N + OF treatments increased pH by 0.27 and 0.31 units, respectively, in 2021. In 2022, all N-reduction treatments increased pH by 0.51–0.60 units compared with CF. Organic matter content increased most notably under the 0.8N + OF treatment, with increases of 16.3% in 2021 and 21.1% in 2022 relative to CF. No significant differences among treatments were observed for total nitrogen, total phosphorus, or total potassium. In conclusion, the 0.8N + OF treatment (20% N reduction combined with organic fertilizer) demonstrated the best performance in improving soil available nutrients, alleviating soil acidification, and increasing organic matter content, with good inter-annual stability.
The relevant analysis indicates that soil available nutrients (available N, available phosphorus, and available potassium) and organic matter are the core factors influencing crop yield (Table S4). Among them, the yield-increasing effects of organic matter and available phosphorus reach an extremely significant level (p < 0.01), while those of available N and available potassium reach a significant level (p < 0.05). This suggests that the supply capacity of soil-active nutrients and the content of organic matter directly determine the potential yield of crops. The effects of total nutrients (total N, total phosphorus, total potassium) and soil pH on yield promotion do not reach a significant level (p > 0.05), indicating that crop yield is more dependent on the available quick-release nutrients that can be directly absorbed by the soil rather than the total nutrient reserves. Reducing sugar has a more sensitive response to most soil nutrients. Total N, total phosphorus, total potassium, available N, available phosphorus, and available potassium can all significantly or extremely significantly promote the accumulation of reducing sugar, with the effects of total potassium and available potassium being the strongest. Total sugar only shows a significant response to total potassium and available potassium, indicating that potassium is the core regulatory factor for enhancing the sugar content of crops, while N and phosphorus nutrients can only promote the directional accumulation of reducing sugar and have a limited overall effect on total sugar accumulation. Only total potassium (0.761 **), organic matter (0.777 **), and soluble solids show an extremely significant positive correlation, while total nitrogen, total phosphorus, and available phosphorus even show a weak negative correlation trend. The correlation between organic matter and soluble solids and the sugar–acid ratio is not significant. pH (0.963 **), available potassium (0.835 **), and organic matter (0.648 *) show extremely significant or significant positive correlations with titratable acid. Among them, the correlation coefficient of pH is the highest, indicating that soil pH is the most critical factor regulating the content of titratable acid, and titratable acid significantly accumulates with the increase in pH. Total potassium (0.943 **), available potassium (0.913 **), and total N (0.809 **) show extremely significant positive correlations with the ratio of solid acid (p < 0.01); total phosphorus, available N, and available phosphorus show significant positive correlations with the sugar–acid ratio (p < 0.05); the correlation between organic matter and the solid–acid ratio and the sugar–acid ratio is not significant. pH is only significantly positively correlated with soluble solids (r = 0.595 *), p < 0.05. This indicates that total potassium has the strongest effect on improving the flavor coordination of crops, and available potassium, pH, and total N can also significantly optimize the flavor. Only available phosphorus and organic matter can significantly or extremely significantly promote the accumulation of Vc, with the effect of organic matter being stronger, indicating that SOM and available phosphorus supply capacity are the key factors for improving the Vc nutritional quality of crops, while potassium, pH, etc., have insignificant effects on Vc.
4. Discussion
4.1. Effects of Combined Application of Organic and Chemical Fertilizers on Photosynthetic Characteristics and NUE in Grapes
The chlorophyll value (SPAD) is a reliable indirect indicator for assessing the photosynthetic capacity and nitrogen nutrition status of leaves. In the present study, the higher SPAD values observed in the CF treatment during the sprouting stage might be attributed to the rapid supply of nitrogen from the chemical fertilizer (Figure 1), while the OF treatment was able to maintain similar or more stable SPAD values in the middle and later stages, which is likely due to the continuous supply of nitrogen released by the mineralization of OF, thereby supporting the synthesis of leaf nitrogen content and chlorophyll [16]. This is consistent with findings in grapevines, where organic fertilizer application improved leaf SPAD values and photosynthetic efficiency [21]. The maintenance of chlorophyll content directly ensures the photosynthetic efficiency of the leaves, providing continuous photosynthetic products for the accumulation of biomass and fruit development during the middle and later stages of grape growth [31,32], which may be the key physiological basis for the final impact of OF treatment on yield and quality formation.
Additionally, the photosynthetic physiological performance was optimal at the berry ripening stage, potentially owing to leaf growth, light intensity, and physiological factor metabolism [33]. OF enhances nutrient absorption, promotes leaf growth, and improves the activity of leaf-related physiological and metabolic enzymes, thereby optimizing leaf photosynthesis [34]. The present study demonstrated that the SPAD value, stomatal conductance, transpiration rate, and net photosynthetic rate were higher in plants treated with OF than in those treated with CF. When the transpiration rate was similar to that of CF, the net photosynthetic rate of 0.7N + OF and 0.8N + OF was significantly higher, indicating that their water use efficiency (net photosynthetic rate/transpiration rate) was better, that is, “obtaining higher photosynthetic products with similar water consumption” (Figure 2). This indicates that OF effectively improved leaf photosynthesis, consistent with the findings of [29], who observed that the application of sheep manure notably increased SPAD values and photosynthetic efficiency in strawberries. The intercellular CO2 concentrations in the 0.7N + OF and 0.8N + OF treatments were relatively low (320–326 μmol·mol−1), but the net photosynthetic rate was higher. This indicates that in these treatments, CO2 was efficiently utilized by the photosynthetic system (i.e., the “source–sink relationship” was coordinated, with CO2 consumption being faster than supply). However, the intercellular CO2 concentration in the CF treatment was the highest, but the net photosynthetic rate was not the highest. There might be a “feedback inhibition” of photosynthesis due to excessive nitrogen or an unsynchronized increase in Rubisco enzyme activity.
Applying OF within an optimal range enhanced nutrient absorption and NUE in grapes, with the 0.8N + OF treatment demonstrating the most pronounced effect (Table 3). Studies have observed increased N utilization rates in Chinese cabbage following treatment with a nitrogen-reducing OF strategy [35]. Studies have shown that compared with traditional nitrogen fertilizers, applying 25–50% OFs can meet the phosphorus and potassium requirements of the sweet pepper’s vegetative growth period, and promote the absorption and accumulation of nitrogen by the fruit after its enlargement, thereby increasing the yield and quality of sweet peppers [36]. The application of combined chemical N fertilizer and OF also increased N, P, and K concentrations in apple leaves [37], total N, P, and K in grape leaves and roots [6], and N and P absorption in cotton plants [38]. Compared with the conventional nitrogen application (CF) and the no-nitrogen control (CK), reducing the amount of chemical N fertilizer by 70–80% and adding OF can significantly increase the N accumulation in branches and fruits, indicating that the addition of OF can promote N absorption and utilization, compensating for the deficiency caused by the reduction of chemical nitrogen. In actual production, treatments of 0.7N + OF or 0.8N + OF can be adopted. By reducing the amount of chemical N fertilizer and by applying OFs to enhance the N accumulation capacity of branches and fruits, the goal of reducing fertilizer usage while achieving efficiency improvement can be achieved.
4.2. Effects of Combined Application of Organic and Chemical Fertilizers on Fruit Yield and Its Components
Fruit quantity, fresh weight of individual fruits, and yield per plant notably influence yield [39]. Additionally, OF-treated apples had the largest individual size and fruit weight, indicating favorable commercial characteristics. This may be attributed to high organic matter content, which enhances nitrogen conversion and improves plant nitrogen absorption [40]. The OF application increases plant height, leaf number, leaf area, fresh and dry weight, root length, branch number, stem circumference, and nutrient uptake [41]. However, combining CF with OF improves soil performance and the environment while enhancing crop yield and quality [42]. Compared with unfertilized orchards, applying CF and OFs significantly increased the proportion of high-quality fruits, with observed yield increases of 9.9% and 20.8%, respectively [23]. The research has found that nitrogen has a more significant impact on the yield of summer black grapes than phosphorus (P) or potassium (K). Specifically, applying nitrogen can increase the weight of the bunches, the weight of the seeds, and the overall yield [43]. However, beyond a certain threshold, the yield declines primarily because of the excessive availability of nutrients during the early growth stage, resulting in stem and leaf proliferation [44]. These findings align with those of the current study, wherein the 0.8N + OF treatment resulted in the most pronounced increase in yield. The significant Year × Treatment interaction for yield increase rate (p < 0.01) reflected the stronger yield response to organic substitution in 2022, likely due to the cumulative improvement in soil fertility and favorable climatic conditions during that season.
The present study demonstrated that substituting CF with OF significantly increased the fruit yield and economic benefits of Shine Muscats (Table S2). Accordingly, selecting an appropriate fertilization level can reduce production costs and increase crop profits [45]. Applying OF to the soil can facilitate the conversion between soil mineralization and plant absorption, enhance the efficiency of plant nutrient absorption, and improve fruit weight and size [46]. Additionally, long-term non-application of nitrogen fertilizers results in an inadequate nutrient supply to trees. By contrast, long-term application of pure chemical fertilizers causes land compaction, soil salinization, and other challenges. Therefore, applying OFs rather than CF can enhance economic benefits and assist farmers in increasing productivity and income. The pronounced yield response in 2022 compared to 2021, particularly under the 0.8N + OF treatment, may be attributed to the cumulative effects of OF application on soil fertility and vine nutrient status, as well as inter-annual variations in climatic conditions (e.g., temperature and precipitation during berry development). The higher yields obtained in 2022 may also reflect improved vine establishment and nutrient uptake efficiency in the second year of the experiment.
4.3. Effects of Combined Application of Organic and Chemical Fertilizers on Quality of Table Grapes
OF facilitates the accumulation of dry matter and sugar in fruits, regulates their sugar-to-acid ratio, and enhances flavor [47]. In the present study, the application of OF and CF notably increased the soluble solids, Vc, and total sugar content of grapes while decreasing the titratable acid content. The total sugar content and sugar–acid ratio of CF treatment were the lowest, indicating that the use of a single fertilizer may lead to a decline in fruit quality (Table S1). Reducing nitrogen and applying OF simultaneously can improve the quality while ensuring yield, which is in line with the direction of agricultural sustainability. Additionally, the sugar-to-acid ratio increased, likely attributed to the increase in SOM and various bioactive substances in the soil, which improve the physical and chemical properties of the soil, accelerate the exchange and accumulation of photosynthetic products, promote the conversion of acid into sugar, and increase the soluble solid content, thus improving the quality of the grapes [21]. Soil treated with OFs can promote apple tree growth and enhance apple quality [46]. Previous studies have observed that the combined application of OFs significantly increased the soluble solids and Vc content of the fruits [48,49]. The anthocyanin content was the highest and the titratable acid content was the lowest, resulting in optimal fruit quality. Regarding the sugar-to-acid and solid-to-acid ratios in the current study, soluble solid and reducing sugar content were significantly and positively correlated with grape yield (Table S1). In 2021, the sugar–acid ratio of the nitrogen-reduced and OF-coated treatment was significantly higher than that of the control (CF), and the fruits were sweeter. In 2022, the solid–acid ratio was even higher in the nitrogen-reduced and OF-coated treatment (for example, 0.9N + OF reached 97.96), further indicating an improvement in flavor. Based on the data from the past two years, the 0.7N + OF and 0.8N + OF treatments performed the best in terms of total sugar, total Vc, and flavor. These can be recommended as solutions: reducing the use of chemical nitrogen fertilizers (to lower costs and environmental risks) and improving the nutritional value and taste of the fruits.
4.4. Effects of Combined Application of Organic and Chemical Fertilizers on Soil Quality in the Cultivated Layer of Vineyards
Nitrogen, phosphorus, and potassium are essential macronutrients for crop growth. Reasonable application of inorganic fertilizers such as nitrogen, phosphorus, and potassium can increase crop yields. However, excessive application of chemical fertilizers not only fails to increase crop yields but also reduces fertilizer utilization and causes a large accumulation of nutrients in the soil, resulting in soil nutrient imbalance, degradation of soil quality, and ultimately affecting crop yield and quality [50]. Numerous studies have shown that OFs can improve soil structure, enhance soil nutrient supply capacity, and slow down soil acidification, exerting positive effects on improving soil quality and promoting plant growth and development. Moreover, increasing the application of OFs can effectively increase SOM content and alleviate soil compaction and acidification [51,52]. OFs directly input organic carbon, accelerating the decomposition and transformation of organic matter such as residues and roots, forming humus, thereby increasing SOM content [53]. The present study found that under the condition of reducing chemical nitrogen fertilizer (N) input by 10–40% (0.9N + OF to 0.6N + OF), total nitrogen and available nitrogen in the soil did not significantly decrease, and the contents of available phosphorus, available potassium, and organic matter were comparable or even higher than those of conventional fertilizers (such as available phosphorus in 0.7N + OF) (Table S3). This indicates that OF combination can compensate for the potential nutrient supply deficiency caused by nitrogen reduction by improving soil nutrient availability (especially phosphorus and potassium) and organic matter; thus, “N reduction without loss of effectiveness” can be achieved [54,55]. Nitrogen reduction (0.6N–0.9N) combined with OF did not reduce total nitrogen and total phosphorus content, possibly because the nitrogen and phosphorus in OFs release slowly, compensating for the reduction in chemical nitrogen fertilizer and maintaining the balance of soil nutrient reservoirs [56]. Overall, the non-significant Year × Treatment interactions for most quality and soil indicators indicate that the effects of organic substitution are stable across years, reinforcing the reliability of the 0.8N + OF treatment as a sustainable fertilization strategy.
Most nutrient indicators in 2022 (such as total potassium and organic matter) were higher than those in 2021, which may be related to the cumulative effect of long-term fertilization, indicating that the soil improvement effect of OF combination has persistence and long-term application may further enhance soil fertility (Table S3). The control (CK) treatment had the lowest nutrient indicators (especially organic matter, available phosphorus, and potassium), indicating that no fertilization leads to a decline in soil fertility, and reasonable fertilization (including nitrogen reduction combined with OF) is the key to maintaining soil productivity. Under the premise of maintaining stable total nitrogen and total phosphorus, nitrogen reduction combined with OF significantly increased available phosphorus, potassium, and organic matter contents, and improved soil pH, suggesting that this measure can reduce chemical nitrogen fertilizer input while maintaining or even enhancing soil fertility through the dual effects of “nutrient supplementation + soil improvement” provided by OFs and is sustainable. It is recommended to promote the technology of nitrogen reduction combined with OF in agricultural production to reduce fertilizer dependence and improve soil quality. The results of the present study indicate that quick-release nitrogen is a key quick-release nutrient that regulates the accumulation of soluble solids and total sugar in fruits and can optimize fruit flavor by enhancing core quality indicators (Table S4). Previous studies have also shown that nitrogen fertilizer regulation can be used as a targeted nutrient for short-term quality control in production [57]. Research has demonstrated that adequate potassium supply is crucial for enhancing flavor and quality components such as sugar, organic acids, and vitamins in fruits [58]. Adequate potassium supply (through soil and foliar supplementation) is essential for increasing berry sugar content, improving color, and enhancing overall flavor [59]. The present study concludes that quick-release potassium is the most comprehensive indicator among quick-release nutrients for improving quality, significantly promoting the accumulation of reducing sugar, total sugar, and Vc, and achieving an effect similar to that of full potassium on flavor ratio optimization, making it the core regulatory nutrient for short-term improvement of fruit quality. Organic matter is a key soil indicator for comprehensively enhancing fruit quality, simultaneously significantly increasing fruit solids and acidity, reducing sugar content, and having a comprehensive effect on improving the basic quality of the fruit (Table S4).
5. Conclusions
This study conducted a two-year field experiment to systematically evaluate the comprehensive effects of nitrogen reduction combined with the application of OF on Shine Muscat grapes. Nitrogen reduction combined with OF optimizes physiological functions: the 0.7N + OF and 0.8N + OF treatments maintain chlorophyll content (SPAD value) in the middle and late stages and increase photosynthetic efficiency, promoting dry matter accumulation and providing a physiological basis for yield and quality formation. It also improves nutrient utilization efficiency: the 0.8N + OF treatment has the highest NUE and NAE, and the nitrogen accumulation in branches and fruits is significantly higher than that of CF, confirming that OF can compensate for the nutrient supply deficiency caused by nitrogen reduction and achieve “reducing nitrogen without reducing efficacy.” It synergistically improves fruit quality: nitrogen reduction combined with OF significantly increases the total sugar, Vc content, and sugar–acid ratio of the fruit. Among the treatments, 0.8N + OF increases the total sugar and sugar–acid ratio compared to CF, and the flavor and nutritional quality are simultaneously optimized. Treatment improves soil physical and chemical properties: the input of OF significantly increases SOM, available phosphorus, and available potassium content, and alleviates soil acidification; the nutrient enhancement effect has an inter-annual cumulative effect and an initial improvement of soil properties, with long-term effects requiring further verification. Treatment maximizes economic benefits: the 0.8N + OF treatment has the highest yield and economic benefits, while reducing nitrogen by more than 40% (0.6N + OF) will lead to a decrease in economic returns. Collectively, the findings of this study indicate that OF utilization in grape production has the potential to be profitable and sustainable.
Supplementary Materials
The following supporting information can be downloaded at: https://www.mdpi.com/article/10.3390/agriculture16080862/s1, Table S1: Economic benefits of grapes under different fertilization treatment growing seasons over the two annual cycles of 2021–2022; Table S2: Grape quality index under different fertilization treatment growing seasons over the two annual cycles of 2021–2022.; Table S3: Soil nutrients after grape berry ripening of different fertilization treatment growing seasons over the two annual cycles of 2021–2022; Table S4: Correlation between soil nutrients and grape yield and quality indexes; Figure S1: Schematic diagram of the field experimental layout.
Author Contributions
Y.H.: Writing—review and editing, Writing—original draft, Methodology, Formal analysis. X.Z. (Xuemei Zhong): Writing—review and editing, Project administration. J.P.: Funding acquisition, Conceptualization. G.L.: Resources, Funding acquisition. X.Z. (Xuan Zhou): Project administration, Data curation. M.X.: Validation, Formal analysis. G.Y.: Supervision, Methodology. X.S.: Validation, Formal analysis. All authors have read and agreed to the published version of the manuscript.
Funding
This study was supported by the National Key Research and Development Project—the Development and Application of Slow Controlled-release Fertilizer Coating with Polyether Polyurethane (2017YFD200703-3), the National Technical System of Rice Industry (CARS-01-26), the Hunan Innovation Fund of Agricultural Science and Technology (2019LS03-3), the Hunan Youth Fund of Natural Science Foundation (2019JJ50337) and the Scientific Research Fund of Hunan Provincial Education Department (23B1004).
Data Availability Statement
The raw data supporting the conclusions of this article will be made available by the authors on request.
Acknowledgments
During preparations of this manuscript, Tao Zi provided authors with help in data visualization. He agreed to be mentioned in the acknowledgments.
Conflicts of Interest
The authors declare that the research was conducted in the absence of any commercial or financial relationships that could be construed as a potential conflict of interest.
Abbreviations
The following abbreviations are used in this manuscript:
| ANOVA | Analysis of variance |
| CF | Conventional fertilization |
| NUE | Nitrogen use efficiency |
| OF | Organic fertilizer |
| SOM | Soil organic matter |
| Vc | Vitamin C |
References
- Gambetta, G.A.; Herrera, J.C.; Dayer, S.; Feng, Q.; Hochberg, U.; Castellarin, S.D. Corrigendum to: The physiology of drought stress in grapevine: Towards an integrative definition of drought tolerance. J. Exp. Bot. 2020, 71, 5717. [Google Scholar] [CrossRef] [Scilit] [PubMed]
- James, A.; Mahinda, A.; Mwamahonje, A.; Rweyemamu, E.W.; Mrema, E.; Aloys, K.; Swai, E.; Mpore, F.J.; Massawe, C. A review on the influence of fertilizers application on grape yield and quality in the tropics. J. Plant Nutr. 2023, 46, 2936–2957. [Google Scholar] [CrossRef] [Scilit]
- Visconti, F.; López, R.; Olego, M.Á. The health of vineyard soils: Towards a sustainable viticulture. Horticulturae 2024, 10, 154. [Google Scholar] [CrossRef] [Scilit]
- Cataldo, E.; Fucile, M.; Mattii, G.B. A review: Soil management, sustainable strategies and approaches to improve the quality of modern viticulture. Agronomy 2021, 11, 2359. [Google Scholar] [CrossRef] [Scilit]
- Zhu, Z.; Bai, Y.; Lv, M.; Tian, G.; Zhang, X.; Li, L.; Jiang, Y.; Ge, S. Soil fertility, microbial biomass, and microbial functional diversity responses to four years fertilization in an apple orchard in North China. Hortic. Plant J. 2020, 6, 223–230. [Google Scholar] [CrossRef] [Scilit]
- Wu, L.; Jiang, Y.; Zhao, F.; He, X.; Liu, H.; Yu, K. Increased organic fertilizer application and reduced chemical fertilizer application affect the soil properties and bacterial communities of grape rhizosphere soil. Sci. Rep. 2020, 10, 9568. [Google Scholar] [CrossRef] [Scilit]
- Ball, K.R.; Baldock, J.A.; Penfold, C.; Power, S.A.; Woodin, S.J.; Smith, P.; Pendall, E. Soil organic carbon and nitrogen pools are increased by mixed grass and legume cover crops in vineyard agroecosystems: Detecting short-term management effects using infrared spectroscopy. Geoderma 2020, 379, 114619. [Google Scholar] [CrossRef] [Scilit]
- Lazcano, C.; Gonzalez-Maldonado, N.; Yao, E.H.; Wong, C.T.F.; Merrilees, J.J.; Falcone, M.; Peterson, J.D.; Casassa, L.F.; Decock, C. Sheep grazing as a strategy to manage cover crops in Mediterranean vineyards: Short-term effects on soil C, N and greenhouse gas (N2O, CH4, CO2) emissions. Agric. Ecosyst. Environ. 2022, 327, 107825. [Google Scholar] [CrossRef] [Scilit]
- Wilson, S.G.; Lambert, J.J.; Dahlgren, R. Compost application to degraded vineyard soils: Effect on soil chemistry, fertility, and vine performance. Am. J. Enol. Vitic. 2021, 72, 85–93. [Google Scholar] [CrossRef] [Scilit]
- Uzoma, K.C.; Inoue, M.; Andry, H.; Fujimaki, H.; Zahoor, A.; Nishihara, E. Effect of cow manure biochar on maize productivity under sandy soil condition. Soil Use Manag. 2011, 27, 205–212. [Google Scholar] [CrossRef] [Scilit]
- Nguyen, T.T.N.; Wallace, H.M.; Xu, C.Y.; Xu, Z.; Farrar, M.B.; Joseph, S.; Van Zwieten, L.; Bai, S.H. Short-term effects of organo-mineral biochar and organic fertilisers on nitrogen cycling, plant photosynthesis, and nitrogen use efficiency. J. Soils Sediments 2017, 17, 2763–2774. [Google Scholar] [CrossRef] [Scilit]
- Geng, Y.; Cao, G.; Wang, L.; Wang, S. Effects of equal chemical fertilizer substitutions with organic manure on yield, dry matter, and nitrogen uptake of spring maize and soil nitrogen distribution. PLoS ONE 2019, 14, e0219512. [Google Scholar] [CrossRef] [Scilit]
- Milošević, T.; Milošević, N. Influence of mineral fertilizer, farmyard manure, natural zeolite, and their mixture on fruit quality and leaf micronutrient levels of apple trees. Commun. Soil Sci. Plant Anal. 2017, 48, 539–548. [Google Scholar] [CrossRef] [Scilit]
- Zhao, Z.; Chu, C.; Zhou, D.; Sha, Z.; Wu, S. Soil nutrient status and the relation with planting area, planting age and grape varieties in urban vineyards in Shanghai. Heliyon 2019, 5, e02362. [Google Scholar] [CrossRef] [Scilit]
- Xiao, L.; Sun, Q.; Yuan, H.; Lian, B. A practical soil management to improve soil quality by applying mineral organic fertilizer. Acta Geochim. 2017, 36, 198–204. [Google Scholar] [CrossRef] [Scilit]
- Mahinda, A.; Funakawa, S.; Shinjo, H.; Kilasara, M. Interactive effects of in situ rainwater harvesting techniques and fertilizer sources on mitigation of soil moisture stress for sorghum (Sorghum bicolor (L.) Moench) in dryland areas of Tanzania. Soil Sci. Plant Nutr. 2018, 64, 710–718. [Google Scholar] [CrossRef] [Scilit]
- Zhang, X.; Zou, T.; Lassaletta, L.; Mueller, N.D.; Tubiello, F.N.; Lisk, M.D.; Lu, C.; Conant, R.T.; Dorich, C.D.; Gerber, J.; et al. Quantification of global and national nitrogen budgets for crop production. Nat. Food 2021, 2, 529–540. [Google Scholar] [CrossRef] [Scilit]
- MacLaren, C.; Mead, A.; van Balen, D.; Claessens, L.; Etana, A.; de Haan, J.; Haagsma, W.; Jäck, O.; Keller, T.; Labuschagne, J.; et al. Long-term evidence for ecological intensification as a pathway to sustainable agriculture. Nat. Sustain. 2022, 5, 770–779. [Google Scholar] [CrossRef] [Scilit]
- Sharma, S.B.; Sayyed, R.Z.; Trivedi, M.H.; Gobi, T.A. Phosphate solubilizing microbes: Sustainable approach for managing phosphorus deficiency in agricultural soils. SpringerPlus 2013, 2, 587. [Google Scholar] [CrossRef] [Scilit]
- Song, X.H.; Xie, K.; Zhao, H.B.; Li, Y.L.; Dong, C.X.; Xu, Y.C.; Shen, Q.R. Effects of different organic fertilizers on tree growth, yield, fruit quality, and soil microorganisms in a pear orchard. Eur. J. Hortic. Sci. 2012, 77, 204–210. [Google Scholar] [CrossRef] [Scilit]
- Zhao, F.; Jiang, Y.; He, X.; Liu, H.; Yu, K. Increasing organic fertilizer and decreasing drip chemical fertilizer for two consecutive years improved the fruit quality of “summer black” grapes in arid areas. HortScience 2020, 55, 196–203. [Google Scholar] [CrossRef] [Scilit]
- Zhang, P.; Yang, F.; Zhang, H.; Liu, L.; Liu, X.; Chen, J.; Wang, X.; Wang, Y.; Li, C. Beneficial effects of biochar-based organic fertilizer on nitrogen assimilation, antioxidant capacities, and photosynthesis of sugar beet (Beta vulgaris L.) under saline-alkaline stress. Agronomy 2020, 10, 1562. [Google Scholar] [CrossRef] [Scilit]
- Zhuang, L.; Wang, P.; Hu, W.; Yang, R.; Zhang, Q.; Jian, Y.; Zou, Y. A comprehensive study on the impact of chemical fertilizer reduction and organic manure application on soil fertility and apple orchard productivity. Agronomy 2024, 14, 1398. [Google Scholar] [CrossRef] [Scilit]
- Wang, L.; Li, J.; Yang, F.; E., Y.; Raza, W.; Huang, Q.; Shen, Q. Application of bioorganic fertilizer significantly increased apple yields and shaped bacterial community structure in orchard soil. Microb. Ecol. 2017, 73, 404–416. [Google Scholar] [CrossRef] [Scilit]
- Coombe, B.G. Growth stages of the grapevine: Adoption of a system for identifying grapevine growth stages. Aust. J. Grape Wine Res. 1995, 1, 104–110. [Google Scholar] [CrossRef] [Scilit]
- Lorenz, D.H.; Eichhorn, K.W.; Bleiholder, H.; Klose, R.; Meier, U.; Weber, E.E. Growth Stages of the Grapevine: Phenological growth stages of the grapevine (Vitis vinifera L. ssp. vinifera)—Codes and descriptions according to the extended BBCH scale. Aust. J. Grape Wine Res. 1995, 1, 100–103. [Google Scholar] [CrossRef] [Scilit]
- AOAC. Official Methods of Analysis, 16th ed.; Method 967.21; Association of Official Analytical Chemists: Washington, DC, USA, 1995; Available online: https://www.aoac.org (accessed on 1 April 2026).
- Song, F.Y. Analysis on the content of reducing sugar and total sugar in the fruits of Capparis spinosa L. Med. Plants 2012, 3, 19–20. [Google Scholar] [CrossRef]
- Li, D.X.; Li, C.D.; Sun, H.C.; Wang, W.X.; Liu, L.T.; Zhang, Y.J. Effects of drought on soluble protein content and protective enzyme system in cotton leaves. Front. Agric. China 2010, 4, 56–62. [Google Scholar] [CrossRef] [Scilit]
- Wang, T.; Liu, Q.; Wang, N.; Dai, J.; Lu, Q.; Jia, X.; Lin, L.; Yu, F.; Zuo, Y. Foliar arginine application improves tomato plant growth, yield, and fruit quality via nitrogen accumulation. Plant Growth Regul. 2021, 95, 421–428. [Google Scholar] [CrossRef] [Scilit]
- Ji, J.; Zhang, J.; Wang, X.; Song, W.; Ma, B.; Wang, R.; Li, T.; Wang, G.; Guan, C.; Gao, X. The alleviation of salt stress on rice through increasing photosynthetic capacity, maintaining redox homeostasis and regulating soil enzyme activities by Enterobacter sp. JIV1 assisted with putrescine. Microbiol. Res. 2024, 280, 127590. [Google Scholar] [CrossRef] [Scilit]
- Zhang, Y.; Shi, Y.; Gong, H.; Zhao, H.; Li, H.; Hu, Y.; Wang, Y. Beneficial effects of silicon on photosynthesis of tomato seedlings under water stress. J. Integr. Agric. 2018, 17, 2151–2159. [Google Scholar] [CrossRef] [Scilit]
- Zhou, H.M.; Niu, X.L.; Yan, H.; Zhao, L.; Zhao, N.; Xiang, Y.Z. Effects of water and fertilizer coupling on growth and photosynthetic characteristics of young apple tree. J. Henan Agric. Sci. 2019, 48, 112–119, (In Chinese with English Abstract). [Google Scholar] [CrossRef]
- Toma, Y.; Higuchi, T.; Nagata, O.; Kato, Y.; Izumiya, T.; Oomori, S.; Ueno, H. Efflux of soil nitrous oxide from applied fertilizer containing organic materials in Citrus unshiu field in Southwestern Japan. Agriculture 2017, 7, 10. [Google Scholar] [CrossRef] [Scilit]
- Jin, L.; Jin, N.; Wang, S.; Li, J.; Meng, X.; Xie, Y.; Wu, Y.; Luo, S.; Lyu, J.; Yu, J. Changes in the microbial structure of the root soil and the yield of Chinese baby cabbage by chemical fertilizer reduction with bio-organic fertilizer application. Microbiol. Spectr. 2022, 10, e0121522. [Google Scholar] [CrossRef] [Scilit] [PubMed]
- Yu, Z.; Guo, B.; Sun, T.; Li, R.; Zhao, Z.; Yao, L. Effects of organic fertilizer substitution for mineral fertilizer on soil fertility, yield, and quality of muskmelons. Agronomy 2025, 15, 639. [Google Scholar] [CrossRef] [Scilit]
- Zuoping, Z.; Sha, Y.; Fen, L.; Puhui, J.; Xiaoying, W.; Yan’an, T. Effects of chemical fertilizer combined with organic manure on Fuji apple quality, yield and soil fertility in apple orchard on the Loess Plateau of China. Int. J. Agric. Biol. Eng. 2014, 7, 45–55. [Google Scholar] [CrossRef]
- Shi, X.; Hao, X.; Shi, F.; Li, N.; Tian, Y.; Han, P.; Wang, J.; Liu, P.; Luo, H. Improving cotton productivity and nutrient use efficiency by partially replacing chemical fertilizers with organic liquid fertilizer under mulched drip irrigation. Ind. Crops Prod. 2024, 216, 118731. [Google Scholar] [CrossRef] [Scilit]
- Dou, Z.; Abdelghany, A.E.; Zhang, H.; Feng, H.; Zhang, Y.; Yu, S.; Zhang, F.; Li, Z.; Fan, J. Exogenous silicon application improves fruit yield and quality of drip-irrigated greenhouse tomato by regulating physiological characteristics and growth under combined drought and salt stress. Sci. Hortic. 2023, 321, 112352. [Google Scholar] [CrossRef] [Scilit]
- Li, Q.; Chen, Y.; Zhu, J.; Liu, L.; Liu, J.; Cheng, C.; Li, L. Effects of organic substitution on the yield and quality of apples and residual nitrate-n leaching in soil. Agronomy 2024, 14, 415. [Google Scholar] [CrossRef] [Scilit]
- Munna, M.R.; Trisa, S.A.; Islam, M.M.; Islam, M.; Pal, D.; Rahman, M. Commercially available organic manures on growth, yield and nutrient content of Burmese Grapes (Baccaurea ramiflora). J. Biodivers. Conserv. Bioresour. Manag. 2022, 7, 63–72. [Google Scholar] [CrossRef] [Scilit]
- Hazarika, T.K.; Aheibam, B. Soil nutrient status, yield and quality of lemon (Citrus limon Burm.) cv. “Assam lemon” as influenced by bio-fertilizers, organics and inorganic fertilizers. J. Plant Nutr. 2019, 42, 853–863. [Google Scholar] [CrossRef] [Scilit]
- Liu, W.; Wang, Q.; Wang, B.; Wang, X.; Franks, A.E.; Teng, Y.; Li, Z.; Luo, Y. Changes in the abundance and structure of bacterial communities under long-term fertilization treatments in a peanut monocropping system. Plant Soil 2015, 395, 415–427. [Google Scholar] [CrossRef] [Scilit]
- Yang, Y.; Zha, W.; Tang, K.; Deng, G.; Du, G.; Liu, F. Effect of nitrogen supply on growth and nitrogen utilization in hemp (Cannabis sativa L.). Agronomy 2021, 11, 2310. [Google Scholar] [CrossRef] [Scilit]
- Zhang, W.; Lu, J.S.; Bai, J.; Khan, A.; Zhao, L.; Wang, W.; Zhu, S.G.; Liu, S.T.; Jin, J.M.; Nyanchera, G.D.; et al. Reduced fertilization boosts soil quality and economic benefits in semiarid apple orchard: A two-year appraisal of fertigation strategy. Agric. Water Manag. 2024, 295, 108766. [Google Scholar] [CrossRef] [Scilit]
- Wang, X.; Bao, Q.; Sun, G.; Li, J. Application of homemade organic fertilizer for improving quality of apple fruit, soil physicochemical characteristics, and microbial diversity. Agronomy 2022, 12, 2055. [Google Scholar] [CrossRef] [Scilit]
- Marzouk, H.A.; Kassem, H.A. Improving fruit quality, nutritional value and yield of Zaghloul dates by the application of organic and/or mineral fertilizers. Sci. Hortic. 2011, 127, 249–254. [Google Scholar] [CrossRef] [Scilit]
- Ye, L.; Zhao, X.; Bao, E.; Li, J.; Zou, Z.; Cao, K. Bio-organic fertilizer with reduced rates of chemical fertilization improves soil fertility and enhances tomato yield and quality. Sci. Rep. 2020, 10, 177. [Google Scholar] [CrossRef] [Scilit]
- Chen, L.; Li, X.; Peng, Y.; Xiang, P.; Zhou, Y.; Yao, B.; Zhou, Y.; Sun, C. Co-application of biochar and organic fertilizer promotes the yield and quality of red pitaya (Hylocereus polyrhizus) by improving soil properties. Chemosphere 2022, 294, 133619. [Google Scholar] [CrossRef] [Scilit]
- García-Orenes, F.; Roldán, A.; Morugán-Coronado, A.; Linares, C.; Cerdà, A.; Caravaca, F. Organic fertilization in traditional Mediterranean grapevine orchards mediates changes in soil microbial community structure and enhances soil fertility. Land Degrad. Dev. 2016, 27, 1622–1628. [Google Scholar] [CrossRef] [Scilit]
- Luo, G.; Li, L.; Friman, V.P.; Guo, J.; Guo, S.; Shen, Q.; Ling, N. Organic amendments increase crop yields by improving microbe-mediated soil functioning of agroecosystems: A meta-analysis. Soil Biol. Biochem. 2018, 124, 105–115. [Google Scholar] [CrossRef] [Scilit]
- Kumar, J.; De, N.; Pradhan, A.K.; Chary, G.R.; Bhatt, R.; Avila-Quezada, G.D.; Mattar, M.A. Long-term effects of inorganic and organic fertilizer application on crop yield and soil carbon dynamics in rainfed rice-lentil system. J. Plant Nutr. 2026, 49, 1202–1213. [Google Scholar] [CrossRef] [Scilit]
- Liang, C.; Schimel, J.P.; Jastrow, J.D. The importance of anabolism in microbial control over soil carbon storage. Nat. Microbiol. 2017, 2, 17105. [Google Scholar] [CrossRef] [Scilit]
- Chen, J.; Lü, S.; Zhang, Z.; Zhao, X.; Li, X.; Ning, P.; Liu, M. Environmentally friendly fertilizers: A review of materials used and their effects on the environment. Sci. Total Environ. 2018, 613–614, 829–839. [Google Scholar] [CrossRef] [Scilit] [PubMed]
- Cai, A.; Xu, M.; Wang, B.; Zhang, W.; Liang, G.; Hou, E.; Luo, Y. Manure acts as a better fertilizer for increasing crop yields than synthetic fertilizer does by improving soil fertility. Soil Till. Res. 2019, 189, 168–175. [Google Scholar] [CrossRef] [Scilit]
- Ladha, J.K.; Tirol-Padre, A.; Reddy, C.K.; Cassman, K.G.; Verma, S.; Powlson, D.S.; van Kessel, C.; de B. Richter, D.; Chakraborty, D.; Pathak, H. Global nitrogen budgets in cereals: A 50-year assessment for maize, rice and wheat production systems. Sci. Rep. 2016, 6, 19355. [Google Scholar] [CrossRef] [Scilit]
- Wen, S.; Cui, N.; Li, M.; Gong, D.; Xing, L.; Wu, Z.; Fan, J.; Zhang, Y.; Wang, Z. Optimizing irrigation and nitrogen fertilizer management to improve apple yield, quality, water productivity and nitrogen use efficiency: A global meta-analysis. Sci. Hortic. 2024, 332, 113221. [Google Scholar] [CrossRef] [Scilit]
- Zörb, C.; Senbayram, M.; Peiter, E. Potassium in agriculture–status and perspectives. J. Plant Physiol. 2014, 171, 656–669. [Google Scholar] [CrossRef] [Scilit] [PubMed]
- Lester, G.E.; Jifon, J.L.; Makus, D.J. Impact of potassium nutrition on postharvest fruit quality: Melon (Cucumis melo L.) case study. Plant Soil 2010, 335, 117–131. [Google Scholar] [CrossRef] [Scilit]

Disclaimer/Publisher’s Note: The statements, opinions and data contained in all publications are solely those of the individual author(s) and contributor(s) and not of MDPI and/or the editor(s). MDPI and/or the editor(s) disclaim responsibility for any injury to people or property resulting from any ideas, methods, instructions or products referred to in the content. |
© 2026 by the authors. Licensee MDPI, Basel, Switzerland. This article is an open access article distributed under the terms and conditions of the Creative Commons Attribution (CC BY) license.