


Abstract
Henan Province, the foremost wheat-producing region in China, frequently experiences drought stress during the wheat seedling stage. Innovating the evaluation methods for drought resistance at this stage and identifying drought-resistant varieties are crucial for the effective utilization of germplasm. This study utilized 55 wheat varieties that have been bred and promoted in Henan Province in recent years as experimental materials. A 15% PEG-6000 solution was employed to simulate drought stress, and the primary morphological indicators of seedlings, relative chlorophyll content (SPAD), and various chlorophyll fluorescence parameters were assessed. The comprehensive drought resistance scores (D values) for each variety were determined by calculating the drought resistance coefficients for each index, employing principal component analysis, and conducting membership function analysis. Based on the cluster analysis of D values, 55 varieties were categorized into four groups: high drought resistance (10), medium drought resistance (28), low drought resistance (16), and drought-sensitive (1). Seven indicators—SPAD, fresh root weight, seedling height, fresh weight of the aboveground part, Fv/Fm, PItotal, and Mo—were selected as evaluation metrics for the drought resistance of wheat through stepwise regression analysis. The comprehensive evaluation system developed in this study, which is based on morphological and photosynthetic fluorescence characteristics, can swiftly and accurately assess the drought resistance of wheat seedlings. The key indicators identified for highly drought-resistant varieties may serve as valuable references for drought-resistant wheat breeding in Henan Province.
1. Introduction
Wheat ranks among the most vital food crops globally, with nearly 35% of the world’s population depending on it as their primary food source [1]. Projections indicate that by 2050, global demand for wheat will rise by 40% per unit area [2]. China stands as the largest producer of wheat, with Henan Province serving as a significant production region for winter wheat, contributing stable output essential for national food security. However, precipitation in Henan Province exhibits considerable variability from year to year. Consequently, winter wheat seedlings frequently experience seasonal drought stress during the seedling stage, which adversely impacts their growth and subsequent yield formation [3]. Therefore, developing accurate and efficient methods for assessing drought resistance at the seedling stage and screening for drought-resistant germplasm resources is crucial for advancing drought-resistant wheat breeding and optimizing production strategies.
The seedling stage is critical for the growth and development of wheat. During this period, the root system is not yet fully developed and is highly sensitive to fluctuations in soil moisture [4,5]. Drought stress induces an imbalance between the production and clearance of reactive oxygen species (ROS) within plant cells, resulting in membrane lipid peroxidation, damage to photosynthetic structures, and inhibited growth [6,7]. Notably, photosynthesis is one of the physiological processes most affected by drought stress. Under such conditions, stomatal closure reduces CO2 supply, excessively reduces the photosynthetic electron transport chain, and triggers photoinhibition and photooxidative damage [8]. Research indicates that the response characteristics of wheat seedlings to drought stress are closely linked to their subsequent growth performance and final yield. Varieties exhibiting stronger drought resistance at the seedling stage often demonstrate improved water use efficiency and yield stability in later growth stages [9]. Thus, developing an accurate and efficient method for identifying drought resistance during the seedling stage is essential for the selection and breeding of drought-resistant varieties and for optimizing production strategies.
Polyethylene glycol (PEG) has been extensively utilized for the rapid indoor assessment of drought tolerance in plant seedlings, owing to its ability to simulate osmotic stress, ease of use, and controllable conditions [10,11]. Drought stress was simulated using PEG-6000, in conjunction with morphological indicators such as germination rate, seedling height, root length, and biomass. This approach has been effectively employed to evaluate the drought resistance of various crops, including wheat, corn, and rice [12,13,14,15]. Under PEG-induced drought stress, significant alterations were observed in both morphological indicators (e.g., plant height, root length, and biomass) and physiological indicators (e.g., chlorophyll content and membrane permeability) of wheat seedlings. These changes can, to some extent, reflect the differences in drought resistance among various cultivars [15,16,17]. However, traditional methods for determining morphophysiological indicators typically involve destructive sampling, which complicates continuous dynamic monitoring and introduces a degree of lag. In contrast, chlorophyll fluorescence technology can analyze the operational status of photosynthetic mechanisms through millisecond-level fluorescence signals, enabling rapid and non-destructive assessment of plant stress levels [18]. Previous studies have demonstrated that the fluorescence parameter Fv/Fm is significantly correlated with wheat yield under drought stress and can effectively quantify yield loss during such stress conditions [19]. Currently, there is a paucity of studies systematically comparing the drought resistance of multiple wheat varieties at the seedling stage using fluorescence parameters.
This study aims to develop a rapid evaluation method for assessing the drought resistance of wheat seedlings by integrating photosynthetic characteristics and morphological features. This approach provides a theoretical foundation and technical support for the selection and breeding of drought-resistant winter wheat varieties, as well as for dryland cultivation management. Additionally, it offers a methodological reference for the swift identification of drought resistance in other crops.
2. Test Materials and Methods
2.1. Test Materials
The test materials consisted of 55 winter wheat varieties that have been bred and widely promoted in Henan Province in recent years (Table 1). All varieties were provided by the Wheat Research Institute of the Henan Academy of Agricultural Sciences (Zhengzhou, Henan, China, 34.76′ N, 113.65′ E).
Table 1.
Wheat varieties and pedigree sources in the experiment.
2.2. Experimental Design
The experiment was conducted in the artificial climate room of the Wheat Research Institute of the Henan Academy of Agricultural Sciences in August 2025. Plump and uniformly sized seeds were selected and placed in a Petri dish lined with moist filter paper for germination under dark conditions at 25 °C. The seeds were arranged in a culture dish with a diameter of 9 cm for the germination process, which lasted for 6 to 7 days. Throughout this period, the filter paper was maintained in a moist state. Once the seeds germinated and the germination length reached 6 cm, 16 seedlings of each variety exhibiting consistent growth were selected and transferred to a hydroponic tray; all varieties are arranged completely randomly on the hydroponic tray. This hydroponic device consisted of a seedling tray filled with 12 L of Hoagland complete nutrient solution. The seedlings were secured in the holes of a foam board floating on the liquid surface using sponge balls, and the nutrient solution was replaced weekly. Treatment commenced when the seedlings attained the two-leaf stage, approximately 7 to 9 days after germination. Two experimental groups were established: the control group, which received a 0% PEG-6000 solution (Tianjin Kemiou Chemical Reagent Co., Ltd., Tianjin, China), and the treatment group, which was administered a 15% polyethylene glycol-6000 solution. Treatment continued until the seedlings reached the three-leaf and one-heart stage, roughly 8 to 10 days later. The entire treatment process occurred during the plants’ growth, with temperature maintained at 22–24 °C and humidity at 50% ± 10%. A white light source provided illumination, delivering a photosynthetically active radiation level of 300 μmol∙m−2∙s−1. The light cycle was set to 12 h of light followed by 12 h of darkness. Eight biological replicates were analyzed for each variety and treatment.
2.3. Methods for Determining Morphological Indicators
Following the completion of treatment, eight seedlings from each variety were randomly selected. The height of the seedlings, measured from the embryo sheath to the tip of the longest leaf, and the root length, measured from the junction of the root and stem to the tip of the longest root, were recorded using a ruler. The seedlings were then separated into aboveground and root portions with a scalpel. The Shoot Fresh Weight (SFW) and the Root Fresh Weight (RFW) were determined using an electronic balance with an accuracy of 0.01 g. The aboveground parts were placed in kraft paper bags, blanched at 105 °C for 15 min, dried at 80 °C until a constant weight was achieved, and the Shoot Dry Weight (SDW) was subsequently measured.
2.4. Method for Determining Relative Chlorophyll Content
The SPAD-502 PLUS chlorophyll meter (Konica Minolta, Tokyo, Japan) was employed to determine relative chlorophyll content, with SPAD values measured in the middle of the latest fully unfolded leaves of each seedling.
2.5. Determination and Calculation Methods of Chlorophyll Fluorescence Parameters
The chlorophyll rapid fluorescence induced kinetic curve (OJIP) was measured using the multi-functional plant efficiency meter (M-PEA, Hansatech Instruments, Norfolk, UK), and the raw data were exported via the M-PEA Data-Analyzer V.5.1 software. The fluorescence parameters were calculated following the methods outlined by Strasser [20] et al. and Yang [21] et al., as detailed in Table 2.
Table 2.
Parameters and formulas of chlorophyll rapid fluorescence induction kinetics curve.
2.6. Calculation of Drought Resistance Coefficient
The drought resistance coefficient was calculated for each index of each variety to reflect the ability of the variety to maintain the stability of a specific trait under drought stress. The formula is as follows [22,23]:
DRCi = (Xsi/Xci) × 100%.
Note: DRCi represents the drought resistance coefficient of the i-th variety for a specific indicator. Xsi denotes the measured value of this index for the i-th variety under drought stress treatment, while Xci indicates the measured value of this index for the i-th variety under control conditions.
2.7. Calculation of Membership Function Values
The membership function value was calculated by referring to the methods of predecessors [24,25,26]. The formula is as follows:
UXj = (Xj − Xjmin)/(Xjmax − Xjmin); j = 1, 2, 3, … n.
Note: UXj denotes the drought resistance membership degree of the j-th index across all materials, Xj represents the measured value of the j-th index for all materials, Xjmin indicates the minimum value of the j-th index among all materials, and Xjmax signifies the maximum value of the j-th index across all materials.
2.8. Weights of Comprehensive Indicators
The weight [26,27] is calculated based on the contribution rate of the principal components. The formula is as follows:
Note: Wj represents the significance of the j-th comprehensive index among all comprehensive indicators, while Pj denotes the contribution rate of the j-th comprehensive index for each variety.
2.9. Comprehensive Evaluation Value of Drought Resistance
The comprehensive evaluation value D of drought resistance is calculated as follows:
Note: UXj represents the drought resistance membership degree of the j index of all materials, Xj represents the measured value of the j index of all materials, Xjmin represents the minimum value of the J index of all materials, and Xjmax represents the maximum value of the j index of all materials.
2.10. Statistical Analysis
Data organization was performed using Microsoft Excel 365. Correlation analysis and principal component analysis were executed with SPSS 21.0 and Origin2025 software. In the principal component analysis, principal components with eigenvalues greater than or equal to 1 were retained, followed by systematic cluster analysis of the results. Data plotting was conducted using GraphPad Prism 8.0.1.
3. Results
3.1. Genetic Variation Analysis of Drought Resistance Coefficient in Morphological and Physiological Indicators of Wheat Under Drought Stress
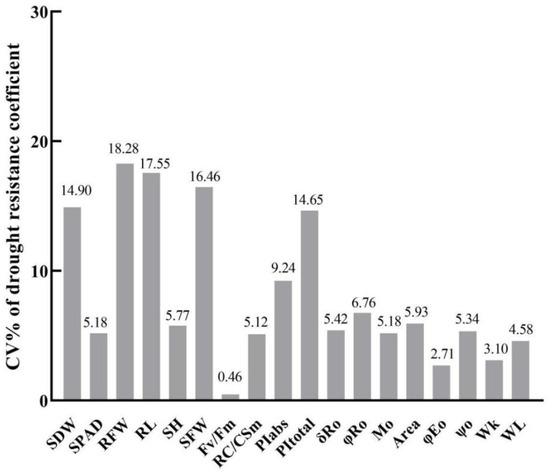
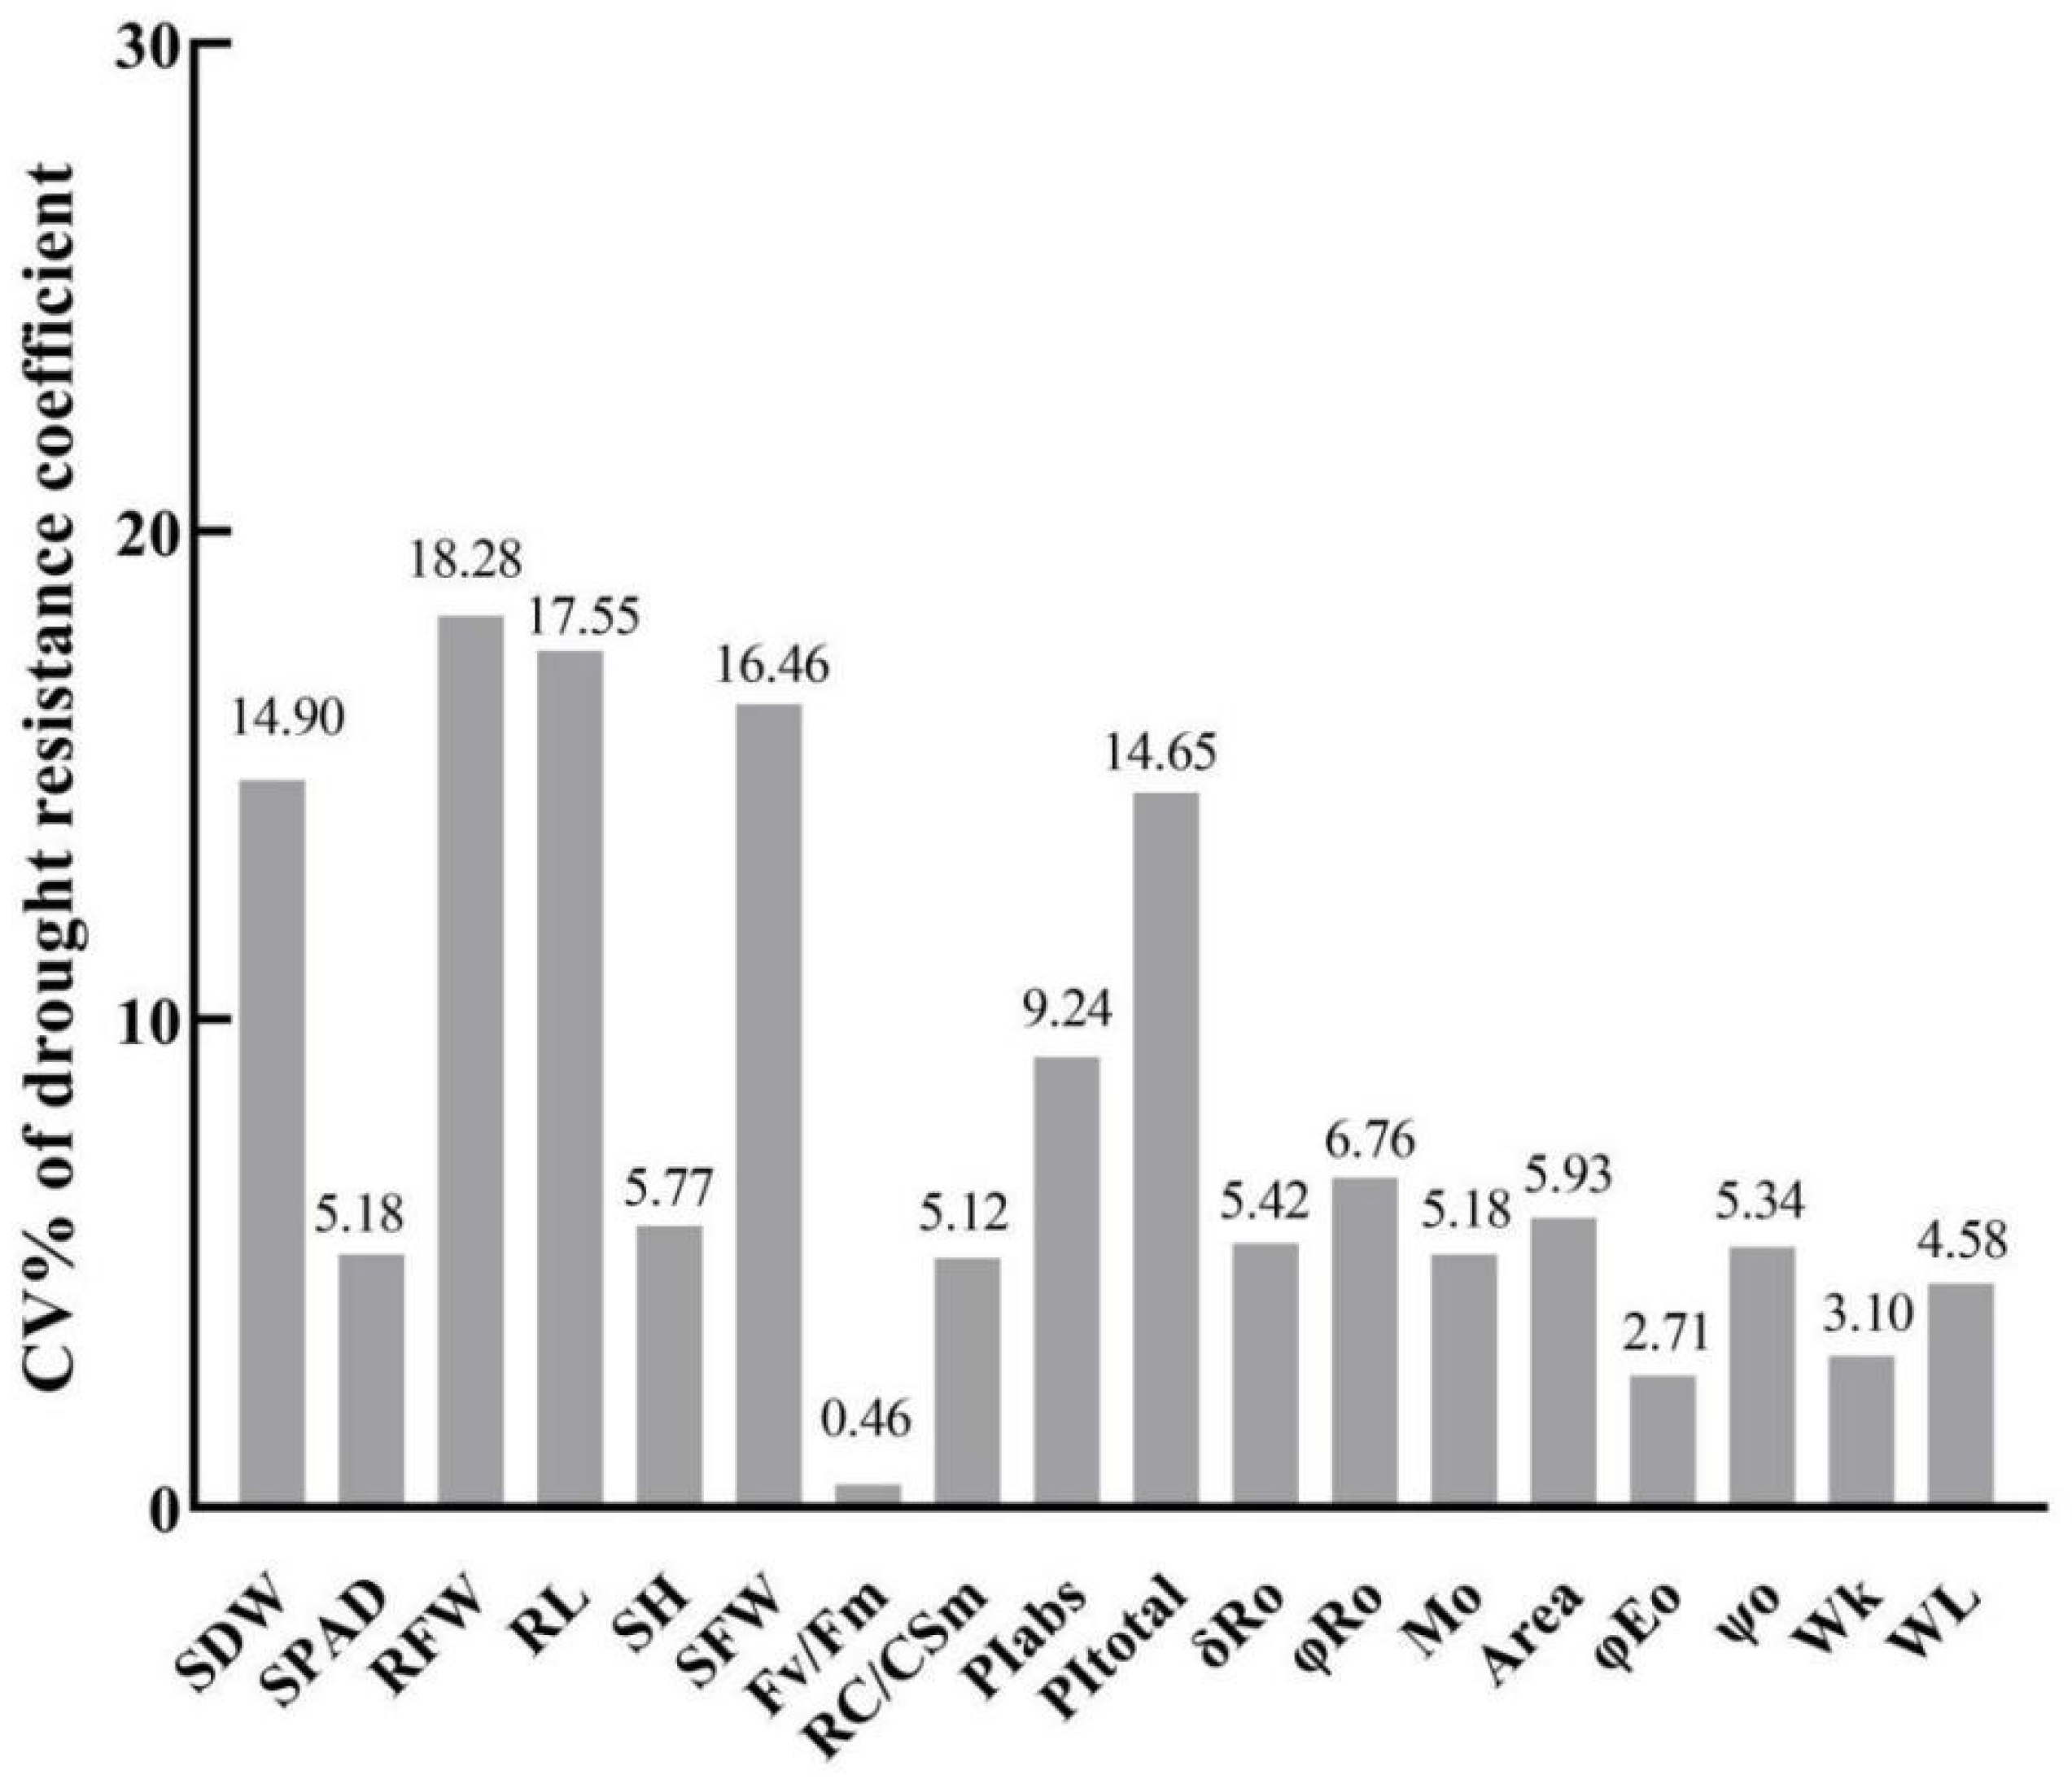
Under polyethylene glycol (PEG) simulation of drought stress, the growth of 55 wheat varieties from Henan Province was inhibited to varying extents (Figure S1, Tables S1 and S2). To quantify the variation among different indicators across varieties, the coefficient of variation (CV%) for the drought resistance coefficients of 18 indicators were calculated. As illustrated in Figure 1, the CV values range from 0.46% to 18.28%. Notably, indicators such as root fresh weight (18.28%), root length (17.55%), shoot fresh weight (16.46%), shoot dry weight (14.90%), and PItotal (14.65%) exhibited considerable variation, indicating substantial genetic diversity for these traits among varieties. In contrast, fluorescence parameters such as Fv/Fm (0.46%), φEo (2.71%), and Wk (3.10%) displayed relatively small variations, suggesting that these indicators remain stable under drought stress. The significant differences in the coefficients of variation among the indicators imply that a single indicator may not adequately reflect the drought resistance of a variety; therefore, a comprehensive evaluation utilizing multiple indicators is warranted.
Figure 1.
Coefficient of variation values for the drought resistance coefficients of wheat varieties. SDW denotes the shoot dry weight, SPAD indicates the relative chlorophyll content, RFW refers to the root fresh weight, RL represents the root length, SH signifies the seedling height, and SFW corresponds to the shoot fresh weight; the fluorescence parameter Fv/Fm denotes the maximum photochemical efficiency of PSII, RC/CSm indicates the number of active reaction centers per unit area of PSII, PIabs reflects the comprehensive performance index of PSII activity, PItotal represents the overall performance of the photosynthetic electron transport chain, δRo signifies the ratio of electrons transferred to the receptor side of PSI relative to those transferred downstream of QA, φRo indicates the ratio of light energy conveyed to the terminal of PSI compared to the absorbed light energy of PSII, Mo denotes the accumulation of QA on the receptor side of PSII, area reflects the capacity of the PQ pool on the receptor side of PSII, φEo represents the ratio of light energy transferred downstream of QA to the absorbed light energy, ψo indicates the ratio of captured excitons that facilitate electron movement to the electron transport chain beyond QA, WK represents the activity on the donor side of PSII, and WL reflects the degree of energy coupling between PSII units.
3.2. Correlation Analysis Among Drought Resistance Coefficients of Various Indicators of Wheat Under Drought Stress
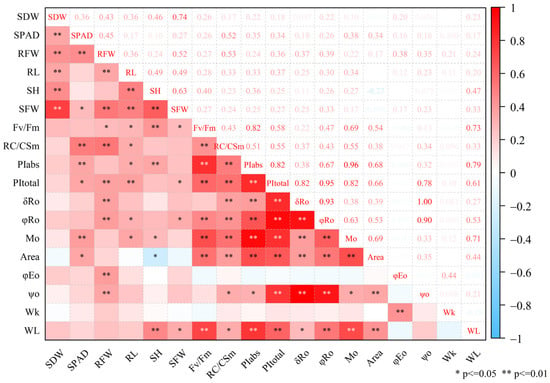
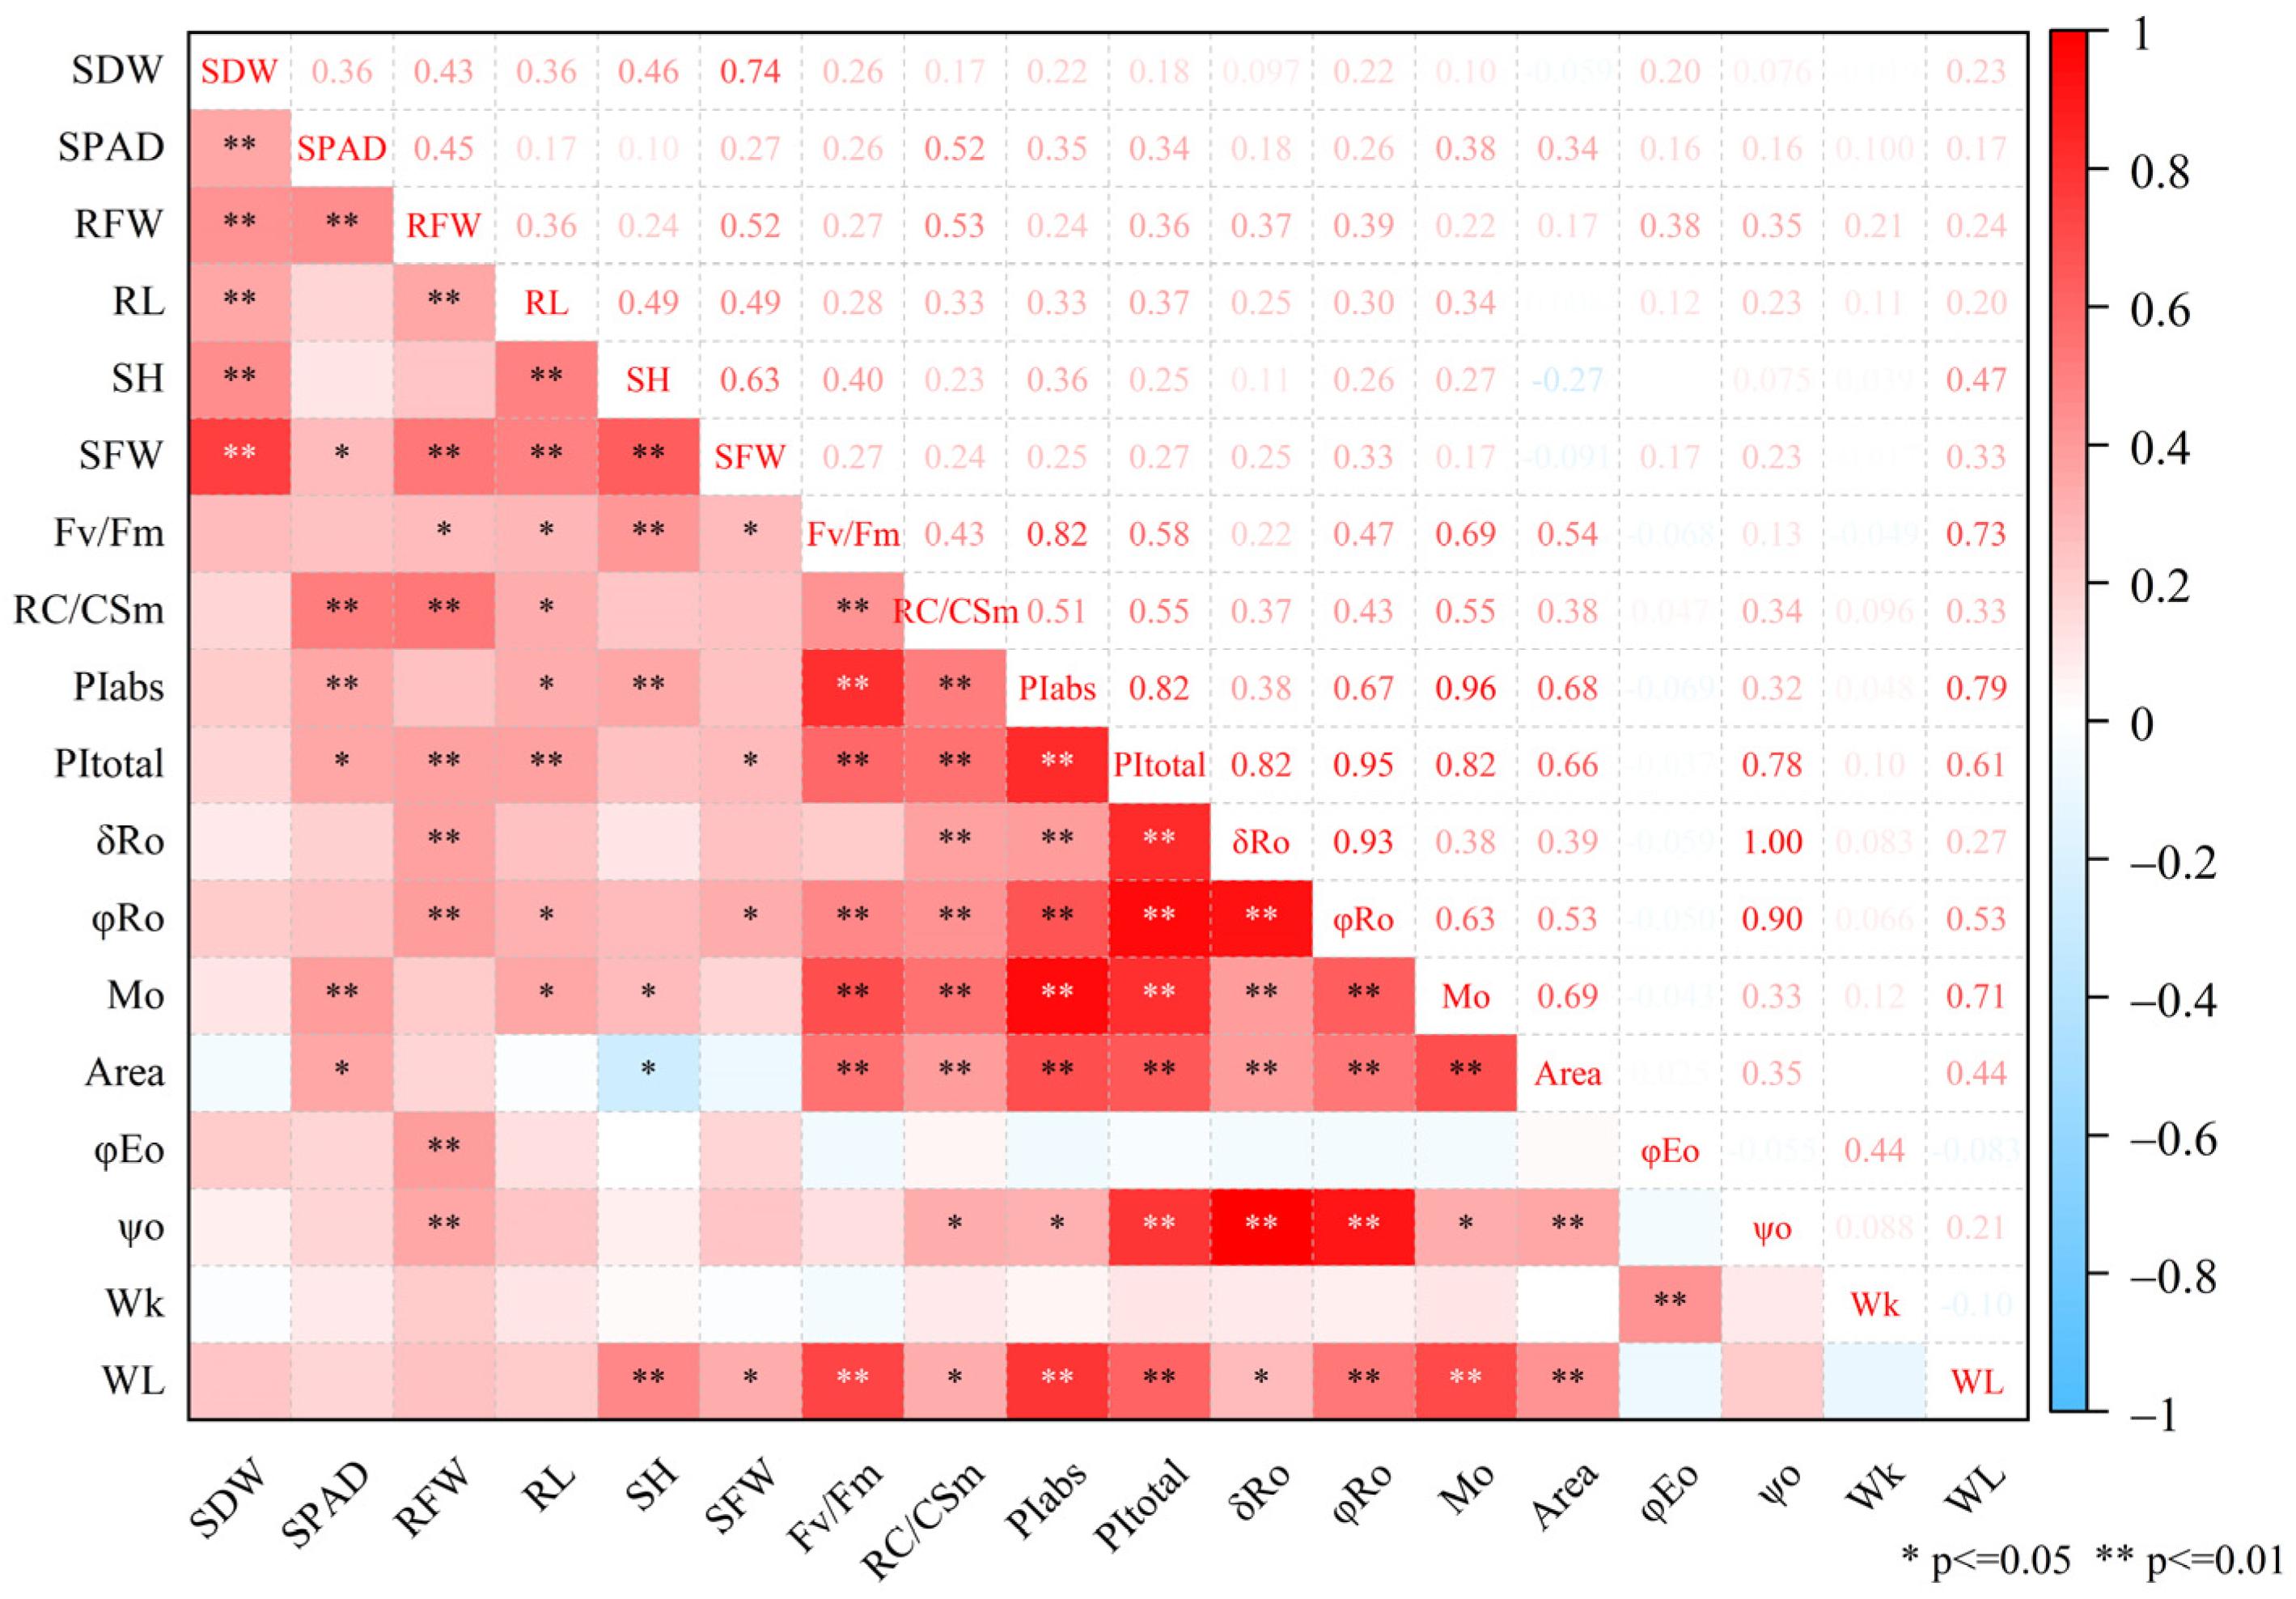
Correlation analysis was performed on the drought resistance coefficients of the 18 indicators, with the results presented in Figure 2. The fresh root weight and root length exhibited significant positive correlations with the fluorescence parameters Fv/Fm, RC/CSm, PItotal, and φRo. Additionally, the SPAD value showed significant positive correlations with the fluorescence parameters RC/CSm, PIabs, PItotal, Mo, and Area. Seedling height was significantly correlated with Fv/Fm, PIabs, Mo, Area, and WL, while the shoot fresh weight was significantly positively correlated with Fv/Fm, PItotal, φRo, and WL. Furthermore, distinct correlations were observed among other indicators. The significant correlation between morphological indicators and fluorescence parameters suggests that well-growing varieties are likely to exhibit higher photosynthetic electron transfer efficiency, providing a theoretical foundation for selecting photosynthetic parameters as indicators for evaluating drought resistance. The complex interrelations among various indicators underscore the necessity of employing multivariate statistical methods for a comprehensive evaluation.
Figure 2.
Correlation analysis of drought resistance coefficients for wheat indicators under drought conditions. SDW denotes the shoot dry weight, SPAD indicates the relative chlorophyll content, RFW refers to the root fresh weight, RL represents the root length, SH signifies the seedling height, and SFW corresponds to the shoot fresh weight. In the lower left quadrant, asterisks (*) denote significant differences (* p < 0.05 and ** p < 0.01); in the upper right quadrant, each value represents a related measurement, the fluorescence parameter Fv/Fm denotes the maximum photochemical efficiency of PSII, RC/CSm indicates the number of active reaction centers per unit area of PSII, PIabs reflects the comprehensive performance index of PSII activity, PItotal represents the overall performance of the photosynthetic electron transport chain, δRo signifies the ratio of electrons transferred to the receptor side of PSI relative to those transferred downstream of QA, φRo indicates the ratio of light energy conveyed to the terminal of PSI compared to the absorbed light energy of PSII, Mo denotes the accumulation of QA on the receptor side of PSII, area reflects the capacity of the PQ pool on the receptor side of PSII, φEo represents the ratio of light energy transferred downstream of QA to the absorbed light energy, ψo indicates the ratio of captured excitons that facilitate electron movement to the electron transport chain beyond QA, WK represents the activity on the donor side of PSII, and WL reflects the degree of energy coupling between PSII units.
3.3. Principal Component Analysis of Drought Resistance Coefficient of Different Wheat Varieties Under Drought Stress
Principal component analysis was performed on the drought resistance coefficients of 18 indicators. Based on the criterion of eigenvalue >1, five principal components were extracted (Table 3), with eigenvalues of 4.49, 3.62, 2.92, 2.02, and 1.53, respectively. Their contribution rates were 24.95%, 20.12%, 16.24%, 11.19%, and 8.50%, respectively. The cumulative contribution rate reached 81.00%, indicating that these five principal components comprehensively reflect the information contained in the original indicators (Table 3).
Table 3.
Component matrix and cumulative contribution rate.
The factor loading matrix (Table 3) indicates that the first principal component predominantly encompasses fluorescence parameters, including Fv/Fm, PIabs, PItotal, Mo, Area, and WL. The second principal component is primarily associated with electron transfer parameters, such as δRo, φRo, and ψo. The third principal component mainly consists of morphological indicators, including the shoot dry weight, root length, seedling height, and shoot fresh weight. The fourth principal component primarily includes SPAD, root fresh weight, and RC/CSm. The fifth principal component mainly comprises φEo and Wk.
3.4. Comprehensive Evaluation and Classification of Drought Resistance of Different Wheat Varieties
Based on the results of principal component analysis, the scores for the five principal components of each variety were calculated, followed by the determination of the comprehensive evaluation value (D value) for drought resistance using the membership function method. A higher D value indicates stronger drought resistance for the variety. The D values for the 55 varieties range from 0.71 to 4.27 (Table 4). The drought resistance of these varieties was ranked according to their D values. Notably, varieties such as Zhengmai 139, Zhengmai 917, and Wanfeng 269 exhibited relatively strong drought resistance, whereas varieties like Pu Bing 03, Nongda 753, and Xinong 511 demonstrated comparatively weak drought resistance.
Table 4.
Values of comprehensive index (F), index weight (Wj), D value and the drought resistance ranking of wheat cultivars.
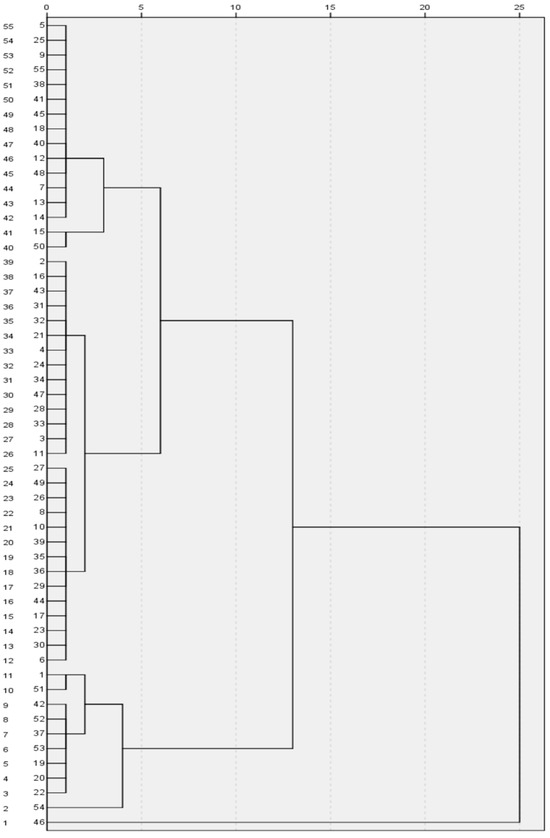
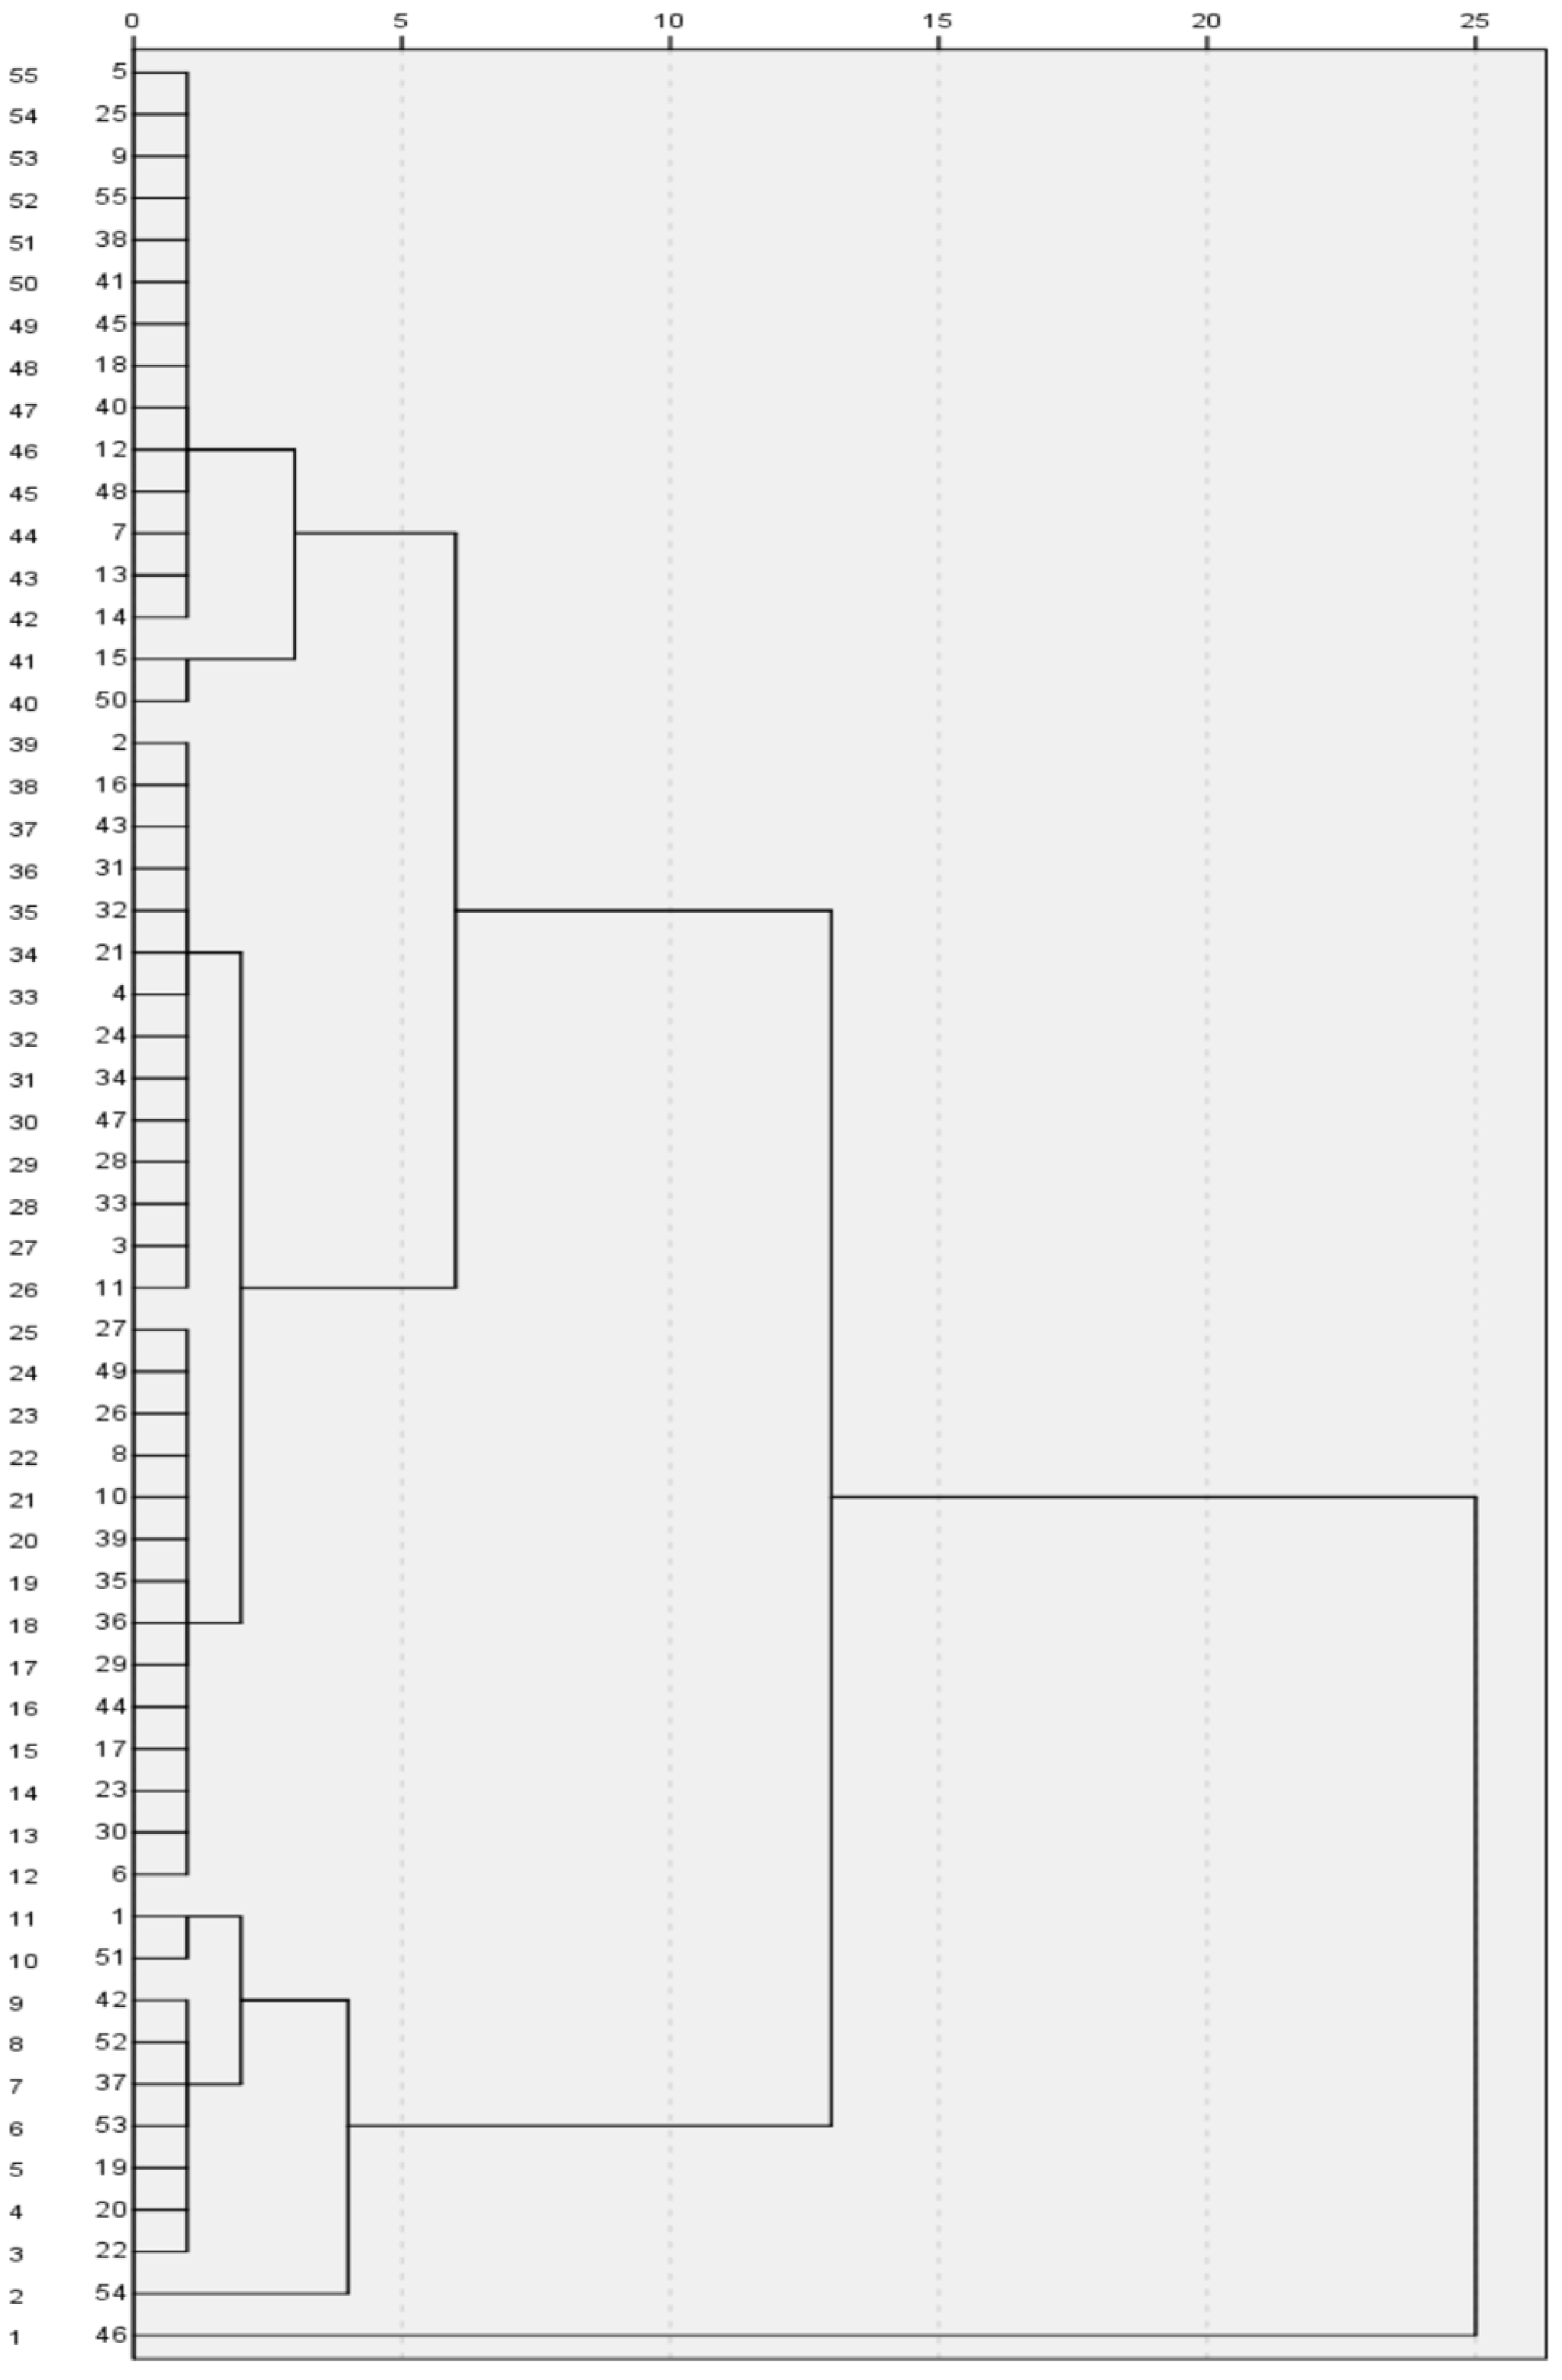
To elucidate the differences in drought resistance among varieties, a systematic cluster analysis was performed based on the D value (Figure 3). At a Euclidean distance of 5, 55 varieties were categorized into four groups (Table 5): The first group, designated as the highly drought-tolerant type (HDT), comprises 10 varieties, including Zhengmai 139 and Zhengmai 20, which represent 18.2% of the total. The second group, identified as the moderately drought-tolerant type (MDT), consists of 28 varieties, such as Bainong 307 and Zhengmai 136, accounting for 50.9%. The third group, termed the mildly drought-tolerant type (MIT), includes 16 varieties, such as Xinong 511 and Zhoumai 22, which make up 29.1%. The fourth group, classified as the drought-susceptible type (DS), contains only Lomai 35, representing 1.8%. The classification results align closely with the ranking of D values, suggesting that the comprehensive evaluation method exhibits strong stability.
Figure 3.
Systematic clustering analysis of 55 wheat varieties.
Table 5.
Drought resistance classification based on D value.
3.5. Establishment of Regression Models and Screening of Drought Resistance Indicators for Chlorophyll Fluorescence Parameters
To further investigate the relationship between the 18 measured indicators and the drought resistance of various wheat varieties, an optimized linear regression equation was developed through stepwise regression analysis. In this model, the comprehensive score value (D) serves as the dependent variable, while the fluorescence parameter indicators of different wheat varieties function as the independent variables:
D = −31.208 + 3.977 X10 + 0.856 X6 + 25.598 X7 + 0.826 X3 + 2.800 X13 + 1.273 X2 + 0.927 X5.
In the formula, X2 represents SPAD, X3 denotes the root fresh weight, X5 indicates the seeding height, X6 signifies the shoot fresh weight, X7 corresponds to Fv/Fm, X10 stands for PItotal, and X13 refers to Mo. The coefficient of determination for the equation is R2 = 0.99, which reaches an extremely significant level (p < 0.01). This result indicates that the selected seven indicators can explain 99% of the variation in the D value. The predicted values (PVs) for each variety were calculated using this equation, and a correlation analysis was performed with the D value (Table 6 and Table 7). The correlation analysis revealed an extremely significant positive correlation (r = 0.99, p < 0.01), further validating the reliability of the regression equation. Consequently, SPAD, root fresh weight, seedling height, shoot fresh weight, Fv/Fm, PItotal, and Mo can be considered core indicators for identifying drought resistance in wheat seedlings.
Table 6.
Predicted values for different wheat varieties.
Table 7.
Correlation analysis between D and PV value. **: p < 0.01.
3.6. Characteristic Analysis of Different Drought-Resistant Wheat Varieties
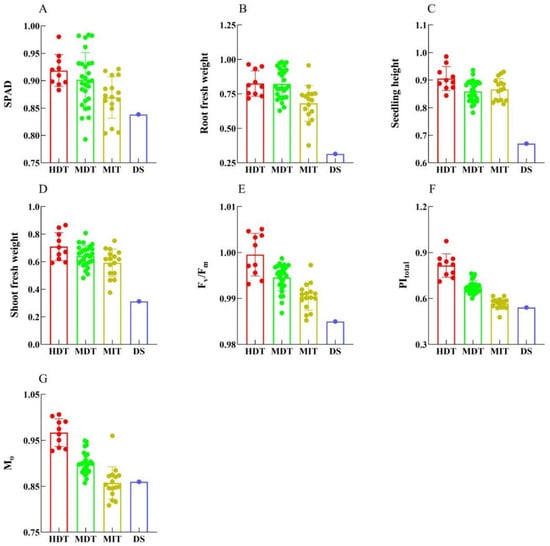
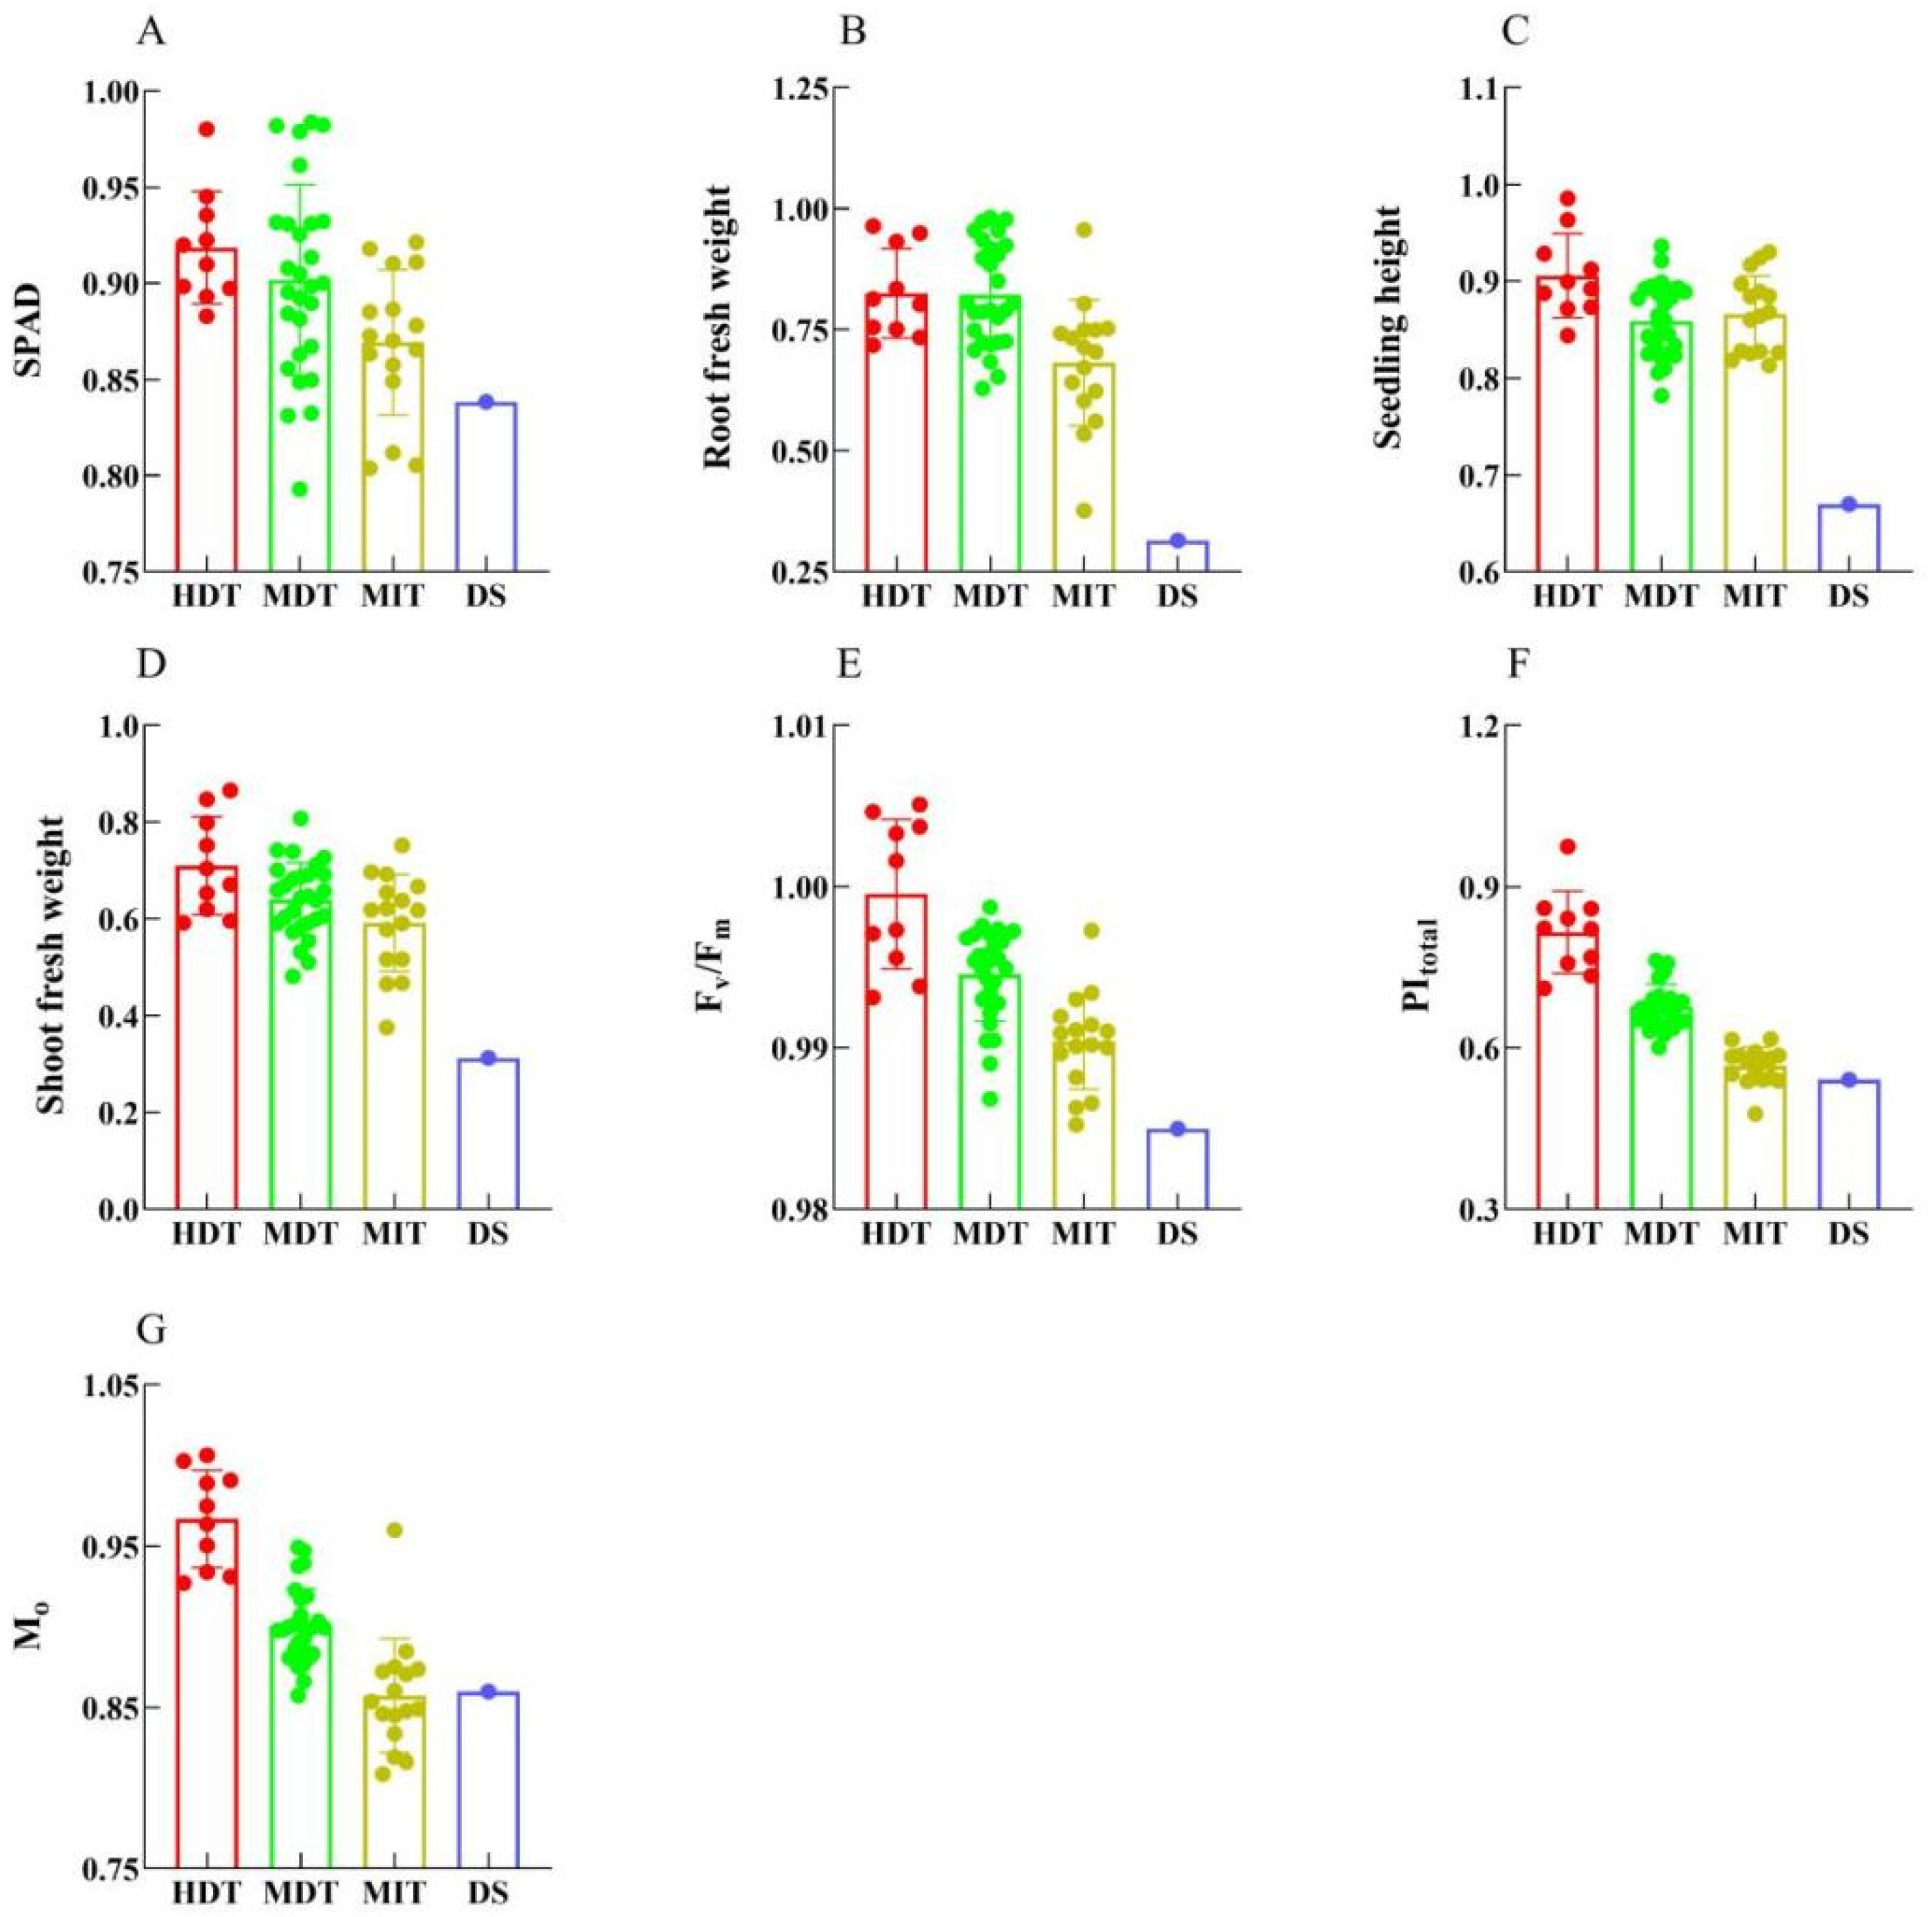
To assess the accuracy of the classification results, we analyzed the performance characteristics of various drought-resistant wheat varieties across seven key indicators. As illustrated in Figure 4, the drought resistance coefficients for SPAD, root fresh weight, seedling height, shoot fresh weight, Fv/Fm, PItotal, and Mo exhibit a stepwise decline from highly drought-resistant to drought-sensitive types, represented as HDT > MDT > MIT > DS. This trend indicates that these seven indicators effectively differentiate among the various drought-resistant varieties. The classification results possess biological significance.
Figure 4.
Morphological and physiological characteristics of winter wheat varieties categorized by varying drought resistance capacities. HDT, MDT, MIT, and DS denote high-resistance varieties, medium-drought-resistant varieties, low-drought-resistant varieties, and drought-sensitive varieties, respectively. Panels (A–G) illustrate the relative chlorophyll content, root fresh weight, seedling height, shoot fresh weight, Fv/Fm, PItotal, and Mo, respectively. The solid circles indicate the average drought resistance coefficient for each variety.
3.7. The Relationship Between Drought Resistance Capacity and Drought Resistance Indicators of Different Wheat Varieties
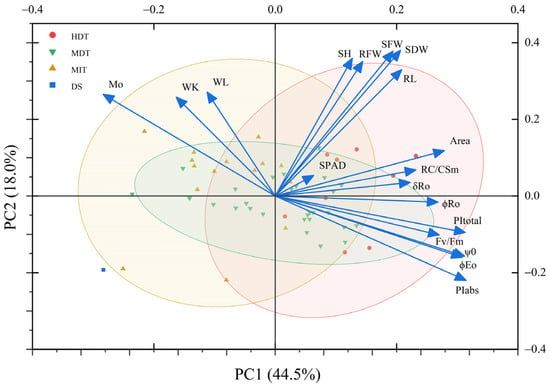
To visually represent the correlation between different drought-resistant types and their respective indicators, we constructed a PCA double-label plot based on the results of principal component analysis (Figure 5). The first principal component (PC1) and the second principal component (PC2) accounted for 24.95% and 20.12% of the total variation, respectively. High-drought-resistant varieties predominantly cluster along the positive half-axis of PC1 and demonstrate a strong correlation with indicators such as SFW, SH, SDW, RL, RC/CSm, Fv/Fm, and Area. The distribution of medium-drought-resistant varieties is relatively dispersed, exhibiting a balanced correlation with various drought resistance indicators. In contrast, low-drought-resistant and drought-sensitive varieties are predominantly located along the negative half-axis of PC1, showing a strong correlation with stress response indicators, including fluorescence parameters Mo, Wk, and WL. The PCA plot effectively validated the results of various indicators associated with different drought-resistant varieties, further supporting the feasibility of integrating morphological indicators with photosynthetic fluorescence indicators for evaluating drought resistance.
Figure 5.
Principal Component Analysis of drought resistance capacity types and indicators for wheat varieties. HDT, MDT, MIT, and DS denote highly drought-tolerant varieties, moderately drought-tolerant varieties, mildly drought-tolerant varieties, and drought-susceptible varieties, respectively. SH, SFW, SDW, RL, RFW, and SPAD correspond to seedling height, shoot fresh weight, shoot dry weight, root length, root fresh weight, and relative chlorophyll content, respectively.
4. Discussion
The direct impact of PEG-simulated drought stress on wheat seedlings primarily affects the root system. This stress impedes water absorption by the roots, leading to a decrease in water transport from the xylem to the above-ground parts of the plant. Consequently, internal physiological disorders arise, which ultimately manifest as morphological changes [28]. These morphological alterations serve as a direct indication of impaired wheat growth. In this study, both root and above-ground development of wheat seedlings were significantly inhibited following drought stress, with notable differences observed among varieties (Table S1). This finding aligns with the majority of studies that have documented significant variations in the morphological responses of different wheat varieties to PEG-simulated drought stress [16,29,30,31]. The use of morphological indicators to assess drought resistance in varieties has consistently been a focal point of research. Sewore et al. [32] utilized morphological and physiological indicators, such as flag leaf size and relative moisture content of leaves, to identify high drought-resistant wheat genotypes and to screen drought resistance indicators across 196 wheat genetic lines using principal component analysis. Tabatabai et al. [16] assessed drought resistance in 169 wheat inbred lines and determined that root length and stem length are the most effective traits for selecting drought-tolerant lines. Ahmad et al. [29] assessed the drought resistance of 80 wheat varieties based on morphological indicators of wheat seedlings. Their findings indicated that seedling biomass, seedling height, and the seedling vitality index are critical indicators for variety screening. The indicators selected for the comprehensive evaluation of drought resistance in this study—seedling biomass, seedling height, and root length—align closely with those identified in previous research. However, earlier studies on drought resistance have primarily concentrated on the physiology and morphology of seedling roots and leaves. There remains a paucity of research examining the differences in photosynthetic electron transfer activity among varieties under drought stress to elucidate drought resistance. Existing literature indicates that fluorescence parameter indicators can effectively screen for heat-tolerant wheat varieties under high-temperature stress [33]. Moreover, the research demonstrated a significant correlation between the maximum photochemical efficiency of PSII and yield under both drought and high-temperature conditions. This parameter can predict the final yield of wheat under drought stress [19,34]. This finding indicates that the varying degrees of drought damage experienced by photosynthetic mechanisms across different varieties may serve as a key factor for rapidly and non-destructively distinguishing the drought resistance of these varieties. This study introduced fluorescence parameters related to photosynthesis, aiming to comprehensively and accurately assess the drought resistance of winter wheat by integrating morphological features and photosynthetic characteristics of seedlings under drought conditions. Additionally, it identified indicators capable of differentiating various drought-resistant wheat varieties, thereby providing a theoretical foundation for future breeding efforts of dryland wheat varieties.
Membership function analysis has been extensively employed to express and identify plants’ tolerance to adverse conditions [26,35,36]. By examining the morphology, relative chlorophyll content, and drought resistance coefficient of fluorescence parameters among wheat varieties under drought conditions, this study constructed an evaluation index that integrates morphological and photosynthetic characteristics using the membership function value method. Consequently, it identified 10 high-drought-resistant varieties, including Zhengmai 139, and 28 medium-drought-resistant varieties, such as Zhengmai 1860. These findings align with previous studies indicating that Zhengmai 1860 and Luohan 22 exhibit moderate drought resistance potential [37,38]. In contrast, the drought resistance of Luomai 35 in this investigation was significantly lower than that of the other varieties. This discrepancy may be attributed to the use of hydroponics in this study, where stress treatment and assessment occurred during the seedling stage. The controlled environment emphasized early osmotic regulation and the physiological responses of photosynthesis in the plants. However, the drought resistance of mature plants in the field is also influenced by factors such as root structure, the ability to utilize deep soil moisture, and phenological regulation. In this study, an optimal linear regression equation was derived through stepwise regression analysis, identifying relative chlorophyll content, fresh root weight, seedling height, shoot fresh weight, Fv/Fm, PItotal, and Mo as indicators for assessing the drought resistance of wheat. Previous research has shown that fluorescence parameters, including Fv/Fm and PItotal, are particularly sensitive to adverse environmental changes [39,40]. Previous studies on camphor trees, Paeonia, and ryegrass have demonstrated the potential for differentiating intraspecific and interspecific drought resistance in plants through fluorescence parameter indicators under drought stress [41,42]. Barboricova et al. [43] investigated the alterations in fluorescence parameters across eight wheat varieties subjected to progressively arid conditions. They assessed the efficacy of using photochemical efficiency (Fv/Fm), the number of active PSII reaction centers (RC/ABS), and the overall performance of PSII (PItotal) to monitor the physiological changes in different wheat varieties. These consistent results further validate the reliability of the fluorescence parameter indicators employed in this study for evaluating drought resistance.
The drought resistance evaluation system developed in this study was established within a controllable hydroponic environment. While this system offers advantages such as environmental control and high repeatability, it does not fully replicate the actual drought conditions encountered in the field. Field drought resistance is influenced by various factors, including root structure, deep water utilization, and phenological regulation capacity [44]. Consequently, future research must validate the highly drought-resistant varieties identified in the laboratory through field studies. By assessing their yield performance and physiological responses under varying water treatments, the drought resistance of these varieties can be further substantiated. This approach will facilitate the establishment of a comprehensive evaluation framework that spans from rapid laboratory identification to precise field predictions, thereby providing a more reliable foundation for drought-resistant wheat breeding. Additionally, by integrating multiple omics approaches, such as transcriptomics and metabolomics, researchers can analyze the molecular mechanisms underlying key drought resistance indicators, offering deeper theoretical insights for the breeding of drought-resistant wheat.
5. Conclusions
In conclusion, the analysis of phenotypes and photosynthetic physiological parameters of wheat seedlings during their growth under drought conditions reveals that drought significantly inhibits wheat growth. A comprehensive evaluation of drought resistance was performed on 55 wheat varieties, resulting in the identification of 10 varieties with high drought resistance, 28 with medium drought resistance, 16 with low drought resistance, and 1 drought-sensitive variety. Seven indicators—relative chlorophyll content (SPAD), fresh root weight, seedling height, fresh weight of the aboveground part, Fv/Fm, PItotal, and Mo—were selected for assessing drought resistance in wheat through stepwise regression analysis. This drought resistance evaluation method, which integrates morphological characteristics of seedlings with photosynthetic traits, offers advantages of rapidity, non-destructiveness, and accuracy. It provides essential technical support for breeding drought-resistant wheat varieties and managing dryland cultivation, thereby holding significant importance for addressing drought stress in the context of climate change, ensuring the stability of wheat production, and safeguarding food security.
Supplementary Materials
The following supporting information can be downloaded at https://www.mdpi.com/article/10.3390/agriculture16080858/s1, Figure S1: The Comparison of the morphology between PEG-treated seedlings and normal seedlings is presented; Table S1: Morphological index changes of 55 winter wheat varieties under drought stress; Table S2: Variation Analysis of drought Resistance Coefficients of Different Indicators for Winter Wheat.
Author Contributions
Conceptualization, C.Y.; investigation, C.T. and L.W.; Methodology, C.Y.; supervision, H.S., H.P. and H.C.; resources, C.Y. and B.F.; data curation, C.T. and C.Y.; writing—original draft preparation, C.T. and C.Y.; writing—review and editing, H.S. and H.P.; visualization, B.F. and S.D.; supervision, C.Y. and F.W.; project administration, C.Y.; funding acquisition, C.Y. and X.L. All authors have read and agreed to the published version of the manuscript.
Funding
This work was supported by the National Key Research and Development Program of China (2022YFD2300202; 2022YFD2300802), Henan Province Science and Technology Research Project (262102111133), the Special Fund for Henan Agriculture Research System (HARS-22-01-G5), and Henan Academy of Agricultural Sciences Innovation Team.
Data Availability Statement
The data presented in this study are available on request from the corresponding author.
Acknowledgments
We thank the members of the Wheat Research Institute of Henan Academy of Agricultural Sciences for their help with the experiments. We appreciate anonymous reviewers for their constructive comments on the manuscript.
Conflicts of Interest
The authors declare no conflicts of interest.
References
- Mohi-Ud-Din, M.; Hossain, M.A.; Rohman, M.M.; Uddin, M.N.; Haque, M.S.; Tahery, M.H.; Hasanuzzaman, M. Multi-Trait Index-Based Selection of Drought Tolerant Wheat: Physiological and Biochemical Profiling. Plants 2025, 14, 35. [Google Scholar] [CrossRef] [Scilit]
- Ray, D.K.; Mueller, N.D.; West, P.C.; Foley, J.A. Yield Trends Are Insufficient to Double Global Crop Production by 2050. PLoS ONE 2013, 8, e66428. [Google Scholar] [CrossRef] [Scilit]
- Zhu, L.L.; Zhang, J.J.; Li, Z.G.; Zhang, Y.W.; Liang, C.L. Spatiotemporal variation characteristics of drought during winter wheat growth period in Henan Province based on SPI. J. Irrig. Drain. 2018, 37, 51–58. (In Chinese) [Google Scholar]
- Shao, H.B.; Liang, Z.S.; Shao, M.A.; Wang, B.C. Changes of anti-oxidative enzymes and membrane peroxidation for soil water deficits among 10 wheat genotypes at seedling. Colloids Surf. B-Biointerfaces 2005, 42, 107–113. [Google Scholar] [CrossRef] [Scilit] [PubMed]
- Sallam, A.; Alqudah, A.M.; Dawood, M.F.A.; Baenziger, P.S.; Börner, A. Drought Stress Tolerance in Wheat and Barley: Advances in Physiology, Breeding and Genetics Research. Int. J. Mol. Sci. 2019, 20, 3137. [Google Scholar] [CrossRef] [Scilit] [PubMed]
- Nyaupane, S.; Poudel, M.R.; Panthi, B.; Dhakal, A.; Paudel, H.; Bhandari, R. Drought stress effect, tolerance, and management in wheat—A review. Cogent Food Agric. 2024, 10, 2296094. [Google Scholar] [CrossRef] [Scilit]
- Hasanuzzaman, M.; Bhuyan, M.; Zulfiqar, F.; Raza, A.; Mohsin, S.M.; Al Mahmud, J.; Fujita, M.; Fotopoulos, V. Reactive Oxygen Species and Antioxidant Defense in Plants under Abiotic Stress: Revisiting the Crucial Role of a Universal Defense Regulator. Antioxidants 2020, 9, 681. [Google Scholar] [CrossRef] [Scilit]
- Gao, J.W.; Luo, Q.C.; Sun, C.J.; Hu, H.; Wang, F.; Tian, Z.W.; Jiang, D.; Cao, W.X.; Dai, T.B. Low Nitrogen Priming Enhances Photosynthesis Adaptation to Water-Deficit Stress in Winter Wheat (Triticum aestivum L.) Seedlings. Front. Plant Sci. 2019, 10, 818. [Google Scholar] [CrossRef] [Scilit]
- Khadka, K.; Earl, H.J.; Raizada, M.N.; Navabi, A. A Physio-Morphological Trait-Based Approach for Breeding Drought Tolerant Wheat. Front. Plant Sci. 2020, 11, 715. [Google Scholar] [CrossRef] [Scilit]
- Li, S.L.; Wang, X.Z.; Liu, X.J.; Thompson, A.J.; Liu, F.L. Elevated CO2 and high endogenous ABA level alleviate PEG-induced short-term osmotic stress in tomato plants. Environ. Exp. Bot. 2022, 194, 104763. [Google Scholar] [CrossRef] [Scilit]
- Qiao, Y.J.; Ren, J.H.; Yin, L.N.; Liu, Y.J.; Deng, X.P.; Liu, P.; Wang, S.W. Exogenous melatonin alleviates PEG-induced short-term water deficiency in maize by increasing hydraulic conductance. BMC Plant Biol. 2020, 20, 218. [Google Scholar] [CrossRef] [Scilit]
- Du, W.T.; Zhang, F.L.; Zhang, L.; Hu, M.T.; Tian, H.J.; Hao, Y.; Ding, S.Q.; Zhang, D. Comprehensive evaluation and screening of drought resistance in maize at germination and seedling stages. Front. Plant Sci. 2025, 16, 1672228. [Google Scholar] [CrossRef] [Scilit]
- Mustamu, N.E.; Tampubolon, K.; Alridiwirsah; Basyuni, M.; Al-Taey, D.K.A.; Janabi, H.; Mehdizadeh, M. Drought stress induced by polyethylene glycol (PEG) in local maize at the early seedling stage. Heliyon 2023, 9, e20209. [Google Scholar] [CrossRef] [Scilit]
- Shereen, A.; Khanzada, M.A.; Baloch, M.A.W.; Asma; Shirazi, M.U.; Khan, M.A.; Arif, M. Effects of PEG induced water stress on growth and physiological responses of rice genotypes at seedling stage. Pak. J. Bot. 2019, 51, 2013–2021. [Google Scholar] [CrossRef] [Scilit] [PubMed]
- Sun, L.; Li, Y.G.; Wang, S.J.; Liu, Y.D.; Wang, Z.Y.; Liu, D.; Li, N.N.; Zhao, C.X.; Gai, H.M. Evaluation of drought resistance of winter wheat varieties at germination stage under simulated drought conditions. Agric. Res. Arid Areas 2017, 35, 109–115. (In Chinese) [Google Scholar]
- Tabatabai, S.M.T.; Goshasbi, F.; Bakhshi, B. Evaluation of the effect of polyethylene glycol (PEG) on germination and morphological characteristics of bread wheat. Cereal Res. Commun. 2022, 50, 1009–1015. [Google Scholar] [CrossRef] [Scilit]
- Yilmaz, P.; Babat, C.F.; Yilmaz, C. Comparison of Short-Term Physiological and Biochemical Effects of Drought Stress on Two Wheat Cultivars. Braz. Arch. Biol. Technol. 2023, 66, e23220705. Available online: https://api.semanticscholar.org/CorpusID:265151541 (accessed on 8 April 2026).
- Li, P.M.; Gao, H.Y.; Strasser, R.J. Application of the fast chlorophyll fluorescence induction dynamics analysis in photosynthesis study. J. Plant Physiol. Mol. Biol. 2005, 31, 559–566. (In Chinese) [Google Scholar]
- Sommer, S.G.; Han, E.S.; Li, X.N.; Rosenqvist, E.; Liu, F.L. The Chlorophyll Fluorescence Parameter Fv/Fm Correlates with Loss of Grain Yield after Severe Drought in Three Wheat Genotypes Grown at Two CO2 Concentrations. Plants 2023, 12, 436. [Google Scholar] [CrossRef] [Scilit] [PubMed]
- Strasser, R.J.; Tsimilli-Michael, M.; Qiang, S.; Goltsev, V. Simultaneous in vivo recording of prompt and delayed fluorescence and 820-nm reflection changes during drying and after rehydration of the resurrection plant Haberlea rhodopensis. Biochim. Biophys. Acta-Bioenerg. 2010, 1797, 1313–1326. [Google Scholar] [CrossRef] [Scilit]
- Yang, C.; Zhang, Z.S.; Yuan, Y.; Zhang, D.Q.; Jin, H.Y.; Li, Y.; Du, S.M.; Li, X.D.; Fang, B.T.; Wei, F.; et al. Natural variation in photosynthetic electron transport of wheat flag leaves in response to dark-induced senescence. J. Photochem. Photobiol. B-Biol. 2024, 259, 113018. [Google Scholar] [CrossRef] [Scilit]
- Song, R.J.; Shi, P.C.; Xiang, L.; He, Y.; Dong, Y.S.; Miao, Y.; Qi, J.C. Evaluation of barley genotypes for drought adaptability: Based on stress indices and comprehensive evaluation as criteria. Front. Plant Sci. 2024, 15, 1436872. [Google Scholar] [CrossRef] [Scilit]
- Li, H.B.; Luo, S.S.; Zhu, K.; Wei, J.J.; Gui, Y.Y.; Liu, X.H.; Tang, Y.H.; Tang, L.Q.; Song, H.Z. Screening and Evaluation of Fifteen Sugarcane Varieties for Drought Resistance. Agronomy 2025, 16, 34. [Google Scholar] [CrossRef] [Scilit]
- Zhang, Y.F.; Xu, S.Q.; Mo, L.L. Screening of grape genotypes for aluminum tolerance and evaluation on selecting indices. Soil Sci. Plant Nutr. 2020, 66, 560–568. [Google Scholar] [CrossRef] [Scilit]
- Xu, C.H.; Mao, J.; Li, X.J.; Burner, D.M.; Li, C.J.; Hussin, S.H.H.; Lin, X.Q.; Liu, H.B.; Zhao, P.F.; Lu, X.; et al. Evaluation of drought tolerance in sugarcane genotypes using the membership function value of drought tolerance (MFVD). Euphytica 2023, 219, 37. [Google Scholar] [CrossRef] [Scilit]
- Wu, X.L.; Liang, H.Y.; Yang, F.; Liu, W.G.; She, Y.H.; Yang, W.Y. Comprehensive evaluation of shade tolerance at seedling stage and screening for its identification indicators in soybean. Sci. Agric. Sin. 2015, 48, 2497–2507. (In Chinese) [Google Scholar]
- Hou, Z.Y.; Gong, Y.Z.; Qian, Y.; Cheng, Z.Y.; Tao, J.; Zhao, D.Q. Evaluation of heat tolerance and screening for identification indicators in herbaceous peony (Paeonia lactiflora Pall.). Sci. Agric. Sin. 2023, 56, 4742–4756. (In Chinese) [Google Scholar]
- Robin, A.H.K.; Uddin, M.J.; Bayazid, K.N. Polyethylene Glycol (PEG)-Treated Hydroponic Culture Reduces Length and Diameter of Root Hairs of Wheat Varieties. Agronomy 2015, 5, 506–518. [Google Scholar] [CrossRef] [Scilit]
- Ahmed, K.; Shabbir, G.; Ahmed, M. Exploring drought tolerance for germination traits of diverse wheat genotypes at seedling stage: A multivariate analysis approach. BMC Plant Biol. 2025, 25, 390. [Google Scholar] [CrossRef] [Scilit]
- Poggi, G.M.; Corneti, S.; Aloisi, I. The Quest for Reliable Drought Stress Screening in Tetraploid Wheat (Triticum turgidum spp.) Seedlings: Why MDA Quantification after Treatment with 10% PEG-6000 Falls Short. Life 2024, 14, 517. [Google Scholar] [CrossRef] [Scilit]
- Zhang, L.L.; Yang, M.M.; Dong, J.; Zhao, W.C.; Gao, X.; Chen, D.Y. Comprehensive evaluation of drought resistance of three new wheat varieties at germination and seedling stages. Agric. Res. Arid Areas 2016, 34, 228–234+279. (In Chinese) [Google Scholar]
- Sewore, B.M.; Abe, A.; Nigussie, M. Evaluation of bread wheat (Triticum aestivum L.) genotypes for drought tolerance using morpho-physiological traits under drought-stressed and well-watered conditions. PLoS ONE 2023, 18, e0283347. [Google Scholar] [CrossRef] [Scilit]
- Jain, N.; Singh, G.P.; Pandey, R.; Ramya, P.; Singh, P.K.; Nivedita; Prabhu, K.V. Chlorophyll fluorescence kinetics and response of wheat (Triticum aestivum L.) under high temperature stress. Indian J. Exp. Biol. 2018, 56, 194–201. [Google Scholar]
- Aberkane, H.; Belkadi, B.; Kehel, Z.; Filali-Maltouf, A.; Tahir, I.S.A.; Meheesi, S.; Amri, A. Assessment of Drought and Heat Tolerance of Durum Wheat Lines Derived from Interspecific Crosses Using Physiological Parameters and Stress Indices. Agronomy 2021, 11, 695. [Google Scholar] [CrossRef] [Scilit]
- Fu, L.J.; Li, C.X.; Su, S.Y.; Li, Y.H.; Zhou, Y. Screening of heat-tolerant germplasms and construction of evaluation system for heat tolerance in cucumber seedlings. Plant Physiol. J. 2020, 56, 1593–1604. (In Chinese) [Google Scholar]
- Yang, C.; Wang, R.; Tian, C.; Zhang, D.; Cheng, H.; Li, X.; Fang, B.; Jin, H.; Song, H.; Tian, B.; et al. The Adaptability of Different Wheat Varieties to Deep Sowing in Henan Province of China. Agronomy 2025, 15, 1466. [Google Scholar] [CrossRef] [Scilit]
- Chen, X.Y.; Song, Y.H.; Zhang, M.H.; Li, X.Y.; Li, H.; Wang, Y.X.; Qi, X.L. Effects of water deficit on physiology and biochemistry of seedlings of different wheat varieties and the alleviation effect of exogenous application of 5-aminolevulinic acid. Acta Agron. Sin. 2022, 48, 478–487. [Google Scholar] [CrossRef] [Scilit]
- Wu, S.H.; Zhang, X.P.; Feng, W.S.; Tian, W.Z.; Yang, H.Q. A new drought-resistant and high-yielding wheat variety ‘Luohan 22’ nationally approved. J. Triticeae Crops 2020, 40, 1023. (In Chinese) [Google Scholar]
- Yang, C.; Du, S.M.; Shi, Y.H.; Zhang, D.Q.; Yue, J.Q.; Li, X.D.; Jin, H.Y.; Fang, B.T.; Wei, F.; Zhang, Z.S.; et al. Differential Sensitivity of Photosynthetic Electron Transport to Dark-Induced Senescence in Wheat Flag Leaves. BMC Plant Biol. 2025, 25, 650. [Google Scholar] [CrossRef] [Scilit] [PubMed]
- Yang, C.; Liu, M.H.; Du, S.M.; Zhang, D.Q.; Li, X.D.; Wu, L.T.; Shi, Y.H.; Fang, B.T.; Yan, G.; Wei, F. Photosynthetic Electron Transport in Winter Wheat: Responses to Low-Temperature and Weak-Light Condition. Cells 2025, 14, 1275. [Google Scholar] [CrossRef] [Scilit] [PubMed]
- Wang, R.J.; Qin, X.X.; Pan, H.B.; Li, D.Y.; Xiao, X.; Jin, Y.K.; Wang, Y.; Liang, H.Z. Assessing the effects of drought stress on photosynthetic performance and physiological resistance in camphor seedling leaves. PLoS ONE 2025, 20, e0313316. [Google Scholar] [CrossRef] [Scilit]
- Silvestre, S.; Araújo, S.D.; Patto, M.C.V.; da Silva, J.M. Performance index: An expeditious tool to screen for improved drought resistance in the Lathyrus genus. J. Integr. Plant Biol. 2014, 56, 610–621. [Google Scholar] [CrossRef] [Scilit] [PubMed]
- Barboricová, M.; Filacek, A.; Vysoká, D.M.; Gasparovic, K.; Zivcák, M.; Bresti, M. Sensitivity of fast chlorophyll fluorescence parameters to combined heat and drought stress in wheat genotypes. Plant Soil Environ. 2022, 68, 309–316. [Google Scholar] [CrossRef] [Scilit]
- Kou, X.; Han, W.; Kang, J. Responses of root system architecture to water stress at multiple levels: A meta-analysis of trials under controlled conditions. Front. Plant Sci. 2022, 13, 1085409. [Google Scholar] [CrossRef] [Scilit] [PubMed]

Disclaimer/Publisher’s Note: The statements, opinions and data contained in all publications are solely those of the individual author(s) and contributor(s) and not of MDPI and/or the editor(s). MDPI and/or the editor(s) disclaim responsibility for any injury to people or property resulting from any ideas, methods, instructions or products referred to in the content. |
© 2026 by the authors. Licensee MDPI, Basel, Switzerland. This article is an open access article distributed under the terms and conditions of the Creative Commons Attribution (CC BY) license.