


Abstract
Accurate mapping of tea plantations in fragmented, mountainous landscapes faces challenges from spectral confusion, cloud-induced data gaps, and limited model transferability. To address these issues, this study proposes a data-driven approach leveraging 64-dimensional Google AlphaEarth Foundations (AEF) satellite embeddings as core predictive features, integrated with Sentinel-2 spectral, textural, and topographic variables. Prior to feature optimization, comparative experiments confirmed that Random Forest outperformed Gradient Boosting Trees, Classification and Regression Trees, and Support Vector Machines in stability and accuracy, serving as the core classifier. Leveraging a robust sampling strategy, this study evaluated 12 classification scenarios. Results showed that the AEF-augmented scenario achieved the best performance in Rizhao (Overall Accuracy 92.69%, Kappa 0.90), with a high Producer’s Accuracy of 97.47% that effectively minimized omission errors. SHapley Additive exPlanations (SHAP) analysis revealed the model’s physically interpretable logic: utilizing embeddings as “exclusion filters” to separate tea from non-target classes by encoding latent phenological patterns, while relying on original spectral bands to capture canopy biological signals. Crucially, the model demonstrated exceptional generalizability when transferred to the unseen Qingdao region without retraining. This study validates AEF embeddings as a robust, scalable feature representation for regional crop monitoring in label-scarce and heterogeneous environments, offering a transferable data foundation for precise agricultural inventory and sustainable development planning.
1. Introduction
Tea is an important economic crop in China, and its national production accounts for more than half of the world’s total output in 2023. By 2024, the total area of tea plantations in China had grown to over 34,000 km2, representing a 320% increase in the last 24 years. The timely and accurate extraction of tea plantation distribution is of great significance for analyzing and adjusting the tea industry structure, protecting cropland, and promoting sustainable development. Given that tea plantations are often fragmented, widely distributed, and predominantly located in mountainous areas, traditional survey methods based on field measurements are prohibitively labor-intensive and costly, thus suffering from numerous limitations [1]. In contrast, remote sensing (RS) technology, with its advantages of being macroscopic, real-time, fast, covering a wide monitoring range, and enabling continuous dynamic monitoring, has been widely applied in studies on land cover classification and crop extraction [2].
In recent years, classification algorithms represented by RF [3], Support Vector Machine (SVM) [4], and Deep Neural Networks (DNN) [5] have been gradually used for tea plantation extraction. Among them, RF, as a commonly used machine learning (ML) classification algorithm, is widely applied in tea plantation classification due to its high accuracy, strong robustness, and suitability for high-dimensional data and large datasets [1,2,6,7,8]. Optical imagery, particularly from sources like Sentinel-2, is widely used in crop extraction due to its high spatial and temporal resolution [9]. However, data gaps and classification errors caused by uneven spatiotemporal coverage (cloud cover) of time-series satellite data are significant challenges for agricultural monitoring based on optical polar-orbiting satellites [10,11]. Furthermore, these data gaps, combined with the inherent spectral confusion (e.g., between tea and other evergreen vegetation) and topographic shadows in mountainous areas, mean that spectral datasets are often insufficient and unreliable for accurate classification.
To address the challenges of data inconsistency and missing information in traditional RS, the Google DeepMind team proposed the AlphaEarth Foundations (AEF) satellite embedding dataset in 2025 for large-scale and multi-year mapping applications [12]. The value of this embedded representation lies in its encoding of multi-dimensional information crucial for downstream tasks like crop classification, such as crop phenology representing growth cycles, climate features affecting growth, and even soil characteristics reflecting ground conditions [13]. More importantly, the introduction of this dataset fundamentally changes the RS analysis workflow. This dataset is intrinsically pre-processed and analysis-ready. Unlike raw imagery that demands rigorous correction pipelines, AEF embeddings are generated to be robust against atmospheric noise and sensor artifacts. This characteristic provides a stable, correction-independent feature foundation, which—when complemented by standard surface reflectance products—can significantly enhance classification robustness without requiring additional complex preprocessing for the deep learning components. Consequently, it mitigates common issues inherent in raw imagery—such as cloud contamination and sensor artifacts—enabling direct application in downstream tasks [14]. It is also naturally compatible with shallow classifiers like RF/SVM and can participate directly in classification as features. Thus, the AEF embedded feature dataset provides a novel and efficient solution for high-precision tea plantation extraction.
The necessity for such an advanced dataset stems from the inherent complexities of tea plantation mapping. As an evergreen crop, tea is easily confused with other vegetation like shrubs, croplands, and small orchards, which can present similar spectral or textural features. However, its distinct annual growth rhythm (e.g., spring-summer growth, picking, and pruning) differs from other crops and thus provides a key opportunity for phenological-based distinction. Existing research shows that combining spectral and texture features can effectively distinguish shrubs and orchards [15], while pixel-based phenological methods can leverage spectral differences from various pruning periods to enhance recognition [16]. Furthermore, some studies have successfully used NDVI/EVI time-series to extract specific tea species, while others have employed indices like the Normalized Difference Tillage Index (NDTI). NDTI is sensitive to tillage/stubble cover, helping to differentiate active cropland from the evergreen tea canopy [17,18]. In addition, topographic factors such as elevation, slope, and aspect are closely related to tea plantation distribution [19]. Consequently, effective tea classification has traditionally required a multi-dimensional feature approach, integrating phenology, texture, spectral indices, and terrain to achieve sufficient accuracy.
Building on this multi-feature concept, the introduction of the AEF satellite embedded dataset offers a more advanced solution. It can provide robust annual and seasonal encoding for key phenological events (e.g., “pruning—flushing—picking”) and complement traditional spectral, texture, and phenological features, thereby enhancing classification accuracy and efficiency. This embedded data is particularly well-suited for addressing common challenges in crop classification, such as inconsistent temporal features (due to observation constraints), high feature redundancy, and insufficient cross-year generalization capabilities. Despite these advancements, a significant gap exists in the literature. Furthermore, current studies on tea extraction predominantly focus on the Southwest, South China, and Jiangnan (South of the Yangtze River) tea regions. In contrast, the Jiangbei (North of the Yangtze River) tea region, represented by Rizhao, has received relatively insufficient attention [4]. This geographic gap is critical, as the unique planting methods and growth rhythms of the Jiangbei tea region, influenced by its distinct regional environment, may render classification models trained on southern regions ineffective.
Therefore, to address the challenges of spectral confusion and data discontinuity in heterogeneous landscapes, this paper introduces a multi-source fusion strategy that augments traditional optical and phenological features with 64-dimensional AEF satellite embeddings. First, this study identified the optimal base classifier through a comparative analysis of mainstream machine learning algorithms (RF, SVM, GTB, and CART). Subsequently, through a comprehensive evaluation of 12 distinct feature scenarios, this study isolated the critical role of satellite embeddings in enhancing classification accuracy. Furthermore, SHAP (Shapley Additive exPlanations) analysis was employed to interpret the underlying decision mechanism and reveal the synergy between embeddings and phenology. Finally, applying the optimal scenario, this study successfully mapped the 2023 distribution of tea plantations in Rizhao and validated the model’s strong transferability in the independent test area of Qingdao. This work provides not only a local case study but also a validated, interpretable, and transferable pathway for dynamic crop monitoring in regions facing data gaps or sparse ground labels.
2. Materials and Methods
2.1. Study Area
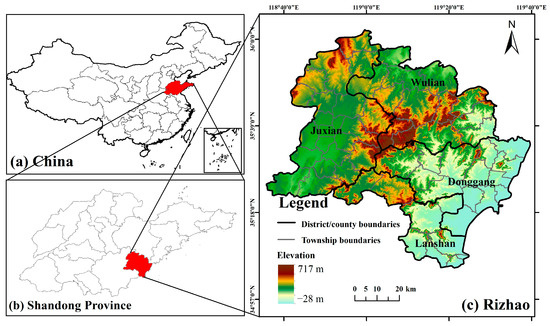
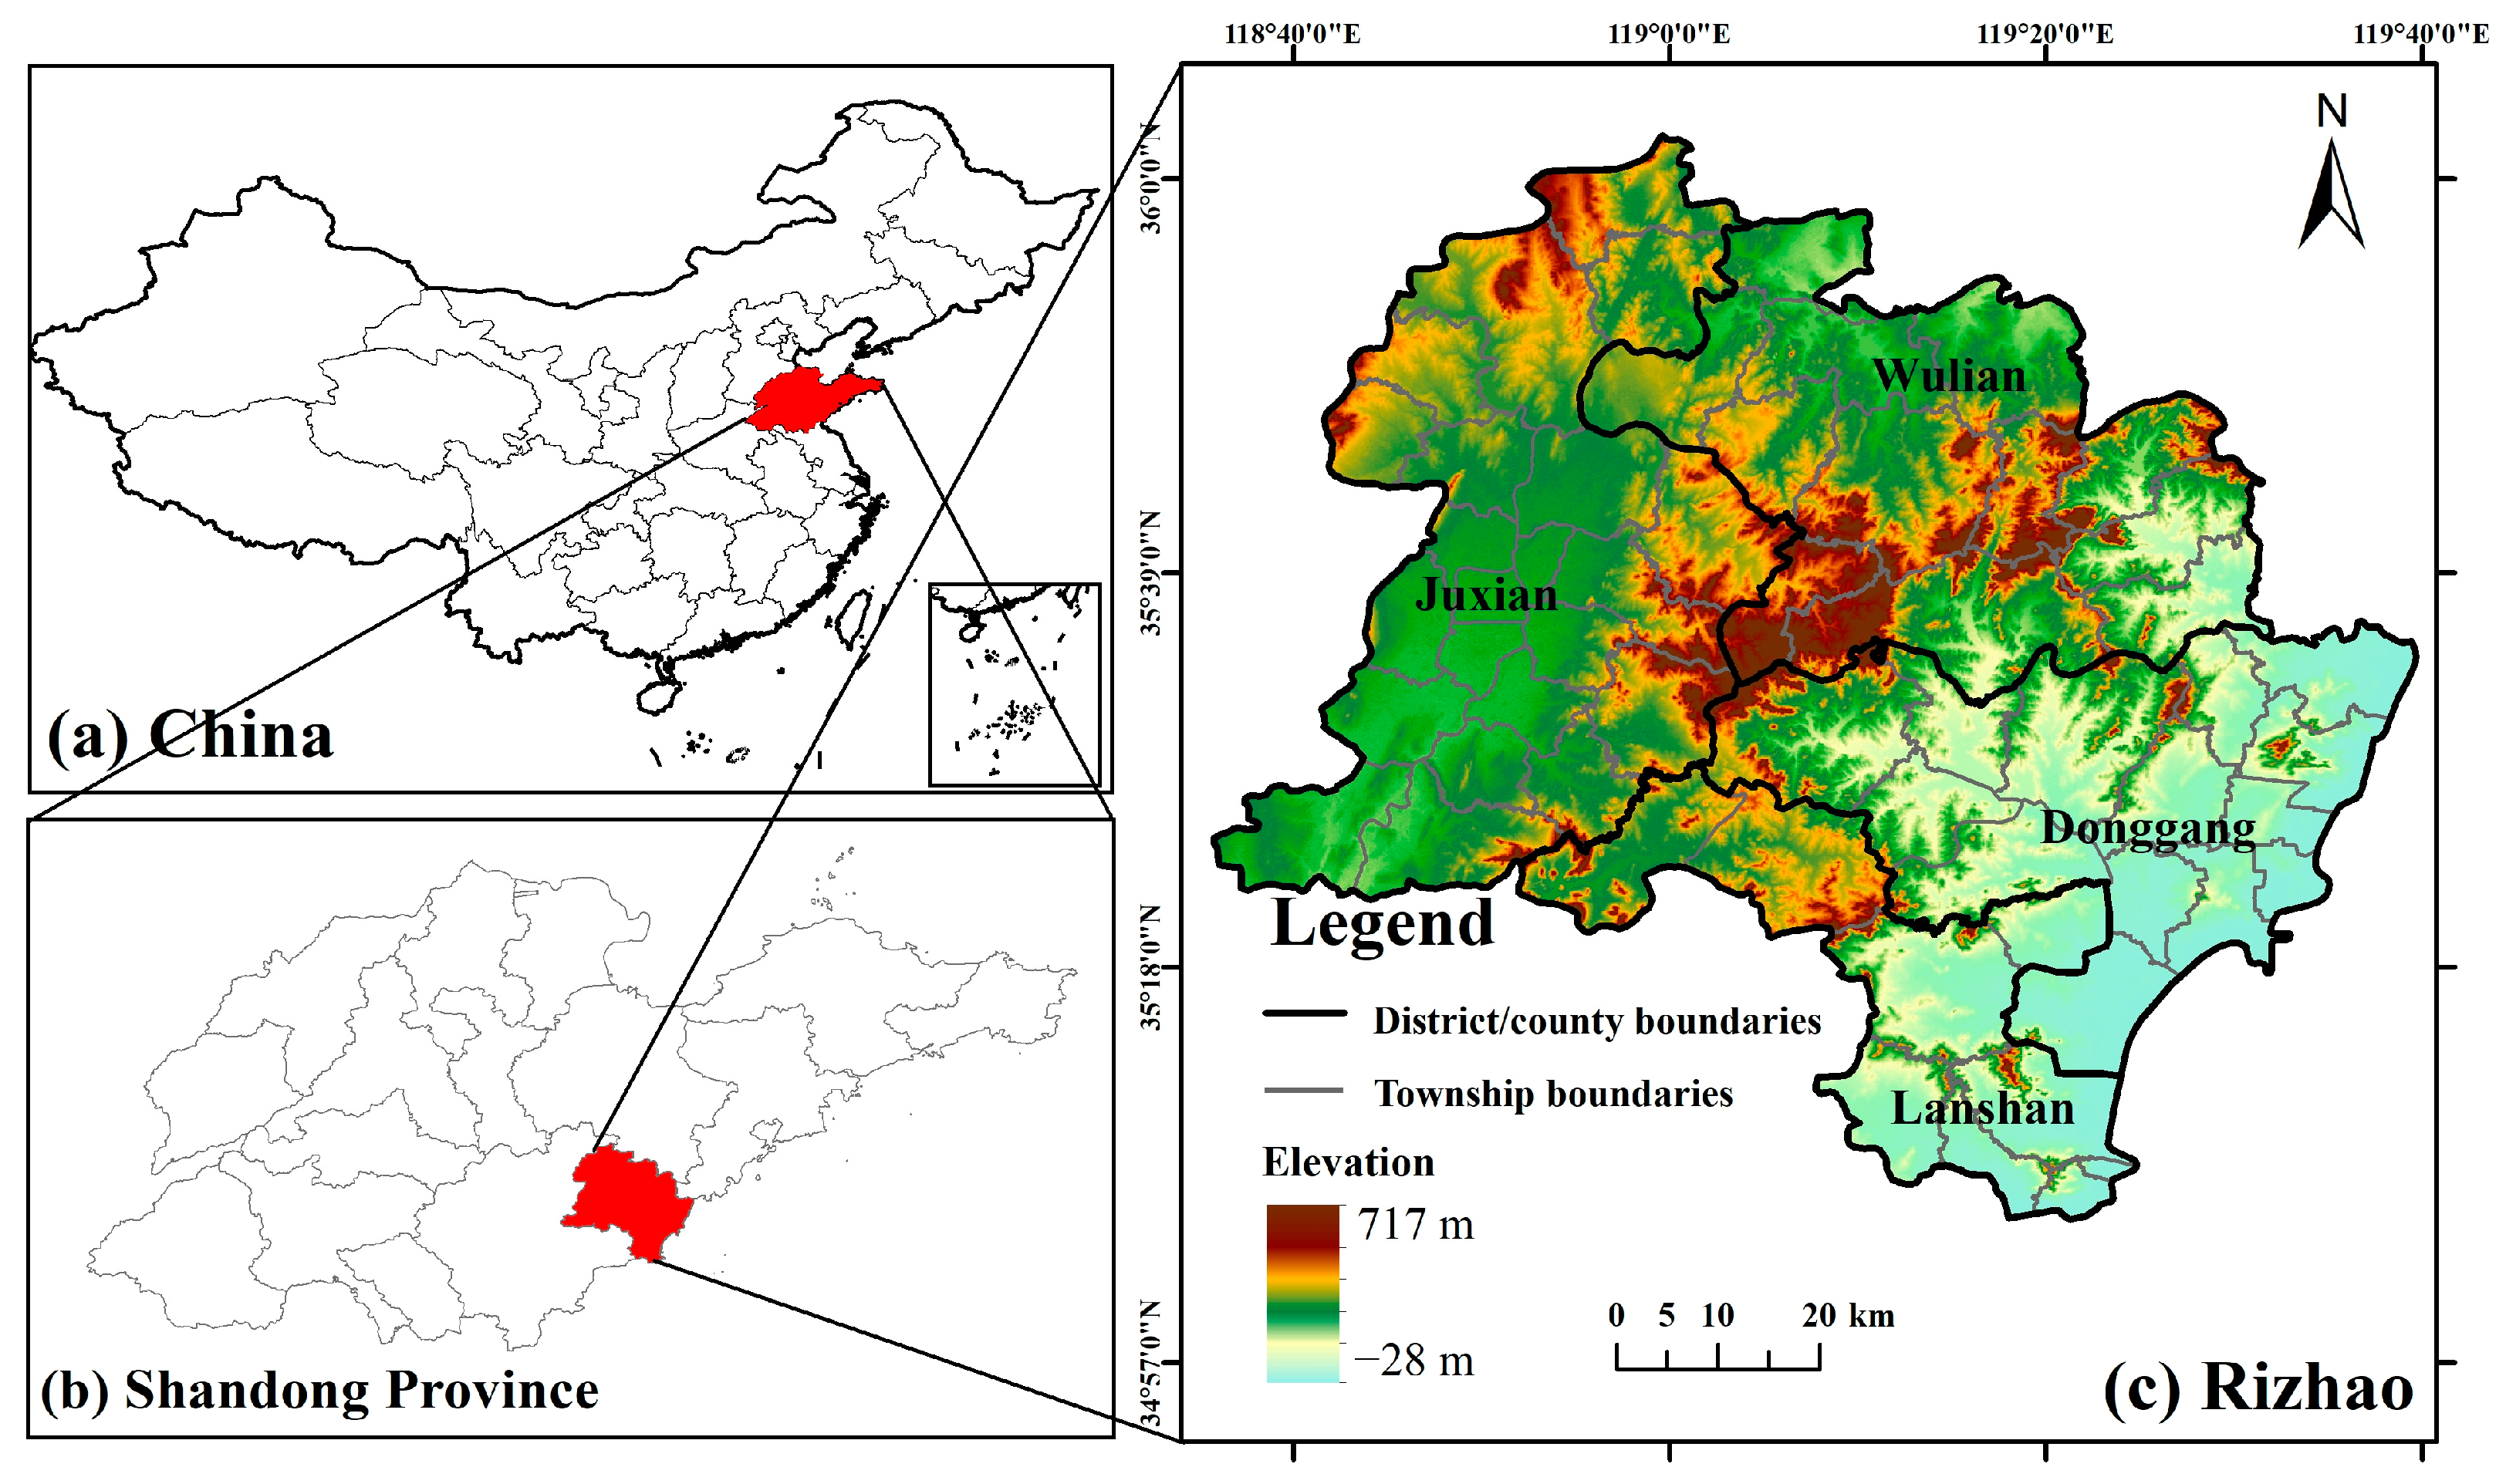
Rizhao (118°25′ E–119°39′ E, 35°04′ N–36°04′ N) is located in the central part of China’s mainland coast and the southeastern part of the Shandong Peninsula, administering Donggang District, Lanshan District, Ju County, and Wulian County [20] (Figure 1). The terrain of Rizhao is high in the center and low on the periphery, with mountains and hills accounting for over 70% of the total area. Influenced significantly by the maritime climate, the city’s average annual precipitation is 870 mm, the average annual temperature is 13 °C, and the frost-free period is over 220 days. Compared to inland areas at the same latitude, the climate is more suitable for tea cultivation. Rizhao belongs to the Jiangbei tea region, the largest tea-producing area in northern China. In 2020, the total tea planting area in Rizhao (including greenhouse tea) was about 200 km2, with an annual output of about 19,800 tons of dry tea and a total output value of about 3.8 billion yuan, making it the largest high-quality tea-producing area in northern China.
Figure 1.
Overview map of the study area: (a) Shandong Province in China; (b) Rizhao in Shandong Province; (c) topography and administrative divisions of Rizhao.
2.2. Data Sources
2.2.1. Sentinel-2 Data
This study utilized the Sentinel-2 Level-2A Surface Reflectance product, accessible via the Google Earth Engine (GEE) platform, as the primary optical data source. The selection of this specific dataset was driven by three critical advantages essential for accurate tea mapping: (1) As a Bottom-of-Atmosphere (BOA) product corrected via the Sen2Cor algorithm, L2A minimizes atmospheric attenuation and aerosol scattering. This ensures physically meaningful spectral values for calculating vegetation indices (e.g., NDVI, RECI) and maintains physical consistency when integrating optical features with the high-level AEF embeddings, thereby minimizing noise in the multi-source feature space [21]. (2) Beyond standard visible bands, Sentinel-2 includes specialized red-edge bands (B5, B6, B7). These bands are highly sensitive to chlorophyll content and canopy structure, providing discriminative power to separate the dense, evergreen canopy of tea plantations from other vegetation types. (3) The 10 m spatial resolution and 5-day revisit cycle are critical for capturing the fragmented spatial patterns of tea gardens in mountainous terrain and constructing dense phenological profiles.
Based on these capabilities, the selection of an optimal image acquisition window was refined according to key phenological differences within the study area. In Rizhao, a northern cultivation zone, tea trees enter an autumn growth and pre-winter nutrient accumulation stage (approximately September–November) [22]. During this time, their canopies remain evergreen, exhibiting a stable spectral response. Conversely, most surrounding annual crops have either been harvested or entered senescence. This senescence is characterized by decreased chlorophyll, reduced near-infrared (NIR) reflection, and a red-edge shift, creating a significant spectral divergence from the evergreen tea plantations. To leverage this high separability, this study defined the temporal window for spectral analysis as 20 October to 15 November [23]. Furthermore, to minimize the impact of cloud cover on extraction accuracy, a two-step data screening process was implemented. First, the image collection was filtered to include only images with a cloud pixel percentage below 10%. Second, the QA60 band was used to mask pixels contaminated by residual cirrus (Bit 10) or opaque clouds (Bit 11), ensuring that only clear pixels (where both bits are 0) were retained for analysis [20].
2.2.2. Satellite Embedding Dataset
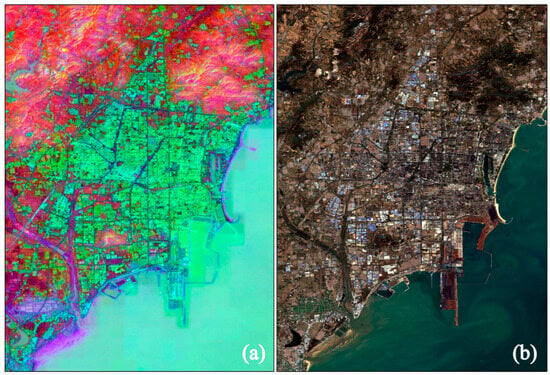
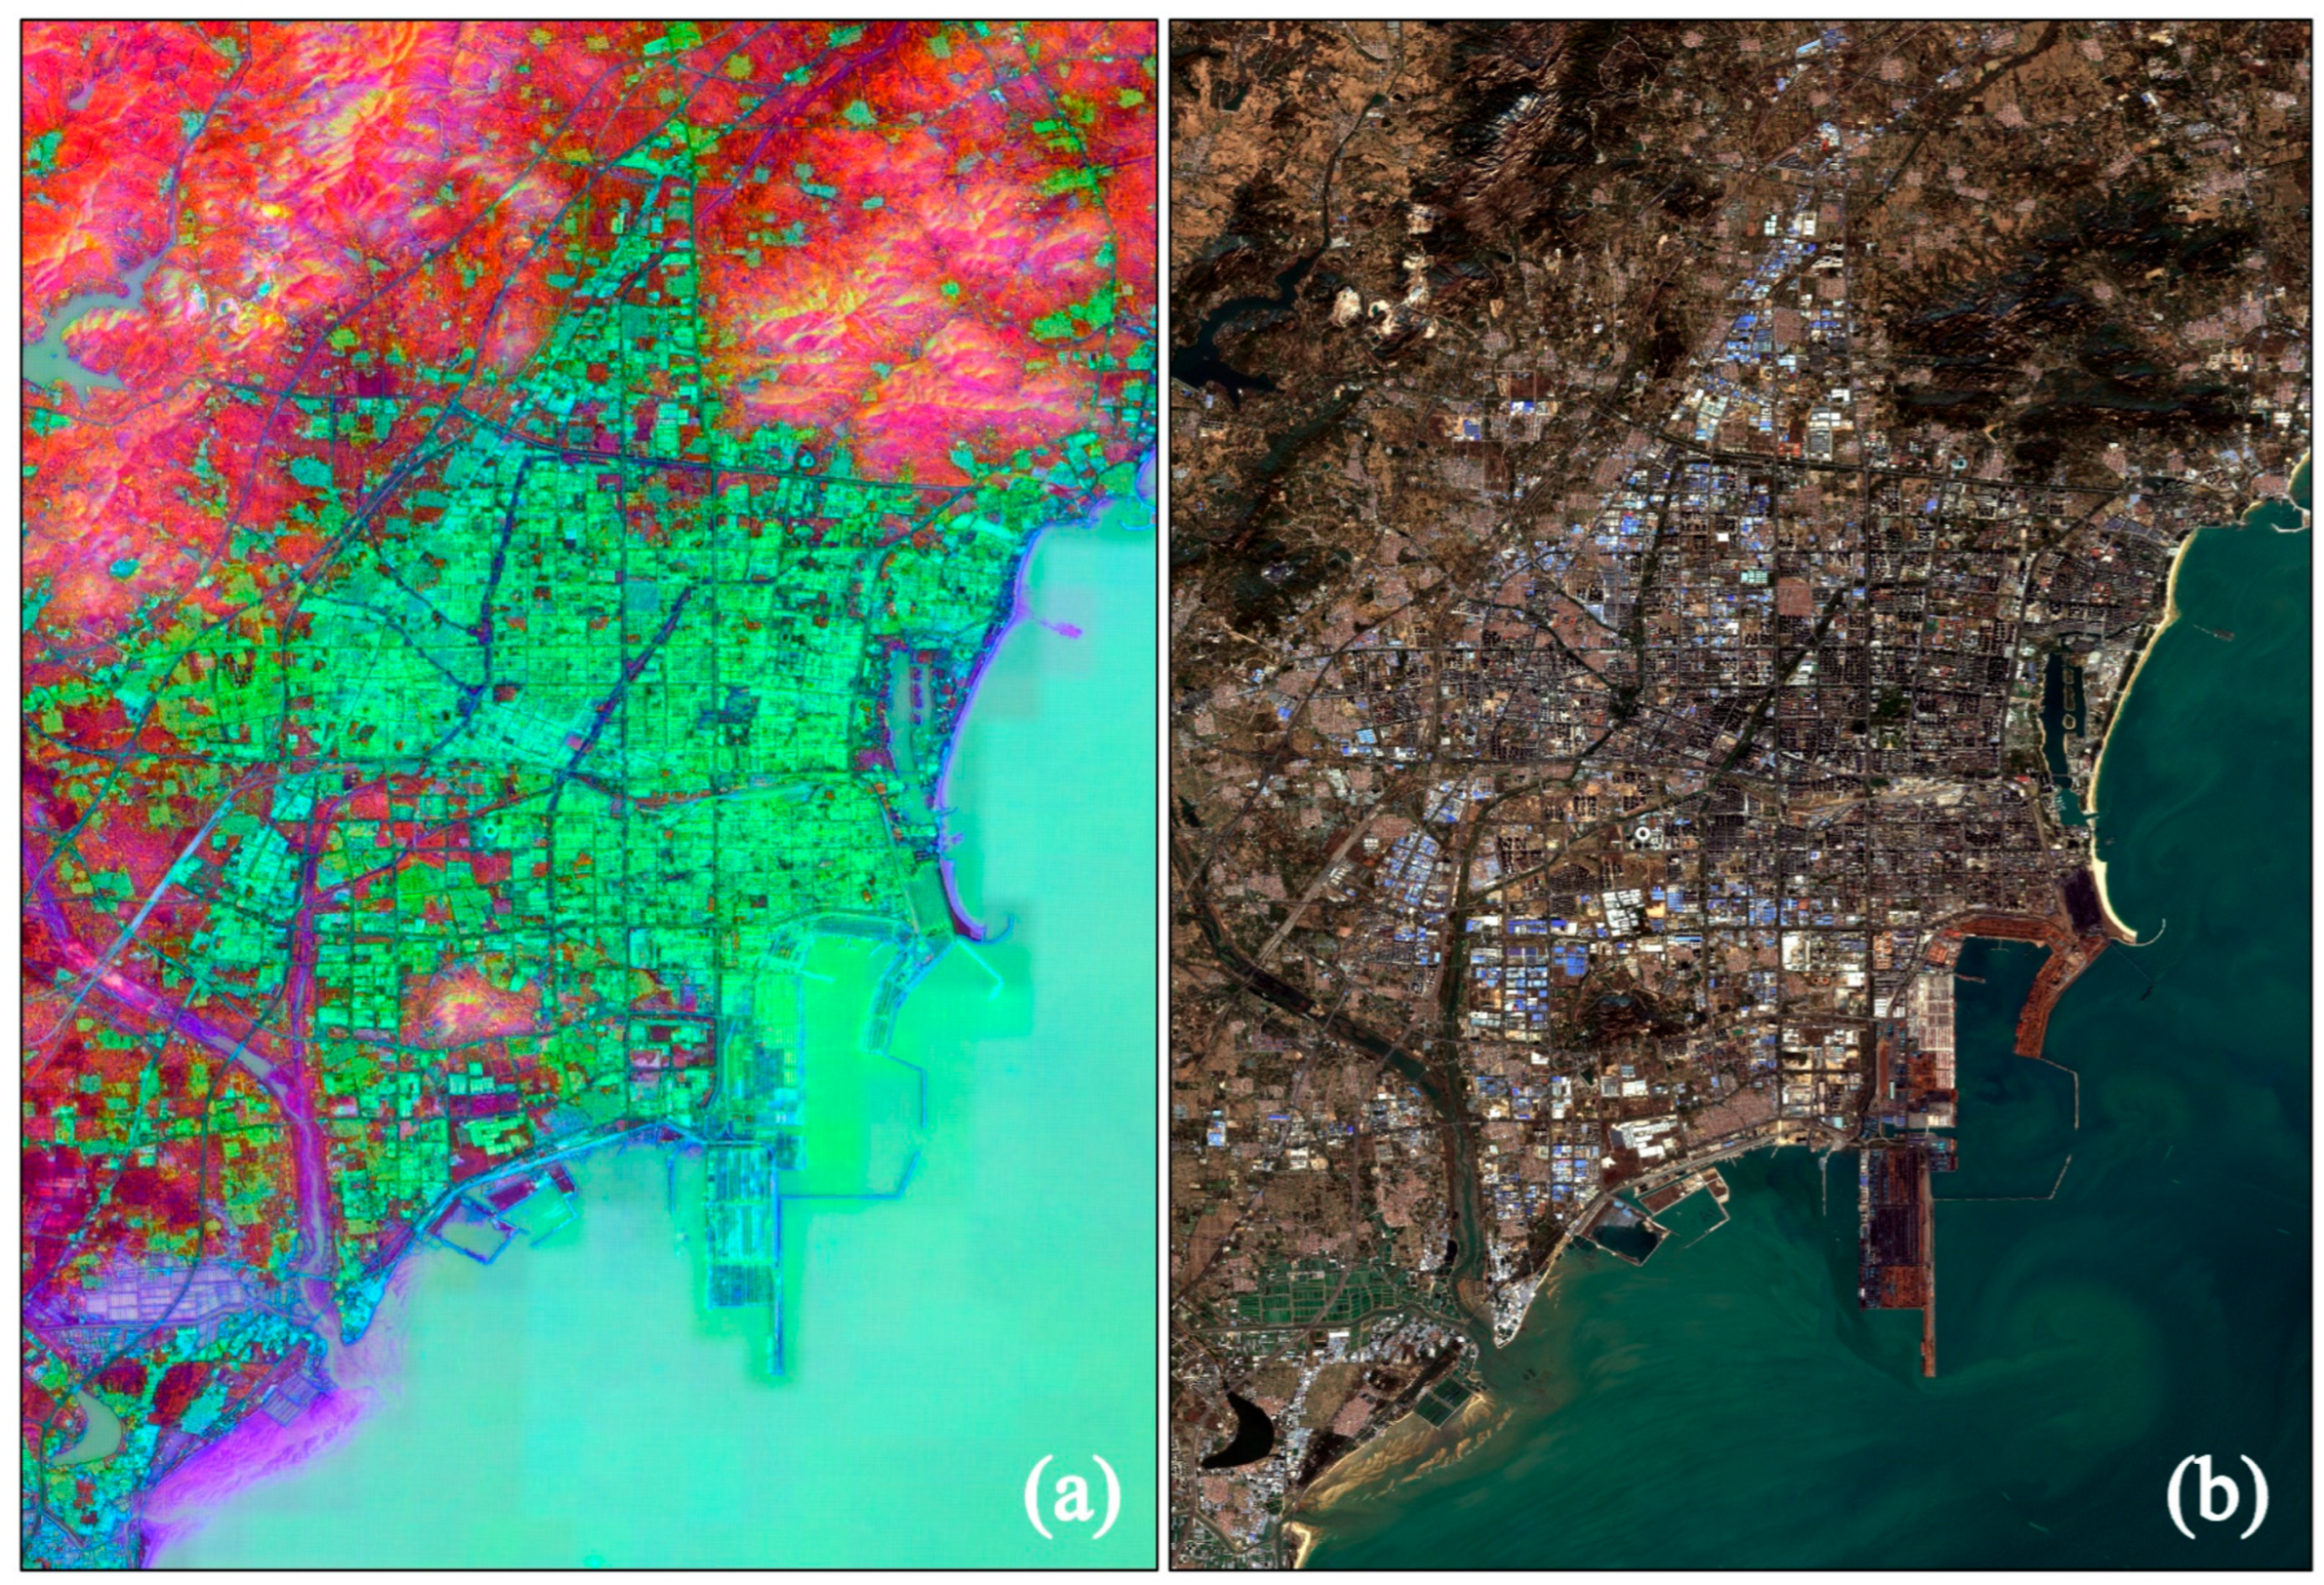
AlphaEarth Foundations is a multimodal geospatial embedding model proposed by Google DeepMind. It fuses multi-source observations including optical, radar, LiDAR, and climate data to generate continuous, spatiotemporally consistent pixel representations, aiming to significantly enhance the efficiency and usability of intelligent remote sensing interpretation [14]. The embedding features themselves do not require user-side preprocessing such as radiometric calibration or atmospheric correction, as they are distributed as analysis-ready vectors capable of being directly ingested into classifiers (Figure 2).
Figure 2.
Comparison of composite images in the study area: (a) False-color composite of Satellite Embedding V1 (R: A01, G: A16, B: A09), where different colors represent distinct multi-source geospatial feature clusters identified by the AlphaEarth foundation model; (b) True-color composite of Sentinel-2 (R: B4, G: B3, B: B2).
This study uses the Satellite Embedding V1 data from the GEE platform. This dataset is released as 64-dimensional annual embeddings, targeting tasks like classification, regression, and change detection. It can be directly used in classification as ‘features as a service’ without complex atmospheric/topographic correction and is more robust to cloud occlusion and observation gaps. Therefore, the embeddings reflect not only spectral information but also integrate spatial context, seasonal changes (such as vegetation phenology, snow cover), and terrain and climate signals, making them particularly suitable for crop type mapping and monitoring. This dataset possesses high accuracy and computational efficiency in key scenarios such as fine-grained crop classification, pollutant distribution prediction, and habitat distribution modelling, serving as a universal solution for global sparse-label mapping [24,25].
2.2.3. Topographic Data
Topography is a fundamental environmental factor affecting the growth and spatial distribution of vegetation. The tea tree, an evergreen crop originating from the warm, humid regions of southern China, has specific site requirements, including high light exposure and excellent soil drainage [26]. The influence of topography on these conditions is multifaceted. Aspect governs the duration and intensity of sunlight, while slope gradient is a primary control on surface runoff and soil water drainage. Furthermore, hillshade, which simulates surface illumination, serves as a proxy for localized climatic conditions and light availability. Therefore, this study integrated a suite of topographic variables as important features for tea plantation extraction. All topographic data—including elevation, slope, aspect, and hillshade—were derived from the Shuttle Radar Topography Mission (SRTM) Digital Elevation Model (DEM) [27].
2.2.4. Sample Data
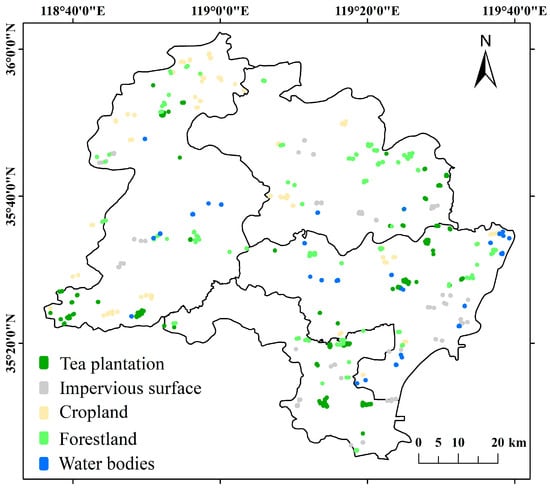
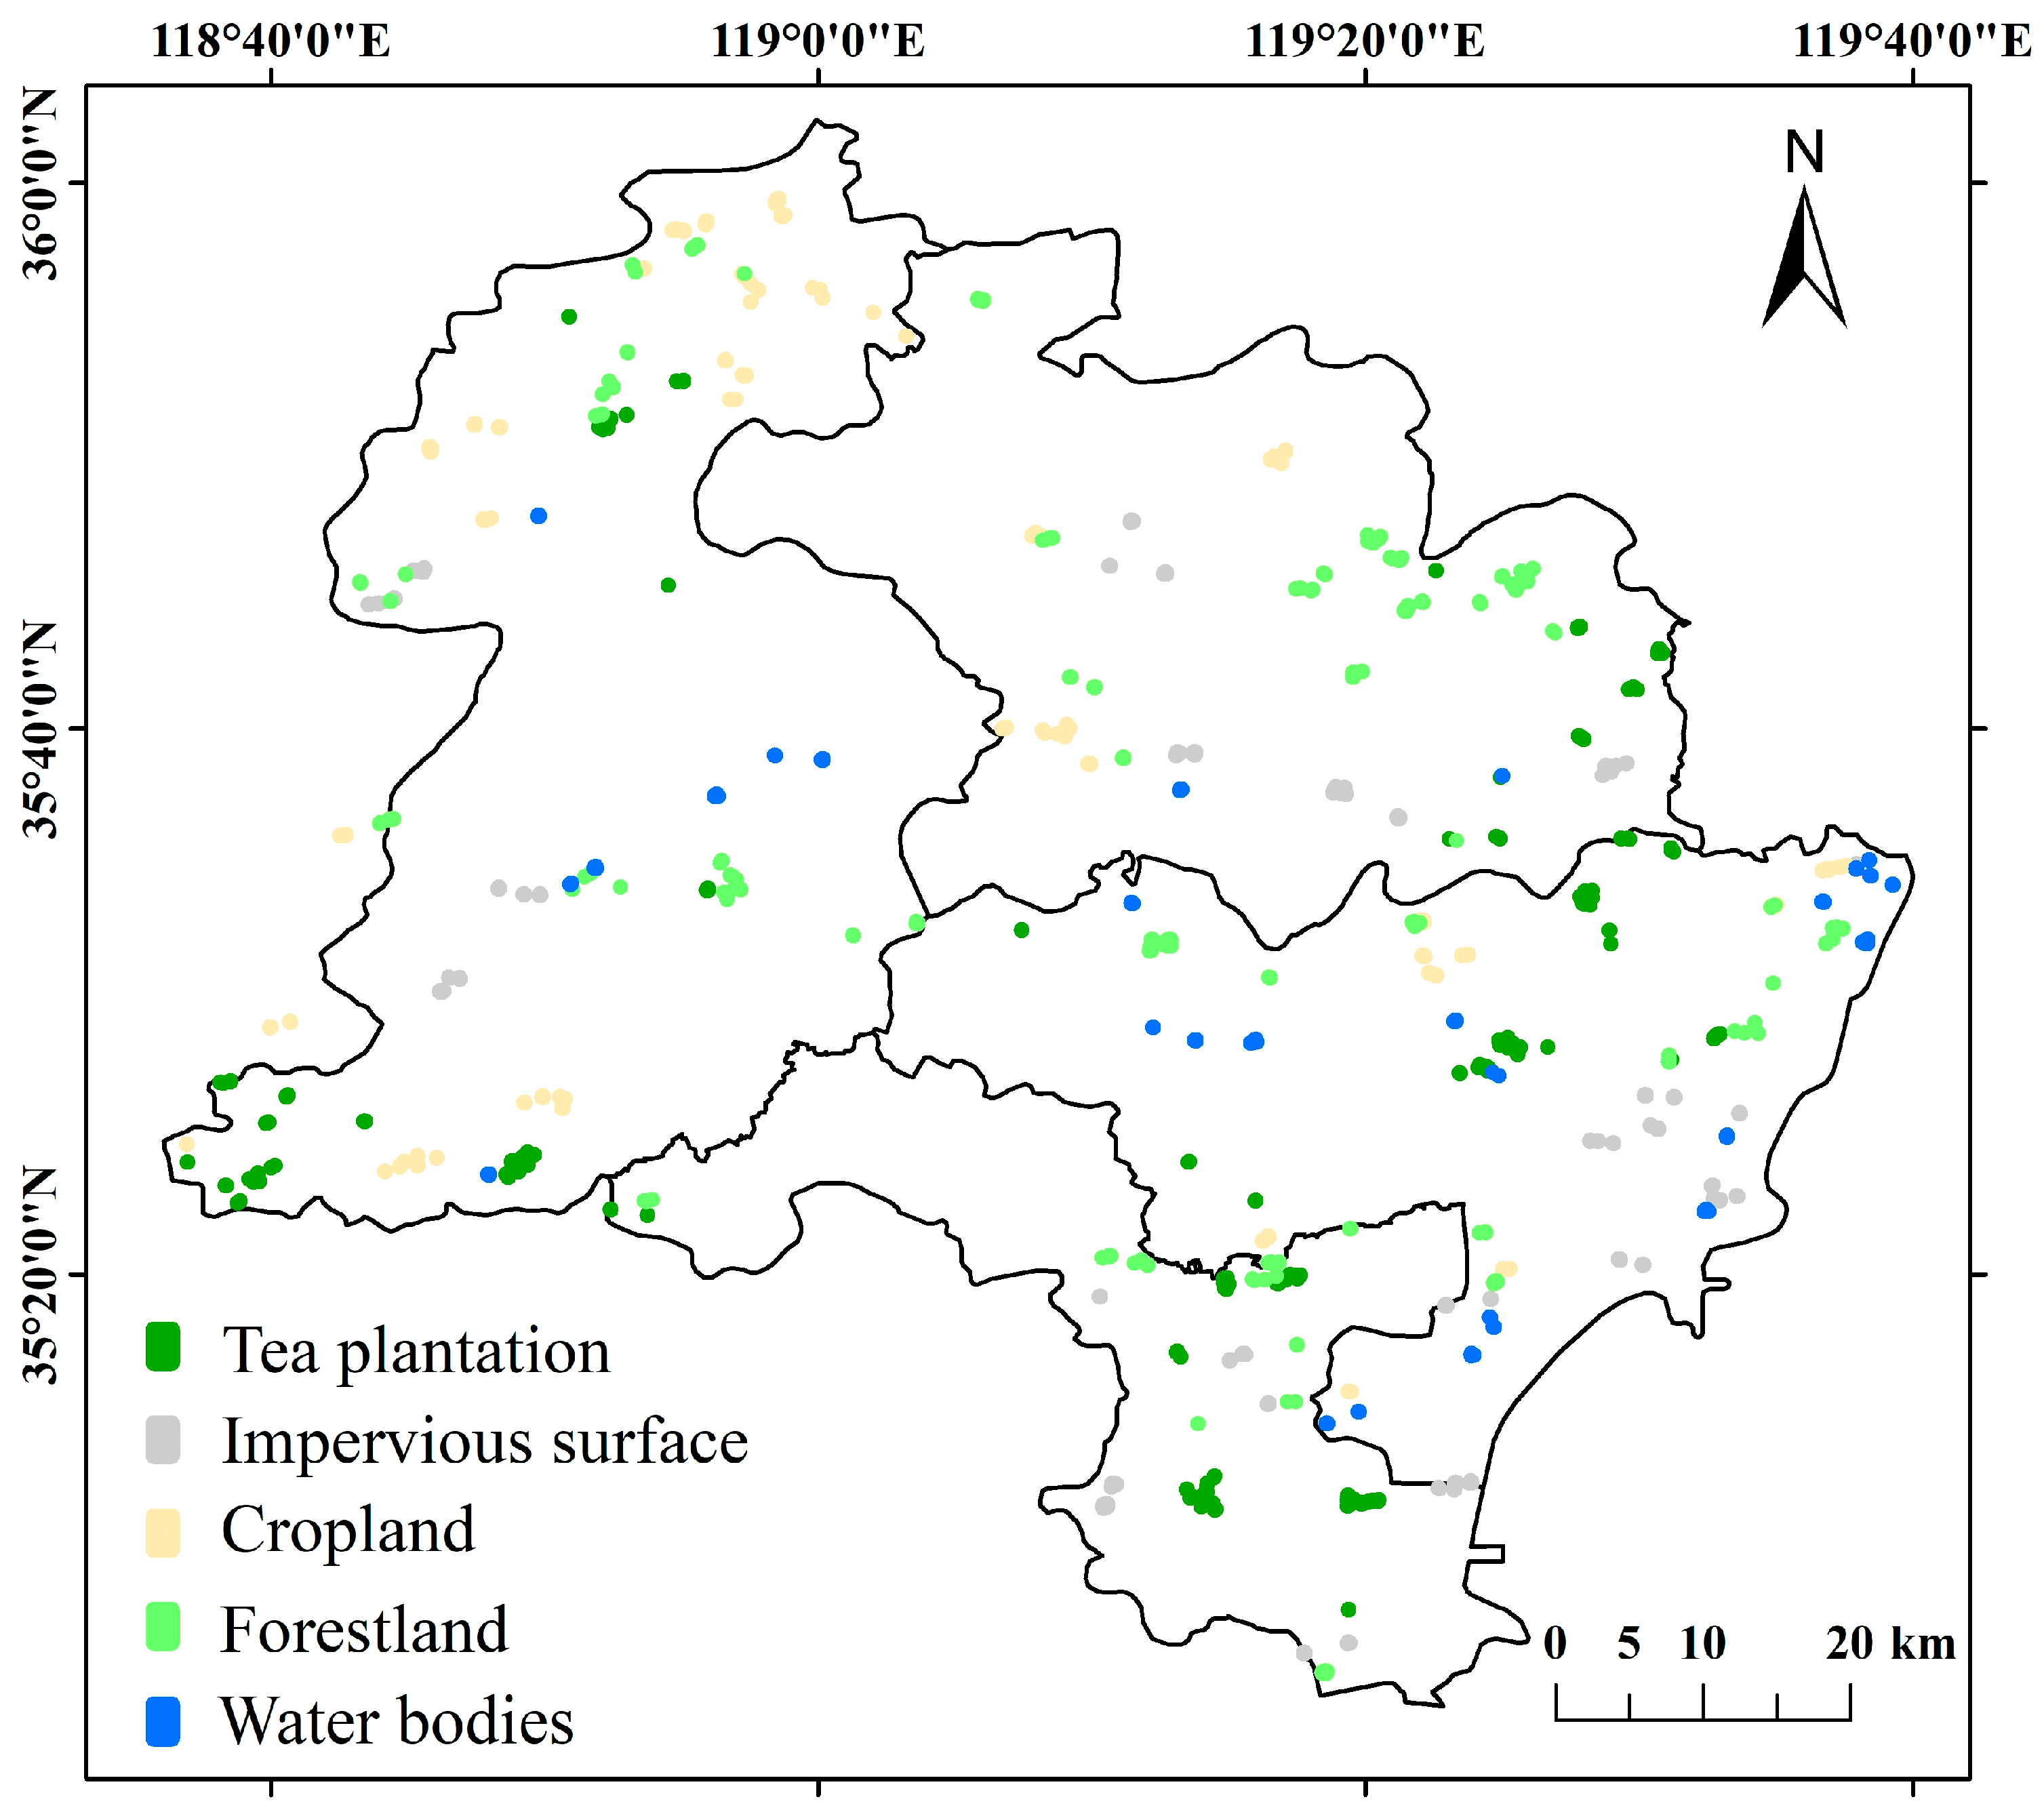
For this study, land cover within the research area was simplified and classified into five primary categories: tea plantations, cropland, forest, impervious surfaces, and water bodies. Drawing on the findings of Xiao et al. regarding sample selection for tea mapping, a moderately imbalanced sample distribution was adopted, as this approach has been shown to enhance extraction accuracy [8]. Therefore, a total sample set of 529 irregular polygon plots was collected. These samples were collected using a method of first applying random point placement and then conducting visual interpretation, supplemented by field sampling. This process used Google high-resolution imagery and the Jilin-1 2023 National Map (https://www.jl1mall.com/) as primary references. The final dataset comprised 211 tea plantation plots, 97 cropland plots, 133 forest plots, 59 impervious surface plots, and 29 water body plots. The spatial distribution of these sample regions is illustrated in Figure 3.
Figure 3.
Spatial distribution of sample points in Rizhao.
2.3. Methodology
2.3.1. Tea Plantation Extraction Workflow
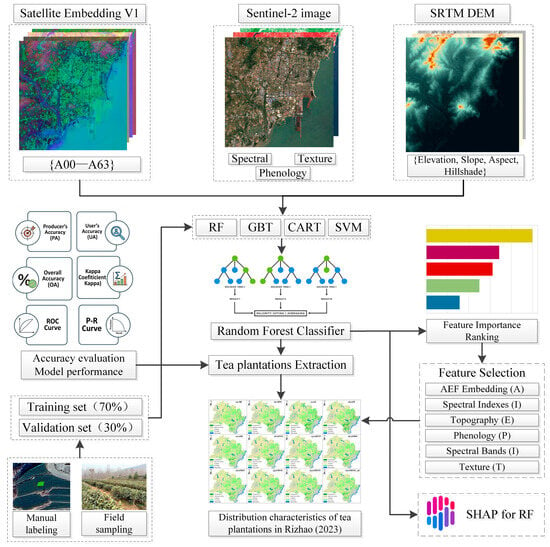
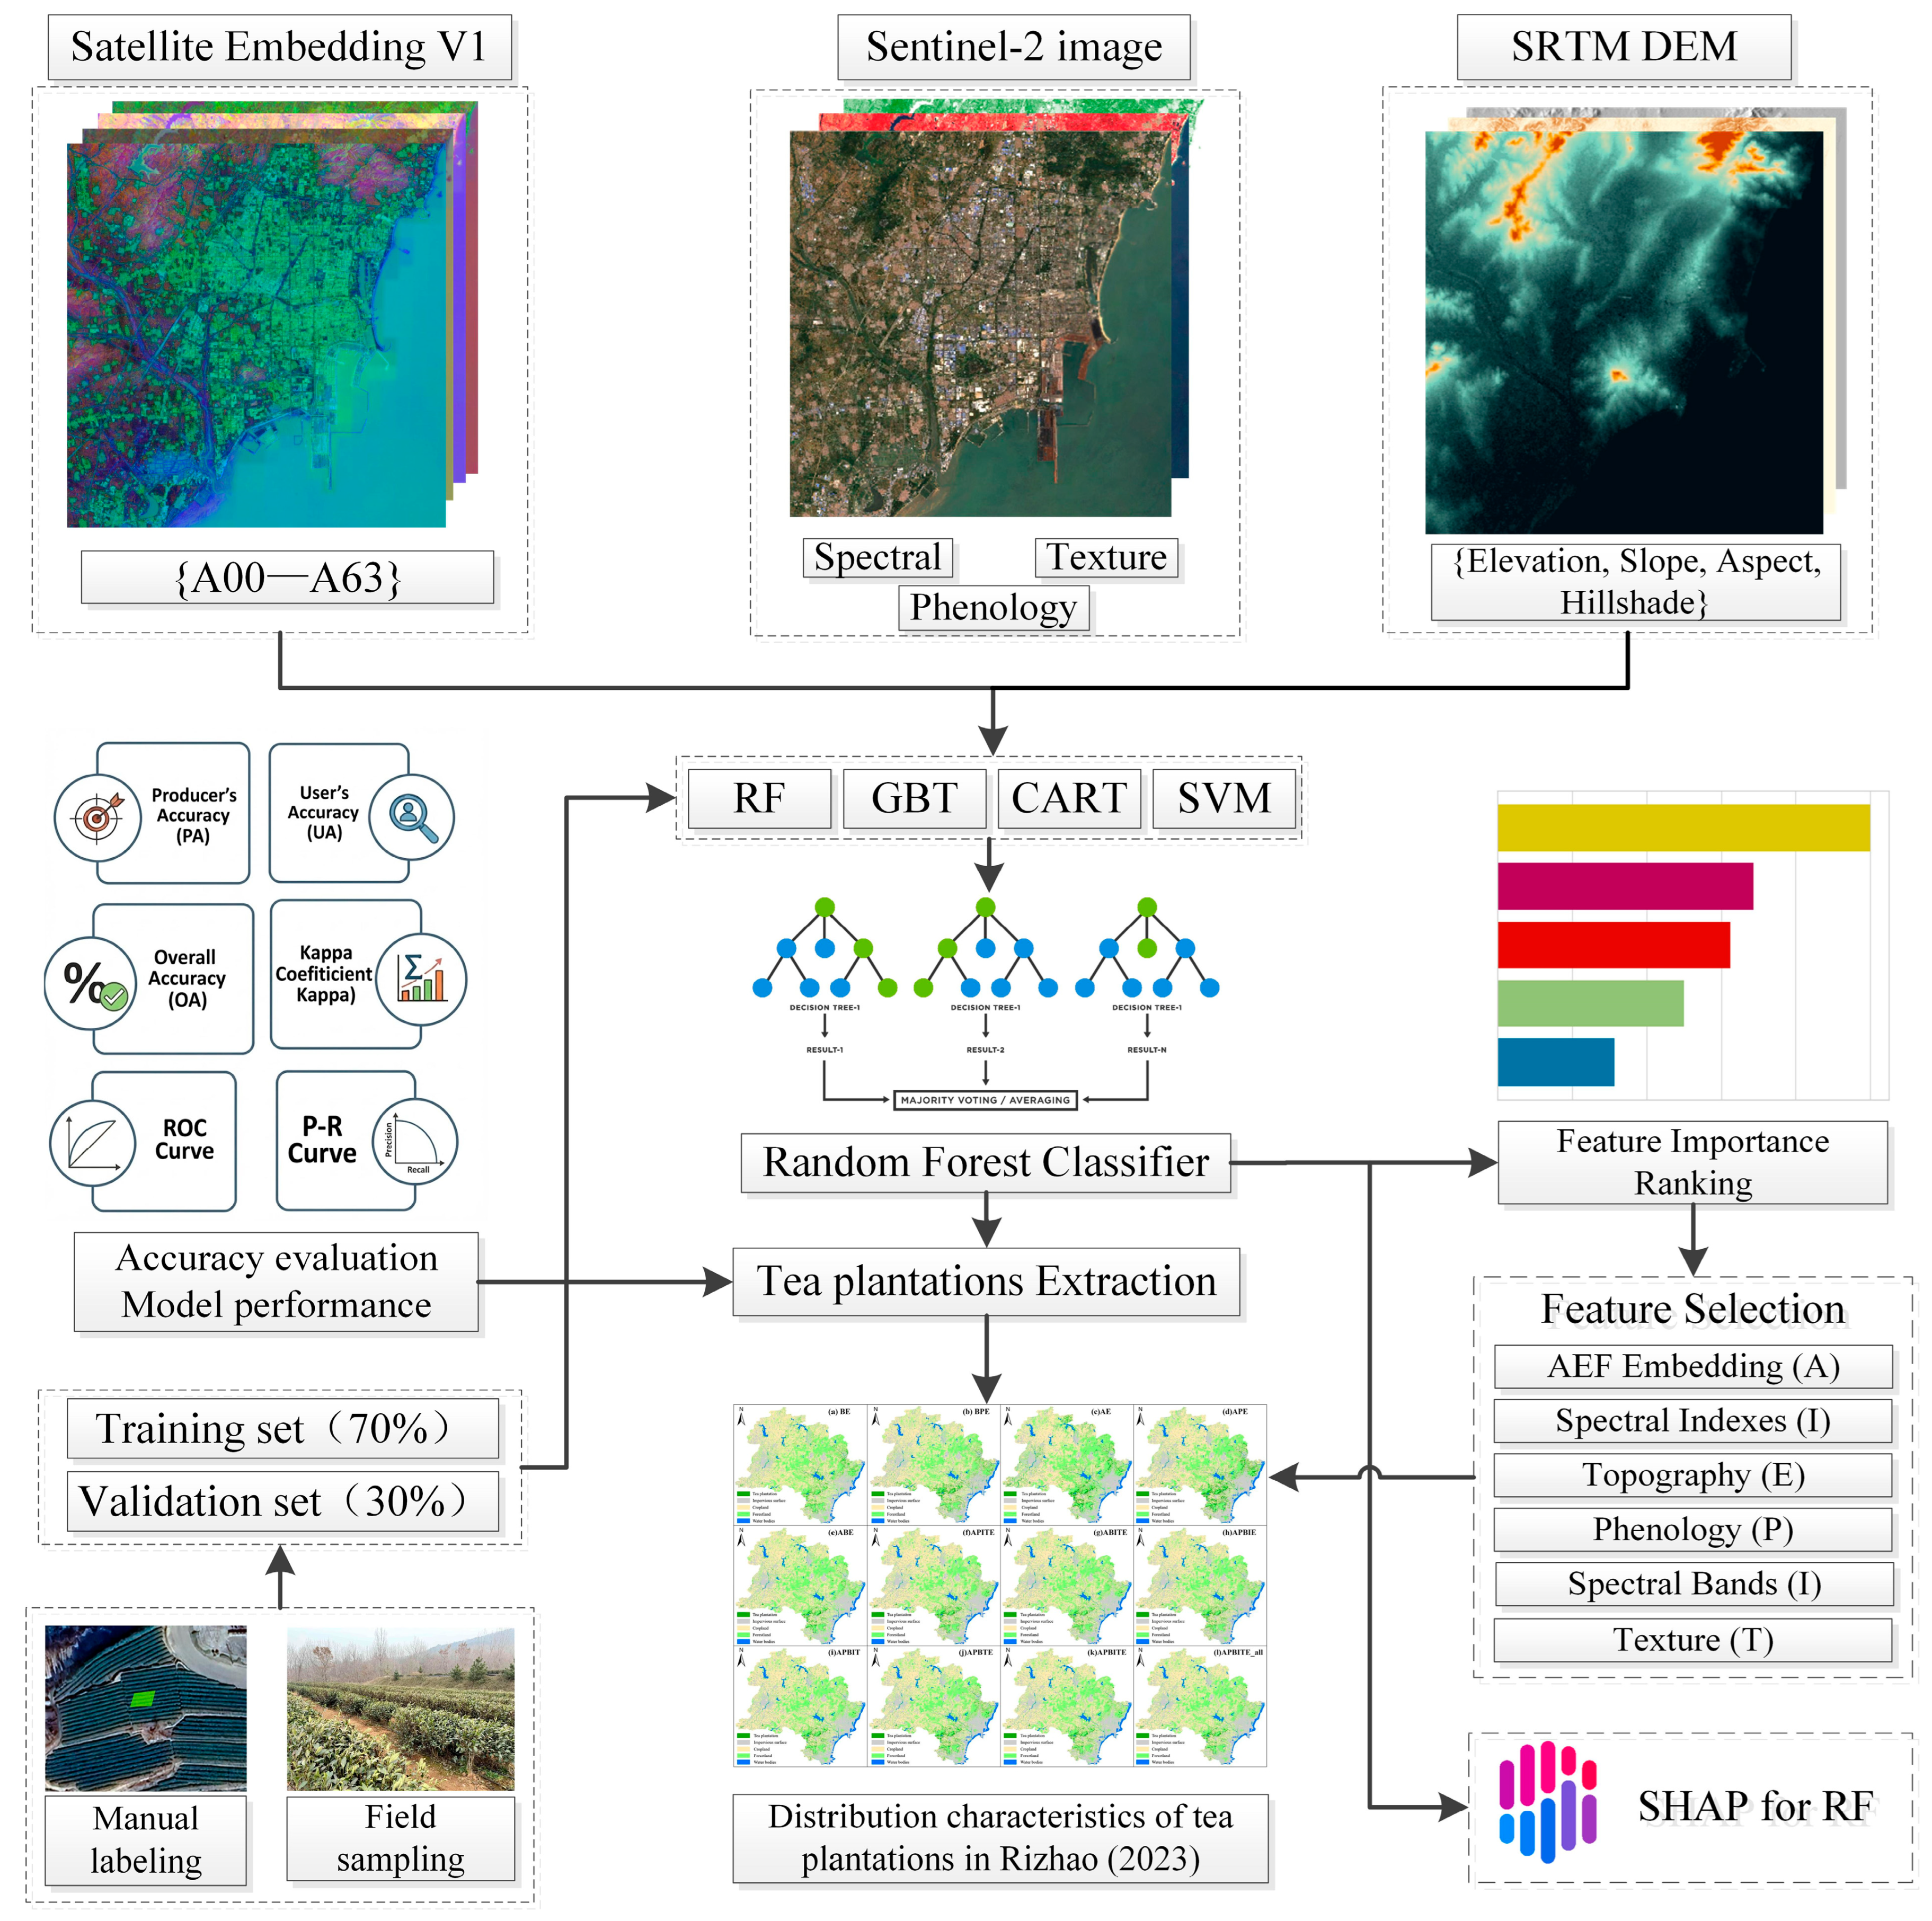
The technical roadmap for extracting tea plantations in Rizhao using multi-source data is shown in Figure 4. First, Satellite Embedding V1, Sentinel-2 MSI, and SRTM DEM data were integrated on the GEE platform to construct a feature space comprising spectral, texture, phenological, topographic, and embedding features. To ensure spatial consistency across the multi-source dataset, the 30 m SRTM DEM and 20 m Sentinel-2 bands were resampled to 10 m using bilinear interpolation within the GEE platform, aligning them pixel-by-pixel with the primary optical bands. Sample points, acquired via visual interpretation and field verification, were divided into training (70%) and validation (30%) sets. RF was selected as the core classifier after a preliminary performance comparison. To determine the optimal feature set, multiple classification scenarios were designed and evaluated using OA, Kappa, and threshold-independent metrics (ROC and P-R curves). Furthermore, the SHAP model interpretability framework was introduced to quantify feature contributions and reveal the underlying physical mechanisms governing tea plantation identification. Based on the comparative results, the optimal scenario was selected to generate the 2023 Rizhao tea plantation distribution map. Finally, the spatial distribution characteristics and area variations across different administrative zones were analyzed.
Figure 4.
Work flowchart for tea plantation extraction.
2.3.2. Classification Features
Classification features are crucial for image classification. Since tea plantations share similar spectral features with shrubs, orchards, and terraces, they are easily confused during classification. Using only the original band features of Sentinel-2 data results in poor accuracy for tea plantation distribution. Therefore, in addition to the AEF satellite embedded features, this study extracted spectral features, texture features, topographic features, and phenological features based on Sentinel-2 data, and added each type of feature as an independent spectral band to the original image for classification.
- Spectral Features
As the B10 band is designed for cirrus detection, mainly observing reflectance at the top of the atmosphere rather than surface reflectance, it is usually used for atmospheric correction. Therefore, this study, based on the preprocessed S2 optical image collection, removed the B10 band and extracted the original 12 bands and 16 spectral indices. Among these, the Normalized Difference Red-Edge Index (NDRE) and the Red-Edge Chlorophyll Index (RECI) were calculated using two different methods. The specific descriptions and formulas are shown in Table S1 in Supplementary Materials. References [28,29,30,31,32,33,34,35,36,37,38,39,40,41] are cited in the Supplementary Materials.
- 2.
- Topographic Features
Topographic factors are known to significantly influence tea cultivation. Therefore, this study incorporated terrain features derived from the SRTM DEM, which has a spatial resolution of 30 m. The processing was executed on the GEE platform. The SRTM DEM dataset was first clipped using the administrative boundaries of Rizhao. Subsequently, three key topographic variables were derived from the clipped DEM: slope, aspect, and hillshade. These terrain features were included as inputs for the analysis.
- 3.
- Texture Features
Remote sensing interpretation reveals that tea plantations possess unique textural properties. This distinction arises from their managed planting structure, which often consists of neat, parallel rows of artificially pruned bushes [42]. These characteristics create a distinctly different texture compared to other land covers like natural forests or cropland. Therefore, texture features were incorporated into the feature set to enhance the model’s ability to distinguish tea plantations.
The Gray-Level Co-occurrence Matrix (GLCM) was employed to quantify these spatial patterns. Using the glcmTexture function in GEE with a 3 × 3 moving window, two sets of texture features were generated. First, 9 GLCM statistics (see Table 1) were calculated from a synthetic gray-level ‘brightness’ composite image to capture the overall geometric structure of the canopy. Second, to leverage the red-edge bands’ sensitivity to chlorophyll and phenological changes, 4 specific metrics (ASM, contrast, IDM, and entropy) were calculated from each of the red-edge bands (B5, B6, and B7).
Table 1.
Computed GLCM texture features.
- 4.
- Phenological Features
As a special economic crop, tea plantations exhibit unique phenological changes throughout their annual growth cycle that distinguish them from other land covers, even those that appear similar at certain times (e.g., shrubs) [23]. Capitalizing on this, our method is built upon extracting multi-temporal phenological features. This study identified four critical time windows within the 2023–2024 period, each chosen to maximize the separability of tea plantations based on key phenological events: Spring (20 February–25 March): Targets the early green-up of tea plantations, a period when most deciduous orchards have not yet leafed out. Summer (20 June–15 August): Selected to occur after the winter wheat harvest, simplifying the distinction between tea and active croplands. Autumn (20 September–30 October): Coincides with the harvest and senescence of major crops (e.g., corn, peanuts), causing a significant drop in cropland greenness while tea plantations remain active. Winter (15 December–10 February): Captures the dormant season, where the evergreen nature of tea contrasts sharply with dormant deciduous forests and harvested croplands.
To quantify vegetation status within these windows, this study employed two complementary indices: the NDVI and the Normalized Difference Water Index (NDWI). While NDVI is a standard measure of vegetation greenness and growth status, it is prone to “saturation” during peak growing seasons, which can reduce its sensitivity to differences between dense canopies. To compensate for this, NDWI was included. NDWI characterizes the vegetation’s moisture content by utilizing the short-wave infrared band [43]. This is less sensitive to atmospheric scattering and, crucially, less prone to saturation than NDVI [44]. The combination of both indices provides a more robust phenological signature, capturing both canopy greenness (NDVI) and canopy moisture/structure (NDWI). This dual-metric approach is essential for accurately tracking the unique profile of evergreen tea plantations against the dynamic changes in surrounding crops and forests. For the analysis, both NDVI and NDWI were calculated for each of the four seasons, resulting in 8 distinct phenological features. These were added as independent bands to the image stack for classification. A total of 124 features were constructed, comprising spectral bands, indices, textures, topographic variables, and embeddings. A detailed summary of all features is provided in Table S2 in Supplementary Materials.
2.3.3. Classification Algorithm and Model Construction
- Classifier Selection and Random Forest Implementation
To ensure the reliability of the classification results, this study first conducted a comparative performance analysis of four mainstream machine learning algorithms: RF, SVM, Gradient Tree Boosting (GTB), and Classification and Regression Trees (CART). Based on the preliminary evaluation (detailed in Section 3.1), the RF algorithm demonstrated superior accuracy and robustness, particularly in handling high-dimensional multi-source data. Consequently, RF was selected as the core classifier for both feature selection and final tea plantation extraction [13]. RF is an ensemble learning method that operates by constructing a multitude of decision trees during training. It employs a bootstrap aggregating (bagging) technique to create sub-sample sets from the training data with replacement. For each node split within a tree, the optimal feature is selected from a random subset of predictor variables. The final classification is determined by a majority vote of all individual trees, which effectively mitigates overfitting and enhances generalization capabilities [45]. In this study, the number of trees (n_trees) hyperparameter was set to 1000 to ensure stable convergence.
- 2.
- Feature Selection and Scenario Design
The samples were labeled into five classes: tea plantation, impervious surface, cropland, forestland, and water bodies. To ensure data quality, a rigorous preprocessing step retained only samples with no missing values across all 124 input features. The unified dataset was then randomly split into a training set (70%) and an independent validation set (30%) using a fixed random seed. To address the high dimensionality and potential redundancy of the feature space, a two-stage feature optimization strategy was adopted. The Gini Importance (Mean Decrease in Impurity) was calculated during the RF training process. This metric quantifies the contribution of each feature (spectral, index, texture, phenology, and satellite embeddings) to the homogeneity of the nodes and leaves. Based on the Gini ranking, this study filtered out redundant variables and identified the most effective feature subset. Guided by the importance ranking, 12 distinct classification scenarios (Scenario a–l) were designed, ranging from basic spectral combinations to comprehensive multi-source fusion sets. This allowed for a systematic assessment of the incremental value of the AlphaEarth embeddings.
- 3.
- Interpretability Analysis using SHAP
While Gini importance provides a global ranking, it lacks directionality and can be biased towards high-cardinality features. To overcome the “black box” nature of machine learning and reveal the underlying physical mechanism of tea plantation identification, this study introduced SHAP analysis. SHAP is a game-theoretic approach that assigns each feature an importance value for a particular prediction [46]. By calculating the marginal contribution of features (e.g., embeddings and phenological indices) to the model output, SHAP allows for the visualization of (1) Global Importance, which provides a robust ranking of feature impact, and (2) Directional Influence, indicating how specific feature values (e.g., high vs. low NDWI) positively or negatively affect the probability of classifying a pixel as a tea plantation. This post hoc analysis was applied to the optimal model to decipher how satellite embeddings interact with phenological traits to distinguish tea from spectrally similar vegetation. The SHAP additive attribution formula is expressed as follows:
where g is the explanation model, z′ is the simplified feature vector, ϕ0 is the model base value (i.e., the average prediction of all features), M is the number of features, and ϕj is the SHAP value of the j-th feature (i.e., its contribution).
2.3.4. Accuracy Assessment
The model’s performance was evaluated using the 30% external validation set. A confusion matrix was generated to diagnose errors, and four standard metrics were calculated: OA, UA, PA, and the Kappa coefficient. The formulas are as follows:
Overall Accuracy (OA):
User’s Accuracy (UA):
Producer’s Accuracy (PA):
Kappa Coefficient (K):
where p is the total number of samples, n is the number of classes, pkk is the number of samples correctly classified for class k, p+k is the number of samples classified as class k (column sum in the confusion matrix), and pk+ is the number of samples whose true class is k (row sum in the confusion matrix).
To further evaluate the model’s discriminative capability and robustness across different decision thresholds, this study employed the Receiver Operating Characteristic (ROC) curve and the Precision-Recall Curve (PRC). The ROC curve plots the True Positive Rate (TPR) against the False Positive Rate (FPR), providing a comprehensive view of the classifier’s performance. The Area Under the ROC Curve (AUC) was calculated to quantify the overall ability of the model to distinguish between tea plantations and non-tea classes, where an AUC value closer to 1 indicates superior performance. The formulas for TPR and FPR are:
Given that tea plantations often occupy a smaller proportion of the study area compared to the background (class imbalance), the Precision-Recall Curve (PRC) was also utilized to provide a more informative assessment of the positive class (tea). The PRC plots Precision against Recall (which is equivalent to TPR). The Area Under the Precision-Recall Curve (AUPRC) serves as a key metric for evaluating the model’s success in correctly identifying tea plantations while minimizing false alarms. The formula for Precision is:
In these equations, TP (True Positive) represents correctly classified tea samples, FP (False Positive) represents non-tea samples incorrectly classified as tea, TN (True Negative) represents correctly classified non-tea samples, and FN (False Negative) represents tea samples incorrectly classified as non-tea.
3. Results
3.1. Model Performance and Feature Importance Analysis
3.1.1. Performance Comparison of Classifiers
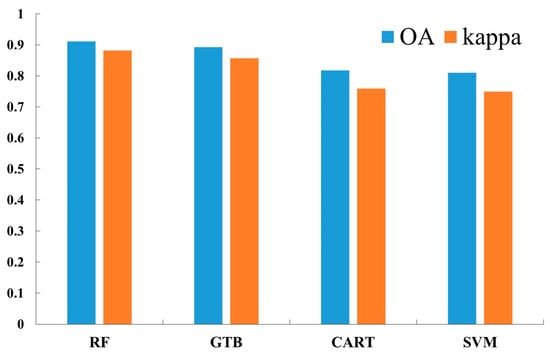
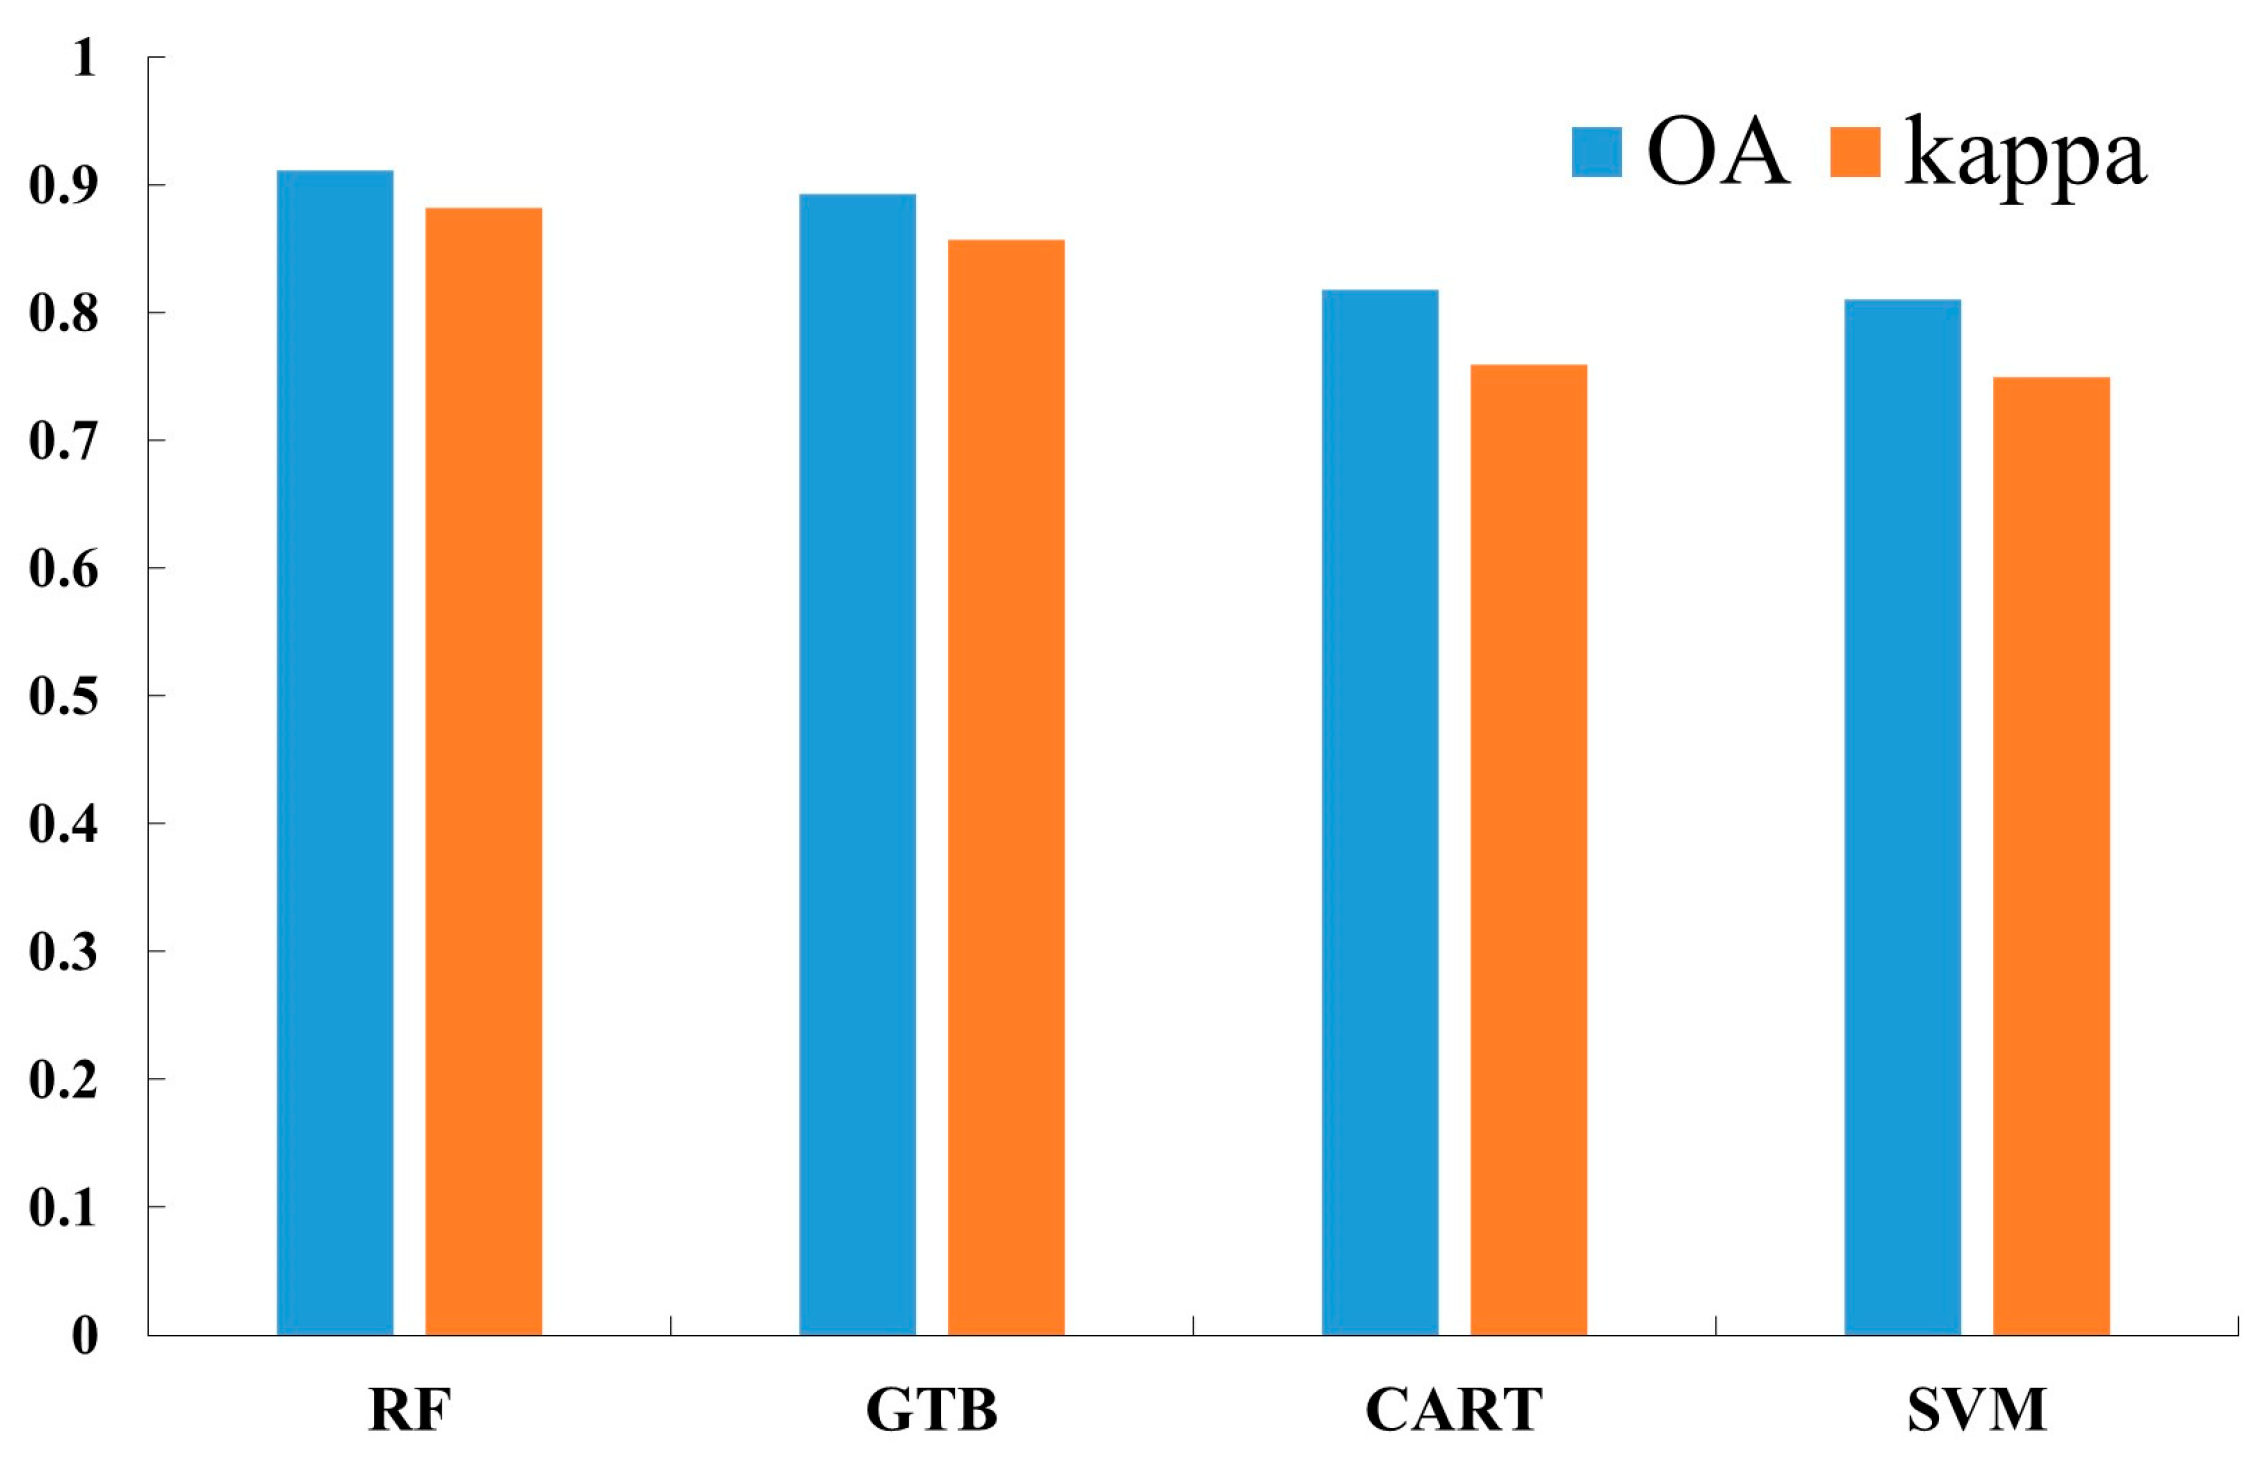
Prior to feature optimization, a comparative experiment was conducted to identify the optimal base classifier for tea plantation extraction. Four mainstream machine learning algorithms—RF, GTB, CART, and SVM—were evaluated using the full feature set. As illustrated in Figure 5, the ensemble learning methods (RF and GTB) significantly outperformed the single decision tree (CART) and SVM. Specifically, the RF model demonstrated the highest classification accuracy and stability, achieving an OA of 91.15% and a Kappa coefficient of 0.8826. The GTB model followed closely with an OA of 89.27% and a Kappa of 0.8575. In contrast, the single decision tree model (CART) and SVM exhibited lower performance, with OAs of approximately 81.79% and 81.05%, respectively. The lower performance of SVM suggests it struggled to effectively partition the high-dimensional, multi-source feature space (particularly with the unnormalized embedding features) compared to the tree-based ensemble methods. Given its superior accuracy and robustness against overfitting, RF was selected as the core classifier for the subsequent feature importance ranking and final mapping tasks.
Figure 5.
Performance comparison of four machine learning classifiers (RF, GTB, CART, and SVM).
3.1.2. Feature Importance Ranking and Physical Mechanism Analysis
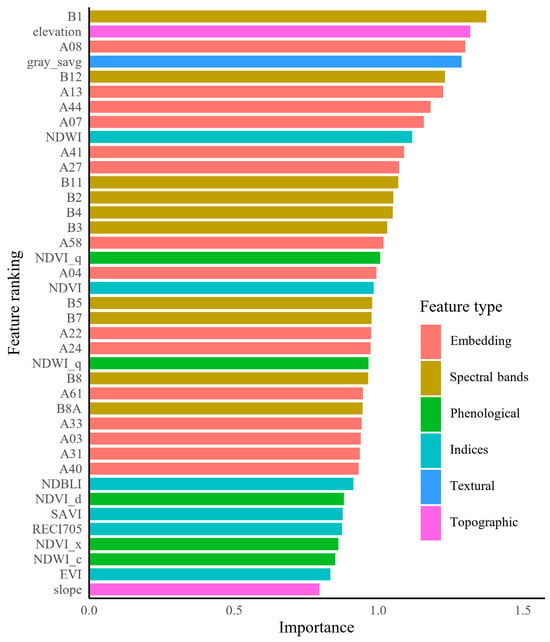
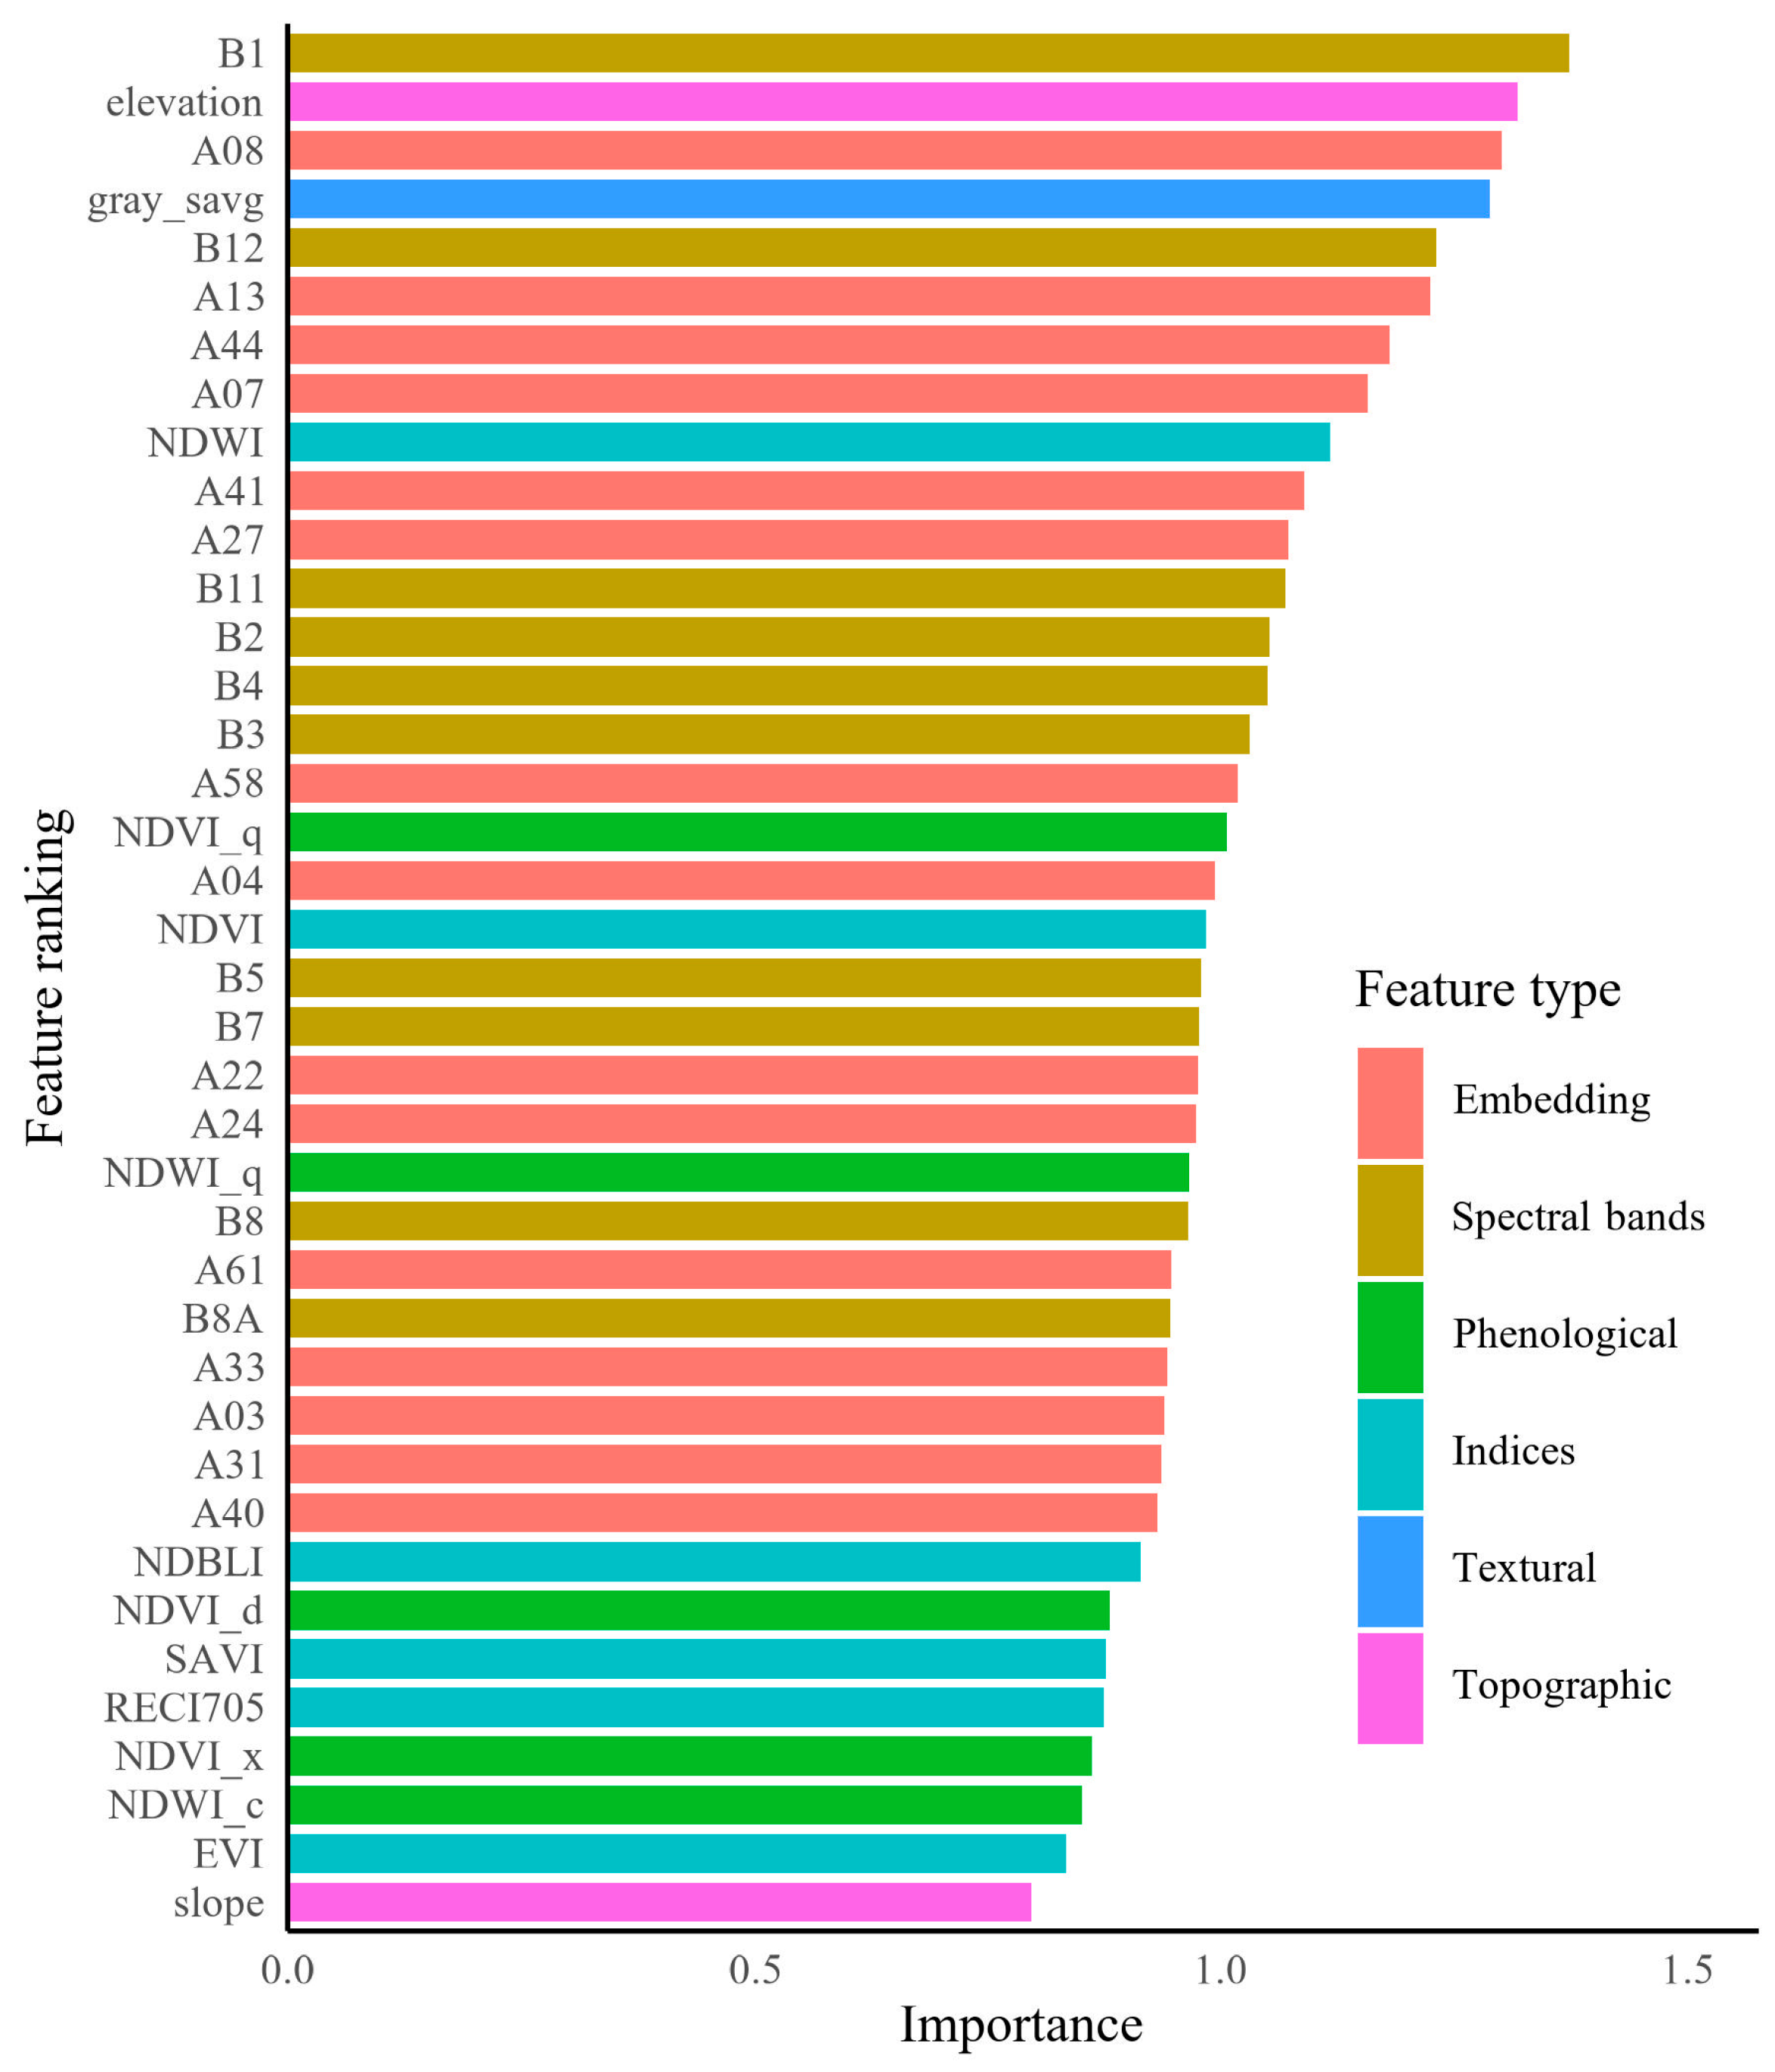
To elucidate the underlying mechanisms of tea plantation identification and reduce data redundancy, this study employed a Gini-based feature importance ranking. From the initial 124-dimensional feature space, a subset of 39 critical features was identified to construct the optimized APBITE scenario (Scenario k in Table 2). As illustrated in Figure 6, this optimized subset relies on a synergy of original spectral bands, satellite embeddings, and topographic variables. The Coastal/Blue band (B1) and SWIR2 band (B12) ranked highest globally. B1 is critical for correcting atmospheric scattering in mountainous terrain, while B12 captures canopy water content differences essential for distinguishing evergreen tea from deciduous vegetation. Elevation (Rank 2) remains a top-tier feature, reflecting the strict spatial constraint of Rizhao tea cultivation in hilly terrain (50–200 m).
Table 2.
Summary of feature combinations in different classification scenarios.
Figure 6.
Importance ranking of the 39 optimized features selected for the APBITE scenario.
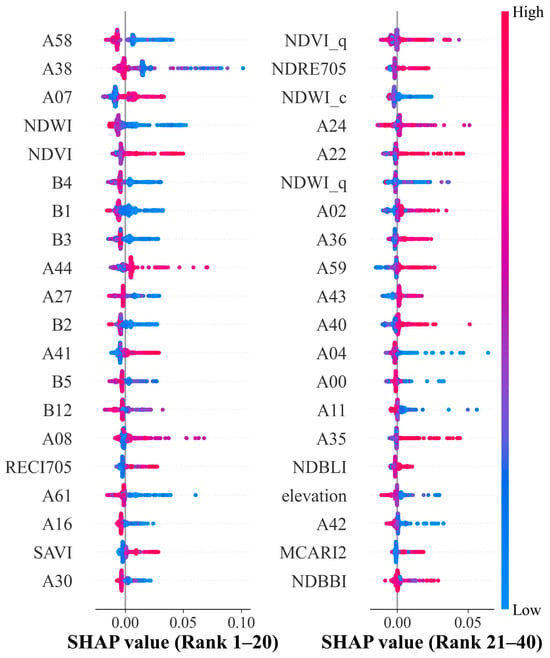
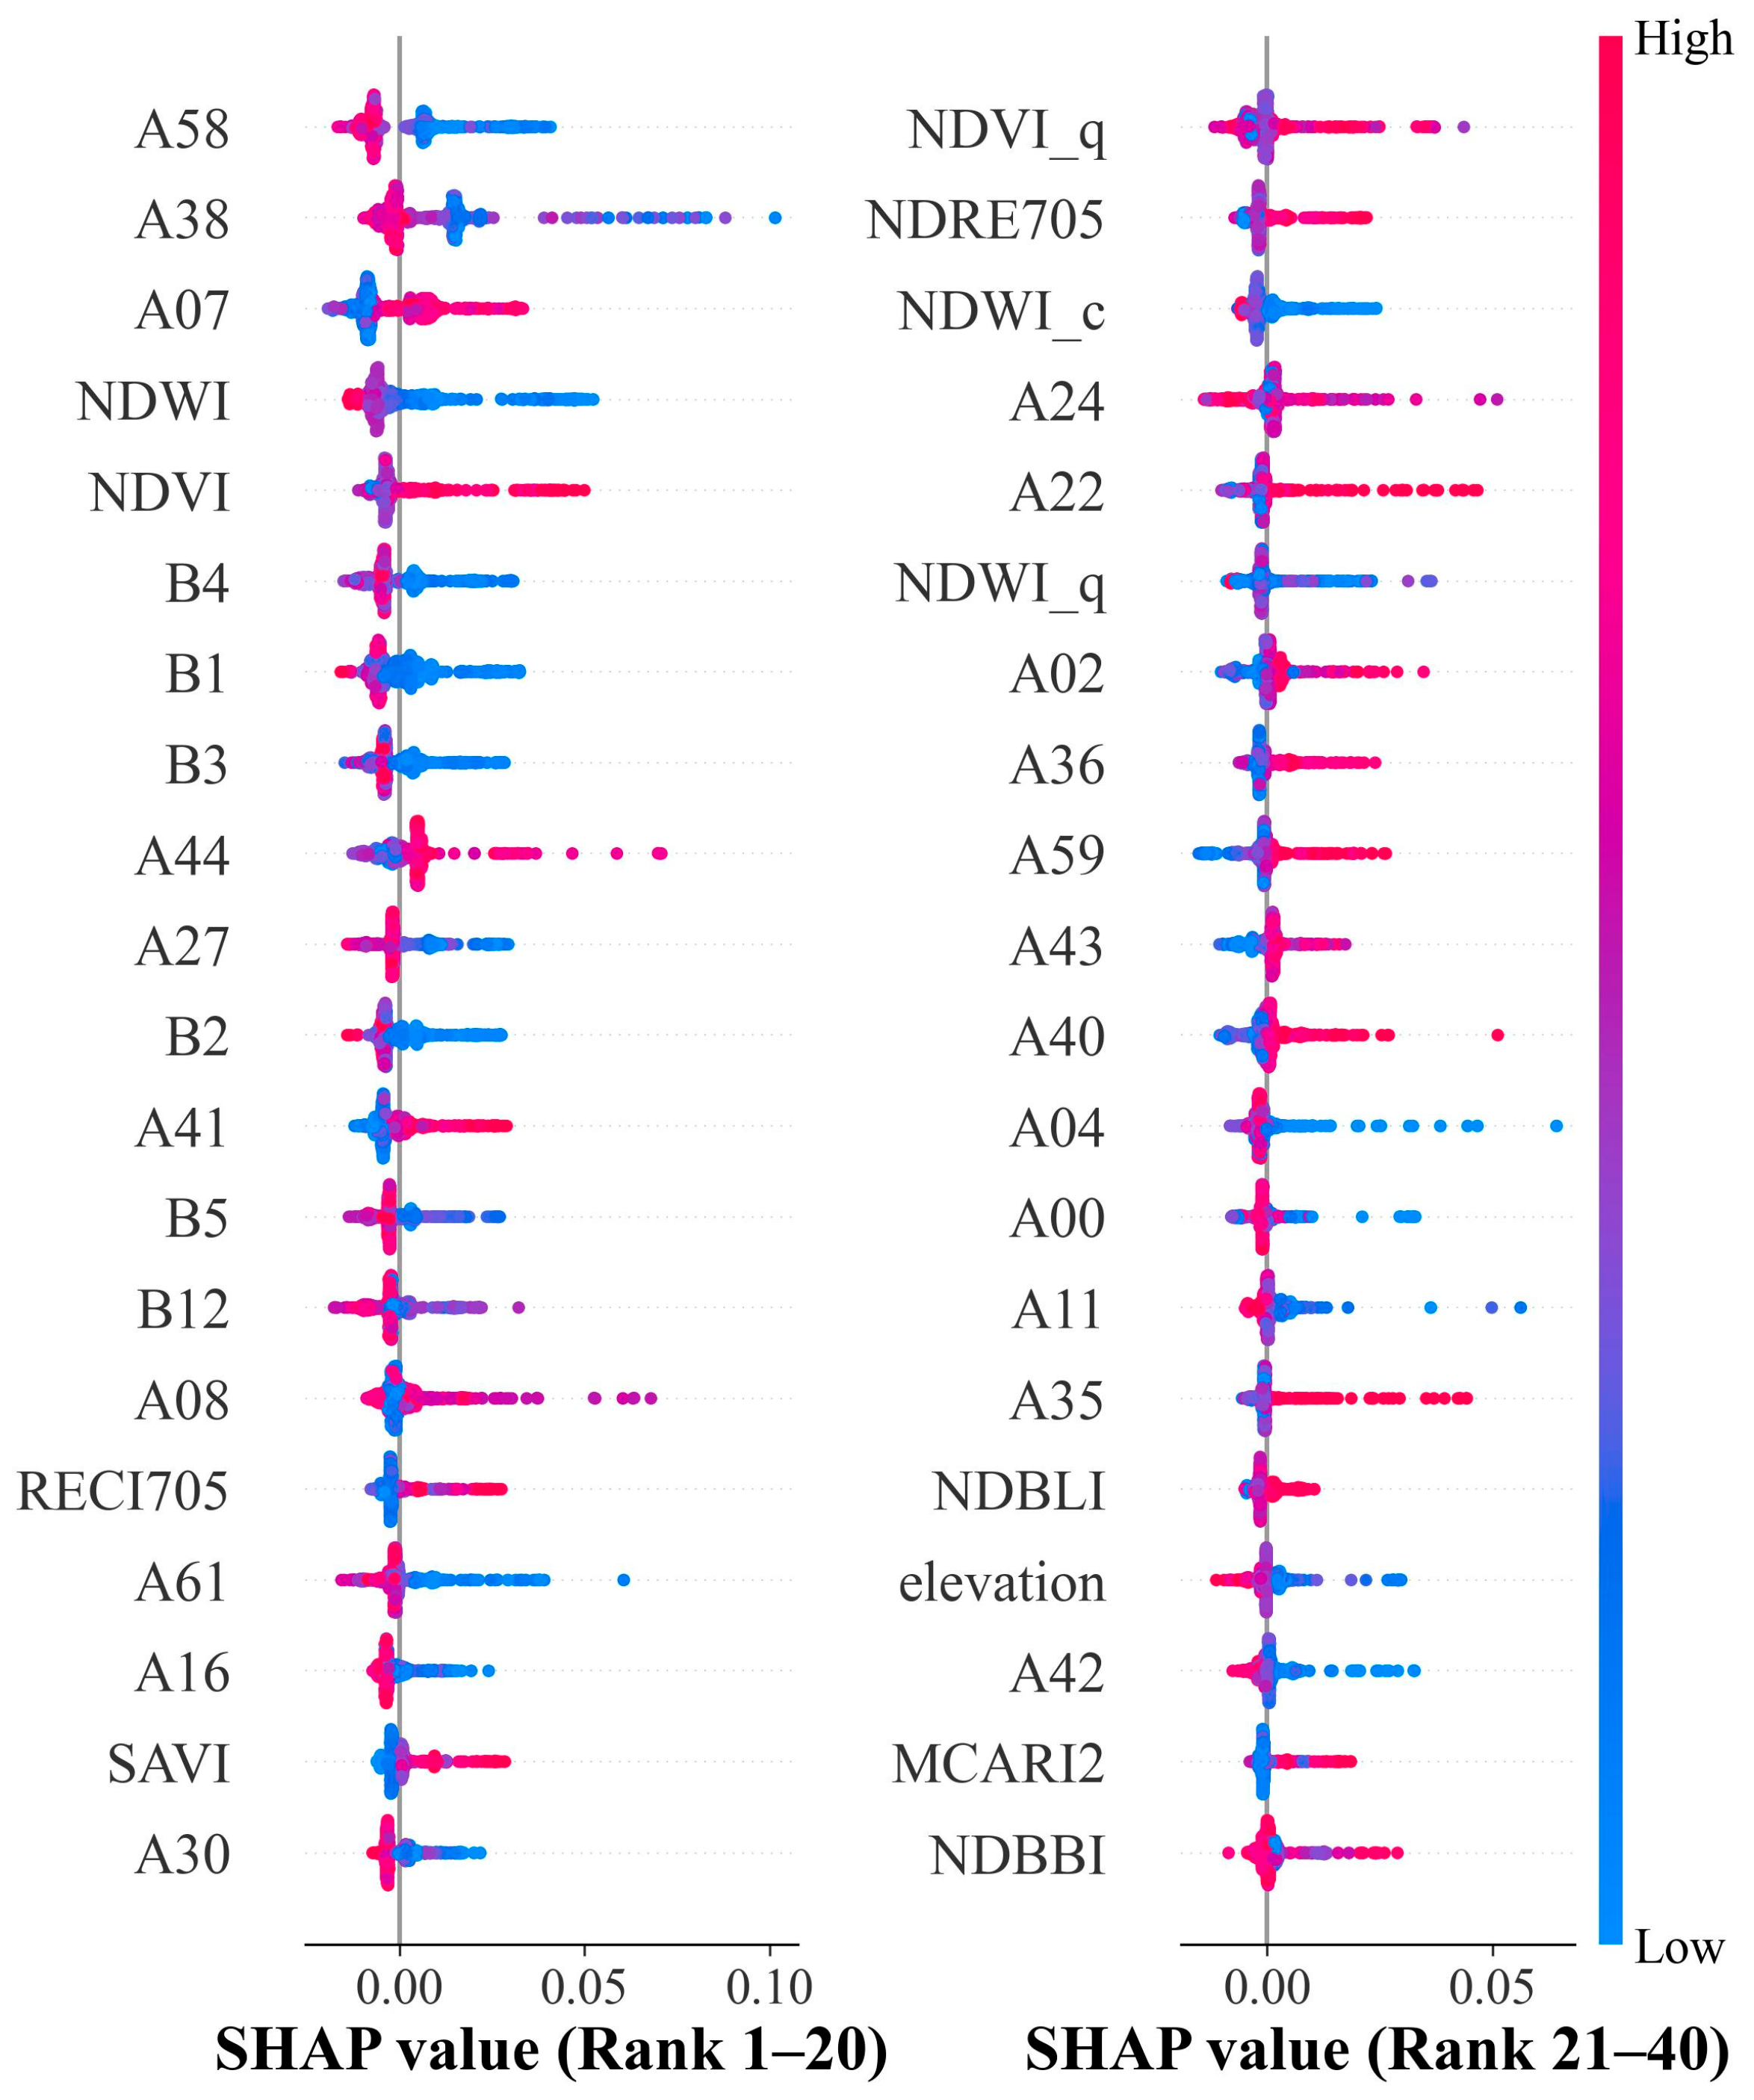
The SHAP summary plot (Figure 7) provides a deeper, instance-level understanding of how these features influence decision-making. Satellite embeddings dominate the top ranks of SHAP importance. A distinct pattern is observed for A58 and A38, where high feature values (red dots) correspond to highly negative SHAP values, strongly suppressing the probability of tea plantation classification. This behavior closely mirrors the SHAP response patterns of “suppression indices” such as NDBBI and NDWI, as shown in Figure 7. This implies a latent semantic alignment: although AEF embeddings are abstract representations, features like A58 likely encode high-level texture or spectral properties specific to artificial impervious surfaces or water bodies. Consequently, the model utilizes these embeddings as robust “negative filters” to effectively mask out non-target classes that share spectral similarities with vegetation, thereby reducing commission errors in complex landscapes. Visible light bands display a consistent response mechanism associated with light absorption. For Red (B4), Blue (B1), and Green (B3), lower values (blue dots) push the model output positively (to the right). This aligns with the biological characteristics of healthy tea canopies, which strongly absorb visible light (especially red and blue) for photosynthesis, making them appear darker than bare soil or senescent crops. In contrast to embeddings, NDVI exhibits a strong positive correlation. High NDVI values (red dots) are clustered on the positive side of the x-axis, confirming that “high greenness” remains a fundamental positive indicator for identifying tea plantations.
Figure 7.
SHAP beeswarm plot of the top 40 features for tea plantation extraction.
To further interpret the separability of different land cover classes and validate these mechanisms, this study calculated the mean values of all 39 input features for each class (Table S3 in Supplementary Materials). The statistical results highlight distinctive signatures for tea plantations. In terms of topography, tea plantations in this region are primarily located in areas with moderate elevation (mean: 96.69 m) and gentle slopes (mean: 4.90°), distinguishing them from forestlands which occupy higher and steeper terrains (mean: 162.18 m, 10.01°). Spectrally, tea plantations exhibit high vegetation vigor, indicated by the highest mean NDVI (0.69) and RECI705 (2.39) values among all classes. Furthermore, phenological metrics such as NDVI_q and NDVI_d effectively capture the unique growth cycle of tea, showing significant divergence from cropland (e.g., NDVI_d: 0.29 for tea vs. 0.09 for cropland). Notably, the AlphaEarth embedding features (e.g., A08, A13, A07) also show varying response patterns across classes, providing high-dimensional contextual information that complements traditional spectral indices.
Although the feature importance and SHAP analysis clarified the contribution of individual features, simply stacking all high-ranking features does not necessarily yield the best model performance due to potential redundancy (e.g., high collinearity between indices and bands). To systematically identify the optimal feature subset, this study carefully selected 12 hierarchical classification scenarios to function as a systematic ablation study, rather than exhaustively testing all possible permutations. As detailed in Table 2, this design was intentionally structured to: (1) quantify the marginal gain of each feature category (e.g., embeddings vs. phenology); and (2) explicitly demonstrate that the optimal performance is achieved not by using the entire high-dimensional dataset (Scenario l), but by a curated subset (e.g., Scenario f) that balances information density with redundancy reduction.
3.2. Tea Plantation Extraction Results and Accuracy Assessment
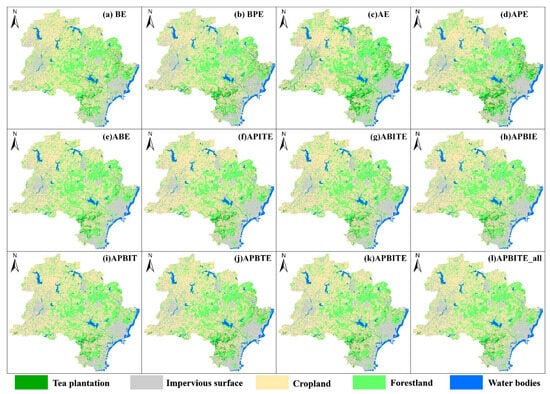
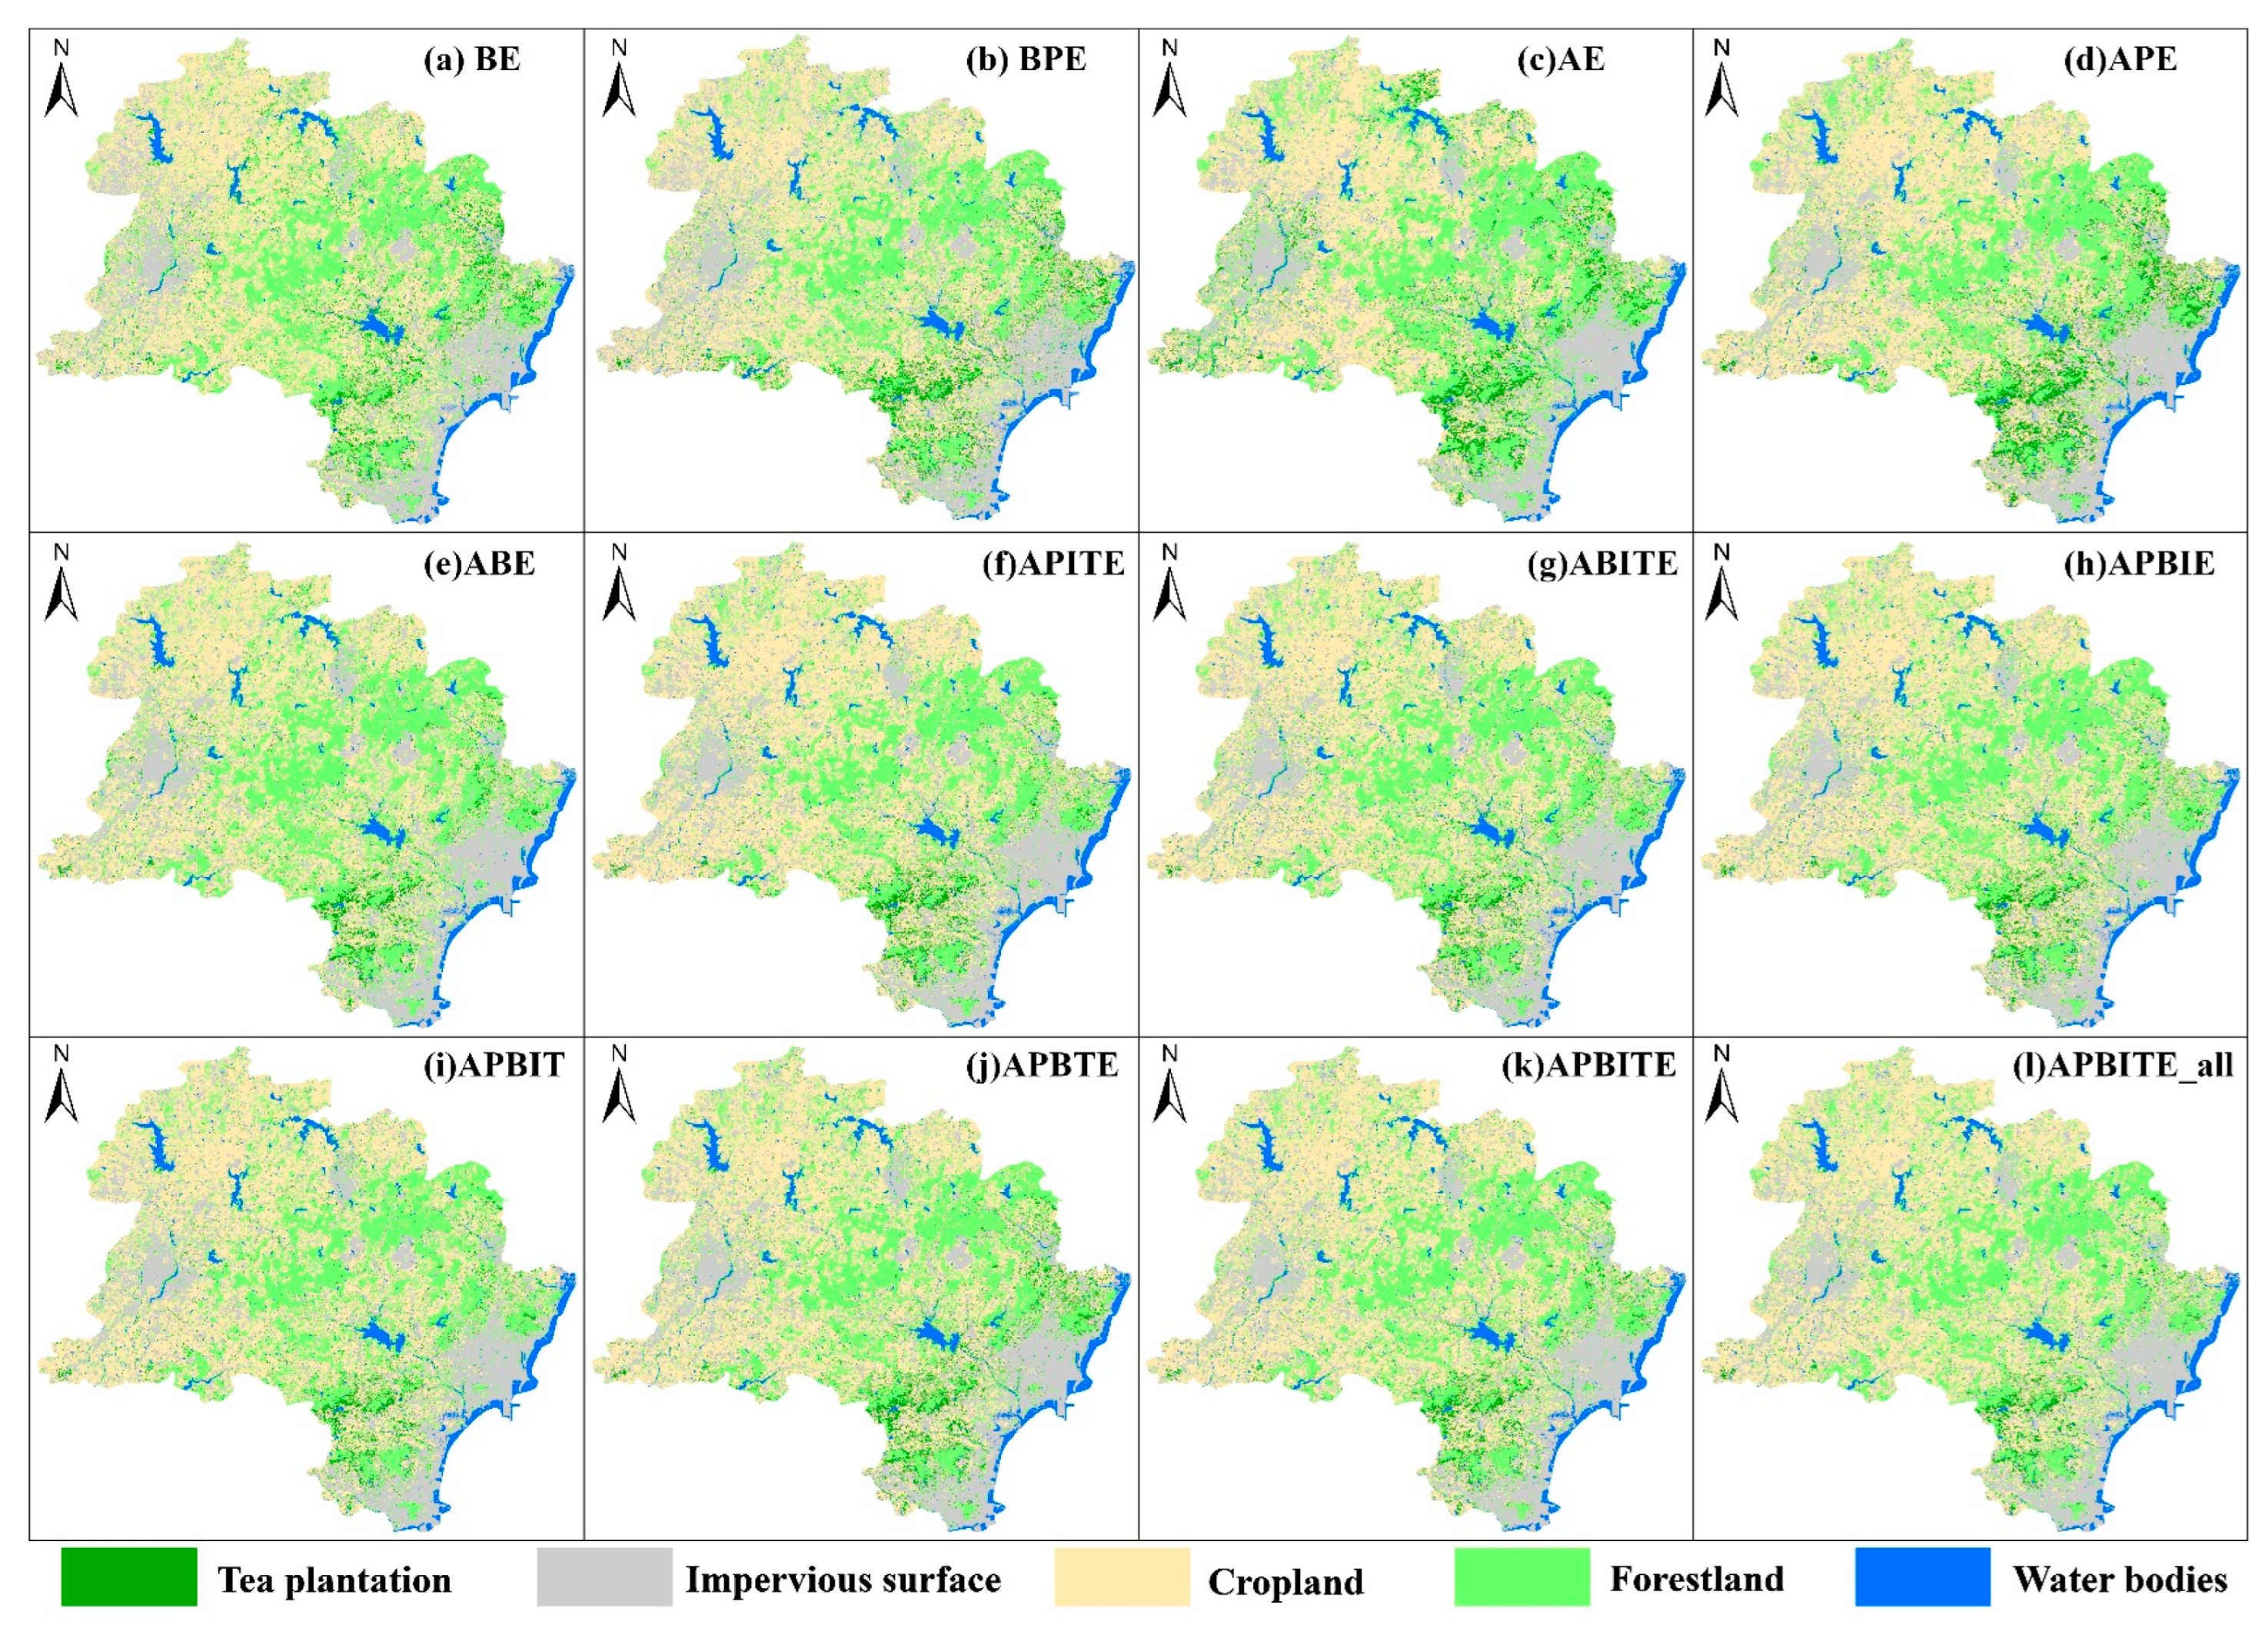
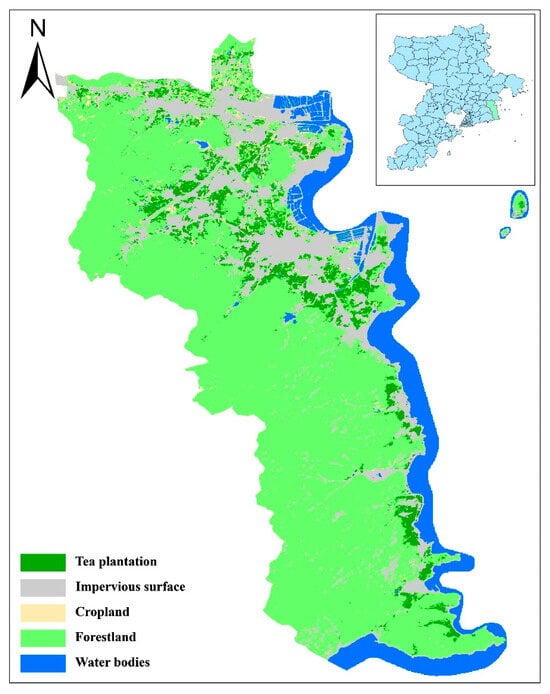
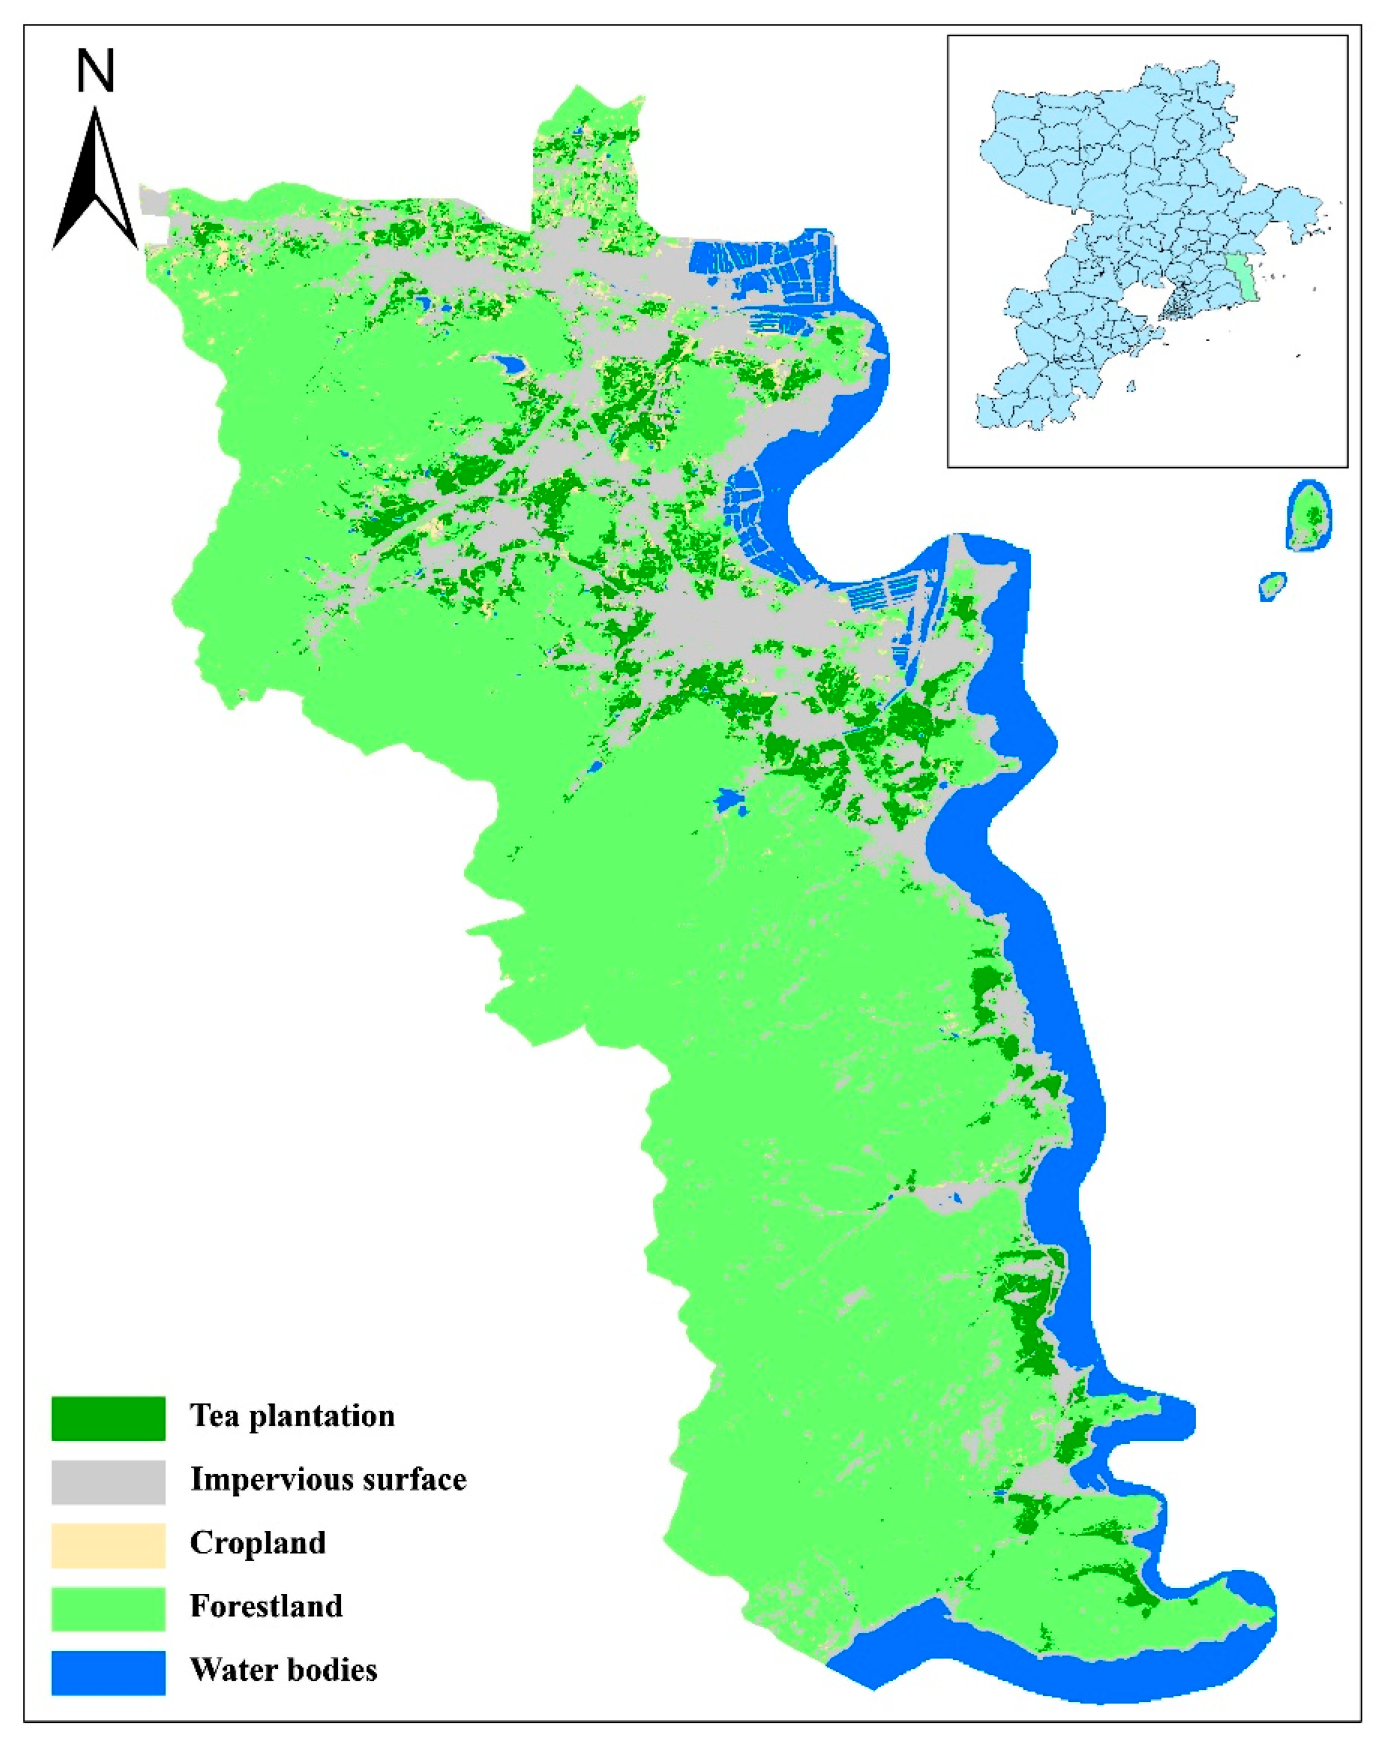
Figure 8 illustrates the classification results for Rizhao across the 12 scenarios. Overall, all scenarios demonstrated a capability to extract tea plantations and other land classes, yielding generally consistent spatial patterns for the five target types. As expected, forestland was concentrated in mountainous areas, while tea plantations were predominantly distributed in the foothills and hilly transitional zones, often interspersed with forestland and cropland. The primary discrepancies between the scenarios emerged in these interspersed zones—specifically, the classification of mixed patches at the boundaries between tea plantations, cropland, and forestland. An analysis of area statistics (Table 3) revealed that water bodies had the lowest variation across scenarios (Standard Deviation [SD] = 12.60 km2), followed by impervious surfaces (SD = 40.31 km2). Conversely, the tea plantation class showed significant variance (SD = 79.26 km2), with total area estimates ranging widely from 152.57 km2 (Scenario l) to 444.61 km2 (Scenario c). This volatility confirms that misclassification between tea plantations and adjacent cropland/forestland remains the primary source of uncertainty. According to official 2023 statistics, the total tea plantation area in Rizhao is approximately 300,000 mu (~200 km2). Based on this external benchmark, the area derived from classification scenario f (APITE) (192.77 km2) provides the most accurate and realistic estimate.
Figure 8.
Tea-plantation classification results in 2023 based on different classification scenarios.
Table 3.
Area (km2) of each land-cover class (2023) under different classification scenarios.
The quantitative evaluation (Table 4 and Table 5) revealed significant performance differences across the 12 classification scenarios. The baseline scenario a (BE), using only original bands and topography, performed the worst (OA = 0.8708, Kappa = 0.8275). Its tea plantation Producer’s Accuracy (PA) was particularly low at 0.6329, indicating severe omission errors. Introducing phenological features (Scenario b—BPE) improved the accuracy (OA = 0.9002), but tea plantation extraction remained suboptimal (UA = 0.3333). A substantial improvement occurred with the introduction of satellite embedded features. Scenario d (APE) achieved a high PA of 0.9747 for tea plantations, significantly reducing omission errors compared to non-embedding scenarios. This highlights the superior capability of the AEF embedding features in encoding complex phenological variables. Among the multi-feature fusion scenarios, Scenario i (APBIT) achieved the highest statistical metrics with an OA of 0.9311 and a Kappa of 0.9080. However, for the specific objective of agricultural resource inventory, Scenario f (APITE) (OA = 0.9269) was determined to be the optimal solution. This decision was driven by the critical trade-off between omission and commission errors. Scenario f demonstrated a superior Producer’s Accuracy (PA) for tea plantations (0.9747), ensuring nearly complete identification of fragmented patches, whereas Scenario i exhibited a notable drop in PA (0.8734), implying a higher risk of missing tea resources. Although Scenario i offered a marginal improvement in User’s Accuracy (0.6970 vs. 0.6638), the strategic priority of minimizing omission errors (high recall) in monitoring fragmented landscapes justified the selection of Scenario f. In contrast, complex scenarios like l (APBITE_all), despite including all 124 features, did not yield the best results (Tea UA = 0.3267, PA = 0.8354). This suggests that excessive feature inclusion introduces noise and redundancy, leading to overfitting and reduced generalization capability.
Table 4.
Macro-averaged accuracy evaluation results under different classification scenarios.
Table 5.
Per-class accuracy evaluation results under different classification scenarios.
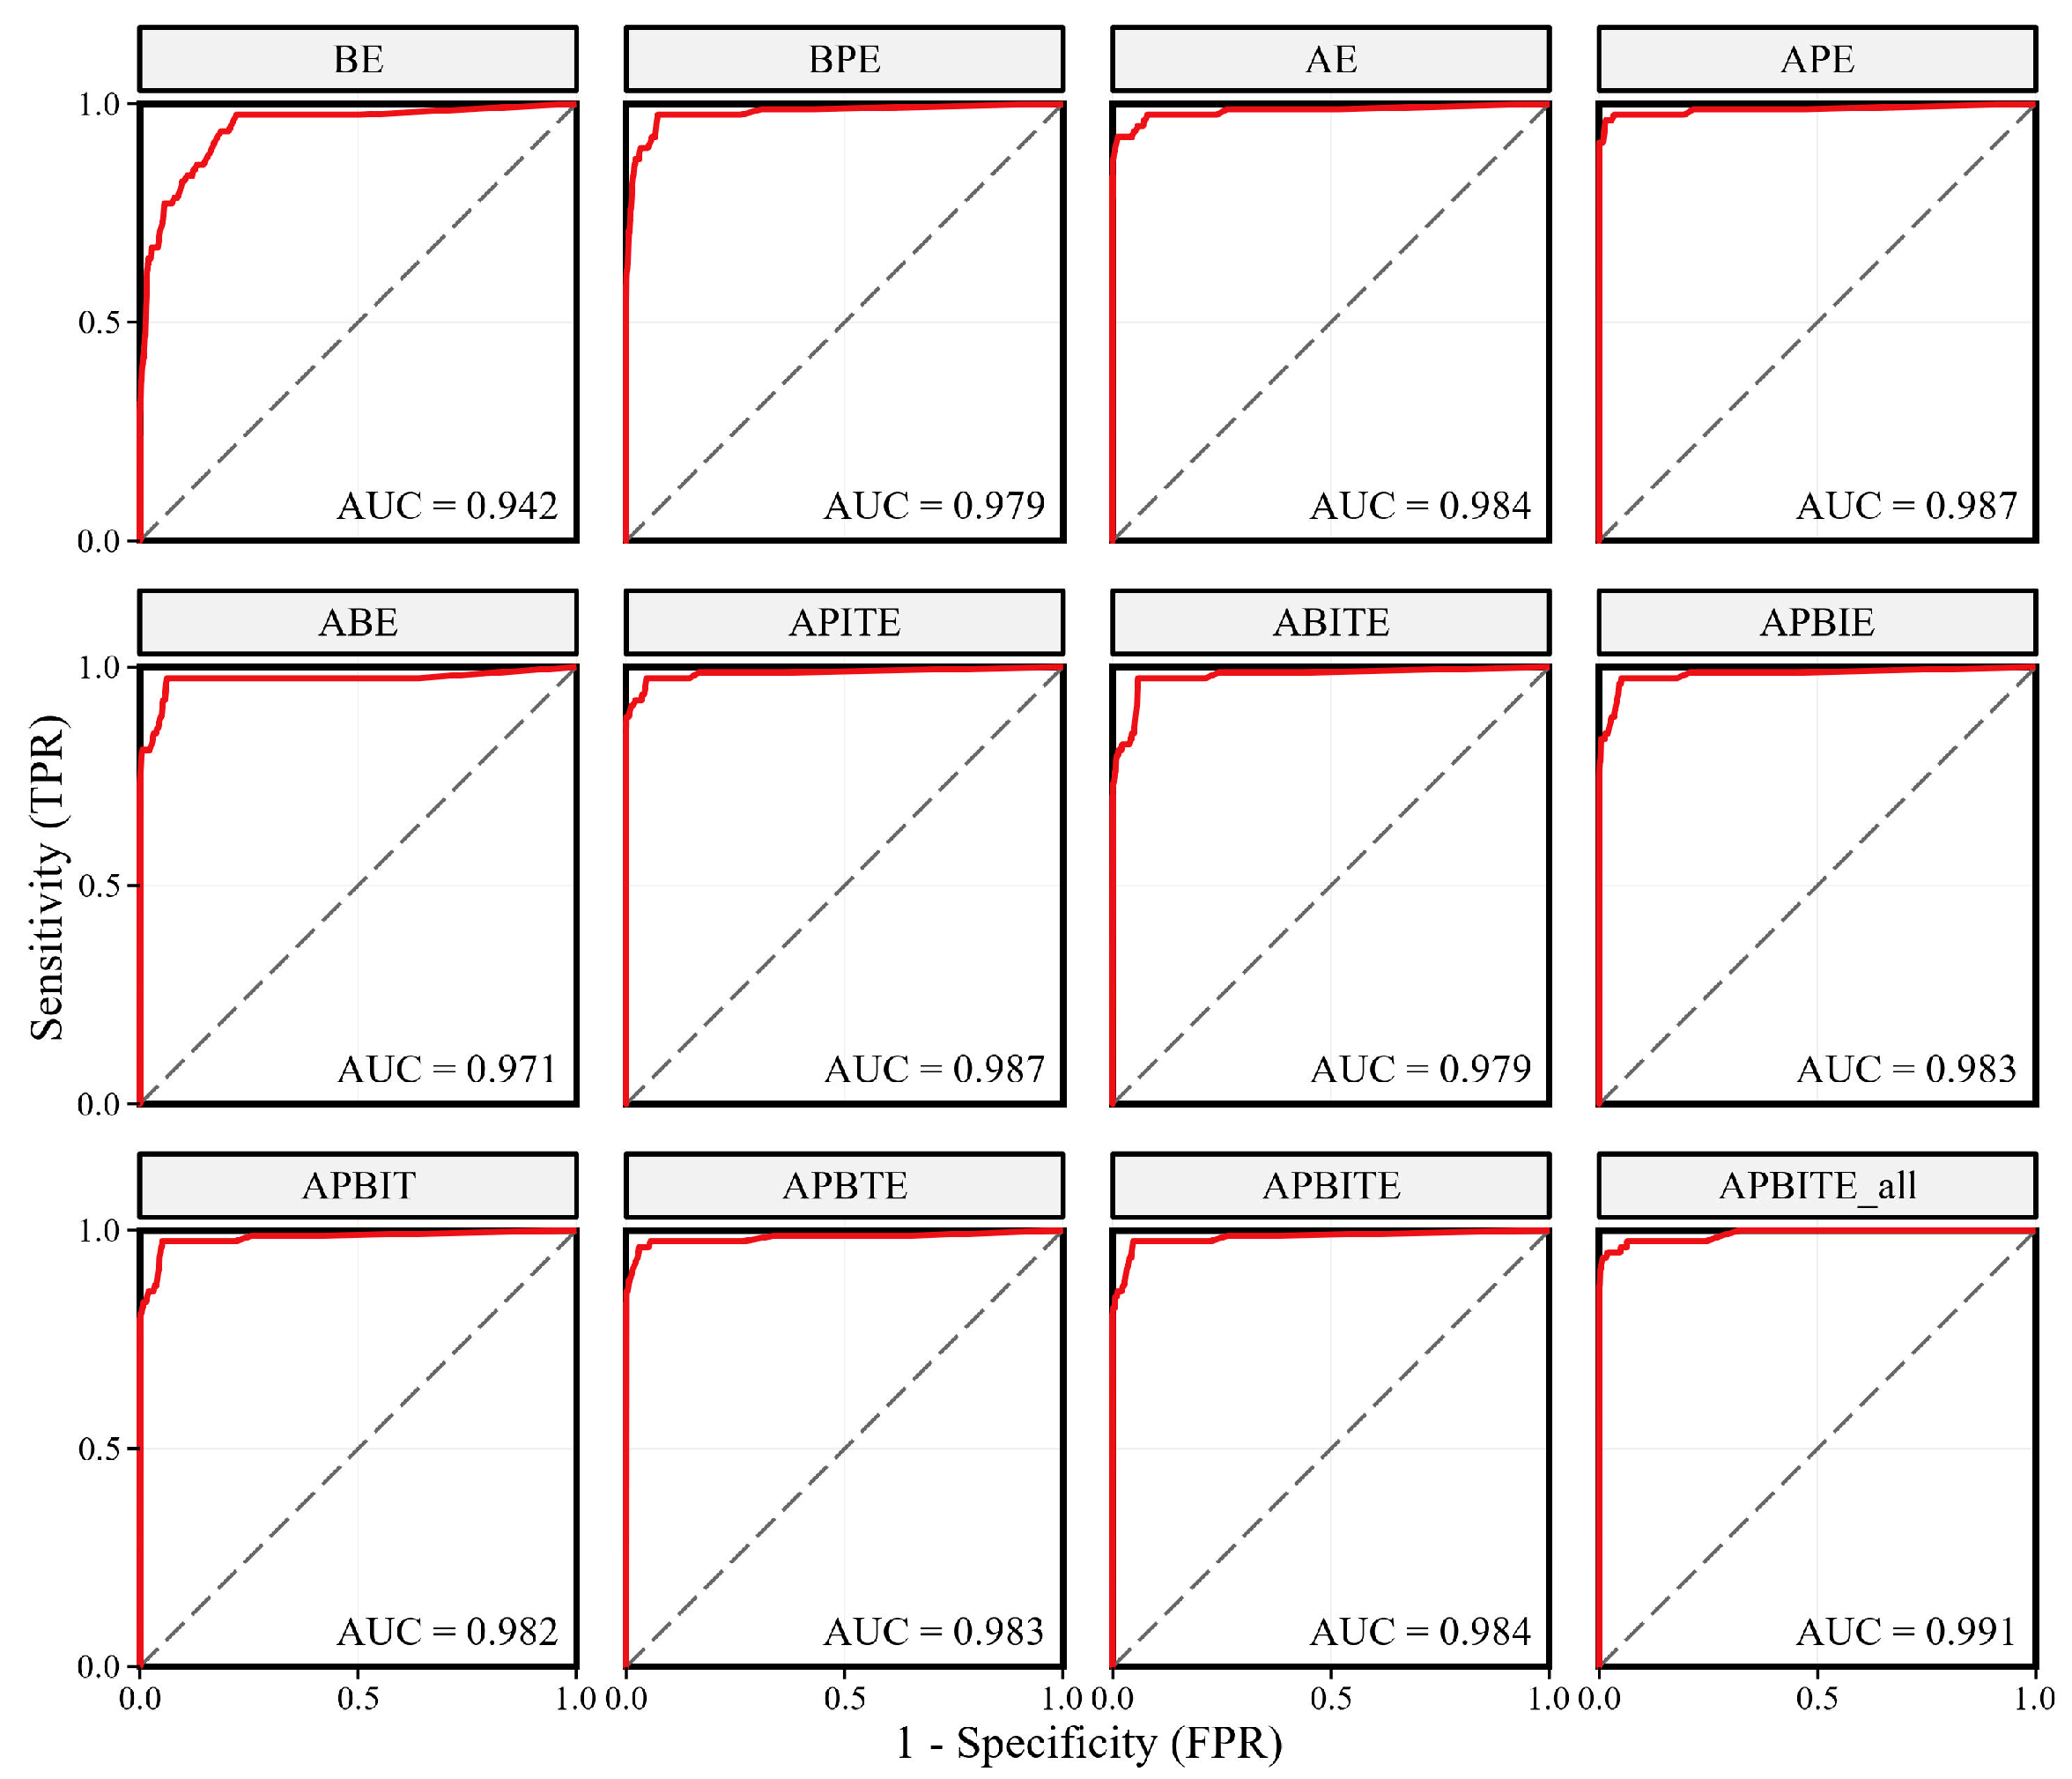
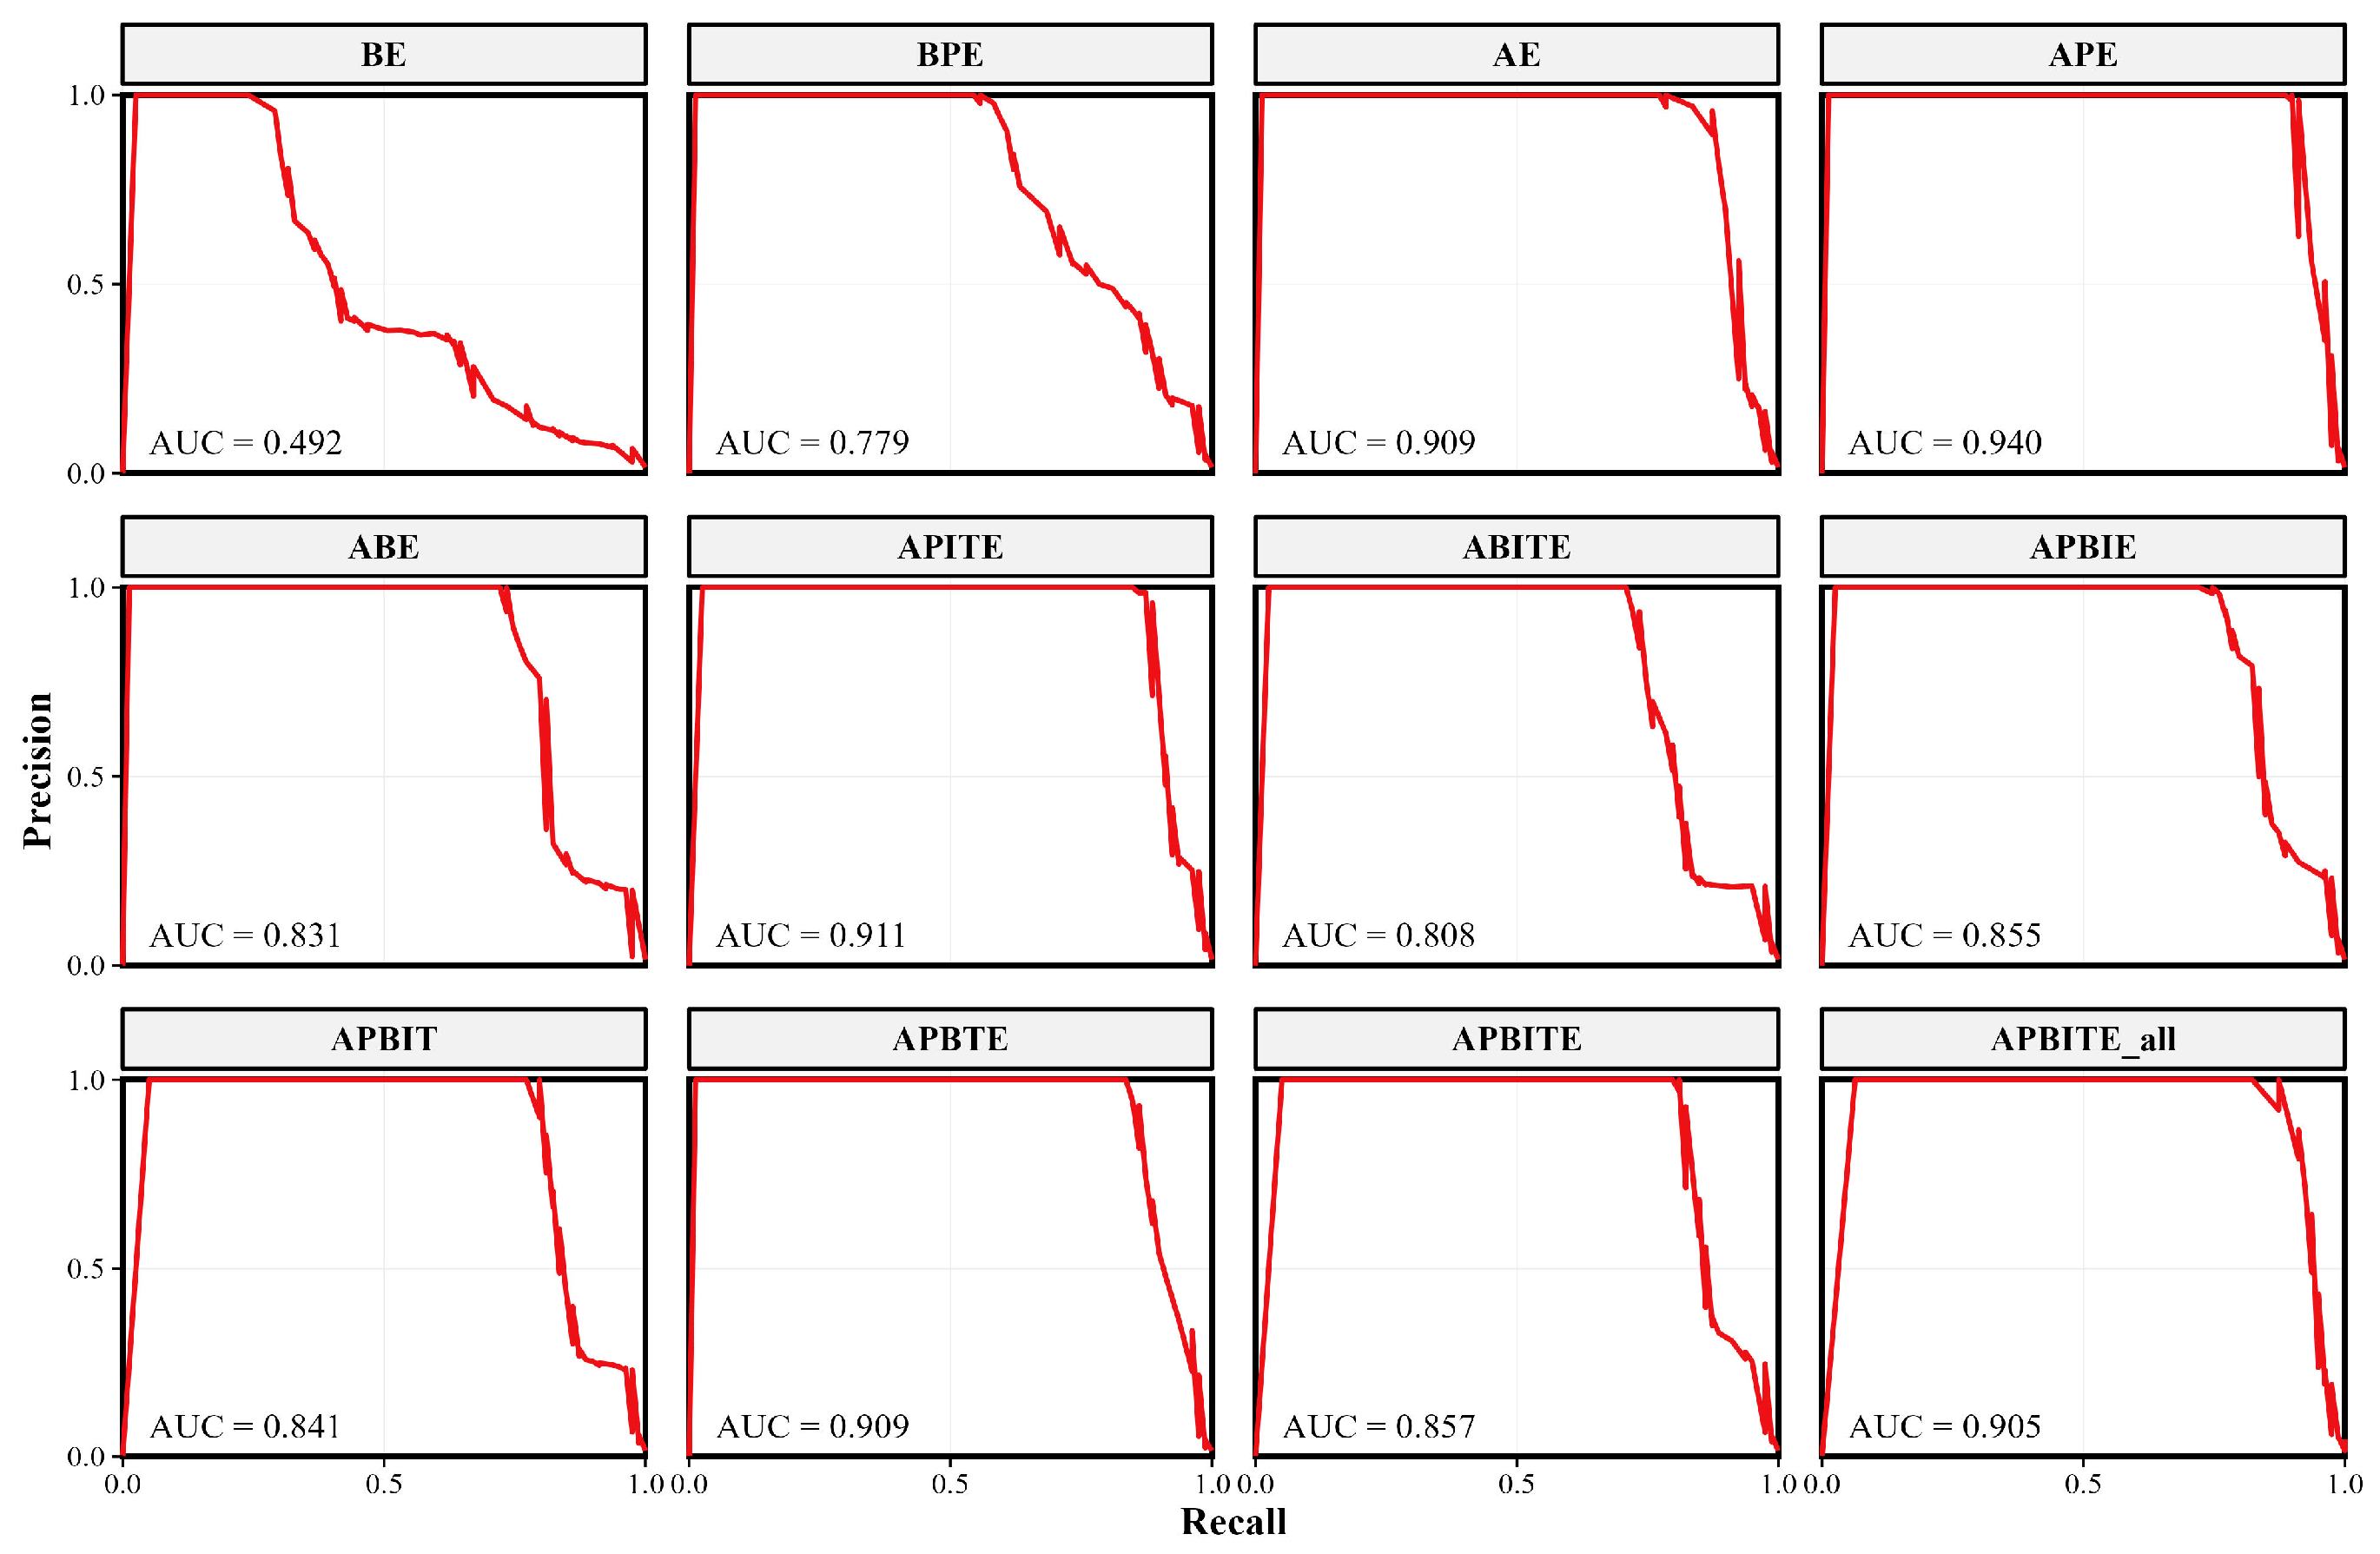
To further validate the robustness of the selected scenario, ROC and P-R curves were analyzed. As shown in Figure 9, Scenario f (APITE) achieved an outstanding AUC-ROC of 0.987, demonstrating excellent separability between tea plantations and other classes. In the P-R analysis (Figure 10), which is more sensitive to class imbalance, Scenario f also performed exceptionally well with an AUC-PR of 0.911. This confirms that the model’s high performance is not an artifact of the dataset distribution but a result of effective feature learning. Considering the balance between statistical accuracy and the practical requirement for high detection rates (Recall), Scenario f (APITE) was established as the optimal solution for mapping tea plantations in Rizhao.
Figure 9.
Comparison of ROC curves for tea plantation extraction under different feature combination scenarios. The dashed diagonal line in each subfigure represents the random baseline (AUC = 0.5) for reference.
Figure 10.
Comparison of P-R curves under different feature combination scenarios.
3.3. Distribution Characteristics of Tea Plantations
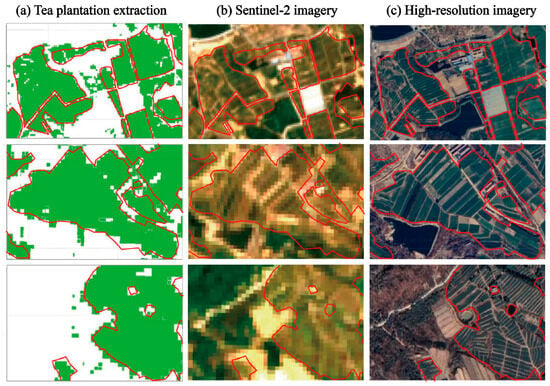
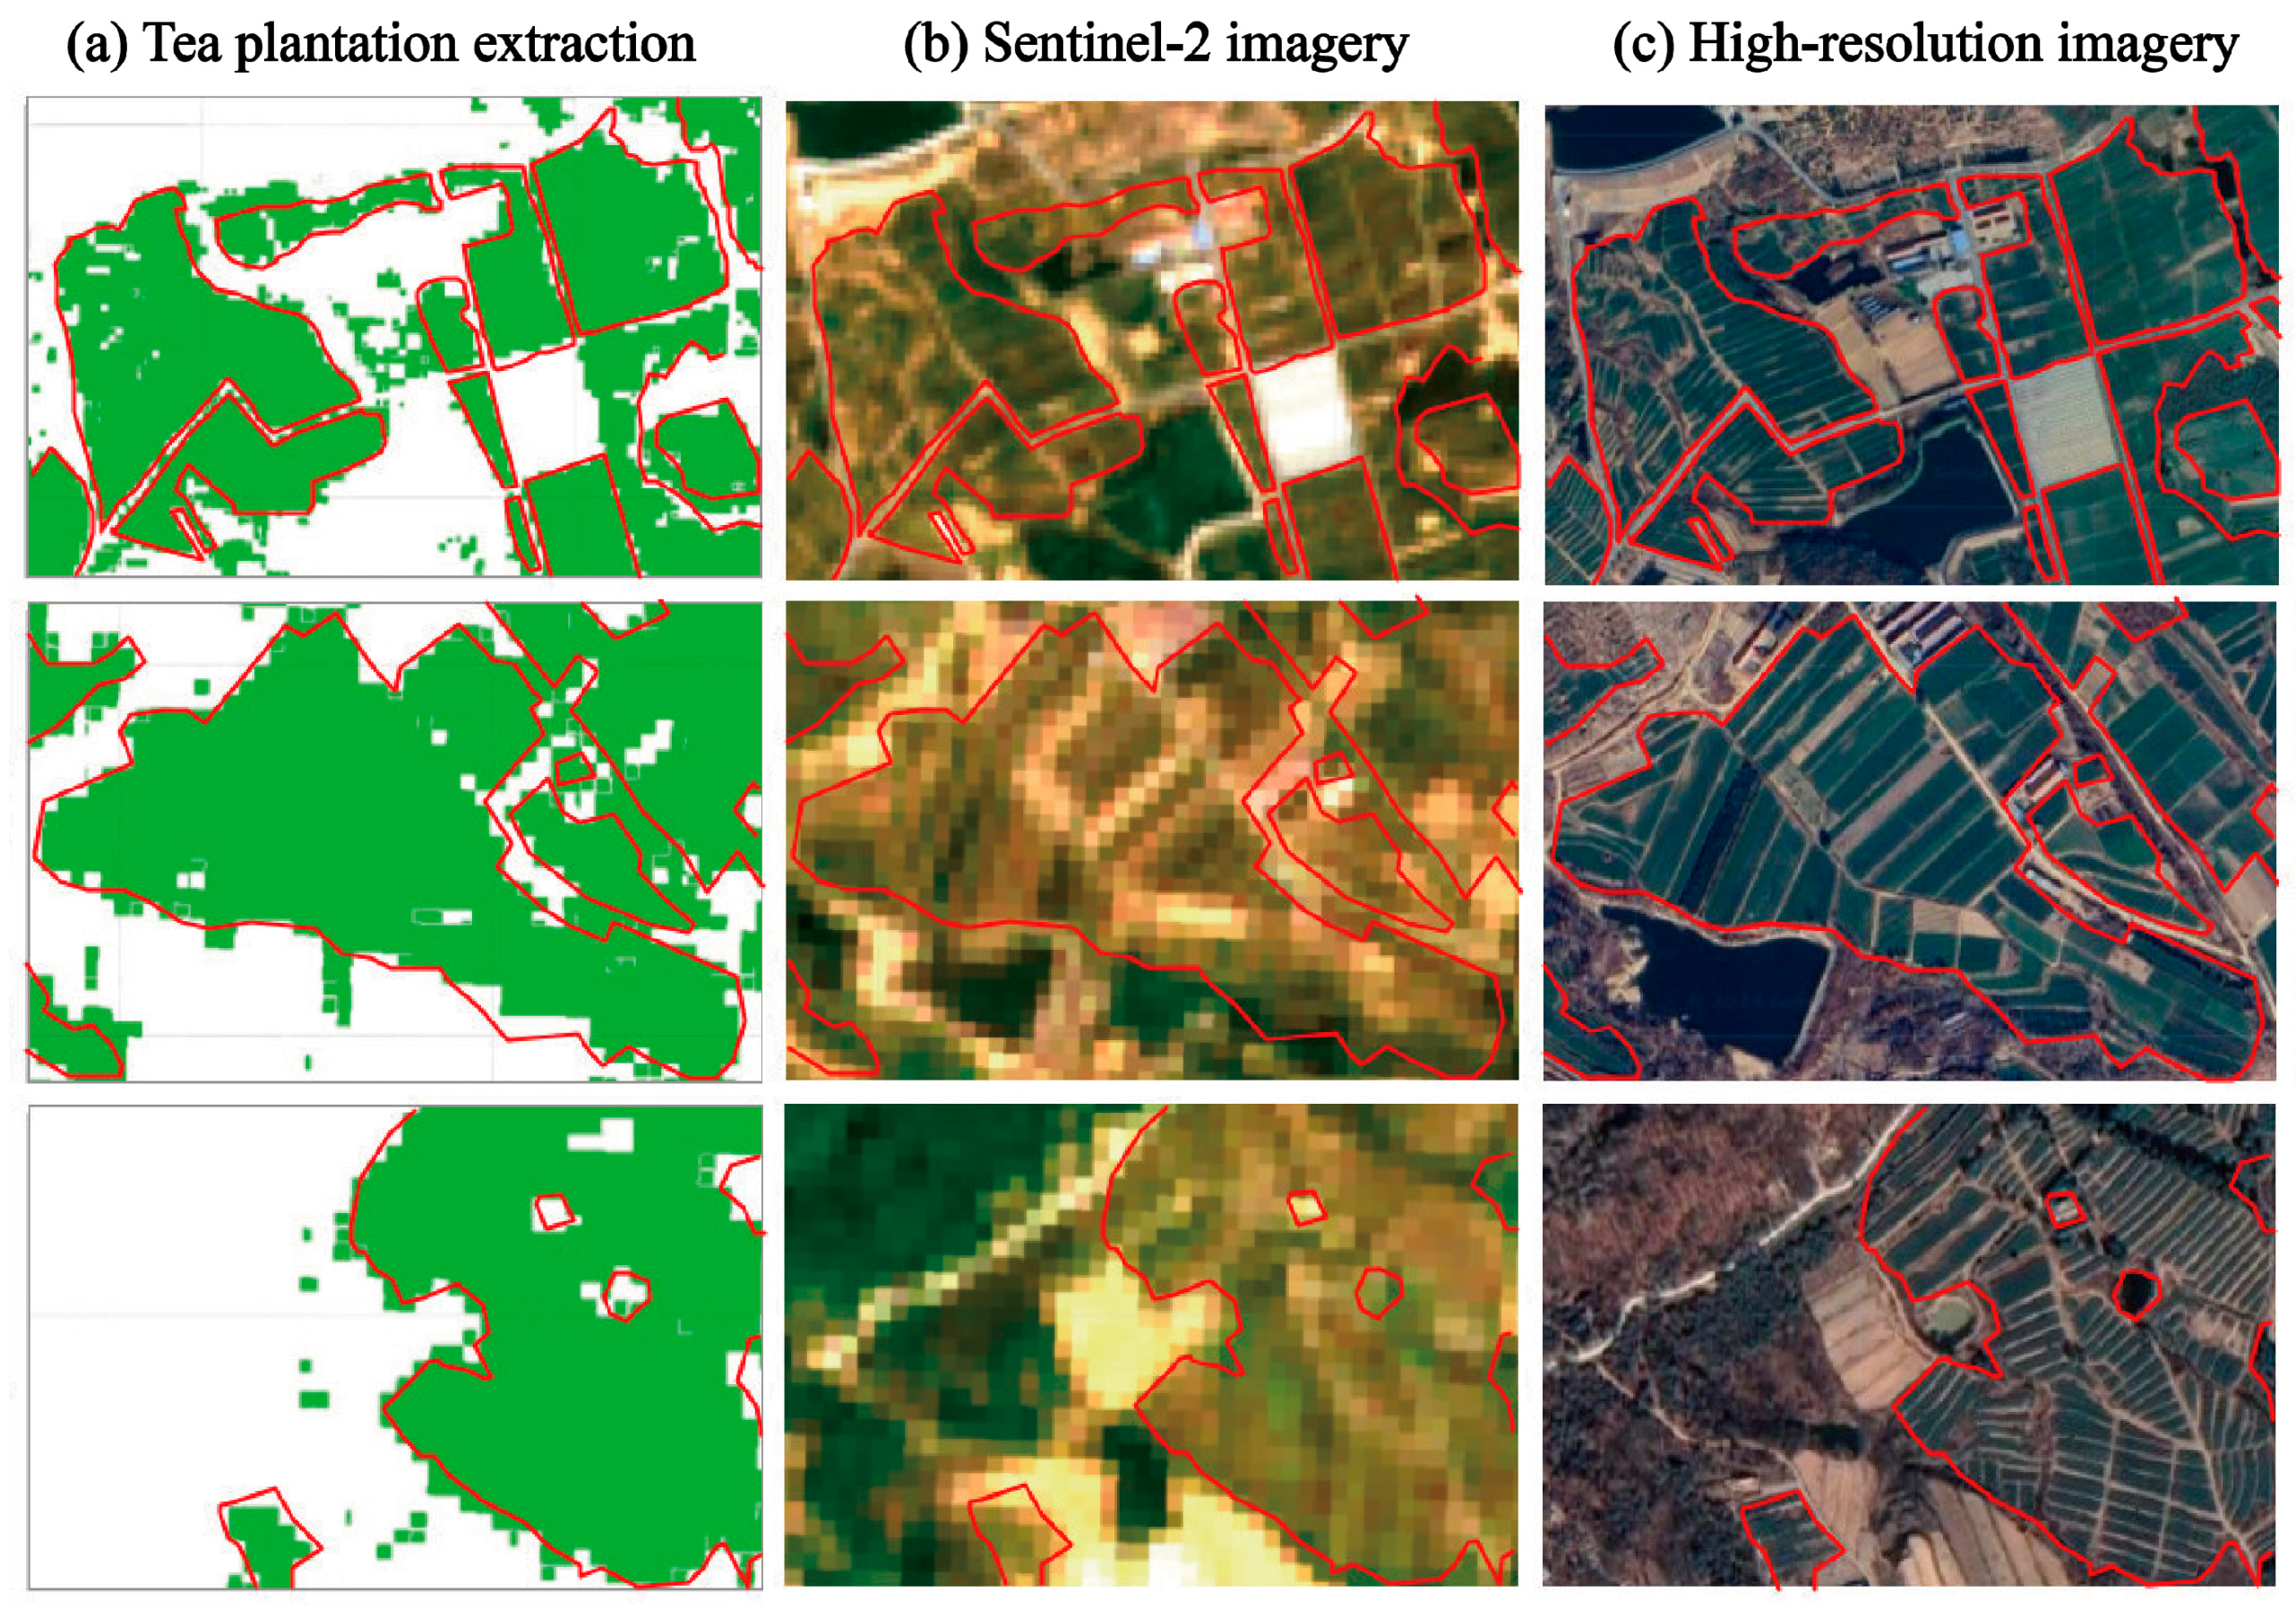
The spatial distribution of tea plantations in Rizhao for 2023 was extracted using the optimal Scenario f (APITE) on the GEE platform. To qualitatively assess the reliability of these results, three representative sub-regions were selected for a detailed comparison against multi-source imagery (Google Earth high-resolution and Sentinel-2), as shown in Figure 11. The visual comparison reveals a high consistency between the extraction results (Figure 11a) and the actual ground truth (Figure 11b,c) in both geolocation and geometric fidelity. The boundaries of contiguous tea plantations are accurately delineated, and non-tea features—such as field roads, irrigation ponds, and greenhouses—are effectively excluded. Minor discrepancies, primarily small-scale omissions, were localized to fragmented plots heavily shaded by windbreak forests or situated on steep slopes with abrupt aspect changes. Overall, the classification quality meets the requirements for regional-scale resource monitoring.
Figure 11.
Comparison of tea plantation extraction results based on the APITE classification scenarios with multi-source imagery. (a) Extraction results (green fill; red outlines), (b) Sentinel-2 imagery, and (c) High-resolution imagery.
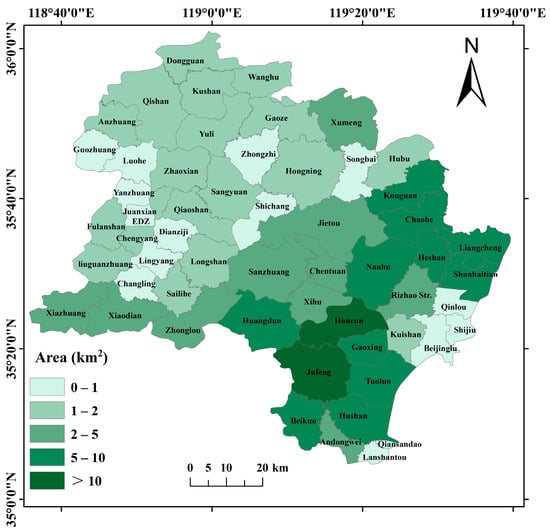
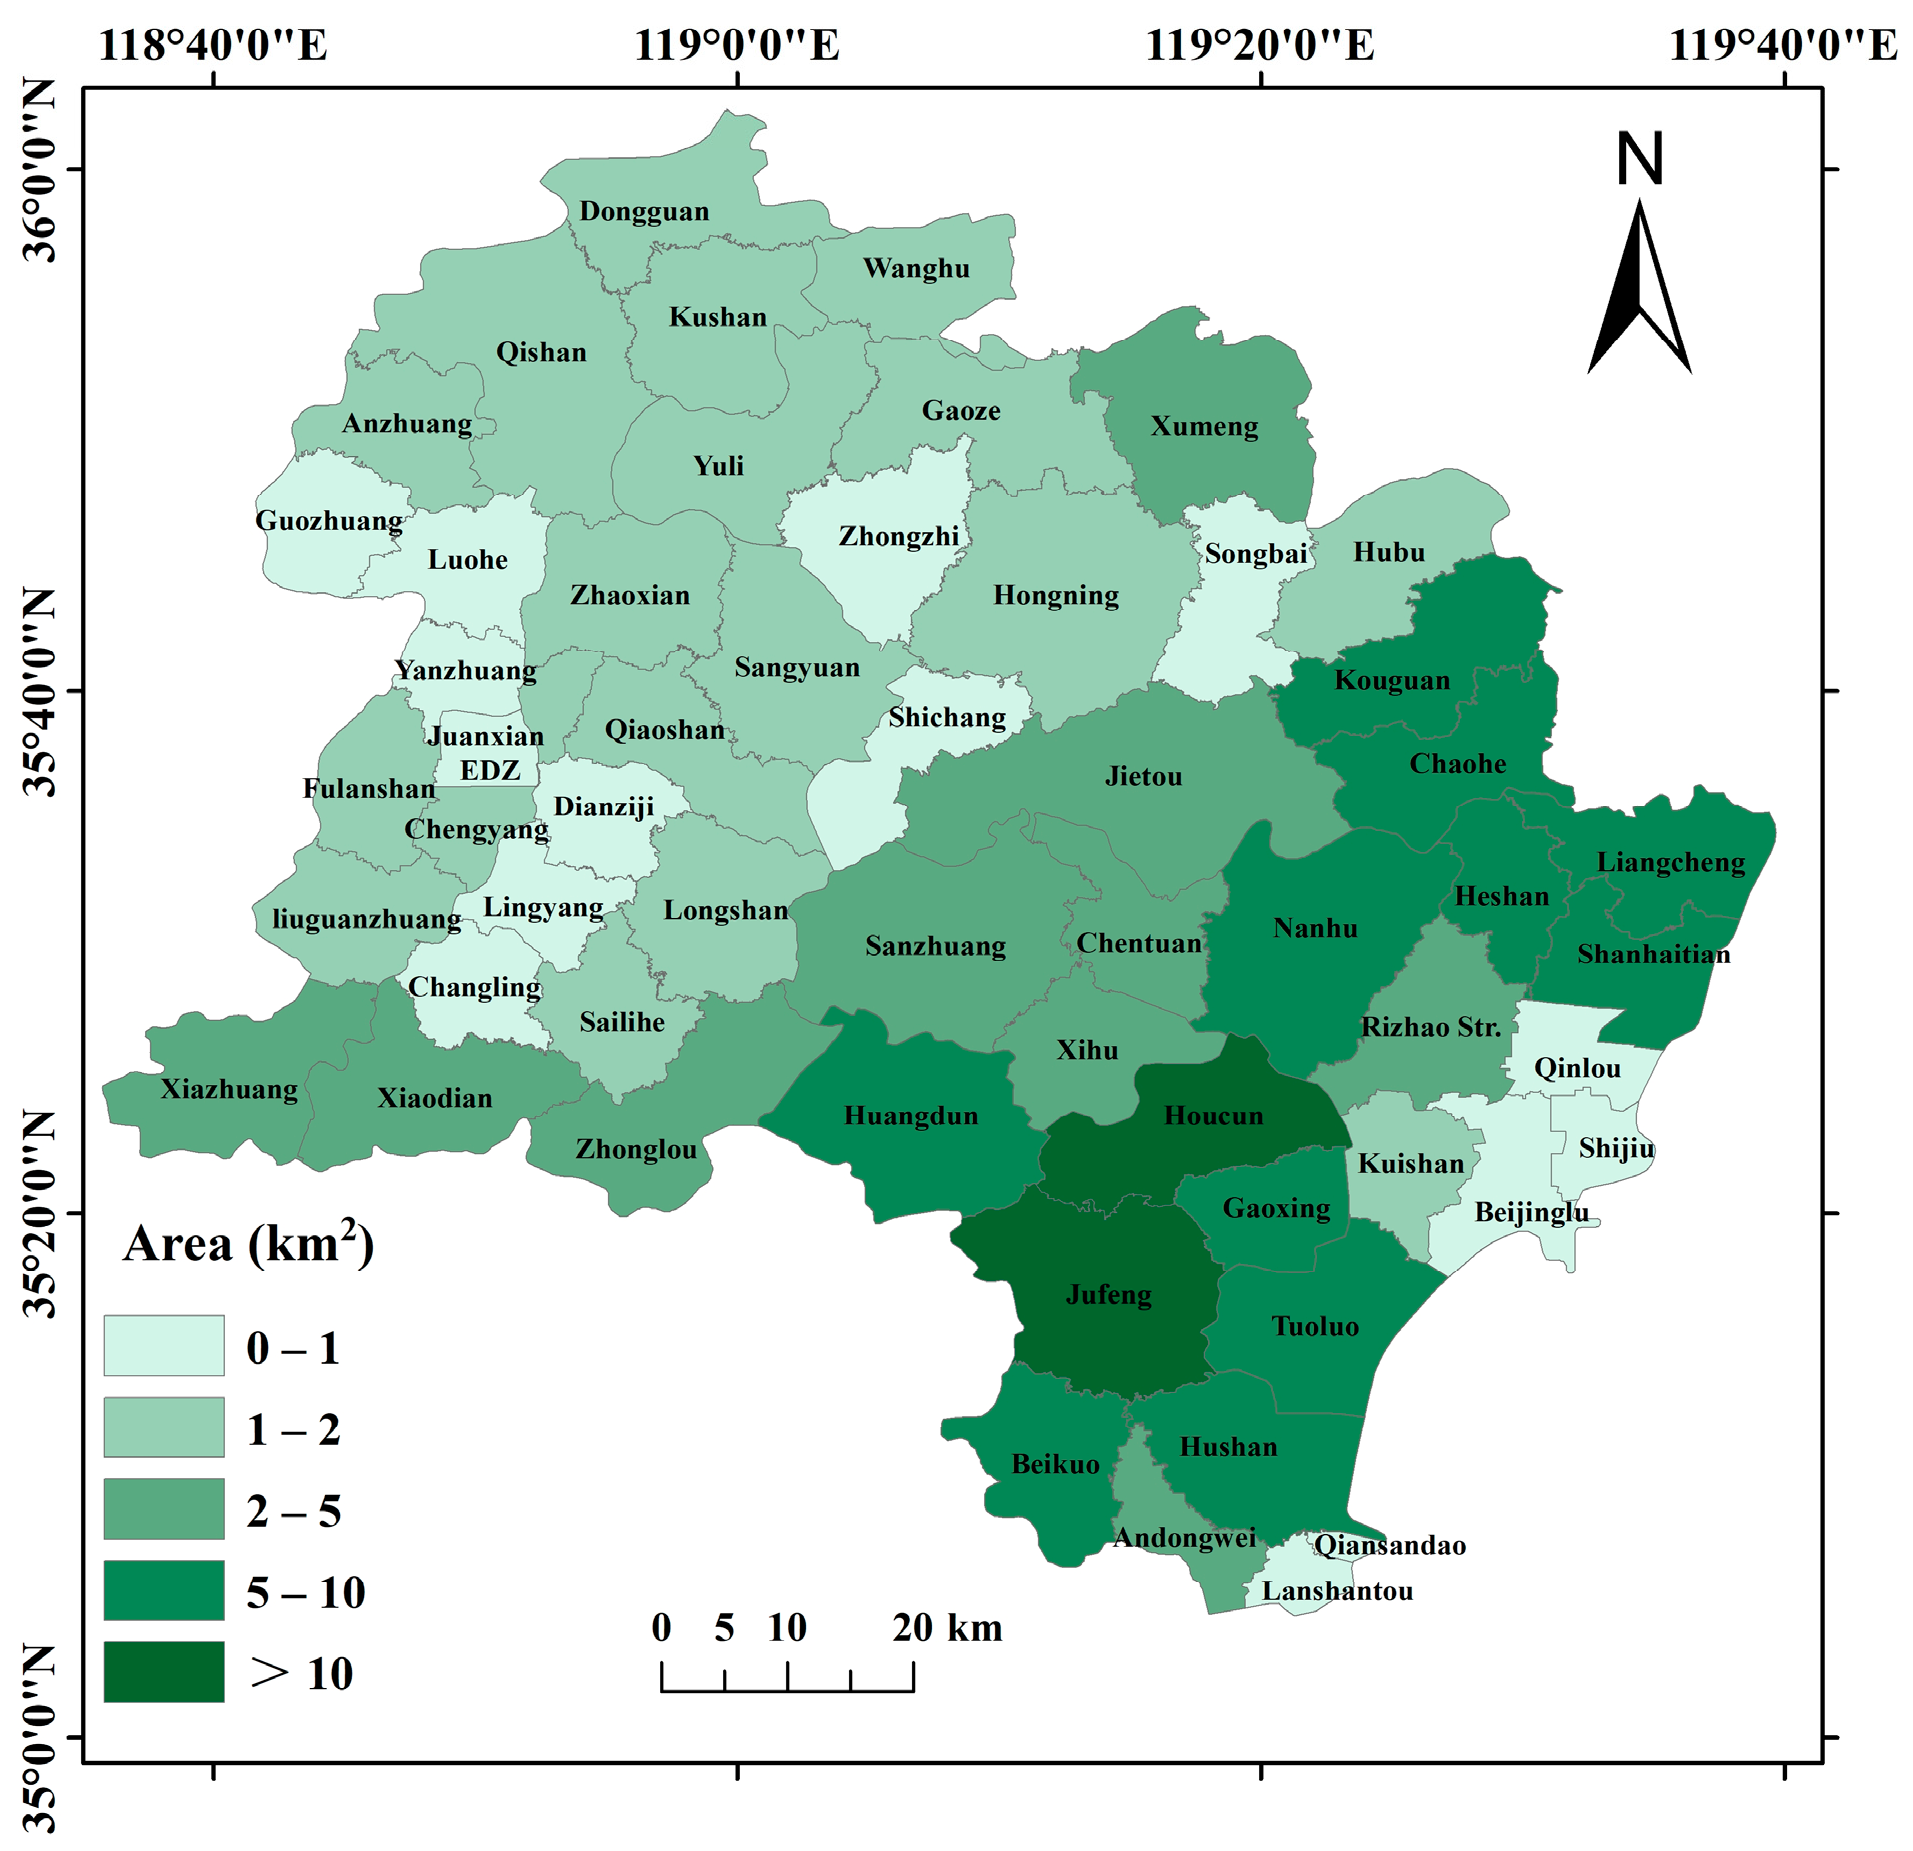
Figure 12 presents the township-level statistics of tea plantation areas. Spatially, the distribution exhibits a distinct “South-Dense, North-Sparse” pattern, with cultivation concentrated in the hilly transition zones of Lanshan District and Donggang District. According to the extraction results, Jufeng Town (Lanshan District) recorded the largest tea plantation area (36.78 km2), confirming its status as the core production hub. This was followed by Houcun Town (Donggang District) with 19.88 km2. Other major production townships include Beikuo Town (9.99 km2), Gaoxing Town (9.58 km2), and Huangdun Town (8.55 km2), all of which fall under the administration of Lanshan District. In Wulian County, Kouguan Town (6.39 km2) and Chaohe Town (5.46 km2) emerged as significant clusters. Conversely, townships in the northern mountainous areas and central urban sub-districts (e.g., Shijiu, Qinlou) showed minimal cultivation, often less than 1 km2.
Figure 12.
Density map of tea gardens in each township of Rizhao.
At the county/district level, the aggregated results based on the latest administrative divisions indicate that Lanshan District holds the dominant share of tea plantations (approx. 76.0 km2), driven by large-scale planting in Jufeng and Beikuo. Donggang District follows with approx. 55.0 km2, primarily contributed by Houcun, Nanhu, and Liangcheng. Wulian County (approx. 25.0 km2) and Ju County have relatively smaller areas, primarily scattered in specific microclimates suitable for tea growth. While these remote sensing-derived estimates align with the general spatial trends reported in the Rizhao Tea Annals [47], the absolute values are conservative compared to statistical yearbooks, likely due to the strict exclusion of mixed pixels and young tea seedlings that lack distinct spectral signatures.
4. Discussion
4.1. Model Performance and Generalizability
The analysis of the 12 classification scenarios in Rizhao provided three key insights. (1) Identifying embeddings as critical drivers, the results showed that the introduction of satellite embedded features (Scenario c, AE) was the single most critical factor for improving accuracy, confirming their ability to capture latent phenological traits. (2) Demonstrating an optimal balance in Scenario f, the APITE model performed best, achieving a robust OA of 0.9269 and a high Kappa of 0.9026. Crucially, it optimized the trade-off for the tea plantation class, maintaining a high Producer’s Accuracy (PA = 0.9747) to minimize omission errors, which is vital for resource monitoring. (3) With respect to error characterization, while the User’s Accuracy (UA = 0.6638) indicated some commission errors (over-classification), this is often preferable to omission in agricultural surveys. The confusion primarily occurred at fuzzy boundaries with mixed forest-shrub zones. It is important to note that while simpler classes (e.g., water) achieved near-perfect accuracy, the model’s performance on tea plantations is sensitive to sample selection, a challenge mitigated here by the robust sampling strategy.
It is pertinent to address the specific relationship between individual feature ranking and the optimal feature subset observed in our results. While raw spectral bands (e.g., B1, B12) were ranked as top predictors in the Gini importance assessment (Figure 6), the optimal APITE scenario excluded them. This phenomenon can be attributed to information redundancy and feature collinearity [48]. Spectral indices are inherently non-linear derivations of raw bands, designed to enhance target signals while suppressing atmospheric and soil background noise [25]. Consequently, the critical information contained in the high-ranking bands was effectively captured and implicitly represented by the indices and embeddings in the APITE scenario. Reintroducing raw bands alongside these derived features (as in the APBITE scenario) likely induced data redundancy without contributing novel distinct information, thereby marginally constraining the model’s efficiency compared to the streamlined APITE configuration.
A more significant question is the generalizability of the model—specifically, its ability to transfer to new, unseen geographies using the APITE feature stack [49]. To test this, the RF model, trained solely on the Rizhao samples, was applied to the Wanggezhuang Subdistrict (Mount Lao region) in neighboring Qingdao City, a representative premium tea-producing area. The model’s area estimate for 2023 was compared against updated official statistics. The spatial results of this transfer test are shown in Figure 13. The model extracted a total tea plantation area of 10.39 km2 for Wanggezhuang. This figure aligns remarkably well with the official statistical area of 9.66 km2, showing a relative deviation of approximately +7.5%. Unlike the slight underestimation observed in Rizhao, the transfer result shows a minor overestimation, likely due to the spectral similarity between tea and the abundant evergreen vegetation in the Mount Lao scenic area. Nevertheless, considering that the model was transferred across administrative boundaries without any local retraining samples, this result demonstrates strong generalization capacity. This success is largely attributable to the AEF satellite embedding features; as this embedded data is globally consistent, it allows the model trained in a label-rich area (Rizhao) to be effectively generalized to label-scarce regions (Qingdao).
Figure 13.
Generalization results of the trained model (APITE) applied to Wanggezhuang (Qingdao) for 2023.
To contextually evaluate the proposed framework, this study compared our results with recent studies to highlight the distinct advantages of the Foundation Model approach. Our optimal APITE model (OA 92.69%) outperforms recent rule-based methods utilizing standard Sentinel-2 features (e.g., OA ~88% in Xia, Bian, Pan and Li [23]), indicating that our deep representation stack effectively resolves spectral confusion that “shallow” features often miss. Unlike traditional methods requiring complex data balancing to mitigate class imbalance [8], AEF features leverage generalized Earth observation knowledge to function as a contextual semantic filter, distinguishing tea plantations based on structural consistency rather than relying solely on spectral reflectance. Furthermore, this study addressed the critical limitation of “low interpretability” in foundation models. By integrating SHAP analysis, this study successfully decoded the decision mechanism of abstract embeddings, proving that they act as effective “negative filters” for confounding vegetation, thereby bridging the semantic gap that typically characterizes these “black box” features.
4.2. Limitations, Uncertainty, and Error Analysis
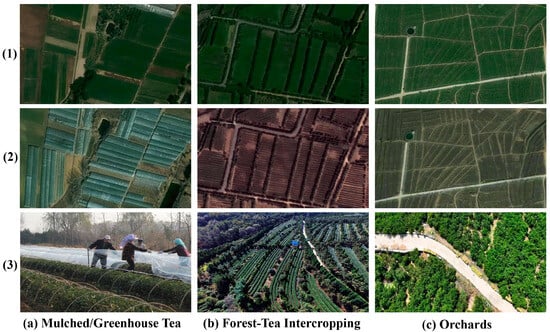
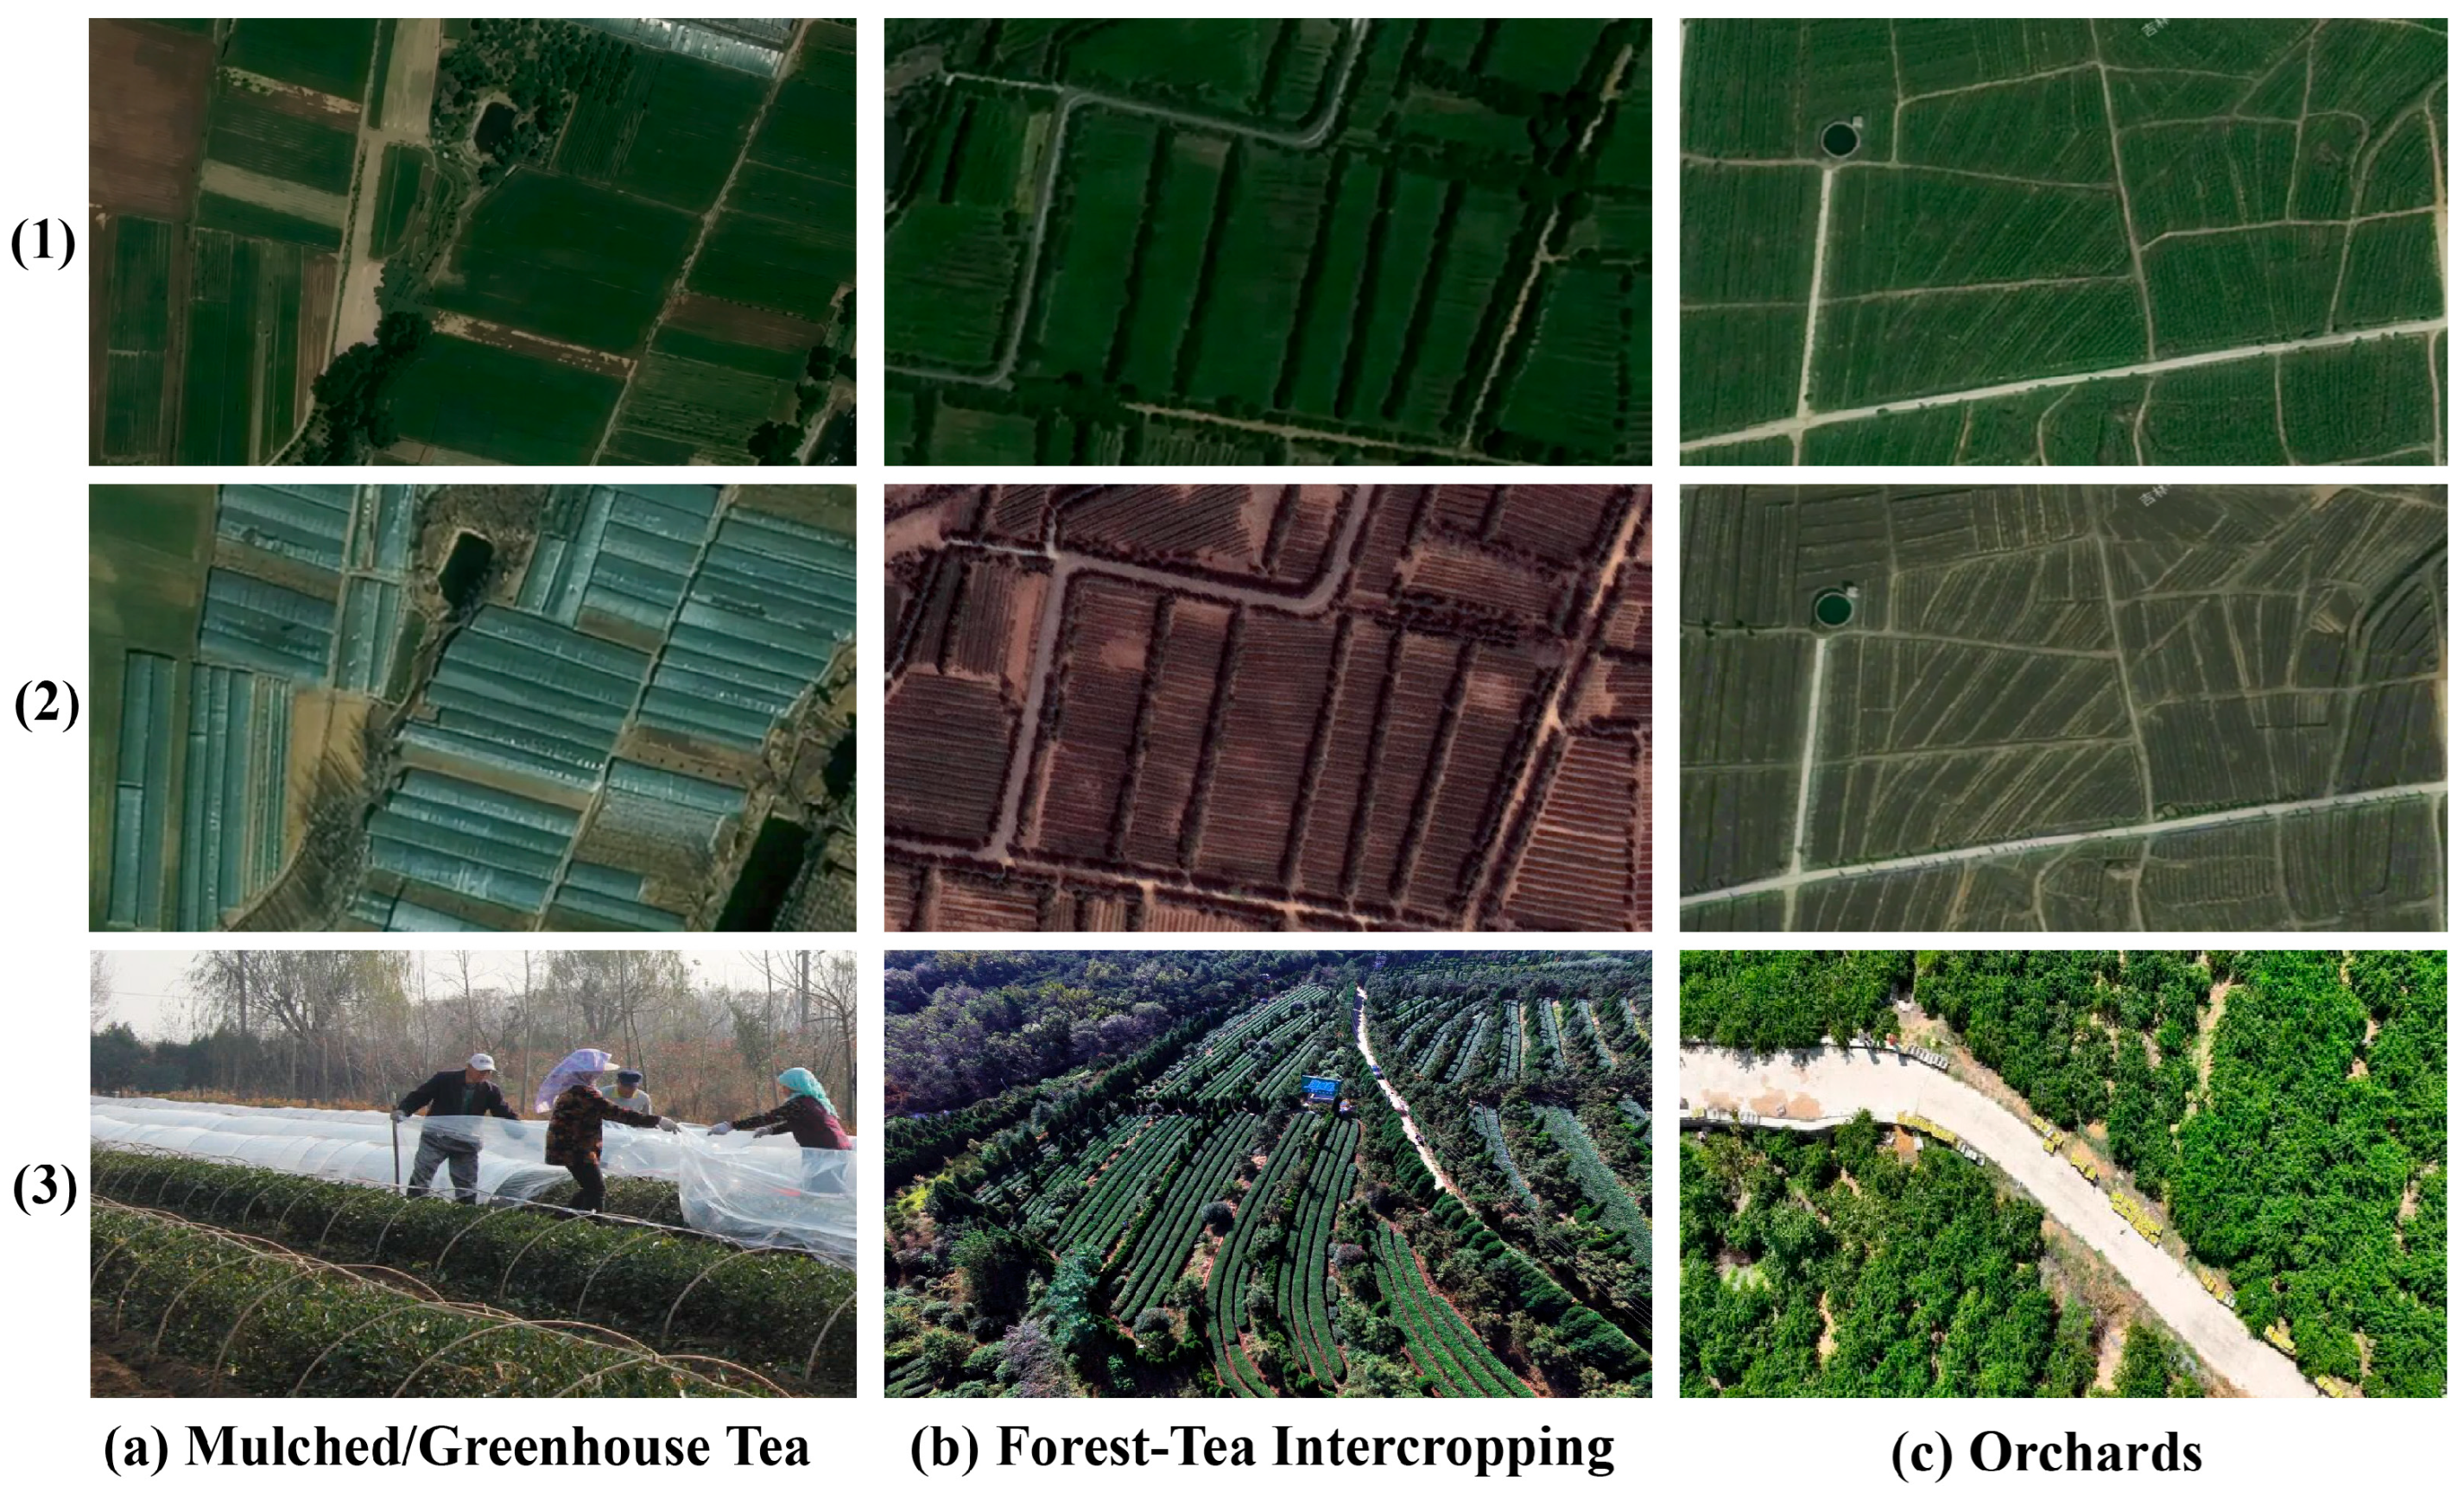
Despite the high accuracy of the model, inherent challenges remain regarding specific cultivation scenarios and the nature of foundation models. These uncertainties fall into three main categories. First, classification errors primarily stem from specific land cover complexities. Omission errors arise largely from tea cultivated under plastic greenhouses or mulch (Figure 14a), where artificial materials dominate the spectral response and obscure the vegetation signal. Additionally, complex intercropping in hilly regions creates mixed pixels (Figure 14b) where taller windbreak trees often lead to misclassification as forests. Conversely, commission errors are caused by spectrally similar evergreen crops, such as modern orchards (Figure 14c). While embeddings effectively filter deciduous crops, differentiating distinct evergreen types remains difficult without specific hard negative training samples. Second, the intrinsic limitations of foundation models present challenges that align with recent benchmarking. A primary constraint is limited temporal sensitivity. As static annual composites, AEF embeddings lack the granularity to capture rapid phenological fluctuations. This necessitates the hybrid fusion strategy used in this study, where Sentinel-2 time series serve as indispensable inputs for capturing dynamic biological signals. Another constraint is low interpretability. Unlike vegetation indices with clear biophysical meanings, the 64-dimensional embeddings are opaque features lacking explicit physical units. Although our SHAP analysis statistically inferred their roles, the lack of direct agronomic interpretability remains a hurdle for operational adoption. Third, regarding robustness and future directions, the small sample size relative to the high feature dimensionality remains a potential concern. However, the stability of the model suggests that AEF embeddings function as dense information carriers, effectively transferring generalized Earth observation knowledge to this local task. Future improvements should focus on enriching the dataset with hard negative samples of orchards and adopting imbalance-aware learning frameworks to refine decision boundaries for minority classes in heterogeneous landscapes.
Figure 14.
Key sources of classification error: (a) Mulched/Greenhouse Tea, (b) Forest-Tea Intercropping, and (c) Orchards. Rows show summer imagery (1), winter imagery (2), and field photos (3).
5. Conclusions
This study, taking Rizhao as a case study, established a comprehensive feature library integrating Sentinel-2 spectral bands, textures, topographic variables, seasonal indices, and 64-dimensional AEF satellite embedded features. Employing the Random Forest classifier, this study successfully extracted the spatial distribution of tea plantations and validated the critical role of satellite embeddings in crop mapping. The main conclusions are as follows:
The integration of AEF satellite embedding features was the single most decisive factor for model performance. Among the 12 comparative scenarios, the optimized Scenario f (APITE) achieved the optimal trade-off for agricultural resource inventory. Although other scenarios yielded marginally higher overall accuracy, Scenario f was selected for its superior accuracy (PA = 0.9747), which effectively minimized omission errors in fragmented landscapes, yielding a robust OA of 0.9269 and a Kappa coefficient of 0.9026. These embeddings provided essential discriminative power to separate evergreen tea plantations from spectrally similar vegetation by compressing multi-source observations into dense vectors.
SHAP analysis revealed that the model learned a physically interpretable decision logic. It utilized embedding features (e.g., A58) as robust “negative filters”—likely encoding latent semantics of impervious surfaces or water—to exclude non-target classes, while leveraging original spectral bands (e.g., B1, B12) to capture the unique pigmentation and water content signals of healthy tea canopies. This confirms that AEF embeddings act as a robust alternative to complex, hand-crafted feature engineering, avoiding the pitfalls of noise introduction seen in full-feature scenarios.
The AEF-driven model demonstrated exceptional transferability. Without any local retraining, the model trained on Rizhao samples was successfully applied to the Wanggezhuang Subdistrict in Qingdao. The extracted tea plantation area (10.39 km2) aligned closely with official statistics (9.66 km2), with a relative deviation of only +7.5%. This success proves that AEF features encode globally consistent phenological patterns, enabling the effective scaling of classification models from label-rich areas to label-scarce regions.
Spatially, tea plantations cluster in the southern and southwestern hilly zones of Lanshan and Donggang, led by Jufeng (36.78 km2) and Houcun (19.88 km2). Future work should prioritize expanding the sample library to validate model stability given the high feature dimensionality (p = 124). Furthermore, enriching training data with ‘hard negative’ samples, such as evergreen orchards and greenhouses, is essential to further refine decision boundaries.
Supplementary Materials
The following supporting information can be downloaded at: https://www.mdpi.com/article/10.3390/agriculture16040412/s1, Table S1: Detailed formulas and descriptions of the remote sensing indices; Table S2: Overview of all input features used for model training and classification; Table S3: Statistical mean values of multi-source features across different land cover types. References [28,29,30,31,32,33,34,35,36,37,38,39,40,41] are cited in the Supplementary Materials.
Author Contributions
Conceptualization, W.W.; methodology, W.W. and D.W.; formal analysis, W.W.; software, F.Q., A.S. and D.W.; investigation, D.W. and J.L.; writing—original draft preparation, W.W. and F.Q.; writing—review and editing, H.G., S.H. and A.S.; supervision, H.G. and S.H. All authors have read and agreed to the published version of the manuscript.
Funding
This research was funded by Natural Science Foundation of Shandong Province, grant number ZR2024QD290; Natural Science Foundation of Rizhao, grant number RZ2024ZR46; Youth Innovation Teams in Colleges and Universities of Shandong Province, grant number 2022KJ178; and Young Taishan Scholars Program of Shandong Province, grant number tsqn202103065.
Data Availability Statement
The data presented in this study are available on request from the corresponding author.
Acknowledgments
During the preparation of this manuscript, the authors used Gemini for the purposes of text refinement, translation, and code checking. The authors have reviewed and edited the output and take full responsibility for the content of this publication.
Conflicts of Interest
The authors declare no conflicts of interest.
References
- Zhou, Y.; Yang, L.; Yuan, L.; Li, X.; Mao, Y.; Dong, J.; Lin, Z.; Zhou, X. High-Precision Tea Plantation Mapping with Multi-Source Remote Sensing and Deep Learning. Agronomy 2024, 14, 2986. [Google Scholar] [CrossRef] [Scilit]
- Gao, S.; Tang, B.-H.; Huang, L.; Chen, G. Identification of tea plantations in typical plateau areas with the combination of Sentinel-1/2 optical and radar remote sensing data based on feature selection algorithm. Int. J. Remote Sens. 2024, 45, 7033–7053. [Google Scholar] [CrossRef] [Scilit]
- Kang, Y.; Chen, Z.; Li, L.; Zhang, Q. Construction of multidimensional features to identify tea plantations using multisource remote sensing data: A case study of Hangzhou city, China. Ecol. Inform. 2023, 77, 102185. [Google Scholar] [CrossRef] [Scilit]
- Xiao, P.; Qian, J.; Yu, Q.; Lin, X.; Xu, J.; Liu, Y. Identify Tea Plantations Using Multidimensional Features Based on Multisource Remote Sensing Data: A Case Study of the Northwest Mountainous Area of Hubei Province. Remote Sens. 2025, 17, 908. [Google Scholar] [CrossRef] [Scilit]
- Yao, Z.; Zhu, X.; Zeng, Y.; Qiu, X. Extracting Tea Plantations from Multitemporal Sentinel-2 Images Based on Deep Learning Networks. Agriculture 2022, 13, 10. [Google Scholar] [CrossRef] [Scilit]
- Phan, P.C.M.; Dao, D.M. Tea plantations mapping in Thai Nguyen, Vietnam using NDVI, spectral reflectance on google earth engine platform. Environ. Res. Commun. 2025, 7, 095004. [Google Scholar] [CrossRef] [Scilit]
- Parida, B.R.; Mahato, T.; Ghosh, S. Monitoring tea plantations during 1990–2022 using multi-temporal satellite data in Assam (India). Trop. Ecol. 2024, 65, 387–398. [Google Scholar] [CrossRef] [Scilit] [PubMed]
- Xiao, Y.; Huang, J.; Weng, W.; Huang, R.; Shao, Q.; Zhou, C.; Li, S. Class imbalance: A crucial factor affecting the performance of tea plantations mapping by machine learning. Int. J. Appl. Earth Obs. Geoinf. 2024, 129, 103849. [Google Scholar] [CrossRef] [Scilit]
- Shi, C.; Jiang, C.; Jiang, S.; Xie, Z. Remote sensing mapping for non-grain cultivated land at the plot scale in southern mountainous areas. Trans. Chin. Soc. Agric. Eng. 2025, 41, 289–298. [Google Scholar] [CrossRef]
- Whitcraft, A.K.; Vermote, E.F.; Becker-Reshef, I.; Justice, C.O. Cloud cover throughout the agricultural growing season: Impacts on passive optical earth observations. Remote Sens. Environ. 2015, 156, 438–447. [Google Scholar] [CrossRef] [Scilit]
- Jia, B.; Rui, S.; Helin, Z.; Yan, W.; Zhifeng, J. Tea plantation identification using GF-1 and Sentinel-2 time series data. Trans. Chin. Soc. Agric. Eng. 2021, 37, 179–185. [Google Scholar] [CrossRef]
- Tollefson, J. Google AI model creates maps of Earth ‘at any place and time’. Nature 2025, 644, 313. [Google Scholar] [CrossRef] [Scilit] [PubMed]
- Qin, Q. AlphaEarth Foundations: The Potential and Challenges of Remote Sensing Foundation Models. J. Geo-Inf. Sci. Chin. 2025, 27, 2283–2290. [Google Scholar] [CrossRef]
- Brown, C.; Kazmierski, M.; Pasquarella, V.; Rucklidge, W.; Samsikova, M.; Zhang, C.; Shelhamer, E.; Lahera, E.; Wiles, O.; Ilyushchenko, S.; et al. AlphaEarth Foundations: An embedding field model for accurate and efficient global mapping from sparse label data. arXiv 2025. [Google Scholar] [CrossRef] [Scilit]
- Dihkan, M.; Guneroglu, N.; Karsli, F.; Guneroglu, A. Remote sensing of tea plantations using an SVM classifier and pattern-based accuracy assessment technique. Int. J. Remote Sens. 2013, 34, 8549–8565. [Google Scholar] [CrossRef] [Scilit]
- Xu, W.; Huang, S.; Wu, C.; Xiong, Y.; Wang, L.; Lu, N.; Kou, W. The pruning phenological phase-based method for extracting tea plantations by field hyperspectral data and Landsat time series imagery. Geocarto Int. 2020, 37, 2116–2136. [Google Scholar] [CrossRef] [Scilit]
- Yao, Y.; Ren, H.; Liu, Y. Remote sensing estimation of winter wheat residue cover with dry and wet soil background. Agric. Water Manag. 2025, 307, 109227. [Google Scholar] [CrossRef] [Scilit]
- Zheng, B.; Campbell, J.B.; de Beurs, K.M. Remote sensing of crop residue cover using multi-temporal Landsat imagery. Remote Sens. Environ. 2012, 117, 177–183. [Google Scholar] [CrossRef] [Scilit]
- Chen, P.; Li, C.; Chen, S.; Li, Z.; Zhang, H.; Zhao, C. Tea Cultivation Suitability Evaluation and Driving Force Analysis Based on AHP and Geodetector Results: A Case Study of Yingde in Guangdong, China. Remote Sens. 2022, 14, 2412. [Google Scholar] [CrossRef] [Scilit]
- Li, J.; Sun, W.; Song, H.; Li, R.; Hao, J. Toward the construction of a circular economy eco-city: An emergy-based sustainability evaluation of Rizhao city in China. Sustain. Cities Soc. 2021, 71, 102956. [Google Scholar] [CrossRef] [Scilit]
- ESA. MSI Level-2A BOA Reflectance Product. Collection 1. European Space Agency; ESA: Paris, France, 2021. [Google Scholar] [CrossRef] [Scilit]
- Huang, Z.; Wang, F.; Li, B.; Pang, Y.; Du, Z. Appropriate Nitrogen Form and Application Rate Can Improve Yield and Quality of Autumn Tea with Drip Irrigation. Agronomy 2023, 13, 1303. [Google Scholar] [CrossRef] [Scilit]
- Xia, H.; Bian, X.; Pan, L.; Li, R. Mapping tea plantation area using phenology algorithm, time-series Sentinel-2 and Landsat images. Int. J. Remote Sens. 2023, 44, 2826–2846. [Google Scholar] [CrossRef] [Scilit]
- Wei, Y.; Zhong, R.; Yang, Y. Groundwater Fluoride Prediction for Sustainable Water Management: A Comparative Evaluation of Machine Learning Approaches Enhanced by Satellite Embeddings. Sustainability 2025, 17, 8505. [Google Scholar] [CrossRef] [Scilit]
- Alvarez, C.I.; Ulloa Vaca, C.A.; Echeverria Llumipanta, N.A. Machine Learning for Urban Air Quality Prediction Using Google AlphaEarth Foundations Satellite Embeddings: A Case Study of Quito, Ecuador. Remote Sens. 2025, 17, 3472. [Google Scholar] [CrossRef] [Scilit]
- Zhang, W.; Yang, L.; Wang, Y. Prediction of changes in suitable habitats for tea plants in China’s four major tea-producing regions based on machine learning models. PLoS ONE 2025, 20, e0332382. [Google Scholar] [CrossRef] [Scilit]
- Jarvis, A.; Reuter, H.; Nelson, A.; Guevara, E. Hole-Filled SRTM for the Globe Version 3, from the CGIAR-CSI SRTM 90m Database. 2008. Available online: http://srtm.csi.cgiar.org (accessed on 4 August 2024).
- McFeeters, S.K. The use of the Normalized Difference Water Index (NDWI) in the delineation of open water features. Int. J. Remote Sens. 1996, 17, 1425–1432. [Google Scholar] [CrossRef] [Scilit]
- Xu, H. A study on information extraction of water body with the modified normalized difference water index (MNDWI). J. Remote Sens. 2005, 9, 595. [Google Scholar] [CrossRef] [Scilit]
- Zha, Y.; Gao, J.; Ni, S. Use of normalized difference built-up index in automatically mapping urban areas from TM imagery. Int. J. Remote Sens. 2003, 24, 583–594. [Google Scholar] [CrossRef] [Scilit]
- Tucker, C.J. Red and photographic infrared linear combinations for monitoring vegetation. Remote Sens. Environ. 1979, 8, 127–150. [Google Scholar] [CrossRef] [Scilit]
- Yan, E.; Wang, G.; Lin, H.; Xia, C.; Sun, H. Phenology-based classification of vegetation cover types in Northeast China using MODIS NDVI and EVI time series. Int. J. Remote Sens. 2015, 36, 489–512. [Google Scholar] [CrossRef] [Scilit]
- Huete, A.R. A soil-adjusted vegetation index (SAVI). Remote Sens. Environ. 1988, 25, 295–309. [Google Scholar] [CrossRef] [Scilit]
- Li, E.; Du, P.; Samat, A.; Xia, J.; Che, M. An automatic approach for urban land-cover classification from Landsat-8 OLI data. Int. J. Remote Sens. 2015, 36, 5983–6007. [Google Scholar] [CrossRef] [Scilit]
- Minghua, W.; Yueming, H.; Hongmei, W.; Guangsheng, L.; Liying, Y. Remote sensing extraction and feature analysis of abandoned farmland in hilly and mountainous areas: A case study of Xingning, Guangdong. Remote Sens. Appl. Soc. Environ. 2020, 20, 100403. [Google Scholar] [CrossRef] [Scilit]
- Sangpradid, S. Change vector analysis using integrated vegetation indices for land cover change detection. Int. J. Geoinform. 2018, 14, 71–77. [Google Scholar]
- Van Deventer, A.; Ward, A.; Gowda, P.; Lyon, J. Using thematic mapper data to identify contrasting soil plains and tillage practices. Photogramm. Eng. Remote Sens. 1997, 63, 87–93. [Google Scholar]
- Barnes, E.M.; Clarke, T.R.; Richards, S.E.; Colaizzi, P.D.; Kostrzewski, M.; Waller, P.; Choi, C.; Riley, E.; Thompson, T. Coincident detection of crop water stress, nitrogen status and canopy density using ground based multispectral data. In Proceedings of the 5th International Conference on Precision Agriculture, Bloomington, MN, USA, 16–19 July 2000; pp. 1–15. [Google Scholar]
- Gitelson, A.A.; Viña, A.; Ciganda, V.; Rundquist, D.C.; Arkebauer, T.J. Remote estimation of canopy chlorophyll content in crops. Geophys. Res. Lett. 2005, 32, 1–4. [Google Scholar] [CrossRef] [Scilit]
- Haboudane, D.; Miller, J.R.; Pattey, E.; Zarco-Tejada, P.J.; Strachan, I.B. Hyperspectral vegetation indices and novel algorithms for predicting green LAI of crop canopies: Modeling and validation in the context of precision agriculture. Remote Sens. Environ. 2004, 90, 337–352. [Google Scholar] [CrossRef] [Scilit]
- Daughtry, C.S.T.; Walthall, C.L.; Kim, M.S.; de Colstoun, E.B.; McMurtrey, J.E. Estimating Corn Leaf Chlorophyll Concentration from Leaf and Canopy Reflectance. Remote Sens. Environ. 2000, 74, 229–239. [Google Scholar] [CrossRef] [Scilit]
- Weiyan, X.; Rui, S.; Zhifeng, J. Extracting tea plantations based on ZY-3 satellite data. Trans. Chin. Soc. Agric. Eng. 2016, 32, 161–168. [Google Scholar] [CrossRef]
- Jha, S.K.; Brinkhoff, J.; Robson, A.J.; Dunn, B.W. Integrating Remote Sensing and Weather Time Series for Australian Irrigated Rice Phenology Prediction. Remote Sens. 2025, 17, 3050. [Google Scholar] [CrossRef] [Scilit]
- Gholinia, A.; Abbaszadeh, P. Agricultural Drought Monitoring: A Comparative Review of Conventional and Satellite-Based Indices. Atmosphere 2024, 15, 1129. [Google Scholar] [CrossRef] [Scilit]
- Breiman, L. Random forests. Mach. Learn. 2001, 45, 5–32. [Google Scholar] [CrossRef] [Scilit]
- Štrumbelj, E.; Kononenko, I. Explaining prediction models and individual predictions with feature contributions. Knowl. Inf. Syst. 2014, 41, 647–665. [Google Scholar] [CrossRef] [Scilit]
- Li, S. Rizhao Shi Chaye Zhi; Fangzhi Press: Beijing, China, 2021. [Google Scholar]
- Pasternak, M.; Pawluszek-Filipiak, K. The Evaluation of Spectral Vegetation Indexes and Redundancy Reduction on the Accuracy of Crop Type Detection. Appl. Sci. 2022, 12, 5067. [Google Scholar] [CrossRef] [Scilit]
- Houriez, L.; Pilarski, S.; Vahedi, B.; Ahmadalipour, A.; Honda Scully, T.; Aflitto, N.; Andre, D.; Jaffe, C.; Wedner, M.; Mazzola, R.; et al. Scalable Geospatial Data Generation Using AlphaEarth Foundations Model. arXiv 2025, arXiv:2508.11739. [Google Scholar] [CrossRef] [Scilit]

Disclaimer/Publisher’s Note: The statements, opinions and data contained in all publications are solely those of the individual author(s) and contributor(s) and not of MDPI and/or the editor(s). MDPI and/or the editor(s) disclaim responsibility for any injury to people or property resulting from any ideas, methods, instructions or products referred to in the content. |
© 2026 by the authors. Licensee MDPI, Basel, Switzerland. This article is an open access article distributed under the terms and conditions of the Creative Commons Attribution (CC BY) license.