


Abstract
Globally, the demand for beef and beef-related products has significantly escalated over the past decade. This study aimed to evaluate the factors influencing the market participation of smallholder beef cattle farmers in uMgungundlovu, South Africa. The study employed a cross-sectional research design, which followed a mixed-methods approach to collect data. Survey data were collected from smallholder cattle farmers from the uMgungundlovu District in KwaZulu-Natal using a semi-structured questionnaire. Purposive sampling was employed to select four local municipalities from the uMgungundlovu District out of a total of seven, whereas a simple random sampling was used to recruit farmers. The sampling was conducted using Microsoft Excel, whereby each farmer was allocated a random number, and then the required sample was generated from those numbers. To determine factors that influence farmers’ market choice, a multinomial logit regression model was used. A significant proportion of the farmers (43.1%) were aged between 51 and 70, followed by 35.5% aged 31 to 50. Just under half (48.2%) of farmers had received formal training in livestock production. This finding (p < 0.001) reinforces the central role of education in income determination. Better-educated individuals tend to earn more and diversify their income sources. This study underpinned that the livestock farming population is dominated by primarily middle-aged, male, semi-educated, and resource-poor individuals, and they rely significantly on traditional farming methods and government assistance. The multinomial logit regression revealed that farmers’ market choices are influenced by education level, extension service quality, access to quality bulls, and breeding knowledge significantly influenced farmers’ market choices. Specifically, secondary and tertiary education reduced the likelihood of participating in auction markets relative to informal markets, while limited breeding knowledge and poor extension services further constrained participation in formal channels.
1. Introduction
Globally, the demand for beef and beef-related products has significantly escalated over the past decade [1]. The major contributing country to this rise is China’s 5.1% growth in beef consumption. The increase in demand compels the beef production sector, especially the commercial sector, to intensify its operations in efforts to meet the demand [2]. For capital gains or revenue generation, an increased demand is a desired scenario, ceteris paribus. However, the beef industry is plagued with severe challenges that limit its capability to adequately meet the escalating demand. These challenges include climate change, drought, volatile consumer preferences, and socioeconomic and political factors [3]. One of the adversaries for consumers in a scenario where the demand far exceeds the supply is an increase in product prices, which is done to regulate the market. Evidently, the global beef industry adopted this traditional regulation strategy, resulting in an 8% beef price increase [2]. A rise in product prices lowers the affordability, which contradicts the pursuit of global food security. Thus, high beef prices affect the purchasing power of rural households, reducing affordability. This limits access to rich protein sources, undermining household food security. Consequently, a cycle of nutritionally vulnerable households is created. Hence, the Food and Agriculture Organization (FAO) always promotes other strategies that can advance mass production.
Many developed countries such as China, the United States, India, and European countries, including Germany, France, and Spain, invest in and promote smallholder beef cattle farming to intensify the efforts to meet the rising demand [3]. This means that there is significant market participation by smallholder beef farmers, thus strengthening the beef industry and expanding supply. For instance, recently, Australia experienced a rapid growth of its herd sizes to approximately 30 million heads produced [2]. This can be easily and hypothetically translated into an escalation in beef supply, as Australia anticipates a production growth of 16% in 2025.
Information about the underdeveloped and developing countries’ approaches for tackling the global challenge of increased demand for beef and beef-related products is poorly documented. Commonly, these countries opt for increasing the importation of the particular product in order to meet the demand. For instance, recently in South Africa, beef production increased by 7.3%, where it is significantly boosted by increased imports of live beef cattle from neighboring countries such as Botswana and Namibia [2].
In developing and underdeveloped countries, market participation by smallholder beef farmers in Sub-Saharan Africa (SSA) remains at significantly low levels [3]. The responsible factors for the poor market participation by smallholder beef farmers remain unresolved and poorly documented. Factors such as poor infrastructure, limited access to credit, and high transaction costs have been suggested as the main constraints to market participation among smallholder livestock farmers, further restricting their choices of sales channels [4]. While it is difficult to influence some of these constraint factors (age, gender, climate shocks, etc.), others can be controlled (education, training, market distance, etc.) through government interventions [5]. As a result, informal markets have remained a preference for smallholder farmers due to limited entry restrictions, although they often yield minimal returns. Thus, investigating and understanding factors that affect both participation and channel choice remains essential and relevant for designing appropriate interventions that improve commercialization and welfare outcomes of smallholder farmers.
South Africa’s trade policies, including beef import tariffs and regional livestock movement restrictions, also have implications for smallholder farmers’ market opportunities. Import controls and veterinary permit requirements play a role in protecting domestic producers from foreign competition. They potentially stabilize local beef prices and encourage smallholder participation [6]. However, disease outbreaks such as foot-and-mouth disease restrict livestock movements, especially cattle, disrupting supply chains and limiting access to formal markets. This forces smallholders to be dependent on informal or local market channels [7]. Hence, targeted policy support, such as disease-free zones and improved traceability systems, becomes crucial in helping and integrating smallholders into higher-value markets, building resilience within the livestock sector [8].
To the best of the authors’ knowledge, there is no previous research that has been conducted in the current study area investigating the factors that limit market participation by smallholder beef farmers. Consequently, evaluating the factors limiting the market participation of smallholder beef cattle is warranted in order to devise strategies to improve the situation. Therefore, the objective of this paper is to determine factors that influence smallholder beef cattle participation in the most accessible market channels in KwaZulu-Natal.
There are various types of market channels available for smallholder beef cattle farmers in South Africa. These include butcheries or abattoirs, auctions, and informal markets. Given that smallholder farmers in South Africa prioritize certain markets over others, market channels are assumed to be distinct and mutually exclusive to facilitate interpretation. Thus, the multinomial logit (MNL) framework is a suitable analytical framework. The MNL framework allows probabilities associated with each market channel to be estimated based on farmer-specific characteristics such as age, education, access to credit, and market distance. Moreover, the categorical variable allows the categorical dependent variable with two outcomes to be accommodated [9]. This framework is common in agricultural marketing studies that capture the influence of socioeconomic and institutional factors on market channel selection [10]. Therefore, it is flexible and easy to interpret for policy-oriented research that aims to improve smallholder access to formal and profitable markets.
2. Materials and Methods
2.1. Research Design and Data Collection
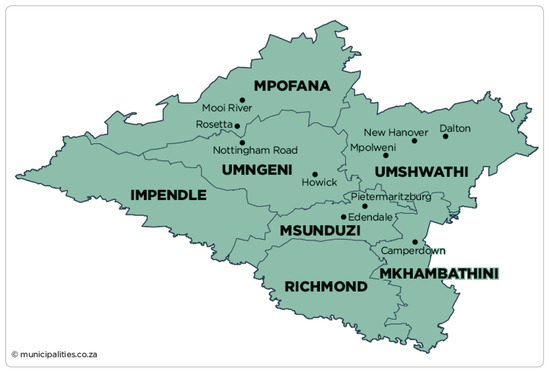
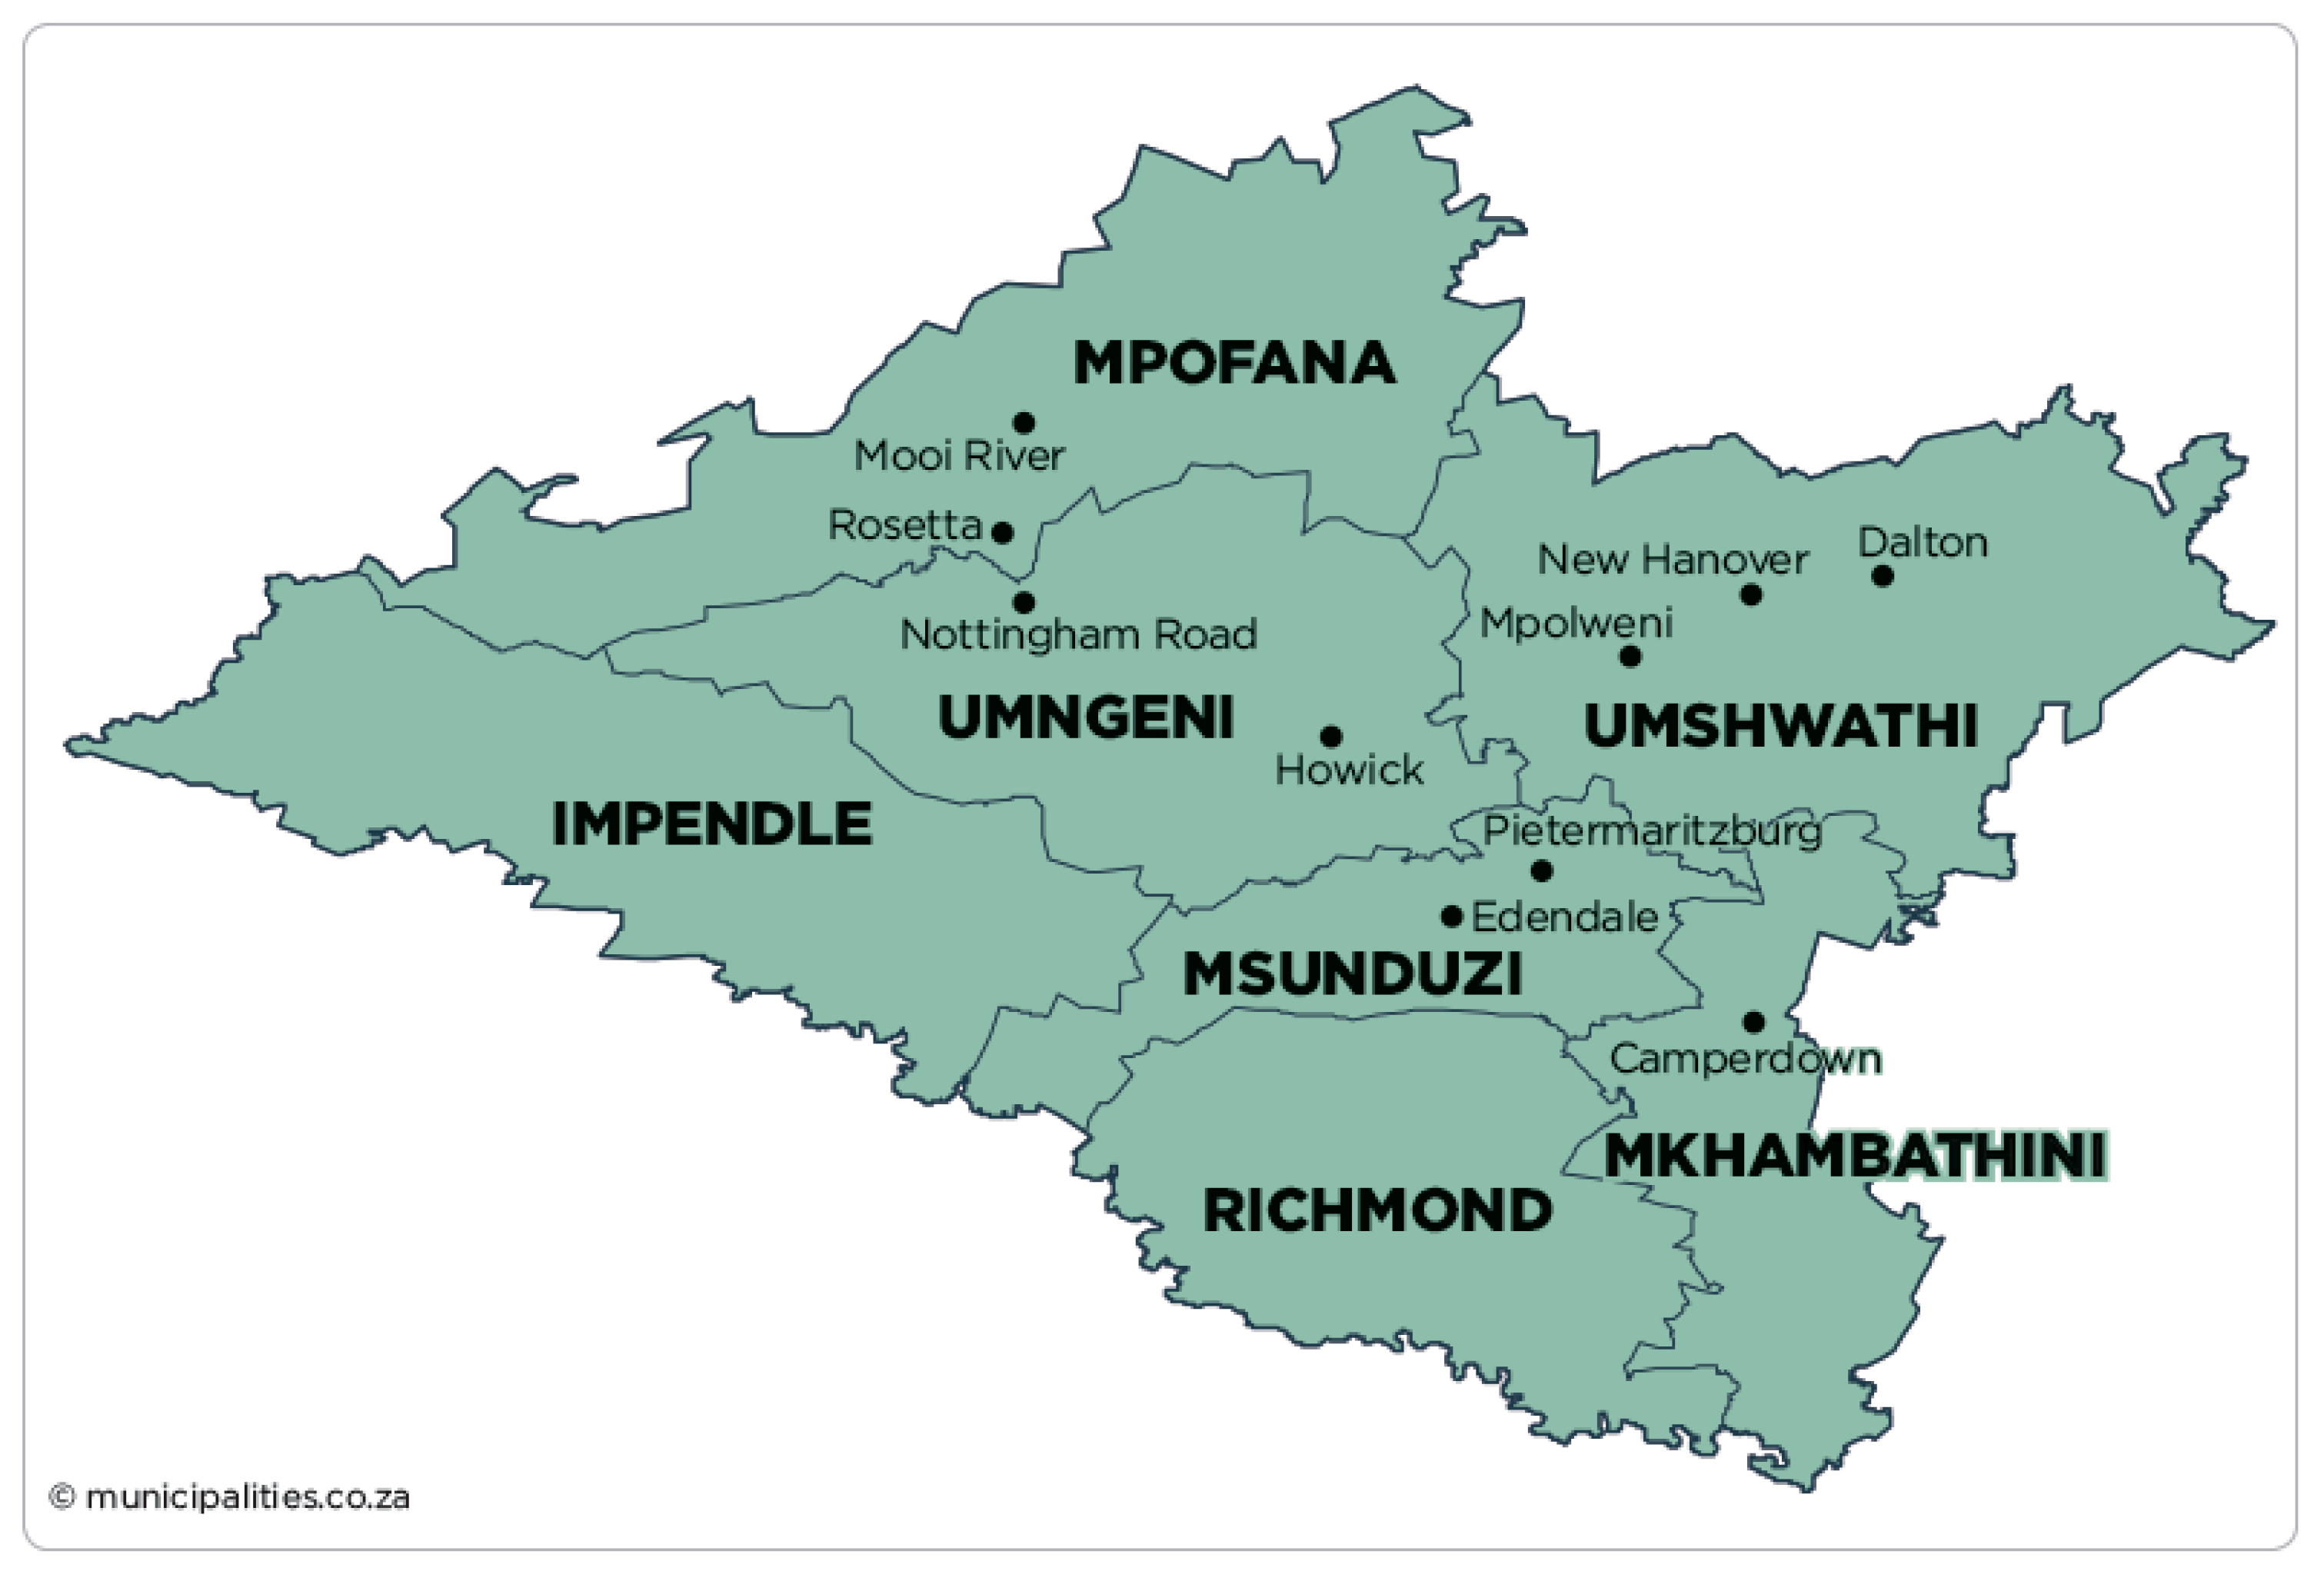
The study employed a cross-sectional research design, which followed a mixed-methods approach that combined quantitative data with qualitative field observations to collect data. Survey data were collected from smallholder cattle farmers from the uMgungundlovu District in KwaZulu-Natal using a semi-structured questionnaire. The questionnaire comprised questions on household demographics, production, market access, and institutional support. Pilot testing and expert validation were conducted to assess and ensure the reliability of the questionnaire. Purposive sampling was employed to select four local municipalities from the uMgungundlovu District out of a total of seven. The purposive sampling was based on the prevalence of smallholder cattle farmers in the area and accessibility regarding logistics. The survey with smallholder cattle farmers sought to collect the following information: household demographic information, socioeconomic status, access to credit, livestock management practices, cattle production figures, cost of production, market participation, access to training, and livelihood outcome, among others. Figure 1 depicts the geographic location of the sampled municipalities in uMgungundlovu District.
Figure 1.
Map showing local municipalities under the uMgungundlovu District. Source: Statistics South Africa [11].
2.2. Sampling Procedure and Sample Size
The target population was the smallholder livestock farmers from the uMgungundlovu District Municipality. Farmers from the selected municipalities formed the sampling frame, and the sampling unit was a household. A comprehensive list of livestock farmers was obtained from the Department of Agriculture in uMgungundlovu. A simple random sampling technique was used to recruit farmers into the study. The sampling was conducted using Microsoft Excel, whereby each farmer was allocated a random number, and then the required sample was generated from those numbers. Sample size determination was done using a formula suggested by [12]. The assumption is that if there is a large population, but the variability in the proportion of the population that will adopt the practice is unknown, it is recommended to use a p-value of 0.5 (maximum variability). The study desires a 95% confidence level and −5% precision. The resulting sample size is demonstrated in the following equation.
where n is the required sample size, p is the percentage occurrence of a state or condition, e is the percentage maximum error required, and Z is the value corresponding to the level of confidence required.
The study relied on the following eligibility criteria based on the research objectives: for recruiting respondent farmers be practicing smallholder livestock production; have access to farming land, either owning, leasing, or communal; and must start from 18 years of age to give proper information regarding farming activities.
2.3. Analytical Framework
Descriptive statistics, together with chi-squared test for association between variables, were used to characterize respondent farmers’ socioeconomic characteristics. However, to determine factors that influence farmers’ market choice, a multinomial logit regression model was used. Market types were treated as distinct and mutually exclusive alternatives to simplify analysis and facilitate interpretation. Hence, the multinomial logit (MNL) model was employable. The assumption was that farmers decide to prioritize specific markets for selling cattle, and the MNL allows for estimation of the probability of each choice conditional on farmer and farm characteristics. The multinomial logit (MNL) model estimates the probability that a farmer chooses a particular market type. The implicit multinomial model was specified as
where
- Yᵢ = Market type choice for farmer I, and the base category used for comparison was “informal markets”;
- Xᵢ = Vector of explanatory variables;
- βⱼ = Vector of coefficients for category j;
- J = Number of market alternatives.
In the full model, several independent variables were considered and are listed in Table 1. The hypothesis was that market channel choice is influenced by both socioeconomic and institutional variables [9,10].
Table 1.
List of all independent variables considered in the full model.
The minimal adequate model retained only statistically significant predictors (or those with at least one significant level). These are presented in Table 2.
Table 2.
List of independent variables retained in the final model.
3. Results and Discussion
Table 3 presents the descriptive statistics results of socioeconomic characteristics of respondents. Understanding agricultural behavior, service accessibility, and technology adoption requires an understanding of farmers’ socioeconomic traits. Significant insights into the demographic and economic circumstances of the surveyed population can be gained from the data displayed in the summary tables. While these findings provide important insights, they may not be generalizable to the entire district and should be interpreted with caution. Moreover, out of the 400 total questionnaires distributed, the respondents did not answer all the questions, leaving each variable with a varying number of responses. Thus, a column of missing values was included to indicate the total number of valid responses per variable. The analysis relied on the valid responses per variable due to the non-numeric nature of most variables, which could not allow imputation techniques for filling in missing values. Furthermore, there were no sensitivity checks to confirm that the exclusion of missing values did not significantly alter the distribution of key variables (Table 3).
Table 3.
Summary table of demographic and economic circumstances of the surveyed population.
3.1. Gender Distribution
The study revealed that 59.3% of farmers were male and 40.7% were female, reflecting a male-dominated agricultural sector. This aligns with findings from Aliber and Hart [13] and Ozor and Nnaji [14], who noted that livestock farming is male-dominated, with men having more access to production resources. However, Zuwarimwe and Kirsten [15] reported a contrasting pattern where female (58.3%) participation exceeded that of males (41.7%), highlighting contextual differences. While women remain active in agriculture, structural barriers like land ownership and access to services continue to limit their full participation.
3.2. Age Distribution
A significant proportion of the farmers (43.1%) were aged between 51 and 70, followed by 35.5% aged 31 to 50. This aging farmer population is consistent with Van Averbeke et al.’s study [16], which emphasized low youth involvement in agriculture. Only 7.7% were under 30 years, underscoring a generational gap in farming. Similar trends were noted in Turkey [17] and India [18], where older males dominate the livestock farming sector. This raises concerns about the sustainability and renewal of the agricultural labor force.
3.3. Farm Residency
The results show that the majority (86%) of farmers lived on their farms. This high on-farm residency supports effective farm management and productivity, as suggested by Fanadzo and Ncumbe [19]. Proximity to livestock and cropland enables better control of inputs and rapid response to challenges.
3.4. Educational Attainment
Approximately 47.8% of the farmers attained secondary education (Grade 8–12), while only 8.9% had tertiary qualifications. The low level of tertiary education is common in rural agricultural populations and may limit access to information and adoption of innovations [20]. Moreover, these findings are in line with studies in Oyo State, where 85% farmers had at least primary education or secondary [17,18,21,22]. This lack of tertiary education rates may limit strategic planning, financial literacy, and engagement with complex technologies.
3.5. Training in Livestock Production
Just under half (48.2%) of farmers had received formal training in livestock production. This indicates a gap in skills development, as also noted by Van Averbeke and Mohamed [23]. Kumar et al. [24] found that 44.6% of goat farmers were illiterate, indicating low baseline education levels, which often correlate with limited access to training. In addition, Mafimisebi et al. [25] linked education and training to the adoption of modern livestock technologies, reinforcing the need for targeted extension services. Moreover, Singaravadivelan et al. [26] also reported a 60% illiteracy rate among Tamil Nadu sheep farmers, suggesting that a lack of education is a common barrier in many smallholder contexts. Hence, enhancing farmer training could significantly improve livestock management practices, contributing to productivity and income gains.
3.6. Major Income Sources
Livestock sales (46.3%) and government grants (32.5%) were the primary income sources, underlining the sector’s importance to rural livelihoods. These results conquer with a study conducted in western Kenya, which revealed that 95% of their farmers rely on livestock farming as their primary livelihood. Zuwarimwe and Kirsten [15] state that smallholder farmers continue to struggle to access external funding and other resources they need to expand and grow their farms. In addition, the dependence on government support signals vulnerability and limited resilience. The problem also lies in farmers not having access to credit, reflecting financial exclusion. Makhura et al. [20] emphasized the critical role of credit in helping farmers to receive sufficient currency, regardless of income. These findings suggest that financial services are essential for unlocking farmers’ productive potential.
3.7. Child Support Grants and Household Wealth
Among those receiving child support grants, 73.5% also earned income from livestock, showing the role of agriculture in complementing social safety nets. This aligns with broader evidence that social grants are often reinvested into productive activities, thereby stabilizing household income. The results showed a substantial share of households identified as poor (58.8%) or very poor (26.1%), consistent with national rural poverty statistics [11]. Poverty constrains investment in agricultural inputs and technologies, contributing to low productivity and market exclusion.
3.8. Land Ownership and Farming Experience
Most farmers had land tenure of 5–10 years (33.5%) or 0–5 years (28%), with similar trends in farming experience. This pattern may reflect beneficiaries of land reform programs or new entrants into farming. However, short tenure duration may discourage long-term investment in infrastructure and sustainable practices [27]. In contrast, in Alabama, Tackie et al. [28] found that 82% of small livestock producers had farming experience of 30 years or less, and 48% owned over 60 acres, reflecting more stability and scale than in the current study. This suggests that while farming experience may be similar, landholding size differs markedly.
Kumar et al. [24] categorized goat farmers into landless (25.8%), marginal (54.2%), and small/semi-medium (20.0%) landholders, closely mirroring the distribution found in the present study. The prevalence of marginal farmers also supports the assertion that smallholder status limits scale and resilience. Singaravadivelan et al. [26] reported that most migratory sheep farmers had over 20 years of experience and were small to marginal dryland farmers, further supporting the link between long farming experience and small landholding. Moreover, Mafimisebi et al. [25] emphasize that land ownership and farming experience directly impact the adoption of modern farming technologies. The short tenure in the current study could therefore hinder innovation adoption.
3.9. Cattle Breed
In the current study, indigenous cattle breeds made up 77.4% of herds, a preference largely attributed to their resilience, adaptability, and low-input requirements traits that make them well-suited to the resource-constrained environments in which many smallholder farmers operate [29]. This trend aligns with findings from Nigeria, where Yakubu et al. [30] observed that smallholder farmers with lower education levels favored indigenous breeds due to their ease of management and ability to thrive under poor nutritional conditions. Similarly, in Ethiopia, Kassie et al. [5] found that more educated cattle buyers were willing to pay a premium for traits such as disease resistance and traction potential, suggesting that education influences not just breed preference but also an appreciation for economically valuable traits. The high proportion of indigenous breeds in the current study may therefore reflect both practical adaptation to local environmental challenges and limitations in farmer education or access to genetic improvement programs. In contrast, in Tanzania, smallholder livestock keepers with formal education were more likely to adopt improved dairy and beef breeds compared to those with no formal education [31].
3.10. Land Size
Nearly half (47.7%) of respondents in the current study farmed on less than two hectares, reflecting a dominance of smallholder farming that limits economies of scale, mechanization, and diversification. This pattern is consistent with findings from Van Averbeke et al. [16] in Kenya and Van Averbeke and Mohamed [23] in South Africa, both of whom observed that small land sizes constrain income and productivity. Similarly, Vandre et al. [32] reported that 35% of farmers in Madhya Pradesh held 1–2 hectares, with 7.2% being landless, while Kumar et al. [24] highlighted a high prevalence of marginal and landless goat farmers, demonstrating the widespread nature of land constraints in developing countries. In contrast, Tackie et al. [28] found that nearly half of small livestock producers in Alabama owned more than 60 acres, suggesting that larger landholdings in developed contexts may enhance resilience, productivity, and capacity for modern farming practices.
3.11. Chi-Squared Test of Association Among Sociodemographic Factors
The Chi-squared test of association among sociodemographic factors is presented in Table 4.
Table 4.
Chi-squared test of association among Sociodemographic factors.
3.11.1. Marital Status and Age Group
The relationship between marital status and age group was found to be statistically significant (p < 0.001), which was expected. Younger individuals are more likely to be single or unmarried, while older individuals are more likely to be married or widowed. This finding aligns with population demographic trends across rural contexts in Sub-Saharan Africa [11]. Age is a critical factor in marital status, with different age groups exhibiting varying marriage patterns. According to Spaull [33], younger individuals may delay marriage due to educational or career pursuits, while older age groups may experience higher rates of marriage or remarriage. Clark and Brauner-Otto [34] state that the timing of marriage can also affect long-term health outcomes, with early marriages sometimes linked to higher mortality risks. In addition, younger age groups are more likely to be single or never married, while marriage rates tend to increase with age, peaking in the middle age groups before declining slightly in later years due to widowhood [35]. In many developing countries, early marriage remains common, particularly among women, though this trend is gradually changing with increased educational attainment and economic participation. Older age groups are more likely to include divorced or widowed individuals, especially among women, due to higher male mortality rates [34].
3.11.2. Marital Status and Household Head
Although the relationship between marital status and household headship in this study is not statistically significant at the conventional 5% level (p = 0.059), it does approach significance, indicating a potential association that merits attention. This finding aligns only partially with the broader literature, which consistently identifies marital status as a strong predictor of household headship. For instance, Hunter [36] emphasized that married individuals are more likely to assume headship roles due to entrenched traditional family structures that prioritize spousal co-residence and joint decision-making authority.
3.11.3. Marital Status and Education Level
The significant association (p < 0.001) between marital status and education level suggests that individuals with different educational backgrounds may marry at different rates or ages. Prior studies have shown that higher education often delays marriage [36], which may be a contributing factor here. Education level significantly influences marital status, with higher education often associated with delayed marriage. This delay is attributed to prolonged educational pursuits and the desire for compatibility in spouse selection [37]. Individuals with higher educational attainment are more likely to marry later, but their marriages tend to be more stable [38]. This is often attributed to the delaying effect of prolonged schooling and career establishment, as well as improved communication and problem-solving skills among the more educated [39]. Additionally, higher education levels are associated with greater selectivity in marital decisions and a lower likelihood of divorce. Conversely, those with lower educational levels tend to marry earlier but also have higher rates of marital dissolution [40].
3.11.4. Marital Status and Formal Employment
The significant association (p = 0.01) suggests that formal employment status may influence or be influenced by marital roles. Married individuals may be more likely to seek or maintain formal jobs due to household responsibilities, though this effect is also mediated by gender roles and regional labor market dynamics. Employment status itself can influence marriage decisions, with higher income levels and stable employment being associated with a greater inclination towards marriage, reflecting economic stability and independence [41]. Marital status significantly correlates with employment patterns. Married individuals are often more likely to be formally employed compared to their unmarried counterparts. This association may be attributed to greater financial responsibilities among married people, which incentivize stable employment [42]. Moreover, married men tend to experience a “marriage premium” in earnings, possibly due to employer perceptions of increased stability and responsibility [43]. Conversely, unmarried individuals, especially single women, may face structural labor market disadvantages and caregiving responsibilities that limit access to formal employment opportunities [44].
3.11.5. Age Group and Household Head
This significant association (p = 0.004) is intuitive. Older individuals are more likely to be household heads, while younger respondents may reside within extended family arrangements. This is consistent with South African census data showing that headship increases with age [11]. Older individuals are more likely to be household heads, as age is often linked to greater life experience, financial stability, and authority within family structures [45]. In South Africa, the General Household Survey shows that household heads are typically aged between 35 and 59 years, with fewer heads under 30 years old [11]. This reflects the global pattern of delayed household formation, often due to extended education, urban migration, or unstable employment among youth [46].
3.11.6. Age Group and Education Level
The highly significant result (p < 0.001) may reflect generational changes in access to education. Younger respondents are more likely to have reached higher levels of schooling due to post-apartheid educational reforms [33]. Younger cohorts tend to have higher levels of formal education than older cohorts, particularly in developing countries, due to improvements in school infrastructure, government funding, and reduced gender disparities in education [33]. This trend mirrors global patterns where access to education has expanded over time, particularly for women [47].
3.11.7. Age Group and Household Income Bracket
These results reveal an association (p = 0.018) that indicates that age is linked to income differences. Older individuals may accumulate more assets or income sources over time or may qualify for pensions or grants, while younger farmers may have more limited economic capacity. Younger age groups typically earn less due to limited work experience and entry-level job positions [48]. Studies show that older women or individuals in rural areas may earn less despite their age due to cumulative disadvantages in labor markets and limited access to pensions [48].
3.11.8. Household Head and Formal Employment
The strong association (p < 0.001) between household headship and formal employment implies that formal income sources could elevate individuals to household leadership roles. This is particularly relevant in rural settings where income diversity is limited. Higher education levels are associated with better employment opportunities and reduced poverty risk. For instance, in Turkey, households with heads who have higher education levels are less likely to be poor, and vocational or technical education can be more beneficial than general high school education in certain regions [49]. The education level of household heads is a critical factor influencing formal employment. Higher education levels are associated with better employment opportunities and reduced poverty risk. For instance, in Turkey, households with heads who have higher education levels are less likely to be poor, and vocational or technical education can be more beneficial than general high school education in certain regions [49]. Similarly, in Vietnam, results revealed that formal employment is more accessible to those with higher education, reducing poverty risk [50].
3.11.9. Education Level and Formal Employment
The significant relationship (p < 0.001) between education and formal employment confirms long-standing findings that higher educational attainment is linked to better access to the formal labor market [51]. Formal education significantly enhances the likelihood of securing formal employment. A study conducted in Nepal reveals that individuals with tertiary education are more likely to be employed in the formal sector compared to those with only primary or secondary education [37]. This trend is consistent over time, although the strength of the relationship between lower levels of education and formal employment has decreased [37]. Moreover, a study conducted in China states that a correlation between education and urban employment has evolved, with higher education levels increasingly necessary for employment growth [52]. In addition, a study conducted in Gorontalo Province, Indonesia, revealed that education level positively influences income in both formal and informal sectors, highlighting the importance of education across different employment types [53].
3.11.10. Education Level and Household Income Bracket
This finding (p < 0.001) reinforces the central role of education in income determination. Better-educated individuals tend to earn more and diversify income sources. This aligns with economic theories on human capital and findings from South African labor market analyses [46]. The education level within a household, particularly the highest educational attainment, is positively correlated with household income. This is supported by studies from China, which show that higher family education levels lead to increased household income [52]. The education of the household head is a significant determinant of household income, with higher education levels leading to better financial decision making and income growth [52].
3.11.11. Formal Employment and Household Income Bracket
A significant relationship (p = 0.008) exists between formal employment and income. Formal jobs provide stable and often higher incomes than informal or subsistence-based livelihoods, supporting improved household economic outcomes. The results are consistent with a study conducted in Sukabumi, which revealed that individuals in formal employment earn more than those in informal sectors, highlighting the income disparity between these sectors [37]. Bilenkisi et al. [49] also concur that there is a relationship between formal employment and income, and it is also influenced by education, as higher education levels facilitate access to formal employment, which in turn enhances household income.
The descriptive results reveal a farming population that is male-dominated, aging, and largely dependent on livestock sales and government support. Moreover, there are low levels of education and training, while landholding sizes remain small. These characteristics collectively suggest limitations in participating in markets, as well as a preference for informal market channels.
3.12. Multinomial Logit Regression Model Results: Market Participation Analysis
Table 5 below presents the final results of the multinomial logit model. The model assessed factors affecting the market choice of beef cattle smallholder farmers. A total of 251 valid responses (n = 251) were used in the multinomial logit (MNL) model after excluding missing data across all relevant variables. The dependent variable, market type, was modeled against various socioeconomic factors, which were selected based on the literature. The informal market type was used as a reference category. Thus, the model compared the likelihood of choosing to sell in informal markets relative to selling in auction markets and selling in butcheries. Before estimating the multinomial logit model, variance inflation factors were calculated to assess the presence of multicollinearity, and values less than two were obtained, indicating no serious collinearity among key variables.
Table 5.
Multinomial logit results of factors influencing market choice.
The table below (Table 6) presents the full multinomial logit regression model results with the raw coefficients, standard s, z-values, p-values, and confidence intervals. There were 251 valid responses (n = 251) that were used in the multinomial logit (MNL) model after excluding missing data across all relevant variables. The asterisks (*) indicate statistically significant variables (p < 0.05). The following were reference (base) categories for categorical predictors: Education Level: Grade 1–7, Extension Service Quality: 50–75, Gender: F, Market Distance Category: Inbreeding, Age Group: 18–30.
Table 6.
Full multinomial logit regression model results of the factors influencing market participation.
The variables that were statistically significant in predicting the market choice by farmers were education, lack of access to quality bulls, limited breeding knowledge, and extension service quality. Grade 8–12 and tertiary education level reduced the likelihood of participating in auction markets. This means that farmers who had obtained these qualifications were likely to participate in auction markets compared to farmers who did not have formal education. Moreover, farmers with lack of access to quality bulls and limited breeding knowledge had lower likelihood of participating in auctions compared to farmers with access to quality bulls. This means that not having access to quality bulls and having limited breeding knowledge reduces the chance of participating in auction markets. Auction markets are competitive and based on certain traits. Thus, breeding knowledge is crucial to increase participation in auction markets.
The results indicate that secondary and tertiary education reduce the likelihood of auction participation relative to informal markets, which was unexpected. This is due to the general belief that education improves market competitiveness. This could be a reflection of educated farmers’ choosing stability in informal or direct-sale markets and avoiding the pressure associated with selling at auctions. Similarly, the negative coefficient for access to quality bulls may be explained by resource-rich farmers choosing to keep superior bulls for improving their herd rather than resorting to immediate sales. This limits participation in the auction.
Moreover, poor extension services also reduce the chance of selling directly to butcheries. This means that farmers who have access to poor extension services have a lower chance of selling directly to butcheries compared to farmers with quality extension services. Thus, poor extension services increase the likelihood of participating in informal markets. Therefore, education level, distance-related challenges, and extension service quality significantly influence market participation. While a higher level of education is related to a preference for informal markets over formal markets, poor extension service support also discourages participation in formal channels such as auctions and butcheries.
4. Conclusions and Recommendations
This study underpinned that the livestock farming population is primarily middle-aged, male, semi-educated, and resource-poor, and they rely significantly on traditional farming methods and government assistance. Productivity and income diversification are hampered by most farmers’ marginal landholding circumstances and lack of formal training. These results highlight the pressing need for focused policy changes. The expansion of extension services to enhance knowledge transfer, youth-focused agricultural initiatives to draw and keep younger generations, and land reform laws that guarantee long-term tenure to encourage investment are some of the main recommendations. Furthermore, increasing productivity within indigenous systems should be the top priority of livestock development strategies, and educational programs should raise awareness of the economic potential of livestock. Improving marginal farmers’ livelihoods and empowering them will require improved access to markets, credit, and financial literacy.
With significant ramifications for policy and development planning, these findings highlight the intricate and interconnected nature of demographic and economic characteristics. Education is shown to be a significant factor in determining employment and income outcomes, underscoring the necessity of ongoing investments in easily accessible, high-quality education. Because different age groups face different opportunities and challenges in the labor market, employment strategies should be age-responsive. Development initiatives aimed at households must consider the complex ways that household headship, marital status, and educational attainment influence socioeconomic well-being, going beyond crude standards. Furthermore, taking gender into account is crucial, especially when figuring out how women’s participation in formal employment and leadership is impacted by marital status and household duties. Therefore, a more intersectional approach is required to guarantee that policies adequately address the layered.
The study revealed that market choice is influenced by education level, access to quality breeding resources, breeding knowledge, and the quality of extension services. Education is more likely to influence farmers to participate in auction markets, indicating the role that education plays in equipping farmers with the skills and confidence to engage in more competitive market environments. Moreover, limited access to quality bulls and insufficient breeding knowledge reduced farmers’ likelihood of participating in auctions, emphasizing the significant role of both resources and technical know-how in meeting market standards. Furthermore, farmers are discouraged from selling directly to butcheries by poor extension services. Therefore, both human and institutional factors are important in shaping smallholder farmers’ access to formal marketing channels.
Therefore, the study identifies education, extension quality, and market distance as key determinants of market participation and channel choice. The results contribute towards a documented gap in South African smallholder livestock commercialization literature by producing empirical evidence from KwaZulu-Natal. This is important for policymakers to plan interventions
To enhance smallholder farmers’ participation in formal markets, focus should be placed on improving access to breeding resources, strengthening farmer education, and upgrading extension service delivery. Moreover, training programs should target farmers’ education through breeding knowledge and market requirements, capacitating farmers with skills to compete in auction markets. Interventions should also focus on the improvement of quality bulls through breeding programs, communal bull schemes, or artificial insemination services. In addition, extension services should be strengthened through capacity building, regular farmer visits, and improved market-oriented advisory support. There is also a need to improve the efficiency of markets for smallholder beef cattle farmers through facilitating access to quality markets for essential inputs such as feed and veterinary services. Improvements in post-harvest infrastructure, such as storage facilities and transportation networks, are also crucial in minimizing spoilage and optimizing the supply chain and should be a major focus. Moreover, ensuring pricing transparency should be at the center of interventions that promote smallholder farmers’ participation in various market channels.
A limitation of the study is that data were collected from only four municipalities, and this has implications for its generalizability. Therefore, future research will benefit from extending the analysis to the entire district and including longitudinal data to capture dynamic changes. Moreover, the extent to which trade policies are transmitted to smallholder farmers on the ground would yield interesting results.
Author Contributions
Conceptualization, R.S.M., G.M., U.C. and O.L.; Methodology, R.S.M. and O.L.; Formal Analysis, R.S.M. and O.L.; Data Curation, R.S.M., G.M., U.C. and O.L.; Writing—Original Draft Preparation, R.S.M.; Writing—Review and Editing, R.S.M., G.M., U.C. and O.L.; Supervision, G.M. and U.C.; Project Administration, O.L. All authors have read and agreed to the published version of the manuscript.
Funding
This research received no external funding.
Institutional Review Board Statement
The study was conducted in accordance with the Declaration of the University of South Africa and approved by the College of Agriculture and Environmental Sciences Health REC (REC-170616-051 Ref #: 2024/CAES_HREC/4982).
Data Availability Statement
The data presented in this study are available upon request from the corresponding author due to privacy.
Conflicts of Interest
The authors declare no conflicts of interest.
References
- Chung, R.H.; Hadi, S.N. Assessment of total factor productivity and methane efficiency of beef cattle producers worldwide. Agric. Syst. 2025, 226, 104334. [Google Scholar] [CrossRef] [Scilit]
- Red Meat Industry Services (RMIS). Red Meat Industry Strategy 2030—Shortened Final Report; Red Meat Industry Services: Pretoria, South Africa, 2024. [Google Scholar]
- Chibanda, M.; Ortmann, G.F.; Lyne, M.C. Institutional and governance factors influencing the performance of selected smallholder agricultural cooperatives in KwaZulu-Natal. Agrekon 2009, 48, 293–315. [Google Scholar] [CrossRef] [Scilit]
- Adams, S.; Sibanda, M.; Turner, S. Smallholder Market Participation and Constraints in Southern Africa: A Review of Infrastructure, Credit Access, and Transaction Costs. J. Agric. Dev. 2010, 12, 45–58. [Google Scholar]
- Kassie, M.; Shiferaw, B.; Muricho, G. Adoption and impact of improved maize production technologies on household welfare in Ethiopia. Food Policy 2010, 35, 313–321. [Google Scholar] [CrossRef] [Scilit]
- Bahta, S.T. The Effect of the South African Trade Policy Regime on the Beef and Maize Sub-Sectors. Master’s Thesis, University of the Free State, Bloemfontein, South Africa, 2004. [Google Scholar]
- Brouwer, A. Multi-Market Analysis of the Impact of Trade Restrictions on Importing Live Animals into South Africa. Master’s Thesis, University of Pretoria, Pretoria, South Africa, 2006. [Google Scholar]
- Department of Agriculture, Land Reform and Rural Development. A Profile of the South African Beef Market Value Chain; Department of Agriculture, Land Reform and Rural Development: Pretoria, South Africa, 2021. [Google Scholar]
- Nxumalo, K.K.S.; Oduniyi, O.S.; Antwi, M.A.; Tekana, S.S. Determinants of market channel choice utilised by maize and sunflower farmers in the North West province, South Africa. Cogent Soc. Sci. 2019, 5, 1678451. [Google Scholar] [CrossRef] [Scilit]
- Munyati, V.T.I.; Mudhara, M.; Sikhulumile, S. Determinants of the Market Channel Choice by Smallholder Maize Farmers in Zimbabwe: A Case of the Mazowe District. S. Afr. J. Agric. Ext. 2025, 53, 100–118. [Google Scholar] [CrossRef] [Scilit]
- Statistics South Africa (Stats SA). Community Survey 2016: Statistical Release; Statistics South Africa: Pretoria, South Africa, 2016. [Google Scholar]
- Gill, J.; Johnson, P.; Clark, M. Research Methods for Managers, 4th ed.; SAGE Publications Ltd.: London, UK, 2010. [Google Scholar]
- Aliber, M.; Hart, T.G.B. Should subsistence agriculture be supported as a strategy to address rural food insecurity? Agrekon 2009, 48, 434–458. [Google Scholar] [CrossRef] [Scilit]
- Ozor, N.; Nnaji, C. Difficulties in adaptation to climate change by farmers in Enugu State, Nigeria. J. Agric. Ext. 2010, 14, 106–122. [Google Scholar] [CrossRef] [Scilit]
- Zuwarimwe, J.; Kirsten, J. Social networks and rural non-farm enterprise development and implication for poverty reduction among rural households in Zimbabwe. J. Geogr. Reg. Plan. 2010, 3, 106–122. [Google Scholar]
- Van Averbeke, W.; Denison, J.; Mnkeni, P.N.S. Smallholder irrigation schemes in South Africa: A review of knowledge generated by the Water Research Commission. Water SA 2011, 37, 797–808. [Google Scholar] [CrossRef] [Scilit]
- Özdemir, M.G. Sustainable Agriculture and Climate Resilience in Türkiye: A Comprehensive Analysis; Qeios: London, UK, 2024. [Google Scholar] [CrossRef] [Scilit]
- Devaki, K.; Mathialagan, P.; Sabarathnam, V.E.; Kumaravel, P.; Karthickeyan, S.M.K. An analysis of socioeconomic profile of traditional animal husbandry practices adopting farmers of Tamil Nadu. Int. J. Sci. Environ. Technol. 2016, 5, 3237–3244. [Google Scholar]
- Fanadzo, M.; Ncube, B. Challenges and opportunities for revitalising smallholder irrigation schemes in South Africa: A review. Water SA 2018, 44, 436–447. [Google Scholar] [CrossRef] [Scilit]
- Makhura, M.T.; Goode, F.M.; Coetzee, G.K. Indexing participation in the market economy through factor analysis: Implications for food security. Agrekon 1997, 36, 473–483. [Google Scholar] [CrossRef] [Scilit]
- Olorunnisomo, O.A.; Olubowale, A.O.; Adesina, M.A. Socio-economic characteristics of cattle farmers and their perception of commercial milk production in three agricultural zones of Oyo State. J. Agric. For. Soc. Sci. 2010, 8, 1–9. [Google Scholar] [CrossRef] [Scilit]
- Reddy, V.K.; Mahajan, G.R.; Paramesh, V.; Singh, N.P. Socio-economic status of livestock farmers of Ibrahimpur village, North Goa district: A benchmark analysis. Econ. Aff. 2017, 62, 335–340. [Google Scholar] [CrossRef] [Scilit]
- Van Averbeke, W.; Mohamed, S.S. Smallholder farming styles and development policy in South Africa: The case of Dzindi Irrigation Scheme. Agrekon 2006, 45, 136–157. [Google Scholar] [CrossRef] [Scilit]
- Kumar, S.; Dixit, A.K.; Singh, K.M. Constraints in goat farming in India: A case study of Bihar. Agric. Econ. Res. Rev. 2015, 28, 271–279. [Google Scholar]
- Mafimisebi, T.E.; Onyeka, U.P.; Ayinde, I.A.; Ashaolu, O.F. Analysis of farmer-specific socio-economic determinants of adoption of modern livestock management technologies by farmers in Southwest Nigeria. J. Food Agric. Environ. 2006, 4, 183. [Google Scholar]
- Singaravadivelan, A.; Kumaravelu, N.; Vijayakumar, P.; Sivakumar, T. An economic analysis of migratory sheep production system in Tamil Nadu, India. J. Anim. Health Prod. 2019, 7, 58–64. [Google Scholar] [CrossRef] [Scilit]
- Lahiff, E. ‘Willing buyer, willing seller’: South Africa’s failed experiment in market-led agrarian reform. Third World Q. 2007, 28, 1577–1598. [Google Scholar] [CrossRef] [Scilit]
- Tackie, D.N.O.; Bartlett, J.R.; Nunoo, N.I. Do socioeconomic factors matter in acreage owned and acreage farmed by small livestock producers in Alabama? J. Agric. Sci. 2019, 11, 1–13. [Google Scholar] [CrossRef] [Scilit]
- Mapiye, C.; Chimonyo, M.; Dzama, K.; Raats, J.G.; Mapekula, M. Opportunities for improving Nguni cattle production in the smallholder sector of South Africa. Livest. Sci. 2009, 124, 196–204. [Google Scholar] [CrossRef] [Scilit]
- Yakubu, A.; Dahloum, L.; Gimba, E.G. Smallholder cattle farmers’ breeding practices and trait preferences in a tropical Guinea savanna agro-ecological zone. Trop. Anim. Health Prod. 2019, 51, 1497–1506. [Google Scholar] [CrossRef] [Scilit]
- Kitole, F.A. Smallholders livestock keepers breeding choice and its implication on poverty reduction in Tanzania. J. Agric. Ext. Rural. Dev. 2022, 14, 45–53. [Google Scholar]
- Vandre, R.K.; Joshi, S.; Thakur, M.S.; Tantia, M.S.; Sharma, R.; Singh, A.P.; Pandey, A.; Khare, V.; Sharma, M.; Khan, A. Assessment of socio-economic status of farmers and distribution of buffalo population in the Mahakaushal region of Madhya Pradesh. J. Anim. Res. 2021, 11, 711–716. [Google Scholar] [CrossRef] [Scilit]
- Spaull, N. Poverty & Privilege: Primary School Inequality in South Africa; Centre for Development and Enterprise: Johannesburg, South Africa, 2013. [Google Scholar]
- Clark, S.; Brauner-Otto, S.R. Health and the Timing of Marriage in Sub-Saharan Africa. Demogr. Res. 2015, 32, 1313–1342. [Google Scholar] [CrossRef] [Scilit]
- Cherlin, A.J. The Marriage-Go-Round: The State of Marriage and the Family in America Today; Vintage Books: New York, NY, USA, 2010. [Google Scholar]
- Hunter, M. Love in the Time of AIDS: Inequality, Gender, and Rights in South Africa; Indiana University Press: Bloomington, IN, USA, 2010. [Google Scholar]
- Bolli, T.; Parajuli, M.N.; Renold, U. Changes in the relationship between formal education and formal employment sector in Nepal between 1995 and 2014. J. Educ. Res. 2019, 9, 49–73. [Google Scholar] [CrossRef] [Scilit]
- Martin, S.P. Trends in marital dissolution by women’s education in the United States. Demogr. Res. 2006, 15, 537–560. [Google Scholar] [CrossRef] [Scilit]
- Schwartz, C.R.; Mare, R.D. Trends in educational assortative marriage from 1940 to 2003. Demography 2005, 42, 621–646. [Google Scholar] [CrossRef] [Scilit] [PubMed]
- Amato, P.R. Research on divorce: Continuing trends and new developments. J. Marriage Fam. 2010, 72, 650–666. [Google Scholar] [CrossRef] [Scilit]
- Harsono, I.; Sutanto, H.; Zuhroh, S.; Arisanti, I.; Erliana, Y.D. The Influence of Socio-Economic Factors on Marriage Patterns in Indonesia: A Quantitative Analysis of the Relationship Between Social Status and Marriage Decisions; Universitas Mataram: Mataram, Indonesia, 2024; Volume 1, pp. 33–39. [Google Scholar]
- Kposowa, A.J. Marital status and suicide in the National Longitudinal Mortality Study. J. Epidemiol. Community Health 2000, 54, 254–261. [Google Scholar] [CrossRef] [Scilit] [PubMed]
- Antonovics, K.; Town, R. Are all the good men married? Uncovering the sources of the marital wage premium. Am. Econ. Rev. 2004, 94, 317–321. [Google Scholar] [CrossRef] [Scilit]
- Budig, M.J.; England, P. The wage penalty for motherhood. Am. Sociol. Rev. 2001, 66, 204–225. [Google Scholar] [CrossRef] [Scilit]
- Chant, S. Gender, Generation and Poverty: Exploring the “Feminisation of Poverty” in Africa, Asia and Latin America; Edward Elgar Publishing: Cheltenham, UK, 2007. [Google Scholar]
- Van der Berg, S. What the Annual National Assessments Can Tell Us About Learning Deficits over the Education System and the School Career; University of Stellenbosch: Stellenbosch, South Africa, 2015. [Google Scholar]
- UNESCO. Global Education Monitoring Report—Gender Report: A New Generation: 25 Years of Efforts for Gender Equality in Education; UNESCO: Paris, France, 2020. [Google Scholar]
- Posel, D.; Rogan, M. Gendered trends in poverty in the post-apartheid period, 1997–2006. In The Oxford Companion to the Economics of South Africa; Bhorat, H., Hirsch, A., Kanbur, R., Ncube, M., Eds.; Oxford University Press: Oxford, UK, 2012; pp. 303–310. [Google Scholar]
- Bilenkisi, F.; Gungor, M.S.; Tapsin, G. The impact of household heads’ education levels on the poverty risk: The evidence from Turkey. Educ. Sci. Theory Pract. 2015, 15, 337–348. [Google Scholar]
- Duc, N.N.; Tin, L. The Impact of Household Head Labor Status and Worker Characteristics on Household Poverty: Evidence in Vietnam. J. East. Eur. Cent. Asian Res. (JEECAR) 2022, 9, 432–446. [Google Scholar]
- Bhorat, H.; Cassim, A.; Tseng, D. Higher Education, Employment, and Economic Growth: Exploring the Interactions; Labour Market Intelligence Partnership (LMIP) Report No. 5; Human Sciences Research Council: Pretoria, South Africa, 2014. [Google Scholar]
- Liu, S. The impact of higher education expansion on the labor force absorption capacity for college graduates in China. In Proceedings of the 6th International Conference on Economic Management and Green Development; Zhang, Y., Li, H., Eds.; Springer: Berlin/Heidelberg, Germany, 2023; pp. 1047–1056. [Google Scholar] [CrossRef] [Scilit]
- Banini, B.R.; Saleh, S.E.; Payu, B.R. Analisis Faktor Sosial Demografi terhadap Tenaga Kerja Provinsi Gorontalo. Econ. Rev. J. 2024, 3, 904–923. [Google Scholar] [CrossRef] [Scilit]

Disclaimer/Publisher’s Note: The statements, opinions and data contained in all publications are solely those of the individual author(s) and contributor(s) and not of MDPI and/or the editor(s). MDPI and/or the editor(s) disclaim responsibility for any injury to people or property resulting from any ideas, methods, instructions or products referred to in the content. |
© 2026 by the authors. Licensee MDPI, Basel, Switzerland. This article is an open access article distributed under the terms and conditions of the Creative Commons Attribution (CC BY) license.