


Abstract
Rural organic wastes are spatially dispersed across agricultural production areas and settlements, creating challenges for collection, treatment, nutrient recovery, and return to agricultural land. This study developed a township-scale spatial planning framework integrating waste quantification, centralized and decentralized composting, nutrient recovery, and techno-economic assessment in Beiyang Township, eastern China. Agricultural residues were allocated to five centralized composting reactors, whereas household kitchen waste was treated using decentralized bins. Machine-learning models estimated total carbon (TC) and total nitrogen (TN) retention under three composting-adoption scenarios. The defined study area was estimated to generate approximately 8745 t yr−1 of rural organic waste, 82.8% of which originated from agricultural production. Under the high-adoption scenario, with 70% of agricultural waste and 75% of kitchen waste composted, retained TN was equivalent to approximately 27.9% of annual local crop N fertilizer demand on a total-N basis. Economic performance improved with increasing waste participation. Under the baseline scenario, four centralized reactors and the decentralized system were financially viable, whereas one reactor was non-viable. Under the moderate- and high-adoption scenarios, all configurations achieved positive NPVs and IRRs above the 10% benchmark rate. The framework supports coordination of rural organic-waste treatment, nutrient recycling, and sustainable agricultural land management at the township scale.
1. Introduction
Rural organic waste management has become an important component of China’s transition towards sustainable agriculture and a circular economy [1]. Large quantities of crop residues, livestock manure, and household food waste are generated across spatially dispersed villages, whereas collection, transportation, and treatment infrastructure remain uneven [2,3,4,5]. Evidence from 100 villages across five Chinese provinces showed that waste collection services were considerably more common than transportation and formal disposal services, leaving many rural communities dependent on uncontrolled dumping, burial, or open burning [6]. More broadly, circular-economy research and infrastructure in rural areas remain less developed than those in urban regions, despite the potential to convert locally generated organic residues into fertilizers, soil amendments, bioenergy, and other secondary resources [7,8]. Rural waste management should therefore be regarded not only as a pollution-control problem but also as a spatial planning and resource-recovery challenge [9]. Appropriate treatment systems need to accommodate differences in waste composition, generation intensity, transport distance, settlement pattern, administrative capacity, and local demand for recovered products [10].
Composting is among the most accessible biological technologies for stabilizing biodegradable waste and returning organic matter and plant nutrients to agricultural soils [4,11]. Reviews of nutrient-recovery technologies identify composting and vermicomposting as established approaches for recovering carbon and nutrients from agricultural and food-system residues [12]. Consequently, the benefits of composting cannot be inferred solely from the quantity of waste diverted from disposal [13]. Nutrient retention during treatment, product quality, operational energy and material requirements, avoided collection and disposal burdens, and the potential substitution of compost for mineral fertilizers collectively determine the performance of a composting system [14]. These considerations are particularly important in rural areas, where feedstocks are heterogeneous, waste sources are geographically dispersed, and agricultural residues are generated seasonally.
Composting systems can generally be organized into centralized and decentralized pathways [15]. Centralized facilities can achieve economies of scale, professional process control, and more consistent quality assurance, but they require sufficient feedstock aggregation and may incur substantial collection and transportation costs [16]. Decentralized or community-scale composting reduces transport requirements and facilitates the local reuse of compost; however, its successful operation depends on source separation, household participation, suitable siting, odor and leachate control, technical support, and clearly assigned operational responsibility [17,18]. A benefit–cost decision model developed for decentralized composting similarly demonstrates that economic, environmental, operational, social, and regulatory factors need to be evaluated jointly, rather than assuming that small-scale treatment is inherently sustainable [19]. The complementary advantages of these two pathways suggest that rural regions may benefit from hybrid systems [16]. Concentrated and relatively homogeneous agricultural residues can be treated at centralized facilities, whereas dispersed household food waste can be processed closer to its point of generation.
Nevertheless, an important implementation gap remains at the township scale. Previous studies on agricultural waste recycling in rural China have demonstrated the value of material-flow analysis and environmental management accounting for farm-level decision-making [20,21]. Recent composting assessments have also highlighted the importance of explicitly defining capital expenditure, operating expenditure, recovered-product revenues, baseline treatment conditions, greenhouse-gas accounting boundaries, and key sensitivity parameters [22]. However, rural waste quantification, spatial allocation, centralized–decentralized technology selection, nutrient-retention estimation, and investment appraisal are frequently addressed as separate research questions. This fragmentation limits the capacity of township governments to determine how much waste can realistically be captured, where treatment facilities should be located, which waste streams should be treated centrally or locally, how much compost and nutrients can be recovered, and under what participation, subsidy, and market conditions a proposed system becomes financially viable [23]. Moreover, integrated assessments that combine centralized and decentralized composting arrangements under alternative rural adoption scenarios remain limited.
This study addresses the challenge of coordinating spatially dispersed rural organic-waste streams with suitable composting infrastructure and local agricultural nutrient demand. Using Beiyang Township in eastern China as a case study, an integrated framework was established to link spatial waste inventories, centralized and decentralized composting configurations, carbon and nitrogen retention, and techno-economic performance under different adoption scenarios. The framework provides a quantitative basis for assessing the potential of differentiated composting strategies to support nutrient recycling and sustainable agricultural land management at the township scale.
2. Materials and Methods
2.1. Study Area and Analytical Framework
Beiyang Township is located in Huangyan District, Taizhou City, Zhejiang Province, eastern China (Figure S1) [24]. It covers an administrative area of 112.54 km2 and had a resident population of 33,222 at the end of 2019. Population data were obtained from official statistics (http://www.stats.gov.cn/). The township comprises 12 villages or communities characterized by spatially heterogeneous agricultural production and household distribution.
Although Beiyang Township was selected as the administrative and planning context, the detailed spatial assessment focused on Urban–Rural Living Lab (URLL), situated in the central part of the township and covering approximately 80% of its administrative area [25,26]. The township-wide population of 33,222 was used to describe the broader administrative setting, whereas the URLL planning inventory covered 22,122 residents (Table SN1.7). The waste-generation inventory, composting-system configuration, and scenario assessments therefore refer to this defined study area rather than the complete township administrative territory. The area coverage is approximate and should not be interpreted as the proportion of the township population represented.
The analytical framework consisted of five sequential modules (Figure 1): (1) construction of a spatially explicit rural organic waste inventory; (2) definition of alternative composting-adoption scenarios; (3) allocation of agricultural and kitchen waste to centralized and decentralized composting systems; (4) estimation of compost production and total carbon (TC) and total nitrogen (TN) retention; and (5) techno-economic and sensitivity analyses. Agricultural residues were assigned to centralized tower composting reactors (CRs), whereas household kitchen waste was assigned to decentralized composting bins (CBs). The analysis was conducted at the village and reactor-site levels and subsequently aggregated to the township level.
Figure 1.
Comprehensive methodological framework including (a) rural waste classification, (b) scenario design analysis, (c) composting technology evaluation, (d) nutrient-recovery analysis and (e) economic benefit analysis.
2.2. Rural Organic Waste Inventory and Spatial Classification
A multidimensional classification framework was used to identify rural waste streams suitable for composting (Figure 2). Waste was classified according to four dimensions: human activity, production scale, generation location, and waste source. Human activities were divided into agricultural production activities and daily-life activities. According to production scale, waste was classified as centralized production waste or decentralized production waste. Generation locations included villages, households, farms, and public facilities. The principal biodegradable waste streams included crop residues, vegetable residues, livestock manure, and kitchen waste.
Figure 2.
Multi-dimensional classification framework for rural waste based on human activities, production scale, specific locations, and waste sources.
Only biodegradable agricultural and household waste streams were included in the subsequent composting assessment. Industrial waste, recyclable inorganic materials, and other non-compostable fractions were excluded. Pig manure was considered a co-composting material in the centralized reactor system but was not assigned a separate scenario-specific composting fraction.
Agricultural waste generation was estimated separately for rice straw, citrus peel, wild-rice residues, sugarcane bagasse, and other vegetable residues. The spatial distribution of cultivated land was obtained from the authors’ previous study [27] and is reproduced in Figure SN1.3 of the Supplementary Materials for completeness and reference. The village-level distribution of centralized and decentralized agricultural residues is provided in Table SN1.3. The annual generation of each agricultural waste type was estimated by combining the cultivated area with its crop-specific waste-generation coefficient.
The estimated residue-generation coefficients were 429.1, 370.1, 1866.8, 1822.5, and 1129.6 kg mu−1 for rice straw, citrus residues, sugarcane bagasse, water bamboo residues, and vegetable residues, respectively. These coefficients were derived from crop yields, residue-generation fractions, and crop-specific collection factors, as detailed in Table SN1.2 of the Supplementary Materials. Kitchen waste generation was estimated separately using a per-capita generation rate of 0.14 kg person−1 day−1.
Agricultural waste was further classified according to whether it originated from concentrated or dispersed production sources. Waste from larger farms and concentrated agricultural production areas was considered more readily collectable and suitable for centralized treatment. Previous studies have highlighted that the scattered distribution of agricultural residues, fragmented farmland ownership, and relatively high collection and transportation costs can substantially constrain biomass recovery from smallholder farming systems [28,29]. To account for these logistical constraints, a conservative accessibility factor of 0.30 was assumed for agricultural residues generated from decentralized production sources, whereas an accessibility factor of 1.0 was applied to centralized production sources. This factor was applied in addition to the crop-specific collection coefficients presented in Table SN1.2 and represents the assumed proportion of physically collectable residues that could realistically be aggregated for centralized composting. The value of 0.30 was adopted as a planning assumption rather than a locally measured collection rate.
Kitchen waste generation was estimated for the 22,122 residents included in the URLL planning inventory (Table SN1.7), using a rural per-capita generation rate of 0.14 kg person−1 day−1 [3]. Multiplication by 365 days yields approximately 1130.4 t yr−1 of household kitchen waste. The additional organic waste from public facilities listed in Table SN1.8 was estimated at approximately 375.3 t yr−1, giving a total of approximately 1506 t yr−1 after rounding. The larger township population of 33,222 was not used in this calculation, and no additional population correction factor was applied. Kitchen waste generated by households and relevant public facilities was allocated to the corresponding village or community. All waste quantities were converted to tonnes per year before the scenario analysis.
The resulting inventory contained the annual quantity, waste source, production scale, and spatial location of each waste stream. These data were used to construct the waste-flow analysis and determine the amount of material available for centralized and decentralized composting.
The waste-generation quantities presented in this study are model-based planning estimates rather than direct measurements of all waste streams. Their precision is limited by uncertainties in cultivated areas, crop-specific residue-generation and collection coefficients, population coverage, and per-capita kitchen-waste generation rates. Accordingly, aggregate and waste-stream totals are presented as rounded planning estimates, while unrounded intermediate values were retained in the underlying calculations. These rounded figures should not be interpreted as statistical confidence bounds.
2.3. Scenario Design and Composting System Configuration
The three scenarios were designed to represent different levels of composting adoption rather than to predict future adoption rates. S1 was defined as the baseline scenario using composting fractions reported for rural China [30,31]. S2 represented a moderate expansion of composting participation, whereas S3 represented a high-adoption scenario for assessing the potential benefits and financial implications of wider implementation. The S2 and S3 fractions were selected as planning assumptions to examine the response of nutrient recovery and economic performance to increasing waste participation. The midpoint values of the specified ranges were adopted consistently in subsequent calculations.
Scenario S2 represented a moderate increase in composting adoption. The assumed composting fractions were 40% for agricultural waste and 45% for kitchen waste. Scenario S3 represented a high-adoption condition, under which 70% of agricultural waste and 75% of kitchen waste were treated. Although Table 1 presents possible ranges for S2 and S3, the midpoint values shown in parentheses were used in all subsequent calculations.
Table 1.
Specific explanations and values for three composting ratio scenarios.
For each scenario, the amount of waste allocated to composting was calculated by applying the corresponding composting fraction to the estimated waste generation. The 30% collection factor was additionally applied to agricultural residues generated from decentralized production sources. For kitchen waste, the scenario-specific composting fraction was assumed to represent the combined effects of household participation, source separation, collection, and actual use of the composting system.
A 10-year assessment horizon was adopted to maintain a consistent economic comparison between centralized composting reactors and decentralized composting bins. This period corresponds to the assumed service life of the equipment in the financial model. All capital investments, annual operating cash flows, and terminal residual values were evaluated within this common period. The assumed service life represents a model parameter, and the resulting economic indicators should be interpreted accordingly. All scenario parameters were held constant during the 10-year assessment period.
Agricultural residues were allocated to centralized tower composting reactors based on the treatment system described by Liu et al. [32], detailed parameters can be found in Table S1 of the Supplementary Materials. Kitchen waste was allocated to decentralized composting bins based on the system evaluated by Colón et al. [33], detailed parameters can be found in Table S2 of the Supplementary Materials. This allocation reflected the relatively concentrated and seasonal generation of agricultural residues and the spatially dispersed generation of household kitchen waste.
Potential locations for the centralized composting reactors were evaluated using ArcGIS (ArcGIS Desktop 10.5) and environmental and accessibility criteria based on the approach described in [34]. Five suitable locations, designated R1–R5, were selected. The site-selection criteria and associated distance and slope thresholds are provided in Table SN1.1, while the GIS-based screening and site-selection procedure is illustrated in Figure SN1.2.
Following site selection, agricultural-residue availability was estimated at the village level using the spatial distribution of cultivated land and crop-specific residue-generation coefficients (Table SN1.3). The seasonal availability of different residue types was further estimated using their monthly generation patterns (Table SN1.4). Based on these estimated feedstock quantities, seasonal patterns, and the assumed composting-adoption rates under S1–S3, scenario-specific operating arrangements were developed for the five reactors. The corresponding feedstock compositions and monthly operating schedules are presented in Tables SN1.5 and SN1.6.
The resulting arrangements represent scenario-based feedstock and treatment-capacity planning rather than an optimized assignment of individual waste sources to specific reactors. In particular, no explicit source-to-reactor allocation model based on minimum transport distance, transport cost, or tonne-kilometres was implemented. Therefore, the proposed reactor configurations should not be interpreted as transport-optimal solutions.
The feedstocks processed in the centralized reactors included locally generated agricultural residues, pig manure, and calcium superphosphate. To facilitate reactor operation and reduce variation in compost quality, each reactor was assumed to process only one type of crop residue per month. Each crop residue was composted separately with pig manure and calcium superphosphate. The feedstock ratios and their reference basis are provided in Table SN1.5, while the scenario-specific monthly operating plans for the five reactors are provided in Table SN1.6. Additional reactor specifications are provided in Supplementary Note S1.
The centralized composting reactors were modeled using a uniform nominal treatment cycle of 10 days, based on the adopted reactor specifications (Table S1). Although the crop-residue types, co-composting ratios, and predicted TC and TN loss rates varied among feedstocks, feedstock-specific treatment durations were not explicitly incorporated into the capacity calculations. The assumed cycle was therefore used as a common operational parameter for planning purposes rather than as a demonstrated maturity period for every agricultural residue.
Kitchen waste was treated using decentralized composting bins located within the corresponding villages or communities. The number of bins required under each scenario was calculated by dividing the amount of kitchen waste allocated to composting by the annual treatment capacity of one bin. The technical specifications and calculation procedure for the composting bins are provided in Supplementary Note S1, while the scenario-specific numbers of bins required for villages/communities and public facilities are provided in Tables SN1.7 and SN1.8, respectively.
2.4. Prediction of TC and TN Contents in Produced Organic Fertilizers
TC and TN can be lost during composting through carbon dioxide, methane, ammonia, nitrous oxide, and other gaseous or leachate pathway [4,35]. These losses reduce the organic matter and nutrient content of the final compost. Direct experimental information was unavailable for several locally important agricultural residues, particularly citrus peel and wild-rice residues. Machine-learning models were therefore developed using data extracted from published composting studies.
The TC-loss dataset comprised 128 observations obtained from 26 publications, while the TN-loss dataset contained 131 observations obtained from 27 publications. When numerical values were reported only in figures, the data were extracted using DigitizeIt. All observations were standardized to represent the percentage loss of the initial TC or TN mass. The complete datasets, original publications, variable definitions, measurement units, and data-extraction procedures are provided in Tables S3 and S4.
Based on the literature analysis, four variables were selected as model inputs: initial moisture content, initial C/N ratio, ventilation rate, and calcium superphosphate addition rate [36,37]. TC loss and TN loss were used as the corresponding target variables.
The TC-loss and TN-loss datasets comprised 128 and 131 observations collected from 26 and 27 publications, respectively. Each dataset was randomly divided at the individual-observation level into training (80%) and testing (20%) subsets, without grouping by publication or experimental study. Three machine-learning algorithms, including random forest (RF), gradient boosting (GB), and extra-trees regression (ETR), were implemented using the scikit-learn library in Python (3.12) with default hyperparameter settings. These models were selected because previous studies demonstrated their applicability to predicting composting maturity, process performance, and related composting indicators [37,38,39,40]. No additional hyperparameter tuning was performed. Model performance was evaluated using R2, RMSE, and MAE. Based on the test-set performance, GB and ETR were selected for predicting TC and TN losses, respectively.
Representative agricultural waste samples were collected in Beiyang Township between November 2022- February 2023 and analyzed to determine the physicochemical characteristics required as model inputs. The analytical methods and measured physicochemical properties of the local feedstocks are provided in Tables SN2.1 and SN2.2, respectively. The measured moisture content and C/N ratio, together with the assumed ventilation rate and calcium superphosphate addition rate of the reactor system, were entered into the selected models. The predicted TC and TN loss rates for the agricultural feedstocks are reported in Table SN2.3.
For kitchen waste, TC and TN loss rates were obtained directly from previous studies because more relevant composting observations were available. The assumed TC and TN losses during kitchen waste composting were 44.2% and 34.4%, respectively [41,42]. The final moisture content of the compost was assumed to be 30% [23].
The retained TC and TN masses were calculated by applying the corresponding predicted or literature-derived loss rates to the initial elemental masses of the feedstocks. Final compost production was estimated from the feedstock mass balance and standardized to a moisture content of 30%. The detailed parameters are provided in Supplementary Note S1. Specific performance results of TC and TN through three different models are shown in Table 2. It compares the predictive performance of three machine-learning algorithms for estimating TC and TN losses during composting. This comparison was conducted to identify suitable models for estimating nutrient retention in locally generated agricultural residues for which direct experimental loss data were unavailable. Based on the test-set performance, GB was selected for TC-loss prediction and ETR for TN-loss prediction. The selected models were subsequently applied to estimate the TC and TN retained in compost under the three treatment scenarios.
Table 2.
Specific performance results of TC and TN through three different models.
2.5. Estimation of Local Crop Nitrogen Demand and Nutrient Recycling Potential
To evaluate the potential contribution of compost-derived nitrogen to local agricultural production, the annual nitrogen (N) fertilizer demand of cropland in Beiyang Township was estimated based on the cultivated area of the major crops and their corresponding N fertilizer application rates. The major crops considered were rice, citrus, wild rice, sugarcane, and vegetables, consistent with the agricultural waste inventory used in this study.
The annual N fertilizer demand of crop i was calculated as:
where Ndemand,i is the annual N fertilizer demand of crop i (kg N yr−1), Ai is the cultivated area of crop i (ha), and Fi is the corresponding N fertilizer application rate (kg N ha−1 yr−1). The crop-specific nitrogen fertilizer application rates and corresponding cultivated areas used to estimate the annual crop nitrogen demand are provided in Table S5 of the Supplementary Materials. The total annual N fertilizer demand within the township was calculated as:
where n represents the number of crop categories included in the analysis. Cultivated areas were derived from the spatial crop-distribution dataset described in Section 2.2. The potential contribution of recovered compost N to local crop N demand was subsequently calculated for each composting scenario as:
where RN is the potential N recycling ratio (%), and Ncompost is the total amount of nitrogen retained in compost produced by the centralized composting reactors and decentralized composting bins under each scenario (kg N yr−1).
Ndemand,i = Ai × Fi
This indicator compares total nitrogen retained in the produced compost with the estimated annual crop nitrogen fertilizer demand. It represents a theoretical nutrient-recycling potential on a total-N basis; plant-available nitrogen and actual mineral-fertilizer substitution are not quantified.
To examine the sensitivity of the estimated nitrogen recycling potential to variations in nitrogen retention, a deterministic one-at-a-time sensitivity analysis was conducted under Scenario S3. The baseline amount of total N retained in compost was varied by ±10% and ±20%, while annual crop N fertilizer demand and other parameters were held constant. The calculation procedure and results are provided in Supplementary Note S3 and Table SN3.1.
2.6. Techno-Economic Assessment
A facility-level techno-economic assessment was conducted separately for the five centralized composting reactors (R1–R5) and the township-wide decentralized composting-bin (CB) system under Scenarios S1–S3. The analysis adopted a 10-year, after-tax discounted-cash-flow framework, corresponding to the assumed service life of the equipment. Year 0 represented the initial capital investment, while all annual operating cash inflows and outflows were assumed to occur at the end of each year. Within each scenario, annual waste throughput, compost output, selling price, unit operating costs, subsidy rate, and depreciation were assumed to remain constant over the project life. The economic input parameters are presented in Table 3 and Table 4, while their corresponding literature references, calculation bases, and underlying assumptions are summarized in Table S6 of the Supplementary Materials. Inflation, price escalation, working capital, and equipment replacement during the assessment period were not considered.
Table 3.
Economic input parameters for the centralized composting-reactor systems under Scenarios S1–S3.
Table 4.
Economic input parameters for the decentralized composting-bin system under Scenarios S1–S3.
The economic assessment focused on the direct financial feasibility of the proposed composting systems rather than a comprehensive socioeconomic cost–benefit analysis. Three indicators were employed to evaluate financial performance: NPV, IRR, DPP. NPV was used to quantify the discounted net financial benefit over the assessment period, IRR was used to evaluate investment profitability relative to the benchmark discount rate, and DPP was used to assess the timing of capital recovery. These indicators are commonly employed in techno-economic evaluations of waste-treatment and resource-recovery system [23,43].
For the centralized reactor system, the initial capital investment I0 included equipment purchase and installation. Annual cash operating expenditure consisted of electricity, labor, and other raw-material costs. Electricity consumption was calculated separately for R1–R5 according to the annual quantity of waste processed, while annual labor expenditure was fixed at USD 5400 per reactor. Reactor revenue consisted of the market-equivalent value of the compost produced and the agricultural-residue treatment subsidy:
where REVCR,t is the annual revenue of a centralized reactor in year t; Pc is the compost selling price (USD 77.4 t−1); Qc,t is annual compost output; Ps is the agricultural-residue treatment subsidy (USD 54.2 t−1) and QAw,t is the annual quantity of agricultural residues processed.
REVCR,t = PcQc,t + PsQAw,t
For the decentralized CB system, initial capital investment was calculated by multiplying the unit purchase price of a composting bin by the number of bins required under each scenario. Annual cash operating expenditure was calculated from the quantity of kitchen waste treated and the unit treatment cost:
where ct is the unit treatment cost of USD 4.2 t−1. QKw,t is the annual quantity of kitchen waste processed. The treatment cost represented water use, pre-composting, and other routine treatment inputs. The decentralized composting-bin system was assumed to be operated by trained residents under a community-based management arrangement without direct wage payments. Accordingly, no paid labor expenditure was included in the baseline financial assessment. Nevertheless, routine operation, monitoring, cleaning, and maintenance require labor inputs, and the associated opportunity costs of residents’ time were not monetized in the present analysis. Revenue from the CB system was calculated as:
OPEXCB,t = ctQKw,t
REVCB,t = PcQc,t
No direct operating subsidy was assigned to the CB system because the corresponding public funding was assumed to support demonstration, training, and system promotion rather than generate project-level cash revenue.
Income tax was calculated using a rate of 25%. Depreciation was treated as a non-cash expense and was used only to determine taxable income. It was therefore not included in cash operating expenditure and was added back when calculating after-tax operating cash flow. Taxable income, income tax, and after-tax operating cash flow were calculated as follows:
where TIt is taxable income, REVt is total annual revenue, OPEXt is cash operating expenditure, Dt is annual depreciation, Taxt is income tax, and OCFt is after-tax operating cash flow. When taxable income was negative, income tax was set to zero; tax-loss refunds and loss carry-forwards were not considered.
TIt = REVt − OPEXt − Dt
Taxt = max(0, τTIt)
OCFt = TIt − Taxt + Dt = REVt − OPEXt − Taxt
For the centralized reactors, annual depreciation and residual value were treated as separate source-based economic parameters. Annual depreciation was held at the values reported in Table 3 and affected project cash flow only through the income-tax calculation. Residual value represented the independently estimated after-tax recovery value of the equipment at the end of year 10 and was not used to recalculate annual depreciation. Thus, the depreciation values should not be interpreted as straight-line depreciation calculated from (I0 − SV)/10.
For the CB system, annual depreciation was calculated by multiplying the rounded depreciation of USD 13.8 bin−1 yr−1 by the number of bins under each scenario. The CB residual value was assumed to be zero. Accordingly, the project cash flow was defined as:
where SV is the terminal residual value. For the centralized reactors, the residual values reported in Table 3 were added to the year-10 cash flow. These residual values were treated as after-tax terminal recoveries, and no additional tax associated with equipment disposal was modelled. For the CB system, SV = 0.
Net present value (NPV) was calculated by discounting all project cash flows at the benchmark discount rate of 10%:
where r = 10%, Ct is the project cash flow in year t, and the project life is 10 years. Internal rate of return (IRR) was defined as the discount rate that produced an NPV of zero:
The discounted payback period (DPP) was calculated from cumulative discounted cash flow and was defined as the first year in which the cumulative discounted value became non-negative:
For the discounted payback analysis, the DPP was reported as the first complete year in which cumulative discounted cash flow became non-negative. When cumulative discounted cash flow remained negative at the end of the 10-year assessment period, the investment was classified as not recovered within the evaluation horizon. If cumulative discounted cash flow remained negative at the end of year 10, the investment was reported as not recovered within the assessment period.
A configuration was classified as financially viable when its 10-year NPV was positive and its IRR exceeded the 10% benchmark discount rate. DPP was reported as a supplementary indicator of capital-recovery timing rather than as an additional independent viability criterion. The economic assessment was restricted to direct facility-level financial performance rather than a comprehensive socioeconomic cost–benefit analysis. For the centralized reactors, the financial model included equipment purchase and installation, electricity consumption, paid labor, and operating materials, whereas external waste-collection infrastructure, transportation expenditures, and land acquisition costs were not explicitly monetized. For the decentralized composting-bin system, equipment and routine treatment costs were included, while unpaid resident labor was excluded from financial operating expenditure. Although decentralized composting may reduce the need for long-distance waste transportation, routine operation, monitoring, cleaning, and maintenance still require labor inputs. Consequently, the financial results should be interpreted within the defined cost boundaries, and the exclusion of these additional costs may lead to optimistic estimates of financial viability and affect the comparison between centralized and decentralized composting systems.
2.7. Sensitivity and Model Interpretation Analyses
Pearson correlation analysis and SHapley Additive exPlanations (SHAP) were used to examine the effects of input variables on predicted TC and TN losses [44,45]. Pearson correlation coefficients were used to characterize the direction and strength of linear relationships between individual predictors and TC or TN loss. SHAP values were subsequently calculated for the selected machine-learning models to quantify the relative contribution of each predictor and identify possible nonlinear effects and interactions [46].
A deterministic one-at-a-time sensitivity analysis was conducted to evaluate the robustness of the economic results [47]. The analysis focused on Scenario S3 because it represented the highest composting-adoption level and produced the most favorable baseline economic results. Each selected parameter was independently increased and decreased by 20%, while all other parameters were held at their baseline values [23].
For the centralized reactors, the parameters evaluated were the agricultural-waste treatment subsidy, compost selling price, annual compost output, cost of auxiliary materials, labor cost, electricity cost, and equipment cost. For the decentralized composting-bin system, the evaluated parameters were compost selling price, annual kitchen waste throughput, treatment cost, annual compost output, and equipment cost. Sensitivity was expressed as the change in NPV relative to the corresponding baseline value. No probability distributions were assigned to the parameters; therefore, the analysis represents deterministic parameter variation rather than a probabilistic uncertainty assessment.
To assess the dependence of centralized-reactor viability on operating subsidies, a break-even subsidy (sBE) was also calculated for each reactor under S1–S3 by solving NPV(sBE) = 0 using the same 10-year discounted-cash-flow framework (10% discount rate), annual depreciation, 25% income-tax rule (zero tax on negative taxable income), and year-10 residual value described in Section 2.6. The subsidy was varied as revenue per tonne of annual agricultural residues processed while all other scenario-specific inputs were held constant. The break-even subsidy represents a model-based financial threshold rather than an observed or recommended policy rate.
3. Results
3.1. Volume Distribution of Rural Organic Waste Within the Multi-Level Classification Framework
A Sankey diagram was used to characterize the distribution of rural organic waste according to human activity, production scale, specific location, and waste stream (Figure 3). The total annual generation of rural organic waste within the defined study area was estimated at approximately 8745 t yr−1. Agricultural production was the dominant source, generating approximately 7240 t yr−1, accounting for 82.8% of the total, whereas daily-life activities contributed approximately 1506 t yr−1 (17.2%).
Figure 3.
Sankey diagram of annual rural organic-waste flows according to human activity, production scale, specific location, and waste stream in Beiyang Township (t yr−1). Values may not sum exactly because of rounding.
In terms of production scale, centralized agricultural production generated approximately 4805 t yr−1 of organic waste, representing 54.9% of the total. Decentralized production, including dispersed agricultural residues and household and public-facility kitchen waste, accounted for approximately 3941 t yr−1 (45.1%). At the spatial level, Guan’ao Village was the largest waste-generating location, producing approximately 1313 t yr−1 (15.0%), followed by Qianjiang Village (1113 t yr−1), Lianqun Village (1111 t yr−1), and Chengxie Village (1042 t yr−1). These results indicate considerable spatial heterogeneity in organic-waste generation across the study area, highlighting the importance of accounting for waste-source distribution when planning composting infrastructure and allocating treatment capacity.
Regarding waste composition, vegetable residues constituted the largest individual waste stream, with an estimated annual generation of approximately 4892 t yr−1, accounting for 55.9% of the total. This was followed by kitchen waste (1506 t yr−1, 17.2%), water bamboo leaves (806 t yr−1, 9.2%), sugarcane bagasse (714 t yr−1, 8.2%), rice straw (474 t yr−1, 5.4%), and citrus peels (353 t yr−1, 4.0%). Vegetable residues and kitchen waste together accounted for approximately 73.2% of total rural organic-waste generation. Their dominant contributions suggest that these two waste streams should receive particular attention in composting-system planning. Moreover, differences in generation scale, spatial distribution, and waste characteristics support the adoption of differentiated treatment strategies, with relatively concentrated agricultural residues allocated to centralized composting facilities and spatially dispersed kitchen waste managed through decentralized composting systems.
3.2. Organic Fertilizer Production and Retained Carbon and Nitrogen Under Different Scenarios
Figure 4a illustrates the specific locations of the five reactors, while Figure 4b–d show the organic fertilizer yield, along with its carbon and nitrogen content, for each reactor (R1 to R5) under three operational scenarios (S1, S2, and S3). The performance of each reactor varies across scenarios, highlighting the influence of different management strategies on output effectiveness.
Figure 4.
(a) Spatial distribution of reactors and comparative analysis of (b) Organic Fertilizer, (c) Carbon, and (d) Nitrogen production from composting in different scenarios across reactor sites.
Among the reactors, R5 had the highest organic fertilizer production, reaching 84,907.0, 281,329.5, and 492,313.2 kg in scenarios S1, S2, and S3, respectively. The total carbon mass of the organic fertilizer in these scenarios was 31,793.5, 105,252.5, and 185,187.4 kg, while the nitrogen content was 2539.7, 8505.3, and 14,884.0 kg. In contrast, R3 produced the lowest amount, approximately 29–33% lower than R5 across the three scenarios. Overall, the yields increased as the proportion of agricultural waste used for composting increased across all scenarios.
Figure 5a also displays the distribution of villages/communities in Beiyang Township and the amount of CBs required under the three scenarios, while Figure 5b–d detail the potential organic fertilizer production and its carbon and nitrogen content across 12 villages/communities under the same scenarios. These illustrations underscore the variation in fertilizer productivity and nutrient content based on the management strategies applied in each village.
Figure 5.
(a) The number of bins required under different scenarios in different villages and quantification analysis of (b) organic fertilizer, (c) carbon and (d) nitrogen from composting.
Marked differences in organic fertilizer production and nutrient content were observed between villages due to variations in population size and treatment options. Among the villages, Lianqun had the highest production, generating 7557.7, 19,968.7, and 33,281.2 kg under scenarios S1, S2, and S3, respectively. This corresponded to 1816.9, 4800.5, and 8000.8 kg of carbon and 111.9, 295.5, and 492.6 kg of nitrogen. Qianjiang and Lianqun villages had similar production levels. In contrast, Yijianju had the lowest yield, approximately 73.8% lower than Lianqun, with total yields of 1978.0, 5236.0, and 8726.6 kg. Xiaoliqiao village had the second-lowest production. These differences emphasize the importance of implementing tailored waste treatment strategies to improve organic fertilizer production.
3.3. Techno-Economic Performance of the Composting Systems
Figure 6a–c present the cumulative discounted cash flows of the five centralized reactors (R1–R5) and the decentralized composting-bin system (CB) over the 10-year project horizon. Initial capital investment was recorded as a cash outflow in year 0, and a discount rate of 10% was applied. For the centralized reactors, the reported residual values were added to the net cash flow in year 10. The zero line therefore represents the discounted break-even threshold.
Figure 6.
Techno-economic performance of the centralized reactors and decentralized composting-bin system under different waste-participation scenarios: cumulative discounted cash flow from year 0 to year 10 under (a) S1, (b) S2, and (c) S3; and discounted payback period (DPP) and internal rate of return (IRR) under (d) S2 and (e) S3. Year 0 represents the initial capital investment. For the centralized reactors, the reported residual value was added to the net cash flow in year 10, whereas the composting-bin system was assumed to have no residual value. A discount rate of 10% was used, and the horizontal dashed line in panels (d) and (e) indicates the 10% benchmark rate.
Under Scenario S1 (Figure 6a), financial performance differed among the five reactor sites. R1, R2, R4, and R5 achieved positive 10-year NPVs of USD 4.74, 5.86, 6.76, and 11.69 thousand, respectively. Their corresponding IRRs were 12.12%, 12.61%, 13.01%, and 15.12%, all exceeding the 10% benchmark rate. Their discounted payback periods were 9, 9, 9, and 8 years, respectively. In contrast, R3 remained economically non-viable, with an NPV of USD −6.68 thousand and an IRR of 6.86%; its cumulative discounted cash flow did not become non-negative within the 10-year project horizon. The CB system remained viable under S1, achieving an NPV of USD 6.80 thousand, an IRR of 17.97% and a DPP of 7 years. Thus, the baseline scenario did not make all centralized reactors unprofitable, but their financial margins were relatively small and site-dependent.
Under Scenario S2 (Figure 6b), all centralized reactors became economically viable. Their 10-year NPVs ranged from USD 72.41 thousand for R3 to USD 143.88 thousand for R5, while their IRRs ranged from 23.89% to 36.06%. R1, R2, R4, and R5 reached discounted break-even in year 4, whereas R3 reached discounted break-even in year 5. The CB system achieved an NPV of USD 19.36 thousand and an IRR of 18.82%, with a DPP of 7 years, respectively. These results demonstrate that increased waste participation substantially improved the financial performance of both treatment pathways.
Scenario S3 produced the highest absolute financial returns (Figure 6c). The NPVs of the five centralized reactors ranged from USD 156.22 thousand for R3 to USD 281.28 thousand for R5, and their IRRs ranged from 28.00% to 40.77%. R5 exhibited the strongest financial performance, with an NPV of USD 281.28 thousand, an IRR of 40.77%, and a DPP of 3 years. R3 remained the least profitable centralized configuration, although it was economically viable, with an NPV of USD 156.22 thousand and an IRR of 28.00%. The CB system achieved an NPV of USD 32.73 thousand and an IRR of 19.00% and its DPP was 6 years.
Figure 6d and Figure 6e compare the DPPs and IRRs under S2 and S3. All five centralized reactors achieved higher IRRs than the CB system under both scenarios. R5 achieved the highest IRR under both scenarios; its DPP was 4 years under S2 and 3 years under S3. R3 had the lowest IRR and longest DPP among the centralized reactors, with a DPP of 5 years under both scenarios. The CB system reached discounted break-even in years 7 and 6 under S2 and S3, respectively.
Overall, the results indicate that economic viability was jointly determined by waste throughput, site-specific compost output, operating costs, subsidy revenue, and initial capital investment. Under S1, four centralized reactors were marginally viable, whereas R3 was not viable. Under S2 and S3, all centralized and decentralized configurations satisfied the viability criteria of a positive 10-year NPV and an IRR exceeding the 10% benchmark rate. These findings remain conditional on the assumed compost selling price, subsidy rate, treatment cost, equipment service life, terminal residual value, and the exclusion of unpaid resident labor and waste-collection infrastructure costs.
3.4. Model Interpretation and Economic Sensitivity Results
Figure 7a,c present the results of the sensitivity analysis for total carbon (TC) loss using a Pearson’s correlation heatmap and a SHAP value plot. The heatmap reveals a strong negative correlation between TC loss and superphosphate percentage (SSP) and a positive correlation with the carbon-to-nitrogen ratio (C/N). This suggests that a decrease in SSP and an increase in the C/N ratio are associated with higher TC loss. The SHAP value plot further emphasizes the influence of SSP and C/N on TC loss predictions, with wide variability in their effects across different observations.
Figure 7.
Sensitivity analysis results including Pearson correlation heatmaps of (a) TC loss and (b) TN loss and SHAP value plots analysis (c) TC loss and (d) TN loss.
Figure 7b,d display the sensitivity analysis results for total nitrogen (TN) loss, again using Pearson’s correlation heatmaps and SHAP value plots. The analyses indicate a moderate positive correlation between moisture content (MC) and TN loss, while SSP shows a negative correlation, underlining the crucial role of SSP in retaining nitrogen during the composting process. Similar to the TC loss analysis, SSP and C/N demonstrate considerable variability in their SHAP values, indicating that their effects on TN loss can differ significantly across the dataset. Additionally, the ventilation rate is shown to have a substantial impact on TN loss, though its effect on TC loss is less pronounced.
Figure 8 presents the sensitivity of NPV to ±20% changes in key economic parameters under Scenario S3. For all five centralized reactors (Figure 8a–e), the agricultural-residue treatment subsidy exerted the greatest influence on NPV, followed by the compost selling price and annual compost output. A 20% increase in the subsidy, compost selling price, or compost output increased NPV, whereas a 20% decrease in these revenue-related parameters reduced NPV. In contrast, increases in equipment cost, auxiliary-material cost, labor cost, and electricity cost reduced NPV, although their effects were generally smaller. For the decentralized composting-bin system (Figure 8f), NPV was most sensitive to the compost selling price and annual compost output. Higher equipment and treatment costs reduced NPV, while increases in annual kitchen-waste throughput also reduced NPV when compost output was held constant in the one-at-a-time sensitivity analysis. Overall, the results indicate that the profitability of centralized composting was primarily revenue- and subsidy-driven, whereas the decentralized system was particularly sensitive to compost revenue and the relationship between treatment throughput and compost production.
Figure 8.
Sensitivity of NPV to ±20% changes in key economic parameters under Scenario S3: agricultural-residue treatment subsidy, compost selling price, annual compost output, auxiliary-material cost, labor cost, electricity cost, and equipment cost for (a) R1, (b) R2, (c) R3, (d) R4, and (e) R5; and compost selling price, annual compost output, annual kitchen-waste throughput, treatment cost, and equipment cost for (f) the decentralized composting-bin system.
The break-even subsidy analysis (Table 5) revealed a marked dependence on waste participation. Under S1, R3 required USD 62.54 t−1 to achieve NPV = 0, above the baseline subsidy of USD 54.15 t−1, consistent with its negative NPV. For the other four reactors, the S1 threshold ranged from USD 42.95 to 49.11 t−1. Under S2, the threshold decreased to USD 11.27–24.89 t−1, and under S3 to USD 6.27–18.08 t−1. All S2 and S3 reactors still required a positive subsidy to reach financial break-even under the adopted assumptions; these thresholds should not be interpreted as actual local subsidy requirements. Since all calculated break-even subsidy thresholds were positive, none of the centralized reactors would achieve a non-negative NPV under zero-subsidy conditions, assuming all other economic parameters remained unchanged. Nevertheless, the substantially lower break-even thresholds under S2 and S3 indicate that increased waste participation could reduce the level of financial support required for economically viable operation.
Table 5.
Minimum agricultural-residue treatment subsidy required for financial break-even (10-year NPV = 0), USD t−1.
4. Discussion
4.1. Carbon and Nitrogen Retention Through Rural Waste Composting
In this study, analysis of the three scenarios revealed that increasing the proportion of rural waste used for composting can increase the total carbon content in the organic fertilizer produced. Retaining carbon in the produced compost may increase the return of organic carbon to agricultural soils and support soil organic matter management. By preserving carbon in the form of stable organic matter, this practice not only improves soil structure and fertility but may support soil organic carbon management [48,49]. The results indicate increased retention of biogenic carbon in the produced compost. However, net soil carbon sequestration and greenhouse-gas mitigation were not quantified and cannot be inferred from the present analysis. Additionally, the use of organic fertilizers may reduce dependency on chemical fertilizers, which may in turn reduce nutrient runoff and associated environmental impacts [50].
Similarly, increasing the fraction of rural waste used for composting also boosts the total nitrogen content in locally produced organic fertilizers. Nitrogen is a critical nutrient for crop growth, and we assessed the potential of organic fertilizers to meet local nitrogen needs under the three scenarios [51]. The results shown in Figure 9 indicate that, under Scenario S3, the total N retained in the produced compost was equivalent to approximately 27.9% of the annual local crop N fertilizer demand on a total-N basis. A supplementary sensitivity analysis showed that this theoretical contribution varied from 22.3% to 33.5% when the total N retained in compost was varied by ±20%, while crop N demand remained constant (Supplementary Note S3 and Table SN3.1). This result highlights the sensitivity of the estimated nutrient-recycling potential to nitrogen retention assumptions. Nevertheless, the indicator represents a theoretical nutrient-recycling potential rather than the amount of nitrogen directly available for crop uptake or the proportion of mineral nitrogen fertilizer that could be replaced. Although compost application may support crop productivity and soil fertility, its agronomic benefits depend on nutrient-release dynamics, crop requirements, and field management conditions, and inappropriate application may increase the risk of nitrogen losses [52,53].
Figure 9.
Potential contribution of compost-derived total N to local crop N demand under different scenarios.
4.2. Implications for Sustainable Agricultural Land Management and Rural Waste Management
The results demonstrate that rural organic-waste management can be more effectively planned when the spatial distribution of waste generation is considered together with treatment configuration and agricultural nutrient demand. In Beiyang Township, agricultural residues are generated across spatially heterogeneous production areas, whereas household kitchen waste is dispersed among villages and communities. The proposed framework therefore assigns agricultural residues to centralized composting reactors and kitchen waste to decentralized composting bins according to their different generation and collection characteristics. Such spatial differentiation provides a practical basis for coordinating waste sources and treatment infrastructure at the township scale. From a land-management perspective, the approach connects the spatial organization of agricultural production with organic-waste treatment and subsequent nutrient recycling, rather than treating waste management as an isolated end-of-pipe activity. Such integration is consistent with circular-agriculture principles, which emphasize closing resource loops, minimizing waste losses, and returning recovered resources to agricultural production systems [54].
Nutrient recovery further strengthens the connection between rural organic-waste management and sustainable agricultural land management. The estimated retention of compost-derived nitrogen indicates that locally generated organic residues could provide a supplementary nutrient resource for agricultural production. Previous studies have demonstrated that compost application, either alone or in combination with mineral fertilizers, can contribute to soil nutrient management, improve soil properties, and enhance crop productivity [55,56,57,58]. However, the magnitude of these benefits depends on compost composition, application rate, soil characteristics, crop nutrient requirements, and nutrient-release dynamics [57,58]. In particular, nitrogen availability from compost is influenced by mineralization and immobilization processes [59]. Therefore, the total nitrogen retained in compost should not be interpreted directly as the amount of mineral nitrogen fertilizer that can be replaced. Integrating compost production with spatially differentiated crop nutrient demand is thus important for developing practical nutrient-recycling strategies and supporting coordinated management of organic-waste treatment and agricultural nutrient inputs at the township scale. From an agronomic perspective, total compost N comprises organic and inorganic forms with different release characteristics. The plant-available fraction depends on nitrogen mineralization and immobilization, soil and crop conditions, and potential field losses. Consequently, this total-N indicator should not be interpreted as a direct measure of crop-available N or mineral-fertilizer replacement without compost-characterization and field-application data.
The results also indicate that spatial and nutrient considerations need to be evaluated together with financial feasibility. The economic performance of both centralized and decentralized composting systems improved as waste participation increased, while the sensitivity analysis identified the agricultural-residue treatment subsidy as an important determinant of centralized-reactor profitability. Because the subsidy was represented as an operating revenue in the present model, the financial sustainability of centralized composting depends not only on treatment capacity and compost production but also on the continuity of policy support and sufficient waste throughput [5]. This suggests that rural organic-waste planning should integrate infrastructure allocation, waste participation, nutrient-recycling objectives, and economic incentives rather than evaluating these components independently.
More broadly, the framework provides a spatial decision-support approach that can be adapted to other rural regions where organic wastes, settlements, and agricultural production are geographically dispersed. Its application does not require the same combination of waste streams or treatment technologies used in Beiyang Township; instead, the framework can be adjusted using locally available information on waste generation, settlement patterns, crop distribution, treatment capacity, nutrient demand, and economic conditions. The approach therefore does not directly optimize agricultural land-use patterns, but it can support land-use planning by identifying how waste-management infrastructure and nutrient-recycling pathways can be better coordinated with the spatial organization of agricultural production. This integration is particularly relevant for rural areas seeking to improve resource recovery while maintaining the productive and environmental functions of agricultural land.
4.3. Limitations and Outlook
While this study provides valuable insights into the potential benefits of implementing composting technology at the township level, several limitations should be acknowledged. First, the analysis primarily relies on scenario simulations, which may not fully capture the complexities and variability of real-world waste management practices. Factors such as changes in waste composition, fluctuations in local participation, and shifts in government policy can significantly influence the outcomes of composting initiatives [60]. Moreover, the study focuses on a specific township in China, which may limit the generalizability of the findings to other regions with different socio-economic and environmental conditions. Future research should incorporate field trials and pilot projects to validate these theoretical models and adapt them to diverse local contexts.
A further technical limitation concerns the assumption of a uniform treatment cycle for different agricultural residues. Feedstock composition, biodegradability, lignocellulosic characteristics, and moisture content may affect decomposition rates and the time required to achieve compost maturity. The use of a common reactor cycle may therefore introduce uncertainty into the estimated annual treatment capacity and compost production. Future experimental studies should determine feedstock-specific processing durations and validate compost maturity to improve the accuracy of reactor scheduling and capacity planning.
The machine-learning models were developed using relatively small literature-derived datasets, and their generalizability requires further evaluation. Because the training and testing subsets were randomly divided at the individual-observation level rather than by publication, observations from the same study may have been included in both subsets, potentially resulting in optimistic predictive-performance estimates. In addition, although default hyperparameters were used without further optimization, the final algorithms were selected based on test-set performance. Therefore, the reported model accuracy should not be interpreted as independent cross-study generalization. Future studies should employ publication-level grouped cross-validation or leave-one-study-out validation to improve model robustness and transferability.
Another limitation is the absence of a detailed assessment of the potential social impacts of adopting composting technologies in rural communities. Although the study considered the fraction of local waste used for composting, it did not fully explore how factors such as cultural attitudes, education levels, and existing waste management infrastructure might influence the success of composting programs [61,62]. Future work should include a comprehensive social impact assessment to identify barriers to compost adoption and develop effective community engagement strategies. Additionally, investigating the long-term environmental impacts of composting, such as effects on soil health and biodiversity, would offer a more complete understanding of the benefits and trade-offs associated with different composting methods [63]. Expanding the scope of the study to include these aspects would enhance the robustness of policy recommendations and support the development of more sustainable waste management systems.
A separate source of uncertainty arises from the waste-generation inventory. The estimated quantities are calculated from cultivated-area statistics, literature-derived conversion and collection factors, and population-based kitchen-waste coefficients, each of which may vary in space and time. Because reliable probability distributions or empirical variability ranges for these combined inputs are unavailable, confidence intervals for the waste totals cannot be justified from the present data. The rounded waste-generation estimates therefore describe approximate quantities under the stated assumptions and should not be construed as high-precision observations.
Additionally, there is another limitation concerning the spatial distribution of agricultural residues into centralized composting reactors. Although GIS-based screening was employed to identify suitable reactor locations, the subsequent allocation was not optimized using explicit source-to-facility transport distances, transportation costs, or tonne-kilometre indicators. Consequently, the proposed configurations should be regarded as scenario-based planning arrangements rather than transport-optimal solutions. The exclusion of detailed transport logistics may affect both the practical feasibility and economic performance of the centralized system. Future studies should integrate spatially explicit waste-source locations, road-network distances, transport capacities, and collection costs into a facility-allocation optimization framework to assess alternative waste-routing strategies and their implications for overall system performance.
The sensitivity analysis indicates that the volume-based agricultural-residue treatment subsidy was a major determinant of reactor profitability. In the present model, the subsidy increased annual operating revenue rather than directly reducing the initial capital investment. Consequently, project performance remains sensitive to the quantity of eligible waste processed, the continuity of the subsidy policy, and the timing of subsidy payments. Uncertainty can also accumulate across the sequential inventory, composting-loss prediction, nutrient-recovery, and financial-assessment modules. The S1–S3 adoption scenarios and ±20% one-at-a-time sensitivity tests explore selected changes in input assumptions, but do not propagate their joint uncertainty or describe correlations among waste generation, treatment effectiveness, compost yield, or market conditions. A probabilistic analysis would require defensible input distributions and dependencies, which were unavailable for the present township-level assessment. Future field monitoring and cost data could support joint Monte Carlo uncertainty propagation, with reported confidence or prediction intervals for recovered N and NPV. The estimated nitrogen-recycling potential is also subject to uncertainty associated with predicted TN losses, initial nitrogen contents, waste-generation estimates, and crop nitrogen demand. Accordingly, the reported 27.9% under Scenario S3 should be interpreted as a point estimate under the adopted assumptions rather than a precisely determined recovery rate. Although the alternative composting-adoption scenarios illustrate changes in nutrient-recycling potential, they do not quantify the predictive uncertainty of this indicator. Further experimental validation and uncertainty propagation using independently evaluated TN-loss models would be necessary to establish a reliable uncertainty interval.
The economic assessment is also subject to limitations associated with the adopted cost boundaries. In particular, the exclusion of external waste-collection infrastructure, transportation, land acquisition, and unpaid resident labor may lead to optimistic estimates of financial feasibility. These omissions may affect centralized and decentralized composting systems differently. Centralized reactors require the aggregation and transportation of agricultural residues from spatially distributed production sources, potentially increasing collection and logistics expenditures. In contrast, decentralized composting reduces the need for centralized waste transportation but relies on household participation and unpaid labor for routine operations, monitoring, and maintenance. Therefore, the relative economic advantages of the two systems should be interpreted with caution. Incorporating these additional cost components could reduce the estimated NPV, lower the IRR, and extend the discounted payback period. Future work should integrate site-specific transportation distances, collection logistics, land requirements, and labor inputs into the economic assessment to provide a more comprehensive evaluation of implementation feasibility. The assumption of unpaid resident participation may lead to an optimistic assessment of the financial feasibility of decentralized composting. In practice, routine operation and maintenance require continued labor inputs, and the introduction of paid personnel or the inclusion of residents’ opportunity costs could reduce the estimated financial benefits. Future studies should quantify actual labor requirements and associated costs through field surveys to evaluate the economic viability of decentralized composting under alternative labor-management arrangements.
5. Conclusions
This study developed an integrated spatial planning and techno-economic assessment framework for coordinating centralized and decentralized composting at the township scale. By linking the spatial distribution of rural organic waste with differentiated treatment pathways, nutrient recovery, and financial performance, the study provides the following main findings.
First, the spatial heterogeneity of waste generation highlights the importance of matching composting technologies to local waste characteristics. Centralized composting is suitable for aggregating agricultural residues from concentrated production areas, whereas decentralized systems offer a complementary pathway for managing household kitchen waste closer to its source. This differentiated configuration provides a practical basis for coordinating treatment infrastructure with agricultural and settlement patterns.
Second, increasing composting adoption can strengthen local nutrient recycling by retaining carbon and nitrogen in recovered organic fertilizers. The estimated compost-derived nitrogen represents a potentially valuable supplementary nutrient source for agricultural land management. Nevertheless, nutrient retention should be distinguished from actual fertilizer substitution, which depends on nutrient availability, crop requirements, and field application conditions.
Third, the financial feasibility of rural composting systems depends not only on treatment capacity but also on waste participation, recovered-product revenues, and policy incentives. The economic analysis indicates that higher waste participation improves investment performance, while subsidy dependence remains a key consideration for centralized systems. Consequently, economically sustainable implementation requires coordinated planning of feedstock supply, infrastructure investment, product utilization, and long-term policy support.
Overall, the proposed framework provides a transferable approach for integrating rural organic-waste management with nutrient-recycling and agricultural land-management objectives. Its application to other regions requires locally adapted waste inventories, treatment parameters, economic conditions, and field validation of composting performance.
Supplementary Materials
The following supporting information can be downloaded at: https://www.mdpi.com/article/10.3390/agriculture16212365/s1. Figure S1: Location of case study area. Figure SN1.1: Framework for composting planning and design in Beiyang Town. Figure SN1.2: The GIS-based compost reactor siting process. Figure SN1.3: Crop cultivation in Beiyang Town obtained through GIS-based grid segmentation and field research. Table S1: Technical parameters of compost reactor. Table S2: Technical parameters of compost bin. Table S3: Dataset used for TC-loss machine-learning model development. Table S4: Dataset used for TN-loss machine-learning model development. Table S5: Crop-specific nitrogen fertilizer application rates used to estimate annual crop N demand in Beiyang Township. Table S6: Sources, calculation bases, and verification status of economic parameters used in Table 3 and Table 4. Table SN1.1: Factors and criteria for siting composting reactors considering environmental, economic, social and topographical factors. Table SN1.2: Crop-specific parameters used to estimate agricultural residue generation in Beiyang Township. Table SN1.3: Total residues from centralised and decentralised production is divided according to the number of grids and village areas. Table SN1.4: Volume of waste from centralised and decentralised production according to type and month. Table SN1.5: Determination of the proportion of crop residues and pig manure in compost reaction materials. Table SN1.6: Detailed operational plans for five composting reactors under three scenarios. Table SN1.7: Population size of villages/communities and number of compost bins under different scenarios. Table SN1.8: Number of compost bins under different scenarios for public facilities. Table SN2.1: Specific sample test methods and standards. Table SN2.2: Sample test and analysis results. Table SN2.3: Final model prediction results. Table SN3.1: Sensitivity of theoretical nitrogen recycling potential to variations in total nitrogen retained in compost under Scenario S3.
Author Contributions
Conceptualization, Z.Y., J.C. and H.L.; methodology, Z.Y., H.L. and R.L.; software, Z.Y. and J.C.; validation, Z.Y., H.Q. and M.C.; formal analysis, Z.Y., J.C. and H.L.; investigation, Z.Y., J.C. and H.L.; resources, Z.Y., J.C., W.R. and S.Y.; data curation, Z.Y., J.C. and H.L.; writing—original draft preparation, Z.Y., J.C., H.Q., H.L., R.L., M.C. and S.Y.; writing—review and editing, Z.Y., J.C., H.Q., H.L., R.L., W.R., M.C. and S.Y.; visualization, Z.Y., J.C. and H.L.; supervision, H.Q., M.C. and S.Y.; project administration, H.Q.; funding acquisition, H.Q. All authors have read and agreed to the published version of the manuscript.
Funding
This study was supported by the China Scholarship Council Scholarship (No. 201908320362), National Natural Science Foundation of China (No. 42577563) and the Agricultural Science and Technology Innovation Program (ASTIP) of CAAS.
Data Availability Statement
The data presented in this study are available in Supplementary Materials.
Acknowledgments
The authors wish to thank the anonymous reviewers for their valuable and constructive comments. During the preparation of this manuscript, the authors used ChatGPT (OpenAI, GPT-5.6) to improve readability and language expression during the writing process, as well as with the generation of selected graphical elements used in Figure 1 and Figure 2. The authors have reviewed and edited the output and take full responsibility for the content of this publication.
Conflicts of Interest
The authors declare no conflicts of interest.
Abbreviations
The following abbreviations are used in this manuscript:
| AW | Agricultural waste |
| C/N | Carbon-to-nitrogen ratio |
| CAAS | Chinese Academy of Agricultural Sciences |
| CB | Decentralized composting bin |
| CR | Centralized tower composting reactor |
| DPP | Discounted payback period |
| ETR | Extra-trees regression |
| GB | Gradient boosting |
| GIS | Geographic information system |
| IRR | Internal rate of return |
| KW | Kitchen waste |
| MAE | Mean absolute error |
| MC | Moisture content |
| NPV | Net present value |
| RF | Random forest |
| RMSE | Root-mean-square error |
| SHAP | SHapley Additive exPlanations |
| SSP | Superphosphate percentage |
| TC | Total carbon |
| TN | Total nitrogen |
| USD | United States dollar |
References
- Cong, H.; Meng, H.; Chen, M.; Song, W.; Xing, H. Co-Processing Paths of Agricultural and Rural Solid Wastes for a Circular Economy Based on the Construction Concept of “Zero-Waste City” in China. Circ. Econ. 2023, 2, 100065. [Google Scholar] [CrossRef] [Scilit]
- Shah, A.M.; Zhang, H.; Shahid, M.; Ghazal, H.; Shah, A.R.; Niaz, M.; Naz, T.; Ghimire, K.; Goswami, N.; Shi, W.; et al. The Vital Roles of Agricultural Crop Residues and Agro-Industrial By-Products to Support Sustainable Livestock Productivity in Subtropical Regions. Animals 2025, 15, 1184. [Google Scholar] [CrossRef] [Scilit] [PubMed]
- Feng, Y.; Marek, C.; Tosun, J. Fighting Food Waste by Law: Making Sense of the Chinese Approach. J. Consum. Policy 2022, 45, 457–479. [Google Scholar] [CrossRef] [Scilit] [PubMed]
- Yang, Z.; Muhayodin, F.; Larsen, O.C.; Miao, H.; Xue, B.; Rotter, V.S. A Review of Composting Process Models of Organic Solid Waste with a Focus on the Fates of C, N, P, and K. Processes 2021, 9, 473. [Google Scholar] [CrossRef] [Scilit]
- Liu, Z.; Sun, J.; Zhu, W.; Qu, Y. Exploring Impacts of Perceived Value and Government Regulation on Farmers’ Willingness to Adopt Wheat Straw Incorporation in China. Land 2021, 10, 1051. [Google Scholar] [CrossRef] [Scilit]
- Wang, A.; Zhang, L.; Shi, Y.; Rozelle, S.; Osborn, A.; Yang, M. Rural Solid Waste Management in China: Status, Problems and Challenges. Sustainability 2017, 9, 506. [Google Scholar] [CrossRef] [Scilit]
- Gajera, R.; Henrysson, M.; Khatiwada, D. Circular Economy for Municipal Solid Waste: A Systematic Review on Resource Management, Recycling, and Recovery. Waste Manag. Bull. 2026, 4, 100333. [Google Scholar] [CrossRef] [Scilit]
- Mihai, F.-C. Circular Economy and Sustainable Rural Development. Sustainability 2023, 15, 2139. [Google Scholar] [CrossRef] [Scilit]
- Rashed, A.H. Sustainable Solid Waste Management in the Context of Environmental Governance. Discov. Sustain. 2025, 7, 148. [Google Scholar] [CrossRef] [Scilit]
- Mwakalinga, V.M.; Samli, S.S. Spatially Explicit Modelling of Socio-Spatial Determinants of Solid Waste Generation in Dar Es Salaam’s Informal Settlements, Tanzania. City Environ. Interact. 2026, 29, 100320. [Google Scholar] [CrossRef] [Scilit]
- Venkata Mohan, S.; Amulya, K.; Annie Modestra, J. Urban Biocycles—Closing Metabolic Loops for Resilient and Regenerative Ecosystem: A Perspective. Bioresour. Technol. 2020, 306, 123098. [Google Scholar] [CrossRef] [Scilit] [PubMed]
- Ahmed, M.; Ahmad, S.; Fayyaz-ul-Hassan; Qadir, G.; Hayat, R.; Shaheen, F.A.; Raza, M.A. Innovative Processes and Technologies for Nutrient Recovery from Wastes: A Comprehensive Review. Sustainability 2019, 11, 4938. [Google Scholar] [CrossRef] [Scilit]
- Vázquez, M.A.; Soto, M. The Efficiency of Home Composting Programmes and Compost Quality. Waste Manag. 2017, 64, 39–50. [Google Scholar] [CrossRef] [Scilit] [PubMed]
- Ravoahangy, N.; Majeau-Bettez, G.; Schoefs, O. Parametrization of Biowaste Composting System for Life Cycle Assessment. Waste Manag. 2026, 212, 115337. [Google Scholar] [CrossRef] [Scilit] [PubMed]
- Phooi, C.L.; Azman, E.A. Option and Effort for Decentralized Food Waste Management. Waste Manag. Bull. 2026, 4, 100292. [Google Scholar] [CrossRef] [Scilit]
- Rao, J.N.; Parsai, T. A Comprehensive Review on the Decentralized Composting Systems for Household Biodegradable Waste Management. J. Environ. Manag. 2023, 345, 118824. [Google Scholar] [CrossRef] [Scilit] [PubMed]
- Pai, S.; Ai, N.; Zheng, J. Decentralized Community Composting Feasibility Analysis for Residential Food Waste: A Chicago Case Study. Sustain. Cities Soc. 2019, 50, 101683. [Google Scholar] [CrossRef] [Scilit]
- Bruni, C.; Akyol, Ç.; Cipolletta, G.; Eusebi, A.L.; Caniani, D.; Masi, S.; Colón, J.; Fatone, F. Decentralized Community Composting: Past, Present and Future Aspects of Italy. Sustainability 2020, 12, 3319. [Google Scholar] [CrossRef] [Scilit]
- Daskal, S.; Asi, O.; Sabbah, I.; Ayalon, O.; Baransi-Karkaby, K. Decentralized Composting Analysis Model—Benefit/Cost Decision-Making Methodology. Sustainability 2022, 14, 16397. [Google Scholar] [CrossRef] [Scilit]
- Yang, L.; Xiao, X.; Gu, K. Agricultural Waste Recycling Optimization of Family Farms Based on Environmental Management Accounting in Rural China. Sustainability 2021, 13, 5515. [Google Scholar] [CrossRef] [Scilit]
- Wang, Y.; Cui, X. Modeling and Quantification of Agricultural Waste Recycling for Agricultural Industrial Structure Optimization in a Novelty Multi-Village Industrial Complex. Environ. Impact Assess. Rev. 2024, 106, 107484. [Google Scholar] [CrossRef] [Scilit]
- Satari, B. Sustainability Assessment of Hydrothermal Carbonization of Food/Agro-Industrial Waste: Integrating Life Cycle, Techno-Economic, and Machine Learning Perspectives. Sustain. Futur. 2026, 12, 102001. [Google Scholar] [CrossRef] [Scilit]
- Wang, H.; Qin, Y.; Xin, L.; Zhao, C.; Ma, Z.; Hu, J.; Wu, W. Preliminary Techno-Economic Analysis of Three Typical Decentralized Composting Technologies Treating Rural Kitchen Waste: A Case Study in China. Front. Environ. Sci. Eng. 2023, 17, 47. [Google Scholar] [CrossRef] [Scilit]
- Xiao, S.; Fügener, T.; Wende, W.; Yan, W.; Chen, H.; Syrbe, R.; Xue, B. The Dynamics of Vegetation and Implications for Ecosystem Services in the Context of Urbanisation: An Example from Huangyan-Taizhou, China. Ecol. Eng. 2022, 179, 106614. [Google Scholar] [CrossRef] [Scilit]
- Pappert, L.; Langbein, A.J.; Imsirovic, T.; Frölich-Kulik, M. The Urban-Rural Living Lab: An Experimental Research Framework for Integrated Territorial Planning—Insights from Nordhausen, Germany. Urban Transform 2026, 8, 24. [Google Scholar] [CrossRef] [Scilit]
- Abels, S.; Angelo, H.; Doehler-Behzadi, M.; Elzenbaumer, B.; Fan, L.; Frölich-Kulik, M.; Frölich-Kulik, M.; Githiri, G.; Hagemann, A.; Hagemann, A.; et al. (Eds.) Urban-Rural Assembly: A Handbook for Co-Visioning Interconnected Regions; JOVIS: Berlin, Germany, 2025. [Google Scholar]
- Yang, Z.; Li, H.; Fu, B.; Xue, B.; Rotter, V.S. Mapping the Potential of Biogas Production for Electricity Generation from Agricultural Crop Residues at the Town Scale in China. Environ. Dev. Sustain. 2025. [Google Scholar] [CrossRef] [Scilit]
- Cao, J.; Pang, B.; Mo, X.; Xu, F. A New Model That Using Transfer Stations for Straw Collection and Transportation in the Rural Areas of China: A Case of Jinghai, Tianjin. Renew. Energy 2016, 99, 911–918. [Google Scholar] [CrossRef] [Scilit]
- Xu, H.; Duan, X.; Xu, Y.; Yan, T.; Tian, Z.; Teng, Y. Behavioral Decision-Making and Path Optimization of Stakeholders in Straw Collection, Storage, and Transportation within Rural Public Health Governance. Front. Public Health 2026, 14, 1826051. [Google Scholar] [CrossRef] [Scilit] [PubMed]
- Wang, J.; Chen, X.; Zhang, S.; Wang, Y.; Shao, X.; Wu, D. Analysis of Raw Materials and Products Characteristics from Composting and Anaerobic Digestion in Rural Areas. J. Clean. Prod. 2022, 338, 130455. [Google Scholar] [CrossRef] [Scilit]
- Zhu, Y.; Zhang, Y.; Luo, D.; Chong, Z.; Li, E.; Kong, X. A Review of Municipal Solid Waste in China: Characteristics, Compositions, Influential Factors and Treatment Technologies. Environ. Dev. Sustain. 2021, 23, 6603–6622. [Google Scholar] [CrossRef] [Scilit]
- Liu, Z.; Wang, X.; Wang, F.; Bai, Z.; Chadwick, D.; Misselbrook, T.; Ma, L. The Progress of Composting Technologies from Static Heap to Intelligent Reactor: Benefits and Limitations. J. Clean. Prod. 2020, 270, 122328. [Google Scholar] [CrossRef] [Scilit]
- Colón, J.; Martínez-Blanco, J.; Gabarrell, X.; Artola, A.; Sánchez, A.; Rieradevall, J.; Font, X. Environmental Assessment of Home Composting. Resour. Conserv. Recycl. 2010, 54, 893–904. [Google Scholar] [CrossRef] [Scilit]
- Yalcinkaya, S.; Uzer, S.; Kaleli, H.İ.; Doğan, F.; Kayalık, M. Compost Plant Site Selection for Food Waste Using GIS Based Multicriteria Analysis. Turk. J. Agric.-Food Sci. Technol. 2021, 9, 1908–1914. [Google Scholar] [CrossRef] [Scilit]
- Shan, G.; Li, W.; Gao, Y.; Tan, W.; Xi, B. Additives for Reducing Nitrogen Loss during Composting: A Review. J. Clean. Prod. 2021, 307, 127308. [Google Scholar] [CrossRef] [Scilit]
- Zhang, Z.; Liu, D.; Qiao, Y.; Li, S.; Chen, Y.; Hu, C. Mitigation of Carbon and Nitrogen Losses during Pig Manure Composting: A Meta-Analysis. Sci. Total Environ. 2021, 783, 147103. [Google Scholar] [CrossRef] [Scilit] [PubMed]
- Chen, H.; Sun, S.; Zhang, B. Forecasting N2O Emission and Nitrogen Loss from Swine Manure Composting Based on BP Neural Network. MATEC Web Conf. 2019, 277, 01010. [Google Scholar] [CrossRef] [Scilit]
- Li, Y.; Xue, Z.; Li, S.; Sun, X.; Hao, D. Prediction of Composting Maturity and Identification of Critical Parameters for Green Waste Compost Using Machine Learning. Bioresour. Technol. 2023, 385, 129444. [Google Scholar] [CrossRef] [Scilit] [PubMed]
- Wan, X.; Li, J.; Xie, L.; Wei, Z.; Wu, J.; Wah Tong, Y.; Wang, X.; He, Y.; Zhang, J. Machine Learning Framework for Intelligent Prediction of Compost Maturity towards Automation of Food Waste Composting System. Bioresour. Technol. 2022, 365, 128107. [Google Scholar] [CrossRef] [Scilit] [PubMed]
- Wang, N.; Yang, W.; Wang, B.; Bai, X.; Wang, X.; Xu, Q. Predicting Maturity and Identifying Key Factors in Organic Waste Composting Using Machine Learning Models. Bioresour. Technol. 2024, 400, 130663. [Google Scholar] [CrossRef] [Scilit] [PubMed]
- Zhao, Y. The Study on Gases Nitrogen Emission Rules During Aerobic Composting. Master’s Dissertation, Beijing Agricultural University, Beijing, China, 2010. [Google Scholar]
- Ye, P.; Fang, L.; Song, D.; Zhang, M.; Li, R.; Awasthi, M.K.; Zhang, Z.; Xiao, R.; Chen, X. Insights into Carbon Loss Reduction during Aerobic Composting of Organic Solid Waste: A Meta-Analysis and Comprehensive Literature Review. Sci. Total Environ. 2023, 862, 160787. [Google Scholar] [CrossRef] [Scilit] [PubMed]
- Yadav, G.; Mishra, A.; Ghosh, P.; Sindhu, R.; Vinayak, V.; Pugazhendhi, A. Technical, Economic and Environmental Feasibility of Resource Recovery Technologies from Wastewater. Sci. Total Environ. 2021, 796, 149022. [Google Scholar] [CrossRef] [Scilit] [PubMed]
- Tian, Y.; Yang, X.; Chen, N.; Li, C.; Yang, W. Data-Driven Interpretable Analysis for Polysaccharide Yield Prediction. Environ. Sci. Ecotechnol. 2024, 19, 100321. [Google Scholar] [CrossRef] [Scilit] [PubMed]
- Ponce-Bobadilla, A.V.; Schmitt, V.; Maier, C.S.; Mensing, S.; Stodtmann, S. Practical Guide to SHAP Analysis: Explaining Supervised Machine Learning Model Predictions in Drug Development. Clin. Transl. Sci. 2024, 17, e70056. [Google Scholar] [CrossRef] [Scilit] [PubMed]
- Brunaccioni, L.; De Fusco, F.; Vallerio, M. Dynamic SHAP: Time Resolved Explainable AI for Batch Processes. Comput. Chem. Eng. 2026, 213, 109717. [Google Scholar] [CrossRef] [Scilit]
- Saltelli, A.; Aleksankina, K.; Becker, W.; Fennell, P.; Ferretti, F.; Holst, N.; Li, S.; Wu, Q. Why so Many Published Sensitivity Analyses Are False: A Systematic Review of Sensitivity Analysis Practices. Environ. Model. Softw. 2019, 114, 29–39. [Google Scholar] [CrossRef] [Scilit]
- Enebe, M.C.; Ray, R.L.; Griffin, R.W. Carbon Sequestration and Soil Responses to Soil Amendments—A Review. J. Hazard. Mater. Adv. 2025, 18, 100714. [Google Scholar] [CrossRef] [Scilit]
- Ghimirey, V.; Chaurasia, J.; Acharya, N. Understanding Soil Carbon Sequestration: Mechanistic Insights, Management Approaches, and Future Challenges. Discov. Soil 2025, 2, 101. [Google Scholar] [CrossRef] [Scilit]
- Kabato, W.; Hailegnaw, N.; Mutum, L.; Molnar, Z. Managing Soil Health for Climate Resilience and Crop Productivity in a Changing Environment. Sci. Total Environ. 2025, 1000, 180460. [Google Scholar] [CrossRef] [Scilit] [PubMed]
- Santolin, J.; Larsen, O.C.; Fritze, A.; Xue, B.; Yang, Z.; Rotter, V.S. Reaching China’s Fertilizer Reduction Goals through Nitrogen and Phosphorus Recovery: A Substance Flow Analysis Case Study. J. Mater. Cycles Waste Manag. 2024, 26, 3650–3664. [Google Scholar] [CrossRef] [Scilit]
- Luo, X.; Kou, C.; Wang, Q. Optimal Fertilizer Application Reduced Nitrogen Leaching and Maintained High Yield in Wheat-Maize Cropping System in North China. Plants 2022, 11, 1963. [Google Scholar] [CrossRef] [Scilit] [PubMed]
- Xu, Y.; Ma, Y.; Wu, W.; Gong, J.; Tian, Y.; Zhao, X. Nitrogen and Phosphorus Loss Under Organic Fertilizer Application in Farmland. Chin. Agric. Sci. Bull. 2017, 33, 75–80. [Google Scholar] [CrossRef]
- Datola, G.; Oppio, A. Sustainability Assessment of Circular Technologies in Agriculture: Overview of Evaluation Methodologies and Research Challenges. Land 2025, 15, 44. [Google Scholar] [CrossRef] [Scilit]
- Asaye, Z.; Kim, D.-G.; Yimer, F.; Prost, K.; Obsa, O.; Tadesse, M.; Gebrehiwot, M.; Brüggemann, N. Effects of Combined Application of Compost and Mineral Fertilizer on Soil Carbon and Nutrient Content, Yield, and Agronomic Nitrogen Use Efficiency in Maize-Potato Cropping Systems in Southern Ethiopia. Land 2022, 11, 784. [Google Scholar] [CrossRef] [Scilit]
- Chang, J.-H.; Selvaraj, S.; Manikandan, S.; Nagarani, S.; Senthilkumar, A.; Samuel, M.S.; Selvarajan, E.; John, A.J.; Kumar, M. A Comprehensive Review of Biomass Utilization for Sustainable Biofuel and Biocomponent Development. Biomass Bioenergy 2025, 202, 108167. [Google Scholar] [CrossRef] [Scilit]
- Oyetunji, O.; Bolan, N.; Hancock, G. A Comprehensive Review on Enhancing Nutrient Use Efficiency and Productivity of Broadacre (Arable) Crops with the Combined Utilization of Compost and Fertilizers. J. Environ. Manag. 2022, 317, 115395. [Google Scholar] [CrossRef] [Scilit] [PubMed]
- Zhao, S.; Schmidt, S.; Gao, H.; Li, T.; Chen, X.; Hou, Y.; Chadwick, D.; Tian, J.; Dou, Z.; Zhang, W.; et al. A Precision Compost Strategy Aligning Composts and Application Methods with Target Crops and Growth Environments Can Increase Global Food Production. Nat. Food 2022, 3, 741–752. [Google Scholar] [CrossRef] [Scilit] [PubMed]
- Geisseler, D.; Smith, R.; Cahn, M.; Muramoto, J. Nitrogen Mineralization from Organic Fertilizers and Composts: Literature Survey and Model Fitting. J. Environ. Qual. 2021, 50, 1325–1338. [Google Scholar] [CrossRef] [Scilit] [PubMed]
- Jaipakdee, P.; Vibhatabandhu, P.; Vitayavarawat, P.; Supakata, N. Waste Composition and Engagement in Management Initiatives: A Study at Chulalongkorn University across Academic Periods. Green Technol. Sustain. 2026, 4, 100252. [Google Scholar] [CrossRef] [Scilit]
- Deus, R.M.; Esguícero, F.J.; Battistelle, R.A.G.; Jugend, D. Drivers and Barriers to Successful Solid Waste Management: Assessing through an Aggregated Indicator. J. Mater. Cycles Waste Manag. 2022, 24, 1476–1484. [Google Scholar] [CrossRef] [Scilit]
- Rahman, T.; Deb, N.; Alam, M.Z.; Moniruzzaman, M.; Miah, M.S.; Horaira, M.A.; Kamal, R. Navigating the Contemporary Landscape of Food Waste Management in Developing Countries: A Comprehensive Overview and Prospective Analysis. Heliyon 2024, 10, e33218. [Google Scholar] [CrossRef] [Scilit] [PubMed]
- Caldara, M.; Di Gregorio, L.; Sarvi, M.; Graziano, S.; Bindo, A.; Salo, T.; Nolfi, L.; Costanzo, M.; Lamanna, G.; Scanferla, V.; et al. Impacts on Soil Health of Soil Improvers Derived from Agri-Food Processing Residues: A Systematic Review with a Focus on European Field Studies. J. Soil Sci. Plant Nutr. 2026, 26, 2858–2883. [Google Scholar] [CrossRef] [Scilit]
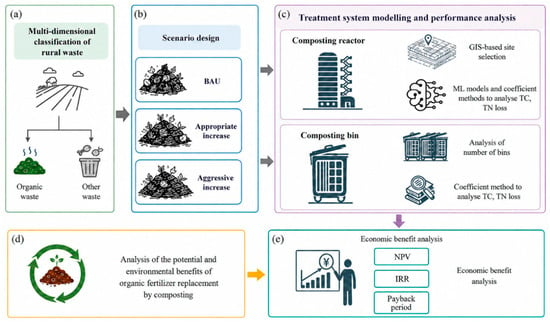
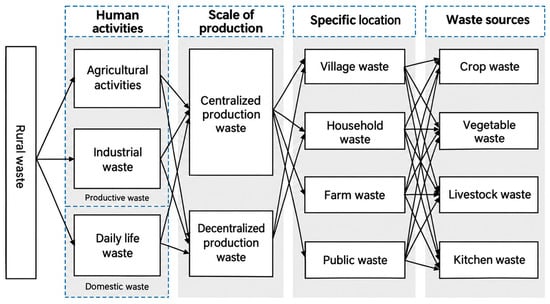
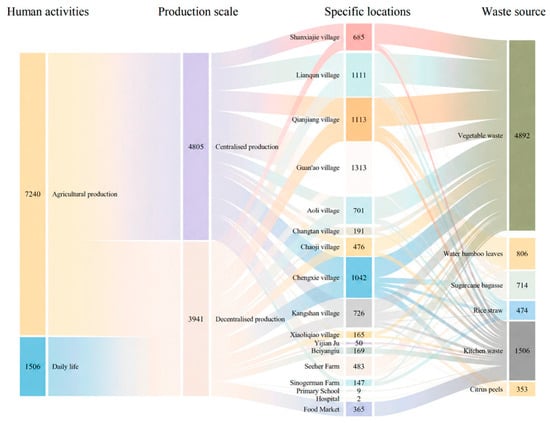
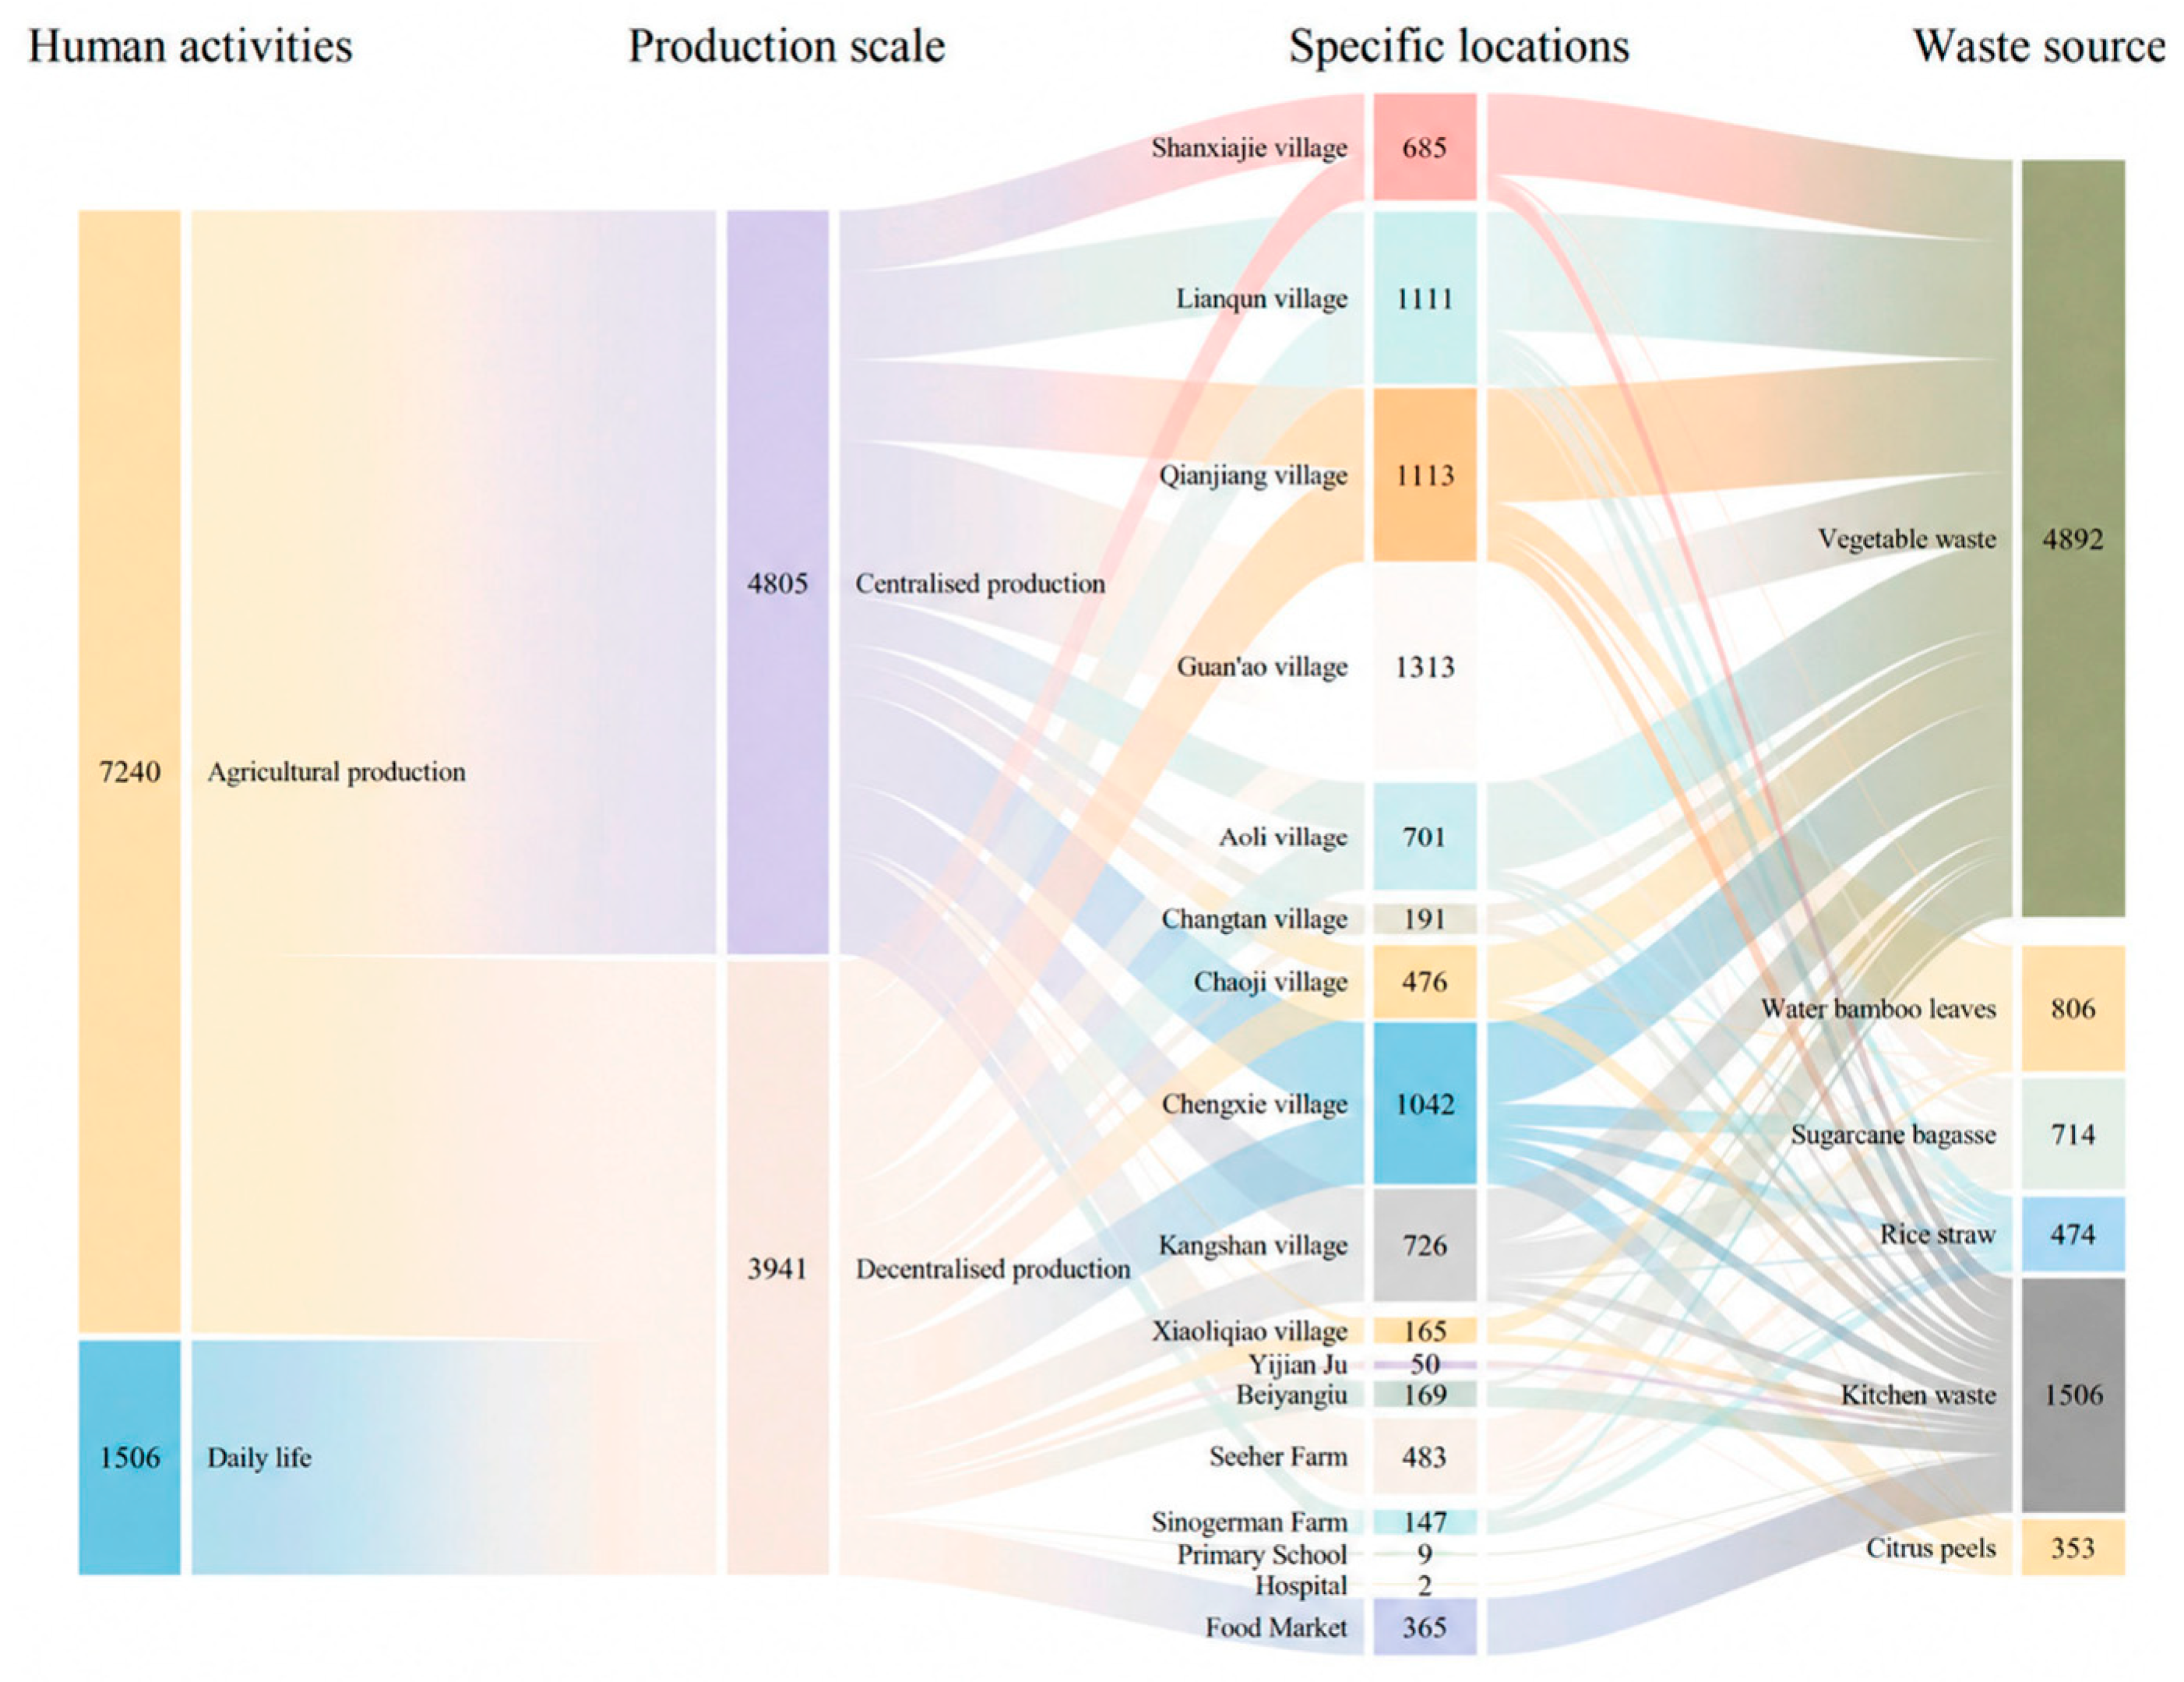
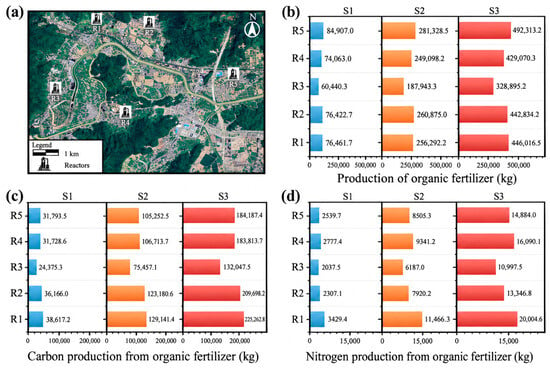
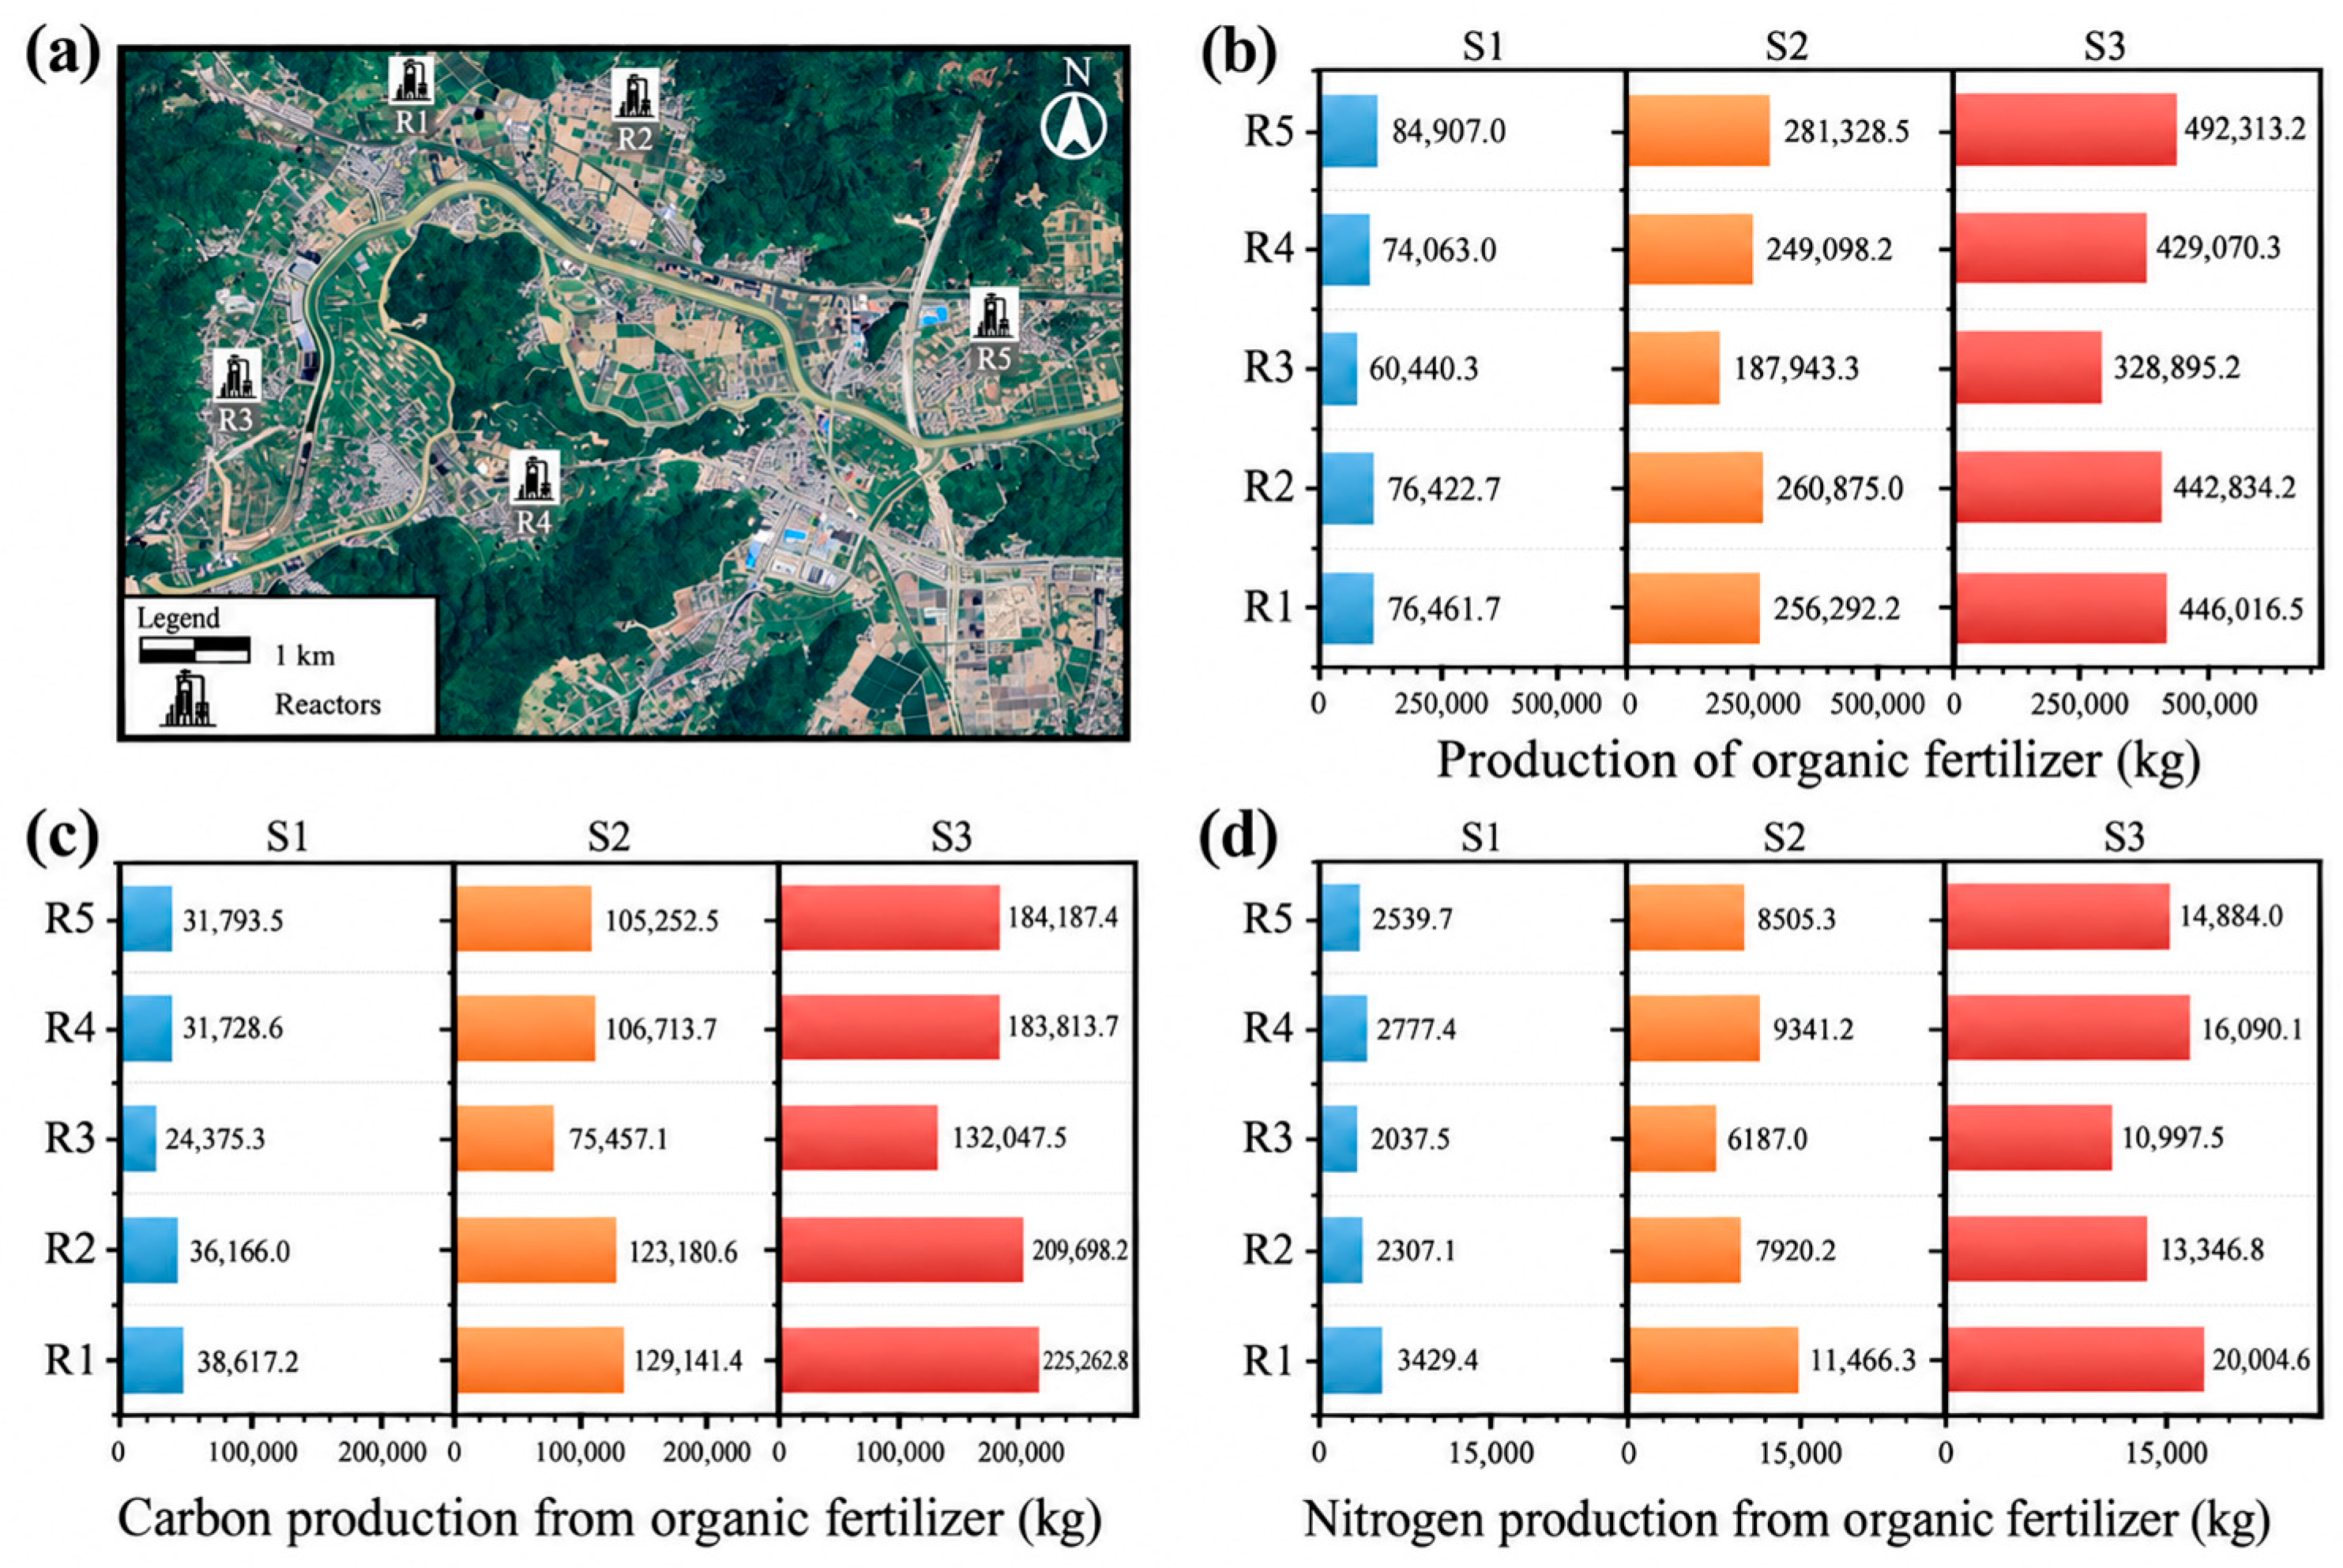
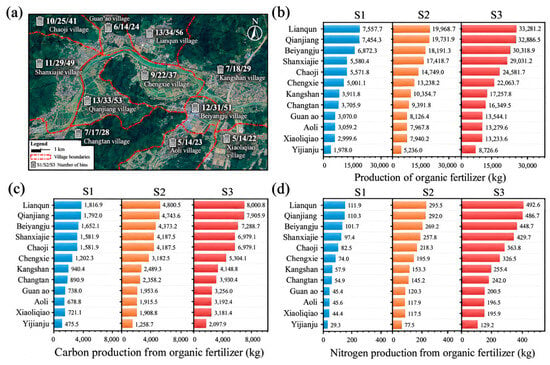
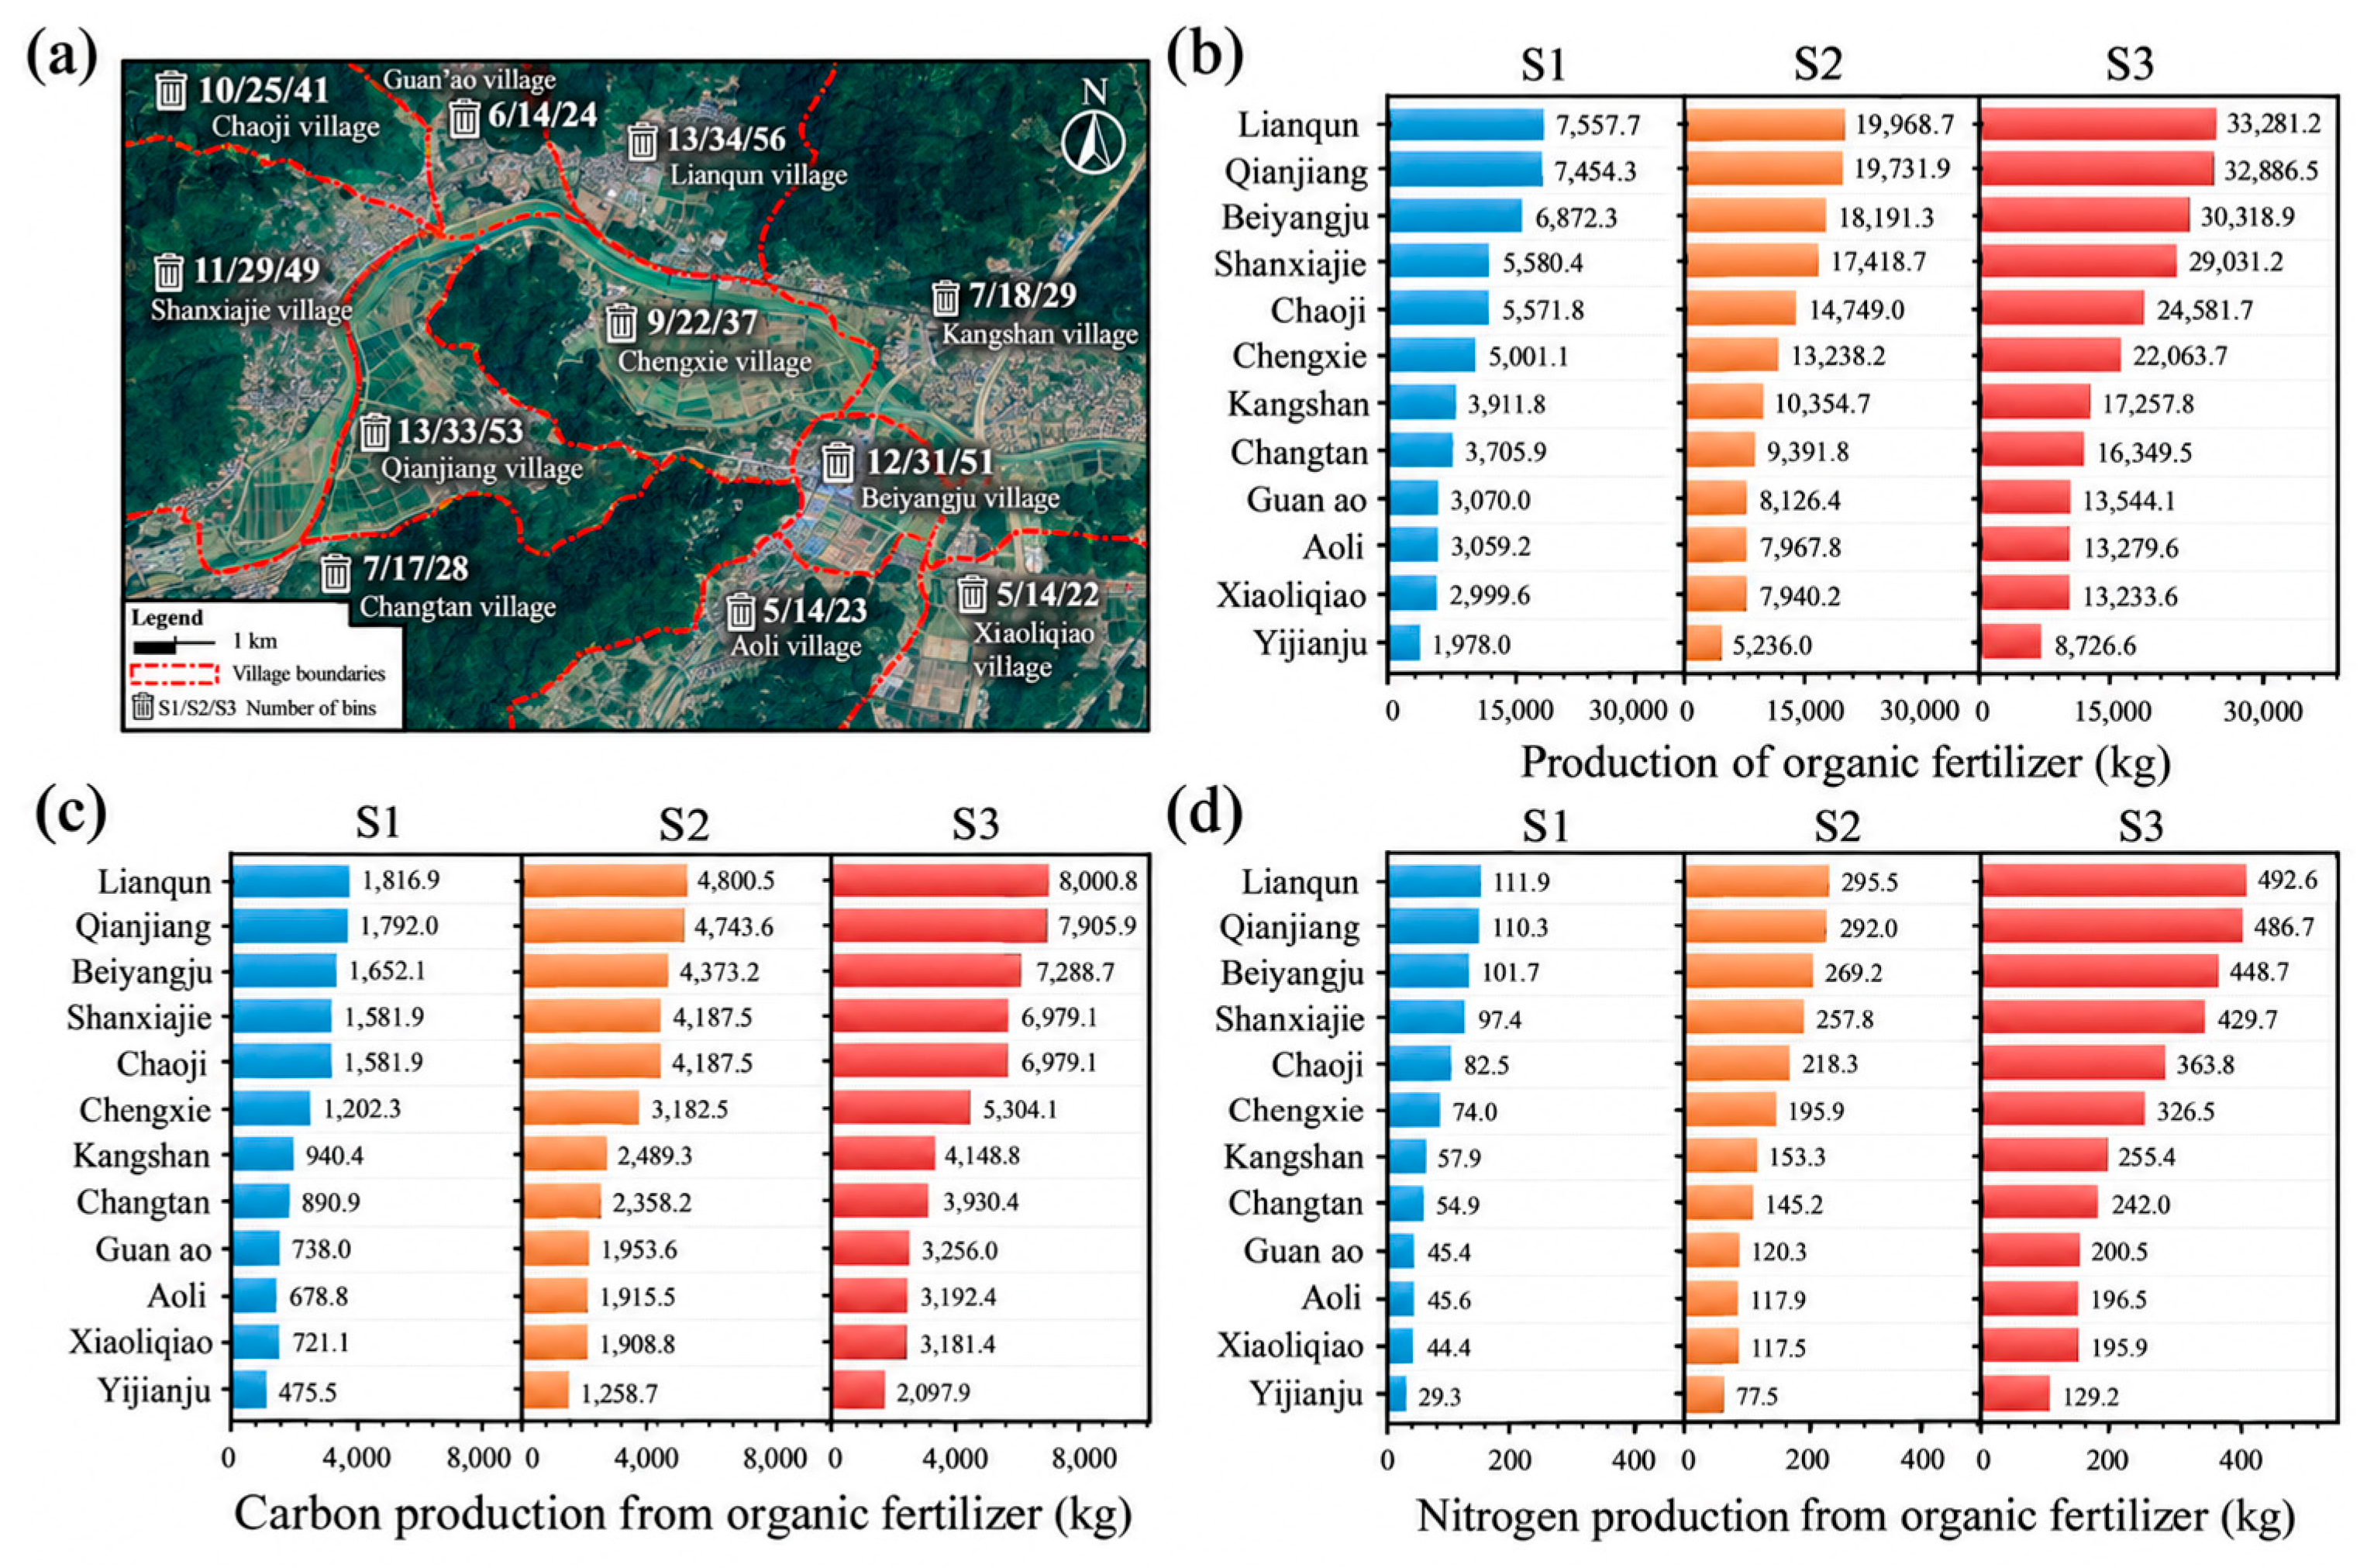
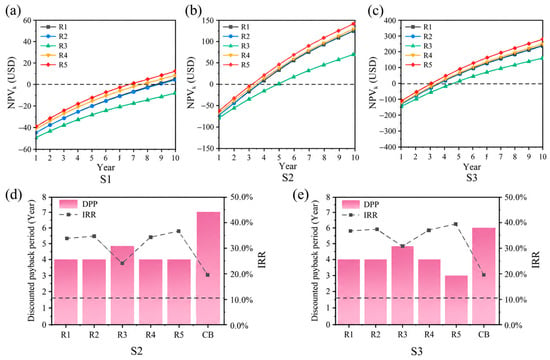
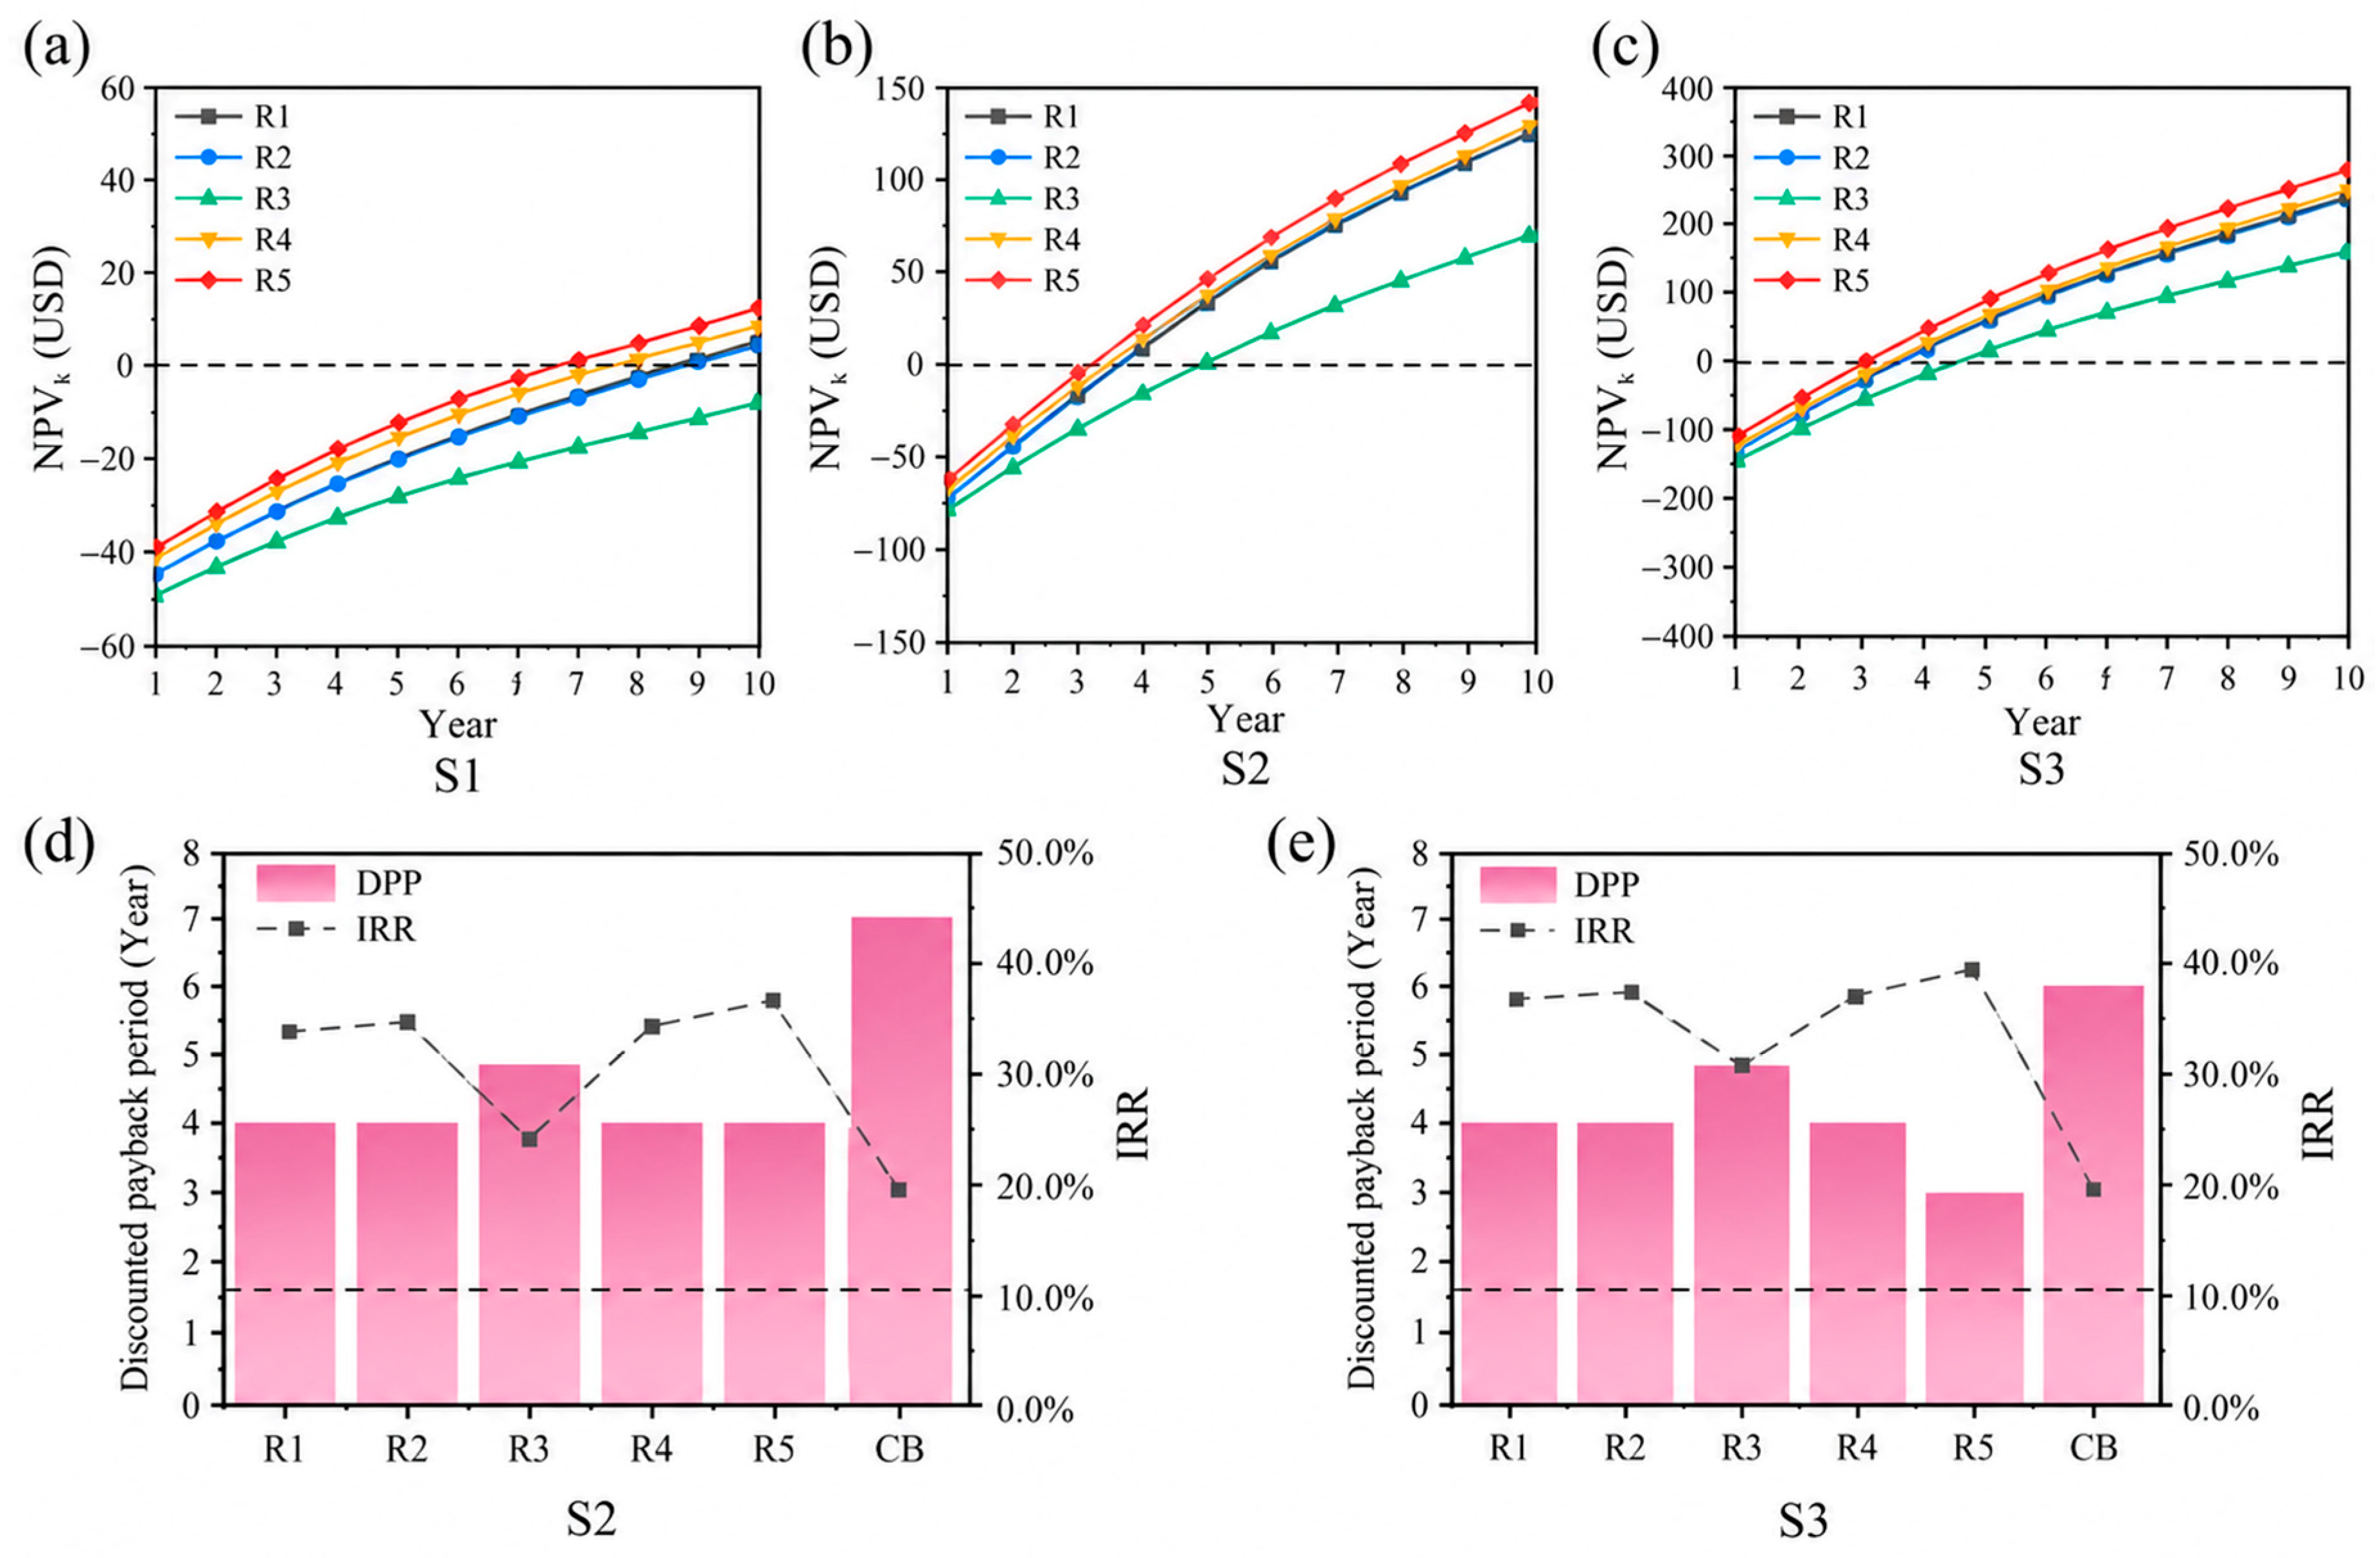
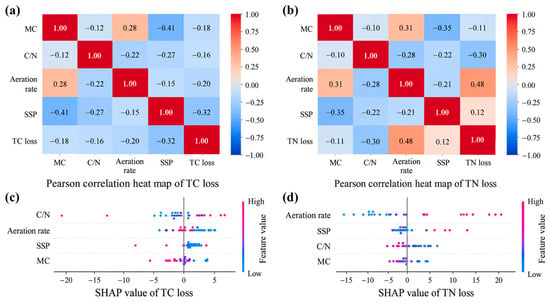
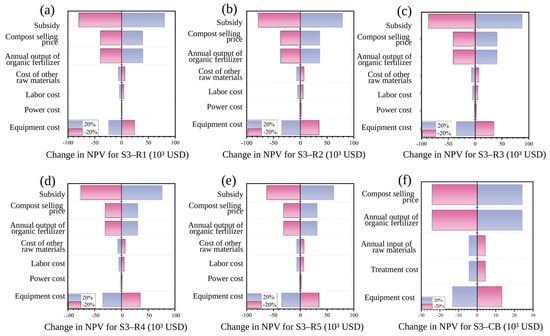
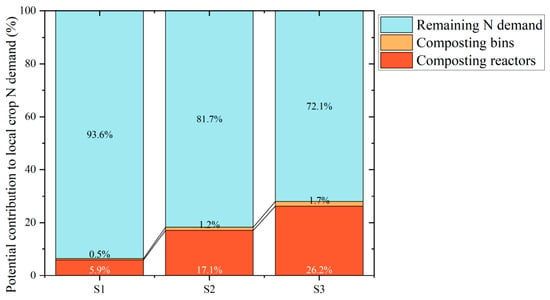
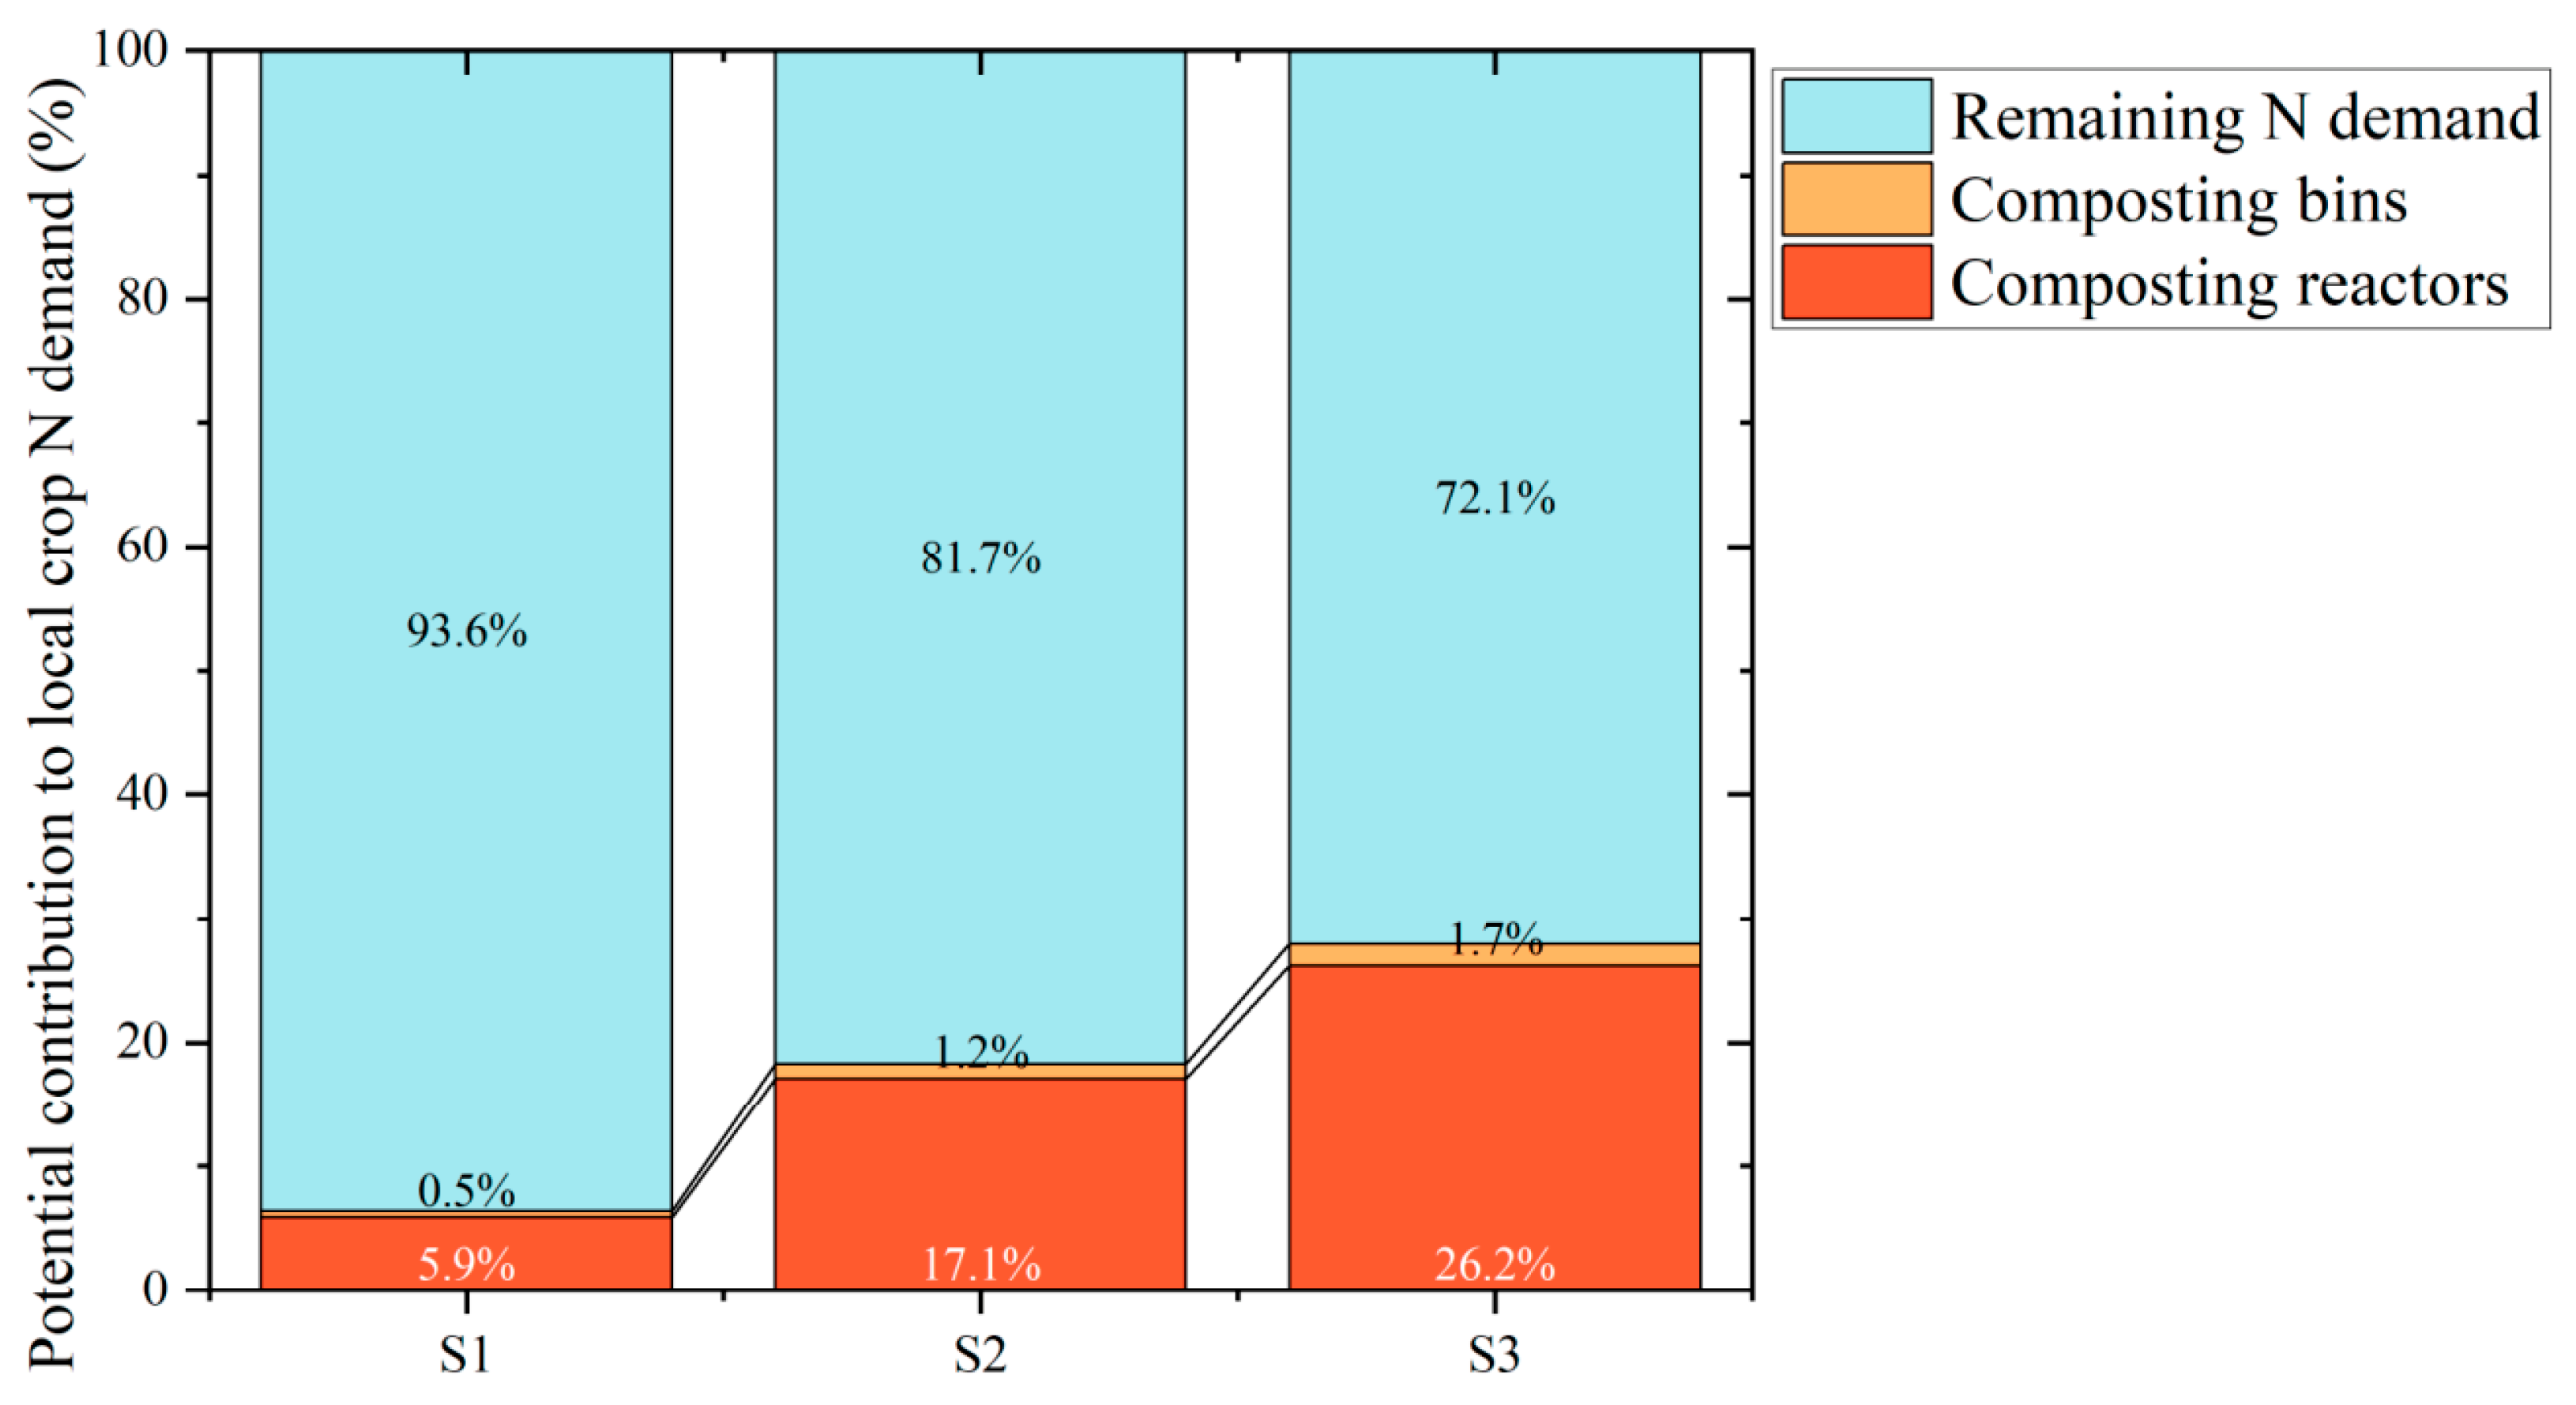

Disclaimer/Publisher’s Note: The statements, opinions and data contained in all publications are solely those of the individual author(s) and contributor(s) and not of MDPI and/or the editor(s). MDPI and/or the editor(s) disclaim responsibility for any injury to people or property resulting from any ideas, methods, instructions or products referred to in the content. |
© 2026 by the authors. Licensee MDPI, Basel, Switzerland. This article is an open access article distributed under the terms and conditions of the Creative Commons Attribution (CC BY) license.