


Abstract
To address inefficient screening of high-soil-content tuber–impurity mixtures during tiger nut harvesting, a coupled-disturbance screening principle based on counter-rotation of the inner and outer roller screens was proposed. A corresponding double-layer roller-screen separation device incorporating a separating screw conveyor was developed. A kinematic model was established to characterize the equivalent relative linear velocity between the screen surfaces, showing that counter-rotation produced a greater value than co-rotation at identical rotational speeds. Comparative discrete element method simulations showed that, at identical rotational speeds, counter-rotation alleviated localized accumulation, increased the separation rate by 3.34 percentage points, and reduced impurity content by 4.07 percentage points relative to co-rotation. A Box–Behnken design with three factors and three levels optimized the speeds of the outer screen, inner screen, and screw conveyor to 20, 53, and 122 r/min, respectively. The predicted separation rate and impurity content were 97.87% and 24.43%. Field trials conducted at the optimized parameter combination yielded a mean separation rate of 91.71% and an impurity content of 22.51%, with absolute relative deviations of 6.29% and 7.86% from the predicted values, respectively. The proposed method and device provide a practical basis for improving tuber–impurity separation in tiger nut harvesters.
1. Introduction
Tiger nut (Cyperus esculentus L.) is an emerging high-yield oil crop. The oil content in its tubers is over 20% [1], and the output of oil per unit area is approximately four times that of soybean and twice that of rapeseed [2,3]. In recent years, with the optimization of China’s oil-bearing crop industry structure, large-scale cultivation of tiger nut has expanded across the northeast, northwest, and central regions of China [4]. However, mechanized harvesting remains hindered by inefficient tuber–impurity separation technologies [5,6]. The material harvested from tiger nut plants predominantly comprises tubers, roots, and soil and is characterized by high soil content, a wide particle-size distribution, and poor flowability. These physical properties lead to material retention and localized accumulation within separation components, thus affecting tuber harvesting efficiency and increasing the workload of the subsequent cleaning process. Currently, most tiger nut harvesters deployed in China are adaptations of equipment originally designed for crops such as potatoes or peanuts. As a result, their cleaning screen and separation systems are ill-suited to the unique characteristics of tiger nut harvest material [7]. During operation, conventional single-layer screens and co-rotating double-layer roller screens frequently suffer from localized material build-up and synchronous movement of the harvested material with the screen surface, significantly diminishing the likelihood of effective soil passage through the apertures. This leads to incomplete tuber–impurity separation and high impurity content, severely constraining both the quality and operational efficiency of mechanized tiger nut harvesting. Consequently, developing a high-efficiency tuber–impurity separation device specifically tailored to the physicochemical and flow characteristics of tiger nut harvest material is essential for overcoming this technical bottleneck.
Tuber–impurity separation in tiger nut harvesting mainly relies on two screening methods: vibratory screening and roller screening. Vibratory screening primarily relies on the periodic reciprocating motion of screen surfaces to promote the dispersion and separation of tubers, soil, and root impurities. Zhang et al. [8] designed a vibrating-screen device driven by an eccentric crank-linkage mechanism. The reciprocating motion of the perforated and woven screens facilitated tuber–impurity separation, and the screening motion parameters were optimized. Liu et al. [9] developed a combined screening system comprising an elevating mesh conveyor, a threshing drum, and a key-type separating device. Multistage separation was achieved through preliminary soil removal during material conveyance and the periodic motion of the key-type separating device. However, the processing capacity of vibratory screens is constrained by factors such as screening area and material bed thickness. Under conditions of high soil content and high feed rates, material accumulation and incomplete separation are likely to occur. In contrast, roller screens have been applied to the separation and cleaning of harvested tiger nut material owing to their simple structure, ability to operate continuously, and uniform material agitation. Zhao et al. [10] designed a cleaning system combining an eccentric-driven vibrating screen with a single-layer octagonal roller screen. Material sliding and falling induced by drum rotation promoted soil-clod breakage and impurity removal. However, single-layer roller screens are limited by their aperture dimensions and screening stages, making it difficult to simultaneously retain large root impurities and remove fine soil particles. To improve separation efficiency for complex agricultural materials, double-layer roller screens have increasingly been adopted for multistage screening. Dai et al. [11] used a double-layer roller screen for the multistage cleaning of material obtained from frozen sea buckthorn fruits and optimized the roller-screen rotational speed and feed rate using discrete element simulations. Their results showed that the combined action of the inner and outer screen surfaces broadened the particle size separation range for complex agricultural materials. Wan et al. [12] proposed a counter-rotating configuration comprising a screen body and a flow-assisting component for cleaning small rapeseed seeds, confirming that agitation significantly enhanced cleaning performance. Overall, existing vibratory screening devices have limited processing capacity under high feed rates, while single-layer roller screens struggle to achieve staged separation of high-soil-content mixtures. Previous studies on double-layer roller screens have primarily focused on agricultural materials with low soil contents. The relative motion and disturbance mechanisms associated with different combinations of rotational directions and speeds of the inner and outer screen surfaces remain insufficiently understood. In particular, theoretical analysis and experimental validation of the separation of high-soil-content tiger nut tuber–impurity mixtures remain relatively limited.
This paper proposes a coupled-disturbance screening principle for high-soil-content tiger nut tuber–impurity mixtures, wherein the inner and outer roller screens rotate in opposite directions at different speeds. A dedicated tuber–impurity separation device was accordingly developed. A kinematic model of the double-layer screen surfaces was established to characterize the equivalent relative linear velocity under co-rotating and counter-rotating conditions. Discrete element method (DEM) simulations were conducted in EDEM 2024 to compare material distribution, accumulated mass, and separation performance under co-rotating and counter-rotating conditions. Response surface methodology (RSM) was used to optimize the operating parameters, with separation rate and impurity content selected as the response variables. Field experiments were subsequently conducted at the optimized parameter combination to evaluate the operational performance of the device and compare the field measurements with the simulation-based predictions. These results provide a basis for understanding the effects of counter-rotating screen motion on material distribution and separation performance, as well as for the design and operating-parameter optimization of tiger nut roller-screen separation devices.
2. Materials and Methods
2.1. Structure and Operating Principle of the Tiger Nut Harvester
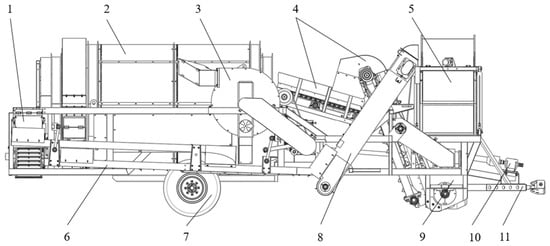
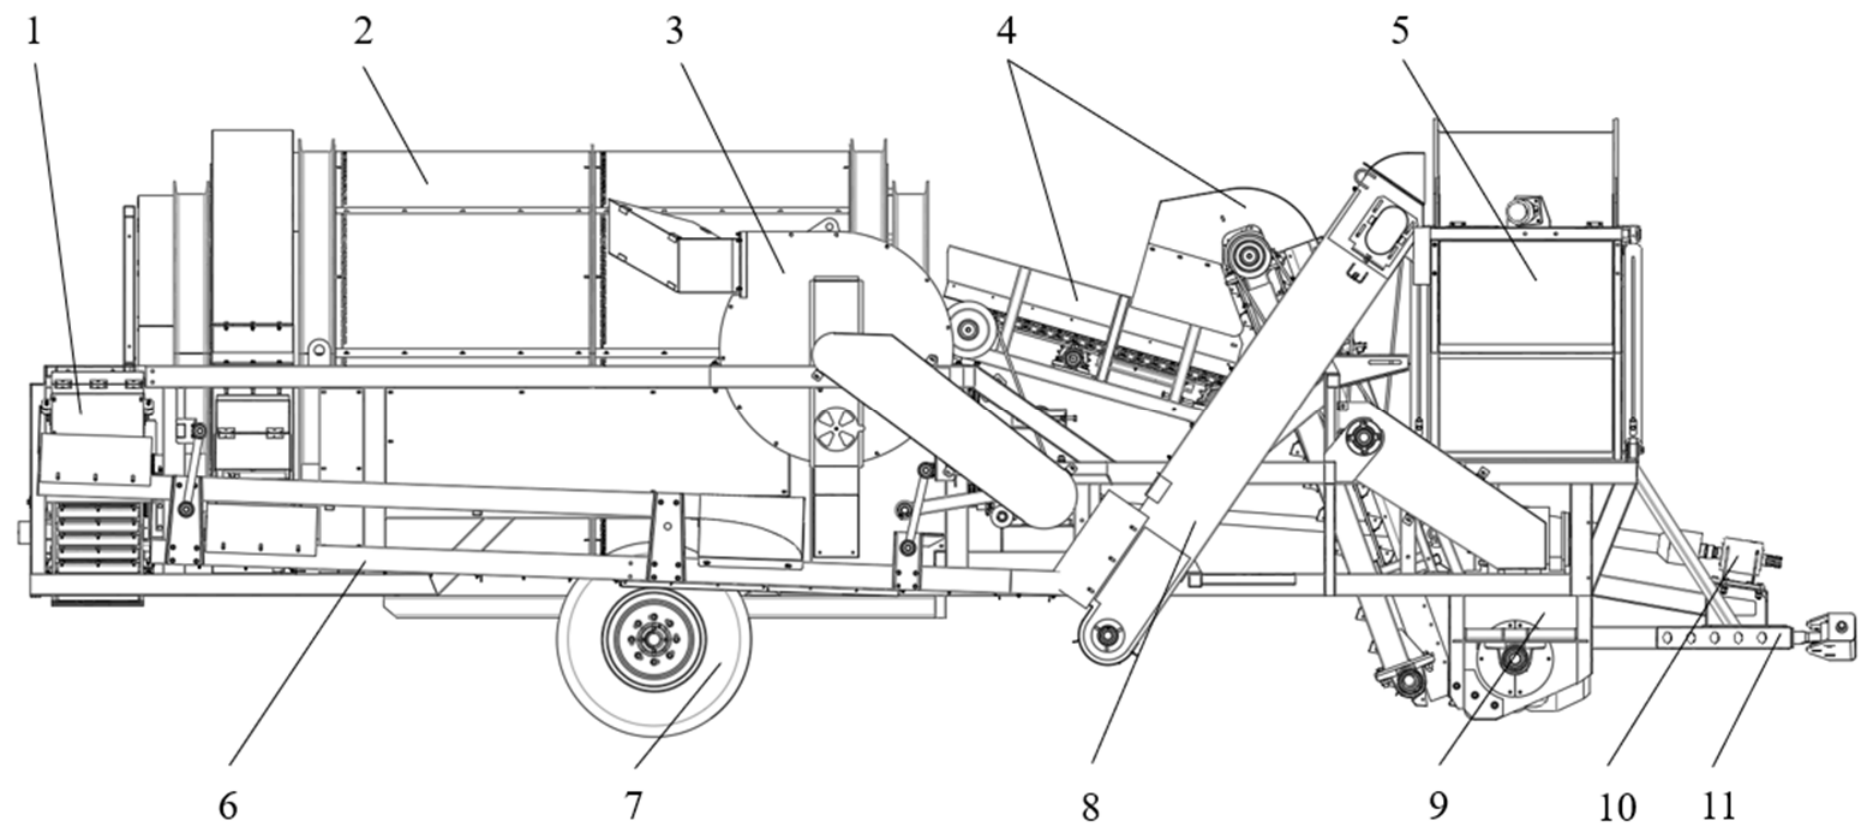
The experimental machine was a 4YDQ-1600 trailed tiger nut harvester. Figure 1 shows the overall structure of the harvester, which comprised the following principal components: rotary cutting digging device, lifting device, separation device, tuber–impurity conveyor, vibrating screen, pneumatic cleaning mechanism, tuber elevator, grain tank, transmission system, and traveling mechanism. Power was transmitted from the tractor’s rear power take-off (PTO) shaft to working components via a transmission system, enabling continuous and integrated operation, including digging, feeding, tuber–impurity separation, cleaning, and tuber collection. During operation, the rotary cutting digging device chopped, loosened, and conveyed the soil layer containing tiger nut tubers, thereby excavating tuber–soil aggregates together with associated impurities to form a mixed material stream. The lifting device elevated the mixture into the separation device, while its screen structure simultaneously facilitated soil loosening during conveyance. The remaining tuber–impurity mixture, which still contained a high proportion of impurities, was fed into the double-layer roller screen for primary separation. Large-sized impurities were discharged through the outlet of the inner roller screen, whereas fine soil particles and tiger nut tubers entered the outer roller screen for secondary separation. Finally, after vibrating screening and pneumatic cleaning, the tubers were conveyed to the grain tank, completing the harvesting process. The main technical parameters of the harvester are listed in Table 1.
Figure 1.
Schematic diagram of the tiger nut harvester structure. 1. Tuber–impurity conveyor; 2. Separation device; 3. Pneumatic cleaning mechanism; 4. Lifting device; 5. Grain tank; 6. Vibrating screen; 7. Traveling mechanism; 8. Tuber elevator; 9. Rotary cutting digging device; 10. Transmission system; 11. Frame.
Table 1.
Main technical parameters of the tiger nut harvester.
2.2. Structure and Operating Principle of the Separation Device
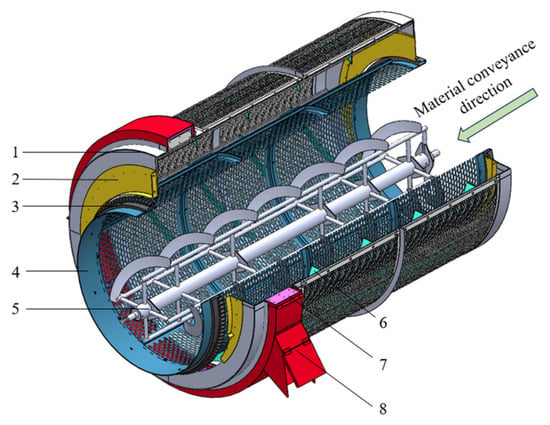
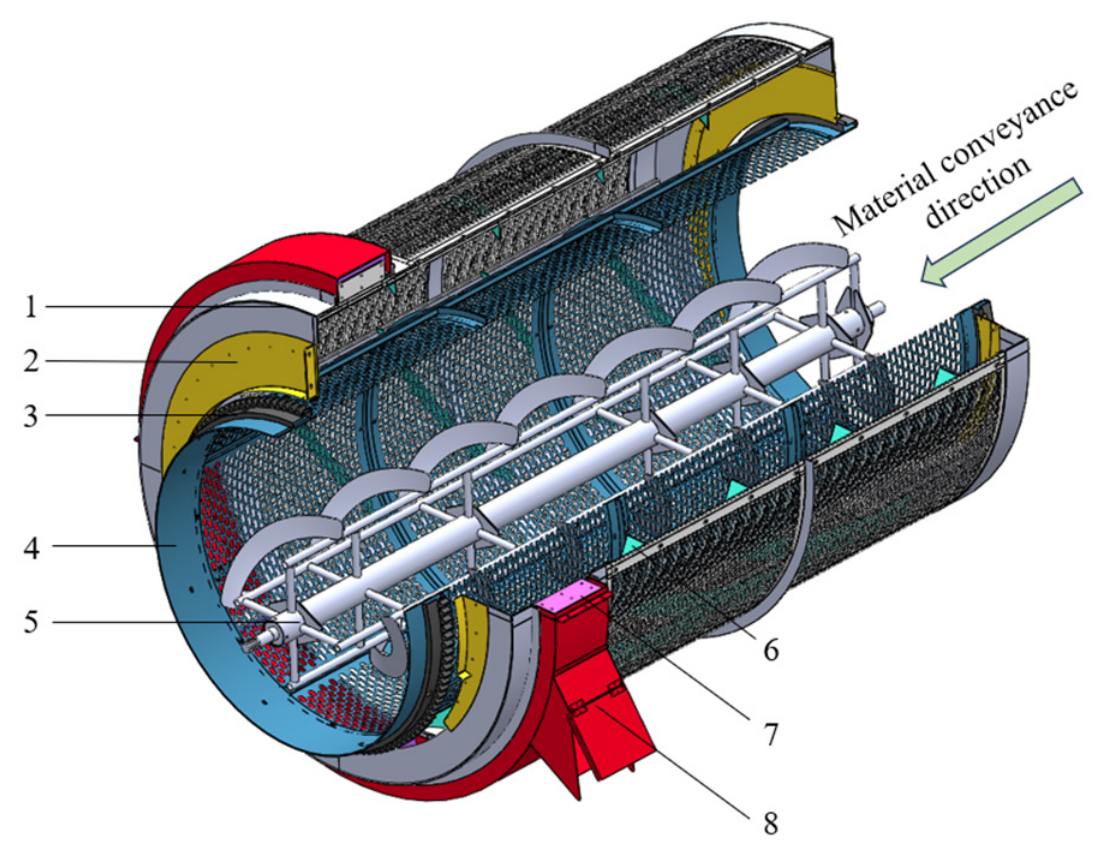
The separation device developed in this study employed a counter-rotating double-layer roller screen and served as the main screening component of the harvester. As shown in Figure 2, the separation device comprised an outer roller screen, an inner roller screen, a separating screw conveyor, a soil-retaining plate, lifting scrapers, and helical guide vanes. The device integrated staged screening with counter-rotating coupled agitation. Specifically, the inner roller screen performed primary separation of root impurities from the tubers and associated soil, whereas the outer roller screen carried out secondary separation by separating the tubers from fine soil particles and small impurities. The separating screw conveyor loosened the material within the inner roller screen and promoted its axial conveyance. Together, these three components enabled efficient separation of high-soil-content tuber–impurity mixtures.
Figure 2.
Structure of the separation device. 1. Outer roller screen (gray); 2. Soil-retaining plate (yellow); 3. Driven gear (black); 4. Inner roller screen (blue); 5. Separating screw conveyor (silver); 6. Helical guide vane (cyan); 7. Lifting scraper (purple); 8. Discharge outlet (red).
The principal innovation lay in the counter-rotating motion of the inner and outer roller screens. When viewed from the material inlet, the outer roller screen rotated clockwise, whereas both the inner roller screen and the separating screw conveyor rotated counterclockwise. Their rotational speeds were independently adjustable. During operation, the mixture first entered the inner roller screen. The screen rotated, the separating screw conveyor agitated the material, and the mixture underwent gravity-induced tumbling, sliding, and axial transport. Relatively small tiger nut tubers and fine soil particles passed through the inner screen apertures into the outer roller screen, while large-sized impurities were retained, conveyed axially by the separating screw conveyor, and discharged at the impurity outlet. Material entering the outer roller screen experienced oppositely directed tangential forces from the inner and outer screen surfaces. These forces disrupted synchronous motion with the screen surfaces, generated intense secondary agitation and shear-induced dispersion, alleviated localized accumulation, and improved screening efficiency. Under continuous agitation, fine soil particles passed through the outer screen apertures and were discharged. Tiger nut tubers larger than the screen apertures were retained and conveyed to the discharge end by the helical guide vanes, thereby completing the staged tuber–impurity separation process.
By generating a combined disturbance field through counter-rotating differential-speed motion, the device transcended conventional size-based screening. This field enhanced relative particle sliding and material redistribution, enabling the device to accommodate harvested tiger nut material with high soil content and a strong tendency to accumulate. It also substantially improved screening stability and separation performance.
2.3. Structural Parameter Design of Key Components
The tiger nut harvesting process is characterized by a high feed rate, high soil content, and a strong tendency for the material to agglomerate. Accordingly, the structural parameters of the double-layer roller screen and separating screw conveyor were determined by considering the installation space, operating efficiency, and required screening accuracy.
2.3.1. Determination of the Diameters and Length of the Double-Layer Roller Screen
The roller screen diameter governs the material filling state, effective screening area, and overall operating efficiency of the harvester, and is a key structural parameter affecting screening performance. During harvesting, a 10–15 cm layer of soil from the land surface must be excavated and fed into the harvester. This process imposes a high instantaneous load on the roller screen. If the roller screen diameter were too small, it would lead to an excessively thick material layer inside the roller screen, insufficient utilization of the screen surface, and localized material accumulation. On the other hand, an excessively large roller-screen diameter would increase the size and transmission load of the harvester. In order to ensure sufficient tuber–impurity separation, considering the working width and available installation space of the harvester, the roller screen diameter was calculated using the method proposed by Sullivan et al. [13] as follows:
where Di is the diameter of the inner roller screen, m; Qm is the feed rate of the inner roller screen, kg/s; ρm is the bulk density of the tuber–impurity mixture, kg/m3; F is the filling coefficient of the inner roller screen, ranging from 0.25 to 0.33; Kv is the rotational-speed correction coefficient; g is the gravitational acceleration, taken as 9.8 m/s2; and β is the inclination angle of the roller screen.
Based on the operating conditions of the tiger nut harvester, Qm was set to 43 kg/s. The bulk density ρm was experimentally measured as 1411 kg/m3, and the filling coefficient F was taken as 0.3. Considering the influence of field terrain, the inclination angle of the roller screen was set to 5°, and the rotational-speed correction coefficient Kv was set to 1.85 [13]. According to Equation (1), the calculated diameter of the inner roller screen was Di ≈ 1.4 m. Based on the material characteristics of tiger nut and the agronomic requirements for tuber–impurity separation, the diameter of the outer roller screen was set to Do = 1.9 m.
The roller screen length determines the effective residence time of the material and significantly influences screening performance. The typical length of a roller screen is 2–6 times its diameter [14]. Considering the available installation space, the length L was set to twice its diameter:
2Di ≤ L ≤ 2Do
The resulting range of L was 2.8–3.8 m. Thus, the double-layer roller screen length was set to L = 3 m.
2.3.2. Design of the Screen Apertures
Material size and physical properties affect separation performance and operating-parameter selection, whereas screen type influences tuber–impurity separation, screening stability, and structural reliability. Considering the high impact loads and intense material mixing encountered during tiger nut harvesting, perforated screens were selected for both the inner and outer roller screens. Perforated screens offer high rigidity, strong resistance to deformation and wear, and stable screening accuracy. They are therefore well suited to complex field conditions.
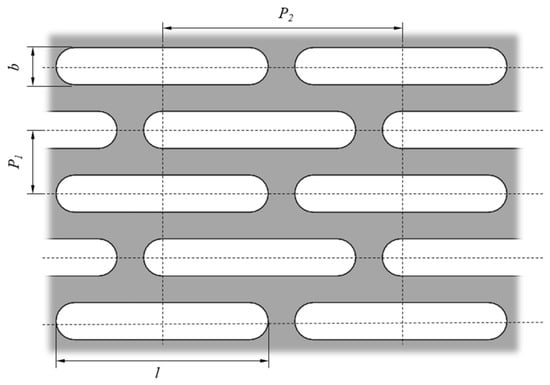
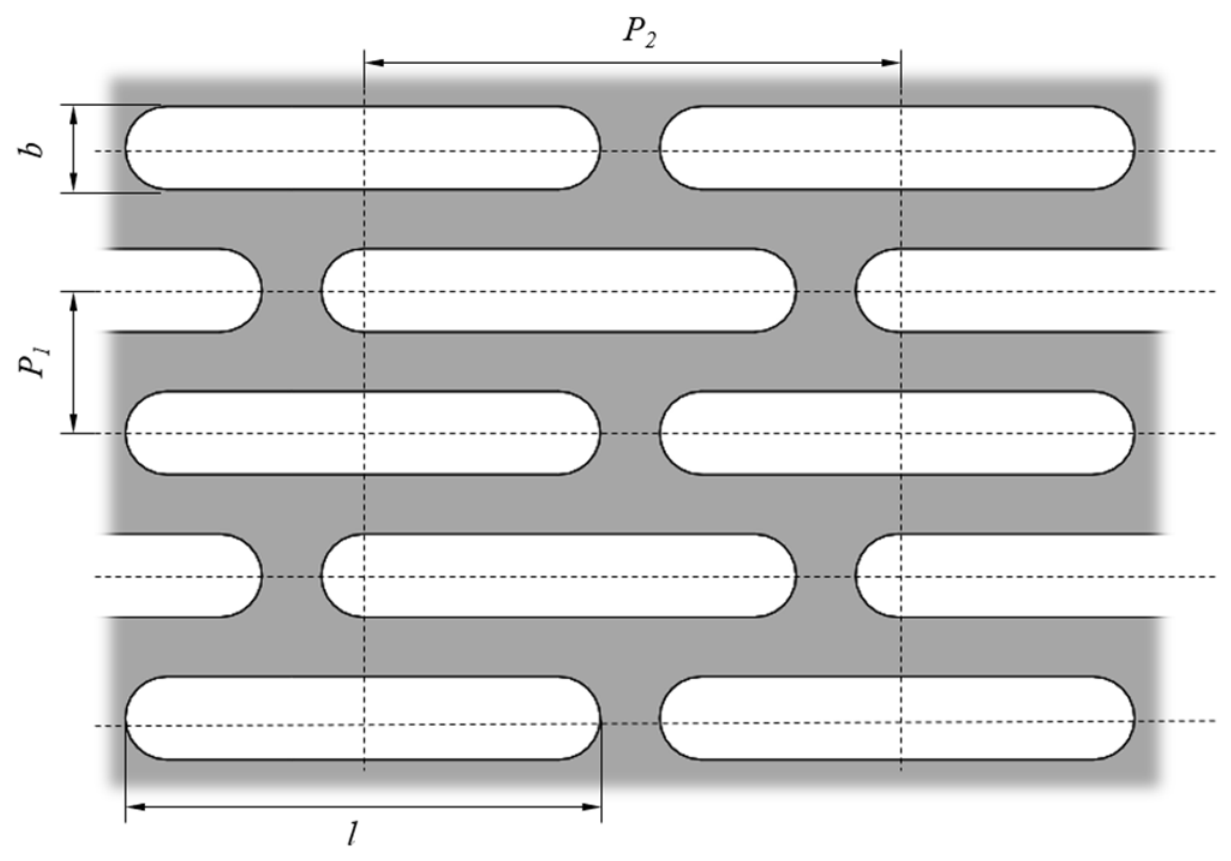
For a given screen area, aperture dimensions and arrangement determine the screen-surface utilization coefficient Kd. A higher Kd generally increases the effective screening area and facilitates material passage through the apertures. As shown in Figure 3, Kd was calculated as follows:
where b is the screen-aperture width, mm; l is the screen-aperture length, mm; P1 is the aperture pitch in the width direction, mm; and P2 is the aperture pitch in the length direction, mm.
Figure 3.
Arrangement of screen apertures.
The predominant cultivar “Yuyousha 2”, whose tubers have triaxial dimensions of 9 to 16 mm, was selected as the research material. The inner roller screen performed primary size classification and was designed to allow tubers to pass while retaining large roots and other impurities. Its apertures were designed as 22 mm × 40 mm with pitches of 30 mm × 50 mm, resulting in Kd = 51.7%. The outer roller screen performed secondary fine screening and was designed to retain tubers while allowing fine soil particles to pass. Its aperture dimensions were therefore designed as 7 mm × 40 mm with pitches of 12 mm × 45 mm, resulting in Kd = 49.9%. These parameters were selected to balance screening efficiency and the structural strength of the roller screen under high-load operation.
2.3.3. Design of the Separating Screw Conveyor
The separating screw conveyor was installed inside the inner roller screen to loosen the harvested material, suppress agglomeration and accumulation, and provide continuous axial conveyance. Its structural parameters directly affect loosening and screening uniformity and were therefore designed to balance conveying continuity and loosening performance while avoiding excessive impact loading on the tubers.
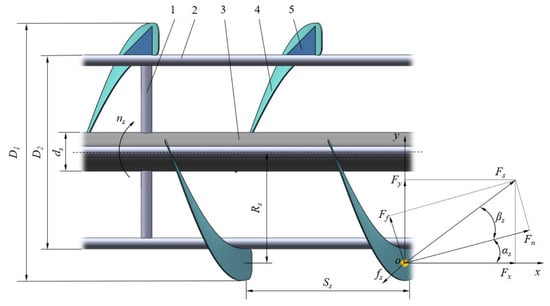
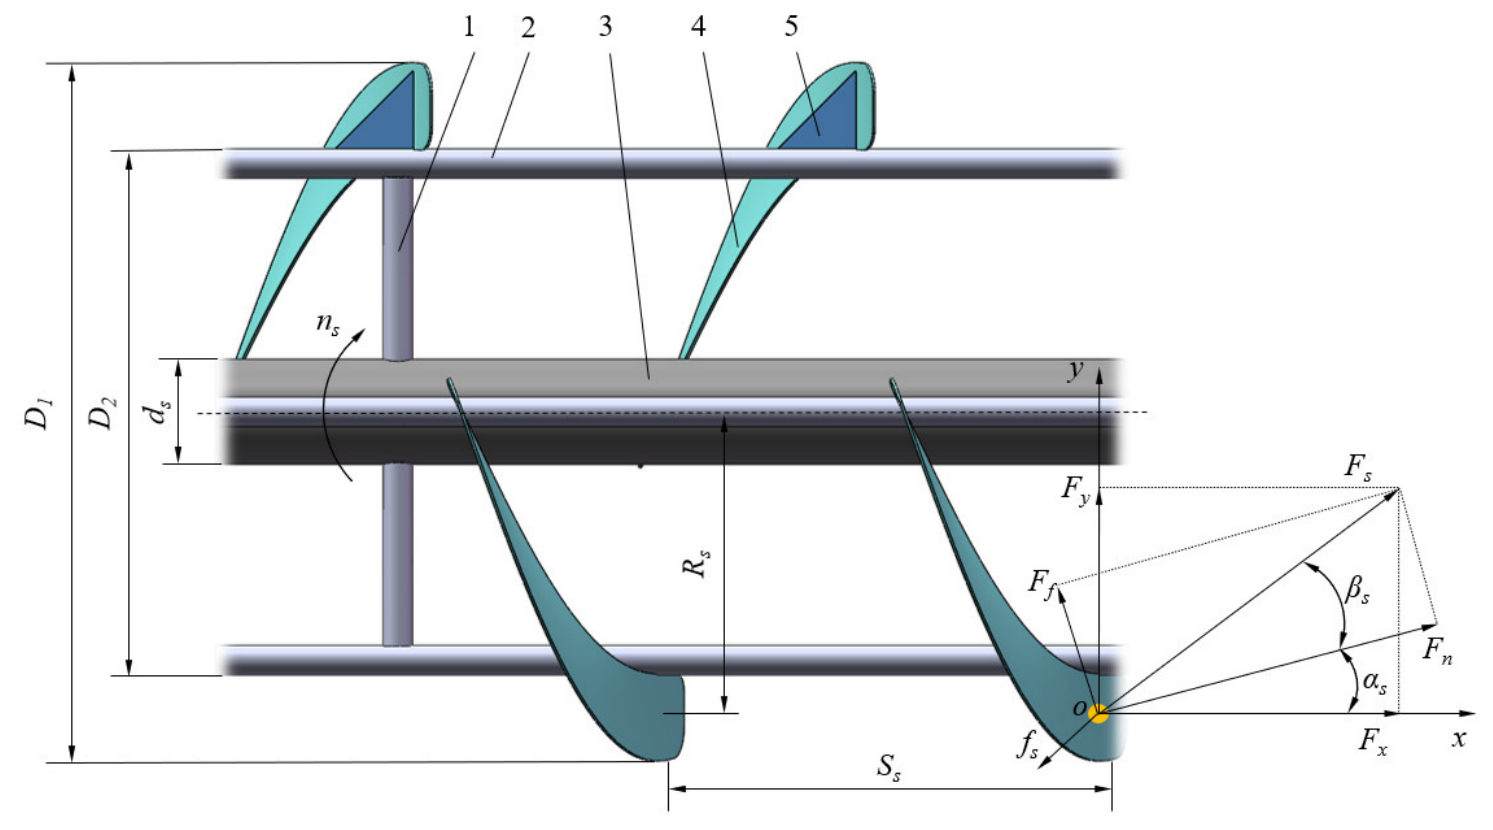
The structural and operating parameters of the helical blade directly determine material-conveying efficiency and screening performance. These parameters include the blade outer diameter D1, blade inner diameter D2, pitch Ss, helix angle αs, mounting-shaft diameter ds, and rotational speed ns.
To establish the design constraints for the helical blade, a material particle on the blade was modeled as a point mass located at Os for force analysis, as shown in Figure 4. The forces acting on the material include its gravitational force G, the normal thrust Fn and the tangential frictional force Ff exerted by the helical blade, and the frictional force fs exerted by the screen surface.
Figure 4.
Schematic diagram of the helical blade structure and force analysis of the material particle. 1. Vertical support tube; 2. Blade support tube; 3. Mounting shaft; 4. Helical blade; 5. Reinforcing plate.
As shown in Figure 4, under the action of the tangential frictional force Ff, the resultant force Fs acting on the material in the horizontal plane deviates from the normal direction of the helical surface by the friction angle βs. The resultant force can be resolved into an axial component Fx and a radial component Fy, which are expressed as follows:
The axial component of the normal thrust Fn acts in the direction of material transport and therefore provides the driving force for material motion. In contrast, the axial components of the tangential frictional force Ff and the screen-surface frictional force fs act opposite to the direction of material advance and therefore constitute the resistance to material motion. To ensure that the material moves in the positive x-axis direction, the following condition must be satisfied:
Fncosαs > Ffsinαs + fssin(90° − αs − βs)
Since the frictional force exerted by the screen on the material acts opposite to the direction of motion, fssin(90° − αs − βs) > 0. Accordingly, Equation (5) can be rearranged as:
Fncosαs > Ffsinαs
Since Ff = Fntanβs, substitution into Equation (6) and subsequent rearrangement yield:
cotαs > tanβs
Accordingly, the design constraint for the helix angle is expressed as follows:
αs < 90° − βs
Friction experiments showed that the friction angle between the tuber–impurity mixture and the steel plate was βs = 35°. Substitution into Equation (8) yielded αs < 55°. Considering both axial conveying efficiency and structural compactness, the helix angle was set to αs = 18°.
According to the design criteria for open screw conveyors [15], the outer diameter D1 of the helical blade must satisfy the following relationship:
where Ks is the pitch coefficient, taken as 0.8; As is the comprehensive material-property coefficient, taken as 40; ψs is the material filling coefficient of the inner roller screen, taken as 0.3; and λs is the inclination coefficient, taken as 1 for horizontal conveying.
Based on screw-conveyor design practice and the design guidelines provided by the Chinese Academy of Agricultural Mechanization Sciences [16], the blade outer diameter was set to D1 = 800 mm. The pitch Ss and mounting-shaft diameter ds satisfy the following relationships with the blade outer diameter [17]:
0.8D1 ≤ Ss ≤ 1.0D1
0.2D1 ≤ ds ≤ 0.35D1
The calculated values were Ss = 650 mm and ds = 160 mm.
To ensure the continuous conveying capacity of the helical blade, its inner diameter was set to D2 = 540 mm in accordance with the design guidelines provided by the Chinese Academy of Agricultural Mechanization Sciences [16].
2.4. Kinematic Analysis and Determination of the Rotational Speeds of Key Components
2.4.1. Determination of Roller-Screen Rotational Speeds
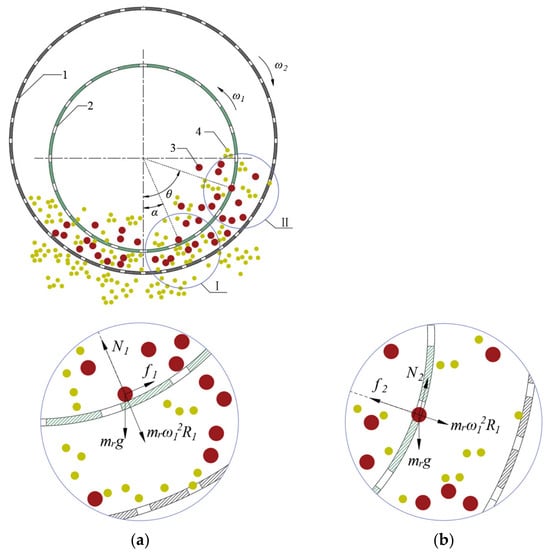
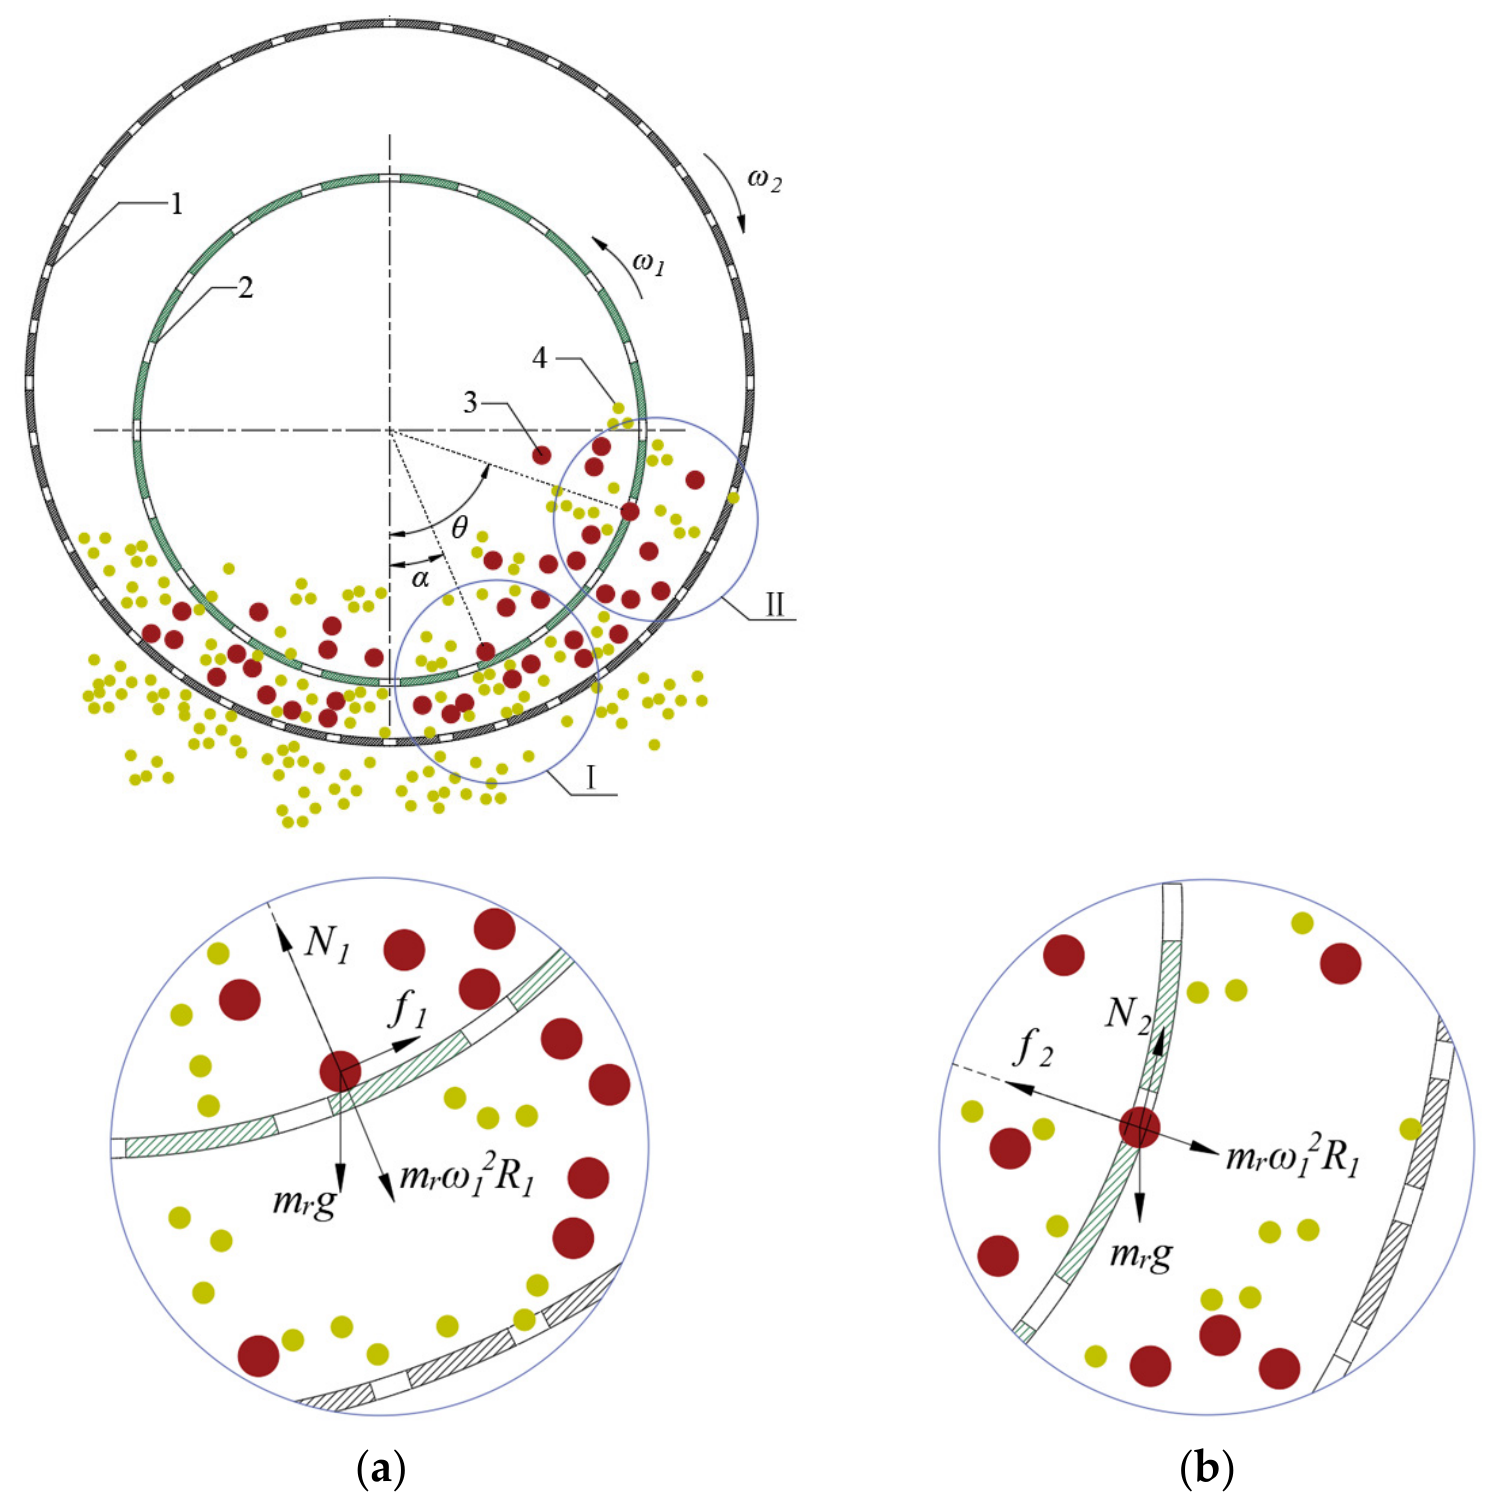
Material motion and the forces acting on the particles determine screening efficiency. Within a roller screen, material motion primarily exhibits sliding, cataracting, or centrifuging [18]. Under centrifuging conditions, the material remains attached to the screen surface and cannot be screened effectively; an appropriate rotational-speed range must be determined through critical force analysis. Taking a tiger nut tuber as the object of analysis and neglecting the interparticle interactions and forces between the particles and the helical guide vanes, force-equilibrium equations were formulated for the critical sliding and detachment conditions, as shown in Figure 5. The admissible rotational-speed range of the roller screen was then determined by incorporating the frictional characteristics of the material.
Figure 5.
Force analysis of a tiger nut tuber at critical positions in cross-sectional views perpendicular to the axes of the inner and outer roller screens. (a) Force analysis at critical position I; (b) Force analysis at critical position II. 1. Outer roller screen; 2. Inner roller screen; 3. Tiger nut tuber; 4. Soil. Red particles represent tiger nut tubers, while yellow particles represent soil particles.
The force-equilibrium equation for a tiger nut tuber at the critical condition of sliding downward along the screen surface is expressed as follows:
Solving this equation gives:
The force-equilibrium equation for a tiger nut tuber at the critical condition of being thrown through a screen aperture is expressed as follows:
Solving this equation gives:
where mr is the tuber mass, kg; α is the critical sliding angle, rad; θ is the critical detachment angle, rad; f1 is the frictional force exerted by the screen surface on the tiger nut tuber, N; f2 is the frictional force exerted by the screen aperture on the tiger nut tuber, N; ω1 is the angular velocity of the inner roller screen, rad/s; R1 is the radius of the inner roller screen, m; N1 is the normal force exerted by the screen surface on the tiger nut tuber, N; N2 is the normal force exerted by the screen aperture on the tiger nut tuber, N; and μ1 is the coefficient of friction between the tuber and the screen.
For a given angular velocity ω1, the critical detachment angle θ obtained from Equation (15) is greater than the critical sliding angle α obtained from Equation (13). This indicates that when the tiger nut tubers are sliding, they can be ejected through the screen apertures as soon as they encounter them. Therefore, the rotational speed of the roller screen can be determined based on the sliding conditions of the tiger nut tubers. According to Zhao et al. [19], the coefficient of friction between tiger nut tubers and the screen is μ1 = tan φ1. The sliding friction angle between the tuber and steel was φ1 = 18°; therefore, μ1 = tan φ1 = 0.32. To maintain stable tumbling and avoid premature transition to centrifuging, the minimum critical sliding angle α was set 5–10° higher than φ1 [20]; thus, αmin = 25°. As α increases, the sliding region of the material becomes longer. However, once α exceeds 90°, the motion changes from sliding to parabolic free fall after detachment, markedly reducing the probability of passage through the apertures. Thus, αmax was set to 90°. Substituting R1 = 0.7 m, αmin = 25°, and αmax = 90° into Equation (13) and rounding gave an inner roller screen rotational-speed range of 22 r/min ≤ ni ≤ 62 r/min. Analogously, the sliding friction angle between soil and steel was measured as φ2 = 22°; so μ2 = tan φ2 = 0.404. Setting αmin = 27° and αmax = 90° to prevent the soil from entering the cataracting regime and falling back into the inner roller screen, and substituting R2 = 0.95 m into Equation (13) yielded the outer roller screen rotational-speed range of 15 r/min ≤ no ≤ 47 r/min.
The single-particle force analysis above describes critical sliding and detachment on a rotating screen under the adopted friction conditions, while neglecting interparticle interactions and the forces exerted by the helical guide vanes. Its applicability is therefore limited to estimating the admissible rotational-speed ranges for representative particles, rather than predicting the collective motion or separation performance of the tuber–soil–root mixture. Under field conditions, particle collisions, soil agglomeration and adhesion, and root entanglement may modify the actual particle motion.
2.4.2. Kinematic Analysis of Relative Motion Between the Inner and Outer Roller Screens
After these ranges had been determined, the relative motion between the two screen surfaces was examined to quantify the additional disturbance generated by counter-rotation. Based on the critical rotational-speed analysis of a single particle, the tangential kinematic behavior of the material within the double-layer roller screen was described.
To elucidate the mechanism by which different combinations of rotational directions affect screening performance, rotational-direction coefficients s1 and s2 were introduced, with clockwise rotation defined as s = +1 and counterclockwise rotation as s = −1. The equivalent relative linear velocity between the inner and outer roller screens can be expressed as follows:
vi = |s1R1ω1 − s2R2ω2|
When the inner and outer roller screens rotate in the same direction, s1 = s2, and the equivalent relative linear velocity is expressed as follows:
vis = |R1ω1 − R2ω2|
When the inner and outer roller screens rotate in opposite directions, s1 = −s2, and the equivalent relative linear velocity is expressed as follows:
where s1 is the rotational-direction coefficient of the inner roller screen; s2 is the rotational-direction coefficient of the outer roller screen; R2 is the radius of the outer roller screen, m; ω2 is the angular velocity of the outer roller screen, rad/s; vi is the equivalent relative linear velocity, m/s; vis is the equivalent relative linear velocity under co-rotating conditions, m/s; and vir is the equivalent relative linear velocity under counter-rotating conditions, m/s.
vir = R1ω1 + R2ω2
For the same pair of rotational speeds, Equations (17) and (18) show that counter-rotation produces a greater equivalent relative linear velocity between the screen surfaces than co-rotation. As illustrated by the cross-sectional arrangement in Figure 5, the inner and outer roller screens form an annular space. Tubers and fine soil particles enter this space through the inner-screen apertures. The oppositely moving screen surfaces impart different tangential motions to particles through frictional contact. During material transfer and subsequent contact with the outer screen, differences in tangential motion, together with interparticle friction and collisions, promote localized shear, relative sliding, and gravity-assisted tumbling. These interactions facilitate circumferential redistribution, weaken synchronous material motion with the screen surfaces, and help alleviate localized accumulation, thereby increasing opportunities for fine soil particles to pass through the outer-screen apertures. The equivalent relative linear velocity therefore characterizes the kinematic difference between the tangential velocities of the two screen surfaces, rather than the actual shear rate or separation performance of the mixture. The associated changes in material distribution and accumulation were subsequently evaluated using DEM simulations.
2.4.3. Determination of the Rotational Speed of the Separating Screw Conveyor
The axial conveying capacity of the helical blade was required to exceed the feed quantity of the inner roller screen [21] as follows:
where δs is the minimum clearance between the outer edge of the helical blade and the inner roller screen, taken as 30 mm. Calculation and rounding yielded ns ≥ 40 r/min.
The risk of tuber damage increases with the peripheral speed of the helical blade. The critical linear velocity vz at the instant of contact was therefore evaluated from Hertz contact theory [22]:
where σz is the minimum critical stress causing damage, taken as 10.4 MPa; Rz is the equivalent relative radius of curvature, taken as 4.6 mm; E is the equivalent elastic modulus, taken as 42.8 MPa; mz is the mass of a single tuber, taken as 1.1 × 10⁻³ kg; and F2(z) is the correction coefficient, taken as 1. The calculated critical linear velocity was vz ≈ 5.7 m/s, corresponding to a rotational speed of 160 r/min after conversion and rounding. However, because damage resistance in biological materials is affected by product structure, loading mode, and test conditions [23,24], this Hertz-based critical velocity was treated as a theoretical upper bound for defining the design space rather than as an experimentally validated damage threshold.
Consequently, the admissible rotational-speed range of the separating screw conveyor was determined as 40 r/min ≤ ns ≤ 160 r/min. This range provides adequate loosening and conveyance while limiting the risk of excessive impact-induced tuber damage, thereby defining the operating range for subsequent parameter optimization.
2.5. Simulation Setup
To quantitatively evaluate the screening performance of the counter-rotating configuration and clarify the effects of operating parameters on separation performance, a discrete element method (DEM) model of tuber–impurity separation was established. Comparative simulations of the co-rotating and counter-rotating configurations were then performed, followed by multifactor simulations for parameter optimization.
2.5.1. Simulation Model and Parameter Settings
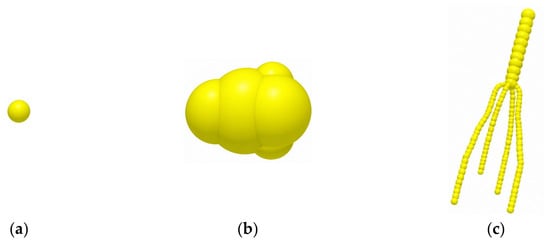
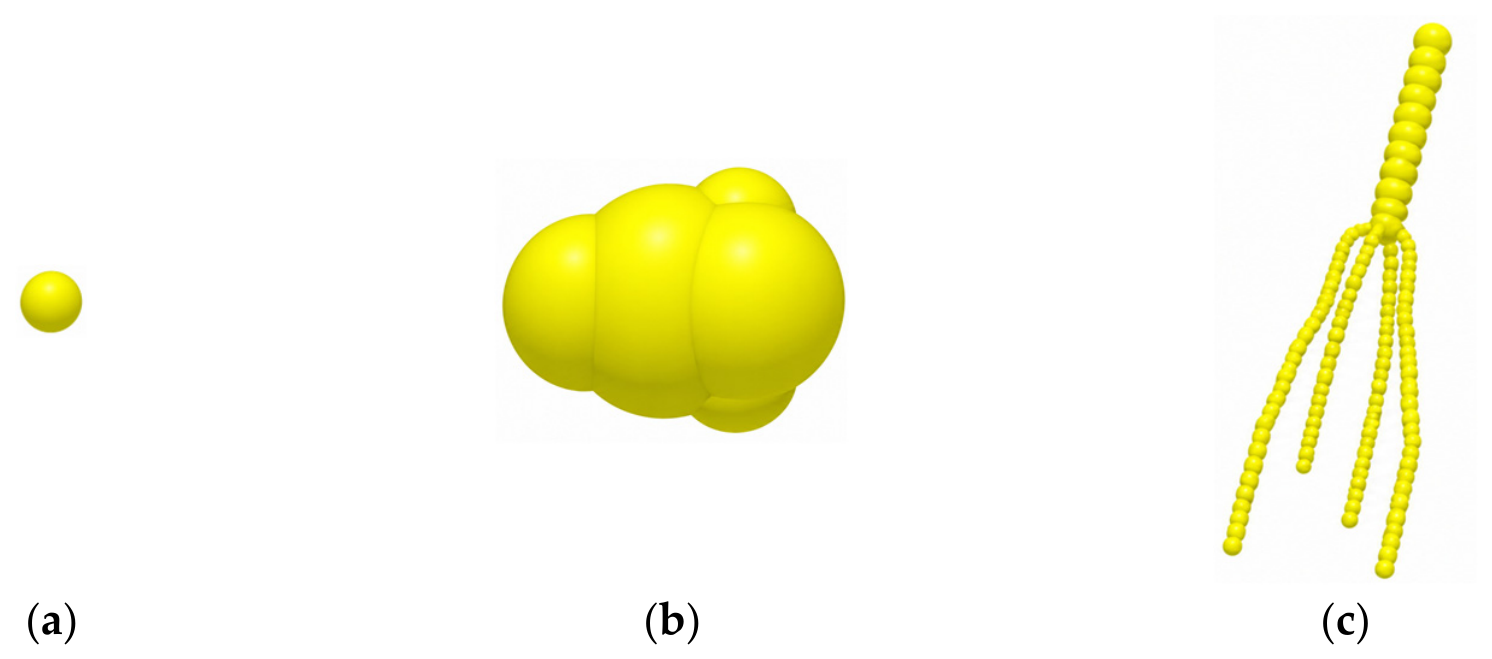
The tiger nut harvest material used for model development was collected on 26 September 2025 from a cultivation area in Zhongmu County, Zhengzhou, Henan Province, China. On the basis of its field material composition, the complex mixture was simplified into three principal components: tiger nut tubers, soil particles, and root impurities. This simplification improved computational efficiency while retaining adequate simulation fidelity. As shown in Figure 6a, soil particles were modeled as spherical particles with a fixed radius of 1 mm in EDEM 2024 [25,26]. A three-dimensional tuber model was constructed from measured triaxial dimensions, exported in STL format, and imported into EDEM 2024 for particle filling, as shown in Figure 6b. The resulting particle model measured 14 mm × 11 mm × 9 mm. The discrete-element model of the root impurity was established based on its actual physical geometry, as shown in Figure 6c. The upper portion comprised spherical elements of 4 mm radius with a center-to-center spacing of 5 mm, and the lower portion comprised spherical elements with a radius of 1.5 mm and a center-to-center spacing of 2 mm. The total root impurity length was 148 mm.
Figure 6.
Material particle models. (a) Soil particle; (b) Tiger nut tuber; (c) Root impurity.
Because the cultivation-area soil was a loose sandy soil, the Hertz–Mindlin (no slip) model was adopted as the base contact model for particle–particle and particle–geometry interactions [27]. The material and contact parameters were obtained from laboratory measurements or adopted from values reported by Zhang et al. [28] and are summarized in Table 2 and Table 3.
Table 2.
Physical parameters of the materials.
Table 3.
Contact parameters of the materials.
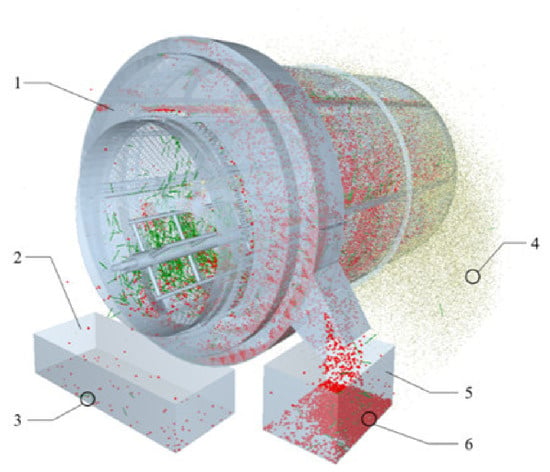
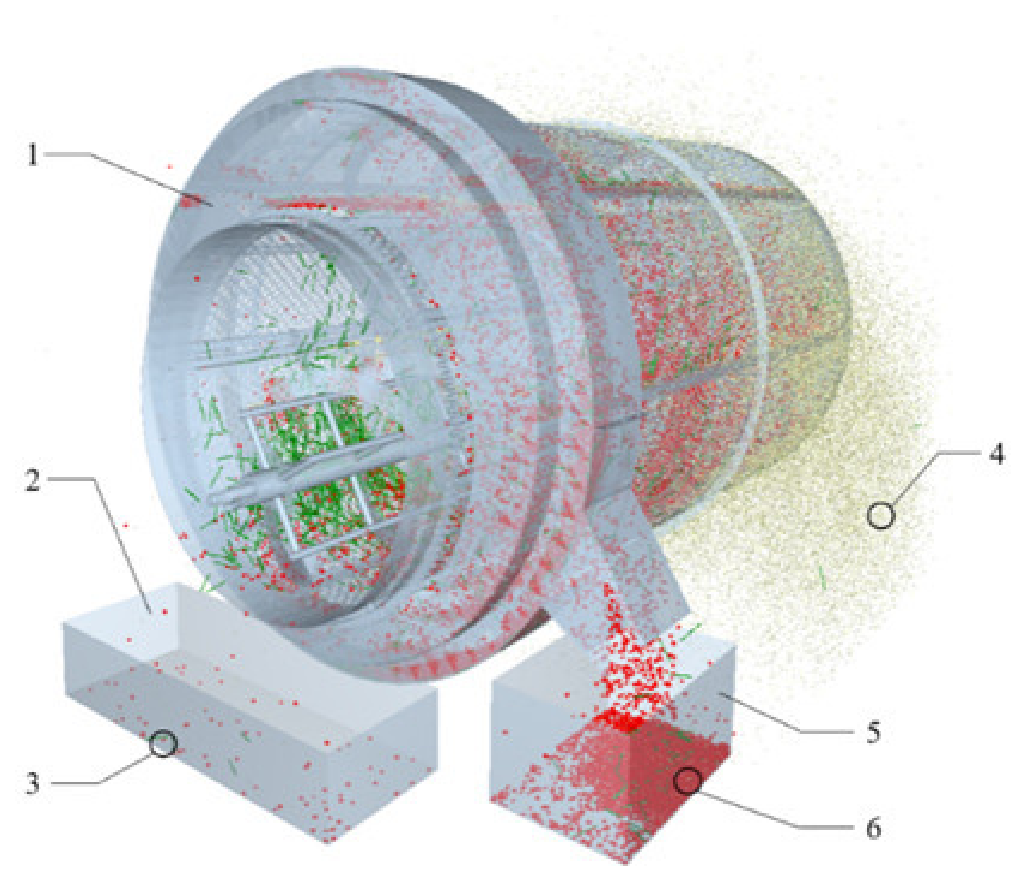
The three-dimensional model of the separation device with a ratio of 1:1 was constructed in SolidWorks 2018 and imported into EDEM 2024, as shown in Figure 7. The material generation rate was set to 43 kg/s, with the mixture consisting of 6% tiger nut tubers, 4% impurities, and 90% soil. The simulation time step was set to 20% of the Rayleigh time step [29]. Particles were generated from t = 0 to 5 s. After particle generation ceased, the remaining particles continued to enter the inner roller screen, and material feeding into the screen was complete at t = 6 s. The total simulation duration was 20 s, and the data-saving interval was 0.5 s.
Figure 7.
Experimental simulation model. 1. Separation device; 2. Inner roller screen discharge collection box; 3. Root; 4. Soil; 5. Outer roller screen discharge collection box; 6. Tiger nut tuber. Red, yellow, and green particles represent tiger nut tubers, soil particles, and root impurities, respectively.
2.5.2. Design of the Comparative Simulation Experiment
To compare the screening performance of the co-rotating and counter-rotating configurations, two operating schemes were established: co-rotating and counter-rotating motion. The rotational speeds of the outer and inner roller screens were fixed at 31 and 42 r/min, respectively. The rotational speed of the separating screw conveyor was fixed at 100 r/min. Only the rotation direction of the inner roller screen was varied, as shown in Table 4. Each scheme was independently simulated five times to reduce random error. After each run, three masses were recorded separately: the mass of tiger nut tubers in the outer-screen discharge collection box (m1), the mass of impurities in the same box (m2), and the mass of tiger nut tubers in the inner-screen discharge collection box (m3). The separation rate Kf and impurity content Kh were calculated as follows:
Kf = m1/(m1 + m3) × 100%
Kh = m2/(m1 + m2) × 100%
Table 4.
Comparative simulation design for different motion configurations.
2.6. Design of the Field Experiment
2.6.1. Field Trial Conditions
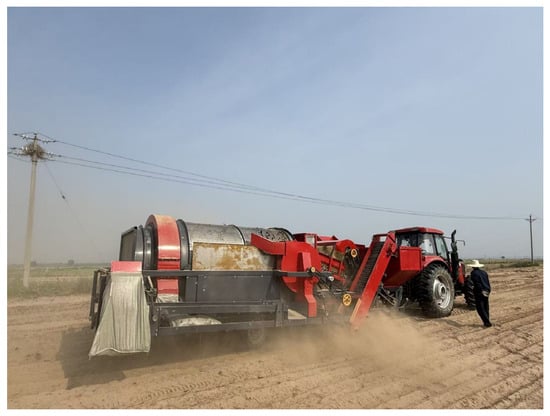
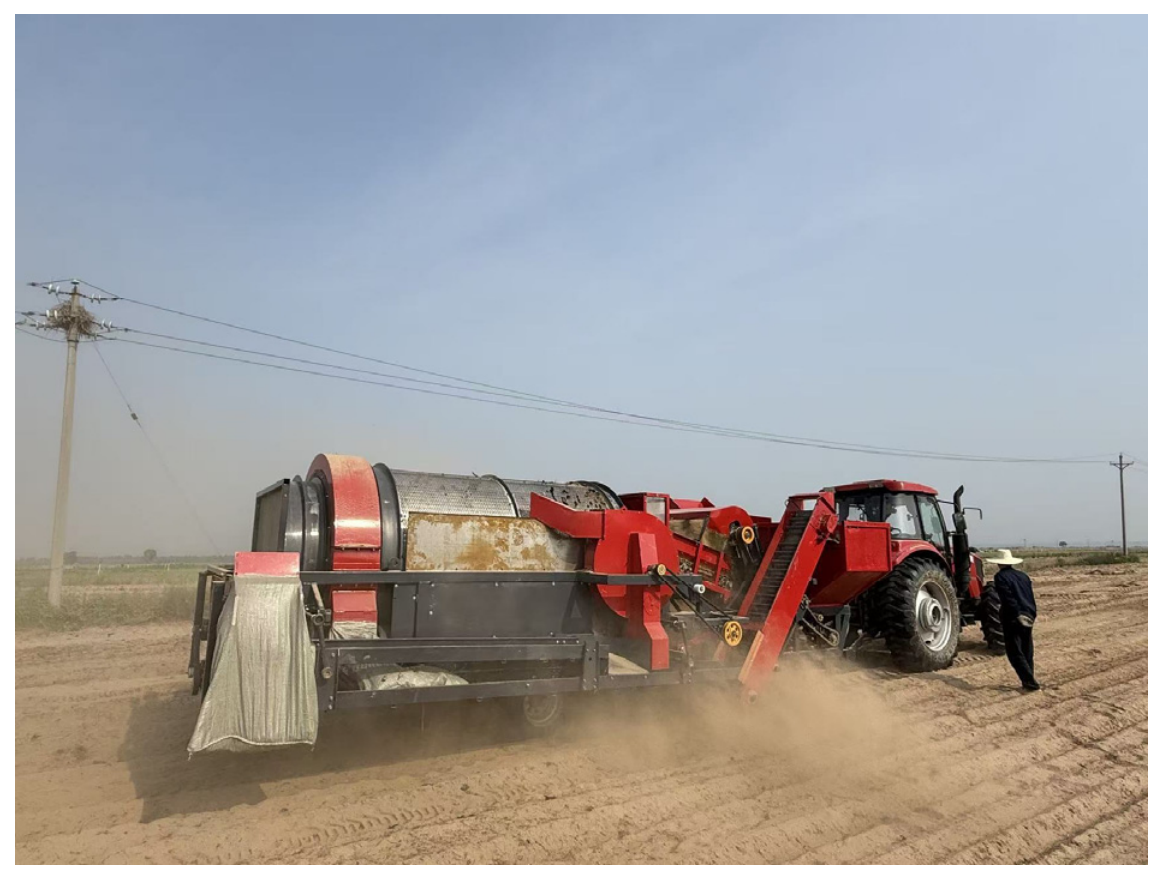
A field experiment was conducted on 19 November 2025 in a tiger nut production area in Zhongmu County, Zhengzhou, Henan Province, China, as shown in Figure 8. The crop was grown by flat planting in sandy soil at a plant spacing of 30 cm and a row spacing of 20 cm. The tuber-bearing layer extended from 8 to 15 cm below the soil surface. Soil samples were taken at a depth of 10 cm using a five-point sampling method. The measured soil moisture content ranged from 11.7% to 18.0%. No rainfall, strong winds, or other adverse weather conditions occurred during the experimental period. Before the experiment, the aboveground stems and leaves of the tiger nut plants had been removed, leaving a stubble height of 7–10 cm. The power unit was a Dongfanghong LX1504 tractor. Other equipment and instruments included shovels, stopwatches, electronic balances, measuring scales, woven bags, etc.
Figure 8.
Field experiment at the optimized parameter combination.
2.6.2. Field Trial Program
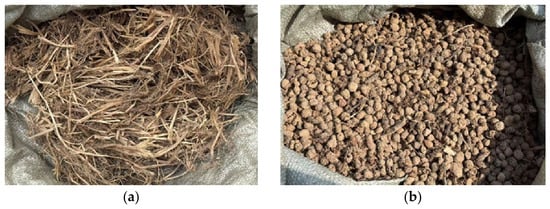
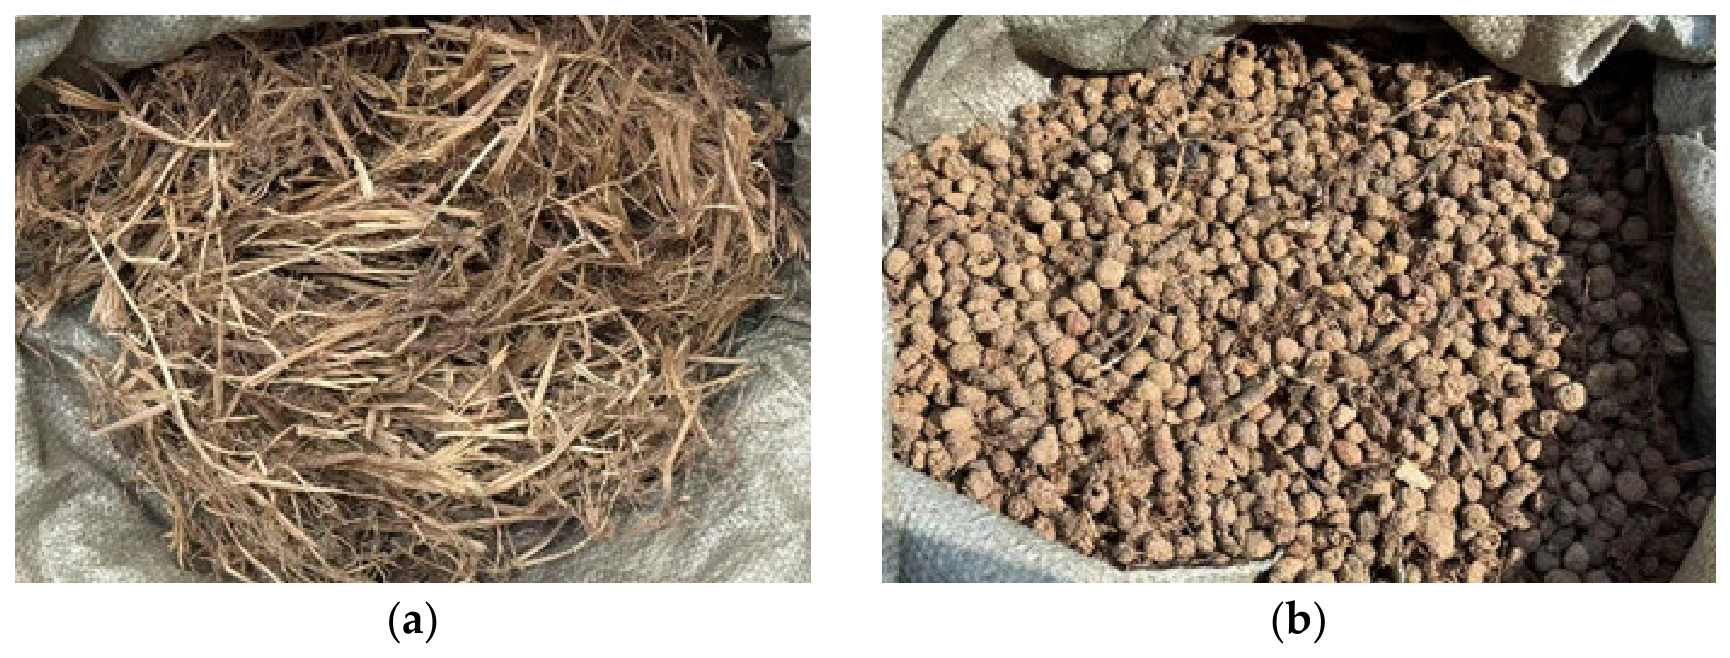
All working components of the harvester were inspected and adjusted before the experiment. The transmission system operated normally, and no loose connections were found. Trials were conducted in accordance with GB/T 8097-2008, Equipment for harvesting—Combine harvesters—Test procedure [30]. Each test strip was 40 m long and comprised a 10 m run-in section, a 25 m measurement section, and a 5 m stopping section to complete material separation. During the field trials, the tractor forward speed was maintained at 0.7 km/h. Based on the simulation optimization, the rotational speeds of the outer roller screen, inner roller screen, and separating screw conveyor were set to 20, 53, and 122 r/min, respectively. Woven bags were fitted and sealed at the outer-screen discharge outlet and the tuber–impurity conveyor outlet to collect all discharged material without leakage. After the machine had reached steady operation, the materials discharged from the two outlets were collected separately, as shown in Figure 9, manually sorted into tubers and impurities, and weighed. The separation rate and impurity content were then calculated using Equations (21) and (22).
Figure 9.
Materials collected from the two discharge outlets. (a) Material collected from the tuber–impurity conveyor outlet; (b) Material collected from the outer-screen discharge outlet.
2.7. Statistical Analysis
Mean values were used to summarize the comparative simulation and field trial results. Standard deviations and coefficients of variation were calculated to characterize variability among the center-point simulation replicates and among the field trials.
Quadratic polynomial regression models for separation rate (Kf) and impurity content (Kh) were fitted using Design-Expert 13. Analysis of variance (ANOVA) was performed, with F-tests used to evaluate the initial full quadratic models and their linear, interaction, and quadratic terms. Effects were considered significant at p < 0.05 and highly significant at p < 0.01. Pure error was estimated from the center-point replicates and used in the lack-of-fit tests. Nonsignificant interaction terms were omitted from the reported regression equations. The relative strengths of the linear effects were compared using their F-values.
3. Results
3.1. Simulated Tuber–Impurity Separation Process
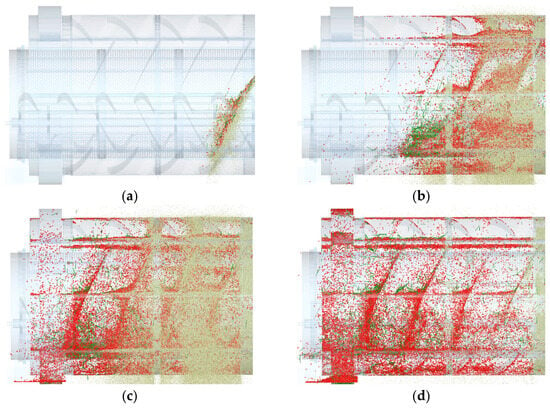
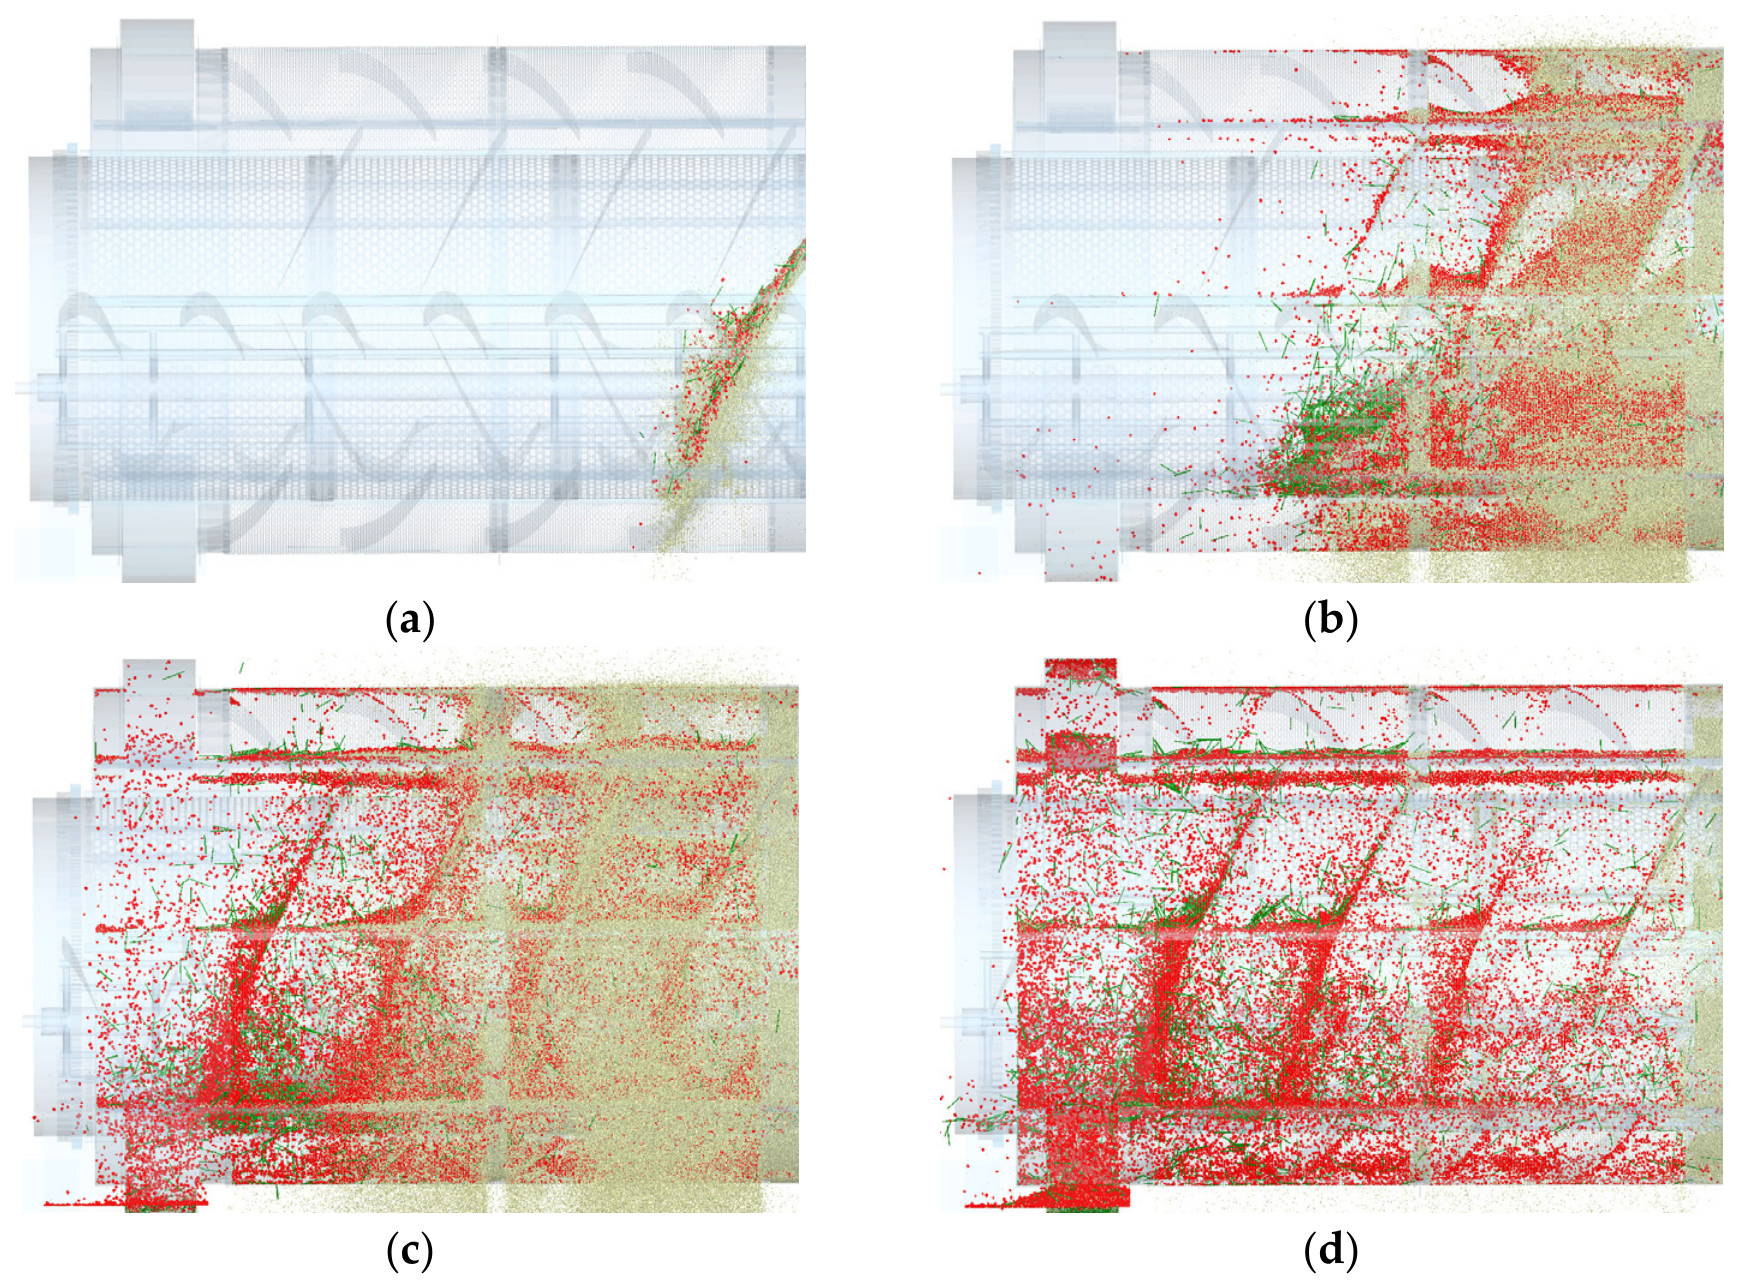
To illustrate the classification and discharge of the mixture within the double-layer roller screen, the counter-rotating configuration was used as a representative case. Material distributions at successive simulation times were extracted and analyzed, as shown in Figure 10.
Figure 10.
Simulated tuber–impurity separation process. (a) t = 1 s; (b) t = 6 s; (c) t = 10 s; (d) t = 15 s. Red, yellow, and green particles represent tiger nut tubers, soil particles, and root impurities, respectively.
From 0 to 6 s, the mixture continuously entered the roller screen and accumulated mainly near the inlet. Under the combined effects of gravity, rotation of the roller screens, and agitation by the separating screw conveyor, relative motion developed among the material components. These actions continuously tumbled, dispersed, and conveyed the mixture axially, thereby weakening the contacts among tubers, soil, and root impurities and increasing material dispersion. At this stage, the separation process was still at an early stage.
At t = 10 s, the separation process became increasingly evident. Roller screen rotation and agitation by the separating screw conveyor caused a portion of the tiger nut tubers to pass through the inner screen apertures into the outer roller screen and move toward the discharge region. Meanwhile, numerous soil particles passed through the outer screen apertures and were discharged under gravity and centrifugal action, while the root impurities continued to be conveyed axially within the inner roller screen and were progressively discharged.
At t = 15 s, the separation process had entered its final stage. The material remaining in the outer roller screen consisted primarily of tiger nut tubers and a small quantity of fine impurities. As the outer roller screen continued to rotate, the tubers were conveyed toward the discharge end by the helical guide vanes and subsequently fell into the corresponding collection box.
The DEM results visualized the continuous feeding, staged screening, and directional discharge of the tuber–impurity mixture, thereby providing a basis for comparing the two motion configurations and optimizing the operating parameters.
3.2. Comparison of Screening Performance Under Co-Rotating and Counter-Rotating Conditions
3.2.1. Material Distribution and Accumulated Mass Within the Roller Screen
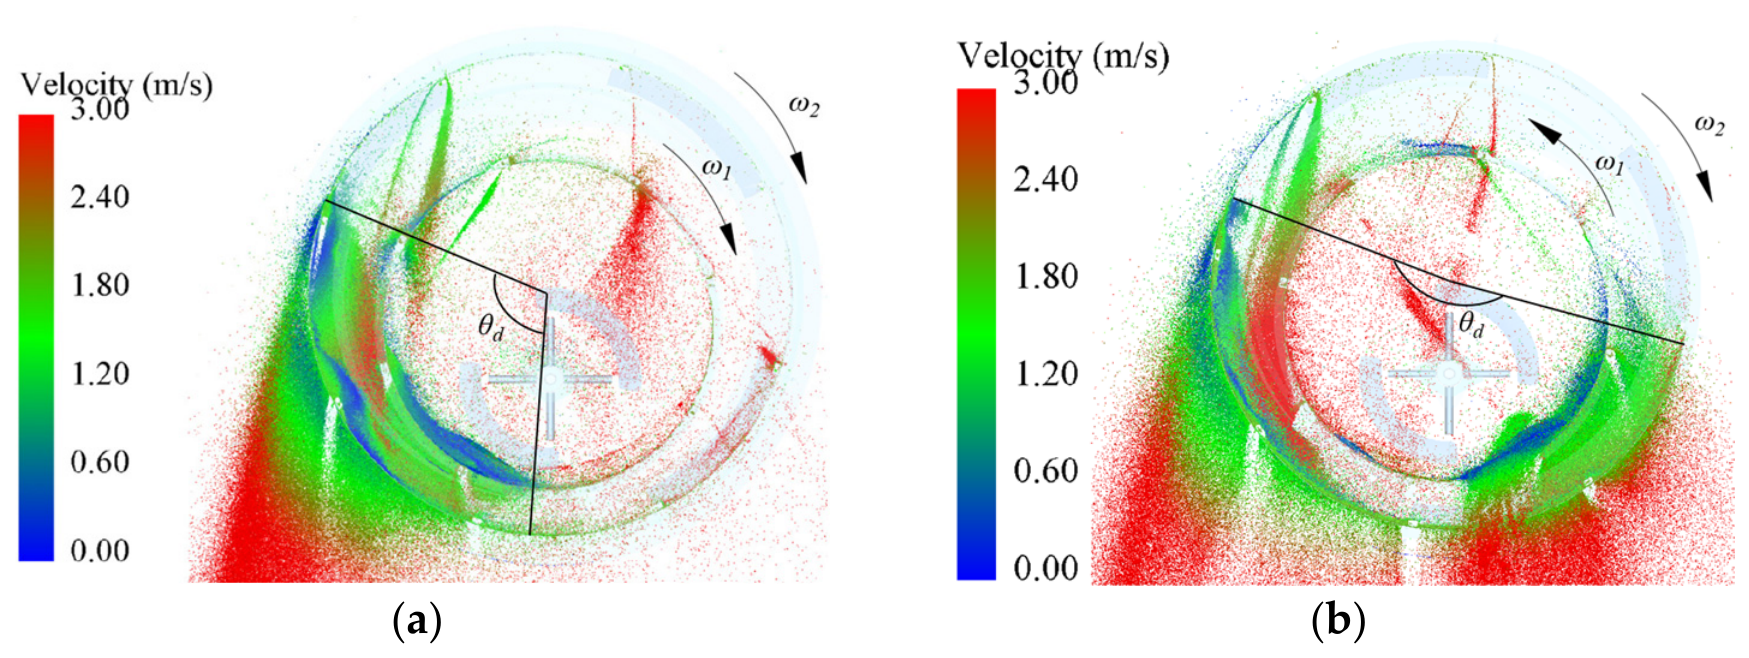
To compare the motion of the tuber–soil mixture in the annular space between the inner and outer roller screens under the two configurations, particle velocities and spatial distributions at t = 6 s were extracted, as shown in Figure 11. To characterize the circumferential spreading of the harvested material at this instant, the circumferential distribution angle θd was introduced. Under co-rotating conditions, the tangential motions of the two screen surfaces were in the same direction, causing the material to tend to move synchronously with the screen surfaces. The resulting low relative velocity caused the harvested material to remain concentrated within a relatively limited circumferential range, with θd = 109°. Under counter-rotating conditions, the relative shear generated by the oppositely moving screen surfaces inhibited the synchronous motion of the harvested material and promoted its circumferential redistribution. The distribution angle increased to θd = 194°, which was 85° larger than that under co-rotation, corresponding to an increase of approximately 78.0%. This broader circumferential distribution indicated that the harvested material was less concentrated within a limited portion of the screen surface and provided more favorable conditions for soil particles to reach and pass through the screen apertures.
Figure 11.
Particle velocity and spatial distribution in cross-sectional views perpendicular to the axes of the inner and outer roller screens at t = 6 s under different motion configurations. (a) Co-rotating motion, θd = 109°; (b) Counter-rotating motion, θd = 194°. The color scale indicates particle velocity magnitude, increasing from blue (low velocity) to red (high velocity).
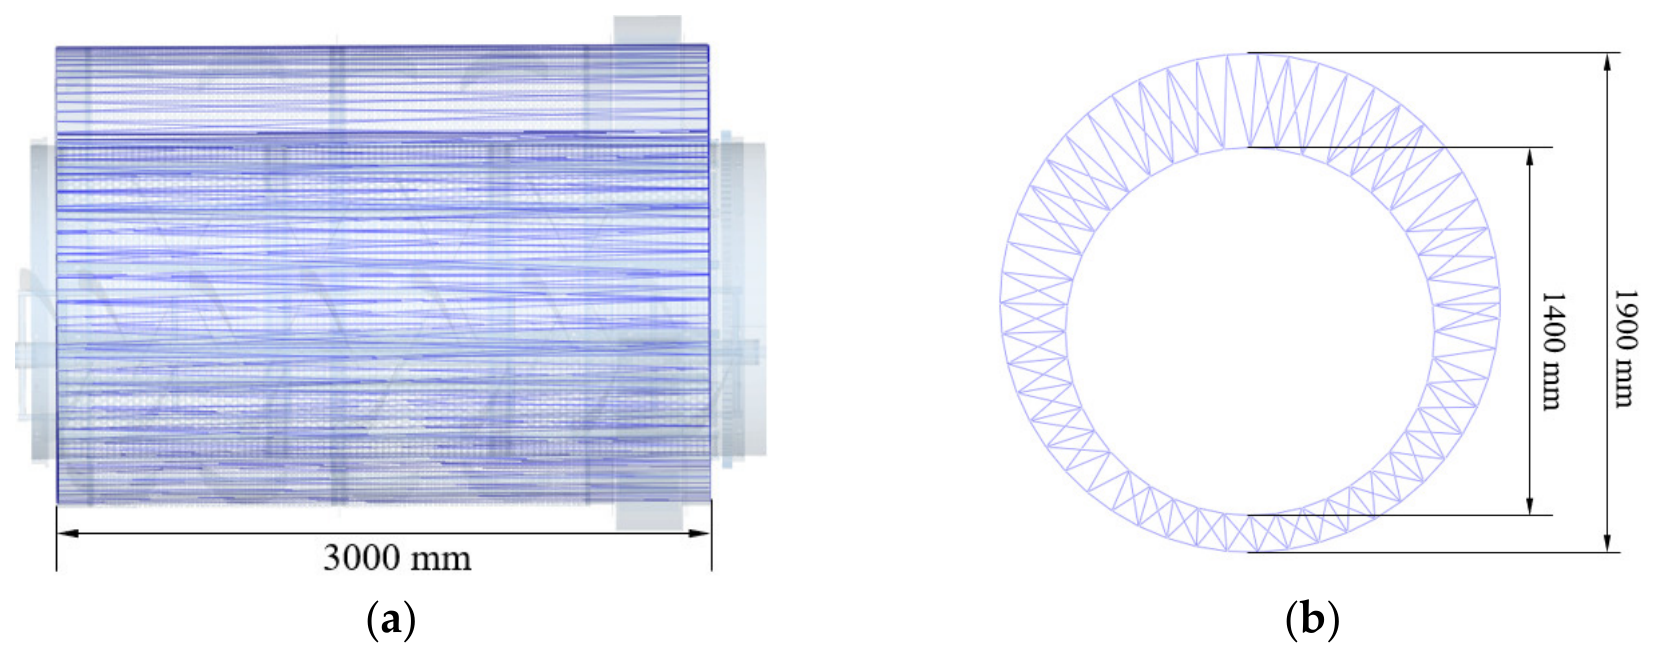
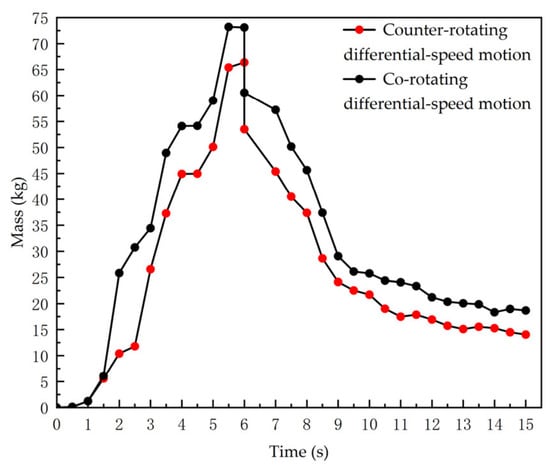
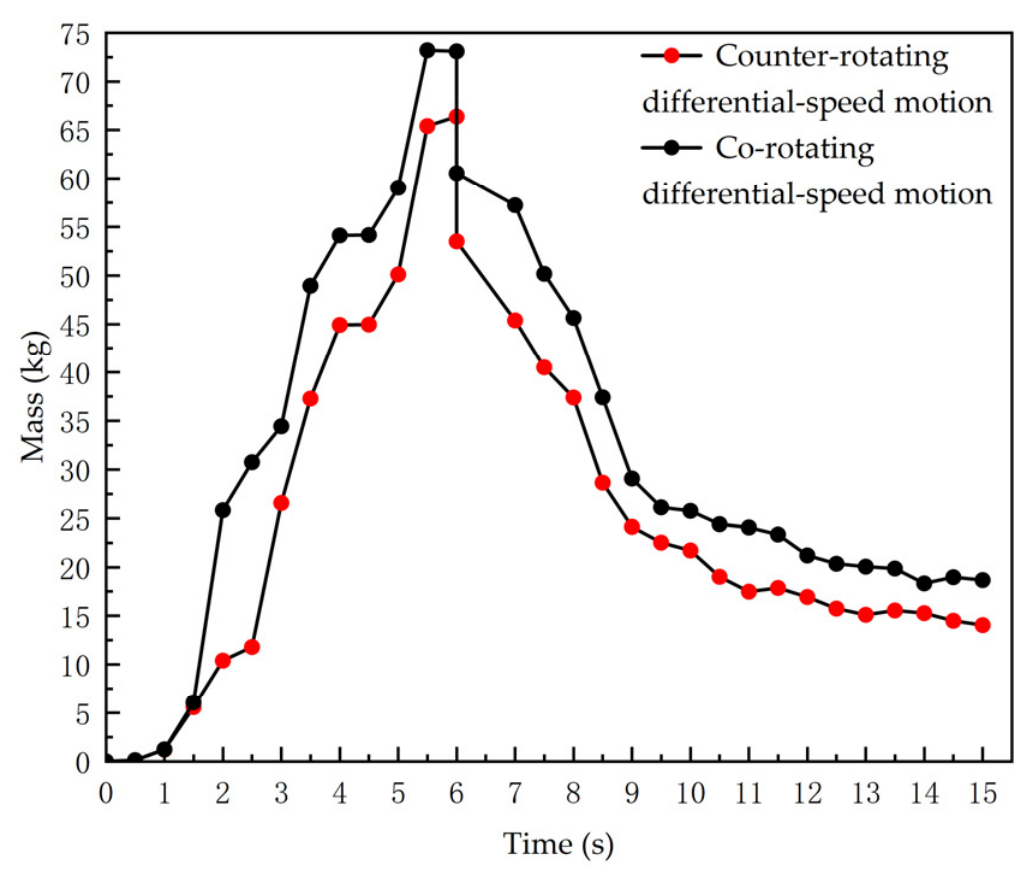
To further characterize the temporal evolution of material accumulation between the inner and outer screen surfaces, an annular grid-based statistical region was defined, as shown in Figure 12. Leveraging the geometric assembly relationship between the two roller screens, the axis of this region was aligned with that of the outer roller screen. The region had an outer diameter of 1900 mm, an inner diameter of 1400 mm, and a total length of 3000 mm. Figure 13 presents the variation in total material mass within this annular statistical region over time under the two motion configurations. The statistical interval was set to 0–15 s, by which time the tuber–impurity separation process was essentially complete. This interval therefore fully captures the dynamic variation in the material within the region.
Figure 12.
Grid configuration in the outer roller screen region. (a) Length of the annular grid-based statistical region; (b) Inner and outer diameters of the annular grid-based statistical region.
Figure 13.
Variation in the total material mass within the annular grid-based statistical region.
Under both configurations, the total mass within the region first increased and then decreased, as shown in Figure 13. From 0 to 6 s, continuous feeding and the passage of soil and tubers through the inner roller screen into the outer roller screen caused the mass within the annular region to increase. At approximately t = 6 s, feeding of the tuber–impurity mixture was completed. Because a substantial portion of the soil had not yet been discharged from the statistical region, the total material mass reached peak values of approximately 73.2 kg in Scheme I and 66.4 kg in Scheme II. Thereafter, soil was discharged through the outer roller screen apertures, while tubers were conveyed axially by the helical guide vanes, and the mass declined progressively. Throughout the simulation, the counter-rotating scheme exhibited a lower rate of mass increase during feeding, a lower peak mass (6.8 kg less than under co-rotation, corresponding to a reduction of approximately 9.3%), and consistently lower mass at subsequent times. This trend was consistent with the broader circumferential distribution observed in Figure 11. Together, the broader circumferential distribution and lower accumulated mass indicate that counter-rotation alleviated localized accumulation and provided more favorable conditions for soil discharge through the outer-screen apertures.
3.2.2. Comparative Analysis of Separation Rate and Impurity Content
To quantify the effect of motion configurations on separation performance, the masses of tiger nut tubers and impurities collected in the outer roller screen discharge box, together with the mass of tubers incorrectly discharged through the inner-screen outlet, were recorded after each run. The separation rate Kf and impurity content Kh were then calculated. The mean results of five replicate simulations are presented in Table 5.
Table 5.
Simulated separation rate and impurity content under two motion configurations.
Relative to co-rotation, counter-rotation raised the mean separation rate from 92.94% to 96.28% (an absolute increase of 3.34 percentage points) and lowered the mean impurity content from 27.97% to 23.90% (an absolute decrease of 4.07 percentage points). Mechanistically, the superposition of tangential velocities under counter-rotating motion intensified the secondary disturbance of the material. This promoted smooth tuber conveyance, reduced losses arising from incomplete separation, increased the probability of soil-particle passage through the screen apertures, and thereby reduced the impurity content of the recovered tubers. These results indicate improved separation performance under counter-rotating conditions within the investigated DEM simulations.
3.3. Response Surface Simulation Experiment for Operating-Parameter Optimization
3.3.1. Experimental Design
Three operating parameters with significant effects on tuber–impurity separation performance were selected as experimental factors: the rotational speed of the outer roller screen (factor A), the rotational speed of the inner roller screen (factor B), and the rotational speed of the separating screw conveyor (factor C). A three-factor, three-level Box–Behnken design was used for the simulation experiments. The coded factor levels are listed in Table 6.
Table 6.
Coded levels of the experimental factors.
3.3.2. Experimental Results
Seventeen simulation runs were performed using the Box–Behnken design module in Design-Expert 13, comprising twelve non-center design points and five center-point replicates for estimation of pure error, as shown in Table 7.
Table 7.
Design and results of the simulation experiments.
Across the 17 runs, Kf ranged from 79.84% to 96.94% (mean value 91.91%) and Kh ranged from 23.27% to 34.71% (mean value 28.92%), as shown in Table 7. For the five center-point replicates, the mean separation rate and impurity content were 96.28% and 23.90%, respectively, with standard deviations of 0.70 and 0.73 percentage points and coefficients of variation of 0.73% and 3.06%. Variations in the spatial distribution of generated particles may alter subsequent interparticle collisions and contact with the screen surfaces, contributing to the differences among repeated runs. These results indicate good repeatability under the center-point conditions.
3.3.3. Establishment of Regression Models and Significance Analysis
The ANOVA results for the full quadratic regression models of Kf and Kh are presented in Table 8 and Table 9, respectively.
Table 8.
Analysis of variance for the regression model of separation rate Kf.
Table 9.
Analysis of variance for the regression model of impurity content Kh.
As shown in Table 8, the overall regression model for Kf was highly significant (F = 137.12, p < 0.0001), while the lack of fit was not significant (p = 0.6945 > 0.05). The main effects A, B, and C, the interactions AB and BC, and the quadratic terms A2, B2, and C2 were all highly significant (p < 0.01), whereas AC was nonsignificant. Ranking of the main-effect F values gave the order of influence C > A > B.
As shown in Table 9, for Kh, the overall model was likewise highly significant (F = 68.94, p < 0.0001), whereas the lack of fit term was not significant (p = 0.7069 > 0.05). The main effects A, B, and C, and the quadratic terms A2, B2, and C2 were highly significant (p < 0.01), while the interaction term AC was significant (p < 0.05). Based on their F values, the relative importance of the main effects on the impurity content followed the order C > A > B.
The regression equations relating the two responses to the coded factors were expressed as follows:
where A, B, and C are the coded values of the rotational speeds of the outer roller screen, inner roller screen, and separating screw conveyor, respectively.
Kf = 96.28 − 2.50A + 1.70B + 4.98C + 1.36AB − 1.43BC − 1.95A2 − 1.07B2 − 6.27C2
Kh = 23.90 + 1.71A − 1.43B − 1.90C + 0.77AC + 4.55A2 + 2.47B2 + 3.66C2
To facilitate prediction using actual rotational speeds, the coded factors were converted according to the factor levels in Table 6 as (A = (no-31)/16), (B = (ni-42)/20), and (C = (ns-100)/60). Substituting these relations into Equations (23) and (24) yielded the corresponding regression equations in actual units:
where no, ni, and ns are the rotational speeds (r/min) of the outer roller screen, inner roller screen, and separating screw conveyor, respectively. The optimal combination of the three operating parameters can be determined by solving the two regression models above.
3.3.4. Analysis of Interaction Effects on the Performance Indices
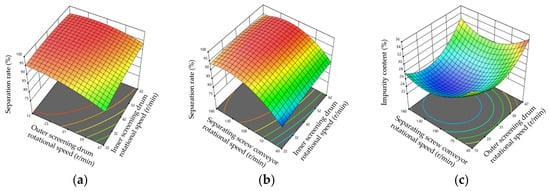
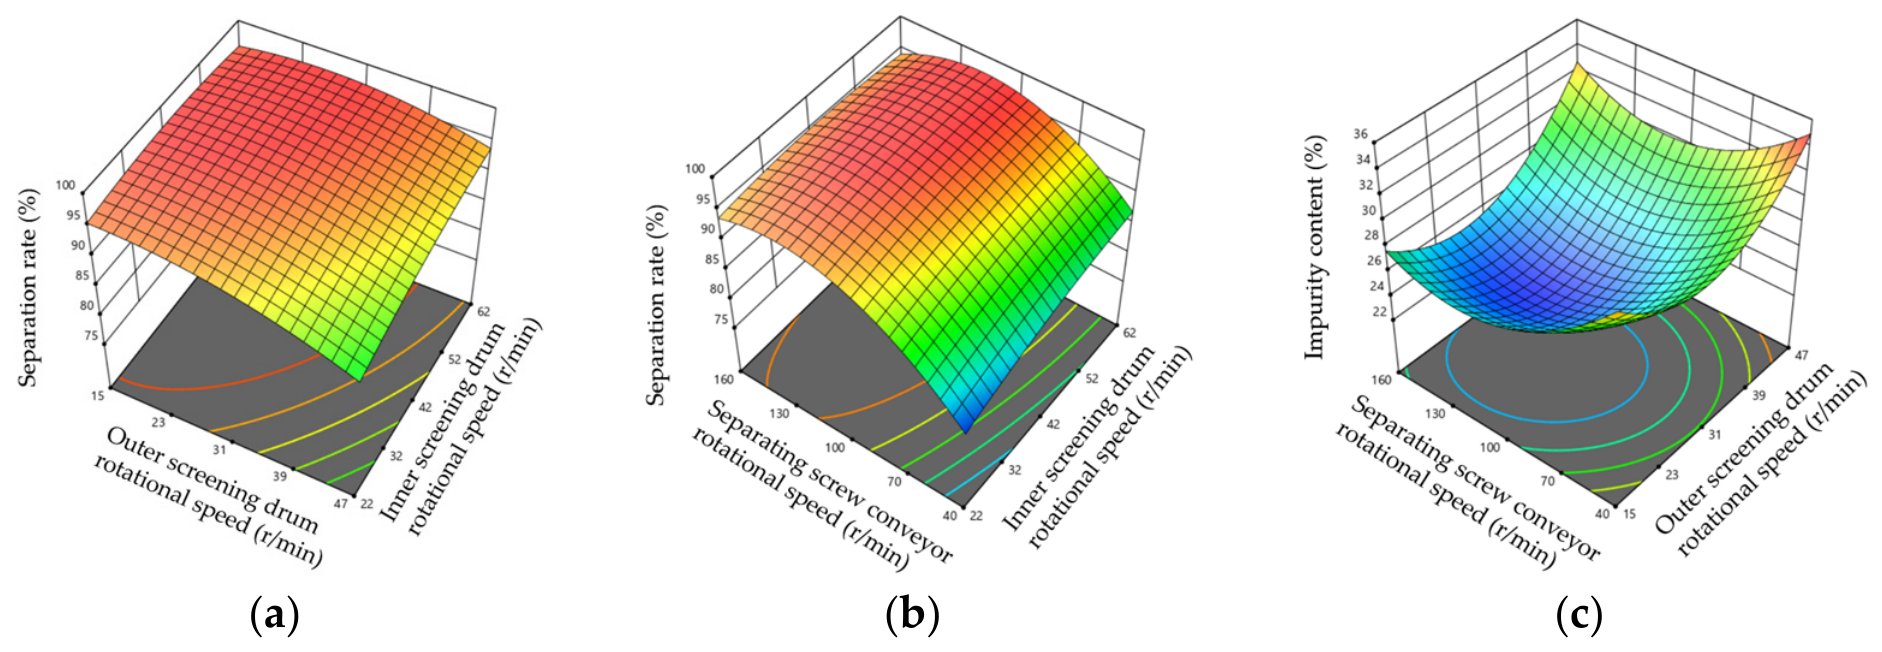
Response surface methodology has been widely used for parameter optimization of agricultural cleaning equipment [31]. In the present study, three-dimensional response surface plots for the significant interaction terms were generated using Design-Expert 13, as shown in Figure 14.
Figure 14.
Response surfaces showing the effects of factor interactions on the experimental indices. (a) C = 0, separation rate; (b) A = 0, separation rate; (c) B = 0, impurity content.
The AB interaction exerted a highly significant effect on the separation rate, as shown in Figure 14a. At low inner-screen speed, increasing outer-screen speed markedly reduced Kf; this adverse effect weakened at high inner-screen speed. A higher inner-screen speed promoted more thorough tumbling within the inner roller screen and increased the probability of passage through the screen apertures. Under counter-rotating conditions, the equivalent relative linear velocity vir between the two screen surfaces increases with the inner roller screen speed, as shown in Equation (18). The resulting stronger secondary disturbance partially offset the negative influence of raising the outer roller screen speed, consistent with the milder slope observed at high B in Figure 14a.
The BC interaction also had a highly significant effect on the separation rate, as shown in Figure 14b. Its F-value slightly exceeded that of AB, indicating a slightly stronger interaction within the investigated ranges. At a low screw-conveyor speed, increasing the inner-screen speed substantially increased Kf. However, this positive effect diminished as the screw-conveyor speed increased. A possible explanation is that, at a low speed of the separating screw conveyor, material loosening and agitation were insufficient. Increasing the inner-screen speed therefore intensified material tumbling and increased contact between the tubers and the screen apertures, thereby increasing the probability of tuber passage. Once the screw conveyor provided sufficient axial conveying and loosening, further increases in inner-screen speed produced only limited gains.
The AC interaction had a significant effect on impurity content, as shown in Figure 14c. At low outer-screen speed, Kh initially decreased as the screw-conveyor speed increased and then increased after reaching a minimum. At a high outer-screen speed, the effect of C was weaker, as indicated by the wider spacing of the contour lines. An excessively high conveyor speed shortened the residence time within the inner roller screen and allowed a greater quantity of fine impurities to enter the outer roller screen. Concurrently, high outer-screen speed increased the tendency of material to remain against the screen wall under centrifugal effects, so that fine soil blocked apertures and was ultimately discharged together with the tubers, elevating impurity content.
3.3.5. Determination of the Optimal Combination of Factor Levels
Maximization of separation rate and minimization of impurity content were adopted as the dual optimization objectives. Multi-objective optimization of the two regression models was performed in Design-Expert 13 using the desirability-function method. The objective functions and constraints were defined as follows:
Both responses were assigned a desirability weight of 1, while their importance levels were set to 5 for separation rate and 3 for impurity content, respectively. Higher priority was given to separation rate because tiger nut tubers incorrectly discharged through the inner-screen outlet cannot be recovered during subsequent cleaning, whereas residual impurities can be further removed by the vibrating screen and pneumatic cleaning mechanism. The optimization results showed that the overall desirability reached its maximum when the rotational speeds of the outer roller screen, inner roller screen, and separating screw conveyor were 20, 53, and 122 r/min, respectively. Under these conditions, Kf = 97.87% and Kh = 24.43%, respectively.
The optimization results have a clear physical interpretation. The optimized outer screen rotational speed lay near the lower bound of its admissible range. This may indicate that under counter-rotation, secondary disturbance arose mainly from relative surface motion rather than from the absolute speed of the outer roller screen. Raising outer-screen speed intensifies shear but also approaches the critical centrifuging speed identified in Section 2.4.1; the trade-off therefore favored a relatively low value. The optimized inner-screen speed lay near the upper bound, ensuring adequate tumbling and dispersion while directly increasing vir, as shown in Equation (18). The optimized screw-conveyor speed occupied a medium-to-high level well below its theoretical upper bound, supplying sufficient axial agitation to suppress local accumulation while preserving an adequate residence time for primary screening. The high statistical significance of the quadratic terms A2, B2, and C2 in both regression models confirmed that the relationships between the three speeds and separation performance were non-monotonic. Performance deteriorated when the rotational speeds were either below or above their optimal levels. When speeds fell below their optimum ranges, tumbling and axial disturbance were insufficient, localized accumulation developed, soil passage was delayed, and separation rate declined. When speeds exceeded the optimum, centrifuging attachment on the outer screen hindered particle detachment, while an overly high conveyor speed shortened residence time inside the inner roller screen; both effects left fine impurities insufficiently screened and raised impurity content. Thus, the identified combination was not obtained by simply selecting the highest or lowest factor levels but represented a balanced operating point under multiple physical constraints.
Field experiments were subsequently conducted at the optimized parameter combination to assess its practical performance and quantify the deviation between the field measurements and the numerical predictions.
3.4. Field Trial Results and Analysis
Three field trials were conducted using the optimized parameter combination, and the mean values were reported as the field-validation results, as shown in Table 10.
Table 10.
Field experimental results.
Under the optimized counter-rotating double-layer roller-screen configuration, the device achieved a mean separation rate of 91.71% and a mean impurity content of 22.51%. The separation rate ranged from 89.91% to 93.26%, with a range of 3.35 percentage points, a standard deviation of 1.69 percentage points, and a coefficient of variation of 1.84%. Impurity content ranged from 19.97% to 24.11%, with a range of 4.14 percentage points, a standard deviation of 2.22 percentage points, and a coefficient of variation of 9.86%. Unlike the controlled feeding conditions in the simulations, field operation was subject to variations in soil moisture, local feed load, and surface evenness. Variations in soil moisture may affect soil cohesion and particle agglomeration, while fluctuations in feed load may alter the thickness and distribution of the material layer within the roller screen. These factors can influence the dispersion and passage of fine soil particles through the outer-screen apertures, potentially contributing to fluctuations in the residual impurity content. In comparison, the relatively small variation in separation rate indicates that the device maintained consistent tuber separation performance under the field conditions examined.
Relative to the model predictions (97.87% and 24.43%), the relative errors of the field means were 6.29% for separation rate and 7.86% for impurity content, indicating that the simulation optimization results accurately reflected the field performance of the device. The present results apply primarily to sandy soil at 11.7–18.0% moisture under stable weather. Under higher post-rainfall moisture or increased soil adhesiveness, agglomeration of the tuber–soil mixture and adhesion-induced aperture blockage may intensify, impairing dispersion and screen passage and thereby raising impurity content while lowering separation rate. Additional adaptability trials under contrasting moisture levels and field conditions are therefore warranted to quantify performance deterioration and to establish corresponding parameter-adjustment strategies.
4. Discussion
The optimized operating parameters and separation performance reported herein were obtained under the specific numerical and field conditions considered in this study. Specifically, the DEM simulations employed a fixed feed composition of 6% tubers, 4% impurities, and 90% soil at a feed rate of 43 kg/s, while the field trials were conducted in sandy soil with a moisture content of 11.7–18.0%. Variations in soil moisture, mixture composition, particle-size distribution, and feed rate can affect interparticle interactions, material flowability, residence time, and screen-aperture blockage, and may therefore shift the quantitative optimum of the operating parameters. In particular, higher soil moisture may promote soil agglomeration and adhesion, increasing the risk of blockage at the outer-screen apertures. Such blockage may hinder the passage of fine soil particles and contribute to variations in impurity content, although it was not quantified in the present field trials. Thus, the combination of outer roller screen, inner roller screen, and separating screw conveyor speeds of 20, 53, and 122 r/min, respectively, should be regarded as a condition-dependent result within the present research framework rather than a universally applicable parameter combination. Although the single-particle force analysis in Section 2.4 provides a theoretical basis for determining the admissible rotational-speed ranges, it neglects interparticle interactions and cannot fully represent the collective motion of the tuber–soil–root mixture. Soil agglomeration, adhesion, and root entanglement under field conditions may further alter particle sliding and tumbling; therefore, the derived rotational-speed ranges should be regarded as theoretical design constraints rather than direct predictions of mixture behavior. The DEM model also simplified the harvested mixture. The soil model represented soil as uniformly sized spherical particles and did not account for soil clods or their breakage. The simplified root model did not capture fibrous deformation and entanglement. The tuber model retained representative dimensions, but mixture composition and feed rate remained constant. These simplifications can affect particle interactions, material flow, and passage through the screen apertures, potentially contributing to the differences between simulated and field separation performance.
More importantly, the kinematic analysis and DEM results provide a physical explanation for the improved screening performance observed under counter-rotating conditions in the simulations. The oppositely directed tangential velocities of the inner and outer roller screens increase the equivalent relative linear velocity between the screen surfaces. These velocities also suppress synchronous material motion, intensify secondary disturbance, disrupt localized accumulation, and promote soil passage through the screen apertures. Accordingly, the relatively low outer-screen speed, relatively high inner-screen speed, and medium-to-high separating screw conveyor speed provide a balance among material disturbance, axial conveyance, screening residence time, and centrifugal effects. The field separation rate of 91.71% and impurity content of 22.51% demonstrated the feasibility of this operating strategy under the tested conditions. However, the greater variability in impurity content indicated its sensitivity to field material properties and feeding uniformity.
Zhang et al. [32] developed a double-layer roller-screen separation device for tiger nut harvesting and reported a mean separation rate of 93.19% and an impurity content of 26.65% in field trials. In comparison, the present device achieved a separation rate that was 1.48 percentage points lower and an impurity content that was 4.14 percentage points lower. Other studies have investigated the effects of screen structure and material motion on tiger nut separation. Zhang et al. [33] found that screen amplitude, vibration frequency, and inclination had nonlinear effects on screening performance, while Zheng et al. [34] demonstrated that screen type and aperture size influenced the screening efficiency of tiger nut threshing material. He et al. [35] developed a hinged lifting screen to facilitate soil passage during material conveyance, whereas Qi et al. [36] combined multistage screw conveying with vibratory screening to promote sand removal. These studies highlight the importance of screen configuration, material agitation, and conveyance in tuber–impurity separation. In the present study, differential-speed counter-rotation of the inner and outer roller screens increased the equivalent relative linear velocity between the screen surfaces and promoted material redistribution, as indicated by the kinematic analysis and DEM simulations. Nevertheless, differences in device configurations, operating conditions, material characteristics, and evaluation indices between studies limit direct performance comparisons. The reported results therefore provide useful references for evaluating the present findings rather than direct evidence of the superiority of counter-rotation.
The field trials evaluated only the optimized counter-rotating configuration. The separation advantage over co-rotation observed in DEM simulations has not yet been directly verified through comparative field tests. Tuber damage was not assessed in the present field trials. Since the harvested material passed through the rotary cutting digging device before entering the separation device, damage measured only at the separation-device outlet would not distinguish pre-existing damage from that induced during separation. Future work will therefore include controlled bench tests with defined initial tuber conditions and grading criteria for skinning, cracking, and breakage. Damage assessments before and after separation will be conducted to quantify the mechanical damage attributable to the separation device. Further studies will also evaluate the device under different soil textures, moisture contents, feed rates, and planting conditions. They will investigate differences between co-rotating and counter-rotating configurations through paired field comparisons. Moisture-dependent soil cohesion, aperture blockage, and adaptive parameter regulation will also be investigated.
5. Conclusions
- (1)
- To mitigate material accumulation and inadequate separation of high-soil-content tuber–impurity mixtures during mechanized tiger nut harvesting, a coupled-disturbance screening principle based on counter-rotation of the inner and outer roller screens was proposed. A corresponding double-layer roller-screen separation device incorporating a separating screw conveyor was developed. The key structural parameters of the device were determined, and the admissible rotational-speed ranges were derived, providing a design basis for the separation of high-soil-content harvested material.
- (2)
- A kinematic model was established to characterize the equivalent relative linear velocity between the inner and outer roller screens under co-rotating and counter-rotating conditions. For the same pair of rotational speeds, counter-rotation produced a greater equivalent relative linear velocity than co-rotation. Comparative DEM simulations showed that counter-rotation improved material distribution and reduced the accumulated mass within the annular region between the inner and outer roller screens. Compared with the conventional co-rotating configuration, the proposed configuration increased the separation rate by 3.34 percentage points and decreased the impurity content by 4.07 percentage points, indicating improved simulated screening performance under the investigated operating conditions.
- (3)
- Dual-response quadratic regression models relating separation rate and impurity content to the principal operating parameters were established using a Box–Behnken design based on EDEM 2024 simulations, and the relative influence of the factors was quantified. The multi-objective optimization identified a preferred operating-parameter combination under the investigated simulation conditions: an outer roller screen rotational speed of 20 r/min, an inner roller screen rotational speed of 53 r/min, and a separating screw conveyor rotational speed of 122 r/min. Field trials at this parameter combination yielded a mean separation rate of 91.71% and a mean impurity content of 22.51%. The corresponding absolute relative deviations from the numerical predictions were 6.29% and 7.86%, respectively, demonstrating the practical feasibility of the selected operating point under the tested sandy-soil conditions. These results provide a practical basis for the design and operating-parameter optimization of tuber–impurity separation devices for tiger nut harvesters.
Author Contributions
Conceptualization, X.D.; methodology, X.C.; software, X.C.; validation, X.C.; formal analysis, Y.Z.; investigation, X.J.; resources, X.J.; writing—original draft preparation, X.C.; writing—review and editing, X.C. and X.D.; visualization, X.Y.; supervision, Y.Z.; project administration, X.D.; funding acquisition, X.D. All authors have read and agreed to the published version of the manuscript.
Funding
This research was funded by the National Key Research and Development Program of China (Grant No. 2024YFB371410005), the Science and Technology Innovation Leading Talent Support Program of Henan Province (Grant No. 254000510059), the Henan Agricultural Machinery R&D, Manufacturing, Promotion, and Application Integration Pilot Project (Grant No. HNYTH2025-07), and a project of the Ministry of Agriculture and Rural Affairs of China (Grant No. NK202216050101).
Institutional Review Board Statement
Not applicable.
Data Availability Statement
The raw data supporting the conclusions of this article will be made available by the authors on request.
Conflicts of Interest
The authors declare no conflicts of interest.
References
- Wang, R.Y.; Wang, X.S.; Xiang, H. A multi-purpose novel oil crop—Tiger nuts. China Oils Fats 2019, 44, 1–4. [Google Scholar] [CrossRef]
- Clemente-Villalba, J.; Cano-Lamadrid, M.; Issa-Issa, H.; Hurtado, P.; Hernández, F.; Carbonell-Barrachina, Á.A.; López-Lluch, D. Comparison on sensory profile, volatile composition and consumer’s acceptance for PDO or non-PDO tigernut (Cyperus esculentus L.) milk. LWT 2021, 140, 110606. [Google Scholar] [CrossRef] [Scilit]
- Yang, X.D.; Li, Z.Y. Tigernut industry in China: Current status of development, potential and adaptive suggestions. Chin. J. Oil Crop Sci. 2022, 44, 712–717. [Google Scholar] [CrossRef]
- Yang, Z.L. Characteristics and research progress of Cyperus esculentus. North. Hortic. 2017, 41, 192–201. [Google Scholar]
- Wang, Z.C.; Li, S.S.; Qi, Z.X.; Zhang, W.Q. Current situation of Cyperus esculentus industry mechanization development in China and construction of the whole industrial chain equipment system. Agric. Eng. 2022, 12, 5–10. [Google Scholar] [CrossRef]
- Qu, Z.; Han, M.; Lv, Y.; Zhou, Z.; Lv, Z.; Wang, W.; He, X. Design and test of a crawler-type tiger-nut combine harvester. Agriculture 2023, 13, 277. [Google Scholar] [CrossRef] [Scilit]
- Zhang, X.K. Report on the research and development progress of the Cyperus esculentus industry in China. China Rural Sci. Technol. 2019, 4, 67–69. [Google Scholar] [CrossRef]
- Zhang, H.M.; Zhou, Z.; Lv, Z.J.; Wang, W.Z.; He, H.; Lv, Y.L. Kinematic analysis and testing of vibratory sieving mechanism for Cyperus esculentus L. harvester. J. Chin. Agric. Mech. 2021, 42, 92–99. [Google Scholar] [CrossRef]
- Liu, W.L.; Yan, H.Y.; Liu, F.; Jiang, C.Y.; Zhang, L.; Wang, X.Y. Design and experiment of compound screening Cyperus esculentus harvester. Agric. Eng. 2023, 13, 88–94. [Google Scholar] [CrossRef]
- Zhao, Y.Q.; Li, B.J.; Meng, J.; Wang, L.; Bi, T.; Jian, J.M.; Hou, S.L. Optimal design of mechanical harvesting and separation system for tiger nut. J. Agric. Mech. Res. 2022, 44, 51–56. [Google Scholar] [CrossRef]
- Dai, Q.L.; Zhang, C.Q.; Yang, J.H.; Yu, H.; Yu, L.Y. Design and simulation analysis of a multi-stage threshing-cleaning device for frozen berries of sea buckthorn. J. South China Agric. Univ. 2026, 47, 685–697. [Google Scholar] [CrossRef]
- Wan, X.Y.; Shu, C.X.; Xu, Y.; Yuan, J.C.; Li, H.T.; Liao, Q.X. Design and experiment on cylinder sieve with different rotational speed in cleaning system for rape combine harvesters. Trans. Chin. Soc. Agric. Eng. 2018, 34, 27–35. [Google Scholar] [CrossRef]
- Sullivan, J.W.; Hill, R.M.; Sullivan, J.F. The place of the trommel in resource recovery. In Proceedings of the 1992 National Waste Processing Conference: Solid Waste Processing into the 21st Century, Fifteenth Biennial Conference, Detroit, MI, USA, 17–20 May 1992; American Society of Mechanical Engineers: New York, NY, USA, 1992; pp. 1–8. Available online: https://wtert.org/wp-content/uploads/2020/10/1992-National-Waste-Processing-Conference-01.pdf (accessed on 4 March 2025).
- Hu, Y.G.; Li, J.G.; Lu, H.Y.; Xiao, H.R. Design and experiment of equant-diameter roller screening machine for fresh tea leaves. Trans. Chin. Soc. Agric. Mach. 2015, 46, 116–121. [Google Scholar] [CrossRef]
- Sun, J.; Yin, Z.J.; Chen, B. Analysis of the conveying principle and parameter design of an open screw conveyor. Hoist. Convey. Mach. 2010, 5, 11–16. [Google Scholar] [CrossRef]
- Chinese Academy of Agricultural Mechanization Sciences. Agricultural Machinery Design Manual; China Agricultural Science and Technology Press: Beijing, China, 2007; Volume 2. [Google Scholar]
- Shi, X.; Niu, C.H.; Wang, X.N.; Zhang, H.C.; Yang, H.M. Design of roller sieve waste plastic film and trash winnowing machine. Trans. Chin. Soc. Agric. Eng. 2017, 33, 19–26. [Google Scholar] [CrossRef]
- Lin, J.C. Study on the Material Properties of Vermicompost and Earthworm–Vermicompost Separation Technology. Ph.D. Thesis, Huazhong Agricultural University, Wuhan, China, 2021. [Google Scholar] [CrossRef]
- Zhao, Q.L.; Chen, X.M.; Xu, S.; Meng, X.Y.; Liu, H.B. Design and test of seed metering device for suction-type Cyperus esculentus precision planter. J. Jilin Agric. Univ. 2025, 47, 185–190. [Google Scholar] [CrossRef]
- Wang, S.S.; Chen, P.; Lu, M.Q.; Geng, L.X.; Ji, J.T.; Yang, F. Design and experiment of separation and cleaning device for Chinese cabbage seeds harvester. Trans. Chin. Soc. Agric. Mach. 2020, 51, 181–190. [Google Scholar] [CrossRef]
- Liao, Q.X.; Xu, Y.; Yuan, J.C.; Wan, X.Y.; Jiang, Y.J. Design and experiment on combined cutting and throwing longitudinal axial flow threshing and separating device of rape combine harvester. Trans. Chin. Soc. Agric. Mach. 2019, 50, 140–150. [Google Scholar] [CrossRef]
- Xu, L.Z.; Li, Y.M. Critical speed of impact damage on a rice kernel. Trans. Chin. Soc. Agric. Mach. 2009, 40, 54–57. [Google Scholar]
- Stopa, R.; Szyjewicz, D.; Komarnicki, P.; Kuta, Ł. Determining the resistance to mechanical damage of apples under impact loads. Postharvest Biol. Technol. 2018, 146, 79–89. [Google Scholar] [CrossRef] [Scilit]
- Rashvand, M.; Altieri, G.; Genovese, F.; Li, Z.; Di Renzo, G.C. Numerical simulation as a tool for predicting mechanical damage in fresh fruit. Postharvest Biol. Technol. 2022, 187, 111875. [Google Scholar] [CrossRef] [Scilit]
- Coetzee, C.J. Particle upscaling: Calibration and validation of the discrete element method. Powder Technol. 2019, 344, 487–503. [Google Scholar] [CrossRef] [Scilit]
- Zhao, L.; Zhou, H.; Xu, L.; Song, S.; Zhang, C.; Yu, Q. Parameter calibration of coconut bran substrate simulation model based on discrete element and response surface methodology. Powder Technol. 2022, 395, 183–194. [Google Scholar] [CrossRef] [Scilit]
- Horabik, J.; Molenda, M. Parameters and contact models for DEM simulations of agricultural granular materials: A review. Biosyst. Eng. 2016, 147, 206–225. [Google Scholar] [CrossRef] [Scilit]
- Zhang, R.; Han, D.; Ji, Q.; He, Y.; Li, J. Calibration methods of sandy soil parameters in simulation of discrete element method. Trans. Chin. Soc. Agric. Mach. 2017, 48, 49–56. [Google Scholar] [CrossRef]
- Altair Engineering, Inc. Select a Time Step. Available online: https://2025.help.altair.com/2025/edem/topics/edem_simulator/selecting_a_time_step_t.htm (accessed on 30 June 2025).
- GB/T 8097-2008; Equipment for Harvesting—Combine Harvesters—Test Procedure. Standards Press of China: Beijing, China, 2008.
- Chai, X.; Xu, L.; Sun, Y.; Liang, Z.; Lu, E.; Li, Y. Development of a cleaning fan for a rice combine harvester using computational fluid dynamics and response surface methodology to optimise outlet airflow distribution. Biosyst. Eng. 2020, 192, 232–244. [Google Scholar] [CrossRef] [Scilit]
- Zhang, S.W.; Zhang, R.Y.; Cao, Q.Q.; Zhang, Y.; Fu, J.; Yuan, H.F. Design and experiment of double-deck roller sieve type fruit impurity separation device for tiger nut harvester. Trans. Chin. Soc. Agric. Mach. 2023, 54, 148–157. [Google Scholar] [CrossRef]
- Zhang, H.; Zhou, Z.; Qu, Z.; Li, Z.; Wang, W. Simulation and experiment of sieving process of sieving device for tiger nut harvester. Agriculture 2022, 12, 1680. [Google Scholar] [CrossRef] [Scilit]
- Zheng, X.S.; Shang, S.Q.; Wang, D.W.; He, X.N.; Wang, H.Q.; Tan, Y.; Xu, N.; Shen, S.L. Sieving analysis and experiment of threshing material of Cyperus esculentus based on discrete element method. J. Agric. Mech. Res. 2024, 46, 146–153. [Google Scholar] [CrossRef]
- He, X.N.; Zhang, F.Y.; Shang, S.Q.; Wang, D.W.; Dong, T.T.; Zhang, Z.X. Design and experiment of hinge lifting device of Cyperus esculentus combine harvester. Trans. Chin. Soc. Agric. Mach. 2024, 55, 148–157. [Google Scholar] [CrossRef]
- Qi, J.; Gao, J.; Chen, S.; Chen, W.; Yang, L.; Meng, H.; Kan, Z. Parameter optimization of a conveying and separating device based on a five-stage screw and vibrating screen for tiger nut harvesters. Agriculture 2024, 14, 682. [Google Scholar] [CrossRef] [Scilit]

Disclaimer/Publisher’s Note: The statements, opinions and data contained in all publications are solely those of the individual author(s) and contributor(s) and not of MDPI and/or the editor(s). MDPI and/or the editor(s) disclaim responsibility for any injury to people or property resulting from any ideas, methods, instructions or products referred to in the content. |
© 2026 by the authors. Licensee MDPI, Basel, Switzerland. This article is an open access article distributed under the terms and conditions of the Creative Commons Attribution (CC BY) license.