


Abstract
To address the low efficiency and stress-inducing nature of traditional manual weighing for dairy cows, this study proposes a semantically guided 3D reconstruction and body weight estimation method for dairy cows. First, a dual-viewpoint Kinect V2 camera synchronous acquisition system captures top-view and side-view point cloud data from 150 calves and 150 lactating cows. Subsequently, the CSS-PointNet++ network model was designed. Building upon PointNet++, it incorporates Convolutional Block Attention Module (CBAM) and Attention-Weighted Hybrid Pooling Module (AHPM) to achieve precise semantic segmentation of the torso and limbs in the side-view point cloud. Based on this, point cloud registration algorithms were applied to align the dual-view point clouds. Missing parts were mirrored and completed using semantic information to achieve 3D reconstruction. Finally, a body weight estimation model was established based on volume and surface area through surface reconstruction. Experiments demonstrate that CSS-PointNet++ achieves an Overall Accuracy (OA) of 98.35% and a mean Intersection over Union (mIoU) of 95.61% in semantic segmentation tasks, representing improvements of 2.2% and 4.65% over PointNet++, respectively. In the weight estimation phase, the BP neural network (BPNN) delivers optimal performance: For the calf group, the Mean Absolute Error (MAE) was 1.8409 kg, Root Mean Square Error (RMSE) was 2.4895 kg, Mean Relative Error (MRE) was 1.49%, and Coefficient of Determination (R2) was 0.9204; for the lactating cows group, MAE was 12.5784 kg, RMSE was 14.4537 kg, MRE was 1.75%, and R2 was 0.8628. This method enables 3D reconstruction and body weight estimation of cows during walking, providing an efficient and precise body weight monitoring solution for precision farming.
1. Introduction
Precise monitoring of dairy cow body weight is a fundamental aspect of smart farming, playing a crucial role in enhancing production efficiency and ensuring the safety of dairy products [1,2]. Accurate weight measurement is a key indicator for assessing dairy cow health and production performance, directly influencing scientific decision-making and management practices on dairy farms [3,4,5]. However, most dairy farms still rely on traditional manual measurement methods, which entail heavy workloads, can induce stress in cows, and are subject to accuracy issues influenced by operators’ technical skills and subjective judgment [6,7]. These limitations hinder the ability to meet the precise and efficient monitoring requirements of modern dairy farming.
With the rapid advancement of machine vision technology, new methods and equipment are continually being developed, offering innovative technical pathways for the non-contact measurement of livestock phenotypic information [8,9]. Imamura et al. [10] proposed a non-invasive method for automatically assessing cow body condition score (BCS) using 3D cameras and image processing technology. Pezzuolo et al. [11] created both linear and nonlinear models for weight estimation by measuring body dimensions using depth imaging techniques on pigs. Song et al. [12] automatically extracted morphological characteristics, such as rump height, width, and length, from 3D images of the rump region in dairy cows. They combined these measurements with factors like days in milk, age, and parity to establish a multiple linear regression model for predicting body weight. Si et al. [13] proposed a pig orientation correction method based on the minimum bounding rectangle, integrating Projection Analysis, the Finite Difference Method, and Hough Transform to identify head and tail positions alongside head orientation, thus obtaining standardized orientation images for body measurement. Zin et al. [14] selected images of dairy cows through an intelligent monitoring platform, extracted three-dimensional surface roughness parameters from two key regions on their backs, and constructed a mathematical scoring equation based on a regression model. Samperio et al. [15] employed three-dimensional imaging technology to estimate lamb body weight by analyzing images of the upper region of lambs and calculating average pixel depth. Most recently, Bai et al. [16] introduced a lightweight network-based model for cattle weight estimation (LaWE), which uses an optimized multi-scale fusion network to extract key points from images and compute body size parameters, coupled with a dedicated deep regression network for accurate weight prediction.
3D reconstruction technology facilitates the acquisition of livestock models, providing a comprehensive characterization of their overall morphological features. With the continuous optimization of 3D reconstruction algorithms and substantial improvements in hardware performance, the application of 3D reconstruction technology for collecting livestock phenotypic information has increasingly gained popularity as a research area. Chu et al. [17] utilized the Iterative Closest Point (ICP) algorithm to complete missing data in lateral viewpoint clouds of dairy cows. By integrating registration and mirroring techniques, they constructed a 3D model and established a body weight estimation model based on surface area and torso volume parameters. Shi et al. [18] captured point cloud data from freely walking pigs from three viewing angles—top, left, and right. By calibrating registration parameters with rectangular prisms, they achieved multi-source point cloud fusion and reconstruction. Analyzing the projection distribution of point clouds from different perspectives enabled precise localization of measurement sites, facilitating automatic measurement of key parameters such as body length, height, width, and girth. Ruchay et al. [19] implemented non-rigid 3D reconstruction of point cloud data obtained from three Kinect V2 cameras observing live cattle, using the ICP algorithm. This reconstruction allowed for the calculation of nine body measurement parameters—including shoulder height, hip height, and slant length—with minimal measurement error. Cozler et al. [20] applied a point cloud Poisson surface reconstruction method to construct a triangular mesh of cows for volume determination. They calculated critical dimensions such as heart girth, chest depth, and hip width to subsequently estimate the cows’ body weight. Hu et al. [21] introduced an improved PointNet++ point cloud segmentation model to divide pig point clouds into regional segments, including head, ears, torso, limbs, and tail, enabling precise localization of key body landmarks. The model achieves accurate weight estimation by integrating techniques such as least-squares fitting, point cloud slicing, edge extraction, and polynomial fitting. Kwon et al. [22] generated 3D point clouds of pigs, reconstructed mesh models for the creation of training data, and developed a Deep Neural Network (DNN) based on this data for weight estimation. They identified forty-eight measurement types from the mesh models and employed a fully connected DNN to estimate the pigs’ body weight. Cominotte et al. [23] utilized Kinect 3D imaging technology to predict the body weight and carcass weight of Nelore cattle. Selle et al. [24] proposed a 3D data modeling approach for pig breeding that constructs statistical shape models, enabling quantitative and visual analysis of changes in pig body size, morphology, and posture. By utilizing body weight as the sole predictor variable in a linear regression model, this method achieves high accuracy in weight prediction. Zhou et al. [25] proposed the FGPointKAN++ segmentation model and the AKCPR adaptive key-cutting plane recognition model, achieving precise component segmentation and calculation of key body parameters for dairy cow point clouds. Wei et al. [26] employed three Kinect V2 cameras to capture multi-angle images, utilizing the PointNet++ model to achieve automatic segmentation of sheep point clouds. By integrating local pose normalization with key points from morphological feature detection, they subsequently calculated body shape parameters.
This study addresses the limitations of existing non-contact weight estimation methods for dairy cows, which rely on static data collection and face practical application constraints. To meet the real-world demand for dynamic monitoring in large-scale farming operations, we propose a semantic-guided 3D reconstruction and weight estimation method for dairy cows. The method first acquires initial point clouds of walking cows through multi-view data collection and point cloud filtering. It then employs semantic segmentation and registration techniques on lateral point clouds to achieve preliminary alignment of morphological structures. Building upon this foundation, a semantic-guided point cloud mirroring completion strategy is proposed to achieve high-precision 3D reconstruction of cow body shapes. Based on the point cloud model, morphological parameters such as volume and surface area are extracted through surface reconstruction to construct a weight prediction model. This model achieves an average relative error below 2% in weight estimation, providing reliable technical support for automated, continuous weight monitoring of cows in walking states on dairy farms.
2. Materials and Methods
2.1. Methodology and Process
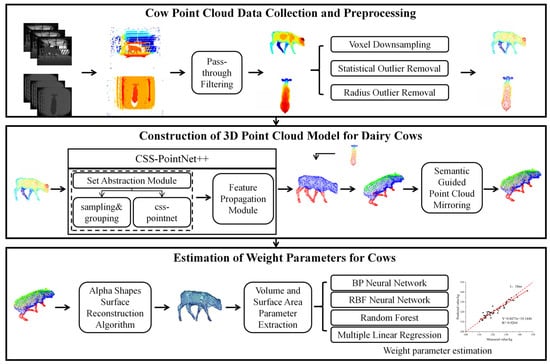
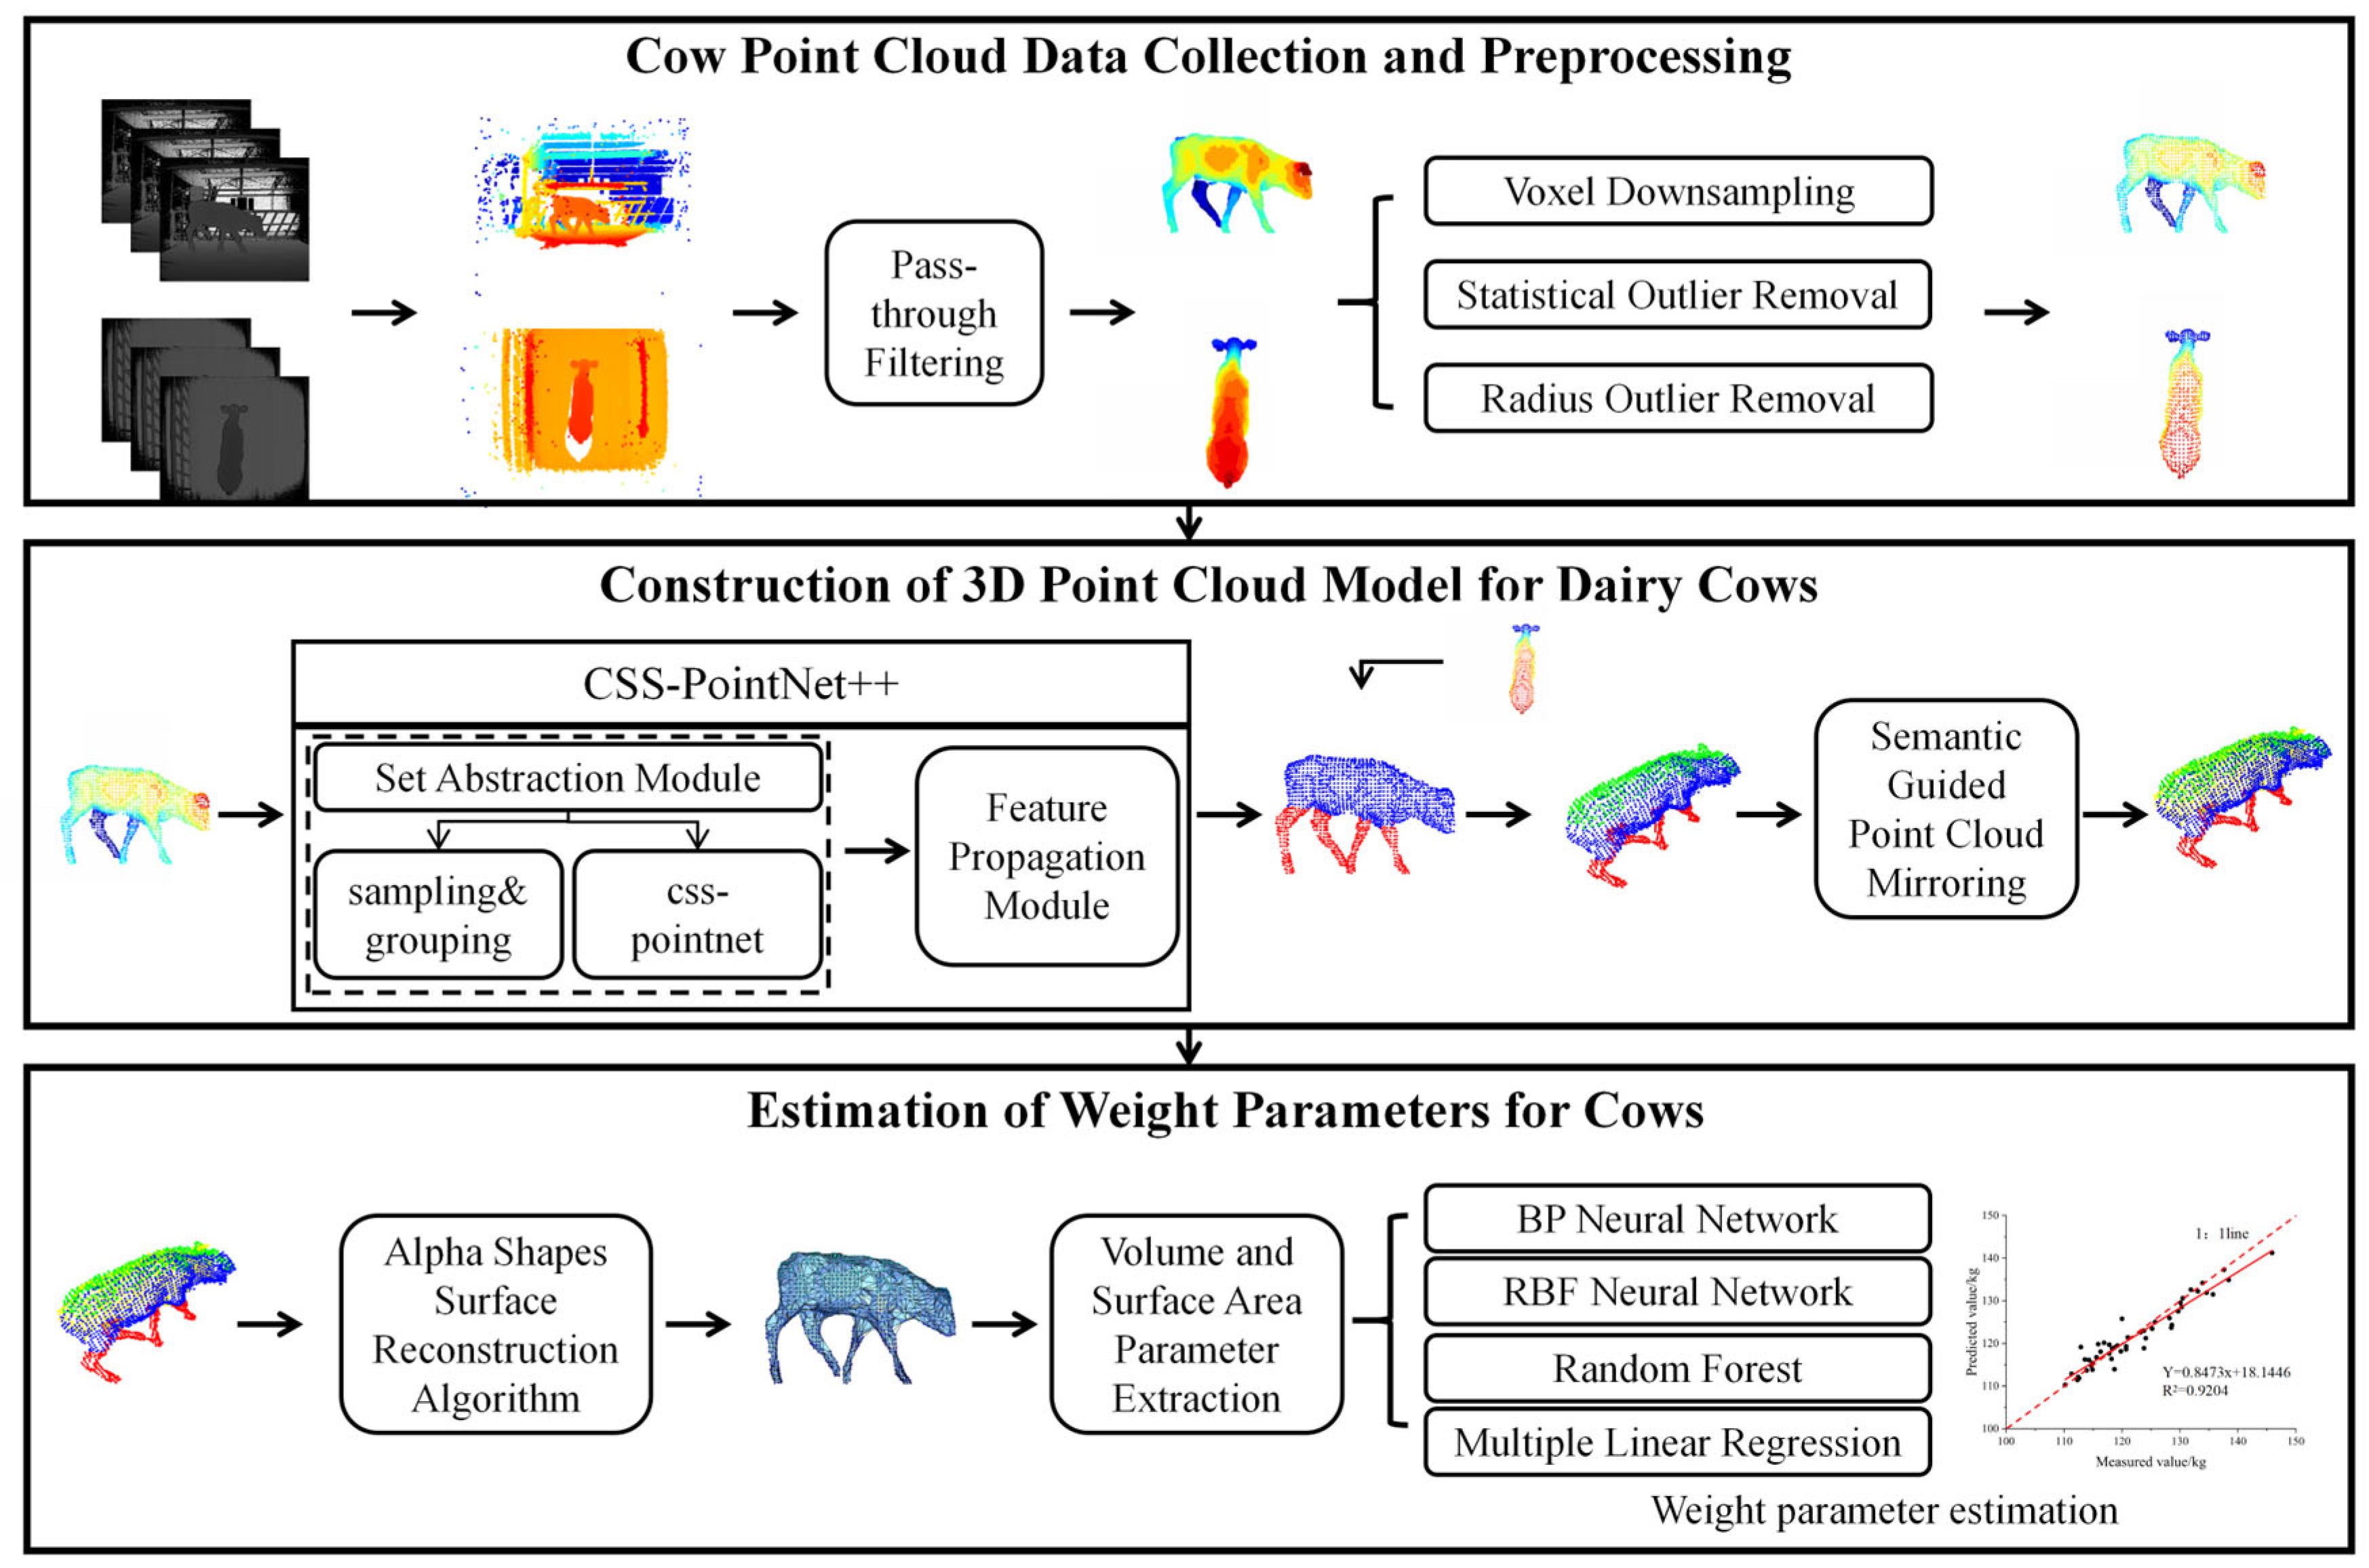
This paper presents a semantically guided 3D reconstruction and body weight estimation method for dairy cows, allowing for the reconstruction of cows in motion and accurate weight estimation. The specific workflow is illustrated in Figure 1. Initially, a dual-viewpoint Kinect V2 camera synchronous acquisition system captures top-view and side-view depth images of the cow. After converting these images into point clouds and undergoing multi-level preprocessing, the target point cloud is extracted. Next, we designed the CSS-PointNet++ semantic segmentation network model, which incorporates the Convolutional Block Attention Module(CBAM) and the Attention-Weighted Hybrid Pooling Module(AHPM) during the feature extraction phase of PointNet++. This design enables precise semantic segmentation of the torso and limbs in the side-view point clouds of dairy cows. Based on this foundation, the point cloud registration algorithm aligns the dual-viewpoint point clouds. Missing sections are mirror-reconstructed using semantic information from the side-view point cloud to complete the 3D reconstruction. Finally, point cloud surface reconstruction is performed, where surface area and volume parameters are derived using the Cross Product and Divergence Theorem. A body weight estimation model is subsequently constructed by integrating various machine learning algorithms.
Figure 1.
Flowchart of semantically guided 3D reconstruction and body weight estimation method for dairy cows.
2.2. Data Collection and Preprocessing
2.2.1. Experimental Data Acquisition
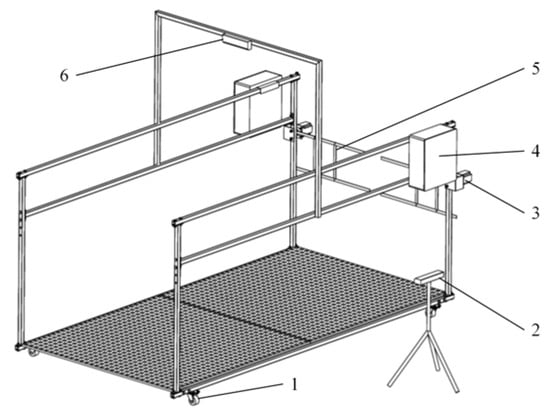
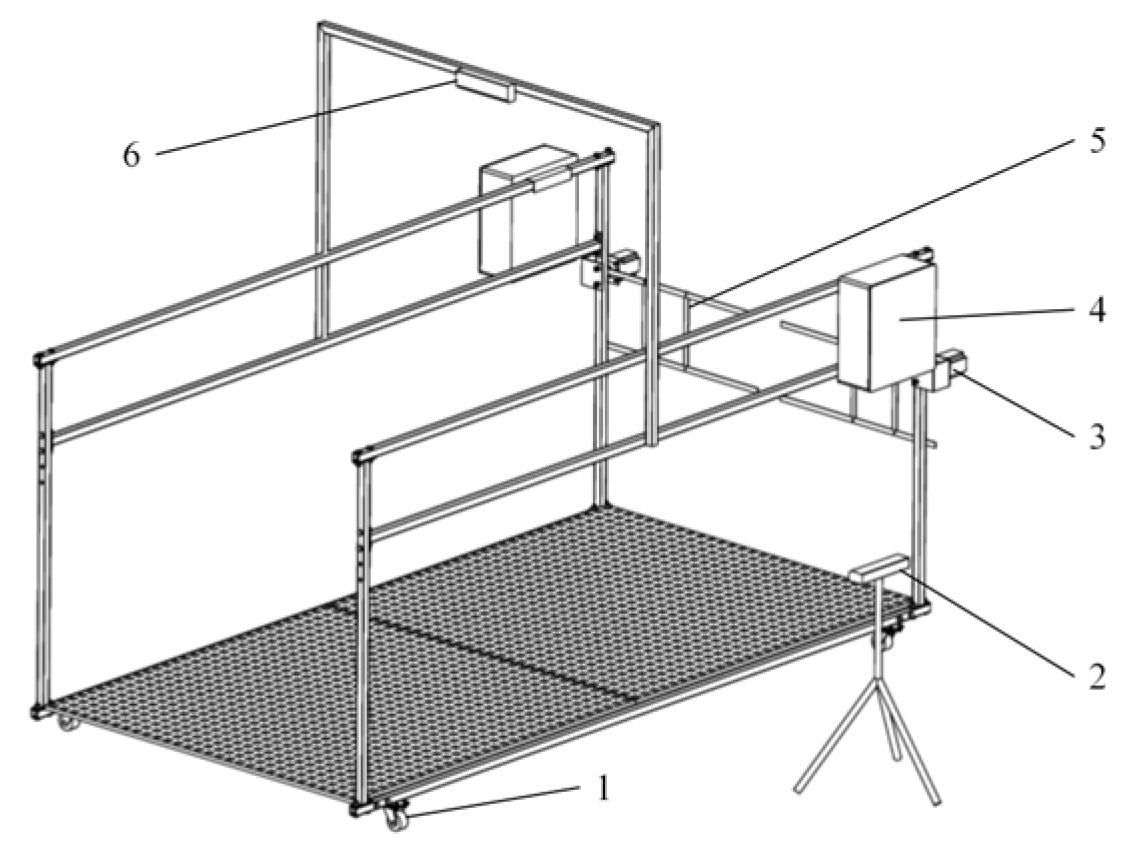
Holstein dairy cattle are the world’s predominant dairy breed. For example, an adult lactating Holstein typically measures 1.65~1.75 m in length, 0.5~0.6 m in width, and 1.45~1.55 m in height. A dual-viewpoint Kinect V2 camera synchronous acquisition system was designed and modeled in SolidWorks 2018, with the structure shown in Figure 2. The main aluminum-alloy frame measures 3 m in length, 1.5 m in width, and 2.3 m in height. It incorporates two Kinect V2 depth cameras, an electronic control system, a channel opening and closing device, and a mobile unit. The side-view camera is positioned 1.1 m horizontally from the acquisition platform, 1.1~2.1 m from the cow, and 0.8 m above the ground. The overhead camera is mounted centrally above the platform, 2.3 m above ground and 0.75~0.85 m from the cow. Both cameras are connected to two computers (i7-13700H/16 GB/RTX 4060) and arranged orthogonally in a 90° dual-view configuration. This system enables depth-image acquisition of dynamic targets moving at speeds up to 1.5 m/s within a working range of 0.5~4.5 m [27].
Figure 2.
Dual-viewpoint Kinect V2 camera synchronous acquisition system. Note: 1 is the mobile unit, 2 is the side-view depth camera, 3 is the motor, 4 is the electrical control box, 5 is the channel opening and closing device, and 6 is the top-view depth camera.
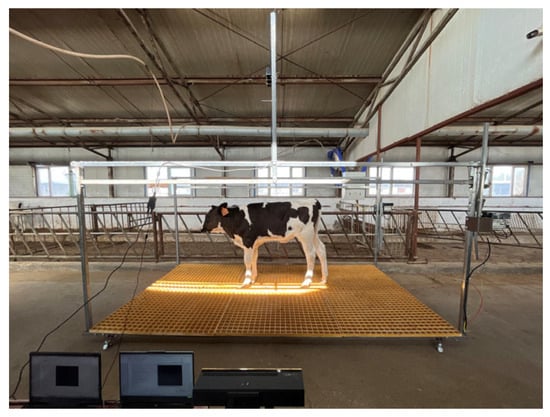
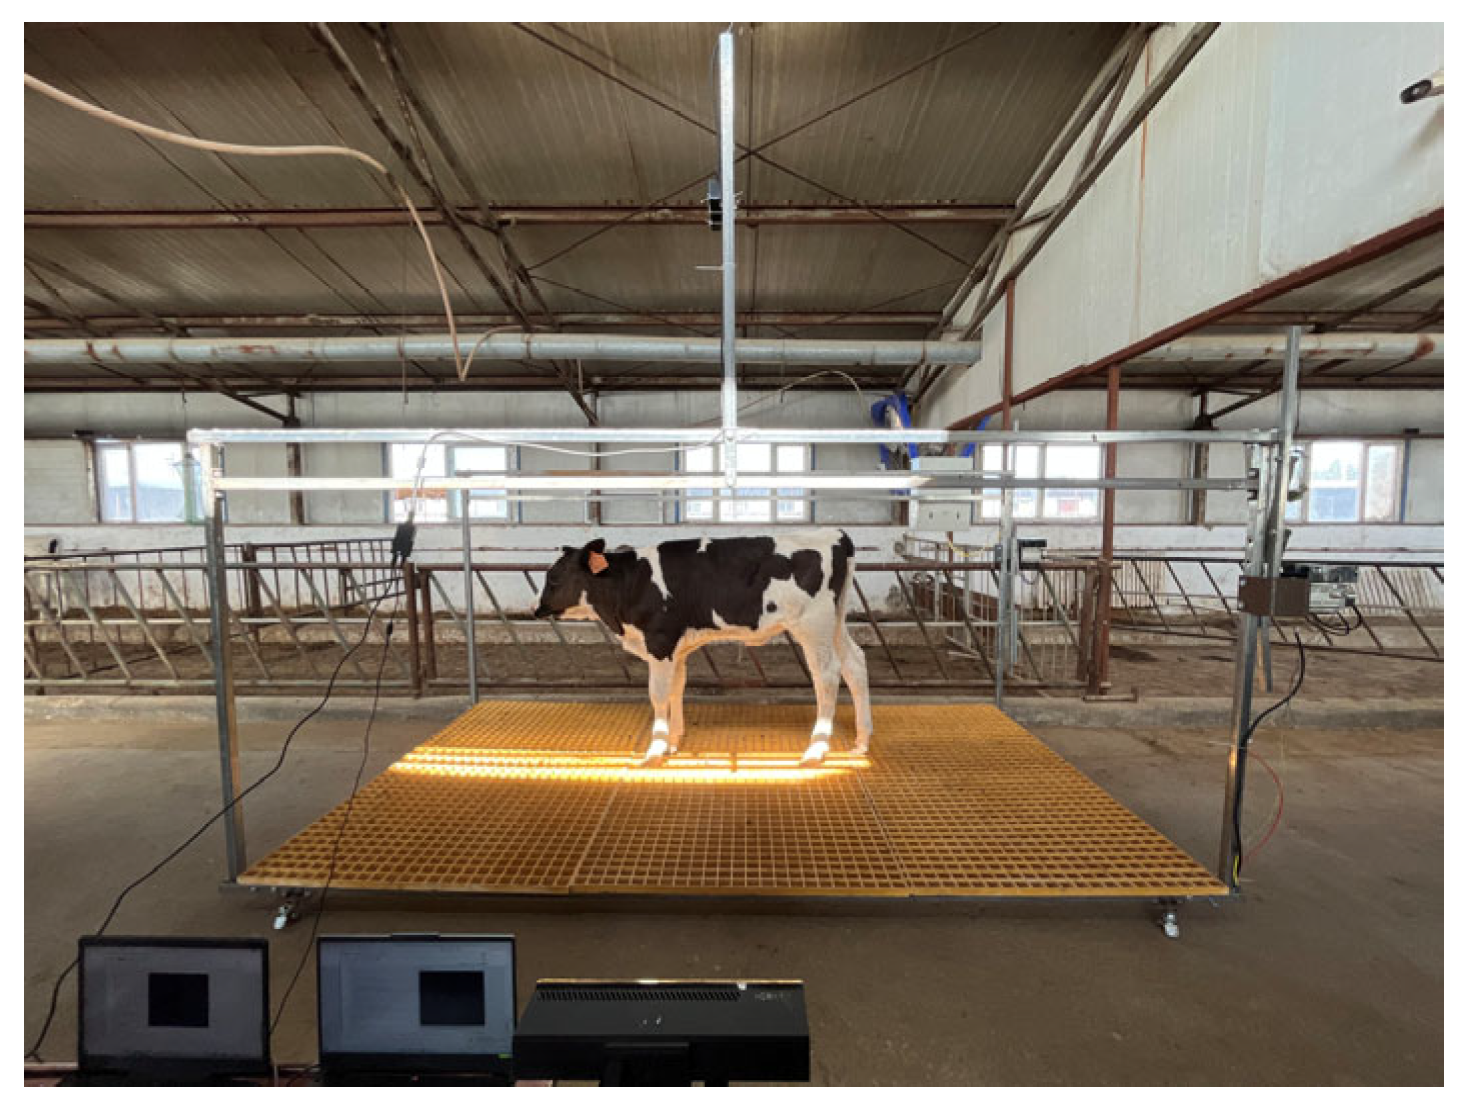
The experimental data were collected in mid-October 2023 at the premium breeding center of Tianshan Guanghe Animal Husbandry Co., Ltd. in the Shihezi Development Zone, Xinjiang Province, China. The study subjects consisted of Holstein dairy cows. During the data collection process, a weighing scale was used to obtain actual body weight measurements, while a dual-viewpoint Kinect V2 camera synchronous acquisition system was employed to capture depth images of the cows. As illustrated in Figure 3, the depth image acquisition utilized an electronic control system to operate a channel opening and closing device, guiding the cows sequentially through the image acquisition area. Two Kinect V2 cameras simultaneously captured top-view and side-view depth images of the cows. The experiment gathered actual weight data from 150 calves (approximately 100 days old) and 150 lactating cows (aged 3–5 years), resulting in a total of 600 sets of dual-view depth images. Each image set was captured over approximately 30 s at a frame rate of 30 fps, with a resolution of 512 pixels × 424 pixels.
Figure 3.
Depth image acquisition.
2.2.2. Point Cloud Data Acquisition and Preprocessing
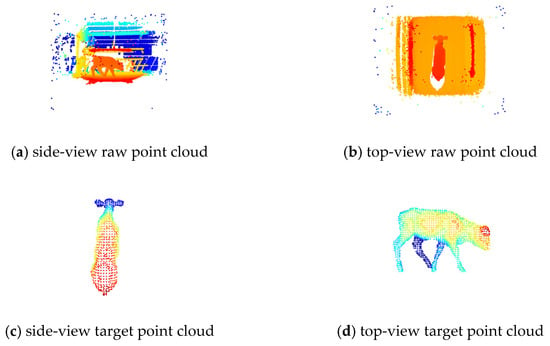
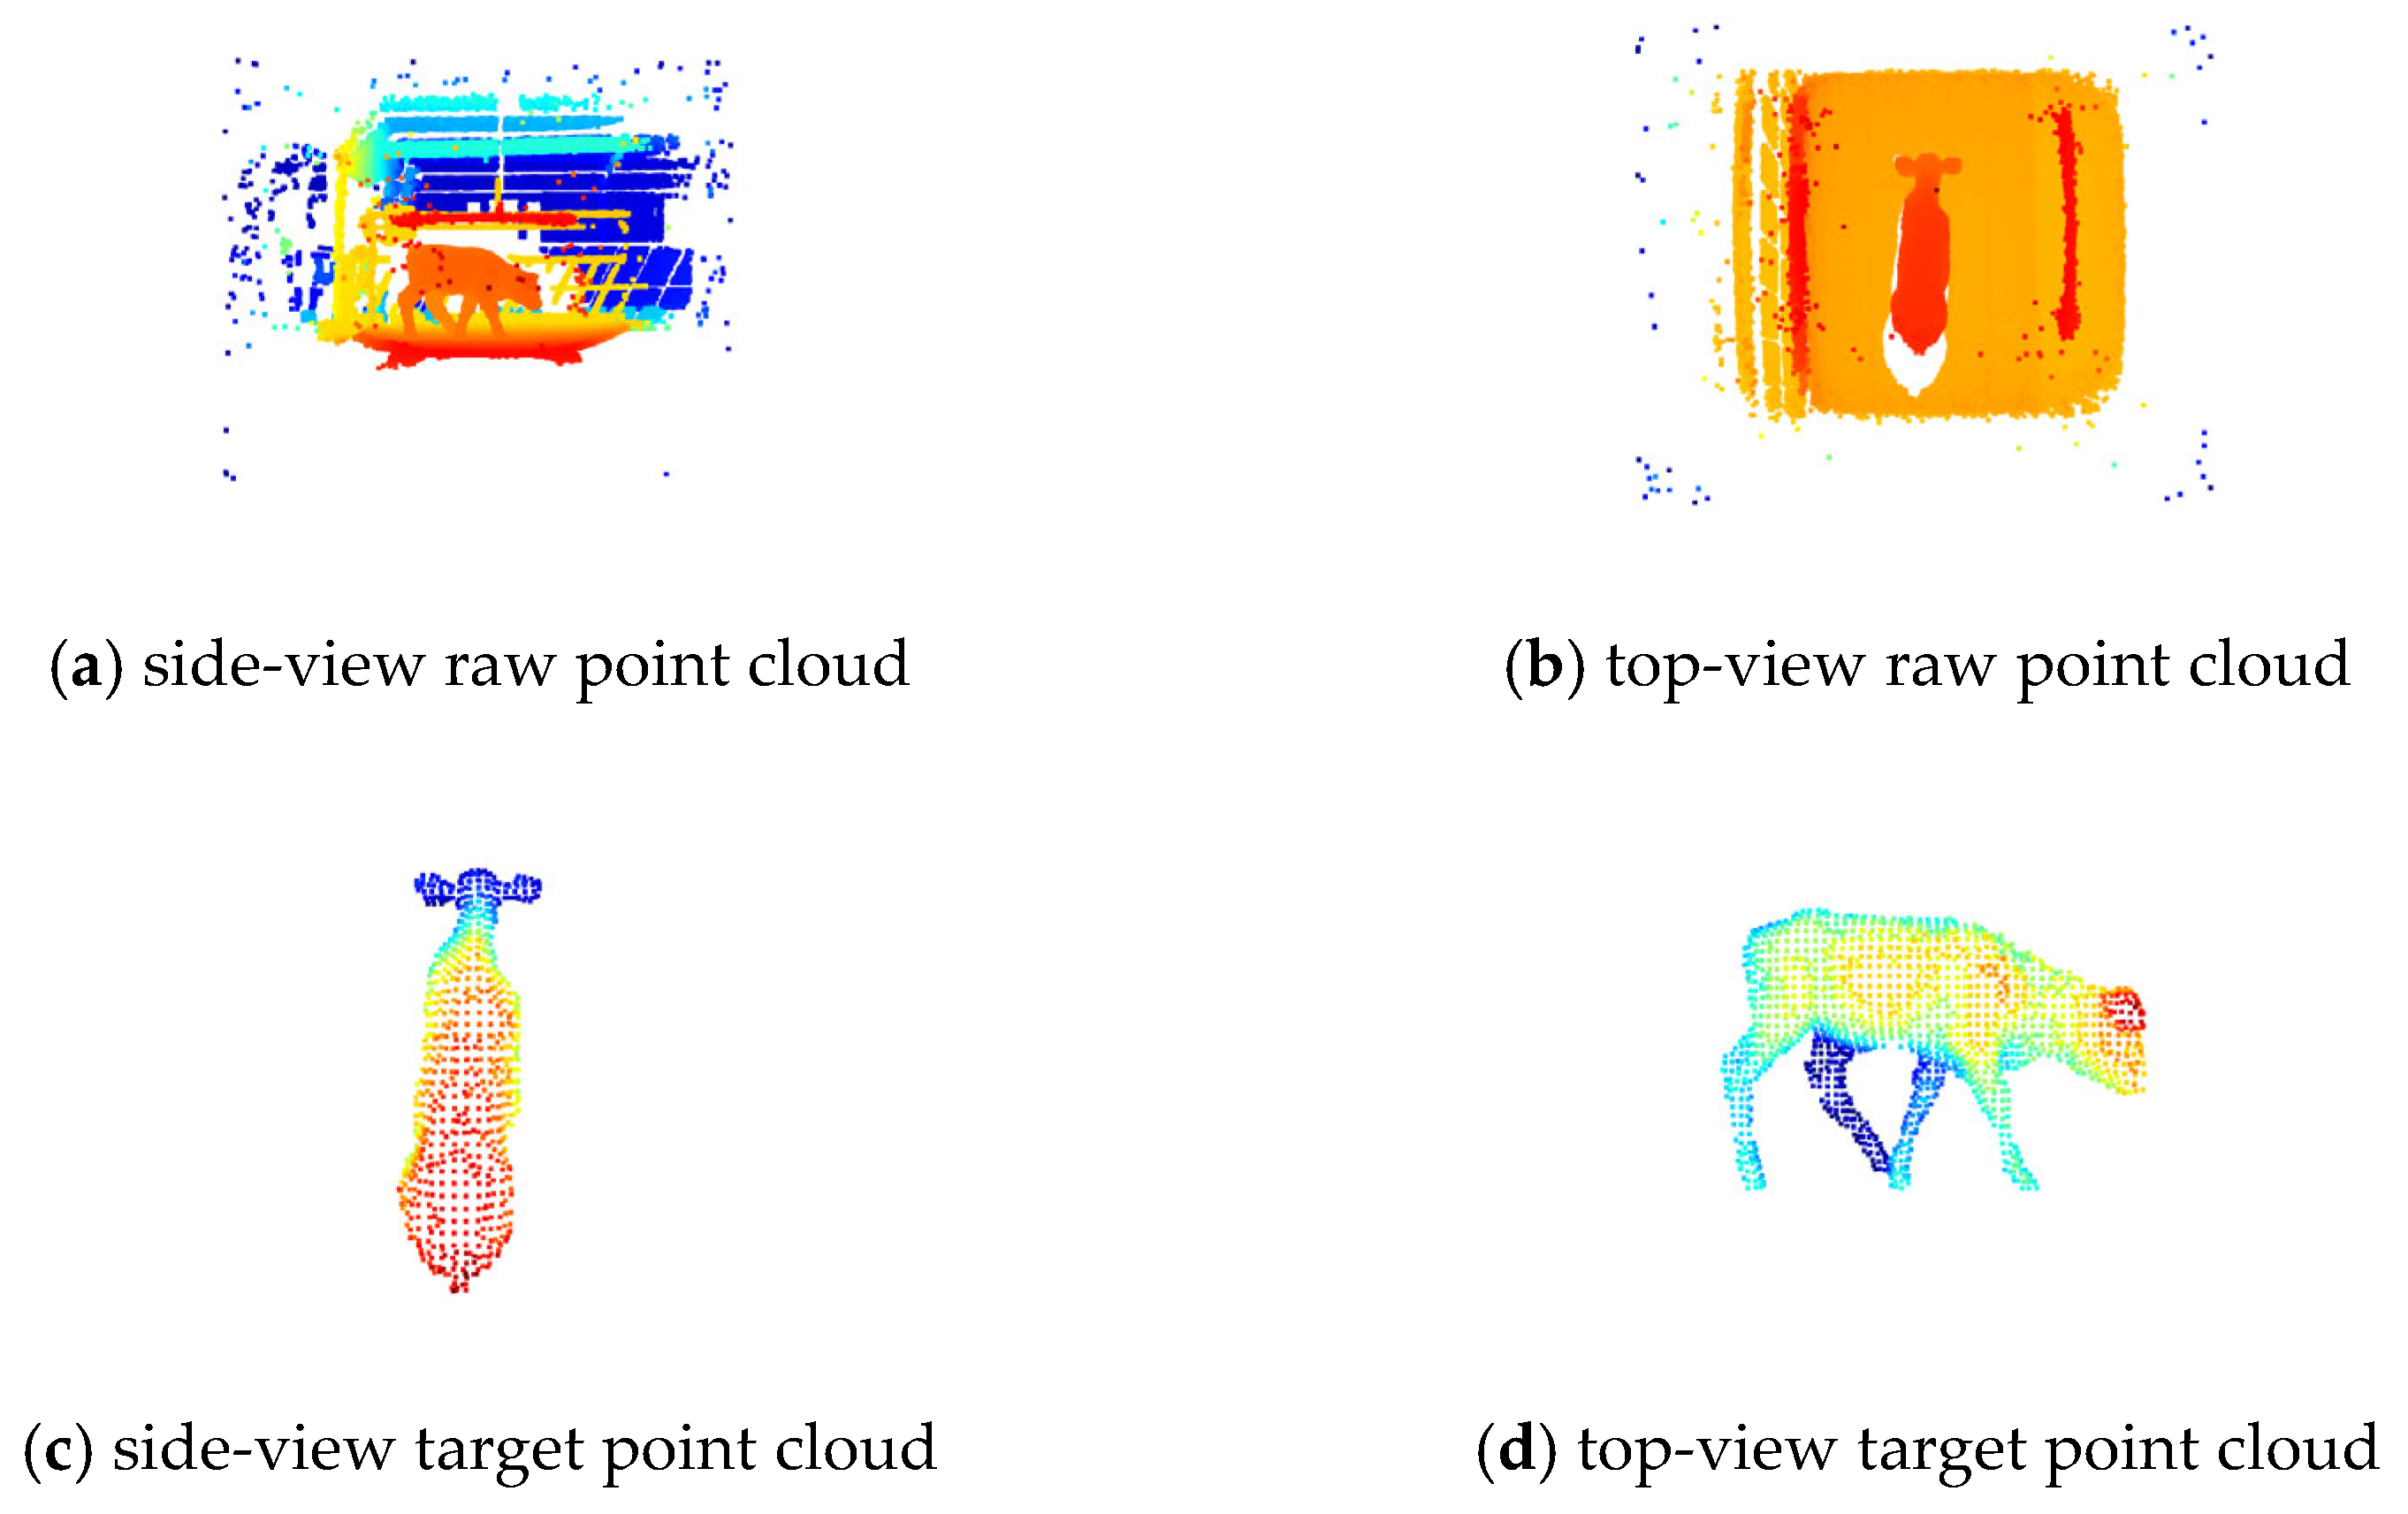
This paper employs Python as the development language and utilizes the Open3D point cloud processing library to convert raw depth images into 3D point cloud data. The conversion formulas are shown in Equations (1)–(3), while the raw point cloud data is illustrated in Figure 4a,b.
In the equation, X, Y, and Z represent point cloud spatial coordinate parameters; fx, fy, cx, and cy denote camera intrinsic parameters; u and v correspond to depth pixel coordinates; depth signifies the raw depth value captured by the camera; and factor indicates the scaling factor.
Figure 4.
Point cloud data before and after preprocessing.
To address data noise issues in complex farm environments, this paper proposes a multi-level point cloud preprocessing method. First, an initial spatial screening is performed using pass-through filtering. Next, voxel downsampling is applied to reduce the dimensionality of the cow target point cloud data (voxel_size = 0.1). Finally, statistical outlier removal (k_neighbors = 20, stddev_mult = 1.5) and radius outlier removal (radius = 0.2, min_neighbors = 10) are implemented to eliminate outlier noise points, resulting in the final cow target point cloud, as depicted in Figure 4c,d. This approach, combined with the appropriate parameter settings, effectively separates background interference, such as ground and railings, allowing for the successful extraction of a high-precision point cloud of the cow target. While preserving the cow’s key morphological features, this method significantly reduces the density of the point cloud data, thereby decreasing the computational burden for subsequent 3D reconstruction [28].
2.3. Cow Side-View Target Point Cloud Semantic Segmentation
This study addresses the practical needs of dairy farming by aiming to perform 3D reconstruction of cows during their walking process. During actual data acquisition, the lateral point cloud of the cow’s torso is susceptible to occlusion, resulting in localized data gaps. In contrast, the limbs, which exhibit a greater range of motion with minimal occlusion, typically maintain complete data capture. Leveraging this characteristic, this paper proposes a semantic segmentation-based processing method that assigns distinct semantic labels to the torso and limb regions of the cow’s lateral point cloud. This approach effectively distinguishes structural information and provides a semantic foundation for further processing. The method facilitates subsequent missing region completion processing, supporting the achievement of high-quality, highly complete 3D reconstruction of dairy cows.
2.3.1. Construction of a Side-View Point Cloud Dataset for Dairy Cows
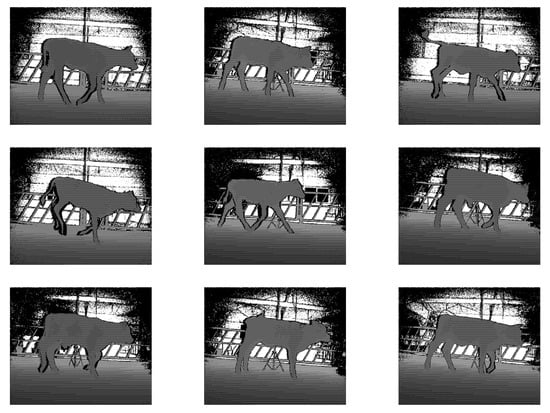
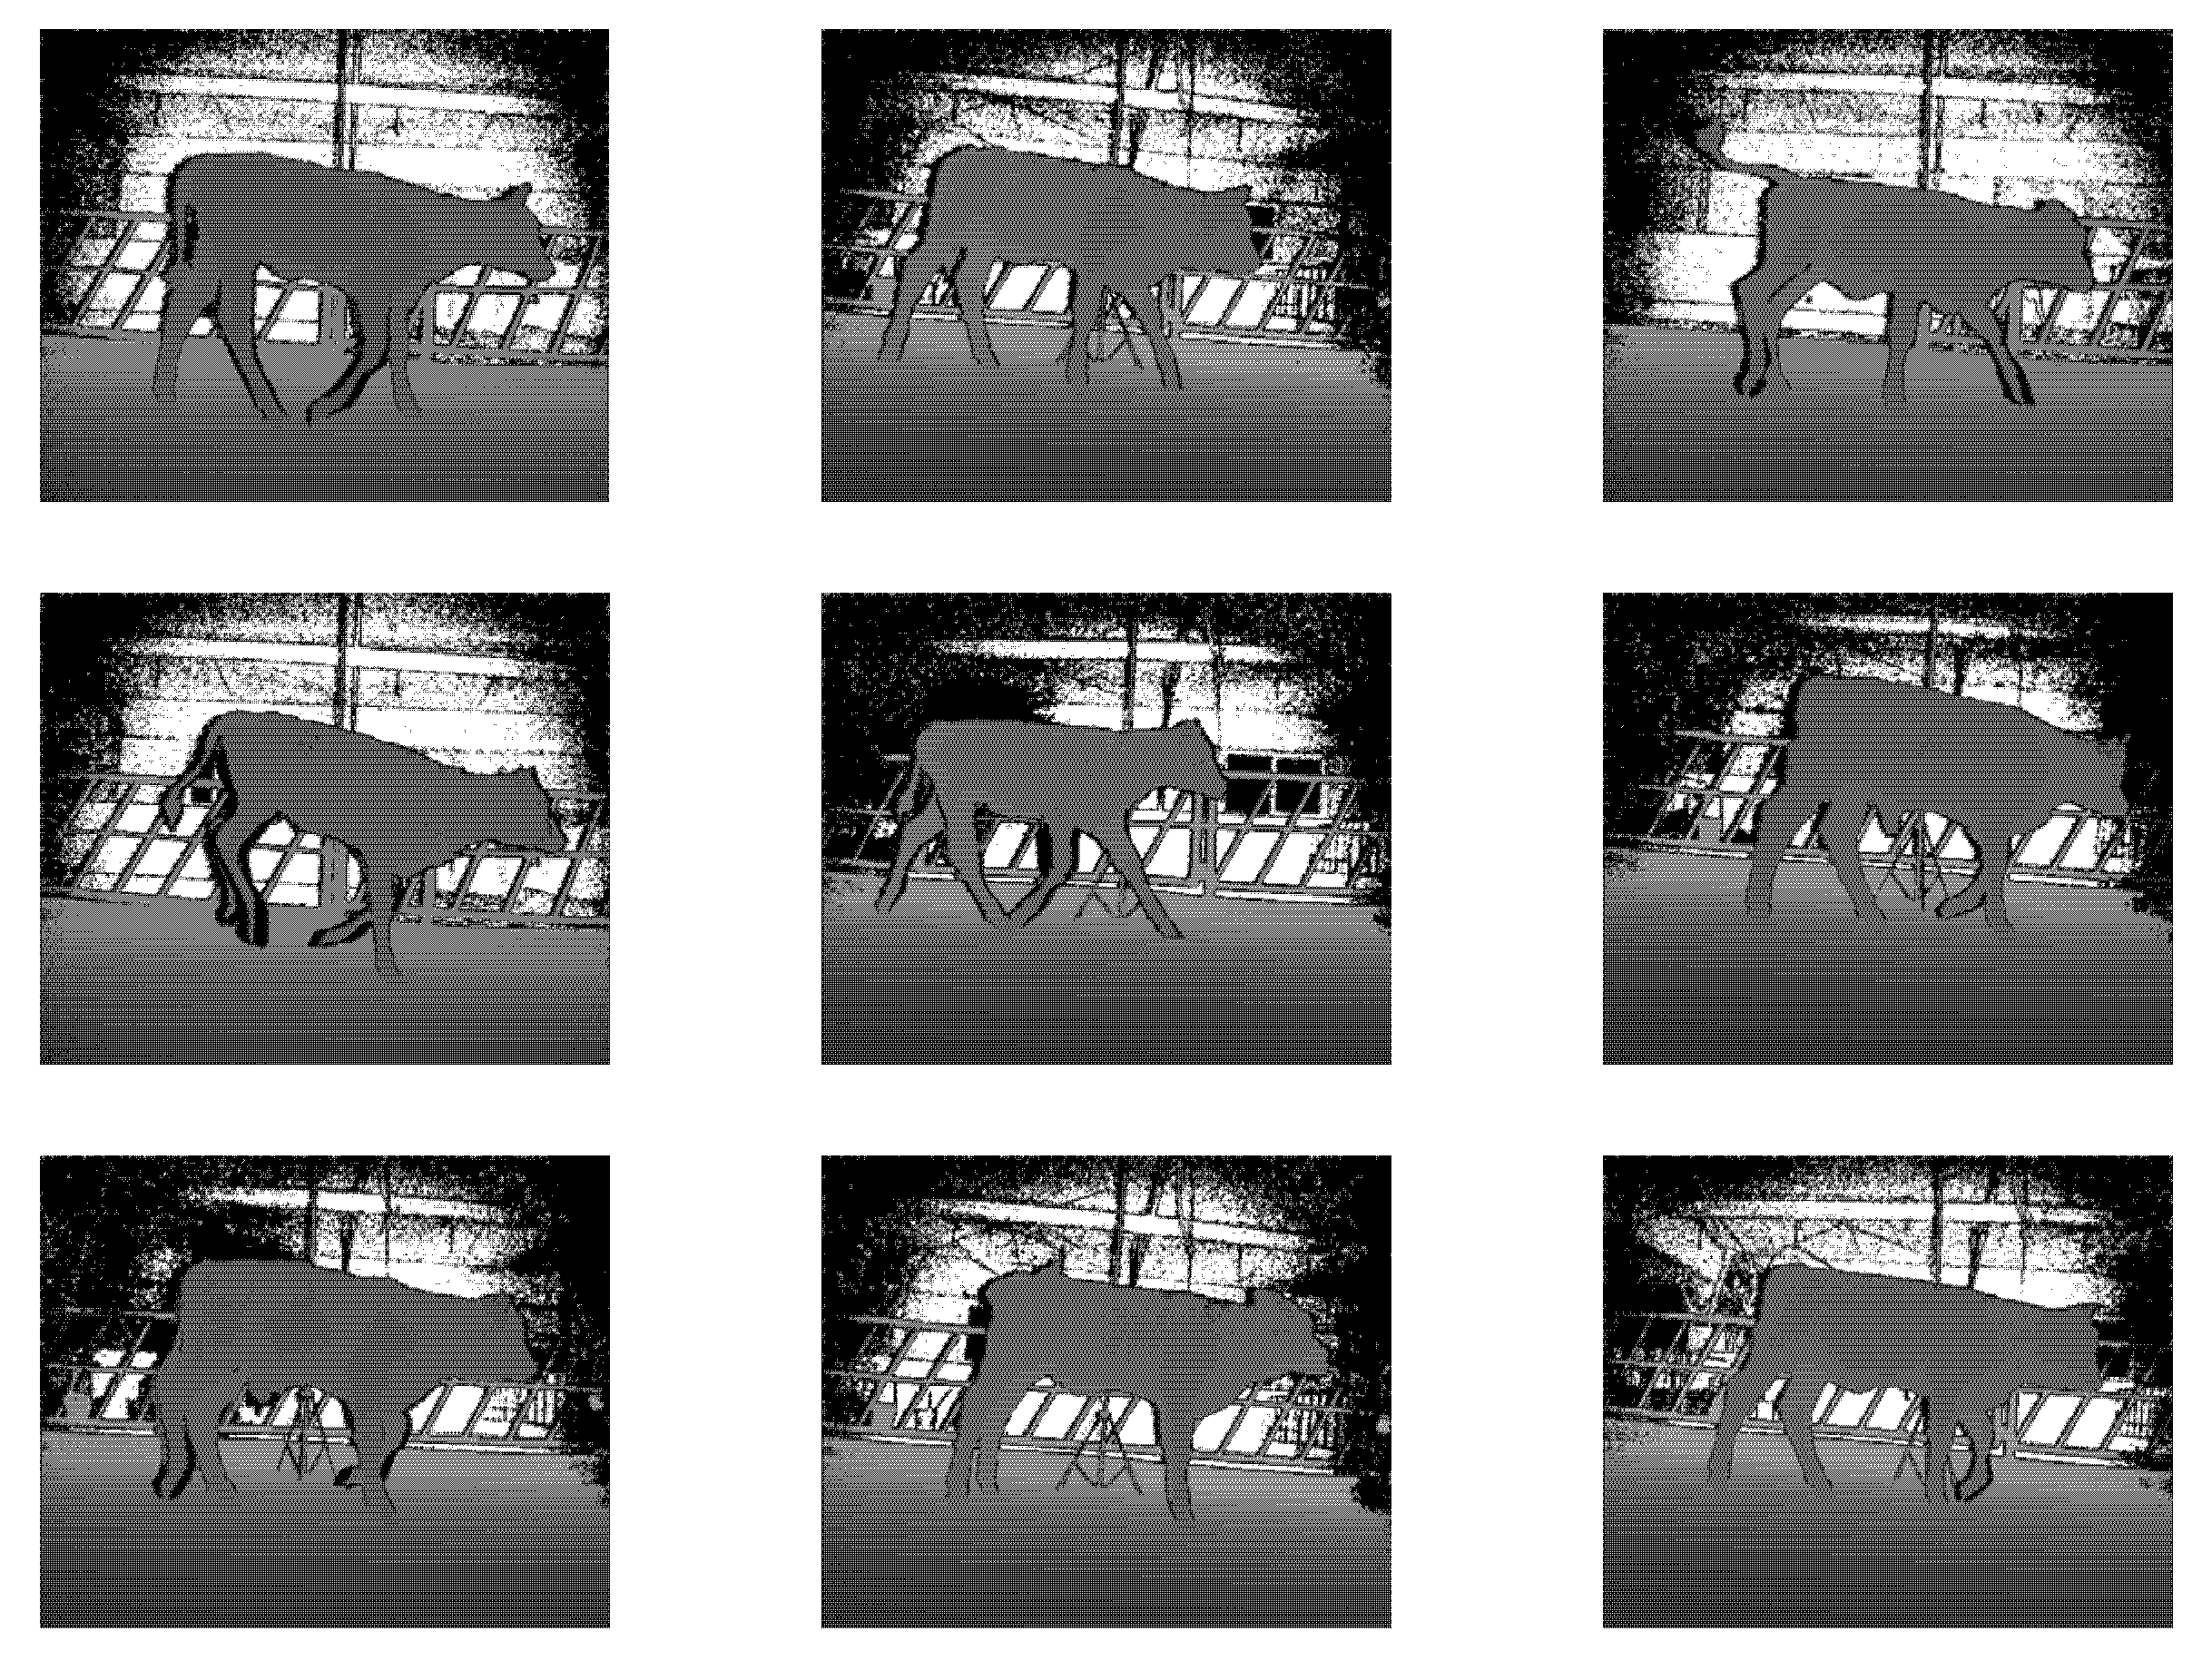
To achieve precise semantic segmentation of the torso and limbs in side-view point clouds of dairy cows, this paper constructs a training dataset based on the ShapeNet dataset as a standard reference. First, lateral depth images of cows in various postures during walking were selected, with partial samples illustrated in Figure 5. After undergoing multi-level point cloud preprocessing, a total of 1029 lateral point cloud samples were obtained. Subsequently, a multidimensional data augmentation strategy was applied, including ±45° spatial rotation, ±0.5 m triaxial translation, and scaling between 0.5 and 1.5 times, to expand the sample set. As a result, a training dataset comprising 2058 point cloud datasets was created. This dataset fully captures the diversity of cow postures and variations in body conformation observed in real-world farming environments, thereby enhancing the algorithm’s generalization capability and robustness [29].
Figure 5.
Cow side-view depth image sample.
In terms of data format processing, the raw PCD format point cloud files were first converted and annotated using CloudCompare v2.10.alpha. Manual annotation was employed to perform precise segmentation of the cow’s side-view point cloud, dividing it into two key regions: the torso and the limbs. Subsequently, normal vector feature information was added to each point cloud dataset (consistent_neighbors = 30, max_neighbors = 6, radius = 0.5). This process ultimately generated 2058 seven-dimensional feature datasets in text format, each containing spatial coordinates (x, y, z), normal vectors (nx, ny, nz), and category labels (label). For dataset partitioning, a stratified random sampling method was employed to divide the complete dataset into training, validation, and test sets in a 3:1:1 ratio. Strict measures were taken to ensure complete independence and no overlap between the subsets.
2.3.2. Convolutional Block Attention Module
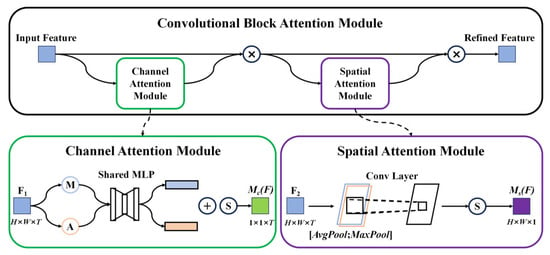
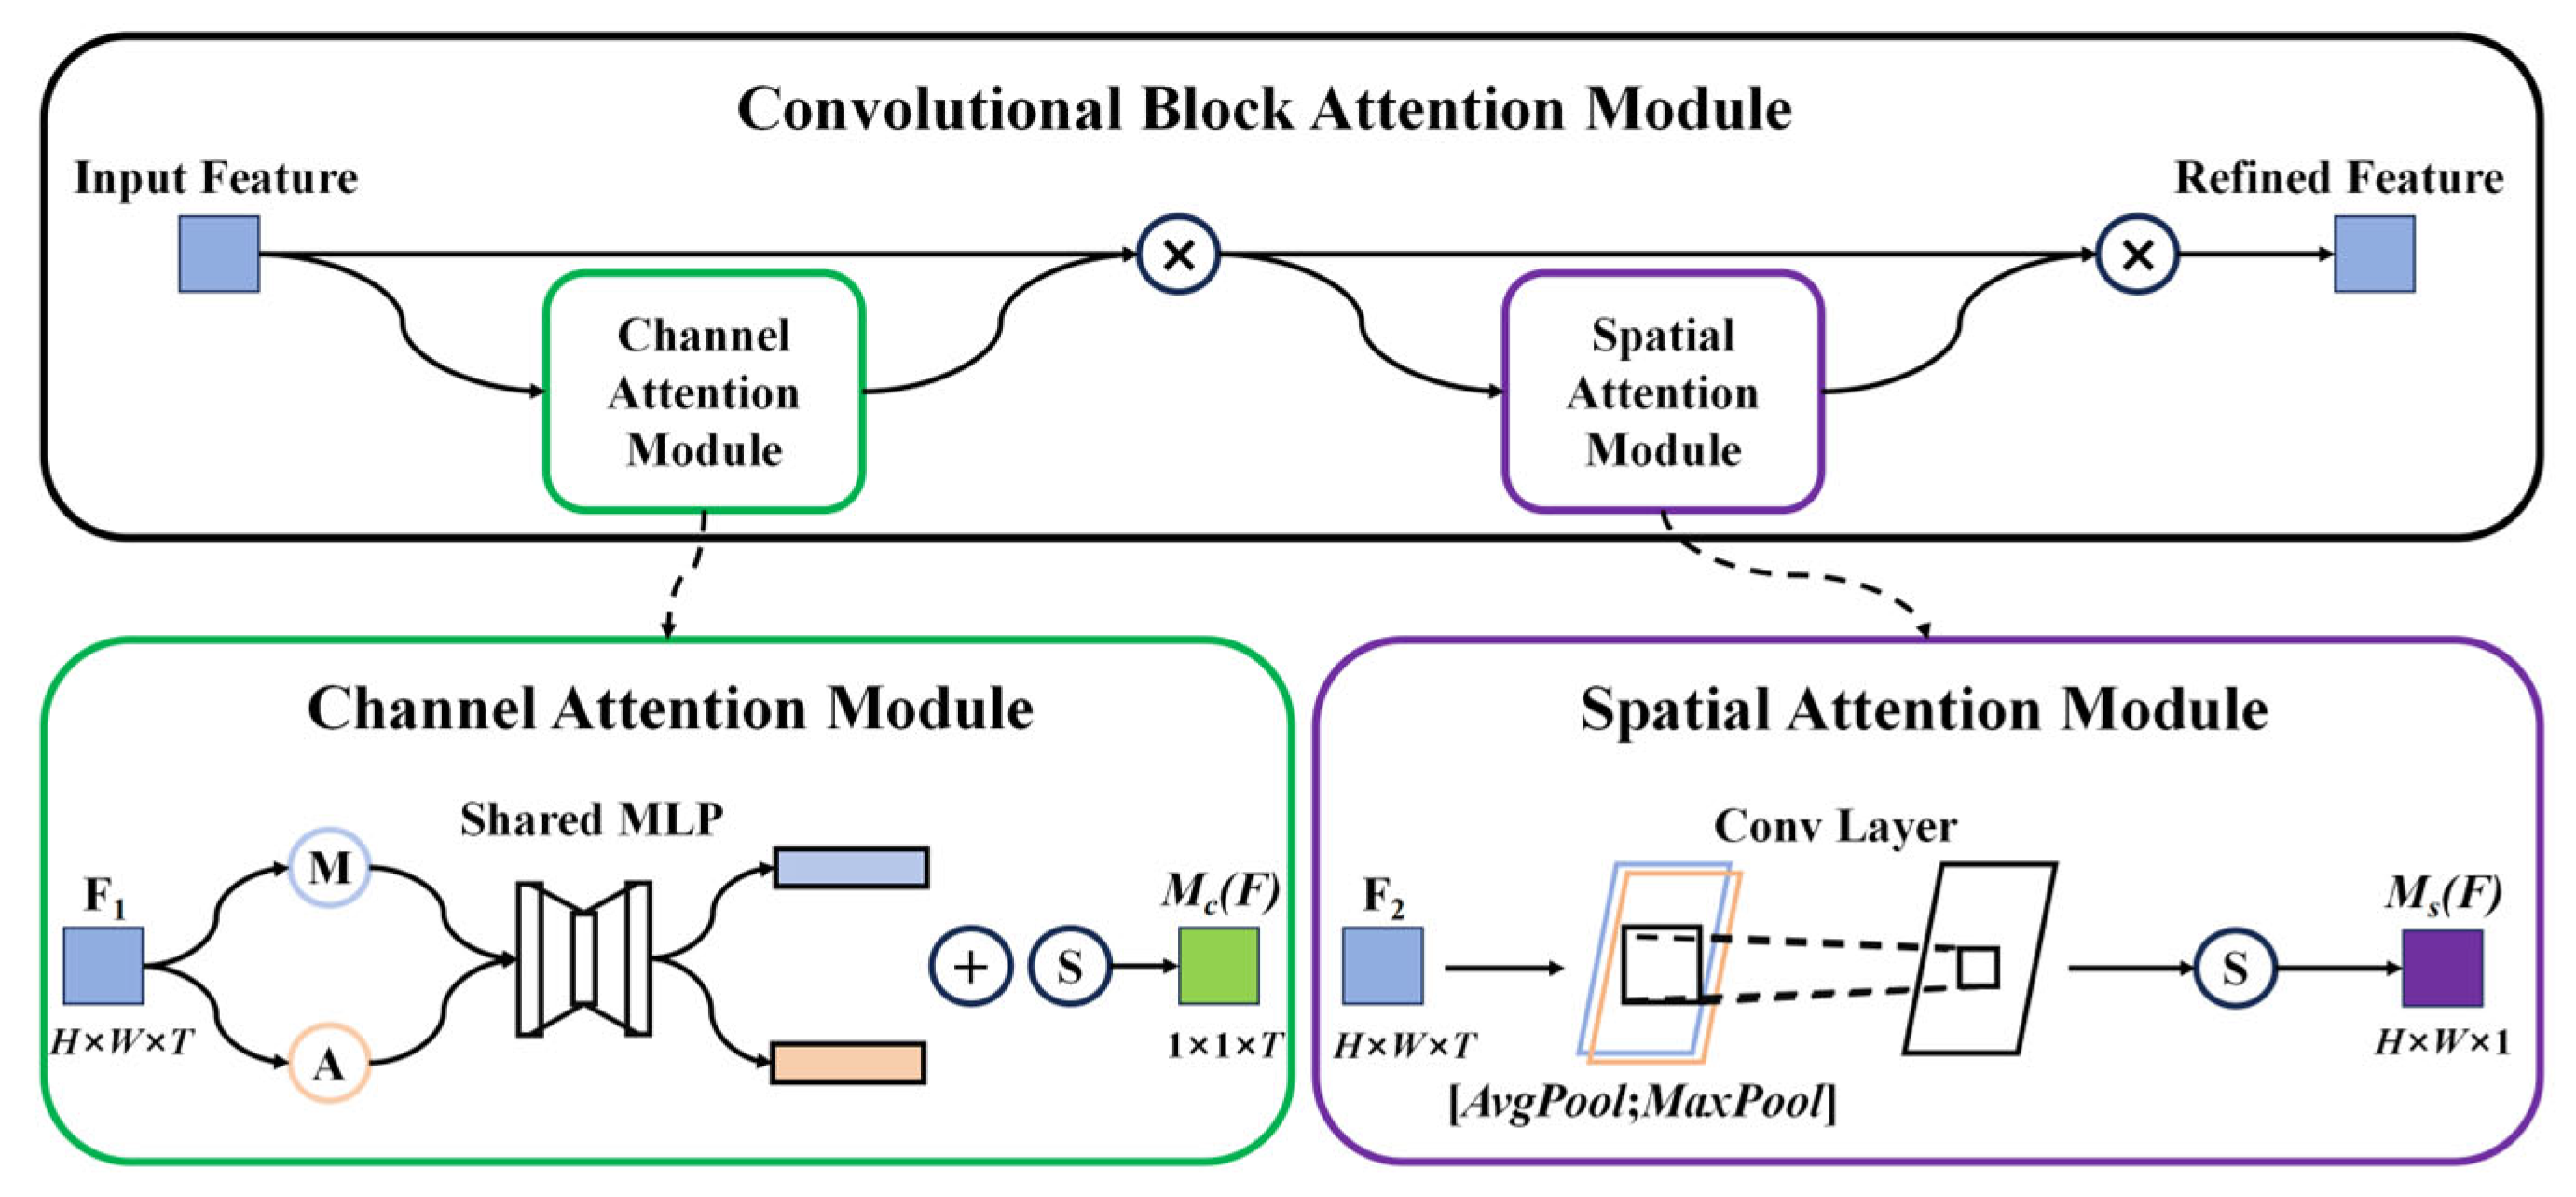
As illustrated in Figure 6, the CBAM integrates the Channel Attention Mechanism and the Spatial Attention Mechanism to achieve multidimensional optimization of point cloud features. During the channel attention phase, the system processes the input feature map through a dual-path approach: first applying global max pooling to extract salient feature responses, and then applying global average pooling to obtain the overall feature distribution. The pooled outputs are then fed into a shared MLP for feature transformation. Element-wise summation combined with a Sigmoid activation function generates the channel attention weight Mc(F), as shown in Equation (4). This weight is multiplied element-wise with the original input features to achieve adaptive feature enhancement in the channel dimension. In the spatial attention phase, the optimized features output from the channel attention phase serve as input. A dual-branch processing approach is employed, utilizing max pooling and average pooling along the channel dimension. The results from both branches are concatenated along the channel dimension, then compressed into a single-channel feature via a 7 × 7 convolution kernel. This is subsequently passed through a sigmoid activation function to generate the spatial attention weights Ms(F), as shown in Equation (5). Finally, these weights are multiplied element-wise with the input feature map of the module to yield a refined feature map possessing dual optimization properties across both spatial and channel dimensions.
In the equation, F1 denotes the channel attention input feature map, and σ represents the Sigmoid activation function.
In the formula, F2 represents the spatial attention input feature map. f7×7 denotes a 7 × 7 convolution kernel. [AvgPool(F);MaxPool(F)] indicates concatenating the results of average pooling and max pooling along the channel dimension.
Figure 6.
Schematic diagram of CBAM. Note: H is the number of grid points in the vertical direction, W is the number of grid points in the horizontal direction, T is the number of channels, M is the maximum pool module, A is the average pool module, S is the sigmoid activation function, and Conv Layer is the convolution layer.
The CBAM achieves dual refinement of input features by integrating channel and spatial attention mechanisms. The channel attention mechanism enhances important feature channels through adaptive weight allocation while suppressing noise and irrelevant feature responses, effectively addressing the problem associated with maximum pooling that often discards non-significant features. Meanwhile, the spatial attention mechanism improves the representation capabilities for edge features and high-curvature regions, while compensating for features in low-density areas, thereby reducing the dominance effect of high-density regions. This module demonstrates remarkable performance across various tasks such as classification and segmentation, particularly in complex, high-noise, and non-uniformly distributed point cloud scenarios.
2.3.3. Attention-Weighted Hybrid Pooling Module
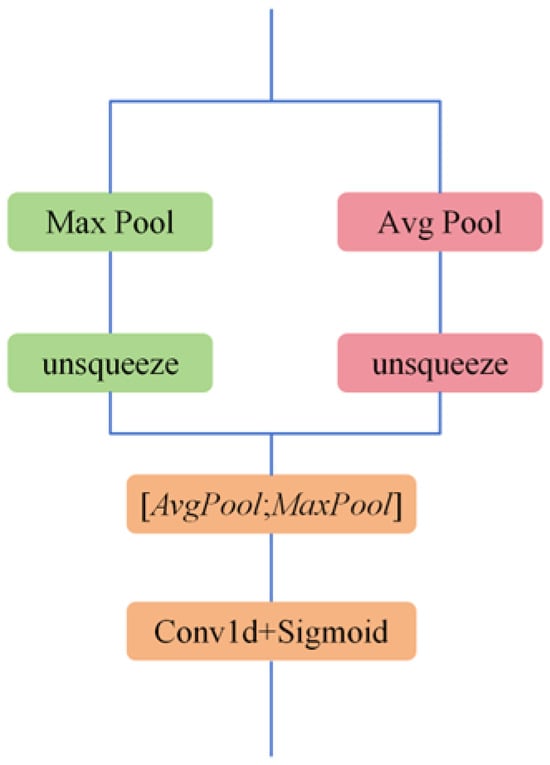
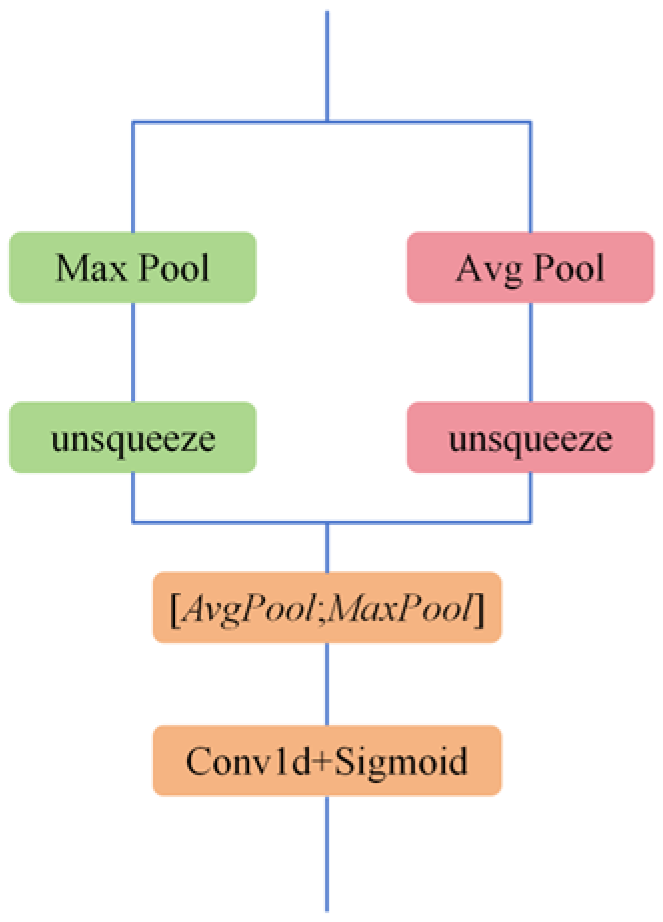
As illustrated in Figure 7, the AHPM performs max pooling and average pooling in parallel on the input features. Following this, the unsqueeze function is applied to expand the dimensions of the two pooled feature tensors, which are then concatenated along the channel dimension. An attention module consisting of a Conv1d and a Sigmoid activation function generates a weight map with values ranging from 0 to 1. This weight map autonomously learns which pooling method is more suitable for different spatial locations. Finally, the attention weights are employed to fuse the results from the two pooling methods, yielding a dynamically blended pooling output. This module effectively captures both locally salient features and globally distributed information, mitigating the information loss commonly associated with single-pooling approaches. It demonstrates superior adaptability to variations in point cloud density and the presence of outliers. By learning optimal fusion weights autonomously, the model adjusts the contribution ratio of both pooling features based on the geometric characteristics of different local regions, enhancing feature expression flexibility. This adaptability renders it particularly suitable for high-precision point cloud segmentation tasks.
Figure 7.
Schematic diagram of AHPM.
2.3.4. CSS-PointNet++ Semantic Segmentation Network Model
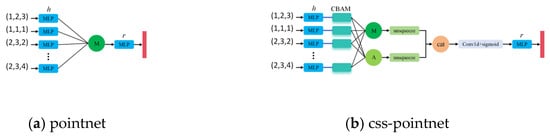
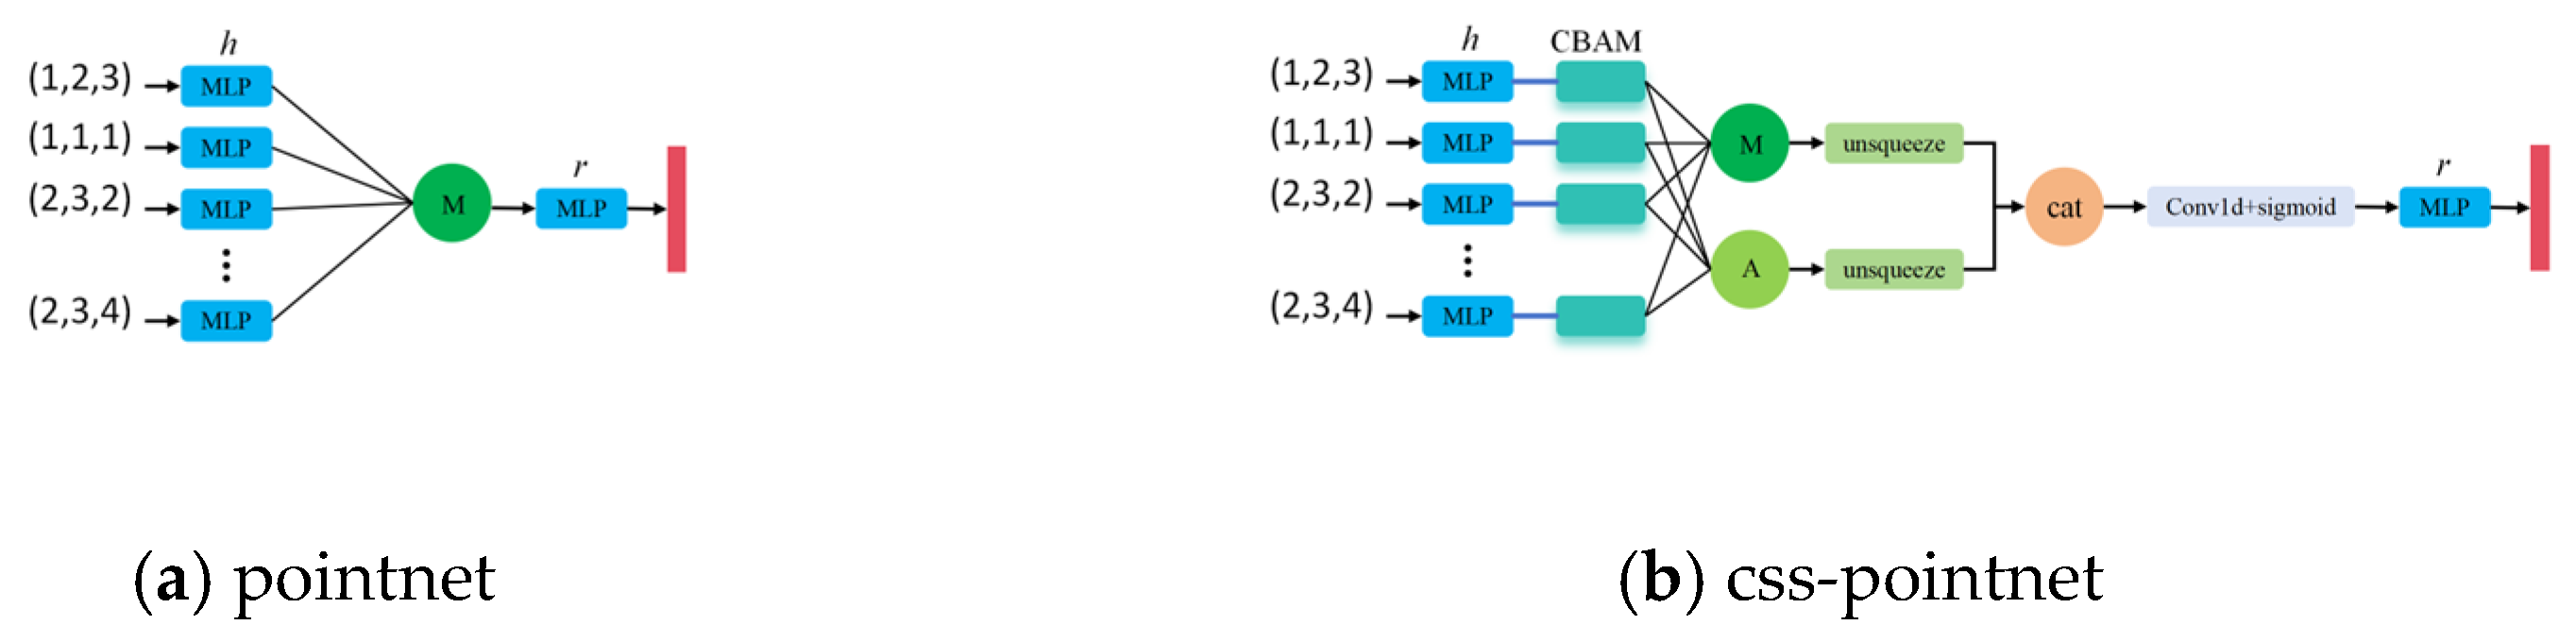
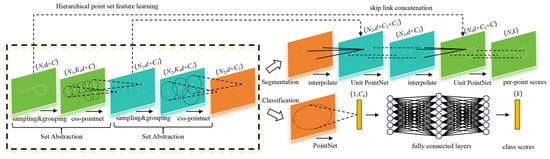
PointNet [30] pioneered the end-to-end neural network model for directly processing unordered point cloud data. Building upon this, PointNet++ [31] introduced a hierarchical recursive structure that constructs layers using Farthest Point Sampling(FPS), applies “pointnet” model locally for feature extraction and aggregation, and employs Feature Propagation(FP) layers to fuse multi-scale information. Due to the morphological and behavioral characteristics of dairy cows, combined with the scanning mechanism of the Kinect V2 depth camera, the acquired side-view point cloud profiles exhibit specific non-uniformities: dense coverage in high-curvature regions, relatively sparse distribution in central and flat areas, higher point density at the top but sparse or missing data at the bottom, as well as blurring, ghosting, or missing segments in dynamic regions. When processing such non-uniform point clouds, the original “pointnet” module—which relies on uniform sampling and a single pooling mechanism—struggles to handle density variations, sparse critical regions, and hair-induced noise, leading to limited segmentation accuracy [32]. To address these limitations, this study integrates the CBAM into the “pointnet” module. By dynamically enhancing features in key anatomical regions through channel and spatial attention mechanisms, the model’s adaptability to density variations is improved. Furthermore, AHPM replaces the original max pooling, combining the strengths of max and average pooling. Attention-weighted adaptive feature fusion helps prevent information loss caused by relying on a single pooling strategy. The resulting “css-pointnet” module enhances robustness in identifying sparse critical areas while effectively suppressing noise interference. This provides a more reliable foundation for 3D segmentation in subsequent precision livestock farming applications, such as body condition scoring and body measurement. The structures of the original “pointnet” module and the improved “css-pointnet” module are shown in Figure 8.
Figure 8.
“pointnet” module before and after improvement.
The specific architecture of the CSS-Pointnet++ semantic segmentation network model is shown in Figure 9: The sampling and grouping layer selects representative center points using FPS to ensure uniform coverage of the point cloud. It then groups each center point with its neighboring points via Spherical Range Query or k-NN Query, forming local regions. This step provides structured input for subsequent local feature extraction, addressing the disordered nature of point clouds while accommodating varying density distributions. The “css-pointnet” feature extraction module performs point-wise feature transformations on each point within its neighborhood via a shared MLP, ensuring permutation invariance through weight sharing. The CBAM adapts feature calibration across both channel and spatial dimensions, enhancing responses to key features. The AHPM highlights salient features while preserving more detailed information, boosting the expressive power of local feature aggregation. The Feature Propagation layer upscales downsampled low-resolution features to high resolution through inverse distance-weighted interpolation, progressively restoring spatial details. Combined with skip link concatenation, it fuses shallow features from the same encoding layer with deep semantic features, effectively mitigating information loss caused by multiple downsampling stages. This enables the model to achieve precise point-wise predictions.
Figure 9.
CSS-PointNet++ network architecture diagram. Note: N is the number of input and output point clouds, d is the coordinate dimension, C is the other feature dimensions, N1 and N2 are the number of point cloud samples, K is the number of domain points obtained from each sample, C1 and C2 are the feature dimensions after passing through pointnet layer, C3 is the feature dimensions after passing through unit pointnet layer, C4 is the deepest feature dimension of the network, k is the number of semantic categories in the segmentation task, and k is the number of categories in the classification task.
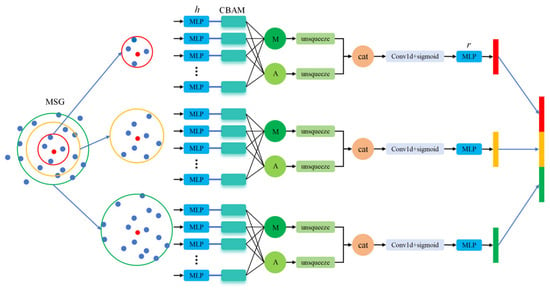
Unlike the single-scale grouping (SSG) strategy employed by traditional PointNet++, CSS-PointNet++ adopts a multi-scale grouping (MSG) strategy for the Set Abstraction(SA) layer during actual training. This strategy represents a core optimization solution addressing the non-uniformity issue in point clouds. As illustrated in Figure 10, its core idea lies in abandoning single-scale perception. Instead, it simultaneously captures local spatial context at different scales by concurrently applying multiple neighborhood groupings with distinct radii to the same central point. Feature extraction for each scale is performed independently through the shared-weight “css-pointnet” module. The resulting multi-scale feature vectors are then fused to form the final feature representation for the central point. This approach enables the network to adaptively handle variations in point cloud density: fine-grained structures in dense regions are captured at small scales, while information integrity in sparse regions is preserved at large scales. This significantly enhances the model’s feature expression capability and robustness in complex real-world scenarios.
Figure 10.
Schematic diagram of CSS-PointNet++ SA layer. Note: h is the point-by-point feature extraction layer, p is the feature weighted by CBAM, cat is the pooled feature splicing module, and r is the high-order feature extraction module.
2.3.5. Test Environment and Parameter Settings
The experimental environment configuration is as follows: CPU is an Intel Core i7-13700H Processor, GPU is an NVIDIA GeForce RTX 4060 Laptop GPU, memory is 16GB, Python version is 3.8, deep learning framework is PyTorch 1.11.0, CUDA 11.3, and training parameters are set as shown in Table 1.
Table 1.
Training parameter settings.
2.3.6. Evaluation Indicators
To evaluate the performance of point cloud segmentation models, this paper employs Overall Accuracy (OA), Class-wise Accuracy, Intersection over Union (IoU), and Mean Intersection over Union (mIoU) as evaluation metrics. The overall accuracy rate represents the proportion of correctly predicted points among all points, and its calculation formula is shown in Equation (6).
In the formula, Class represents the total number of categories, Total Points denotes the total number of points across all category point clouds, and TPi (True Positive) indicates the total number of points correctly predicted as category i.
Class-wise Accuracy represents the proportion of points correctly predicted as belonging to category i and correctly excluded from category i out of the total number of points. Its calculation formula is shown in Equation (7).
In the formula, FNi (False Negative) represents the total number of points where the true class is i but is predicted as another class.
IoU represents the degree of overlap between predicted segmentation results and ground truth segmentation. Its value ranges from 0 to 1, with higher values indicating greater overlap between predictions and ground truth. The calculation formula is shown in Equation (8).
In the formula, FPi (False Positive) represents the total number of points incorrectly predicted as category i.
mIoU represents the average of the IoU for each category across the entire dataset, yielding a single comprehensive segmentation accuracy metric. Its calculation formula is shown in Equation (9).
2.4. Reconstruction of a 3D Point Cloud Model of a Dairy Cow
2.4.1. Dual-Viewpoint Point Cloud Registration
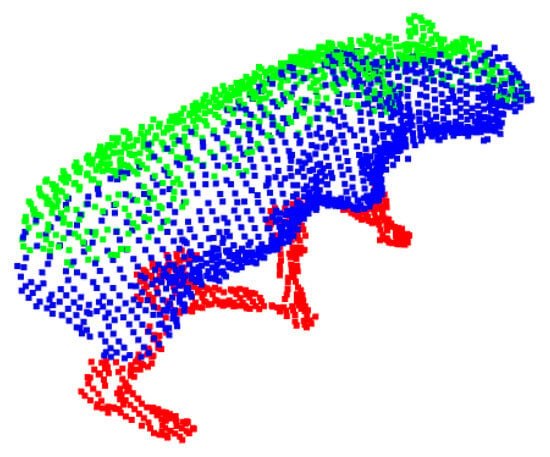
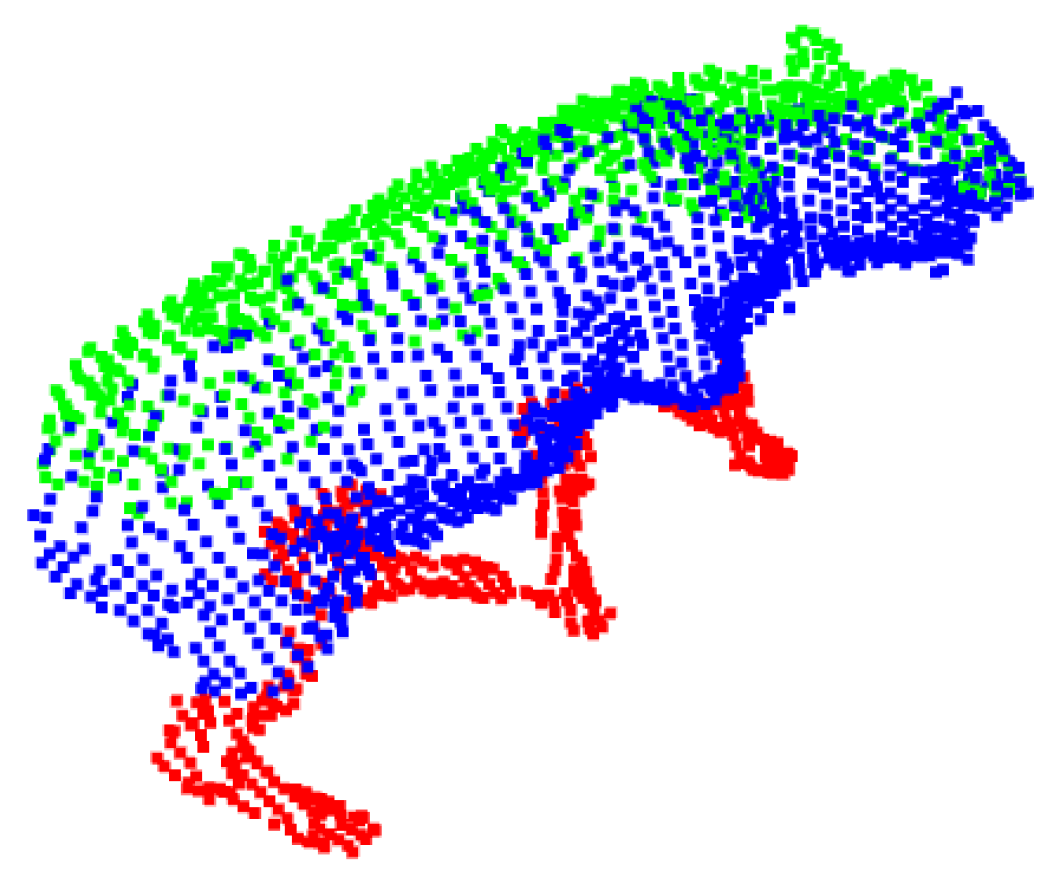
To achieve dual-viewpoint point cloud registration for dairy cows, it is essential to determine the rigid body transformation between two coordinate systems. A rigid body transformation refers to the conversion of an object’s coordinates in three-dimensional space from one coordinate system to another using a rotation matrix R3×3 and a translation matrix T3×1. This paper employs Spherical Calibration based on Randomized Anonymized Random Sampling and Consistency (RANSAC) [33] along with Singular Value Decomposition (SVD) [34] to compute the parameters of the rigid body transformation. Initially, a set of spherical calibration models is arranged within the dual-viewpoint Kinect V2 camera synchronous acquisition system to capture both top-view and side-view point cloud data of the calibration models. The RANSAC algorithm is then employed to match corresponding sphere centers across the two point cloud sets. Finally, SVD is utilized to compute the optimal rotation matrix R3×3 and translation matrix T3×1, facilitating the registration between the top-view of the cow and the semantically informative side-view point cloud. The registered point cloud data of the cow is illustrated in Figure 11.
Figure 11.
Aligned cow point cloud image. Note: The green point cloud represents the cow’s top-view point cloud, the blue point cloud represents the torso portion of the cow’s side-view point cloud, and the red point cloud represents the limbs portion of the cow’s side-view point cloud.
2.4.2. Image Completion Strategy Based on Semantic Segmentation Results
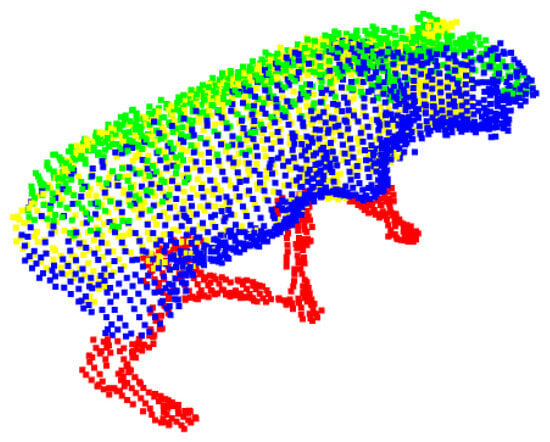
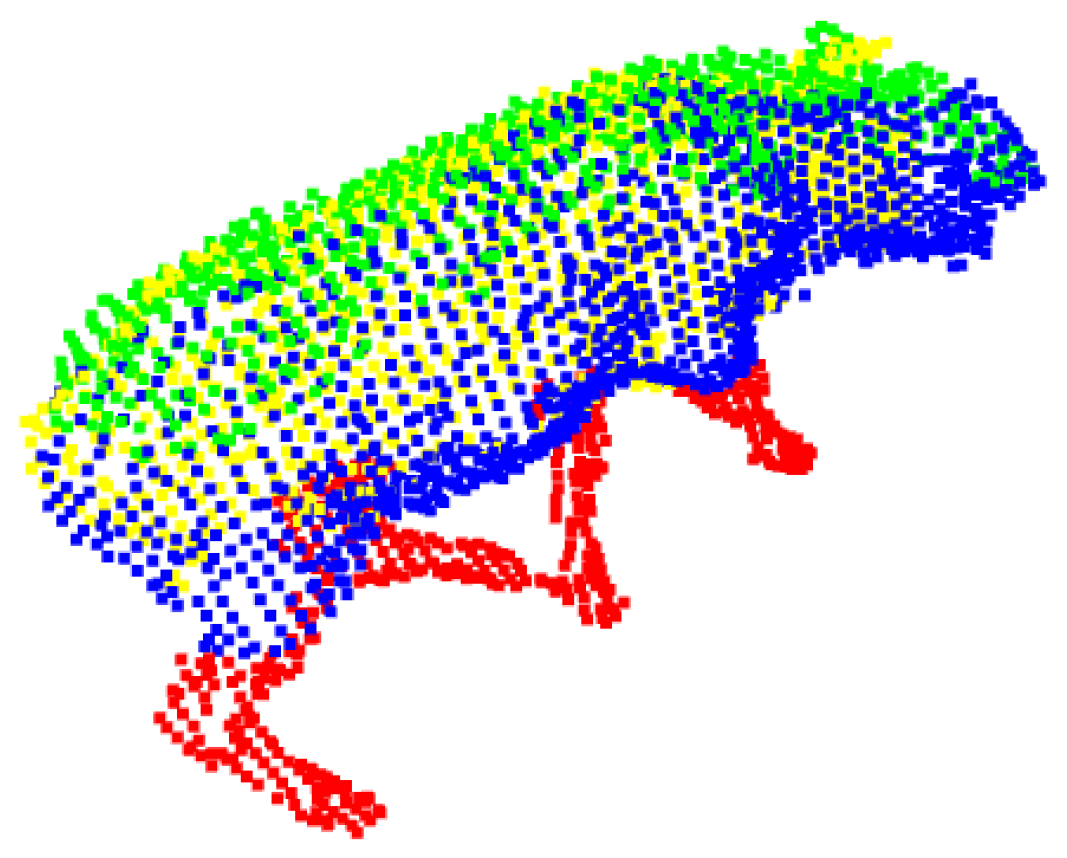
This paper proposes a semantic-guided side-view point cloud mirroring method for cows to reconstruct missing point cloud data. First, the cow’s top-view point cloud is projected onto the XOY plane to determine its distribution range along the Y-axis. The top-view point cloud is then uniformly sliced along the Y-axis at a specified thickness l. For each slice, the points with the maximum and minimum x-values are identified, and their median coordinates are calculated to create a set of median points that represent the contour features of the cow’s spine. Next, a linear regression algorithm is applied to fit a straight line through these median points. This fitted line, together with the XOY plane, is used to construct a mirror plane. Finally, by integrating semantic information from the lateral point cloud of the cow, the mirroring process is applied to the torso section of the lateral point cloud, resulting in a complete 3D point cloud model of the cow, as illustrated in Figure 12.
Figure 12.
Mirror-processed cow point cloud image. Note: The green point cloud represents the cow’s top-view point cloud, the blue point cloud represents the torso portion of the cow’s side-view point cloud, the red point cloud represents the limbs portion of the cow’s side-view point cloud, and the yellow point set represents the mirror-generated point cloud.
This method integrates semantic information from lateral point clouds of dairy cows, applying differentiated processing to address occlusion in different body regions during data collection. For limb areas with minimal occlusion and typically intact structures, the original point cloud structure is preserved. For the torso region, prone to occlusion and resulting in data gaps, precise reconstruction is achieved through symmetry analysis and local point cloud generation under semantic constraints. This approach significantly enhances the completeness and reconstruction accuracy of the cow point cloud model while maintaining geometric consistency.
2.5. Cow Weight Estimation
2.5.1. Point Cloud Surface Reconstruction
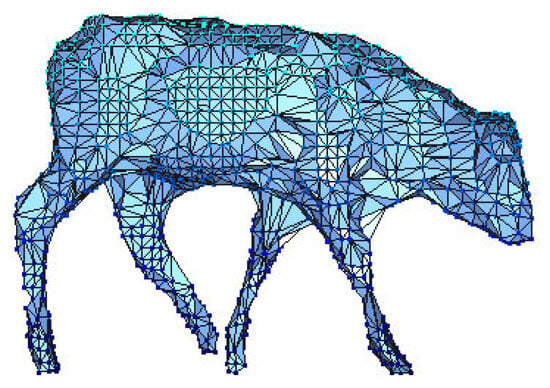
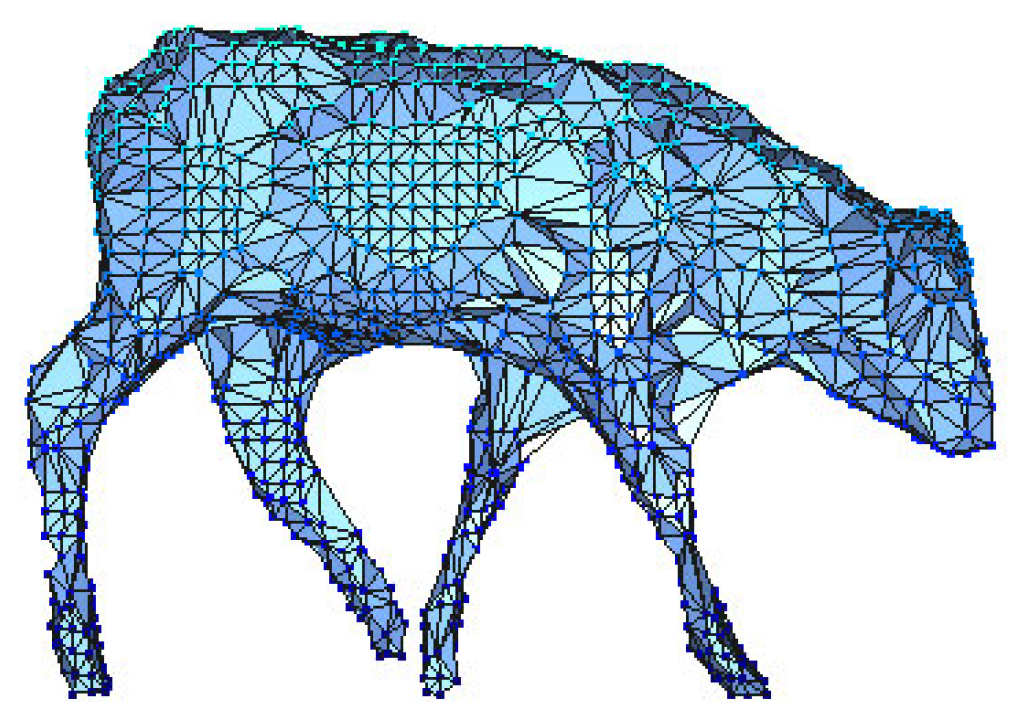
This article uses the Alpha Shapes algorithm [35,36] (alpha-value = 4.5) to reconstruct the surface of a 3D point cloud model of a cow, and uses hole-filling techniques to fill in the missing areas [37]. Finally, the 3D surface model of the cow is obtained, as shown in Figure 13.
Figure 13.
3D surface model of dairy cow.
2.5.2. Weight Prediction Model Development
This paper employs the Cross Product and Divergence Theorem to calculate the surface area and volume parameters of a 3D bovine surface model [38]. Initially, the surface model is discretized into multiple triangular patches using a triangular mesh approach. For surface area computation, the area of each triangular patch is calculated based on the principle of the spatial vector cross product, as described by the formula in Equation (10). The total surface area of the model is then obtained by summing the areas of all triangular patches. For volume calculation, the coordinate origin O is used as the reference point. The signed tetrahedral volume formula indicated in Equation (11) is applied to determine the volume of the tetrahedron formed by each triangular patch and the reference point. Finally, the absolute values of all tetrahedral volumes are computed and summed to obtain the total volume of the model.
In the formula, v0, v1, and v2 denote the coordinates of the triangle’s vertices.
This study employs four methods—Backpropagation Neural Network(BPNN), Radial Basis Function Neural Network(RBFNN), Random Forest(RF), and Multiple Linear Regression(MLR)—to construct a bovine weight estimation model based on the volume and surface area parameters of 3D bovine surface models. Four evaluation metrics—Mean Absolute Error (MAE), Root Mean Square Error (RMSE), Mean Relative Error (MRE), and Coefficient of Determination (R2)—were selected to comprehensively assess model performance. Through comparative experimental analysis, the optimal weight estimation model was identified.
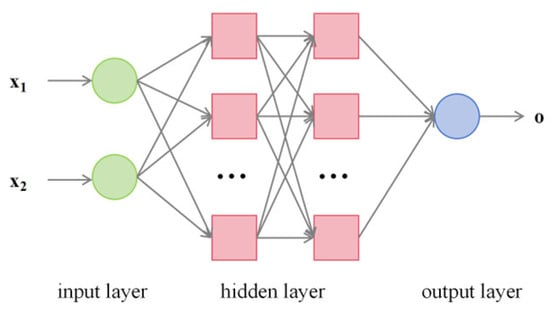
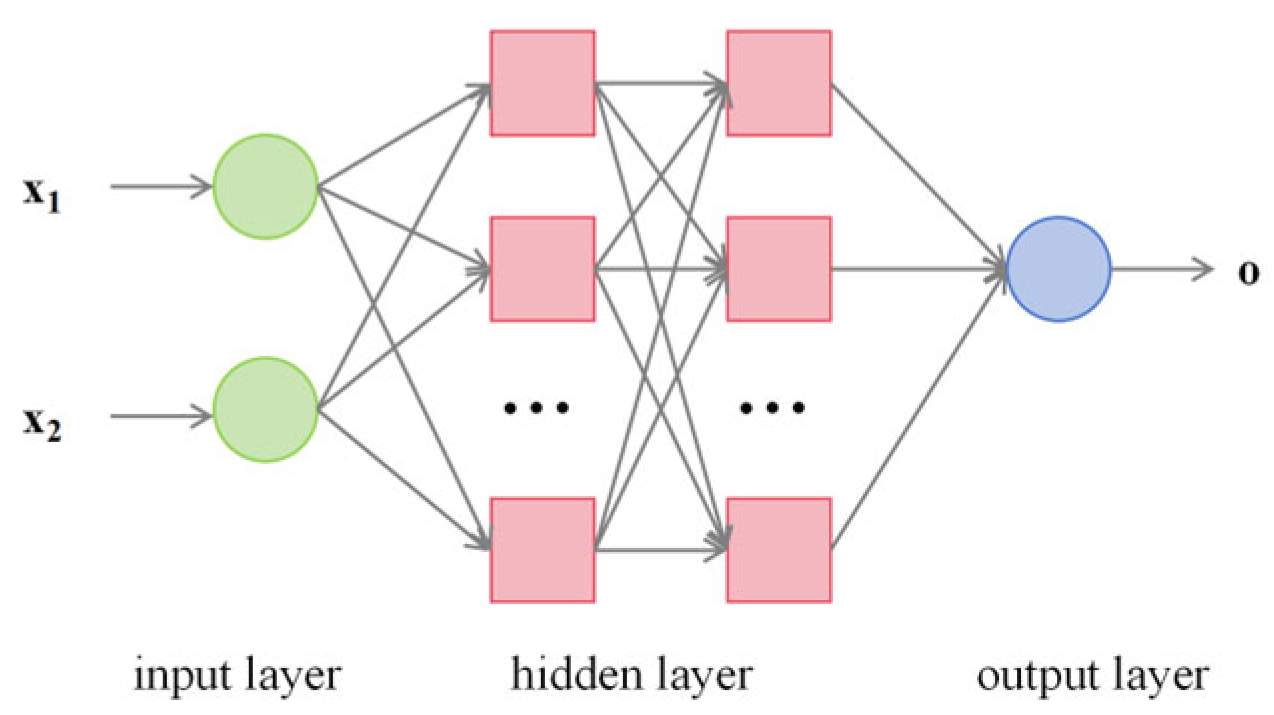
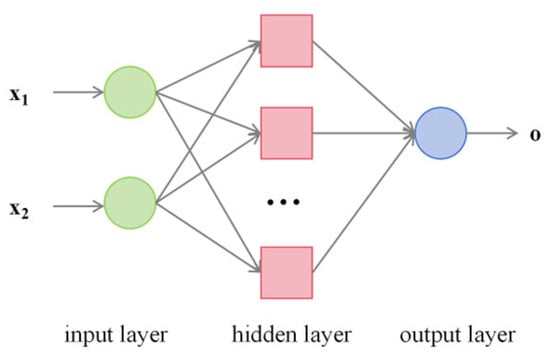
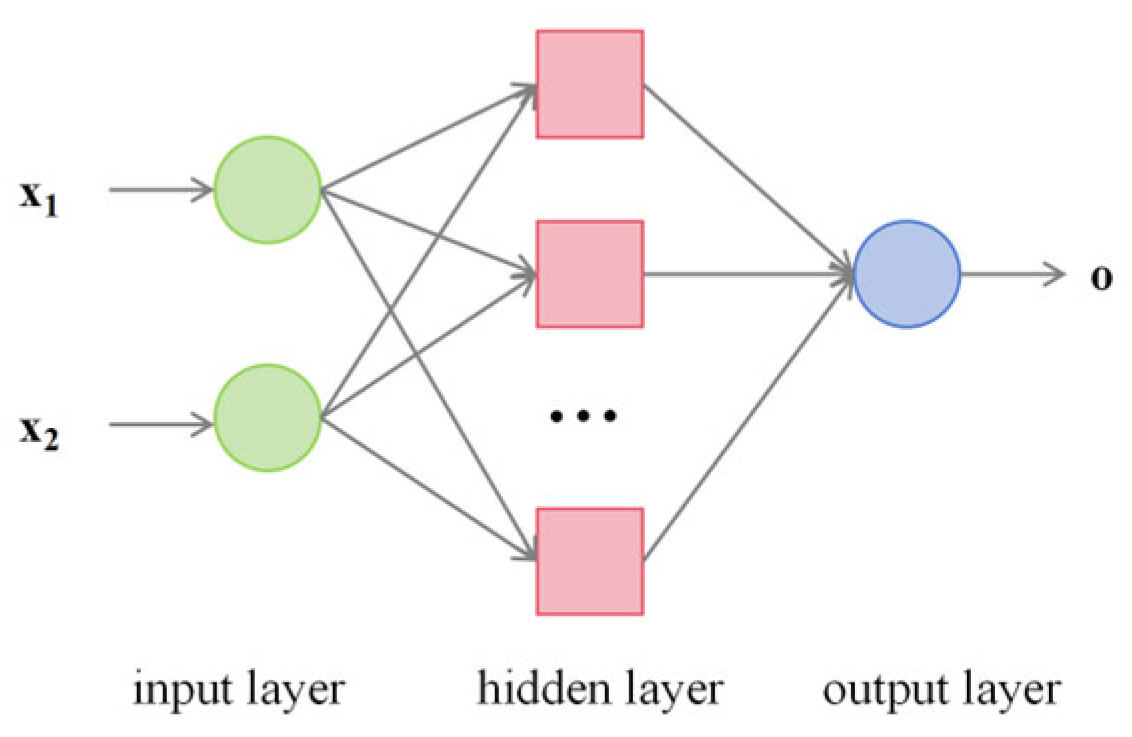
The BPNN is a multilayer feedforward network trained using the error backpropagation algorithm; its network structure is shown in Figure 14. The network architecture includes an input layer with two neurons (volume and surface area), a first hidden layer with 64 neurons and ReLU activation, a second hidden layer with 32 neurons using Tanh activation, and a single-neuron output layer for cow weight prediction. During forward propagation, inputs are processed sequentially through each layer to produce the final output. In the backward pass, errors are propagated from the output layer back through the network using the chain rule, and gradient descent is applied to update weights and biases by minimizing the loss function. This structure enables the network to model complex nonlinear relationships between input features and output values, offering strong fitting capacity and generalization performance for regression tasks such as weight estimation.
Figure 14.
BPNN Structure Diagram.
The RBFNN consists of an input layer with two neurons (corresponding to volume and surface area), a hidden layer with 64 radial basis functions, and an output layer with one neuron for cow weight prediction, its network structure is shown in Figure 15. Training first determines the centers and widths of the basis functions using a clustering algorithm, then computes the output weights via the least squares method. By leveraging radial basis functions for nonlinear mapping, the network provides strong local approximation ability and fast training, making it well-suited for regression prediction tasks.
Figure 15.
RBFNN Structure Diagram.
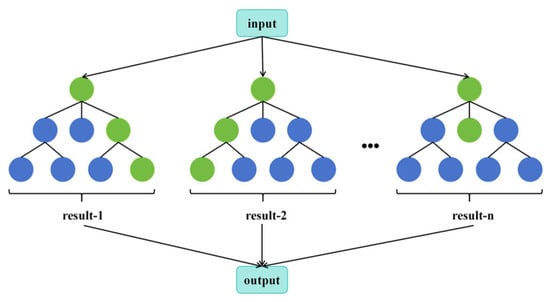
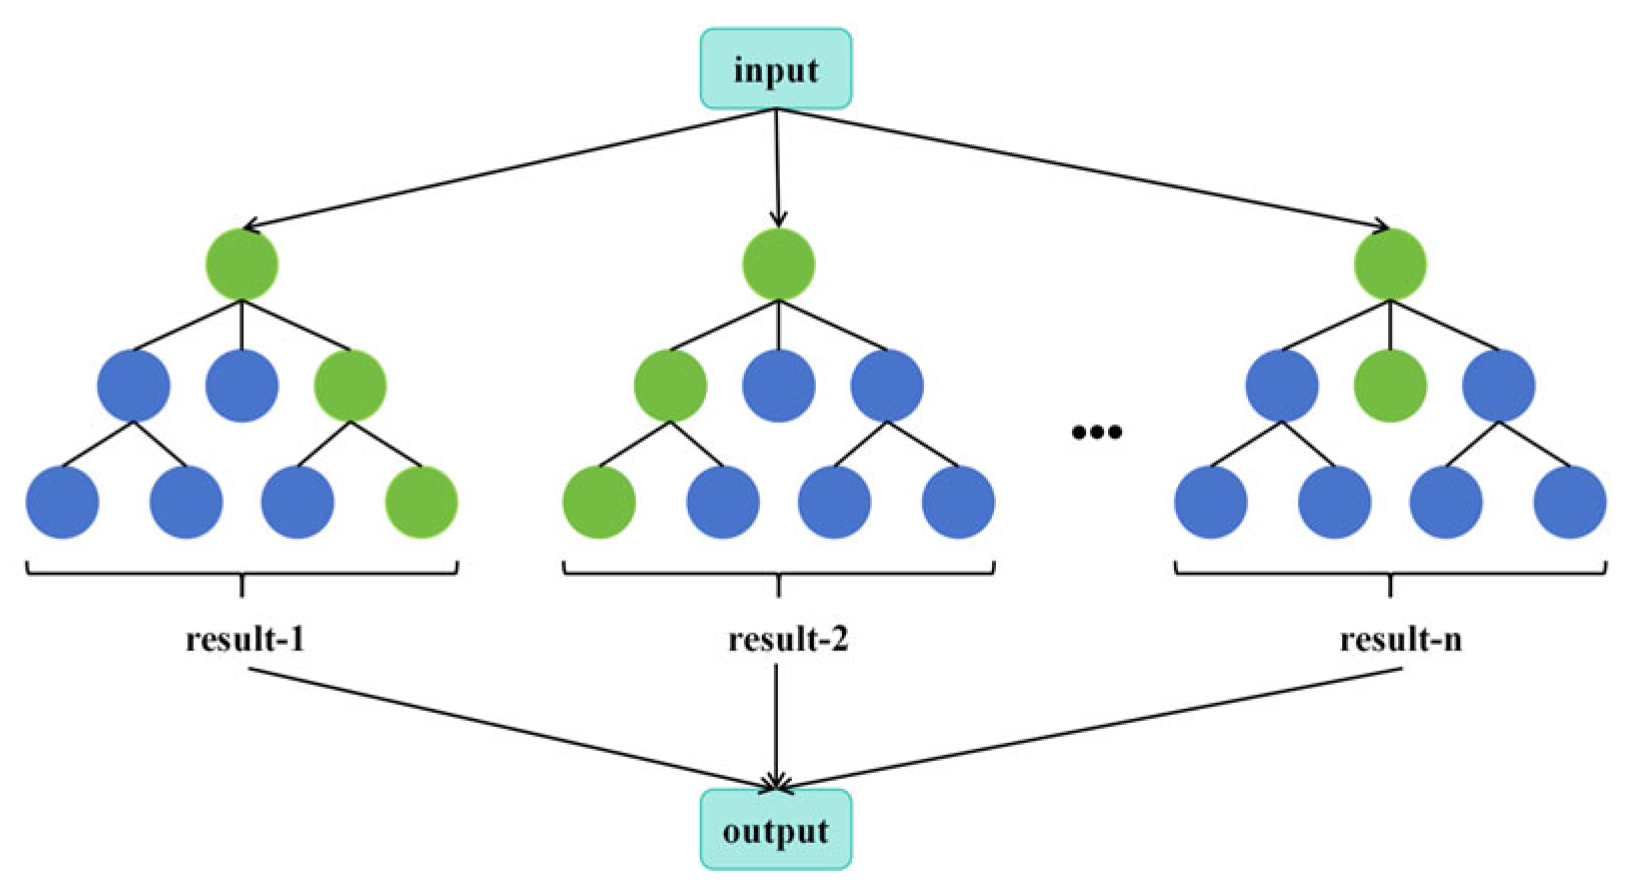
RF is an ensemble learning algorithm based on the Bagging principle, which improves prediction performance by constructing multiple decision trees and aggregating their outputs. Its network structure is shown in Figure 16. Its core design employs a dual randomization strategy: first, using Bootstrap sampling to create distinct training subsets for each tree; second, randomly selecting feature subsets at each node split to determine the optimal division. This mechanism reduces overfitting risk in individual trees and enhances the model’s generalization ability. For regression tasks, the model averages predictions from all trees; for classification, it uses majority voting. Random Forest inherently evaluates feature importance, demonstrates robustness to outliers and feature scaling, and effectively captures nonlinear feature relationships. It is particularly suitable for regression and classification tasks involving small to medium-sized datasets.
Figure 16.
RF Network Structure Diagram.
MLR is a statistical model that predicts a target variable through linear combinations of multiple independent variables. The expression is shown in Equation (12) using the least squares method to estimate parameters and minimize prediction errors. In this study, the data are first standardized, then parameters are estimated via least squares to derive standardized coefficients. The final predicted values are obtained through inverse transformation to their original scale. This approach is suitable for investigating and predicting the linear effects of multiple factors on a dependent variable.
where represents the predicted body weight, β0 is the intercept term, β1 and β2 are the regression coefficients for input1 and input2, respectively, and p denotes the error term.
3. Results and Discussion
3.1. Cow Side-View Point Cloud Segmentation
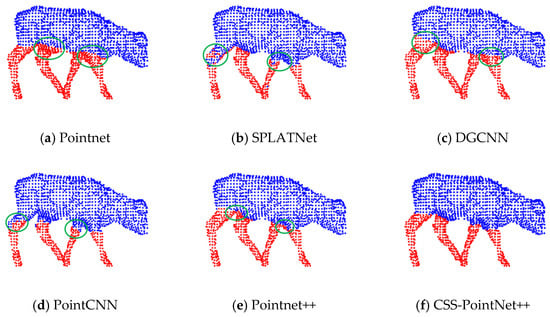
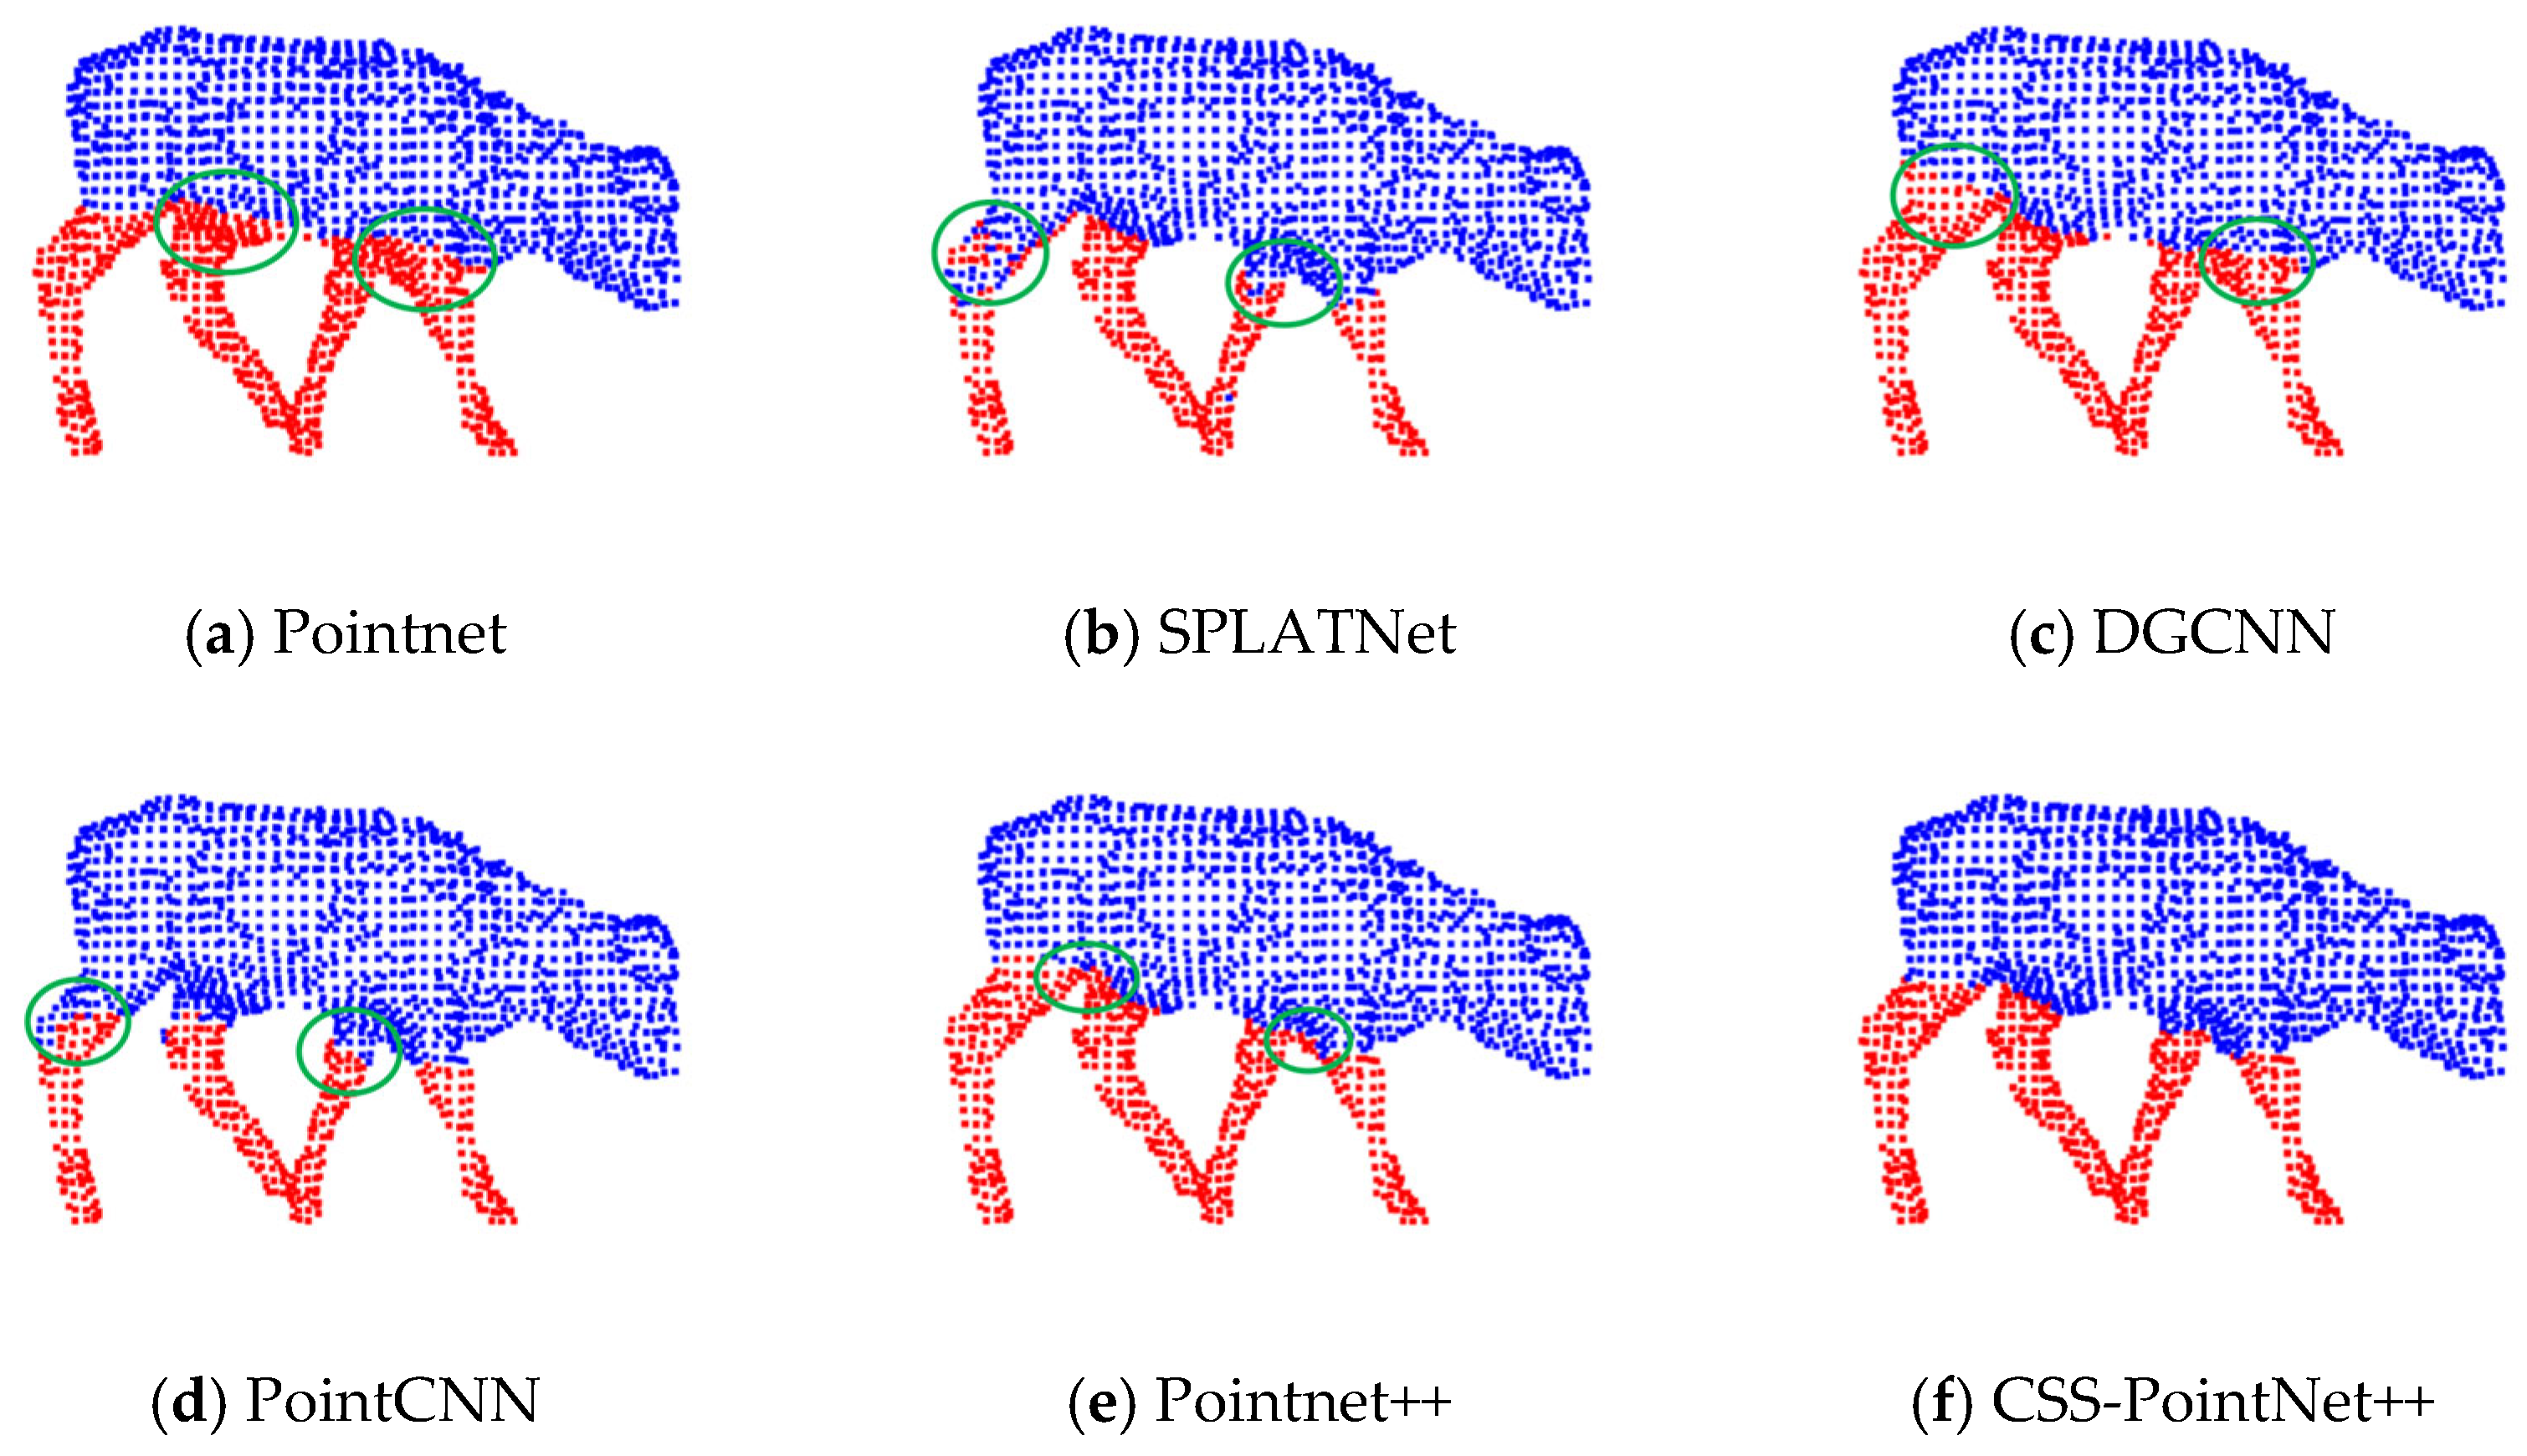
To validate that the proposed CSS-PointNet++ network model outperforms mainstream deep learning algorithms for segmenting the torso and limbs of cows from side-view point clouds, we trained and tested PointNet [30], PointNet++ [31], SPLATNet [39], DGCNN [40], and PointCNN [41] on the constructed cow side-view point cloud dataset. The test results are shown in Table 2.
Table 2.
Comparative experiment of a point cloud segmentation algorithm.
Comparative analysis reveals that PointNet, which lacks local feature processing for point clouds, exhibits inferior OA and mIoU metrics compared to other algorithms. SPLATNet is sensitive to variations in point cloud density, resulting in feature blurring and information loss that compromise its segmentation performance. DGCNN and PointCNN display unstable segmentation performance when handling fine structures, struggling to accurately segment intricate regions such as the limbs and torsos of cattle. PointNet++ also fails to effectively extract key features from non-uniformly distributed point cloud data, impairing its segmentation capability. In contrast, CSS-PointNet++ integrates the CBAM and the AHPM during feature extraction, significantly enhancing its ability to focus on critical channels and spatial regions. This improvement leads to greater segmentation accuracy in complex structures and detailed areas. Compared to baseline models, CSS-PointNet++ achieves a 2.2% overall gain in segmentation accuracy, with torso and limb segmentation accuracy increasing by 2.84% and 0.15%. The IoU is improved by 4.65%, with torso and limb IoU increasing by 2.96% and 6.34%, respectively. This enables effective extraction of fine, complex point cloud features, facilitating a more precise structural understanding, particularly in contour recognition at the boundaries between the torso and limbs of dairy cows. Segmentation results for each model are illustrated in Figure 17.
Figure 17.
Comparison of the segmentation effects of each model.Note:The green circle represents the point cloud portion where semantic segmentation failed.
3.2. Semantic-Guided Side-View Point Cloud Mirroring Method for Dairy Cows
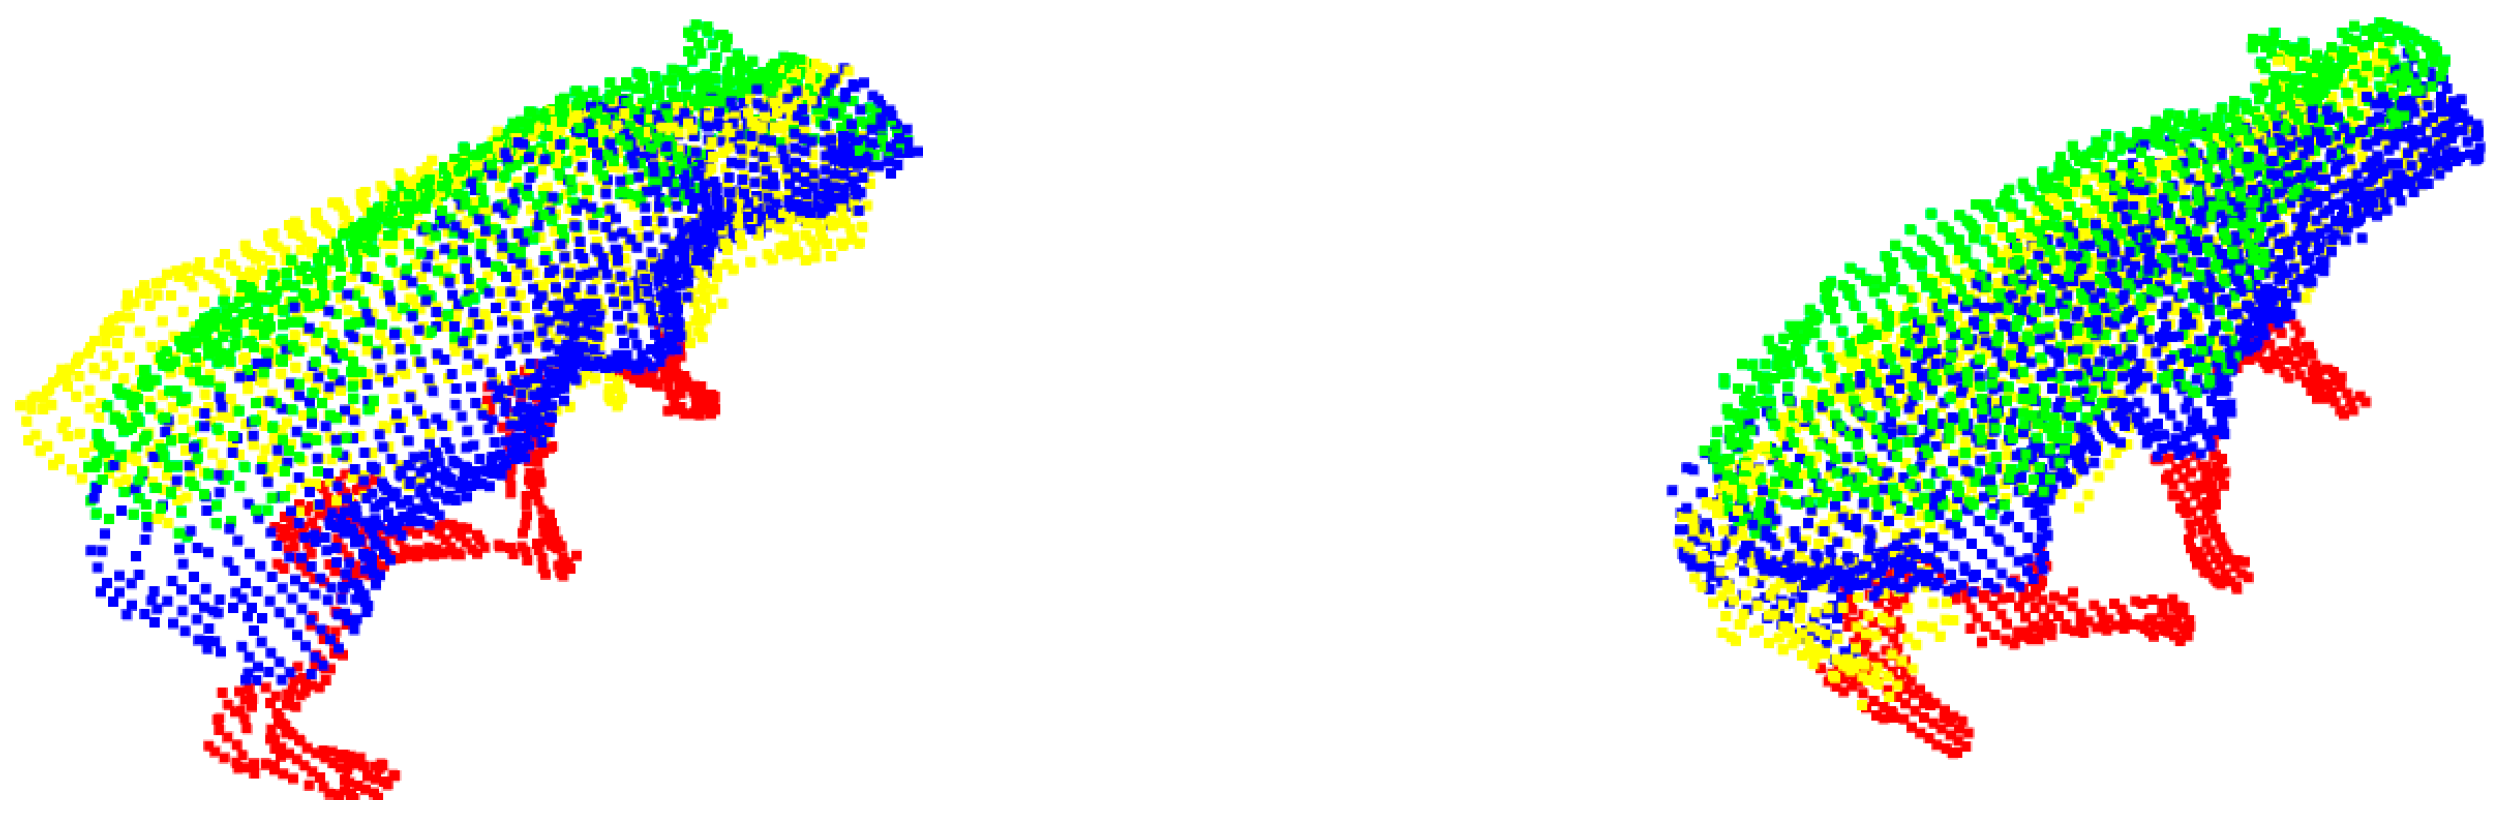
This paper proposes a semantic-guided mirroring method for bovine lateral point clouds. The approach begins by automatically extracting the dorsal spine line to construct a mirror plane. It then integrates semantic information from the point cloud to specifically focus on mirroring the torso section of the lateral view, thereby enabling the creation of a complete 3D point cloud model of the bovine. Testing on 592 sets of dual-view point cloud data demonstrated a success rate of 96.28% for the proposed mirroring method, indicating high reliability in 3D cow reconstruction. The implementation of this method requires the selection of standard-pose top-view point cloud data from cows, which must undergo outlier removal and noise processing. The quality of the point cloud data is crucial, as poor data quality can adversely affect the accuracy of mirror plane extraction, potentially leading to failures in 3D reconstruction, as illustrated in Figure 18.
Figure 18.
Failed mirroring point cloud. Note: The green point cloud represents the cow’s top-view point cloud, the blue point cloud represents the torso portion of the cow’s side-view point cloud, the red point cloud represents the limbs portion of the cow’s side-view point cloud, and the yellow point set represents the mirror-generated point cloud; the left mirror generated point cloud deviates from the main structure of the cow, and the right mirror generated point cloud overlaps with the original point cloud excessively.
3.3. Body Weight Estimation Model
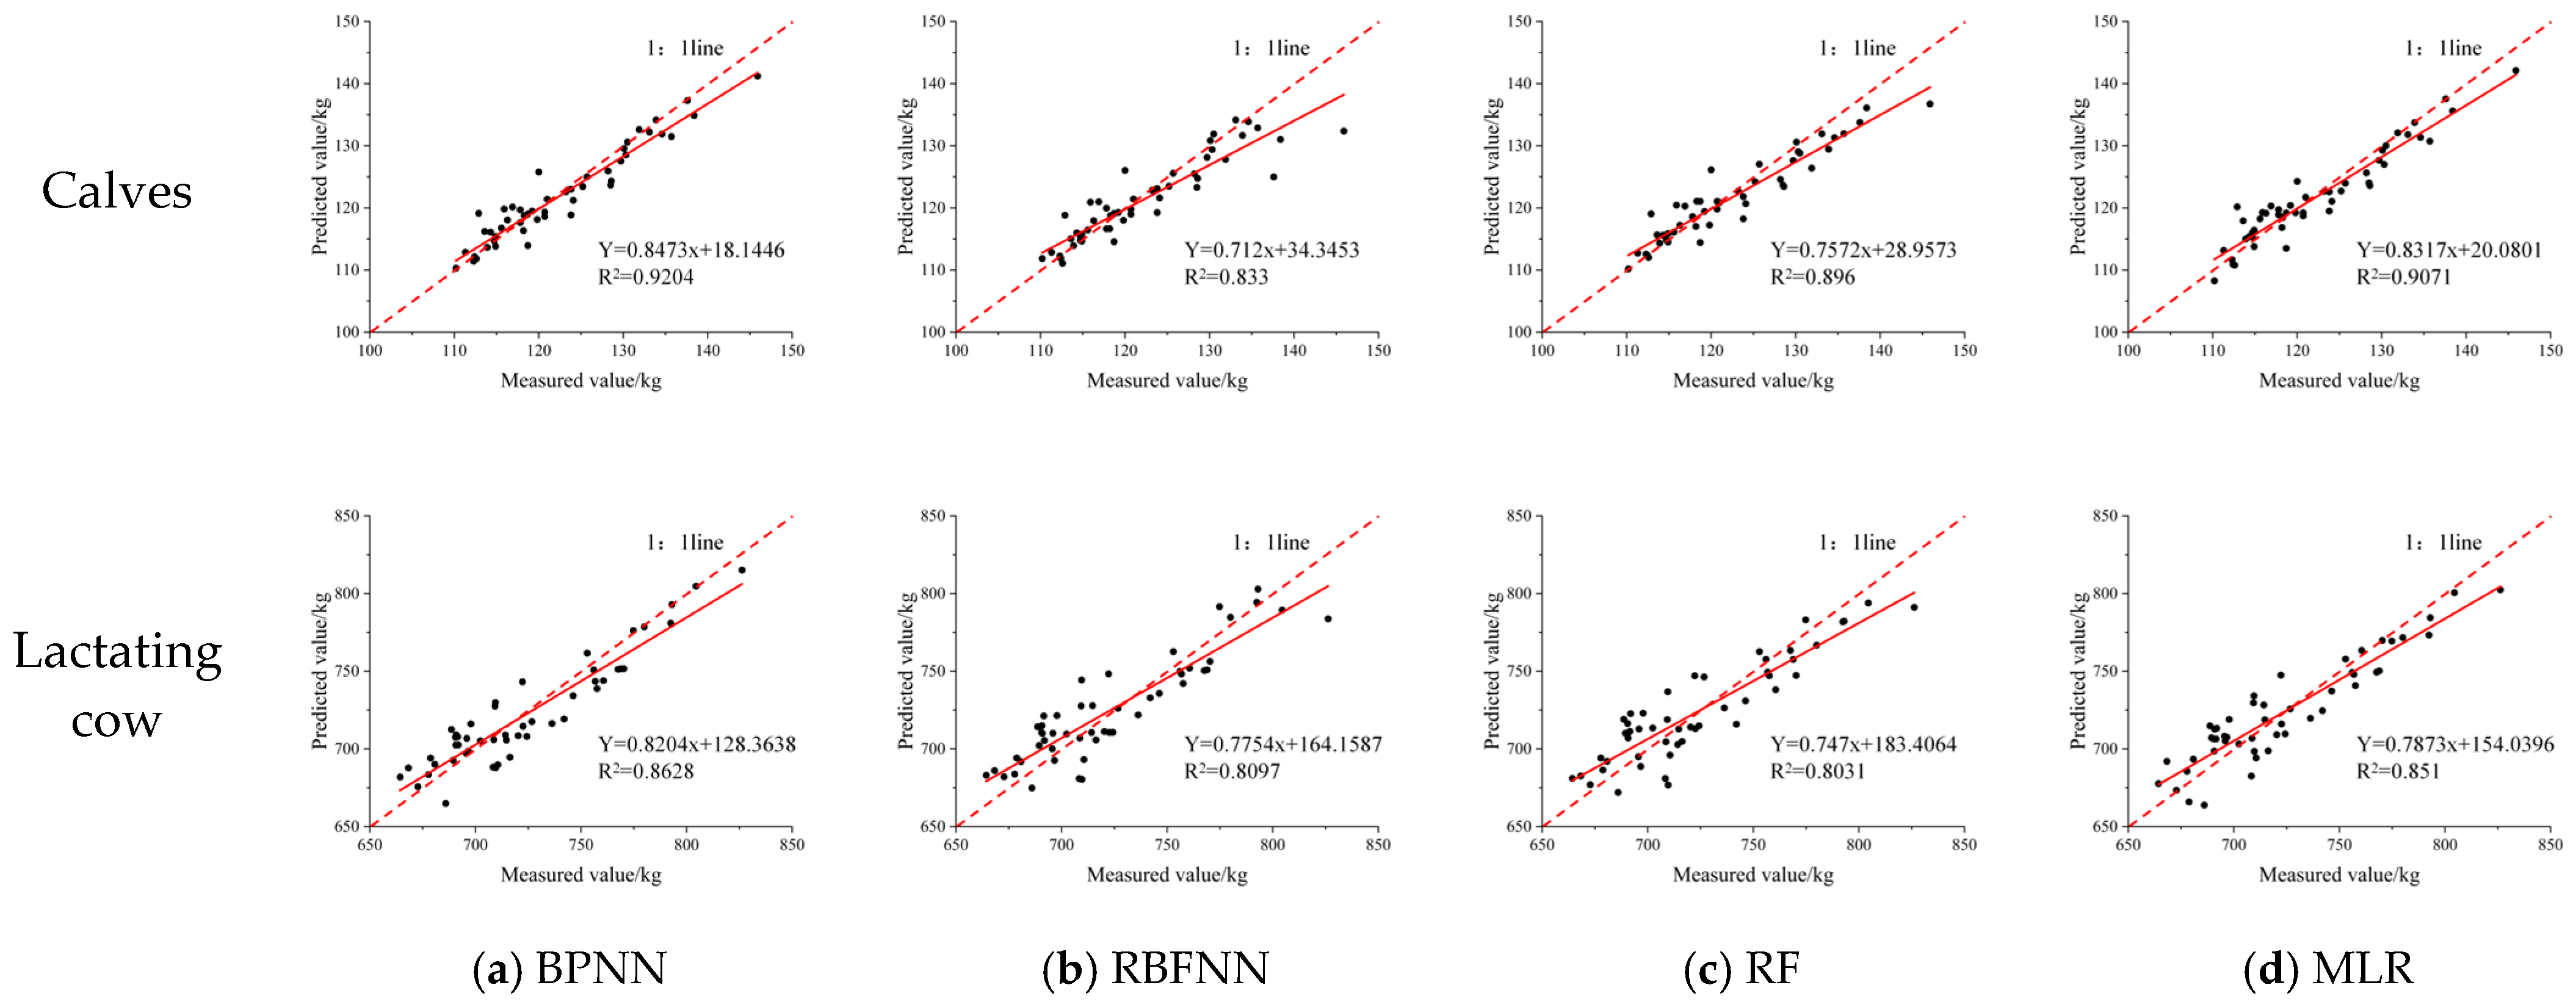
The experiment processed dual-view depth images captured from dairy cows, generating 3D surface models for 150 calves and 150 lactating cows, from which corresponding volume and surface area parameters were extracted. This data was then combined with actual weight measurements from the cows to construct a training dataset. The two sample groups were divided into training and testing sets at a ratio of 2:1. Four machine learning models—BPNN, RBFNN, RF, and MLR—were trained on the data, and predictions were validated using the testing set. The results of the regression analysis, comparing the predicted weights from each model to the actual measurements, are illustrated in Figure 19, with corresponding performance evaluation metrics presented in Table 3. The data details are shown in Table A1 and Table A2.
Figure 19.
Regression analysis of actual and predicted values for various body weight estimation models.
Table 3.
Evaluation metrics for each model.
The BPNN model demonstrated superior performance across all key metrics. In terms of MAE, BPNN outperformed the RBFNN, RF, and MLR models, with reductions of 0.55 kg, 0.4143 kg, and 0.3014 kg in the calf group and more substantial decreases of 1.9843 kg, 2.4145 kg, and 0.5651 kg in the lactating cow group, respectively. Similarly, for RMSE, BPNN achieved lower values by 1.1921 kg, 0.5509 kg, and 0.1799 kg in the calf group, and by 2.4992 kg, 2.8125 kg, and 0.6493 kg in the lactating cow group, respectively. In addition, BPNN also showed a lower MRE by approximately 0.3~0.4% and 0.08~0.33% on average across groups, indicating enhanced prediction stability. Moreover, BPNN yielded higher R2 values—0.0874, 0.0244, and 0.0133 greater in the calf group and 0.0531, 0.0597, and 0.0118 higher in the lactating cow group compared to RBFNN, RF, and MLR, respectively. These results collectively confirm BPNN’s stronger predictive accuracy and model fit.
Based on the results of comprehensive regression analysis and error evaluation metrics, the BPNN was selected as the final choice for body weight prediction, demonstrating significantly superior prediction accuracy and stability compared to other benchmark models. The regression analysis results, illustrated in Figure 16, indicate that for the calf group trial, the fitted line slope was 0.8473, the intercept was 18.1446, and the R2 value reached 0.9204. In the lactating cow group trial, the fitted line slope was 0.8204, the intercept was 128.3638, and the R2 value reached 0.8624. Error analysis results, depicted in Table 3, show that in the calf group trial, the MAE was 1.8409 kg, with an absolute error range of −4.9264~+ 5.7721 kg. The RMSE was 2.4895 kg, the MRE was 1.49%, and the relative error range was −3.98%~+ 4.81%. For the lactating cow group trial, the MAE was 12.5784 kg, with an absolute error range of −22.7137~+ 23.8014 kg; the RMSE was 14.4537 kg, and the MRE was 1.75%, with a relative error range of −3.07%~+ 3.46%. These results indicate that calf weight data exhibits a relatively concentrated distribution, yielding stable model predictions with minimal error fluctuations. In contrast, the weight distribution among dairy cows is broader, coupled with complex physiological changes that lead to larger absolute prediction errors. However, the relative errors remain at a low level, demonstrating that the proposed prediction method possesses high reliability and applicability.
3.4. Discussion and Analysis of Weight Estimation Models
In this study, the BPNN demonstrated superior data fitting performance compared to RBFNN, RF, and MLR. This advantage stems primarily from its strong nonlinear mapping capability, flexible network architecture, and global optimization achieved through backpropagation. MLR is limited to linear relationships, while RBFNN relies heavily on the selection of radial basis function centers, which constrains its generalization ability. RF offers stability and resistance to overfitting, but is less effective at capturing subtle variations and complex functional relationships in continuous data compared to BPNN. With multiple hidden layers and nonlinear activation functions, BPNN can approximate any continuous function with high precision. Combined with gradient descent optimization that continuously adjusts weights to minimize global error, it shows clear advantages in handling high-dimensional and strongly nonlinear fitting problems.
3.5. Discussion on Sources of Weight Estimation Error
The cow weight estimation method proposed in this study achieves high accuracy but still exhibits certain errors. The primary error sources include: (1) reading fluctuations during actual cow weighing due to animal movement; (2) limitations in camera accuracy and variations in lighting affecting the initial point cloud quality; (3) residual segmentation errors during the semantic segmentation stage, leading to misidentification of key body regions and impacting reconstruction accuracy; (4) variations in coat thickness interfering with volume and surface area extraction; (5) significant deviations introduced by individuals with limb injuries or pathological conditions.
3.6. Discussion on Future Outlook
This study currently focuses on cows in standard standing and walking postures. Future research will focus on the following directions: (1) Develop multi-pose 3D modeling and adaptive reconstruction methods to enhance system robustness in complex scenarios; (2) Explore multimodal data fusion techniques, integrating infrared and inertial sensor data to improve weight estimation accuracy and expand health monitoring capabilities; (3) Optimize real-time processing algorithms to mitigate point cloud degradation caused by motion in dynamic scenarios; (4) Enhance model generalization and transferability to accommodate different cattle breeds and environments, promoting the practical application of the method in smart livestock farming; (5) Advance the comprehensive assessment of technical, economic, and logistical feasibility by incorporating system costs, deployment and maintenance complexity, and actual conditions of farms, thereby providing a pathway for transitioning research findings from experimental settings to large-scale, economically efficient real-world applications.
4. Conclusions
This paper achieves 3D reconstruction and weight estimation of cows during walking using a depth camera. Through experiments and result analysis, the following conclusions can be drawn:
(1) This paper employs a comprehensive approach combining pass-through filtering, voxel downsampling, statistical outlier removal, and radius outlier removal to perform denoising on the acquired dual-viewpoint point cloud data of dairy cows. This effectively separates background interferences such as the ground and railings, successfully extracting a high-precision point cloud of the cow target. This lays the foundation for subsequent 3D reconstruction.
(2) This paper proposes the CSS-PointNet++ model, which incorporates the CBAM and AHPM into PointNet++ to achieve precise segmentation of cow side-view point clouds. Experimental results demonstrate that the CSS-PointNet++ model achieves a segmentation accuracy of 98.35%, with torso and limb segmentation accuracies reaching 99.07% and 96.06%, respectively. The model’s mIoU is 95.61%.
(3) This paper proposes a semantic-guided side-view point cloud mirroring method for dairy cows. It automatically extracts the mirror plane based on the cow’s spine structure, integrates semantic information from the side-view point cloud, and focuses on mirroring the torso region to construct a complete 3D point cloud model of the cow. Experimental results demonstrate that this method achieves a success rate of 96.28%.
(4) This study extracted volume and surface area parameters from bovine surface models and employed four machine learning algorithms—BPNN, RBFNN, RF, and MLR—to construct body weight prediction models. Experimental results indicate that the BPNN delivers optimal performance. In the calf group, it achieved a MAE of 1.8409 kg, a RMSE of 2.4895 kg, a MRE of 1.49%, and an R2 of 0.9204. In the lactating cow group, the MAE was 12.5784 kg, the RMSE was 14.4537 kg, the MRE was 1.75%, and the R2 was 0.8628.
Author Contributions
Conceptualization, J.Z.; methodology, J.Z.; investigation, J.Z., X.W., H.M., J.H., X.Z. and K.Z.; data curation, J.Z.; formal analysis, J.Z. and X.W.; writing—original draft, J.Z.; writing—review and editing, J.Z., X.W., H.M., J.H., X.Z., Y.L. and H.P.; project administration, X.Z. and K.Z.; funding acquisition, Y.L. All authors have read and agreed to the published version of the manuscript.
Funding
This research was funded by Open Research Projects of the Key Laboratory of Modern Agricultural Equipment and Technology of the Ministry of Education at Jiangsu University and the Jiangsu Provincial Key Laboratory of Agricultural Equipment and Intelligent High-Tech Research, grant number MAET202309.
Data Availability Statement
The data used in the current study are available from the corresponding author on reasonable request.
Acknowledgments
The authors would like to thank the Engineering Research Center for Produc tion Mechanization of Oasis Special Economic Crop, Ministry of Education for providing experimental materials; the authors have reviewed and edited the output and take full responsibility for the content of this publication.
Conflicts of Interest
The authors declare no conflicts of interest.
Abbreviations
The following abbreviations are used in this manuscript:
| ICP | Iterative Closest Point |
| DNN | Deep Neural Network |
| CBAM | Convolutional Block Attention Module |
| AHPM | Attention-Weighted Hybrid Pooling Module |
| FPS | Farthest Point Sampling |
| FP | Feature Propagation |
| SSG | single-scale grouping |
| MSG | multi-scale grouping |
| SA | Set Abstraction |
| OA | Overall Accuracy |
| IoU | Intersection over Union |
| mIoU | Mean Intersection over Union |
| RANSAC | Randomized Anonymized Random Sampling and Consistency |
| SVD | Singular Value Decomposition |
| BPNN | Backpropagation Neural Network |
| RBFNN | Radial Basis Function Neural Network |
| RF | Random Forest |
| MLR | Multiple Linear Regression |
| MAE | Mean Absolute Error |
| RMSE | Root Mean Square Error |
| MRE | Mean Relative Error |
| R2 | Coefficient of Determination |
Appendix A
Table A1.
Details of measured and predicted cow weight for each model (Calves group trial).
Table A2.
Details of measured and predicted cow weight for each model (Lactating cow group trial).
References
- Qiao, Y.; Kong, H.; Clark, C. Intelligent perception for cattle monitoring: A review for cattle identification, body condition score evaluation, and weight estimation. Comput. Electron. Agric. 2021, 185, 106143. [Google Scholar] [CrossRef] [Scilit]
- Akbar, M.O.; Shahbaz khan, M.S.; Ali, M.J. IoT for development of smart dairy farming. J. Food Qual. 2020, 2020, 4242805. [Google Scholar] [CrossRef] [Scilit]
- Ma, W.; Sun, Y.; Qi, X. Computer-vision-based sensing technologies for livestock body dimension measurement: A survey. Sensors 2024, 24, 1504. [Google Scholar] [CrossRef] [Scilit]
- Gebreyesus, G.; Milkevych, V.; Lassen, J. Supervised learning techniques for dairy cattle body weight prediction from 3D digital images. Front. Genet. 2023, 13, 947176. [Google Scholar] [CrossRef] [Scilit] [PubMed]
- Xavier, C.; Le Cozler, Y.; Depuille, L. The use of 3-dimensional imaging of Holstein cows to estimate body weight and monitor the composition of body weight change throughout lactation. J. Dairy Sci. 2022, 105, 4508–4519. [Google Scholar] [CrossRef] [Scilit]
- Chiang, H.I.; Zhou, J.M.; Chu, W.L. Application of weight prediction for Holstein dairy cows in non-pregnant and postpartum stages. Biosyst. Eng. 2025, 259, 104276. [Google Scholar] [CrossRef] [Scilit]
- Yue, C.; Zhang, X.; Zhang, Y. Automatic and Accurate Measurement of Cattle Body Based on a Lightweight YOLOv8-Pose Model and 3D Point Cloud. Mach. Learn. Appl. 2025, 2025, 100662. [Google Scholar] [CrossRef] [Scilit]
- Wiley, V.; Lucas, T. Computer vision and image processing: A paper review. Int. J. Artif. Intell. Res. 2018, 2, 29–36. [Google Scholar] [CrossRef] [Scilit]
- Negreiro, A.; Bresolin, T.; Ferreira, R.E.P.; Dado-Senn, B.; Van Os, J.M.C.; Laporta, J.; Dórea, J.R.R. Computer vision systems for monitoring hutch-housed dairy calves. J. Dairy Sci. 2025, 108, 9998–10011. [Google Scholar] [CrossRef] [Scilit]
- Imamura, S.; Zin, T.T.; Kobayashi, I. Automatic evaluation of Cow’s body-condition-score using 3D camera. In Proceedings of the 2017 IEEE 6th Global Conference on Consumer Electronics (GCCE), Nagoya, Japan, 24–27 October 2017; pp. 1–2. [Google Scholar]
- Pezzuolo, A.; Guarino, M.; Sartori, L. On-barn pig weight estimation based on body measurements by a Kinect v1 depth camera. Comput. Electron. Agric. 2018, 148, 29–36. [Google Scholar] [CrossRef] [Scilit]
- Song, X.; Bokkers, E.A.M.; Van der Tol, P.P.J.; Koerkamp, P.G.; Van Mourik, S. Automated body weight prediction of dairy cows using 3-dimensional vision. J. Dairy Sci. 2018, 101, 4448–4459. [Google Scholar] [CrossRef] [Scilit] [PubMed]
- Si, Y.; An, L.; Liu, G.; Li, B.; Li, B. Ideal Posture Detection and Body Size Measurement of Pig Based on Kinect. Trans. Chin. Soc. Agric. Mach. 2019, 50, 58–65. [Google Scholar] [CrossRef]
- Zin, T.T.; Seint, P.T.; Tin, P. Body condition score estimation based on regression analysis using a 3D camera. Sensors 2020, 20, 3705. [Google Scholar] [CrossRef] [Scilit]
- Samperio, E.; Lidón, I.; Rebollar, R. Lambs’ live weight estimation using 3D images. Animal 2021, 15, 100212. [Google Scholar] [CrossRef] [Scilit] [PubMed]
- Bai, L.; Guo, C.; Song, J. Cattle weight estimation model through readily photos. Eng. Appl. Artif. Intell. 2025, 143, 109976. [Google Scholar] [CrossRef] [Scilit]
- Chu, M.; Liu, G.; Si, Y.; Feng, F. Predicting Method of Dairy Cow Weight Based on Three-dimensional Reconstruction. Trans. Chin. Soc. Agric. Mach. 2020, 51, 378–384. [Google Scholar]
- Shi, S.; Yin, L.; Liang, S.; Zhong, H.; Tian, X.; Liu, C.; Sun, A.; Liu, H. Research on 3D surface reconstruction and body size measurement of pigs based on multi-view RGB-D cameras. Comput. Electron. Agric. 2020, 175, 105543. [Google Scholar] [CrossRef] [Scilit]
- Ruchay, A.; Kober, V.; Dorofeev, K. Accurate body measurement of live cattle using three depth cameras and non-rigid 3-D shape recovery. Comput. Electron. Agric. 2020, 179, 105821. [Google Scholar] [CrossRef] [Scilit]
- Le Cozler, Y.; Brachet, E.; Bourguignon, L. Three-dimensional (3D) imaging technology to monitor growth and development of Holstein heifers and estimate body weight, a preliminary study. Sensors 2022, 22, 4635. [Google Scholar] [CrossRef] [Scilit]
- Hao, H.; Cheng, Y.; Ling, Y. An improved PointNet++ point cloud segmentation model applied to automatic measurement method of pig body size. Comput. Electron. Agric. 2023, 205, 107560. [Google Scholar] [CrossRef] [Scilit]
- Kwon, K.; Park, A.; Lee, H. Deep learning-based weight estimation using a fast-reconstructed mesh model from the point cloud of a pig. Comput. Electron. Agric. 2023, 210, 107903. [Google Scholar] [CrossRef] [Scilit]
- Cominotte, A.; Fernandes, A.; Dórea, J. Use of biometric images to predict body weight and hot carcass weight of Nellore Cattle. Animals 2023, 13, 1679. [Google Scholar] [CrossRef] [Scilit]
- Selle, M.; Kircher, M.; Dorsch, U. An accessible and intuitive approach to 3D data modeling for morphometric surface evaluation in pig farming. Comput. Electron. Agric. 2024, 225, 109327. [Google Scholar] [CrossRef] [Scilit]
- Zhou, G.; Ye, W.; Li, S. FGPointKAN++ point cloud segmentation and adaptive key cutting plane recognition for cow body size measurement. J. Artif. Intell. Agric. 2025, 15, 783–801. [Google Scholar] [CrossRef] [Scilit]
- Wei, Y.; Zhang, L.; Yang, F. Automatic measurement method of sheep body size based on 3D reconstruction and point cloud segmentation. J. Comput. Electron. Agric. 2025, 239, 110978. [Google Scholar] [CrossRef] [Scilit]
- Kurillo, G.; Hemingway, E.; Cheng, M.L. Evaluating the accuracy of the azure kinect and kinect v2. Sensors 2022, 22, 2469. [Google Scholar] [CrossRef] [Scilit]
- Lyu, W.; Ke, W.; Sheng, H. Dynamic downsampling algorithm for 3D point cloud map based on voxel filtering. Appl. Sci. 2024, 14, 3160. [Google Scholar] [CrossRef] [Scilit]
- Bello, S.A.; Wang, C.; Sun, X. PDConv: Rigid transformation invariant convolution for 3D point clouds. Expert Syst. Appl. 2022, 210, 118356. [Google Scholar] [CrossRef] [Scilit]
- Qi, C.R.; Su, H.; Mo, K. Pointnet: Deep learning on point sets for 3D classification and segmentation. In Proceedings of the IEEE Conference on Computer Vision and Pattern Recognition, Honolulu, HI, USA, 21–26 July 2017; pp. 652–660. [Google Scholar] [CrossRef] [Scilit]
- Qi, C.R.; Yi, L.; Su, H. Pointnet++: Deep hierarchical feature learning on point sets in a metric space. Adv. Neural Inf. Process. Syst. 2017, 30. [Google Scholar] [CrossRef] [Scilit]
- Guo, Y.; Wang, H.; Hu, Q. Deep learning for 3D point clouds: A survey. IEEE Trans. Pattern Anal. Mach. Intell. 2020, 43, 4338–4364. [Google Scholar] [CrossRef] [Scilit] [PubMed]
- Fischler, M.A.; Bolles, R.C. Random sample consensus: A paradigm for model fitting with applications to image analysis and automated cartography. Commun. ACM 1981, 24, 381–395. [Google Scholar] [CrossRef] [Scilit]
- Eckart, C.; Young, G. The approximation of one matrix by another of lower rank. Psychometrika 1936, 1, 211–218. [Google Scholar] [CrossRef] [Scilit]
- Edelsbrunner, H.; Mücke, E.P. Three-dimensional alpha shapes. ACM Trans. Graph. (TOG) 1994, 13, 43–72. [Google Scholar] [CrossRef] [Scilit]
- Fu, Y.; Li, C.; Zhu, J. Three-dimensional model construction method and experiment of jujube tree point cloud using alpha-shape algorithm. Trans. Chin. Soc. Agric. Eng. 2020, 36, 214–221. [Google Scholar]
- Tabib, R.A.; Jadhav, Y.V.; Tegginkeri, S. Learning-based hole detection in 3D point cloud towards hole filling. Procedia Comput. Sci. 2020, 171, 475–482. [Google Scholar] [CrossRef] [Scilit]
- Le Cozler, Y.; Allain, C.; Xavier, C. Volume and surface area of Holstein dairy cows calculated from complete 3D shapes acquired using a high-precision scanning system: Interest for body weight estimation. Comput. Electron. Agric. 2019, 165, 104977. [Google Scholar] [CrossRef] [Scilit]
- Su, H.; Jampani, V.; Sun, D. Splatnet: Sparse lattice networks for point cloud processing. In Proceedings of the IEEE Conference on Computer Vision and Pattern Recognition, Salt Lake City, UT, USA, 18–23 June 2018; pp. 2530–2539. [Google Scholar] [CrossRef] [Scilit]
- Wang, Y.; Sun, Y.; Liu, Z. Dynamic graph cnn for learning on point clouds. ACM Trans. Graph. (TOG) 2019, 38, 146. [Google Scholar] [CrossRef] [Scilit]
- Li, Y.; Bu, R.; Sun, M. Pointcnn: Convolution on x-transformed points. Adv. Neural Inf. Process. Syst. 2018, 31. [Google Scholar] [CrossRef] [Scilit]

Disclaimer/Publisher’s Note: The statements, opinions and data contained in all publications are solely those of the individual author(s) and contributor(s) and not of MDPI and/or the editor(s). MDPI and/or the editor(s) disclaim responsibility for any injury to people or property resulting from any ideas, methods, instructions or products referred to in the content. |
© 2026 by the authors. Licensee MDPI, Basel, Switzerland. This article is an open access article distributed under the terms and conditions of the Creative Commons Attribution (CC BY) license.