


Abstract
Accurate estimation of the number of emerged soybean seedlings is critical for field production management. However, existing methods struggle to achieve rapid and precise counting due to several challenges: variation among varieties, differences in growth stage, large variations in object scale, and complex backgrounds. To address these challenges, we constructed a dataset of UAV images of multiple soybean varieties at the seedling stage and developed a lightweight detection model named SSDNet. The main innovations of this model include replacing the YOLOv11n backbone with StarNet to improve performance while maintaining efficiency; introducing a C3k2-PFDConv module to extract fine-grained features at multiple scales; incorporating a lightweight shared convolution detection head to reduce computational redundancy; and adopting slicing-aided inference to process high-resolution imagery. Experimental results show that SSDNet achieves 98.7% mAP@50 with only 1.57 M parameters and an inference time of 5.4 ms per image. When combined with SAHI, it completes detection in high-resolution imagery covering 675 breeding plots in 9.8 min. Across the 300 validation plots, the method achieved an absolute counting error of no more than 7 seedlings per plot relative to manual field counts. In summary, SSDNet enables accurate and efficient soybean seedling counting under the breeding field conditions and UAV image acquisition protocol tested in this study, providing technical support for emergence assessment in breeding fields.
1. Introduction
Soybean is one of the most economically valuable leguminous crops worldwide, contributing over 25% of the global protein supply as a major oilseed crop [1]. With population growth, soybean demand continues to rise [2]. To meet increasing supply pressure, improving soybean production capacity has become a critical issue in agricultural production [3]. Accurate estimation of soybean seedling emergence is essential for field production management, as it helps managers evaluate variety performance, estimate final yields, and adjust planting layouts effectively [4]. However, traditional manual surveys are time consuming, labor intensive, and subjective, making it difficult to meet requirements for efficiency and accuracy [5]. Therefore, there is an urgent need to develop fast and objective methods for estimating seedling emergence [6].
Traditional phenotype data collection relies on manual sampling and visual counting, which does not reflect overall field conditions [7]. To overcome the efficiency bottleneck of manual surveys, researchers have increasingly applied computer vision to field phenotyping. Early studies showed that traditional computer vision methods can detect and segment plants in agricultural fields. For instance, deep learning architectures such as VGG16 with Faster R-CNN can detect maize seedlings [8], while classical image processing techniques, including edge detection, watershed algorithms, and Otsu threshold segmentation, can extract plant contours [9,10,11]. Some studies combined vegetation indices and color features with classifiers such as K-means clustering, random forests, or support vector machines for crop recognition [12,13,14]. However, these methods are unstable in complex field environments and cannot support accurate monitoring at large scale.
In recent years, deep learning has created new opportunities for object detection in agriculture. It has also supported the transition from manual surveys to automated seedling detection and counting. Researchers have made progress across several crops. The TCE-YOLO model improves wheat seedling detection accuracy by integrating Depthwise Transformer Vision modules with a coordinate attention mechanism [15]. An improved YOLOv5s model combined with DeepSort enables peanut seedling counting [16]. The CenterTrack tracking method enables cotton seedling and flower counting from video sequences [17]. These studies demonstrate the potential of deep learning for accurate seedling detection and counting under field conditions. However, their applicability to early-stage soybean seedling counting in breeding plots requires further evaluation.
For soybean seedlings, improved YOLO-based models have been used for detection and counting from UAV images. These models address challenges such as small targets, clustered distribution, and mutual occlusion [18]. D. Wang et al. [19] proposed a two-stage segmentation model for overlapping soybean leaves. Xiang et al. [20] developed YOLO-POD to count densely overlapping soybean pods. Guo et al. [21] introduced multi-granularity alignment to improve cross-domain generalization. Ning et al. [22] used contextual attention to improve detection accuracy. These studies provide a foundation for soybean object recognition. However, detecting organs such as leaves and pods differs from counting individual seedlings. In large-scale breeding fields, further work is needed to balance counting accuracy under varying seedling conditions with processing efficiency.
Researchers have explored lightweight detection models to reduce computational costs in field applications. Liu et al. [23] improved YOLOv8n and deployed it on Android phones for real-time rice seed detection and counting in complex field environments. Jiang et al. [24] proposed lightweight models for maize seedling counting and leaf age monitoring. Gao et al. [25] developed SCS-YOLO for real-time detection and severity assessment of wheat Fusarium head blight on edge devices. Cheng et al. [26] proposed YOLO-Lite-CSG, which achieved competitive accuracy with only a small fraction of the parameters of YOLOv3. Feng et al. [27] developed YOLOv8-FLY, a lightweight model for real-time maize seedling detection and counting using UAV RGB imagery. These studies offer useful approaches to lightweight model design. However, their accuracy and efficiency in soybean seedling counting require task-specific evaluation.
UAV platforms enable efficient image acquisition for large-scale field seedling monitoring. They also place demands on small-object detection and recognition against complex backgrounds. Zhou et al. [28] modified detection heads and introduced attention mechanisms and Shape-IoU loss to reduce computational costs while maintaining accuracy. Feng et al. [29] used UAV spectral imagery to assess cotton seedling emergence. Other studies combined UAV multispectral imagery with deep learning for cotton seedling detection and counting [30], or used UAV RGB imagery and deep learning to evaluate cotton stand count and canopy size [31]. Liu et al. [32] developed a rapid maize seedling estimation system based on UAV RGB images. Researchers have also used image cropping and random sampling to address small-object detection and tracking in UAV imagery [33]. For background interference and field seedling monitoring, Hasan et al. [34] used YOLOv7 variants for rapid weed detection. An RGB–NIR image fusion approach improved weed–crop discrimination [35]. The CSM-YOLO framework enabled the detection of cotton seedlings and missing-seedling regions under complex field conditions [36]. However, soybean seedlings within a breeding plot can vary considerably in size and shape. Early-stage seedlings are small and can be difficult to distinguish from soil backgrounds and weeds. Expanding leaves can also cause occlusion. To address these challenges, this study proposes SSDNet to improve soybean seedling detection and counting accuracy under complex field conditions. It also aims to reduce computational costs and improve whole-field image processing efficiency.
This study aims to: (1) construct a UAV field image dataset covering multiple soybean varieties and different emergence states; (2) develop a lightweight soybean seedling detection model, SSDNet, and combine it with sliced inference to improve detection in high-resolution orthomosaic images; and (3) evaluate the detection accuracy, computational efficiency, and plot-level counting performance of the proposed method in multi-variety soybean breeding plots.
2. Materials and Methods
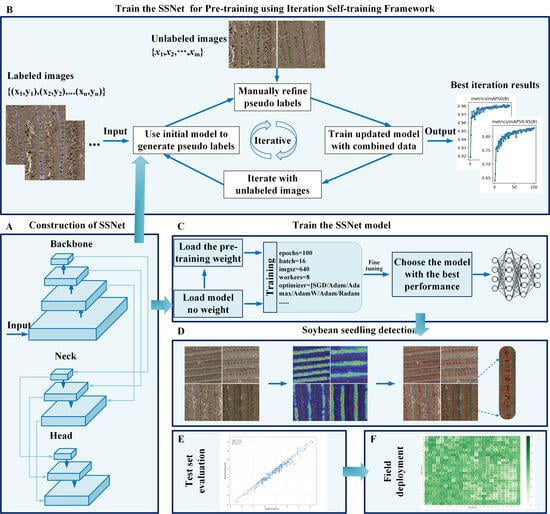
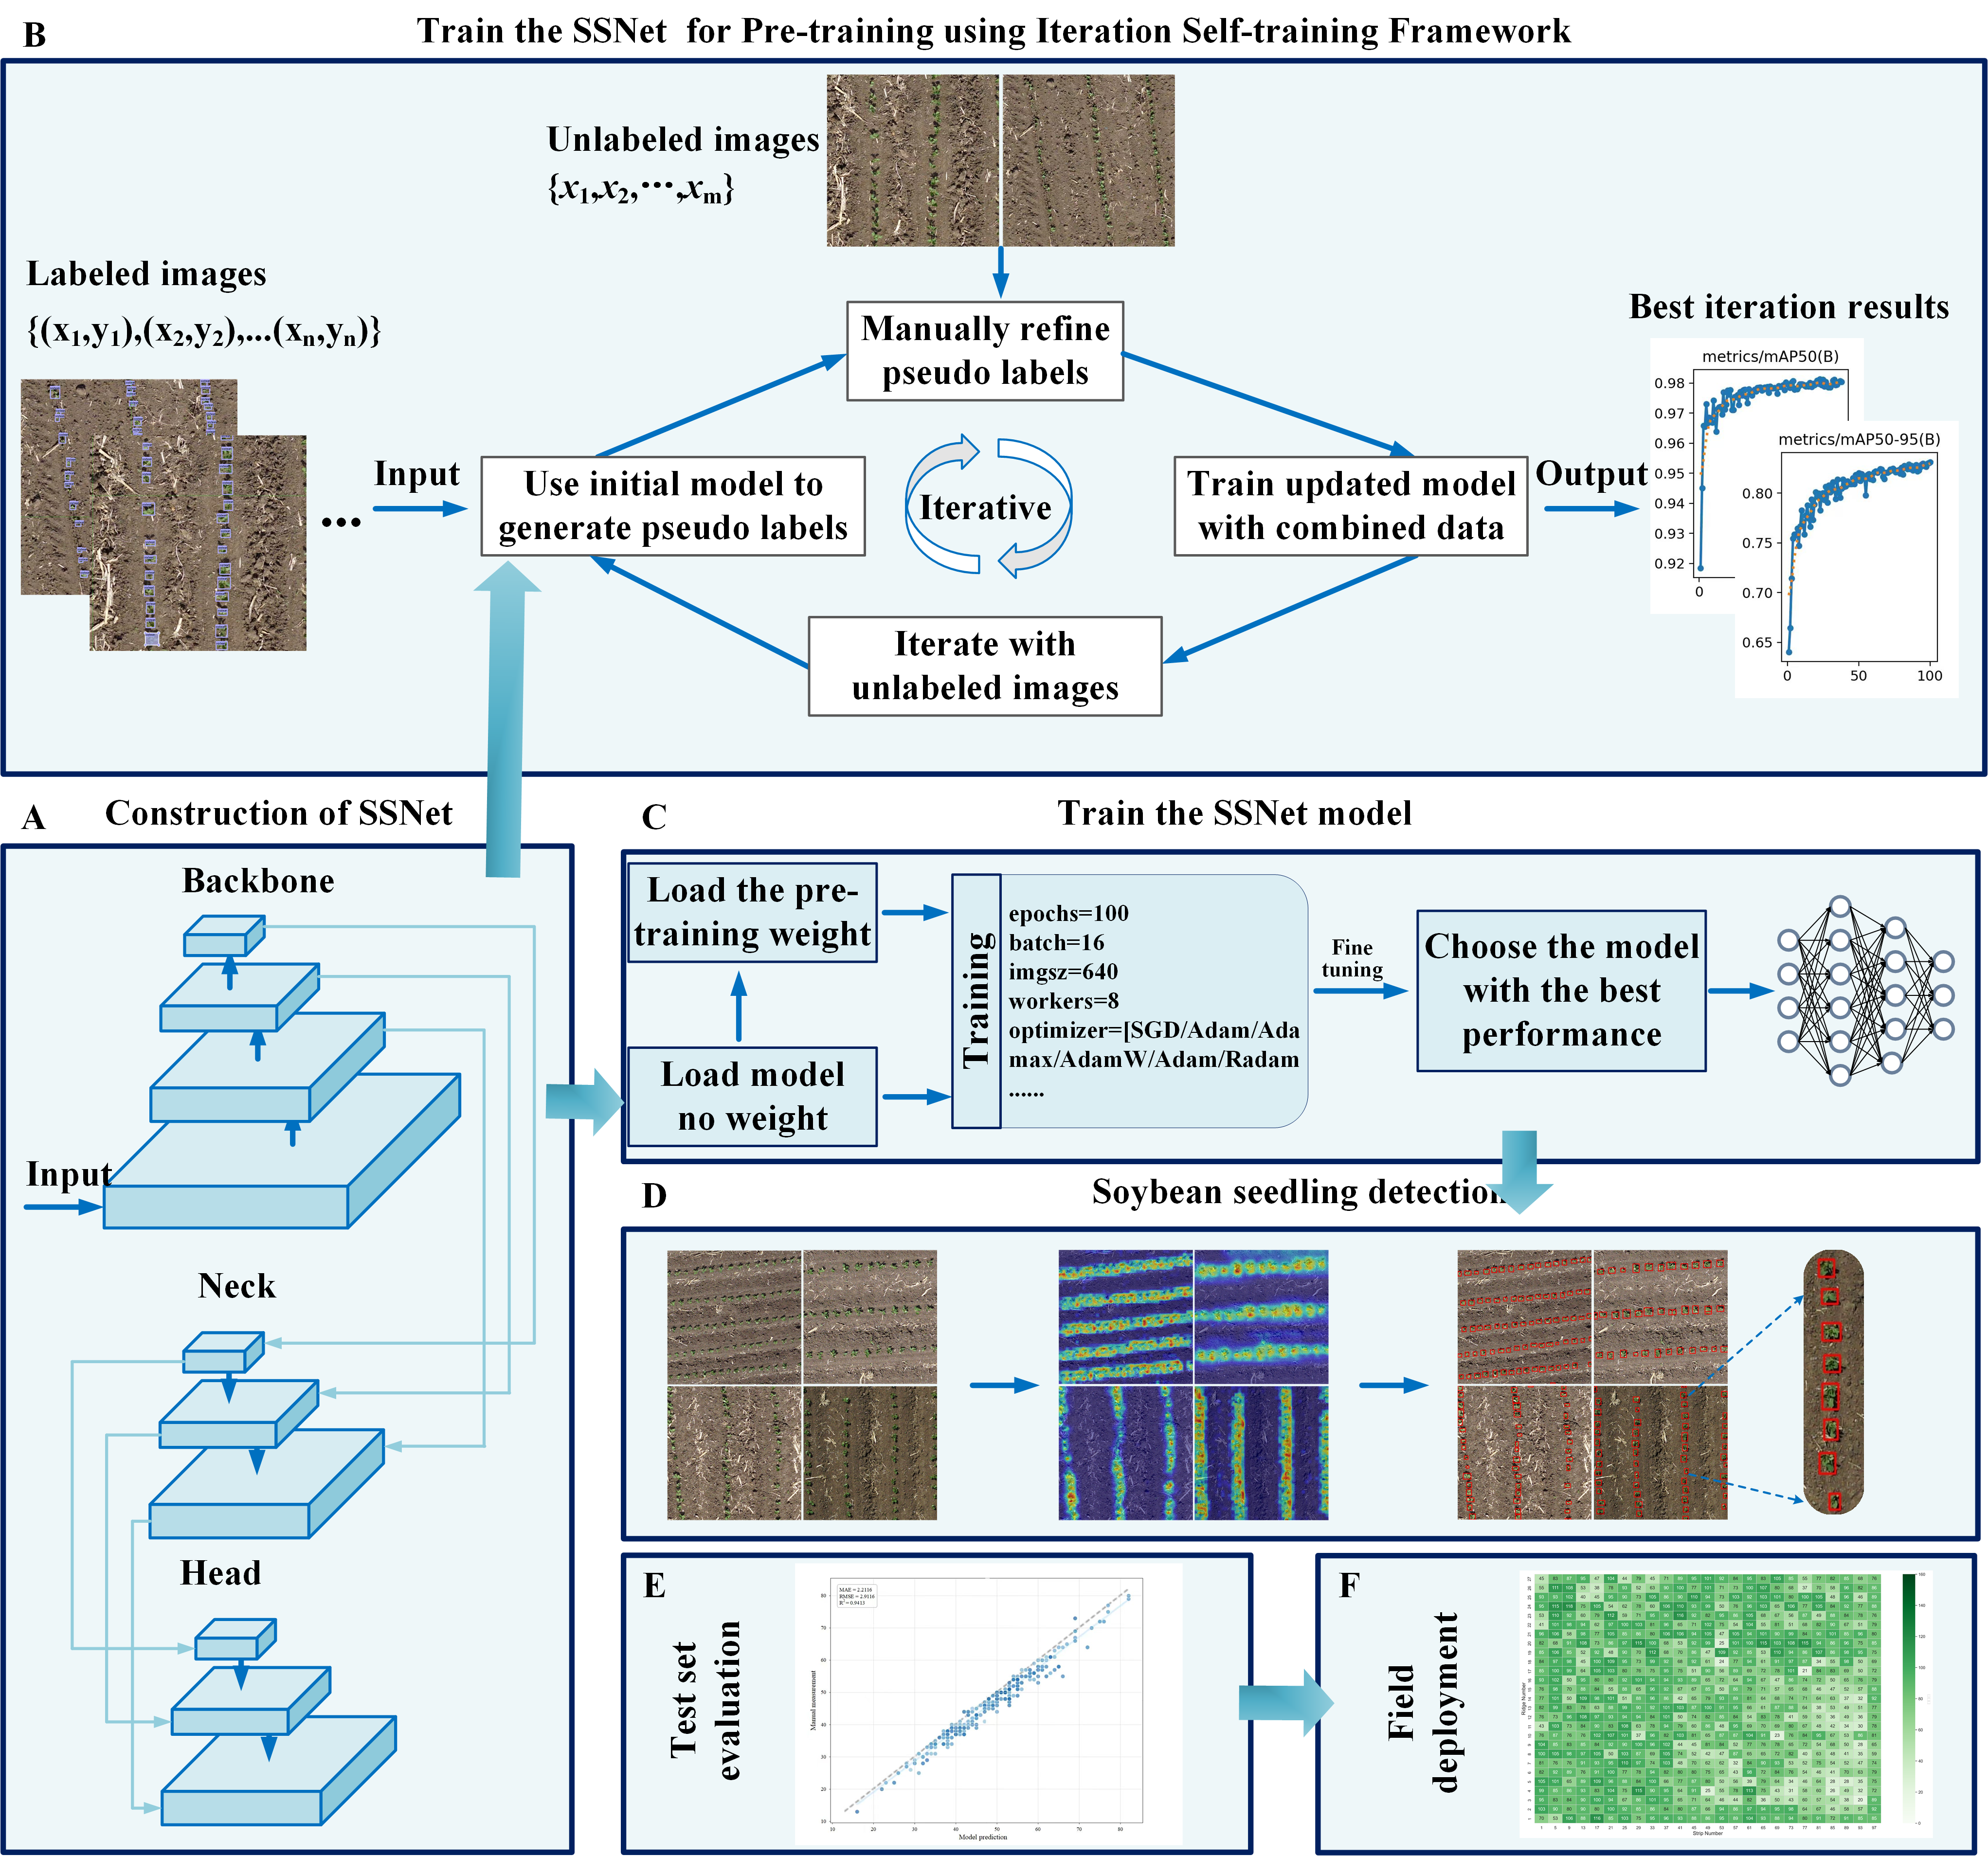
Figure 1 shows the experimental workflow of soybean seedling counting in the field under mixed conditions with multiple varieties and multiple growth stages. Figure 1A: SSDNet model construction: YOLOv11n is used as the baseline, and the StarNet backbone, the C3k2-PFDConv module, and a lightweight shared convolution detection head are introduced. Figure 1B: Semi-supervised pretraining: An iterative self-training framework is employed to generate pseudo labels from a small amount of labeled data and iteratively update the model. Figure 1C: Model fine-tuning and optimization: Pretrained weights are loaded to fine-tune SSDNet, and optimal parameters are selected by comparing performance curves. Figure 1D: Slicing-aided inference: Large images are partitioned into patches for detection, and the results are fused. Figure 1E: Seedling counting and evaluation: Based on detection results, seedling numbers are counted, and counting accuracy is quantified using mean absolute error, root mean square error, and the Pearson correlation coefficient. Figure 1F: Field deployment and application: SSDNet with slicing-aided inference is integrated into the field phenotyping workflow to generate seedling density heatmaps.
Figure 1.
Experimental workflow of the SSDNet. (A) Construction of SSNet; (B) Train the SSNet for Pre-training using Iteration Self-training Framework; (C) Train the SSNet model; (D) Soybean seedling detection; (E) Test set evaluation; (F) Field Deployment.
2.1. Study Area and Data Collection
2.1.1. Overview of the Study Area
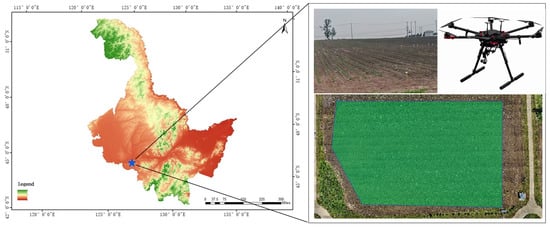
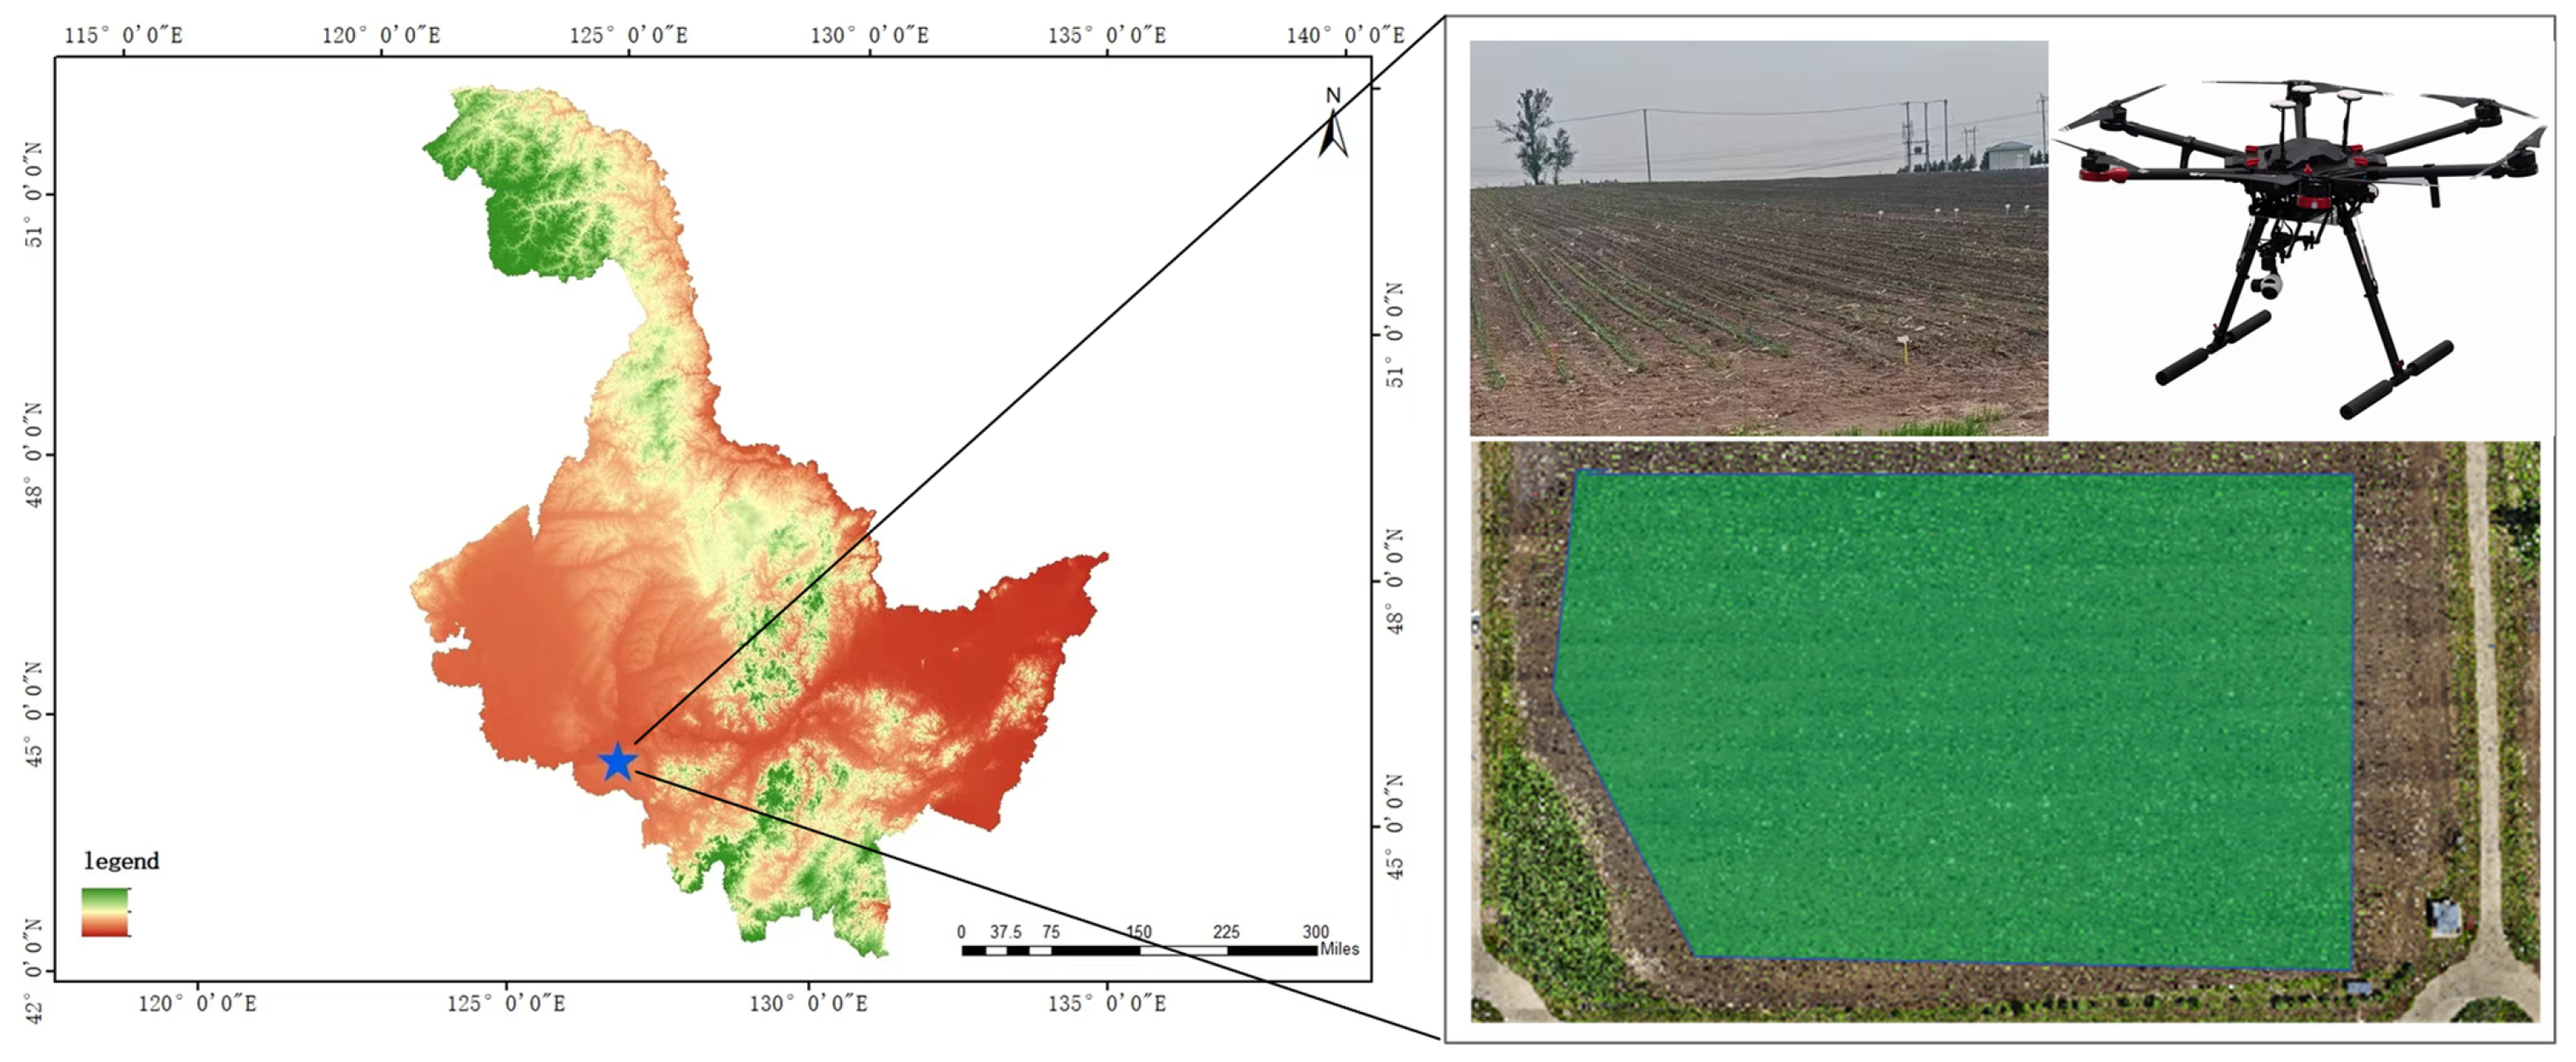
As shown in Figure 2, the experiment was conducted at the Xiangyang Farm Experimental Base of Northeast Agricultural University, Harbin, Heilongjiang Province, China. The experimental field was approximately 123 m long and 67 m wide, covering about 8241 m2, and contained 675 breeding plots. Sowing was performed on 12 May 2025. A total of 216 varieties were sown at a row spacing of 65 cm and a plant spacing of 10 cm, with 120 plants per breeding plot. Data collection was carried out on 29 May 2025, using a DJI Matrice 300 RTK UAV (DJI, Shenzhen, China) equipped with a DJI Zenmuse P1 RGB camera, which features a 35.9 × 24 mm full-frame sensor, 45 effective megapixels, and a pixel size of 4.4 μm. The flight was conducted at 3:00 PM under clear and windless weather conditions following a preset flight route. The average flight height was 23.38 m, the flight speed was 2.8 m/s, and the forward and side overlap rates were 80% and 70%. A total of 2318 images were captured. Image registration, calibration, and stitching were performed using DJI Terra V5.0.1. During reconstruction, 16 ground control points were used for control, the image RTK status was recorded as a fixed solution, and the final true orthomosaic had a GSD of 0.34 cm/px. The resulting orthomosaic covered 55,297 m2, including the experimental field and surrounding areas outside the study area.
Figure 2.
Overview of the soybean breeding experimental area.
Fifty breeding plots representing 29 soybean varieties were selected as the data source. These plots were located in strips 1 to 10 and covered ridge numbers 81 to 100. A total of 68 original UAV images covering these plots were used to construct the dataset. Before cropping, fixed portions of the original images were removed according to the configured flight overlap ratios to reduce overlapping coverage. The retained image regions were cropped into patches of 640 × 640 pixels. After screening for image clarity, 2346 patches were retained and randomly divided at the patch level into training, validation, and test sets at an approximate ratio of 8:1:1.
The training set contained 1876 images and 50,828 annotated seedling instances, representing 35 plots and 25 varieties. The validation set contained 235 images and 5811 annotated seedling instances, representing 10 plots and 9 varieties. The test set contained 235 images and 11,165 annotated seedling instances, representing 13 plots and 9 varieties. Some varieties were planted in multiple plots. Distinct plots and varieties were counted separately within each subset, and the same plot or variety could be represented in more than one subset.
2.1.2. Semi-Automatic Labeling of Soybean Seedlings
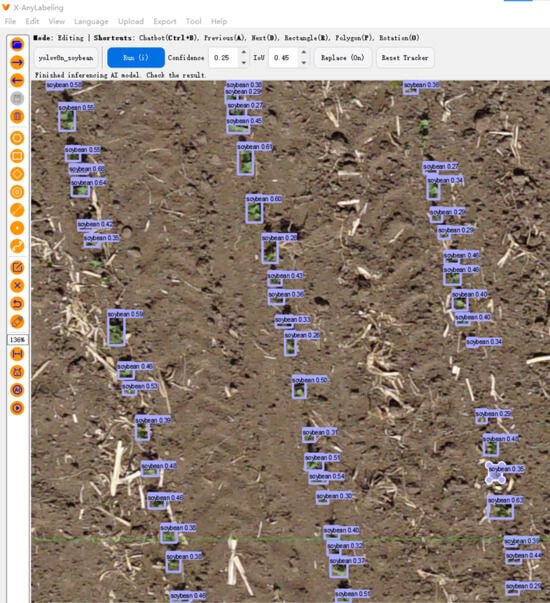
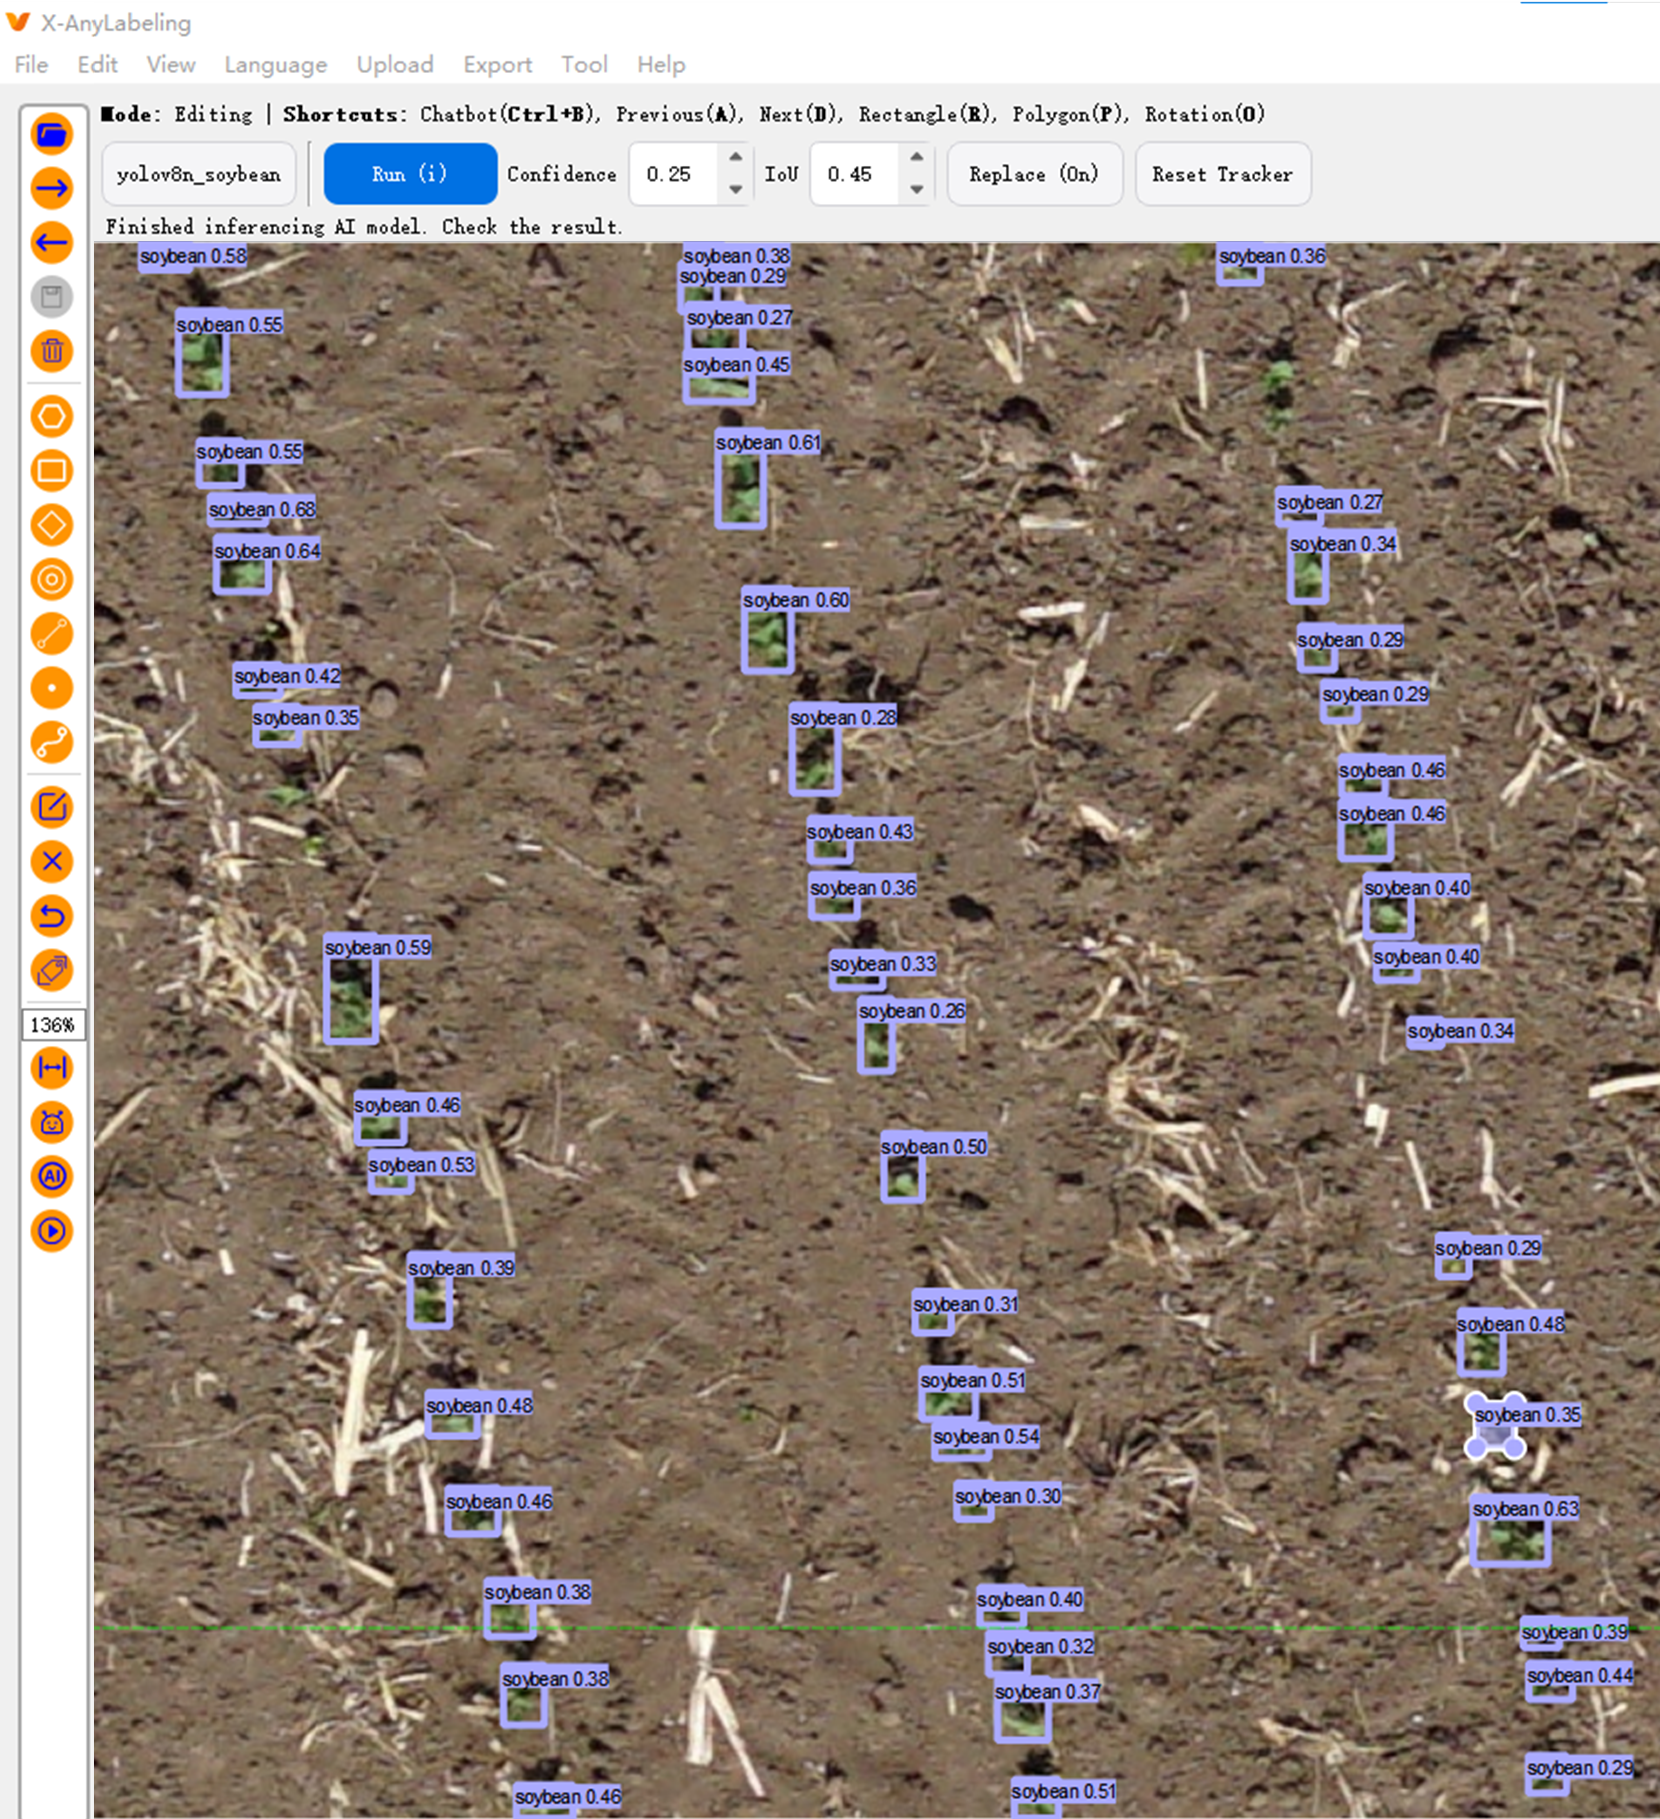
To improve the efficiency of soybean seedling annotation, this study adopted a semi-automatic labeling method based on X-AnyLabeling, Segment Anything [37], and an auxiliary YOLOv8n model. The Segment Anything model used in this study was the SAM ViT-H quantized model (segment_anything_vit_h_quant-r20230810), which generated contours or bounding boxes after manual clicks on seedlings. The annotation procedure consisted of the following steps: (1) manually labeling 200 samples to train an initial YOLOv8n auxiliary labeling model and obtain weight parameters; (2) using the obtained weights to label another 200 images, followed by manual refinement; (3) accumulating 400 samples for a second round of model training and updating the weights; (4) applying the updated weights to annotate all remaining images; and (5) manually reviewing every semi-automatically labeled image and correcting errors where necessary to ensure annotation quality. The overall workflow is illustrated in Figure 3. During annotation, each individual soybean seedling was treated as one labeling object. Fully visible seedlings and occluded but still identifiable seedlings were labeled, whereas weeds were not labeled. For seedlings located at image edges, fully visible seedlings were labeled, while seedlings with only a small visible portion were not labeled because they also appeared in adjacent patches. Five annotators were responsible for manual checking and correction according to the same labeling criteria. To evaluate the quality of the original semi-automatic annotations, 200 images were randomly selected from the model outputs before manual review, after all reviews had been completed. These original annotations were compared with the final manually reviewed annotations. Statistical results showed that the original model annotations had a missing rate of 4%, a duplicate rate of 2%, and an average bounding box IoU of 0.90 relative to the final reviewed annotations.
Figure 3.
Semi-automatic annotation results of soybean seedling images.
2.2. Soybean Seedling Counting Model Construction
2.2.1. Construction of SSDNet
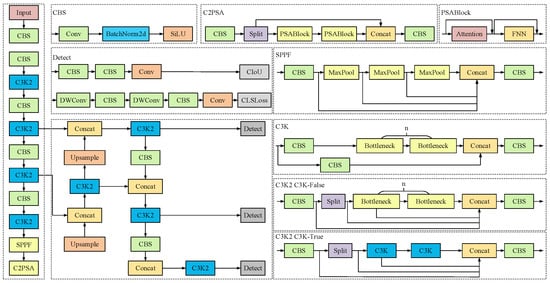
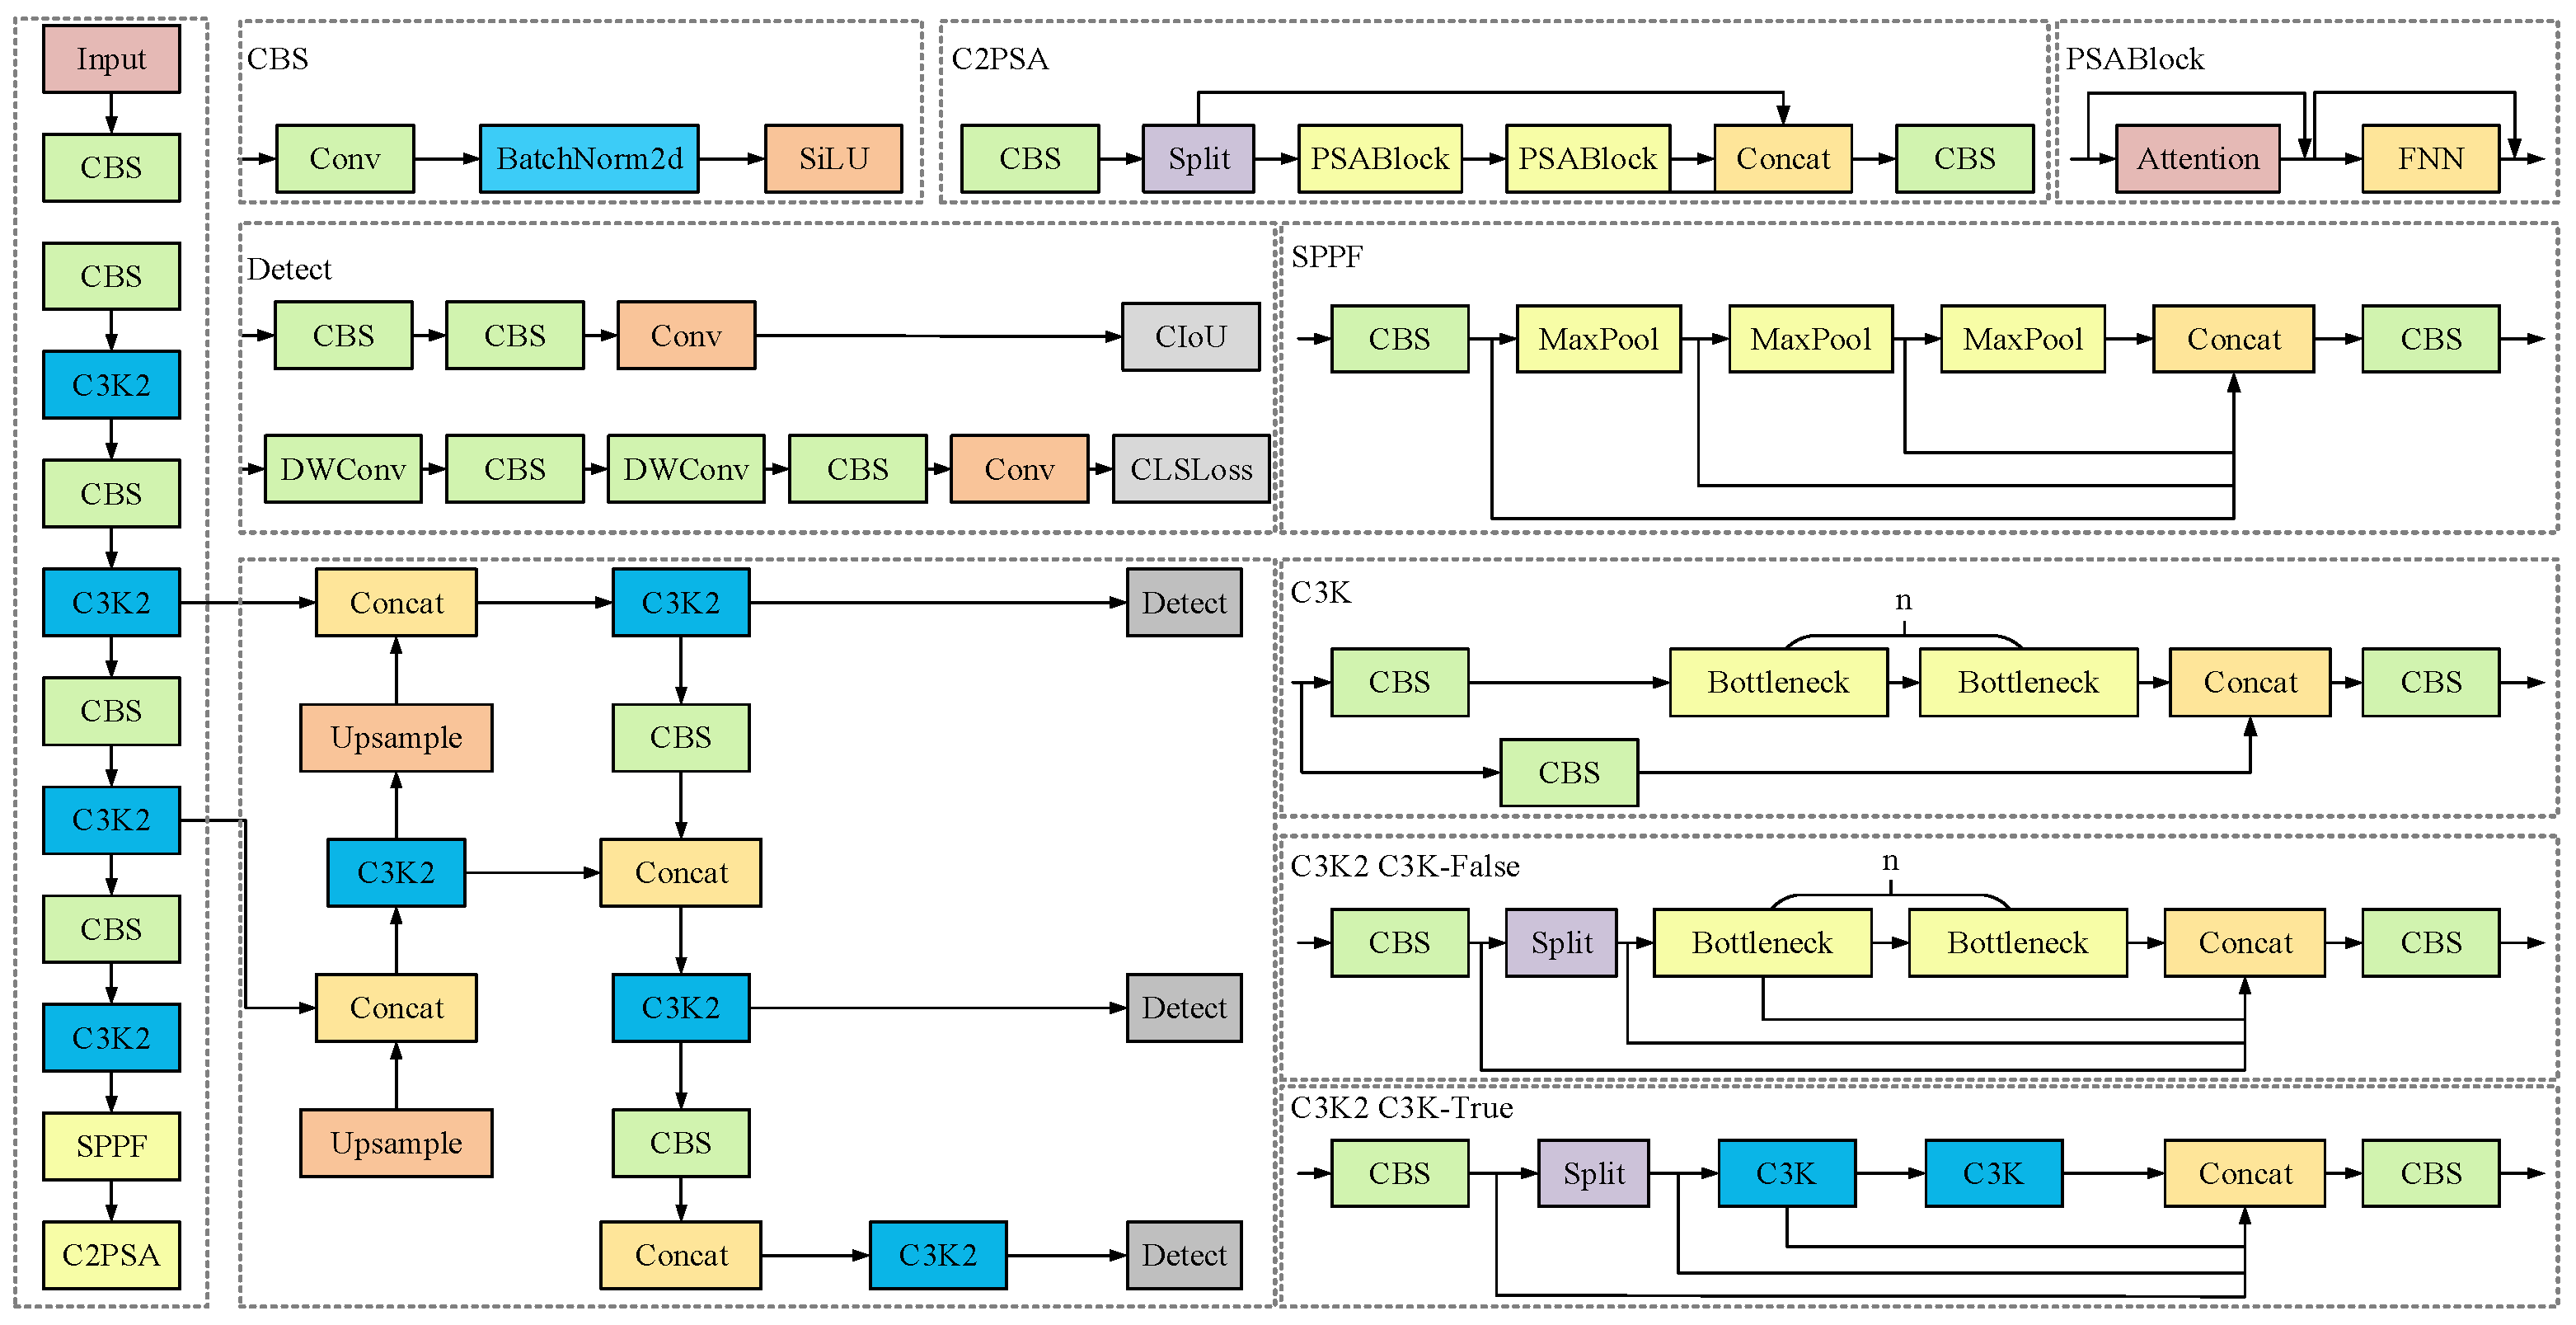
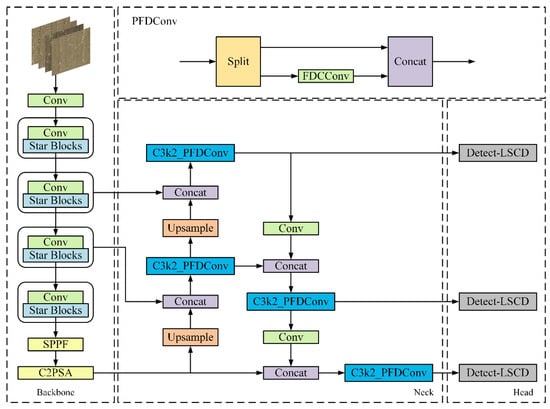
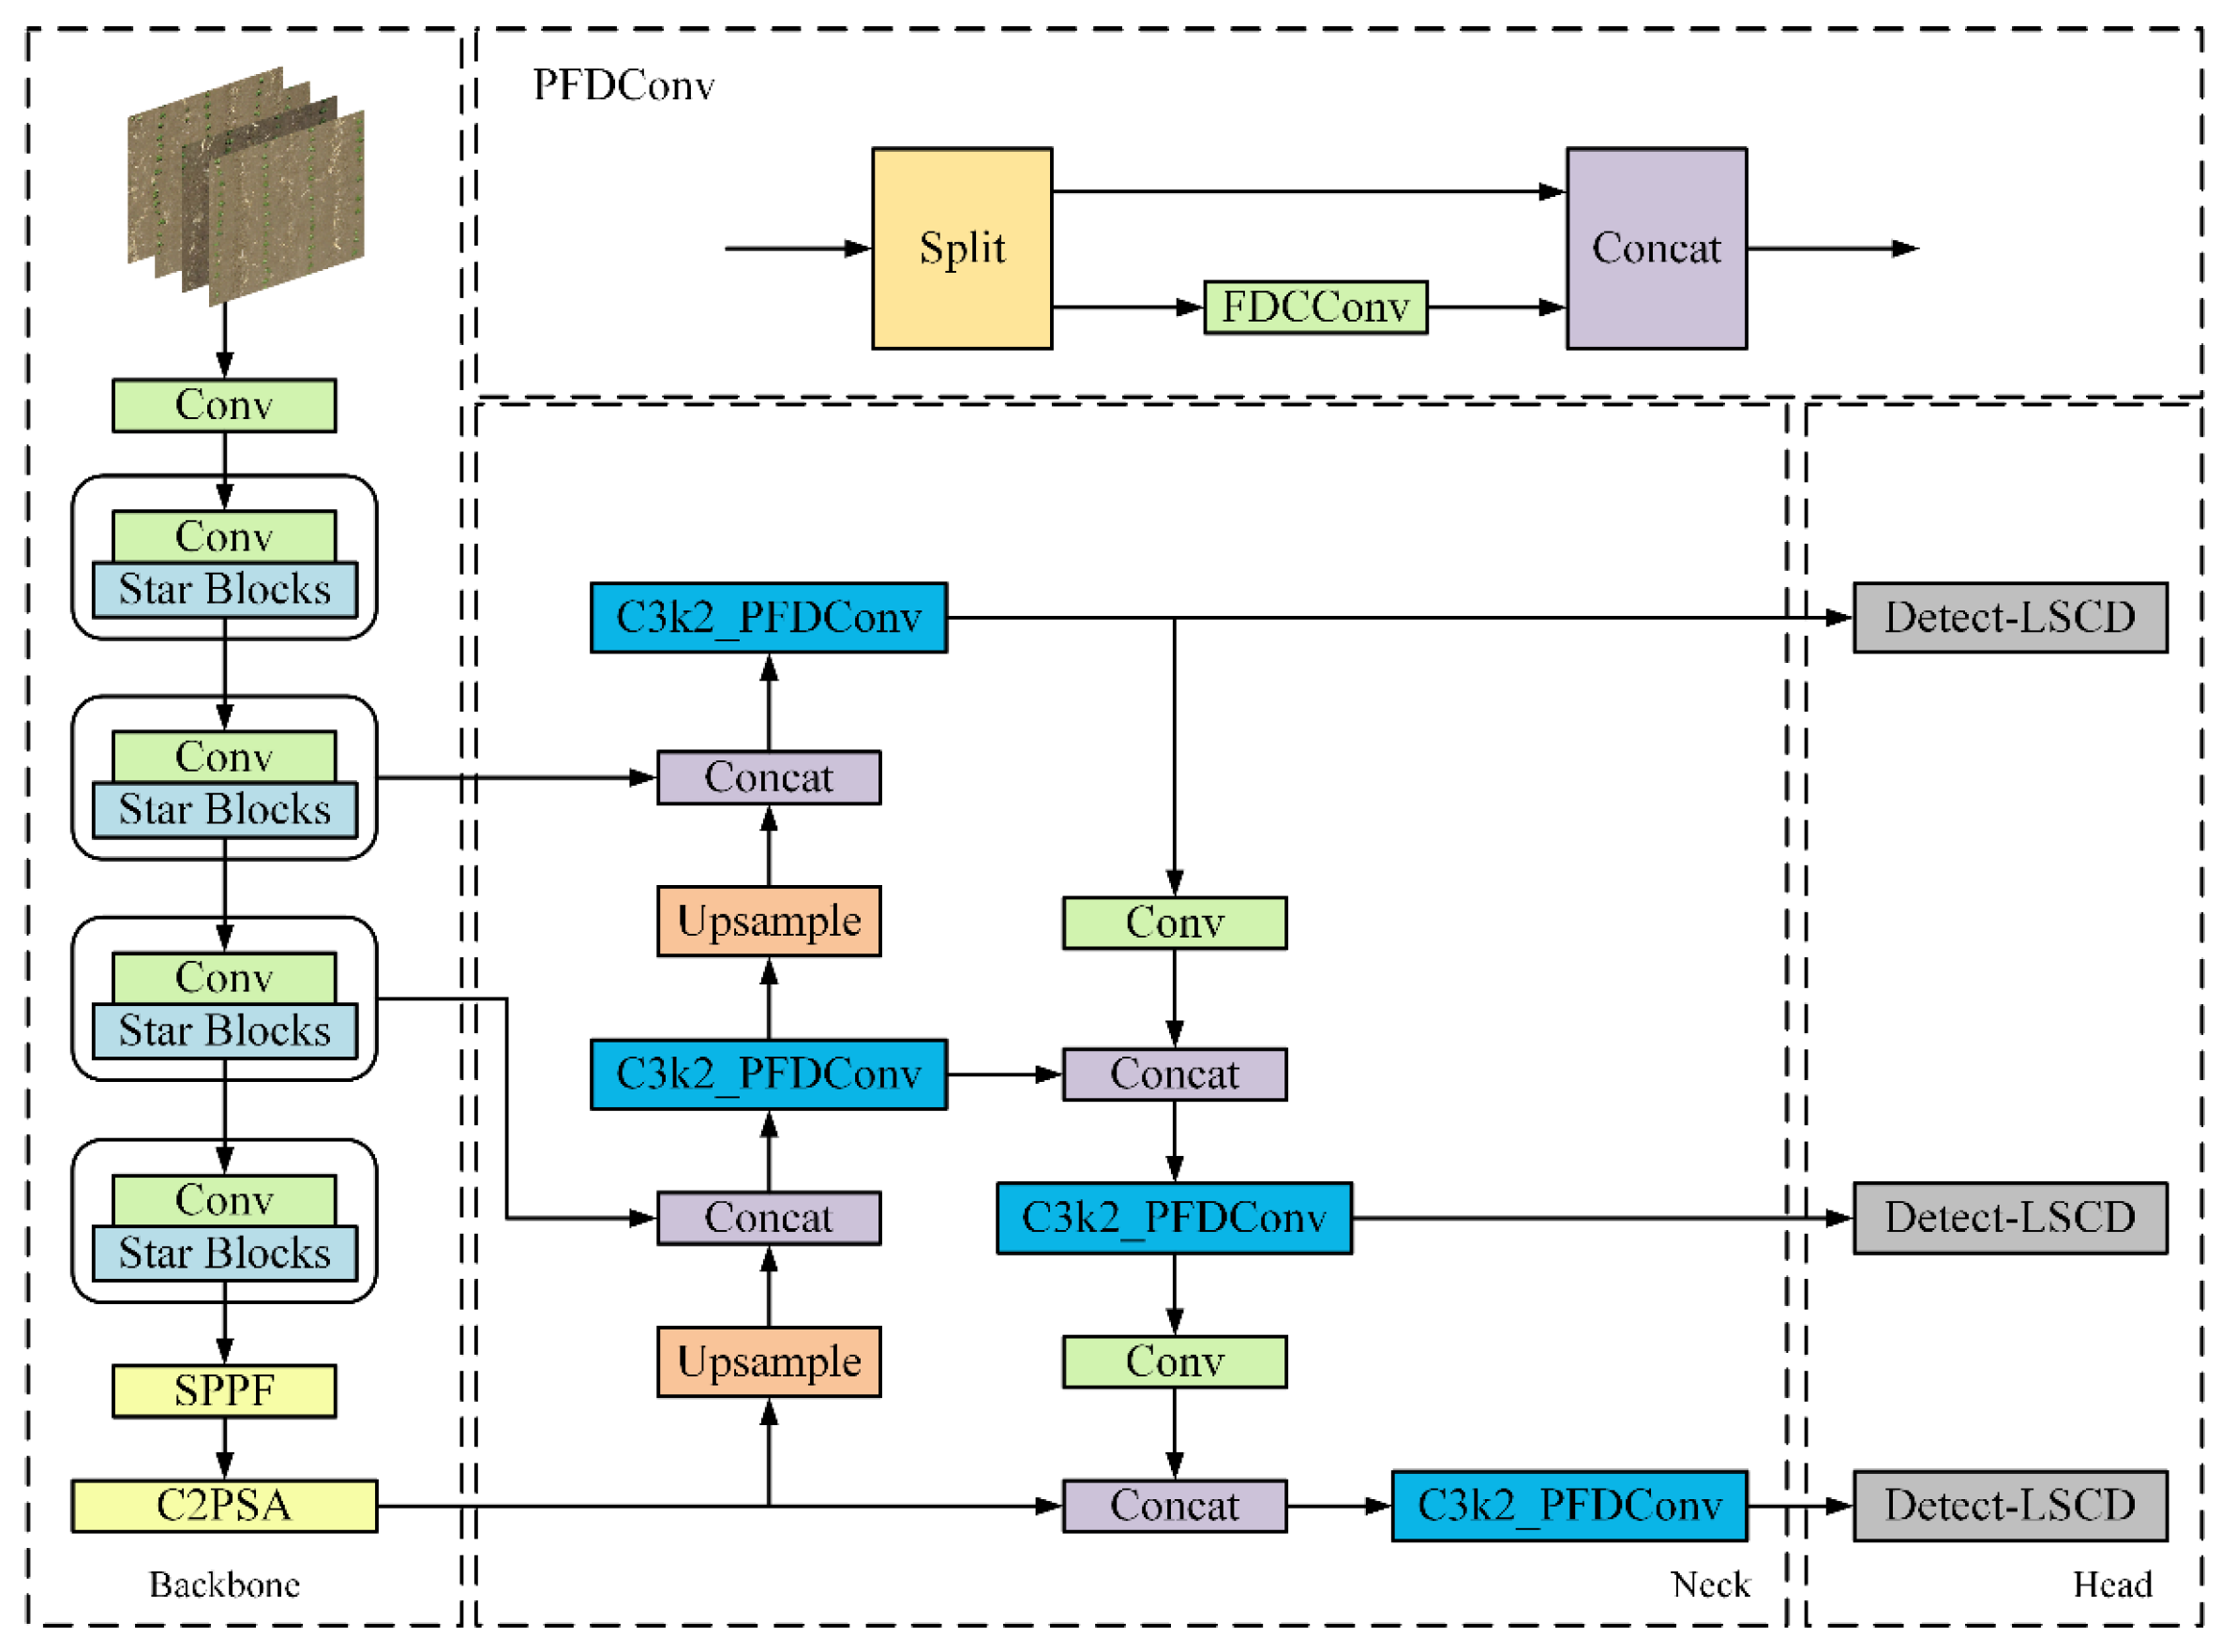
YOLOv11 is a one-stage object detection algorithm with a backbone, neck, and head architecture, as shown in Figure 4. To address its limited ability to detect dense small targets in soybean seedling images, as well as the limited computing power of edge devices and the need to process high resolution images, this study proposes an improved model, SSDNet, which jointly optimizes the backbone, neck, and head structures. The backbone uses StarNet to achieve lightweight feature extraction. For feature enhancement, C3k2-PFDConv is introduced to strengthen multi-scale detail representation of small targets. The detection head adopts a lightweight shared convolution detection head, LSCD, which maintains multi-scale detection capability while reducing the number of parameters. The structure of the improved model is shown in Figure 5. The effectiveness of StarNet, C3k2-PFDConv, and LSCD is validated in Section 3.2 and Section 3.3.
Figure 4.
YOLO11 network structure.
Figure 5.
SSDNet network structure.
2.2.2. StarNet
Soybean seedlings are morphologically similar to weeds, with dense and tiny targets, making detection challenging. To reduce model complexity, this study replaces the backbone of YOLOv11n with StarNet proposed by Ma et al. [38]. StarNet is a lightweight convolutional neural network whose core operation is the star operation, which implicitly enhances nonlinear feature representation through element-wise multiplication between two projected feature branches. For dense and morphologically similar small targets such as soybean seedlings, this operation helps improve feature discriminability. Meanwhile, StarNet reduces the parameter count and computational cost through depthwise convolution and a streamlined modular architecture, making it suitable for lightweight dense seedling detection.
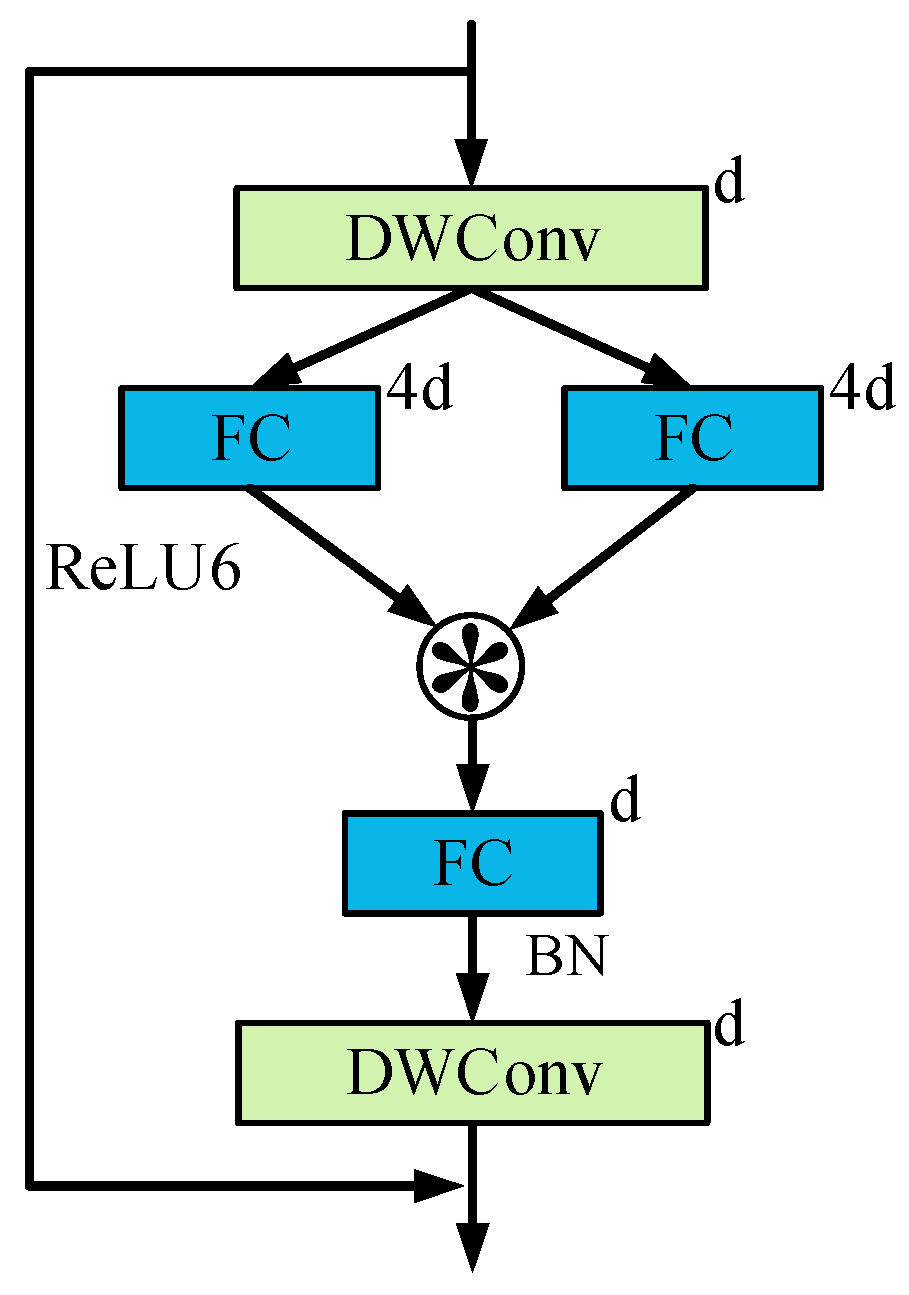
The structure of StarNet includes convolutional layers for downsampling and multiple Star Blocks for feature extraction. Each Star Block mainly consists of depthwise convolution, two pointwise convolution branches, element-wise multiplication, and a residual connection. By stacking these Star Blocks, StarNet reduces computational overhead while maintaining feature extraction ability. The structure of the Star Block is shown in Figure 6, and the basic star operation is expressed as follows:
w1 and w2 represent the combination of weight matrices and biases, and x is the input feature. By using this operation, a feature space is obtained that contains approximately (d + 2)(d + 1)/2 linearly independent dimensions, where d is the number of input channels.
Figure 6.
The design details of the star block. The asterisk (*) denotes element-wise multiplication.
By stacking multiple star operations, StarNet can implicitly expand the nonlinear feature representation space. With the output of the l-th layer of the star operation, the output feature can be represented as , where Ol denotes the output of the l layer of the star-shaped operation, ℝ denotes the feature space, d denotes the input feature dimension, and l denotes the number of stacked star-operation layers.
2.2.3. C3K2-PFDConv
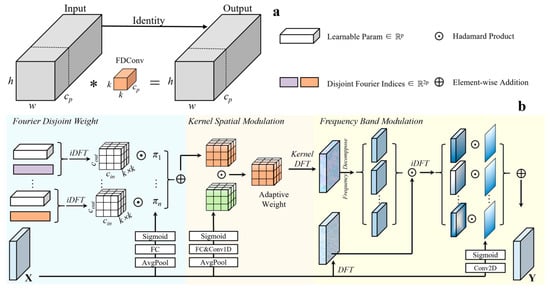
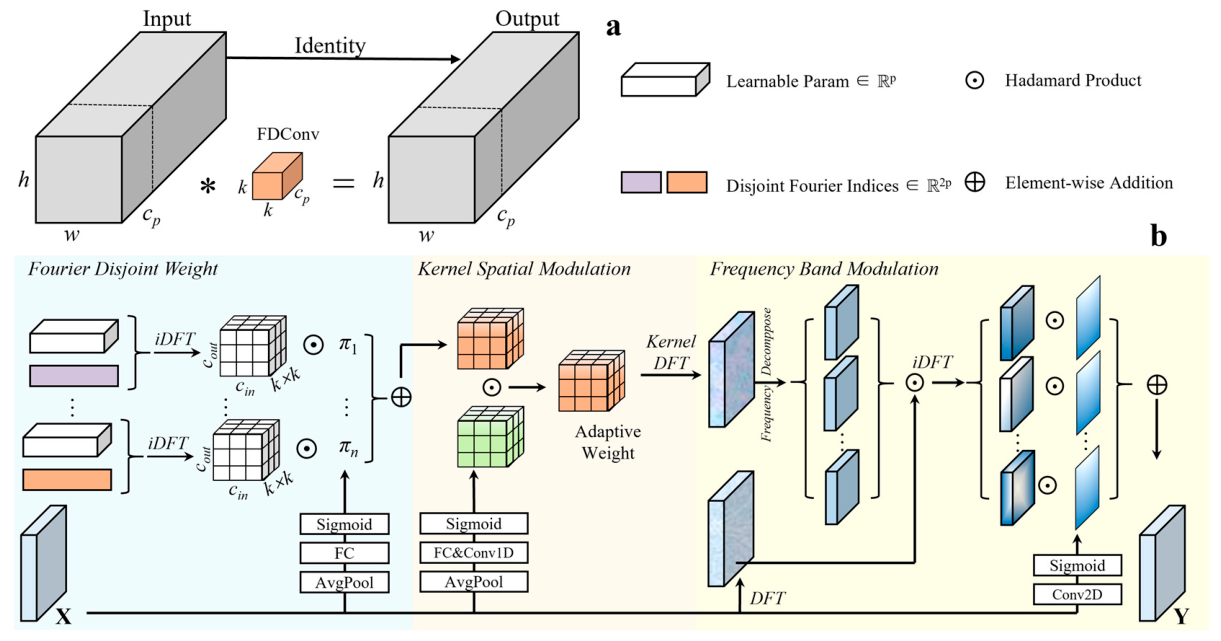
To enhance the feature representation of small seedlings and reduce computational cost, we combined the C3k2 module with PFDConv to construct the C3k2-PFDConv module. PFDConv combines the partial-channel processing strategy of PConv [39] with FDConv [40], processing only a subset of channels while preserving an identity mapping for the remaining channels. The implementation includes two alternative processing paths, standard convolution and frequency dynamic convolution, selected according to the number of channels to be processed.
Given an input X with C channels, the number of processed channels is . The operation is expressed as:
where X1 contains the first Cp channels, X2 contains the remaining channels, and Concat denotes concatenation along the channel dimension. The frequency-dynamic branch is enabled only when Cp >16. In the experimental configuration used in this study, Cp does not exceed 16 for any PFDConv instance. Therefore, F uses a standard 3 × 3 convolution with a stride of 1 and padding of 1, without executing frequency-band modulation, dynamic attention, or iRFFT reconstruction. The module structure is shown in Figure 7.
Y = Concat(F(X1),X2)
Figure 7.
(a) PFDConv structure diagram; (b) FDConv structure diagram. The asterisk (*) in panel (a) denotes the convolution operation.
2.2.4. Lightweight Shared Convolution Detection Head
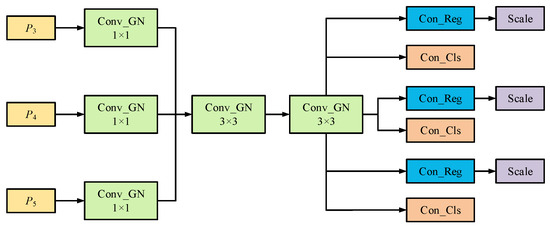
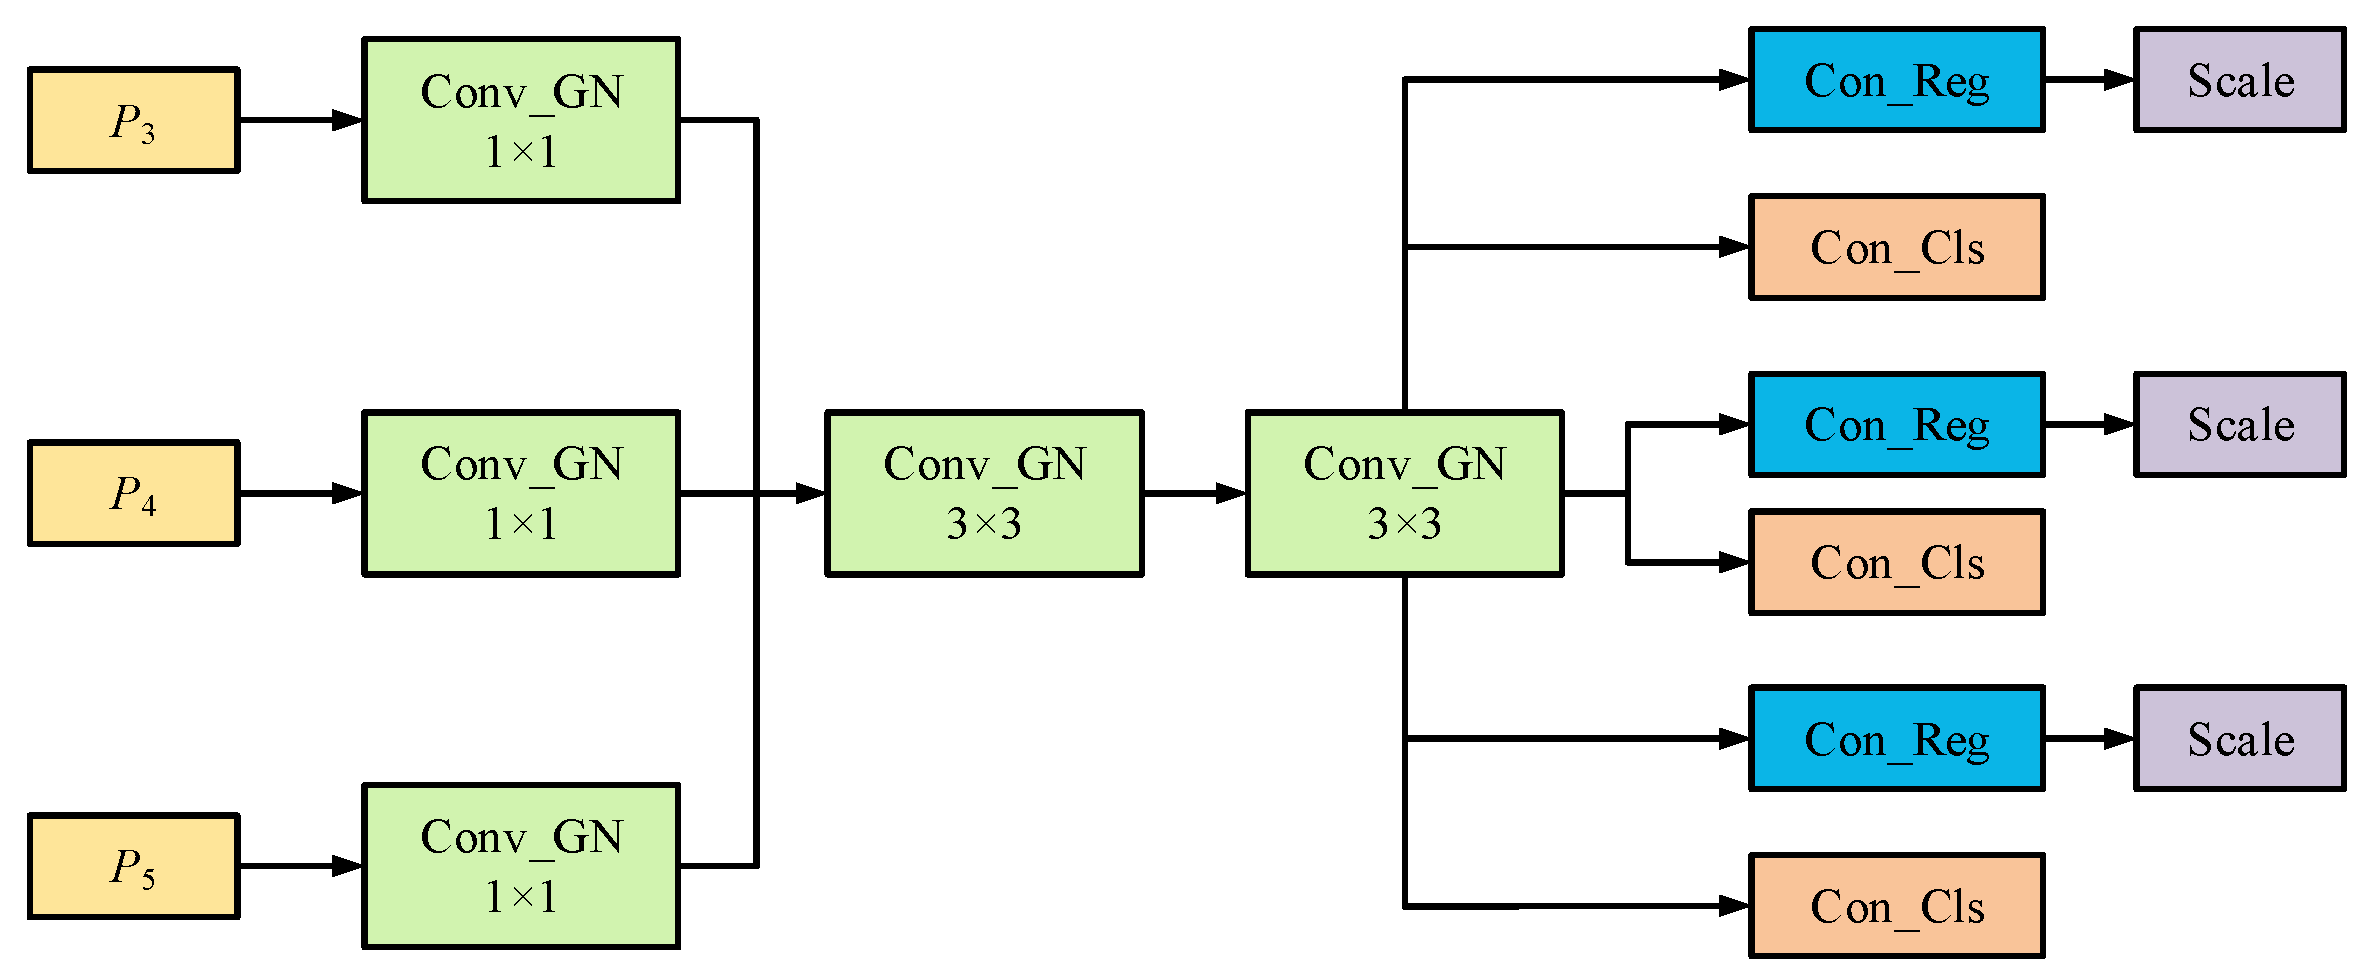
Each detection head in YOLOv11 is fed by separate feature maps, and limited interaction among detection heads may cause information loss and reduce detection performance. To address this issue, Shen et al. [41] proposed a lightweight shared convolutional detection head (LSCD). LSCD employs group normalization and shared convolutions to support multi-scale object localization and classification while reducing parameter redundancy through weight sharing. Input features from three scales are first projected to 64 channels through separate convolutions, followed by a shared depthwise convolution and a shared convolution for feature extraction and channel information fusion, with 16-group normalization and SiLU activation. The regression and classification branches output 64 distance-distribution channels and one seedling-class channel, respectively. An independent learnable scale factor adaptively adjusts the regression outputs at each scale. During detection, LSCD dynamically generates anchor points at feature-map grid centers according to the feature-map dimensions and uses the corresponding strides of 8, 16, and 32 for bounding-box decoding and coordinate mapping, accommodating different input sizes for lightweight multi-scale seedling detection. The structure of LSCD is shown in Figure 8.
Figure 8.
Lightweight shared convolutional detection head structure.
2.2.5. Slicing-Aided Inference
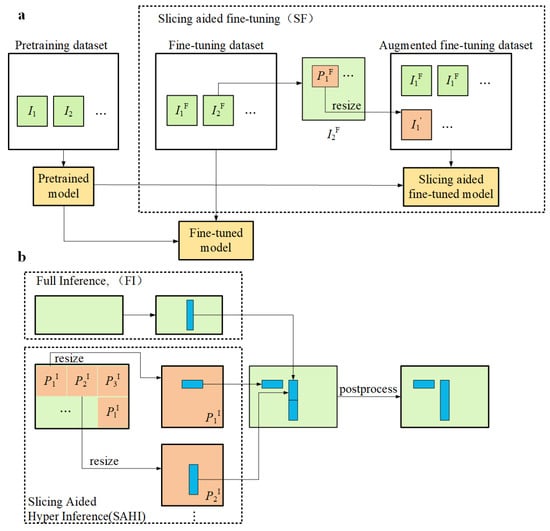
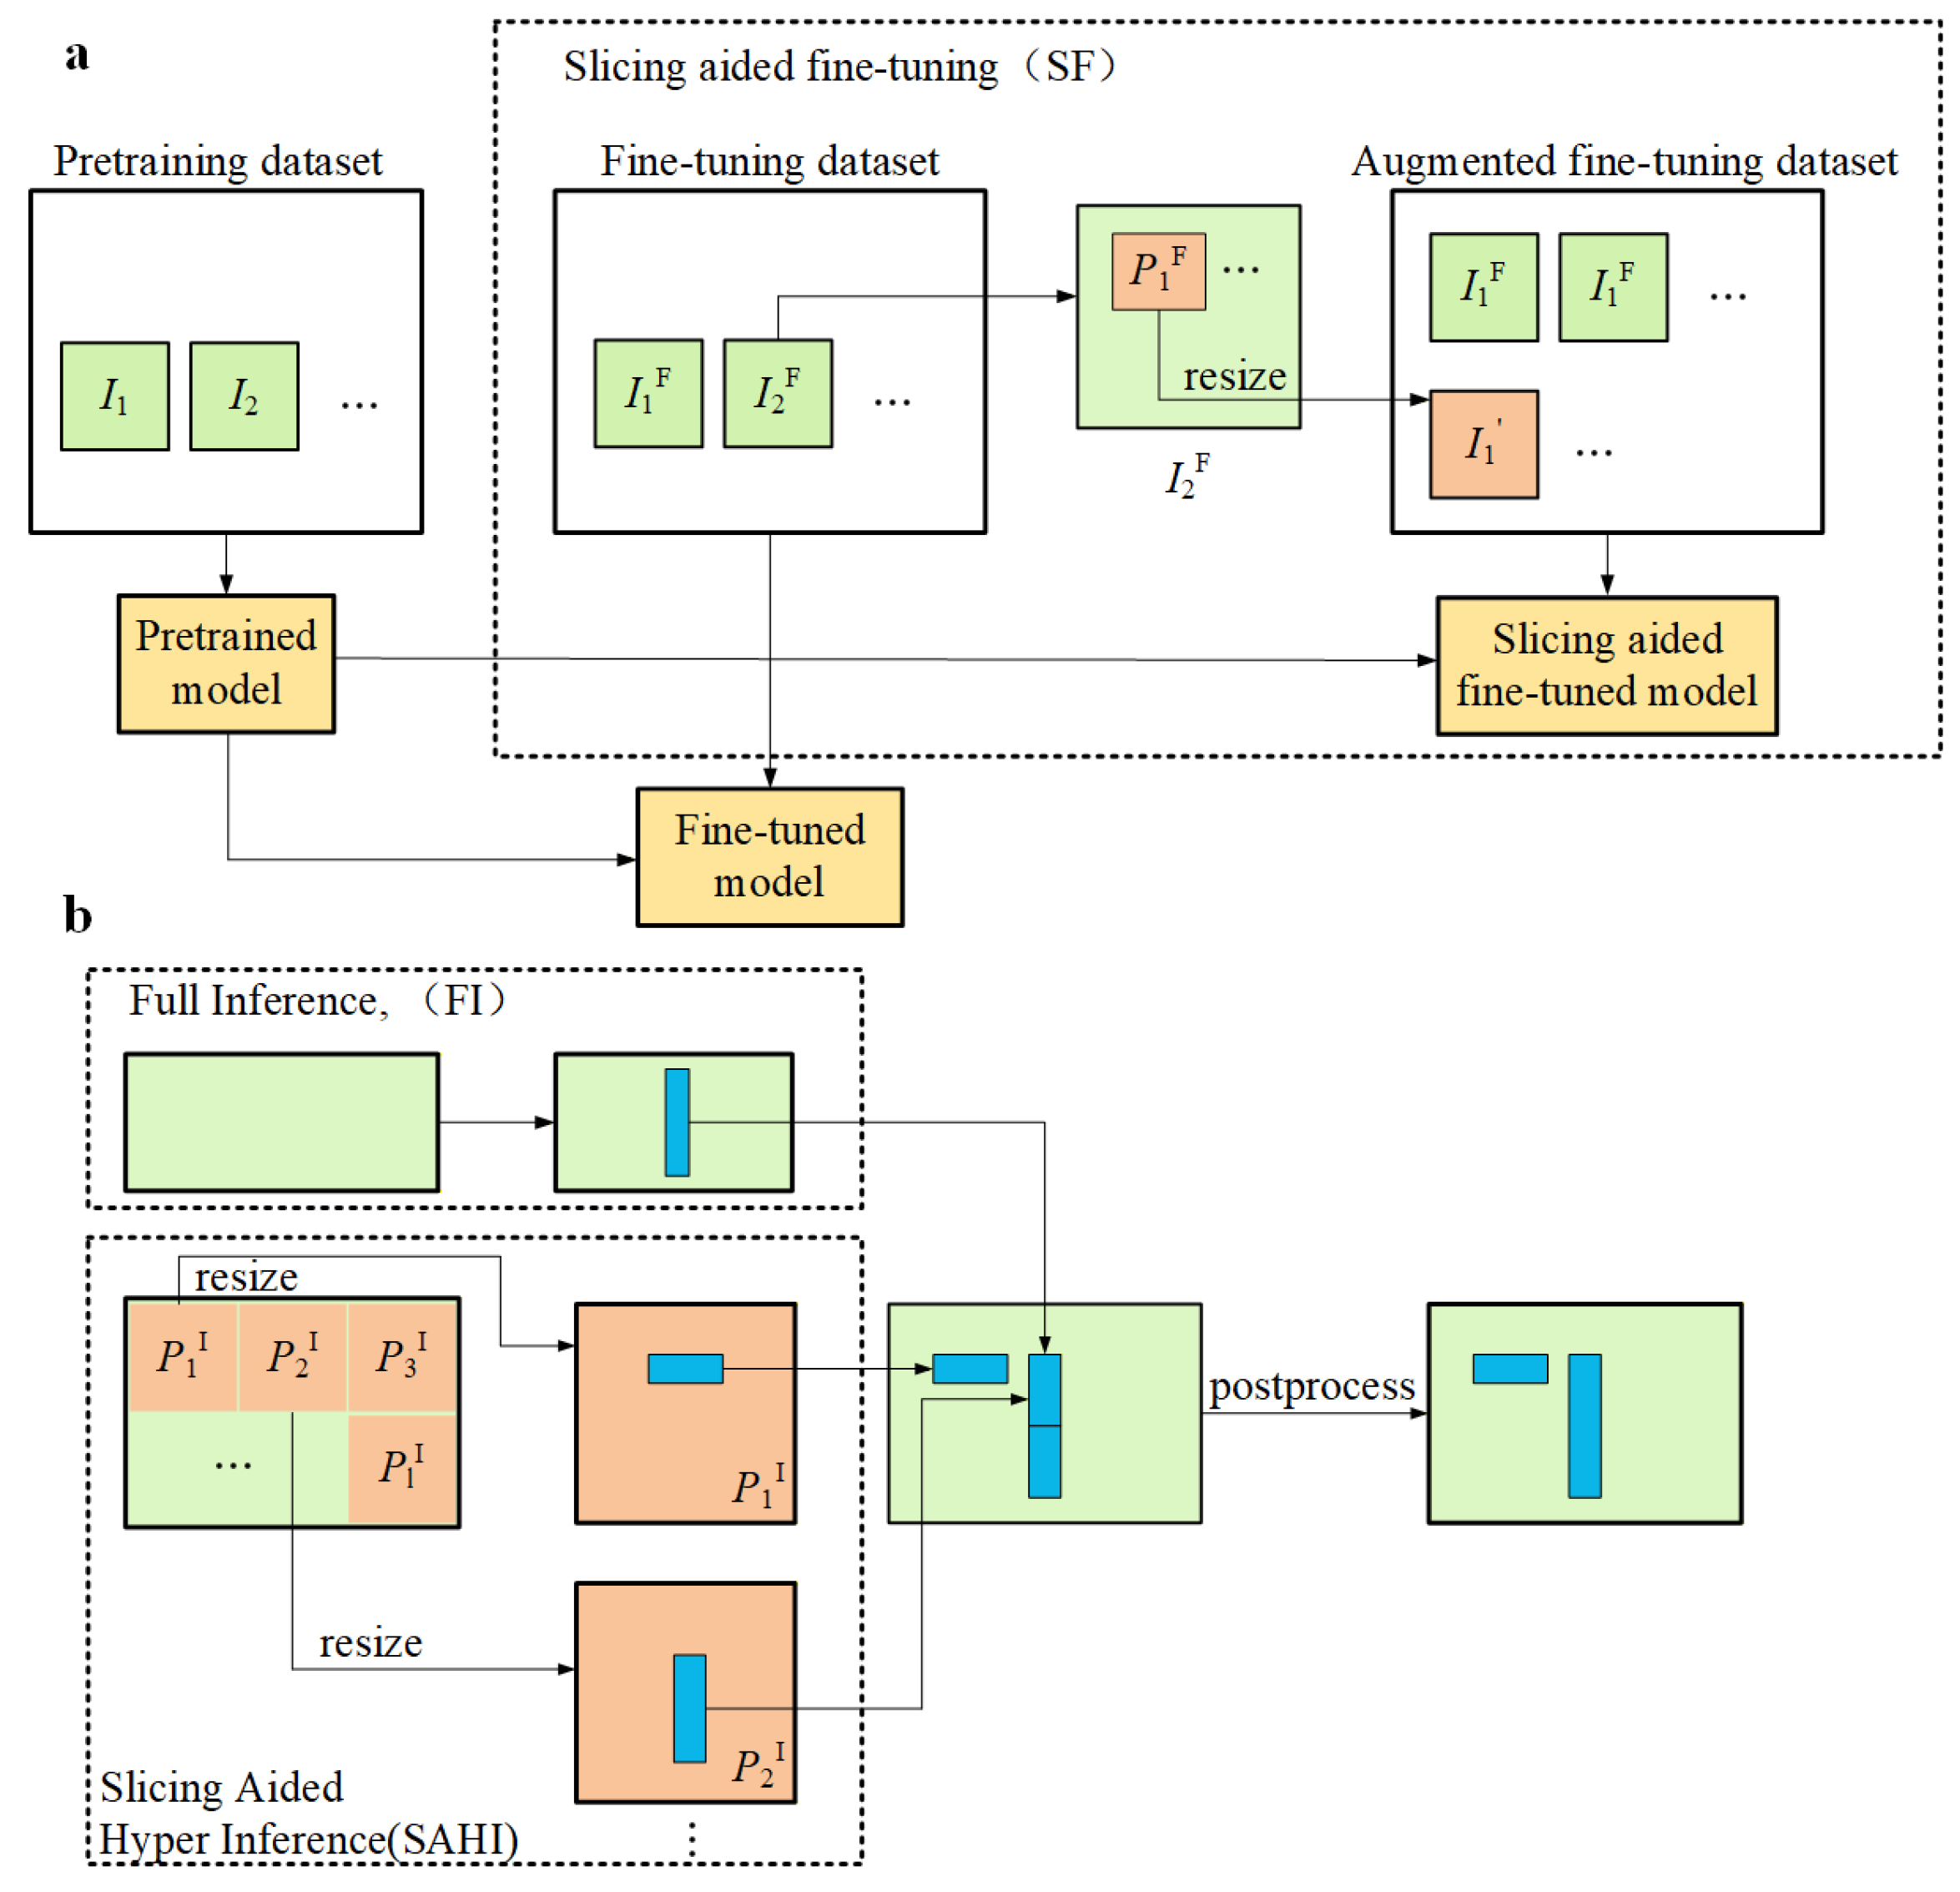
Although the soybean seedling detection model SSDNet developed and trained in this study has been validated on standard datasets, it still faces challenges when applied to field images captured by drones. Due to the relatively small size and low pixel occupancy of soybean seedlings, it is difficult to balance detection accuracy and speed, which limits high-throughput counting in field applications. To address this issue, this study integrates SSDNet with Slicing-Aided Hyper Inference (SAHI) [42] to improve its applicability in real-world field scenarios and enable accurate and rapid detection and counting of soybean seedlings. The SAHI framework is designed for small target detection in high-resolution images. Its core innovation is a universal slicing-aided inference and fine-tuning pipeline that can be directly embedded into existing models without structural modification, with low computational requirements and high versatility. More importantly, SAHI enhances small target features through slicing without altering target pixel information, making it particularly suitable for high-resolution tasks with large target scale variation, such as drone captured aerial imagery. This aligns well with the requirements of this study. Figure 9 illustrates the general SAHI framework, which includes slicing-aided fine-tuning and slicing-aided inference. These two components are described below to explain the figure. In this study, SSDNet was trained using UAV image patches of 640 × 640 pixels, and the trained model was subsequently combined with slicing-aided inference to detect soybean seedlings in the original large UAV images.
Figure 9.
General SAHI framework: (a) slicing-aided fine-tuning; (b) slicing-aided inference.: original fine-tuned aerial images; : fine-tuned original aerial image overlapping patches; : augmented images; : overlapping patches of the drone-captured image to be detected.
Training Phase: The original fine-tuned aerial images , , … are sliced into overlapping patches , , …. These patches are then rescaled to a standard resolution to obtain augmented images , , …. Both the augmented and original images are used together for model fine-tuning. This process allows the model to learn features of seedlings with a larger pixel occupancy, while retaining the ability to recognize larger targets.
Inference Phase: The drone captured image to be detected is divided into overlapping patches , , …. Object detection inference is performed in parallel on each patch. The resulting bounding boxes are then mapped to the coordinate system of the original image. Non-maximum suppression is applied to suppress redundant detections in overlapping regions and produce the final detection results for the original image. In this study, full-image inference was disabled during SAHI processing, and only slice-based inference was used.
3. Results
3.1. Experimental Environment and Evaluation Metrics
The experimental environment was set up with Windows 10, an NVIDIA GeForce RTX 3090 GPU (24GB VRAM), and CUDA 12.6. The system used a 12th-generation Intel Core i9-12900KF CPU with 16 cores and a clock speed of 3.20 GHz, together with 64 GB of RAM. Training parameters are listed in Table 1.
Table 1.
Experimental environmental parameters.
The performance of the soybean seedling detection model was evaluated using precision, recall, and mean average precision (mAP), reported as mAP@50 and mAP@50:95. Precision represents the proportion of predicted soybean seedlings that are correctly detected, while recall represents the proportion of actual soybean seedlings that are successfully detected. Average precision (AP) summarizes the relationship between precision and recall for each class at a given intersection over union (IoU) threshold, and mAP is the mean AP across all classes. mAP@50 is calculated at an IoU threshold of 0.50, whereas mAP@50:95 is calculated by averaging mAP over 10 IoU thresholds ranging from 0.50 to 0.95 in increments of 0.05.
Model performance evaluation metrics are calculated as follows:
Here TP, FP, and FN denote true positives, false positives, and false negatives, respectively. N denotes the number of classes and equals 1 in this study because soybean seedlings are the only target class. The F1 score is the harmonic mean of precision and recall.
3.2. Ablation Experiments
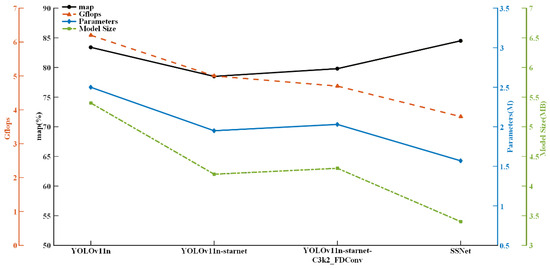
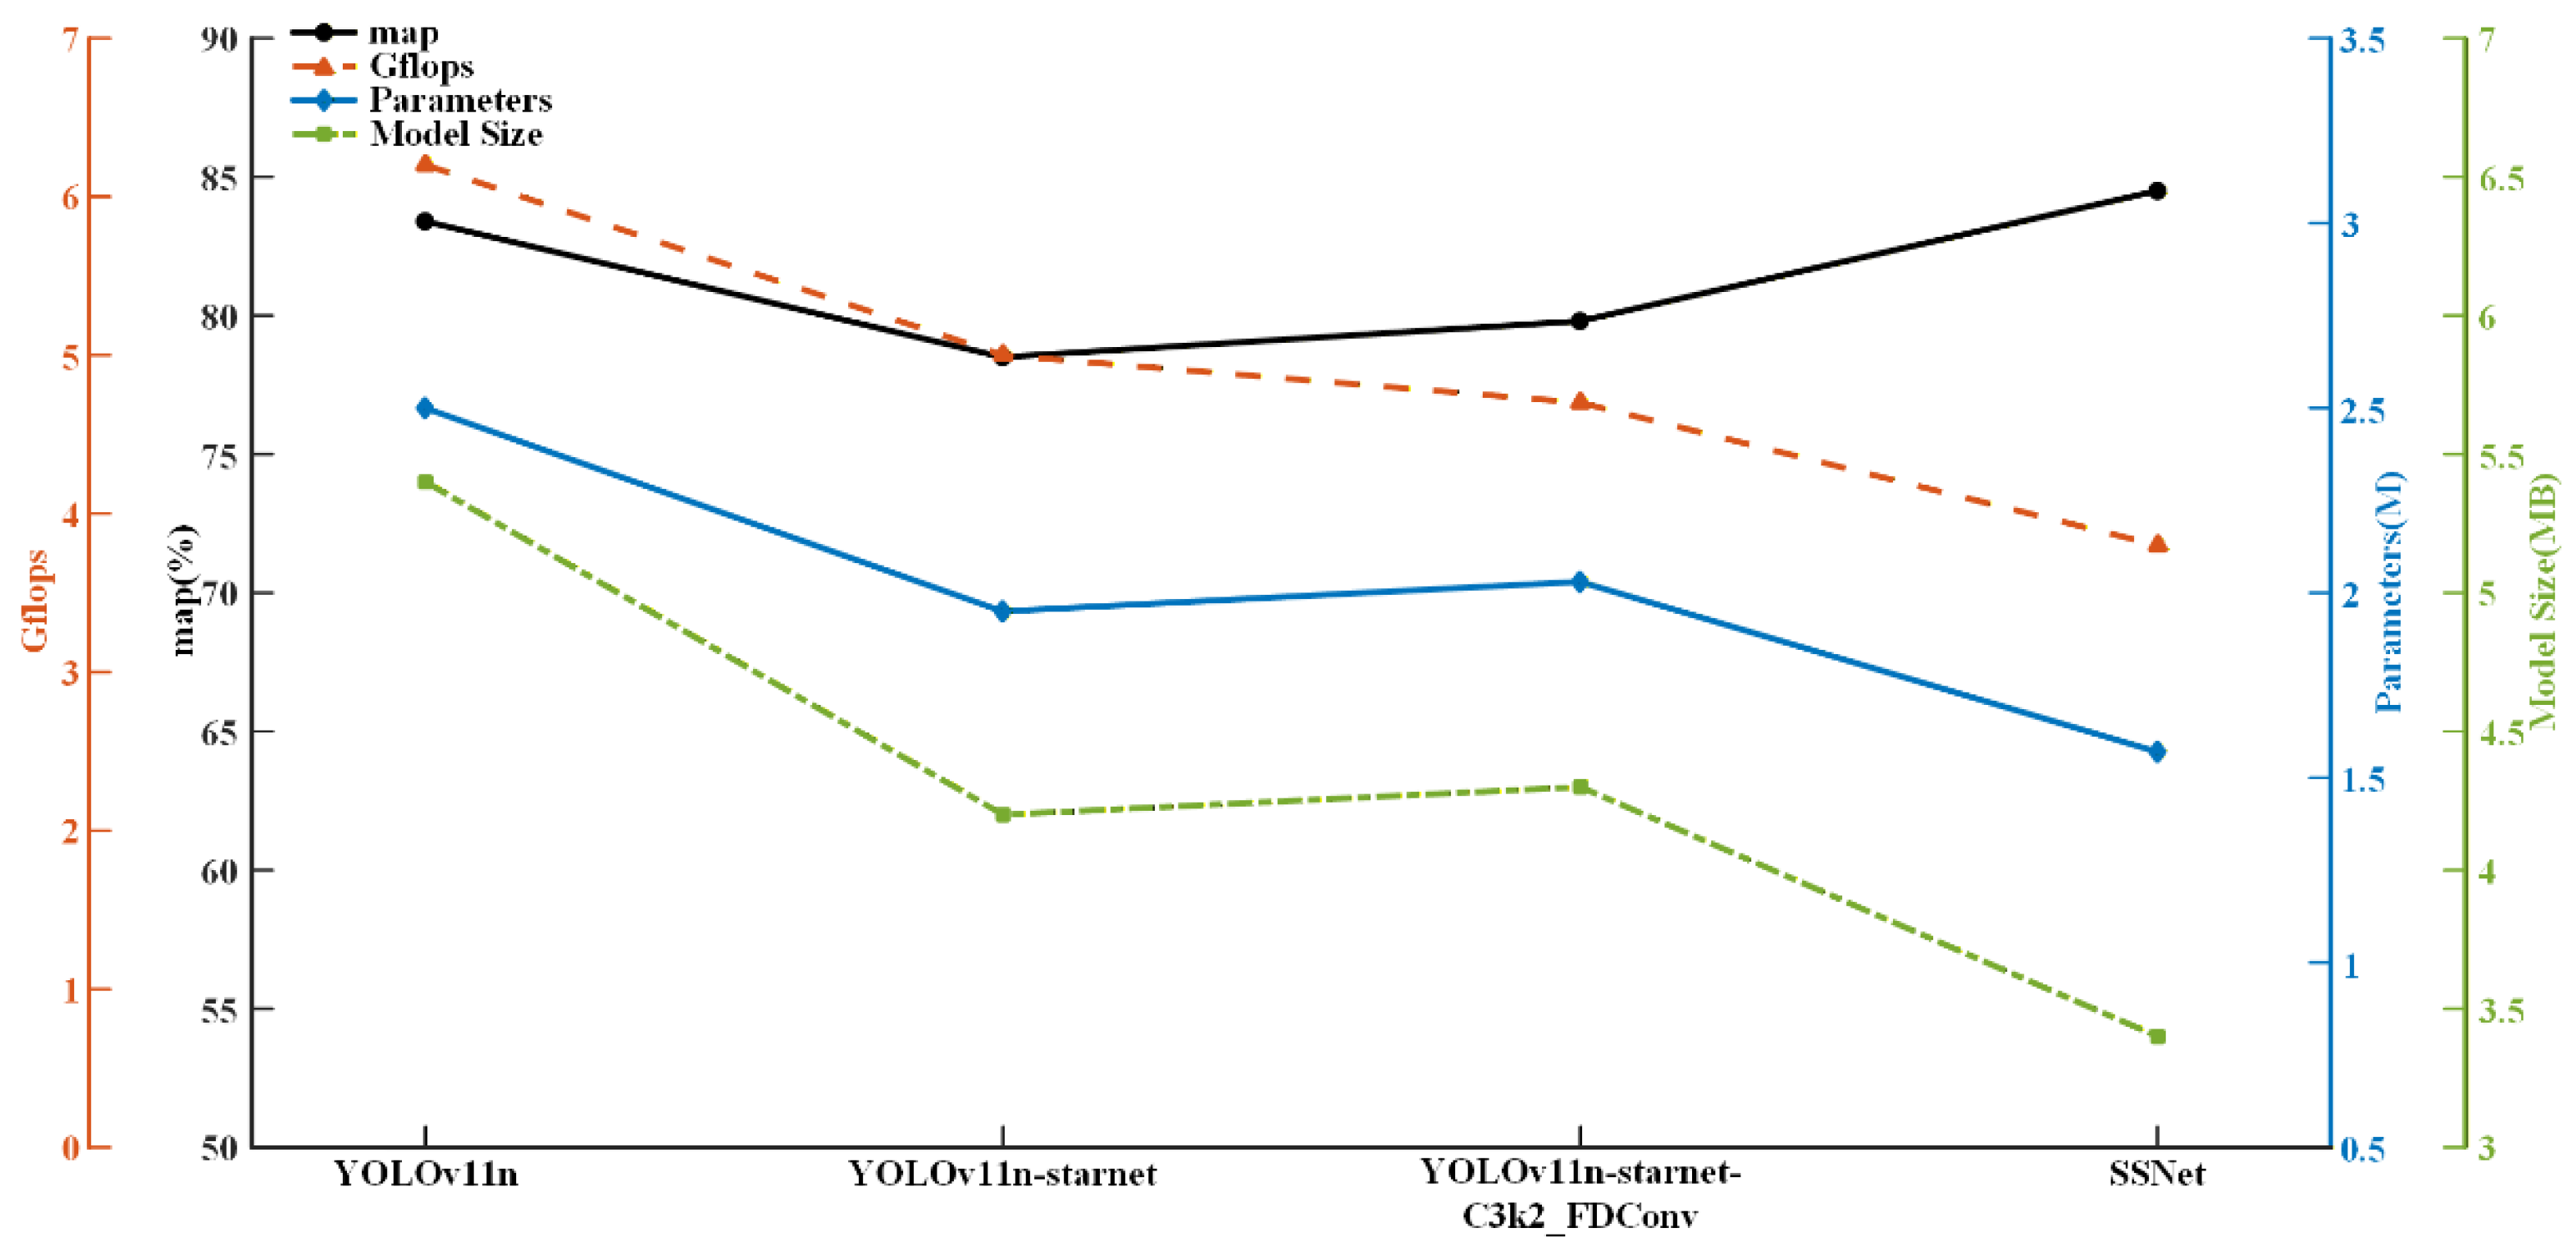
To evaluate the effectiveness and synergy of StarNet (module A), C3k2-PFDConv (module B), and LSCD (module C) in the detection model, an ablation study was conducted on the same dataset. To reduce the influence of training randomness, each configuration was independently trained three times using identical data splits and training settings. The mean results are reported in Table 2, where the three modules are denoted as A, B, and C. F1 scores were calculated as the harmonic mean of the reported mean precision and recall. Performance changes after adding different modules are analyzed in Figure 10.
Table 2.
Results of ablation experiment.
Figure 10.
Comparison of results of different modules.
The original YOLO backbone was replaced with the lightweight StarNet network, reducing parameters by 20.8% to 1.95M and model size to 4.2 MB, demonstrating the strong compression capability of StarNet. In contrast, the C3k2-PFDConv structure was used to extract key features. This approach reduced parameters and model size while achieving a mAP@50 of 96.92%, outperforming the 95.35% obtained with StarNet alone. This indicates that module B helps preserve features during model lightweighting. When module C (LSCD) was used alone, the model also surpassed YOLOv11n in precision, recall, and other metrics, making LSCD the most effective single component for detection accuracy. Several two-module combinations achieved slightly higher values on individual metrics such as mAP@50 than the full model. Nevertheless, when all modules were integrated, the model achieved the best overall balance among detection accuracy, recall, model size, parameter count, and computational cost, with mAP@50 reaching 98.7% and recall ranking highest at 94.59%. At the same time, the model achieved the most compact configuration, with model size and parameter count reduced to 3.4 MB and 1.57M, respectively, and computational cost reduced to 3.8 GFLOPs. These results show that the proposed module combination maintains reliable detection performance while effectively reducing model complexity, achieving a favorable trade-off between accuracy and efficiency.
3.3. Comparative Experiments
Based on the hardware and hyperparameter configurations in Section 3.1, all models were trained on the same dataset. All models were trained from scratch without loading pretrained weights, and no data augmentation was applied during training. The best checkpoint saved during training was used for subsequent performance evaluation. To evaluate the performance of the proposed object detection model, comparative experiments were conducted using several representative architectures, including (1) the classic two-stage detector Faster R-CNN [43] and the single-stage detector SSD [44]; and (2) widely used lightweight networks, such as YOLOv5n [45], YOLOv7-tiny [46], YOLOv8n [47], YOLOv9t [48], YOLOv10n [49], and the more recent YOLOv11n [50], YOLOv12n [51], and YOLOv13n [52], to balance detection accuracy and inference efficiency.
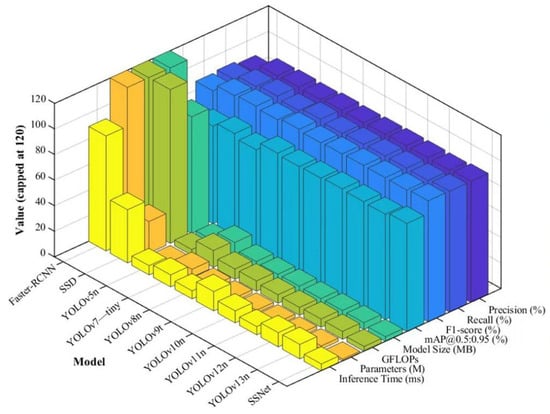
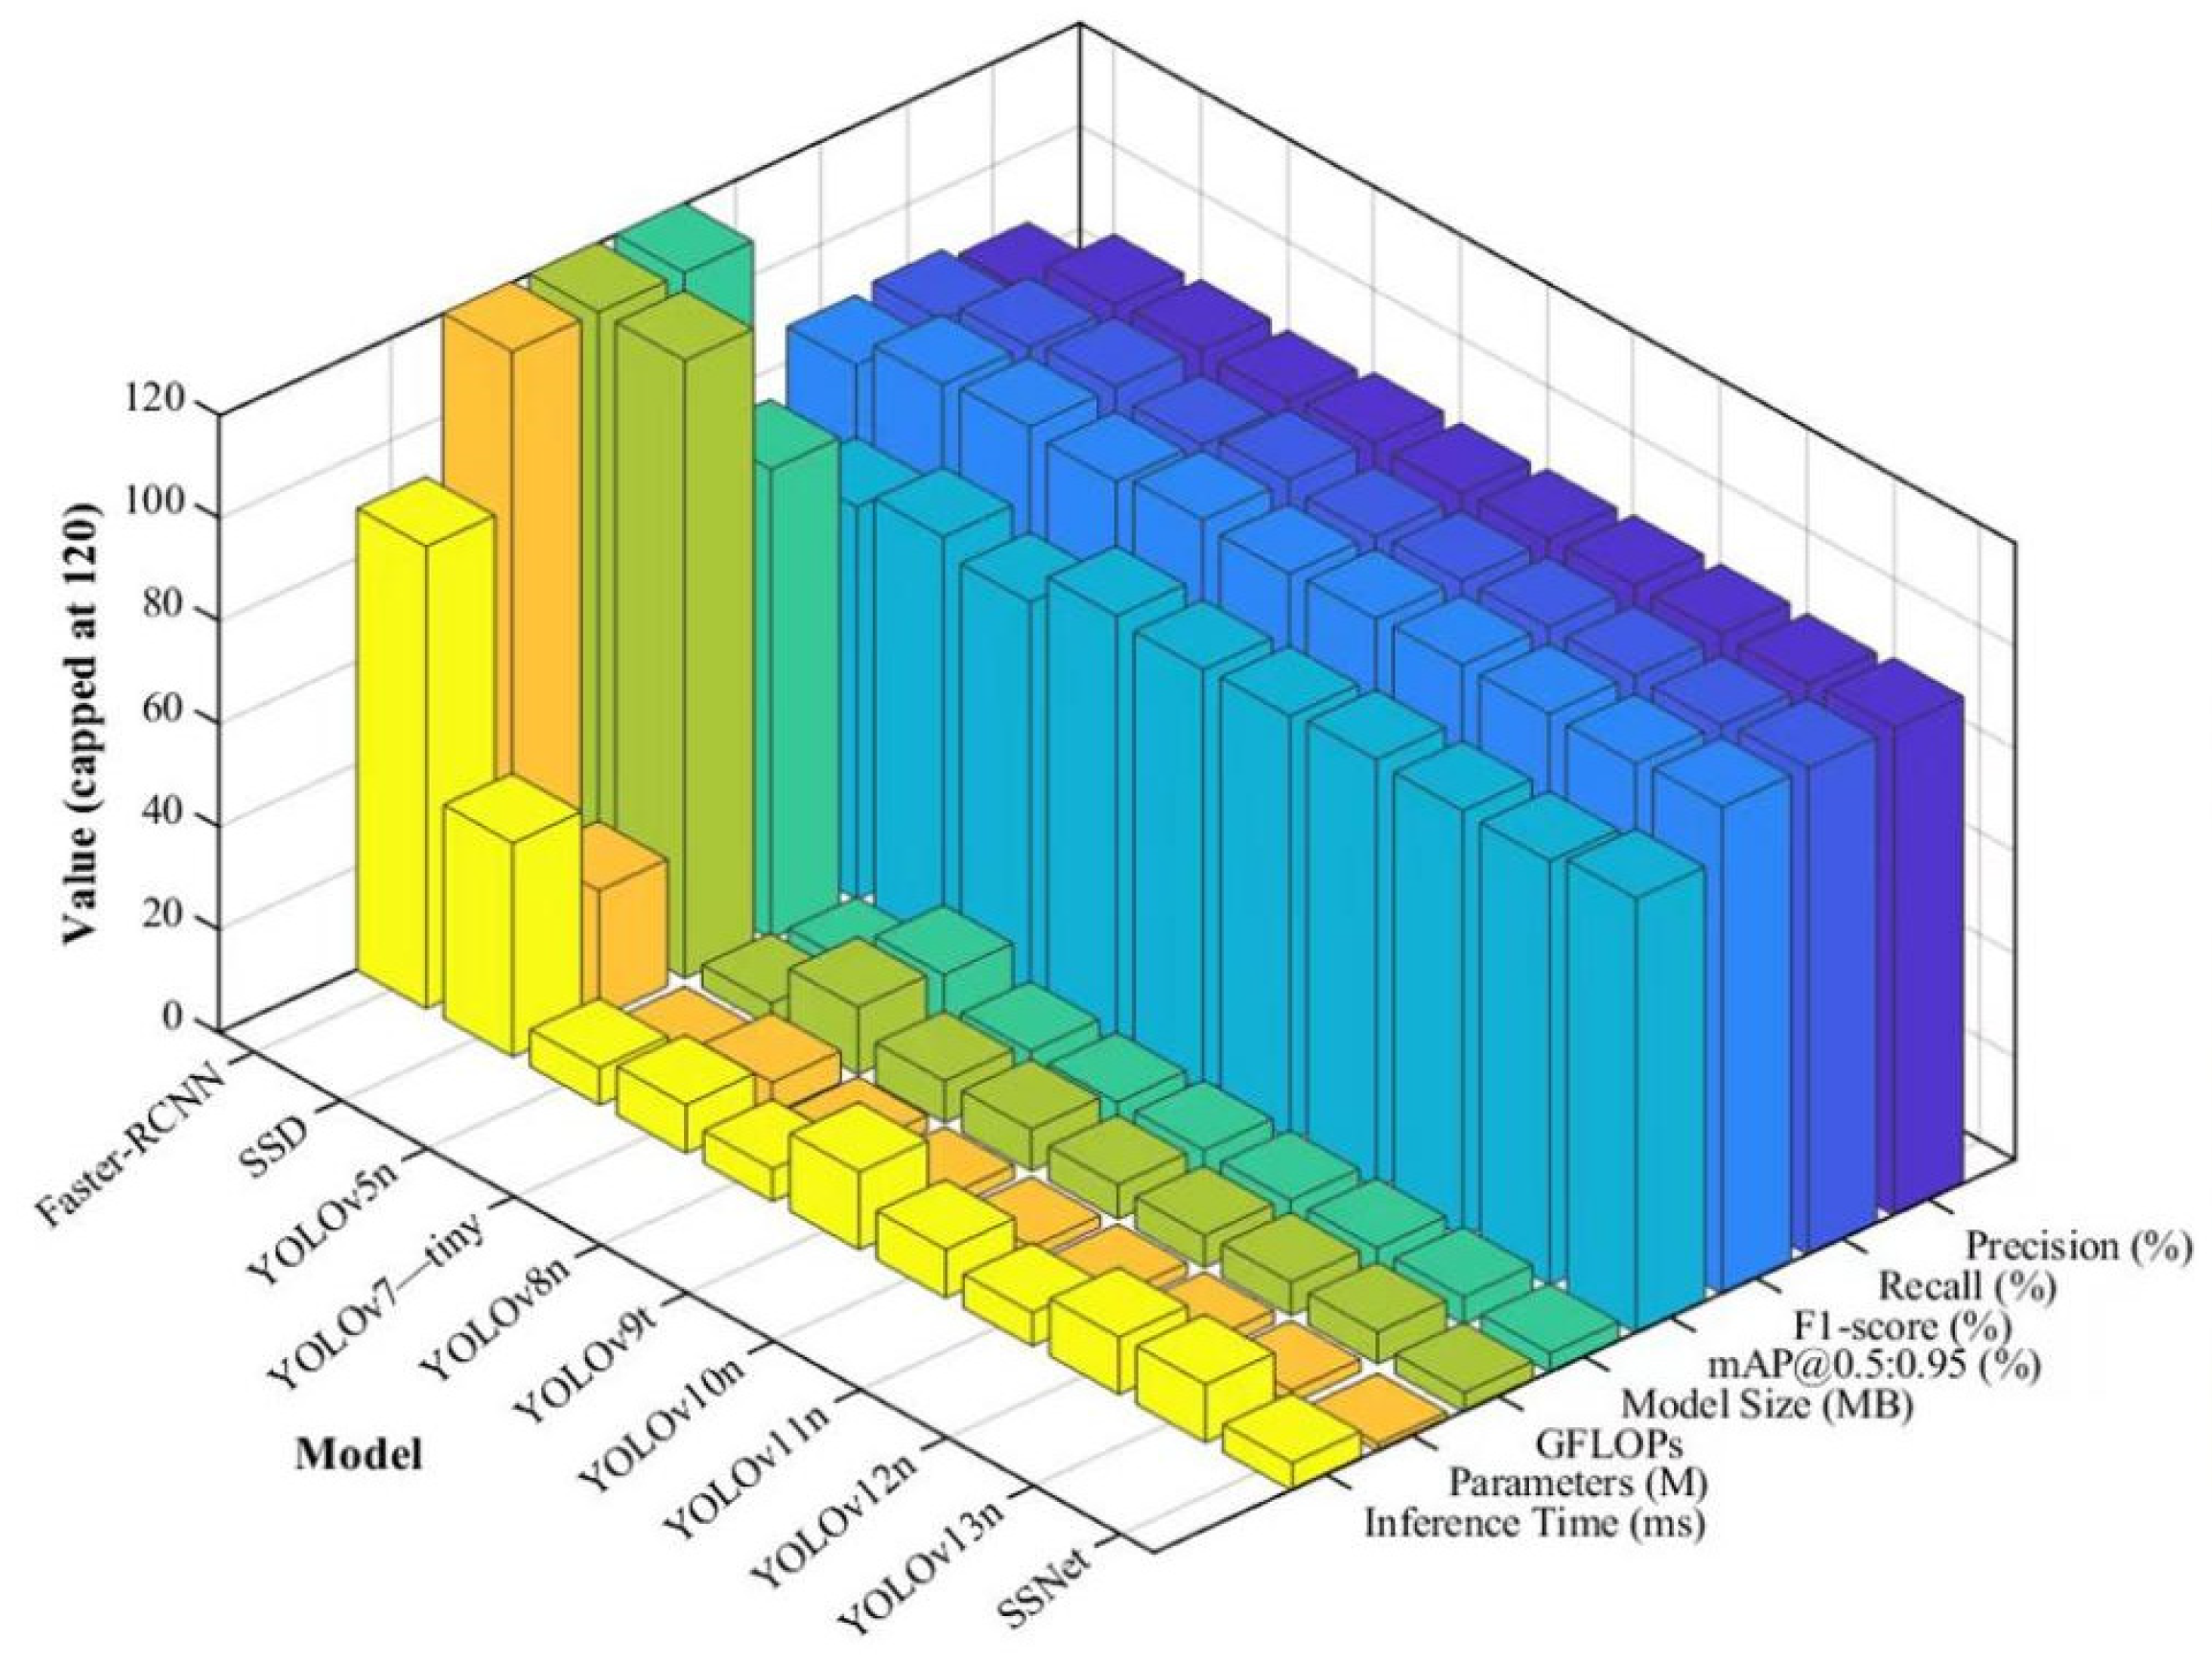
Figure 11 compares the performance of different detection models and SSDNet shows strong detection accuracy and computational efficiency among mainstream object detection models. As shown in Table 3, although YOLOv10n, YOLOv11n, YOLOv12n, and YOLOv13n are among the most recent models, SSDNet still achieves better overall performance. Specifically, the mAP@50 of SSDNet reaches 98.7%, which is 1.1 percentage points higher than the 97.6% of YOLOv11n. The mAP of SSDNet is 84.5%, which is 1.1 percentage points higher than the 83.4% of YOLOv11n, indicating stronger multi-scale detection capability.
Figure 11.
Comparison of results of different object detection models.
Table 3.
Model performance comparison.
In terms of model lightweighting, SSDNet achieves substantial compression while maintaining high accuracy. Compared with YOLOv11n, SSDNet reduces model size by 37.03%, parameter count by 37.2%, and FLOPs by 38.7%, while improving inference speed by 16.92%. Compared with other models, SSDNet also shows clear lightweighting advantages: model size is reduced by 99.35%, 96.27%, 12.82%, 71.06%, 46.03%, 40.35%, 41.38%, 38.18%, and 37.04% relative to Faster R-CNN, SSD, YOLOv5n, YOLOv7-tiny, YOLOv8n, YOLOv9t, YOLOv10n, YOLOv12n, and YOLOv13n, respectively. Parameter count is reduced by 98.85%, 93.63%, 12.78%, 74.26%, 47.84%, 40.98%, 31.74%, 38.91%, and 35.92% for the same models. Meanwhile, the inference speed of SSDNet reaches 5.4 ms, outperforming YOLOv8n and YOLOv10n and demonstrating strong real-time detection performance. These results highlight the effective balance between detection accuracy and computational efficiency achieved by SSDNet.
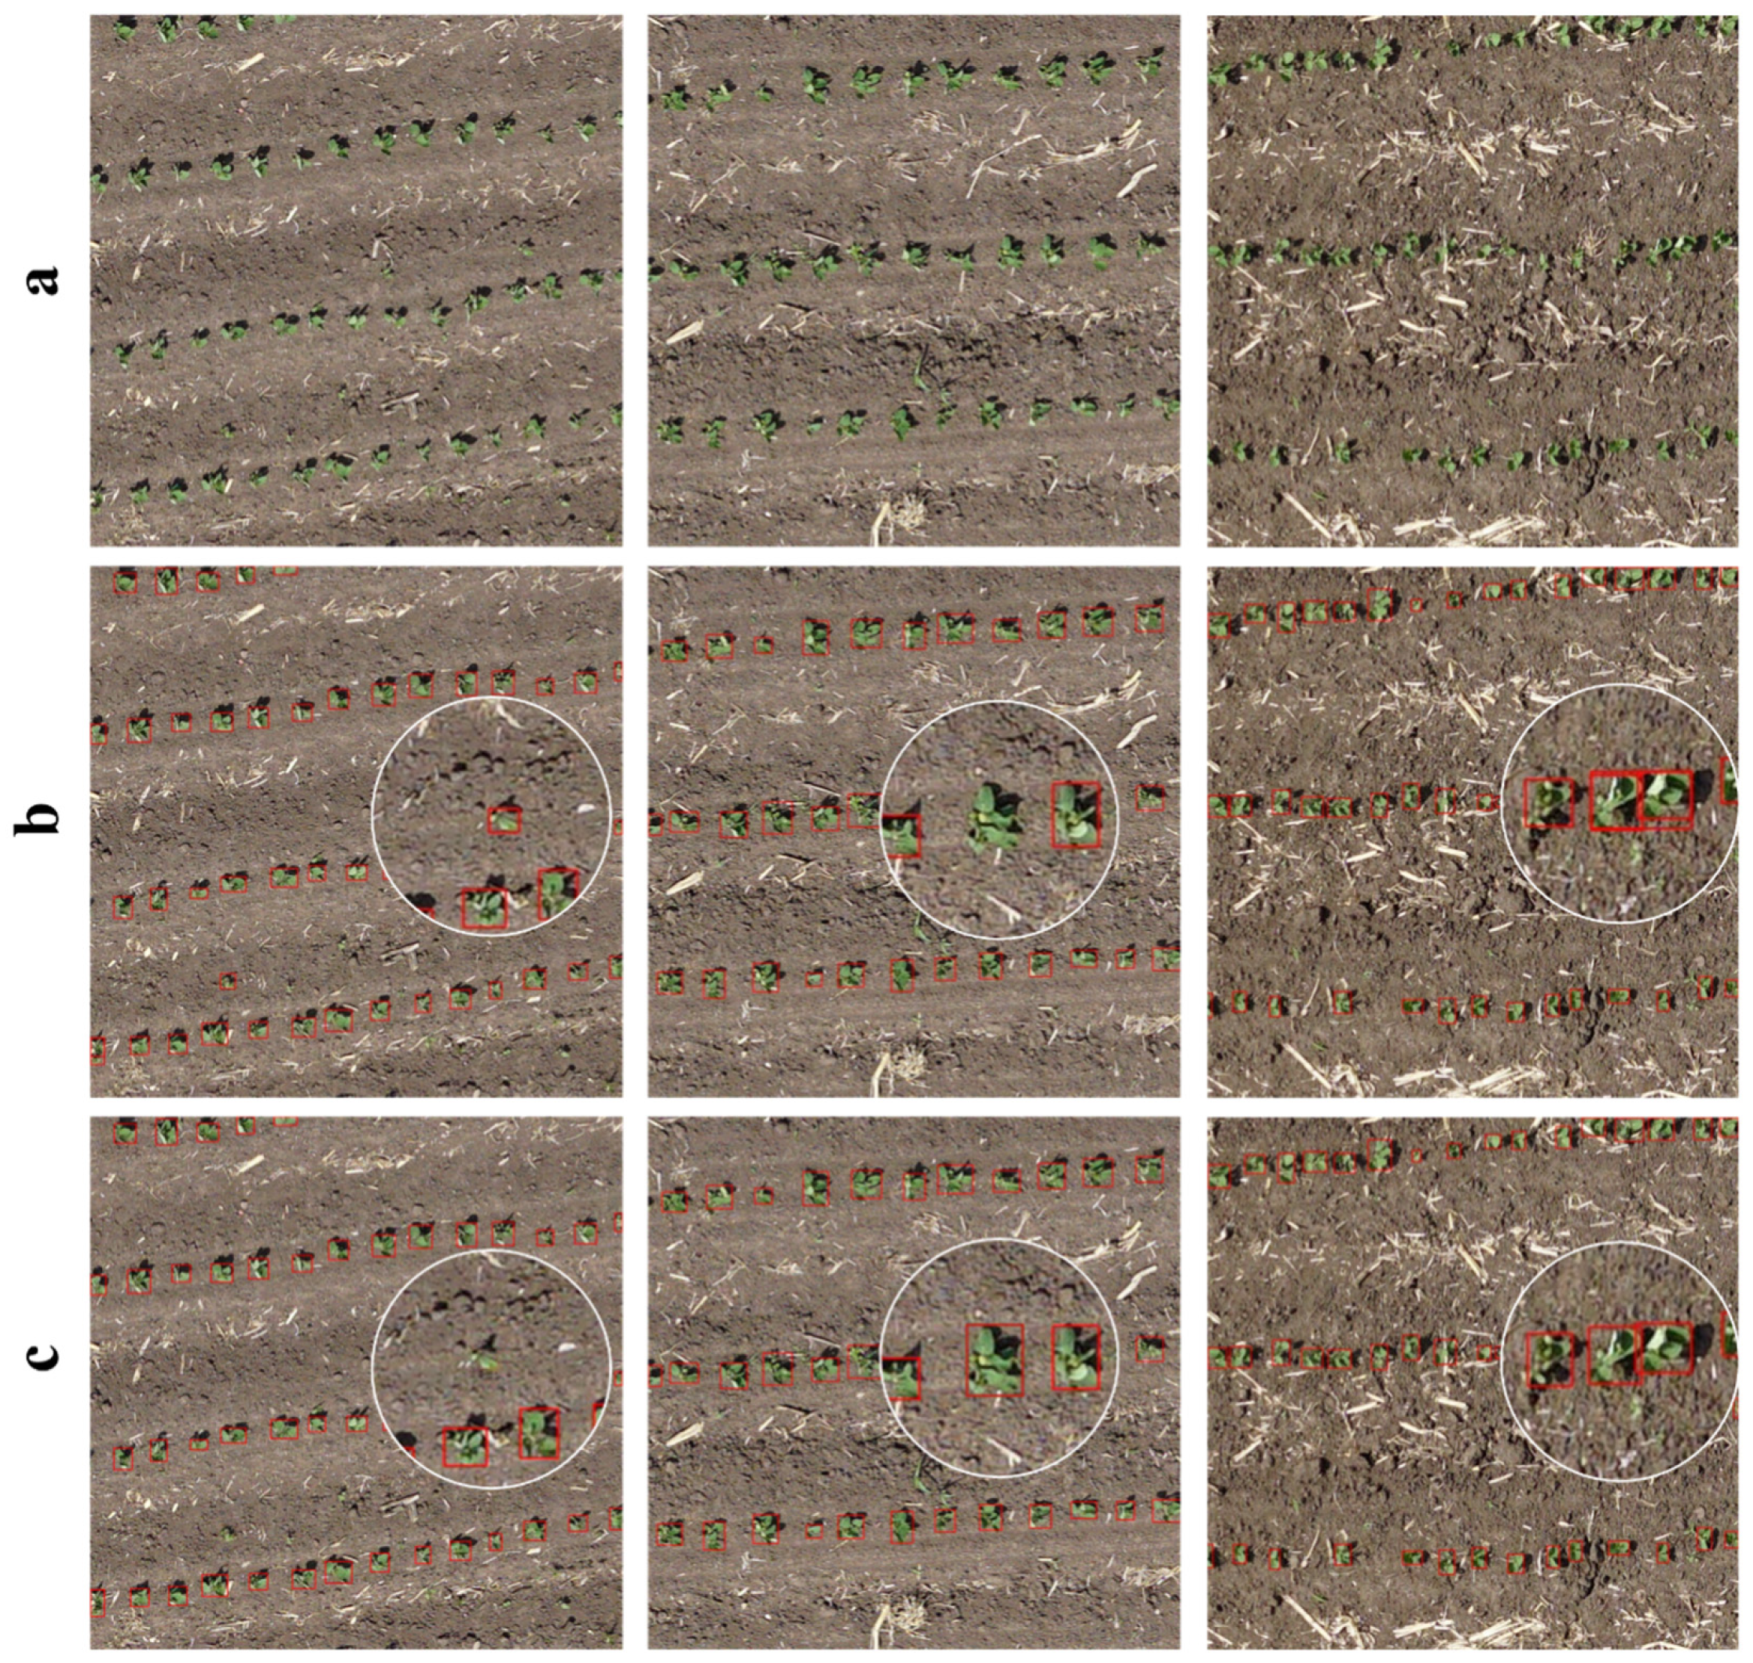
The selected examples illustrate the detection behavior of SSDNet under the depicted conditions; they do not establish the absence of missed or false detections across the test set. To assess detection reliability in complex field environments, three images of growing soybean seedlings were randomly selected to compare YOLOv11n and SSDNet. As shown in Figure 12a, seedlings are arranged neatly along planting rows; however, weeds with morphology, color, and size similar to seedlings create strong visual interference. YOLOv11n shows obvious false detections, whereas SSDNet distinguishes seedlings from similar weeds and suppresses such errors. In Figure 12b, although YOLOv11n detects most seedlings, missed detections and duplicate annotations remain. In the selected example shown in Figure 12c, no apparent missed or false detections were observed for SSDNet, and its bounding boxes aligned more closely with seedling contours. These observations illustrate SSDNet’s detection behavior in the selected field scenes.
Figure 12.
Comparison of detection results. (a) original images; (b) detection results of YOLOv11n; (c) detection results of SSDNet.
3.4. Soybean Seedling Counting Model Testing and Evaluation
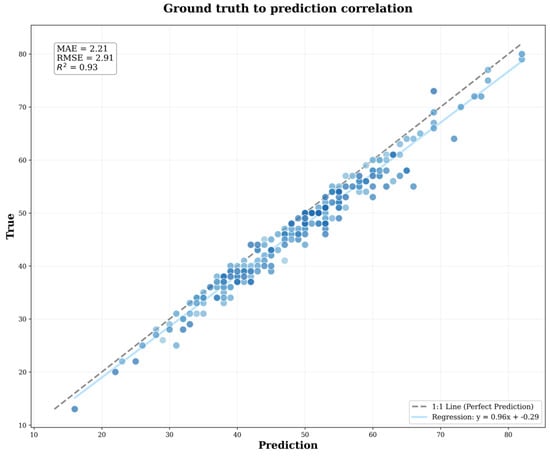
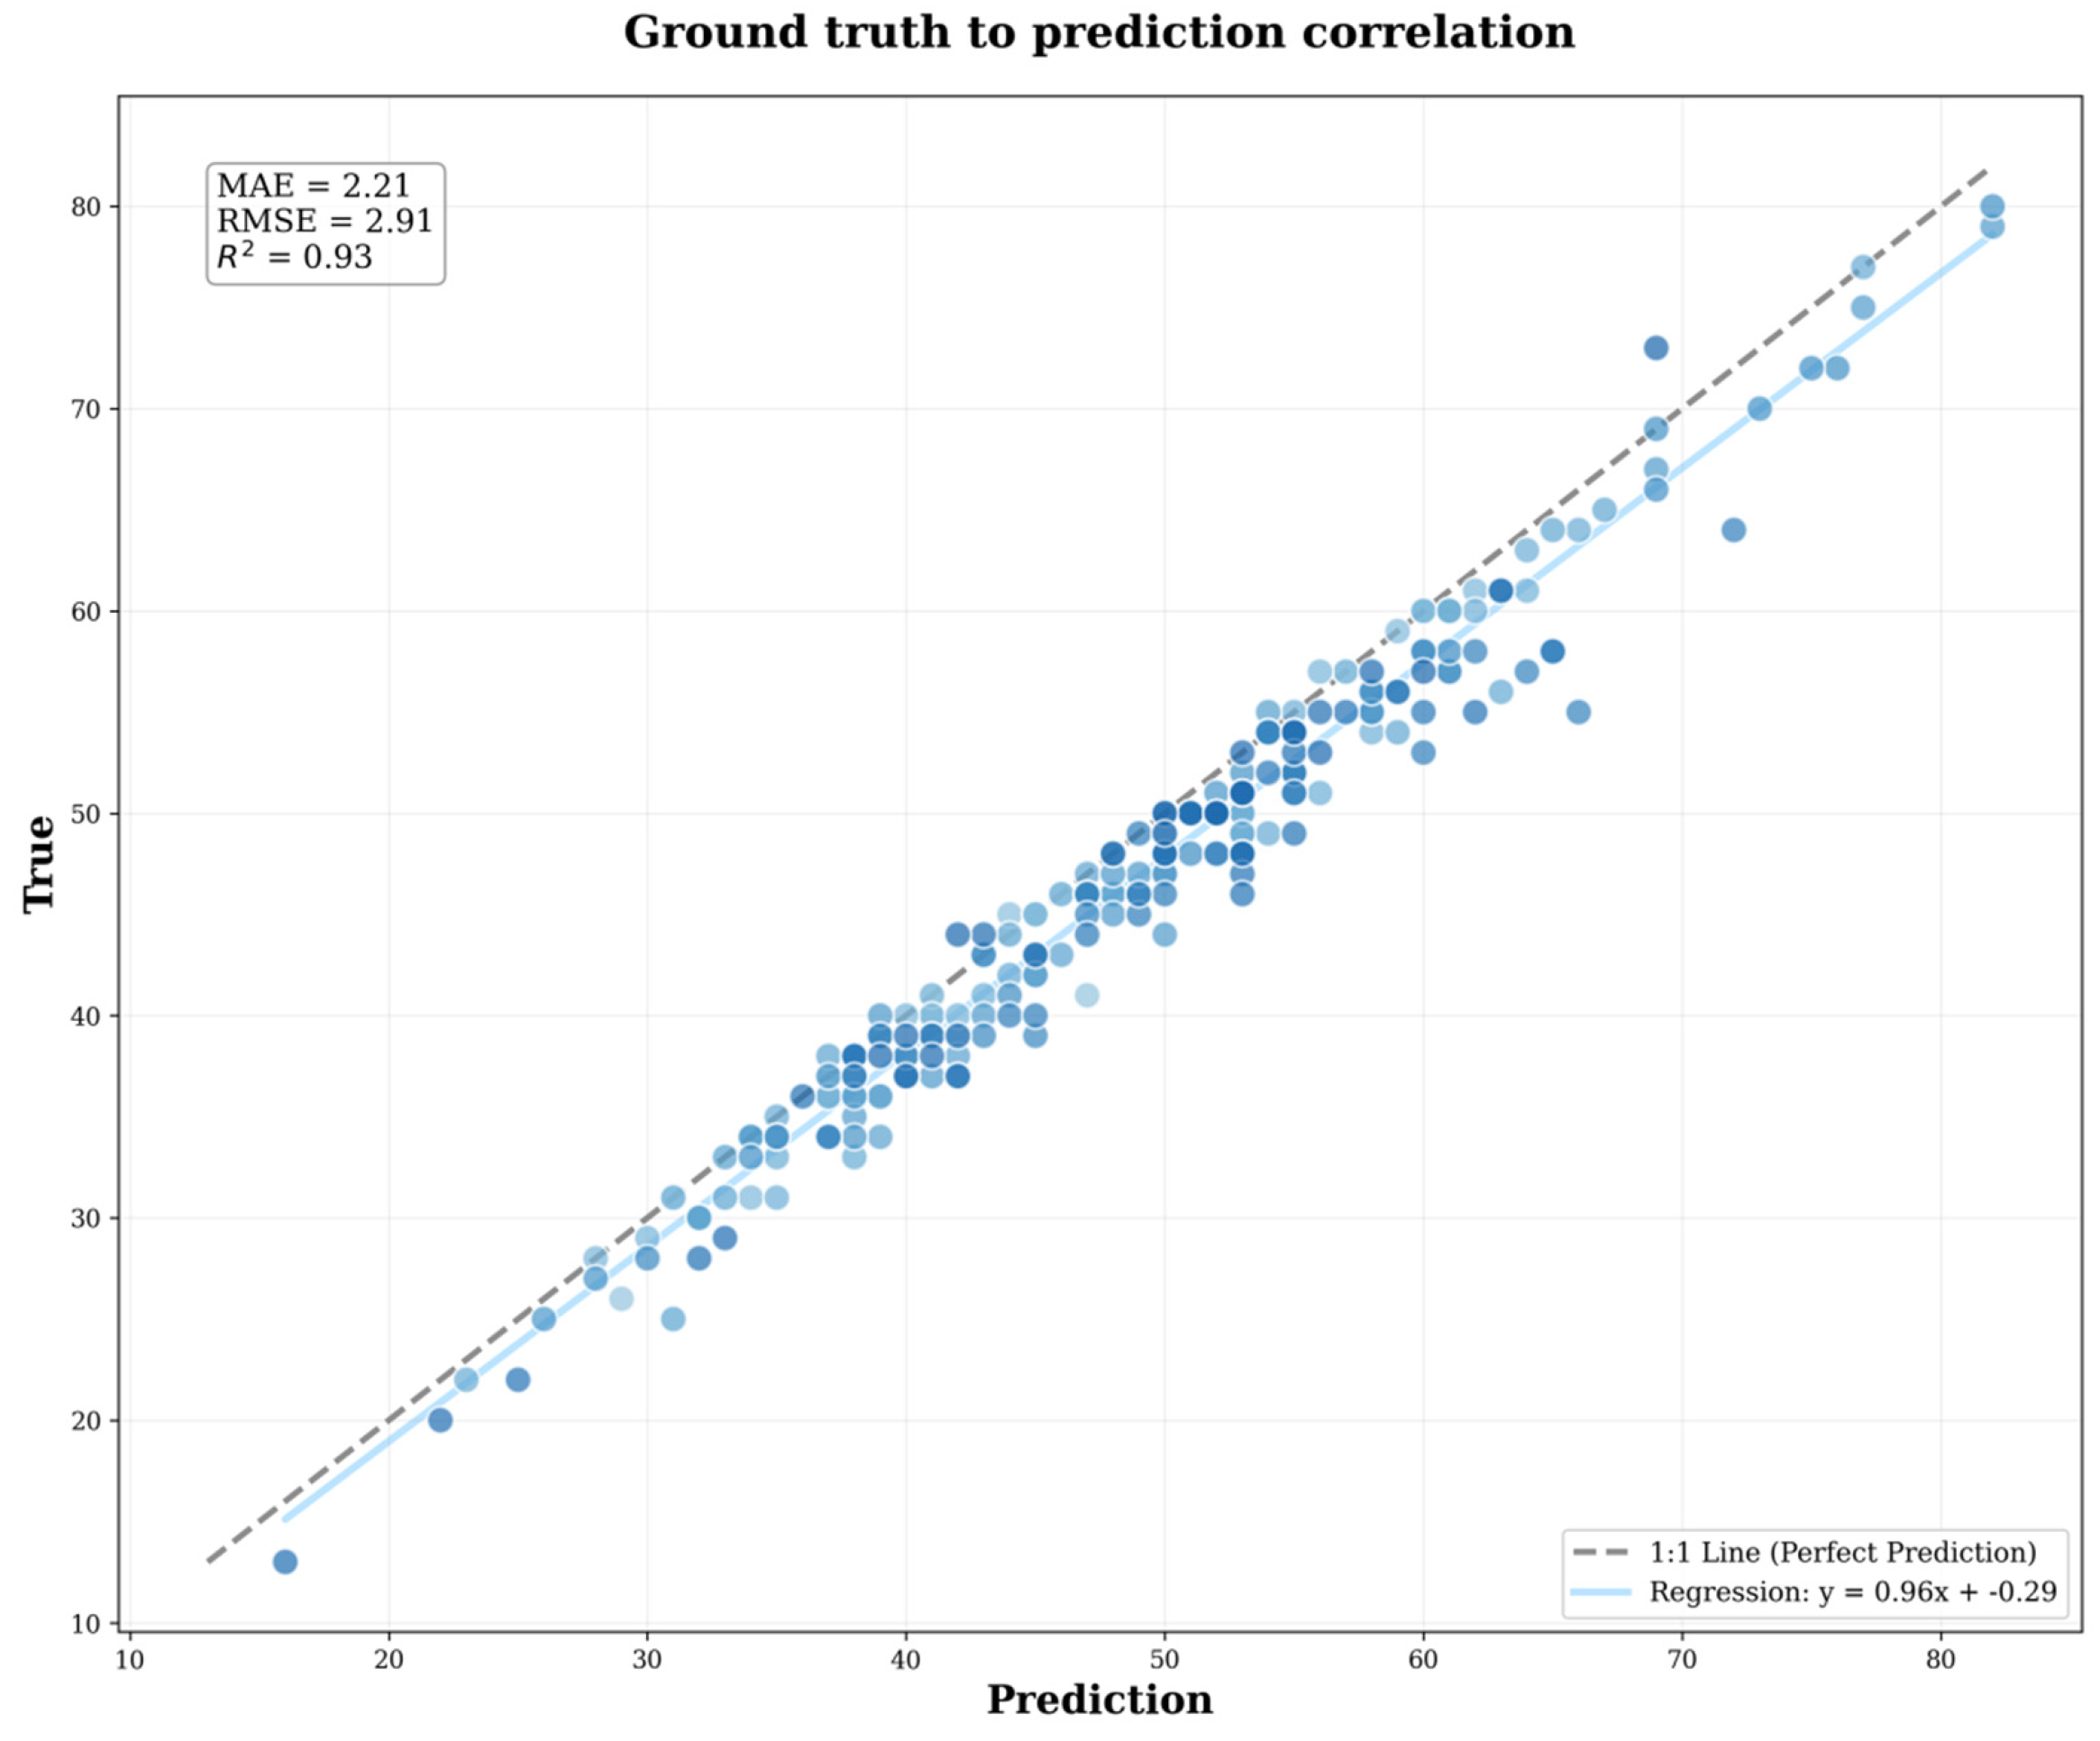
This study evaluated the counting performance of SSDNet by comparing automated and manual counts for 235 test images, as shown in Figure 13. The gray dashed line represents the 1:1 line (y = x), and the light blue solid line represents the linear regression line. Each blue scatter point represents one test image, and the different shades of blue have no specific meaning. Three researchers independently performed the manual counts by visual inspection. The counts were then reviewed and cross-checked. Images with discrepancies were examined again to determine the final reference counts. SSDNet achieved an R2 of 0.93. The mean absolute error (MAE) and root mean square error (RMSE) were 2.21 and 2.91 seedlings, respectively. The manual count was subtracted from the automated count for each image. These differences were then averaged, yielding a mean bias (Bias) of 2.11 seedlings. The absolute counting error for each image was divided by the corresponding manual count. These ratios were averaged and expressed as a percentage, yielding a mean absolute percentage error (mAPE) of 5.04%. Small counting errors were related to very small targets and severe seedling occlusion in UAV images. Nevertheless, the metrics indicate that these errors had a limited impact on overall counting performance.
Figure 13.
The fitting of SSDNet seedling counts on the test set.
3.5. SSDNet Combined with SAHI for Rapid Soybean Seedling Detection
Because soybean seedlings appear as small targets in UAV orthomosaic images, sliced inference alone is sufficient for whole-field counting while avoiding redundant detections. Therefore, we integrated SSDNet with SAHI, performed sliced detection using the settings in Table 4, mapped the predicted bounding boxes back to the original image, and applied NMS to remove duplicate detections. Full-image inference was disabled. On this basis, the impact of SAHI on detection performance is first verified, followed by a sensitivity analysis of slice size and overlap ratio to determine the default configuration. Subsequently, whole-field counting is conducted for 675 breeding plots, and the results are compared with manual surveys through sampling to validate counting accuracy.
Table 4.
SAHI parameter settings.
3.5.1. Sensitivity Analysis of SAHI Slice Parameters
With the parameters fixed in Table 4 and full-image auxiliary inference disabled, a sensitivity analysis of slice size and overlap ratio was conducted. Table 5 summarizes processing efficiency and detection performance under nine combinations of slice size and overlap ratio. The 640 × 640 configuration with a 30% overlap ratio yielded the highest average confidence, with 39,336 detected targets and an end-to-end processing time of approximately 9.8 min. In comparison, the 800 × 800 configuration with a 30% overlap ratio required about 8.9 min but yielded lower average confidence. Although the 640 × 640 configuration with a 50% overlap ratio detected about 3.9% more targets, the processing time increased to approximately 15.7 min. The 640 × 640 configuration with 30% overlap was adopted as an empirical setting for subsequent whole-field counting.
Table 5.
Processing efficiency and detection results under different SAHI slice sizes and overlap ratios.
3.5.2. Whole-Field Counting Results
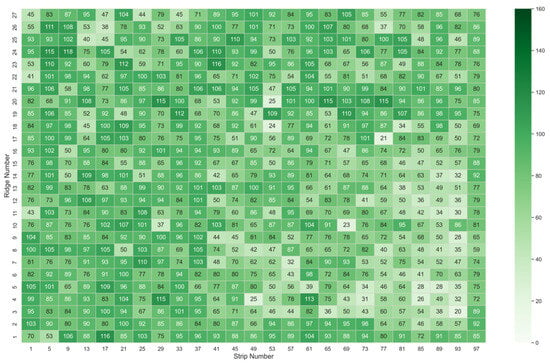
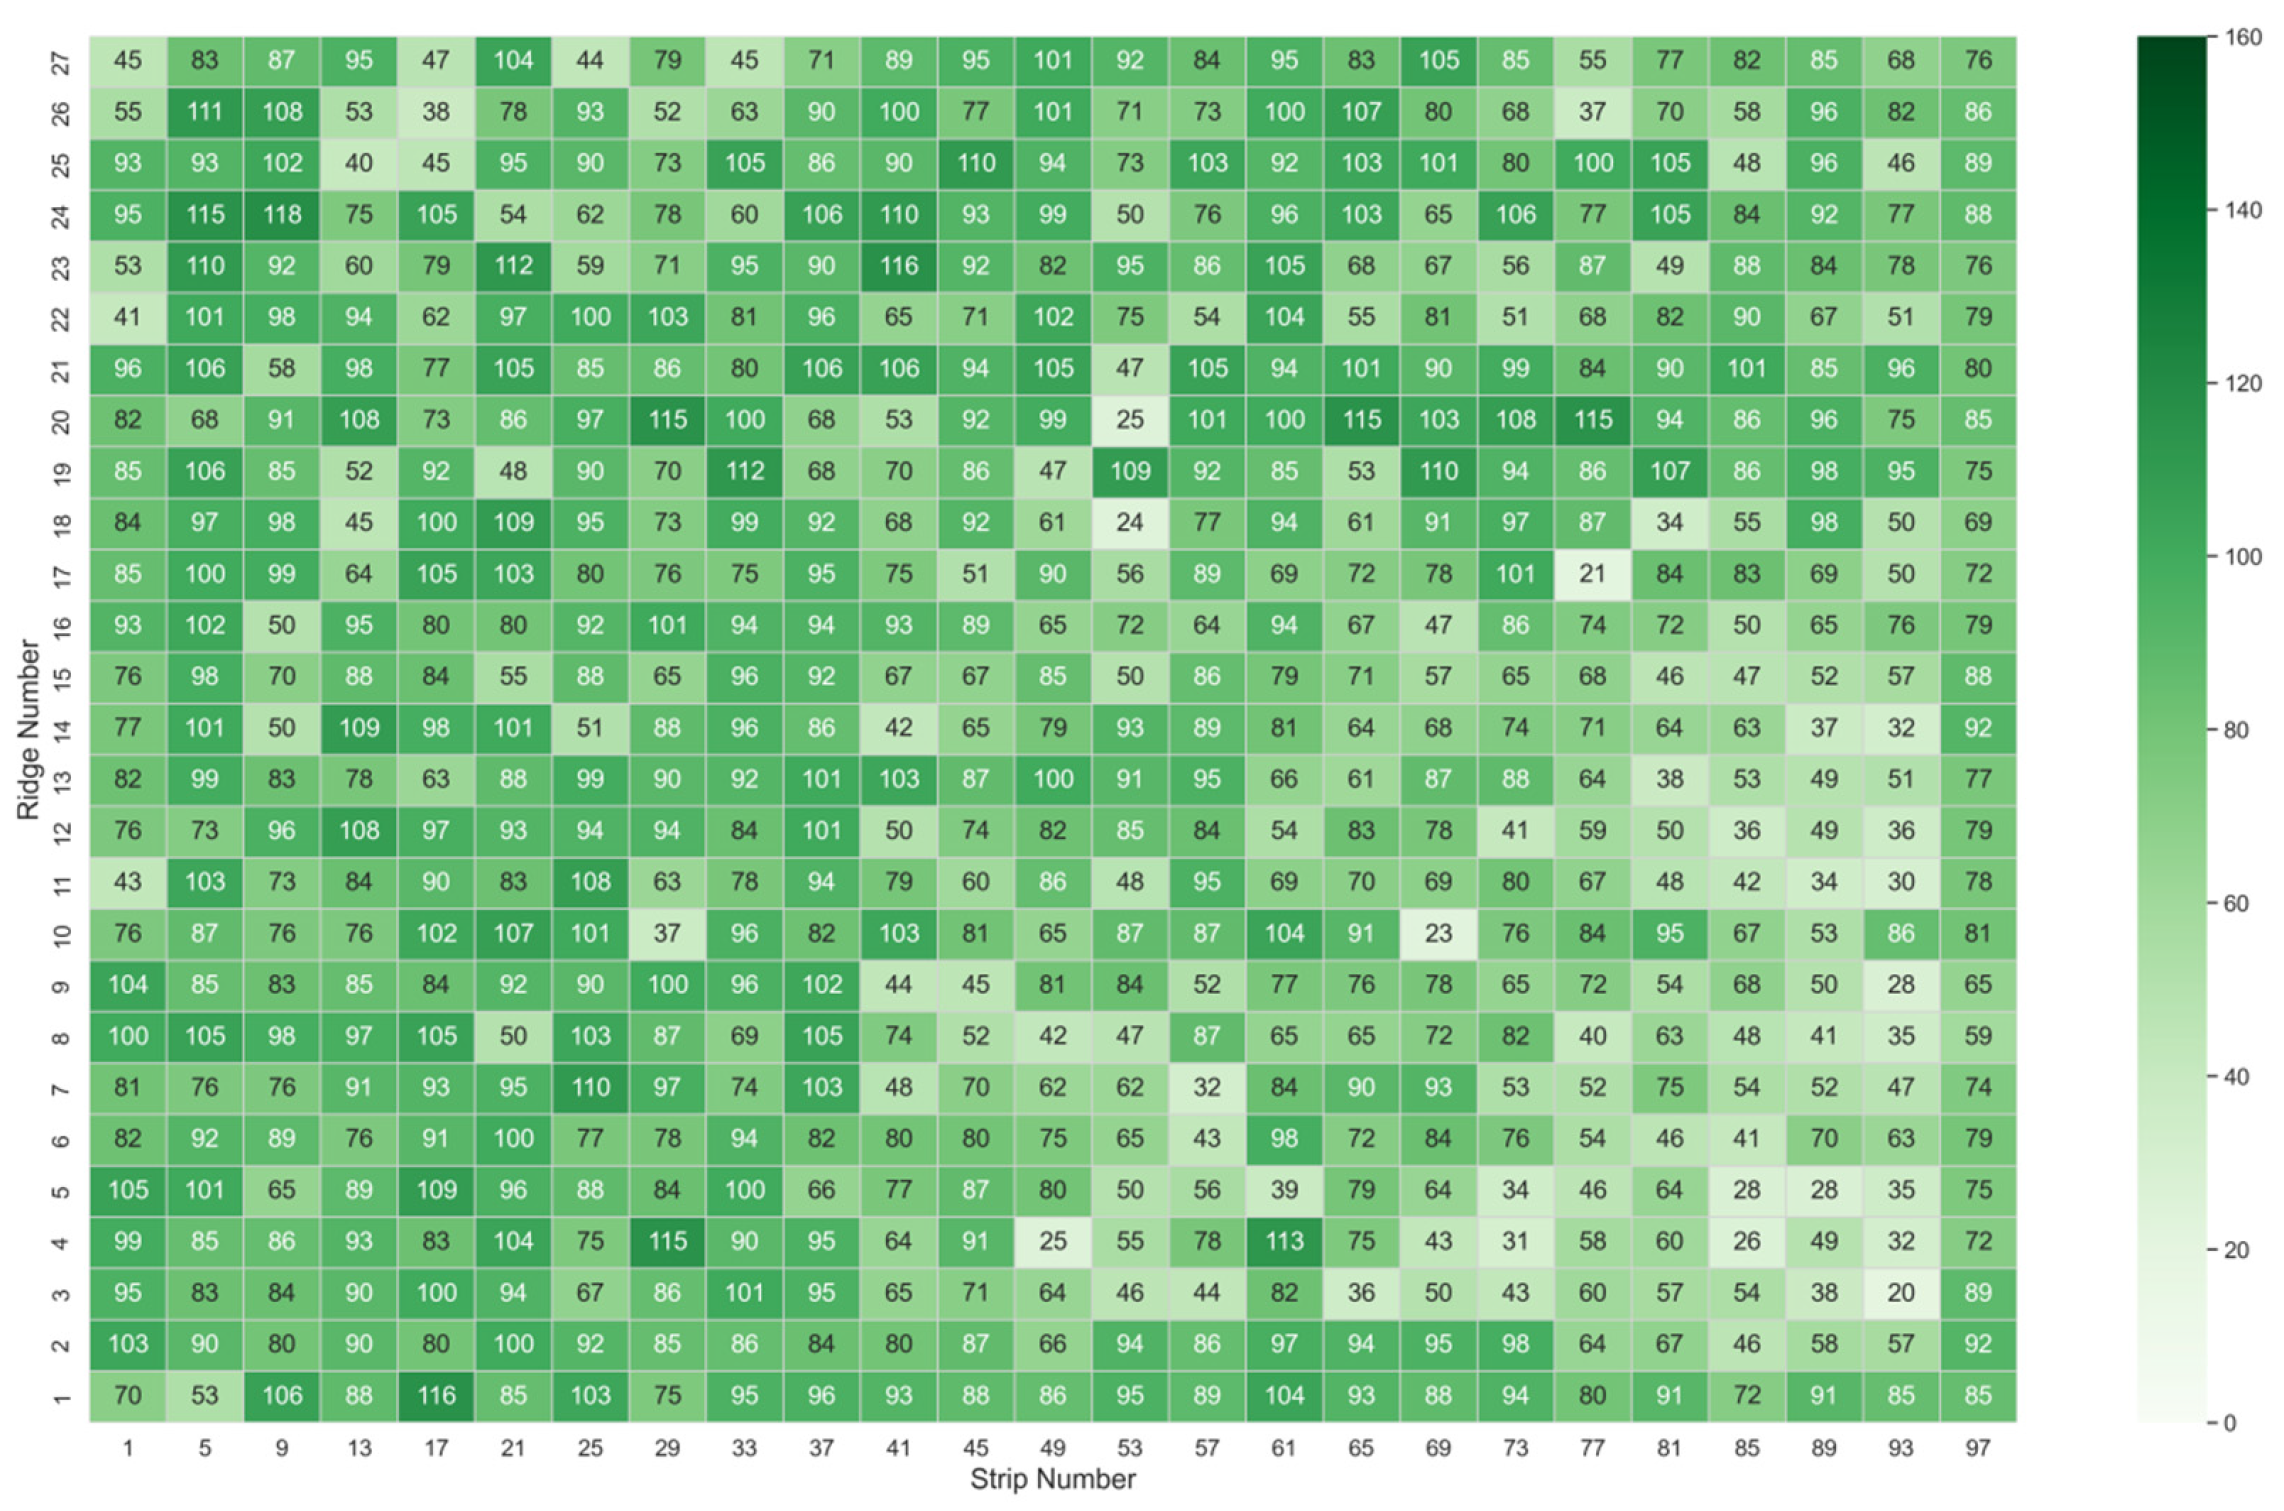
To comprehensively evaluate the detection performance of SSDNet combined with SAHI in field scenarios, whole-field detection was performed across an experimental field containing 675 plots. The field was divided into multiple horizontal planting strips, each containing several planting ridges. As shown in Figure 14, seedling emergence counts across the field ranged from 50 to 110 seedlings per plot, showing a banded spatial distribution with local clustering. The middle region, corresponding to strips 41 to 61, formed a continuous band of medium to high density with relatively uniform emergence counts. The right side and edge region, corresponding to strips 73 to 93, contained multiple low-density plots, with some areas below 60 seedlings.
Figure 14.
Soybean seedling counting results in the experimental field.
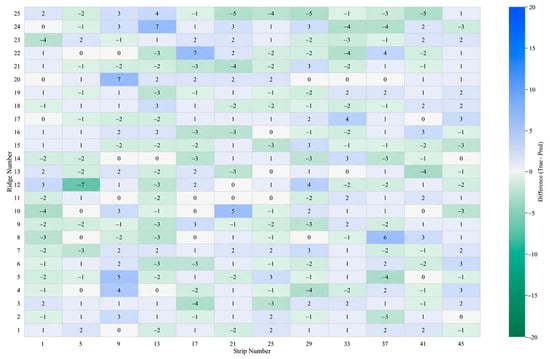
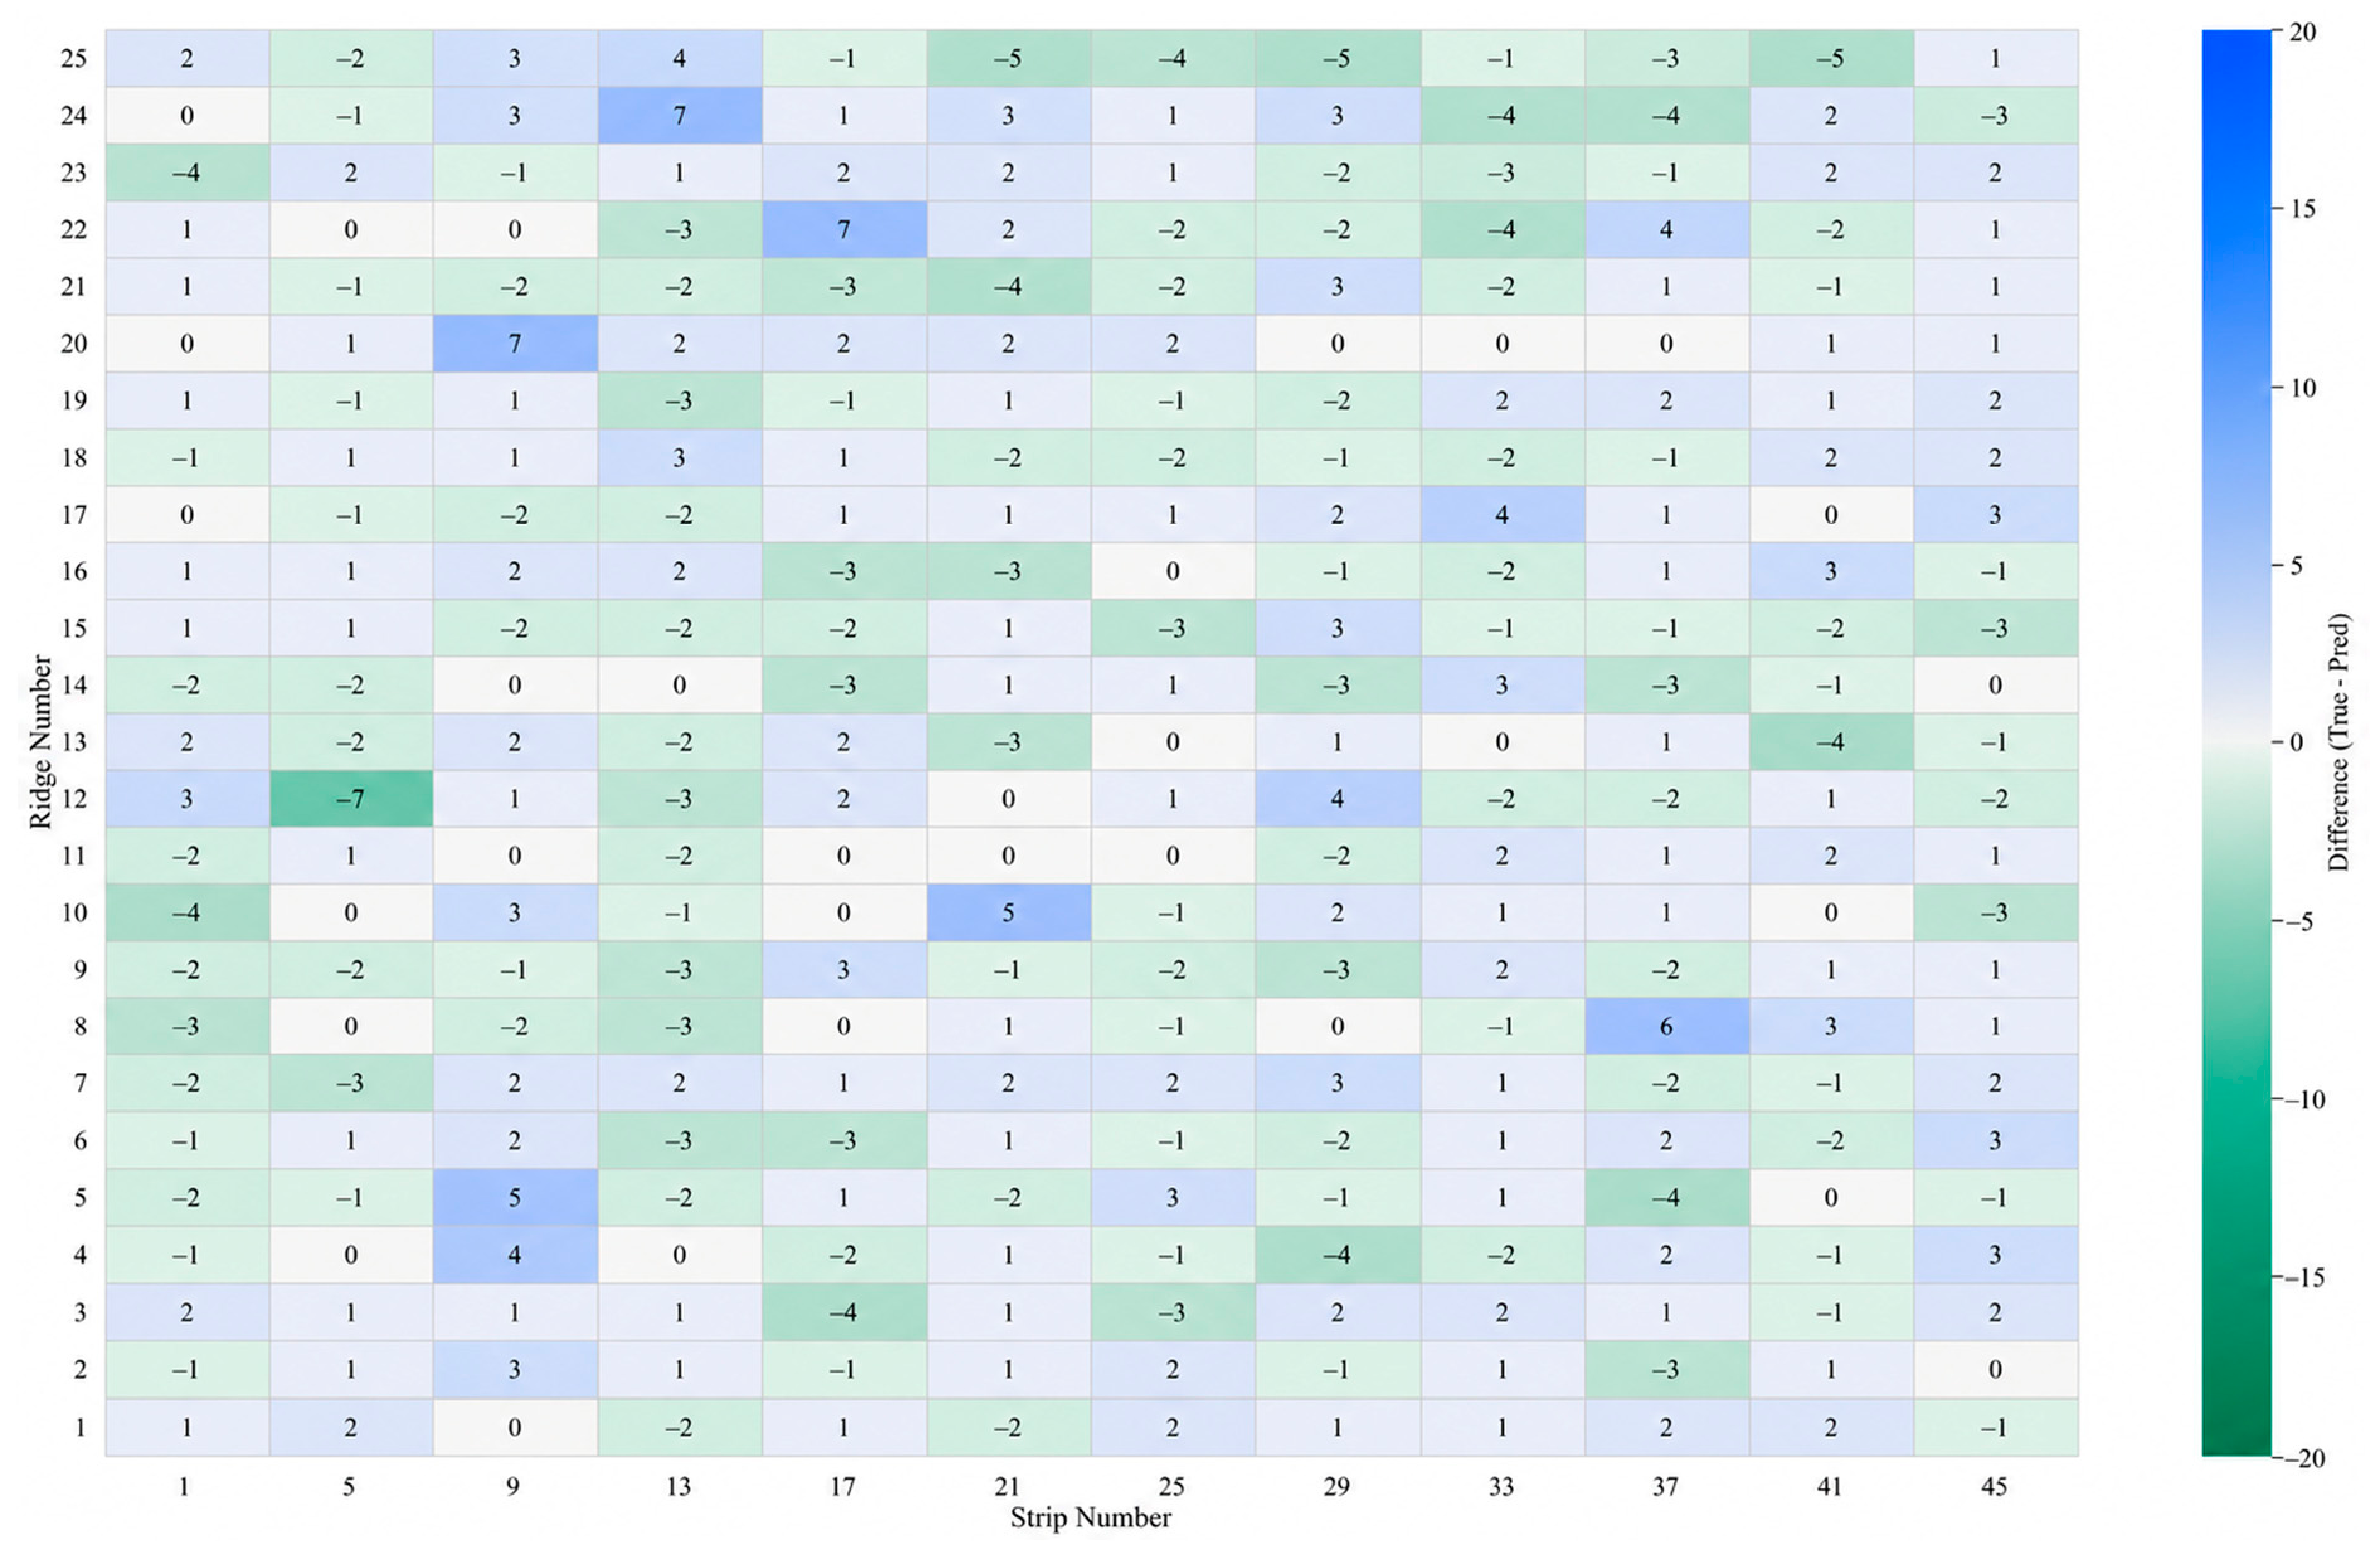
To further verify counting accuracy, 300 plots that did not overlap with the 50 training plots were selected from the 675 plots. These validation plots covered ridge numbers from 1 to 25 and strip numbers from 1 to 45. Manual emergence counts were obtained through visual surveys along planting rows without reference to model outputs, while automatic counts were derived from orthomosaic images using SSDNet with SAHI. The deviation heatmap in Figure 15 shows the plot-level differences between automatic and manual counts. The MAE and RMSE were 1.82 and 2.22 seedlings, respectively. In total, 98.33% of the plots had absolute counting errors within five seedlings, and the maximum absolute error was seven seedlings. These results indicate that the automatic counting results of SSDNet combined with SAHI were highly consistent with the manual field survey results.
Figure 15.
Soybean seedling counting deviation in the test plot.
4. Discussion
4.1. Lightweight Object Detection
In recent years, the increasing use of deep learning in agriculture has greatly expanded model size and computational complexity, creating challenges for deployment on edge devices. To meet real-time requirements in resource-constrained scenarios, lightweight object detection models have become an important research focus. Classic lightweight architectures, such as MobileNet, ShuffleNet, and CSPNet, reduce computational costs through efficient convolution operations while maintaining feature extraction capability. For example, Kim et al. [53] developed an MT-MobileNet-based driver monitoring system for real-time driver state recognition on low-power edge devices, while Chen et al. [54] achieved 97.9% accuracy in garbage classification with only 1.3 million parameters.
The model proposed in this study achieves a favorable balance between accuracy and computational cost, meeting the basic requirements of practical applications. However, further optimization is still needed for broader edge deployment and lower-latency scenarios. Existing studies mainly focus on static network optimization, such as lightweight convolution modules and channel adjustment, whereas deeper compression techniques remain less explored. Future work could combine structured pruning and knowledge distillation to further reduce model size and inference latency while maintaining detection accuracy.
4.2. Semi-Supervised Iterative Labeling Strategy
Acquiring high-quality annotations is critical for deep learning models. Annotating soybean seedling field images is time consuming and labor intensive due to dense targets, small scale, and weed interference. Manual annotation is accurate but impractical for large datasets. Semi-automatic methods combine automated tools with manual corrections, balancing efficiency and accuracy. To address this, we propose a semi-supervised iterative annotation strategy. The model automatically labels unlabeled data, expanding the dataset and improving processing efficiency. This semi-automatic approach has been validated in soybean seedling detection, significantly boosting annotation efficiency. Iterative predictions with manual corrections make field data annotation more efficient.
In the future, integrating large-scale pretrained models and self-supervised learning could further enhance this strategy. Pretrained models provide high-quality initial pseudo labels; combined with manual corrections, they improve initial annotation accuracy. This reduces human intervention and accelerates data generation, making it suitable for large-scale tasks.
4.3. Model Field Counting Performance and Analysis
SSDNet combined with SAHI showed potential for efficient field counting under the tested conditions. Nevertheless, counting accuracy still needs improvement in several respects. Figure 15 shows that under extreme conditions, SSDNet misses some soybean seedlings. The validation results of this study are primarily applicable to seedling emergence surveys and breeding plot evaluations at the seedling stage under consistent flight altitude, uniform imaging specifications, and similar field management practices.
This study did not include comparisons of SAHI configurations against ground truth, controlled comparisons of inference options, or a comprehensive uncertainty assessment. Future work should therefore prioritize evaluation using spatially independent data from multiple environments, along with systematic assessments of configuration effects, error sources, and repeatability. Additional field data covering more varieties and other crop types should also be collected to assess the transferability of the proposed model.
Future research could also explore adaptive slicing strategies based on image resolution and local target density to improve automation. For higher-throughput surveys or near-real-time onboard applications, further testing of model compression, hardware adaptation, dynamic flight, and illumination variation can be conducted by deploying lightweight SSDNet on different computing platforms.
5. Conclusions
This study addresses the challenges of detecting soybean seedlings of multiple varieties and growth stages in complex field environments. A UAV image dataset covering multiple soybean varieties at the seedling stage was constructed, and a lightweight object detection model, SSDNet, was proposed. The model uses the StarNet backbone, the C3k2-PFDConv module, and LSCD to reduce computational complexity while maintaining high detection accuracy. Experimental results show that SSDNet achieves an mAP@50 of 98.7%, with only 1.57M parameters and an inference time of 5.4 ms per image. Its model size is 37.03% smaller than that of YOLOv11n. When combined with SAHI, SSDNet completed seedling detection and counting in high-resolution imagery of 675 breeding plots in just 9.8 min. Validation on 300 selected plots showed an absolute counting error of no more than 7 seedlings per plot compared with manual counts. Under the breeding field conditions and UAV image acquisition protocol tested in this study, SSDNet enables accurate and efficient soybean seedling counting and provides technical support for emergence assessment in breeding fields.
Author Contributions
Software, M.S., D.C., J.T. and R.Z.; investigation, M.S., D.C., J.T. and R.Z.; data curation, M.S.; writing—original draft preparation, M.S.; writing—review and editing, M.S., D.C., J.T., R.Z., T.S., Z.Z. and Q.C.; supervision, R.Z. and J.T.; project administration, R.Z. All authors have read and agreed to the published version of the manuscript.
Funding
This work was supported by the National Key R&D Program Project funded by the Ministry of Agriculture and Rural Affairs of the People’s Republic of China under Grant No. 2025YFD2300401; Research and Application of Key Technologies for Intelligent Farming Decision Platform (an Open Competition Project of Heilongjiang Province, China) under Grant No. 2021ZXJ05A03; the Programs for Science and Technology Development of Heilongjiang Province under Grant No. 2024ZX01A07; the Heilongjiang Province Key Research and Development Plan (Innovation Bases), China, under Grant No. JD2023GJ01-01; and the Heilongjiang Province Key Research and Development Plan (Innovation Bases), China, under Grant No. JD2023GJ01-08.
Institutional Review Board Statement
Not applicable.
Data Availability Statement
The data presented in this study are available on request from the corresponding authors.
Conflicts of Interest
The authors declare that they have no conflicts of interest. The funders had no role in the design of the study; in the collection, analyses, or interpretation of data; in the writing of the manuscript; or in the decision to publish the results.
References
- Karges, K.; Bellingrath-Kimura, S.D.; Watson, C.A.; Stoddard, F.L.; Halwani, M.; Reckling, M. Agro-economic prospects for expanding soybean production beyond its current northerly limit in europe. Eur. J. Agron. 2022, 133, 126415. [Google Scholar] [CrossRef] [Scilit]
- Hasan, N.; Suryani, E.; Hendrawan, R. Analysis of soybean production and demand to develop strategic policy of food self sufficiency: A system dynamics framework. Procedia Comput. Sci. 2015, 72, 605–612. [Google Scholar] [CrossRef] [Scilit]
- Khojely, D.M.; Ibrahim, S.E.; Sapey, E.; Han, T. History, current status, and prospects of soybean production and research in sub-saharan africa. Crop J. 2018, 6, 226–235. [Google Scholar] [CrossRef] [Scilit]
- Lamichhane, J.R.; Aubertot, J.-N.; Champolivier, L.; Debaeke, P.; Maury, P. Combining experimental and modeling approaches to understand genotype x sowing date x environment interaction effects on emergence rates and grain yield of soybean. Front. Plant Sci. 2020, 11, 558855. [Google Scholar] [CrossRef] [Scilit] [PubMed]
- Riera, L.G.; Carroll, M.E.; Zhang, Z.; Shook, J.M.; Ghosal, S.; Gao, T.; Singh, A.; Bhattacharya, S.; Ganapathysubramanian, B.; Singh, A.K.; et al. Deep multiview image fusion for soybean yield estimation in breeding applications. Plant Phenomics 2021, 2021, 9846470. [Google Scholar] [CrossRef] [Scilit] [PubMed]
- Gao, F.; Anderson, M.; Daughtry, C.; Karnieli, A.; Hively, D.; Kustas, W. A within-season approach for detecting early growth stages in corn and soybean using high temporal and spatial resolution imagery. Remote Sens. Environ. 2020, 242, 111752. [Google Scholar] [CrossRef] [Scilit]
- Minervini, M.; Scharr, H.; Tsaftaris, S.A. Image analysis: The new bottleneck in plant phenotyping [applications corner]. IEEE Signal Process. Mag. 2015, 32, 126–131. [Google Scholar] [CrossRef] [Scilit]
- Quan, L.; Feng, H.; Lv, Y.; Wang, Q.; Zhang, C.; Liu, J.; Yuan, Z. Maize seedling detection under different growth stages and complex field environments based on an improved faster r-CNN. Biosyst. Eng. 2019, 184, 1–23. [Google Scholar] [CrossRef] [Scilit]
- García-Martínez, H.; Flores-Magdaleno, H.; Khalil-Gardezi, A.; Ascencio-Hernández, R.; Tijerina-Chávez, L.; Vázquez-Peña, M.A.; Mancilla-Villa, O.R. Digital count of corn plants using images taken by unmanned aerial vehicles and cross correlation of templates. Agronomy 2020, 10, 469. [Google Scholar] [CrossRef] [Scilit]
- Li, B.; Xu, X.; Han, J.; Zhang, L.; Bian, C.; Jin, L.; Liu, J. The estimation of crop emergence in potatoes by UAV RGB imagery. Plant Methods 2019, 15, 15. [Google Scholar] [CrossRef] [Scilit] [PubMed]
- Zhao, B.; Zhang, J.; Yang, C.; Zhou, G.; Ding, Y.; Shi, Y.; Zhang, D.; Xie, J.; Liao, Q. Rapeseed seedling stand counting and seeding performance evaluation at two early growth stages based on unmanned aerial vehicle imagery. Front. Plant Sci. 2018, 9, 1362. [Google Scholar] [CrossRef] [Scilit] [PubMed]
- Chen, Y.; Wu, Z.; Zhao, B.; Fan, C.; Shi, S. Weed and corn seedling detection in field based on multi feature fusion and support vector machine. Sensors 2020, 21, 212. [Google Scholar] [CrossRef] [Scilit] [PubMed]
- Wang, Z.; Li, H.; Zhu, Y.; Xu, T. Review of plant identification based on image processing. Arch. Comput. Methods Eng. 2017, 24, 637–654. [Google Scholar] [CrossRef] [Scilit]
- Zhou, C.; Yang, G.; Liang, D.; Yang, X.; Xu, B. An integrated skeleton extraction and pruning method for spatial recognition of maize seedlings in MGV and UAV remote images. IEEE Trans. Geosci. Remote Sens. 2018, 56, 4618–4632. [Google Scholar] [CrossRef] [Scilit]
- Wang, S.; Zhang, B.; Che, Y.; Zheng, G.; Ren, Y.; Xi, L.; Ma, X.; Xiong, S. A wheat seedling detection model based on efficient feature extraction and coordinate attention mechanism. Eur. J. Agron. 2026, 175, 127993. [Google Scholar] [CrossRef] [Scilit]
- Lin, Y.; Chen, T.; Liu, S.; Cai, Y.; Shi, H.; Zheng, D.; Lan, Y.; Yue, X.; Zhang, L. Quick and accurate monitoring peanut seedlings emergence rate through UAV video and deep learning. Comput. Electron. Agric. 2022, 197, 106938. [Google Scholar] [CrossRef] [Scilit]
- Tan, C.; Li, C.; He, D.; Song, H. Anchor-free deep convolutional neural network for tracking and counting cotton seedlings and flowers. Comput. Electron. Agric. 2023, 215, 108359. [Google Scholar] [CrossRef] [Scilit]
- Wu, H.; Kang, J.; Li, H. Soybean seedling detection and counting from UAV images based on an improved YOLOv8 Network. Int. Arch. Photogramm. Remote Sens. Spat. Inf. Sci. 2024, XLVIII-1-2024, 727–735. [Google Scholar] [CrossRef] [Scilit]
- Wang, D.; Huang, Z.; Yuan, H.; Liang, Y.; Tu, S.; Yang, C. Target soybean leaf segmentation model based on leaf localization and guided segmentation. Agriculture 2023, 13, 1662. [Google Scholar] [CrossRef] [Scilit]
- Xiang, S.; Wang, S.; Xu, M.; Wang, W.; Liu, W. YOLO POD: A fast and accurate multi-task model for dense soybean pod counting. Plant Methods 2023, 19, 8. [Google Scholar] [CrossRef] [Scilit] [PubMed]
- Guo, G.; Lai, S.; Wu, Q.; Shou, Y.; Shi, W. Enhancing domain adaptation for plant diseases detection through masked image consistency in multi-granularity alignment. Expert Syst. Appl. 2025, 276, 127101. [Google Scholar] [CrossRef] [Scilit]
- Ning, X.; Gao, S.; Liu, J.; Cheng, L.; Zhang, Y. Few-shot agricultural disease detection method using contextual attention generation. Alex. Eng. J. 2025, 130, 101–114. [Google Scholar] [CrossRef] [Scilit]
- Liu, C.; Zhong, L.; Wang, J.; Huang, J.; Wang, Y.; Guan, M.; Li, X.; Zheng, H.; Hu, X.; Ma, X.; et al. Grain-YOLO: An improved lightweight YOLO v8 and its android deployment for rice grains detection. Comput. Electron. Agric. 2025, 237, 110757. [Google Scholar] [CrossRef] [Scilit]
- Jiang, T.; Li, L.; Zhang, Z.; Yu, X.; Zhu, Y.; Li, L.; Liu, Y.; Bai, Y.; Tang, Z.; Liu, S.; et al. YOLO-light-pruned: A lightweight model for monitoring maize seedling count and leaf age using near-ground and UAV RGB images. Artif. Intell. Agric. 2026, 16, 164–186. [Google Scholar] [CrossRef] [Scilit]
- Gao, C.; He, B.; Guo, W.; Qu, Y.; Wang, Q.; Dong, W. SCS-YOLO: A real-time detection model for agricultural diseases—A case study of wheat fusarium head blight. Comput. Electron. Agric. 2025, 238, 110794. [Google Scholar] [CrossRef] [Scilit]
- Cheng, Z.; Huang, R.; Qian, R.; Dong, W.; Zhu, J.; Liu, M. A lightweight crop pest detection method based on convolutional neural networks. Appl. Sci. 2022, 12, 7378. [Google Scholar] [CrossRef] [Scilit]
- Feng, P.; Nie, Z.; Li, G. Field-deployable lightweight YOLOv8n for real-time detection and counting of maize seedlings using UAV RGB imagery. Front. Plant Sci. 2025, 16, 1639533. [Google Scholar] [CrossRef] [Scilit] [PubMed]
- Zhou, Y.; Zhao, B. You only look once 11 (YOLO11) optimization for lightweight and accurate plant detection in uncrewed aerial vehicle imagery. PeerJ Comput. Sci. 2025, 11, e3322. [Google Scholar] [CrossRef] [Scilit]
- Feng, A.; Zhou, J.; Vories, E.; Sudduth, K.A. Evaluation of cotton emergence using UAV-based narrow-band spectral imagery with customized image alignment and stitching algorithms. Remote Sens. 2020, 12, 1764. [Google Scholar] [CrossRef] [Scilit]
- Feng, Y.; Chen, W.; Ma, Y.; Zhang, Z.; Gao, P.; Lv, X. Cotton Seedling Detection and Counting Based on UAV Multispectral Images and Deep Learning Methods. Remote Sens. 2023, 15, 2680. [Google Scholar] [CrossRef] [Scilit]
- Feng, A.; Zhou, J.; Vories, E.; Sudduth, K.A. Evaluation of cotton emergence using UAV-based imagery and deep learning. Comput. Electron. Agric. 2020, 177, 105711. [Google Scholar] [CrossRef] [Scilit]
- Liu, S.; Yin, D.; Feng, H.; Li, Z.; Xu, X.; Shi, L.; Jin, X. Estimating maize seedling number with UAV RGB images and advanced image processing methods. Precis. Agric. 2022, 23, 1604–1632. [Google Scholar] [CrossRef] [Scilit]
- Liu, Y.; She, J.; Song, Y.; Liu, Z.; Xu, H.; Yuan, Q.; Qi, N. A unified framework for small object analysis in UAV imagery: Tracking single target from multiple detected targets. Chin. J. Aeronaut. 2026, 39, 103917. [Google Scholar] [CrossRef] [Scilit]
- Hasan, A.S.M.M.; Diepeveen, D.; Laga, H.; Jones, M.G.K.; Sohel, F. Object-level benchmark for deep learning-based detection and classification of weed species. Crop Prot. 2024, 177, 106561. [Google Scholar] [CrossRef] [Scilit]
- Hruška, A.; Hamouz, P.; Lev, J.; Pavlíček, J.; Kroulík, M.; Hamouzová, K.; Košnarová, P.; Holec, J.; Kouřím, P. Weed detection in cabbage fields using RGB and NIR images. Smart Agric. Technol. 2025, 12, 101232. [Google Scholar] [CrossRef] [Scilit]
- Wang, X.; Aierken, N.; Zhou, X.; Yao, Z.; Yang, B.; Li, Y.; Feng, X. CSM-YOLO: An integrated lightweight framework for UAV-based detection and geospatial analysis of missing cotton seedlings. Smart Agric. Technol. 2026, 13, 101751. [Google Scholar] [CrossRef] [Scilit]
- Kirillov, A.; Mintun, E.; Ravi, N.; Mao, H.; Rolland, C.; Gustafson, L.; Xiao, T.; Whitehead, S.; Berg, A.C.; Lo, W.-Y.; et al. Segment Anything. In Proceedings of the IEEE/CVF International Conference on Computer Vision, Paris, France, 2–6 October 2023; pp. 4015–4026. [Google Scholar]
- Ma, X.; Dai, X.; Bai, Y.; Wang, Y.; Fu, Y. Rewrite the Stars. In Proceedings of the IEEE/CVF Conference on Computer Vision and Pattern Recognition, Seattle, WA, USA, 17–21 June 2024; pp. 5694–5703. [Google Scholar]
- Chen, J.; Kao, S.-H.; He, H.; Zhuo, W.; Wen, S.; Lee, C.-H.; Chan, S.-H.G. Run, Don’t Walk: Chasing Higher FLOPS for Faster Neural Networks. In Proceedings of the IEEE/CVF Conference on Computer Vision and Pattern Recognition, Vancouver, BC, Canada, 18–22 June 2023; pp. 12021–12031. [Google Scholar]
- Chen, L.; Gu, L.; Li, L.; Yan, C.; Fu, Y. Frequency Dynamic Convolution for Dense Image Prediction. In Proceedings of the IEEE/CVF Conference on Computer Vision and Pattern Recognition, Nashville, TN, USA, 11–15 June 2025; pp. 30178–30188. [Google Scholar]
- Shen, Q.; Zhang, L.; Zhang, Y.; Li, Y.; Liu, S.; Xu, Y. Distracted driving behavior detection algorithm based on lightweight StarDL-YOLO. Electronics 2024, 13, 3216. [Google Scholar] [CrossRef] [Scilit]
- Akyon, F.C.; Altinuc, S.O.; Temizel, A. Slicing Aided Hyper Inference and Fine-tuning for Small Object Detection. In Proceedings of the 2022 IEEE International Conference on Image Processing (ICIP), Bordeaux, France, 16–19 October 2022; pp. 966–970. [Google Scholar] [CrossRef] [Scilit]
- Ren, S.; He, K.; Girshick, R.; Sun, J. Faster r-CNN: Towards real-time object detection with region proposal networks. IEEE Trans. Pattern Anal. Mach. Intell. 2017, 39, 1137–1149. [Google Scholar] [CrossRef] [Scilit] [PubMed]
- Liu, W.; Anguelov, D.; Erhan, D.; Szegedy, C.; Reed, S.; Fu, C.-Y.; Berg, A.C. SSD: Single Shot MultiBox Detector. In Computer Vision—ECCV 2016; Leibe, B., Matas, J., Sebe, N., Welling, M., Eds.; Springer: Cham, Switzerland, 2016; Volume 9905, pp. 21–37. [Google Scholar] [CrossRef] [Scilit]
- Jocher, G. YOLOv5 by Ultralytics. 2022. Available online: https://zenodo.org/records/7347926 (accessed on 19 September 2026). [CrossRef]
- Wang, C.-Y.; Bochkovskiy, A.; Liao, H.-Y.M. YOLOv7: Trainable Bag-of-Freebies Sets New State-of-the-Art for Real-Time Object Detectors. In Proceedings of the IEEE/CVF Conference on Computer Vision and Pattern Recognition, Vancouver, BC, Canada, 18–22 June 2023; pp. 7464–7475. [Google Scholar]
- Jocher, G.; Chaurasia, A.; Qiu, J. Ultralytics YOLOv8. 2023. Available online: https://docs.ultralytics.com/models/yolov8/ (accessed on 19 September 2026).
- Wang, C.-Y.; Yeh, I.-H.; Liao, H.-Y.M. YOLOv9: Learning What You Want to Learn Using Programmable Gradient Information. arXiv 2024, arXiv:2402.13616. [Google Scholar]
- Wang, A.; Chen, H.; Liu, L.; Chen, K.; Lin, Z.; Han, J.; Ding, G. YOLOv10: Real-time end-to-end object detection. arXiv 2024, arXiv:2405.14458. [Google Scholar]
- Jocher, G.; Qiu, J. Ultralytics YOLO11. 2024. Available online: https://docs.ultralytics.com/models/yolo11/ (accessed on 19 September 2026).
- Tian, Y.; Ye, Q.; Doermann, D. YOLOv12: Attention-Centric Real-Time Object Detectors. arXiv 2025, arXiv:2502.12524. [Google Scholar]
- Lei, M.; Li, S.; Wu, Y.; Hu, H.; Zhou, Y.; Zheng, X.; Ding, G.; Du, S.; Wu, Z.; Gao, Y. YOLOv13: Real-Time Object Detection with Hypergraph-Enhanced Adaptive Visual Perception. arXiv 2025, arXiv:2506.17733. [Google Scholar]
- Kim, W.; Jung, W.-S.; Choi, H.K. Lightweight driver monitoring system based on multi-task mobilenets. Sensors 2019, 19, 3200. [Google Scholar] [CrossRef] [Scilit] [PubMed]
- Chen, Z.; Yang, J.; Chen, L.; Jiao, H. Garbage classification system based on improved ShuffleNet v2. Resour. Conserv. Recycl. 2022, 178, 106090. [Google Scholar] [CrossRef] [Scilit]

Disclaimer/Publisher’s Note: The statements, opinions and data contained in all publications are solely those of the individual author(s) and contributor(s) and not of MDPI and/or the editor(s). MDPI and/or the editor(s) disclaim responsibility for any injury to people or property resulting from any ideas, methods, instructions or products referred to in the content. |
© 2026 by the authors. Licensee MDPI, Basel, Switzerland. This article is an open access article distributed under the terms and conditions of the Creative Commons Attribution (CC BY) license.