


Abstract
Plant covers offer a potential non-chemical strategy to reduce insect herbivory and protect plants from weather extremes. The first 3-D spacer fabric constructed as a crop cover in a tunnel field application in previous research from our laboratory increased cabbage vegetative growth 2.93-fold and was resistant to insect penetration. Whether this use will increase fruit production was not studied. Tunnel field studies were conducted here with strawberries since they grow over three seasons (Fall to Spring) and single-layer textiles are used as a cover to protect flowers and fruit from freezing. Covered strawberry plants yielded a 3.56-fold increase in harvestable fruits with the number and weight of fruit significantly higher than in uncovered plants. No differences in vegetative plant biomass were found. The 3-D spacer fabric did not elicit a shade avoidance response. Covering consistently increased temperature, but relative humidity was not affected between the covered and uncovered field plots. The fabric, although porous to air and water, demonstrated absolute aphid exclusion in lab bioassays. In preliminary studies, rhizosphere bacterial colony-forming units did not differ significantly between covered and uncovered plots. On-farm testing is now needed to examine the utility of this new textile for a variety of crop plants in different geographical locations.
Keywords:
strawberry; crop cover; spacer fabric; 3-D fabric; aphid; Rhodobium porosum; rhizosphere; bacteria 1. Introduction
Strawberry (Fragaria × ananassa Duch.) is one of the most economically important fruit crops worldwide, with global production exceeding 10.4 million metric tons in 2023. This output from approximately 435,000 hectares (ha) had an estimated market value of 20.9 billion USD, a 35% increase from 2013 to 2023 [1]. The United States is the second largest global producer of strawberry after China. The US harvest of 1,250,100 metric tons from approximately 22,986 ha contributed 3.39 billion USD to the total global market value. Most of the crop (1,016,064 metric tons) is directed toward the fresh market, with the remaining used for other forms of food [2].
Over the years, strawberry production has been affected by a complex of biotic and abiotic stresses. Plant pathogens [3,4,5] and arthropod pests [6,7,8,9] limit strawberry production and increase management costs. The management of these biotic stresses has relied heavily on synthetic pesticides. However, increasing concerns about environmental impact, ecological threats, and human health [10] have led to ongoing regulatory restrictions and bans to minimize the use of these pesticides [11]. Additionally, a growing consumer preference for organic and pesticide-free fruits and vegetables [12,13,14] has further constrained strawberry producers, narrowing their management options. Abiotic stresses compound these challenges. Temperature fluctuations owing to climate change negatively impact strawberry phenology and yield [15,16,17], while water scarcity, particularly in production regions facing drought, limits the ability to irrigate strawberry systems [18,19]. Thus, developing strategies to meet these challenges is important to maintain food security.
Agrotextiles have been used in both greenhouses and open-field cultivation to manage environmental factors such as temperature, humidity, and soil moisture [20,21]. For example, small mesh nets have been used as physical barriers to prevent insect infestations in crops such as tomatoes, cucumbers, and cabbage [22,23,24]. However, a major challenge associated with this approach is finding a material with the right pore size. To be effective, the mesh must be fine enough to keep out small arthropod pests, but at the same time provide enough light, have favorable air and water penetration, and create optimal temperature and humidity without promoting plant disease. Reduced airflow can raise humidity levels, potentially leading to the proliferation of fungal diseases [25]. With an optimum fabric structure, it may be possible, for example, to cover strawberries for most or all the growing season to protect them from freezing and insect pests, with a possible application to other fruit crops.
Cave et al. [26] recently demonstrated for the first time that a novel 3-D spacer fabric in a field tunnel application could enhance cabbage vegetative growth 2.93-fold while preventing insect penetration by creating a tortuous (“zigzagging”) path across the textile [27]. The tortuous path allowed for insect exclusion without compromising airflow and water penetration, with the potential of plant protection from weather extremes. Our hypothesis is that this 3-D fabric could also increase fruit production. This hypothesis was tested here in a field tunnel application on strawberries that grow over three seasons (Fall, Winter and Spring) and where single-layer crop covers are used to protect flowers and fruit from freezing [28].
2. Materials and Methods
2.1. Plot Preparation, Plant Selection, and Planting
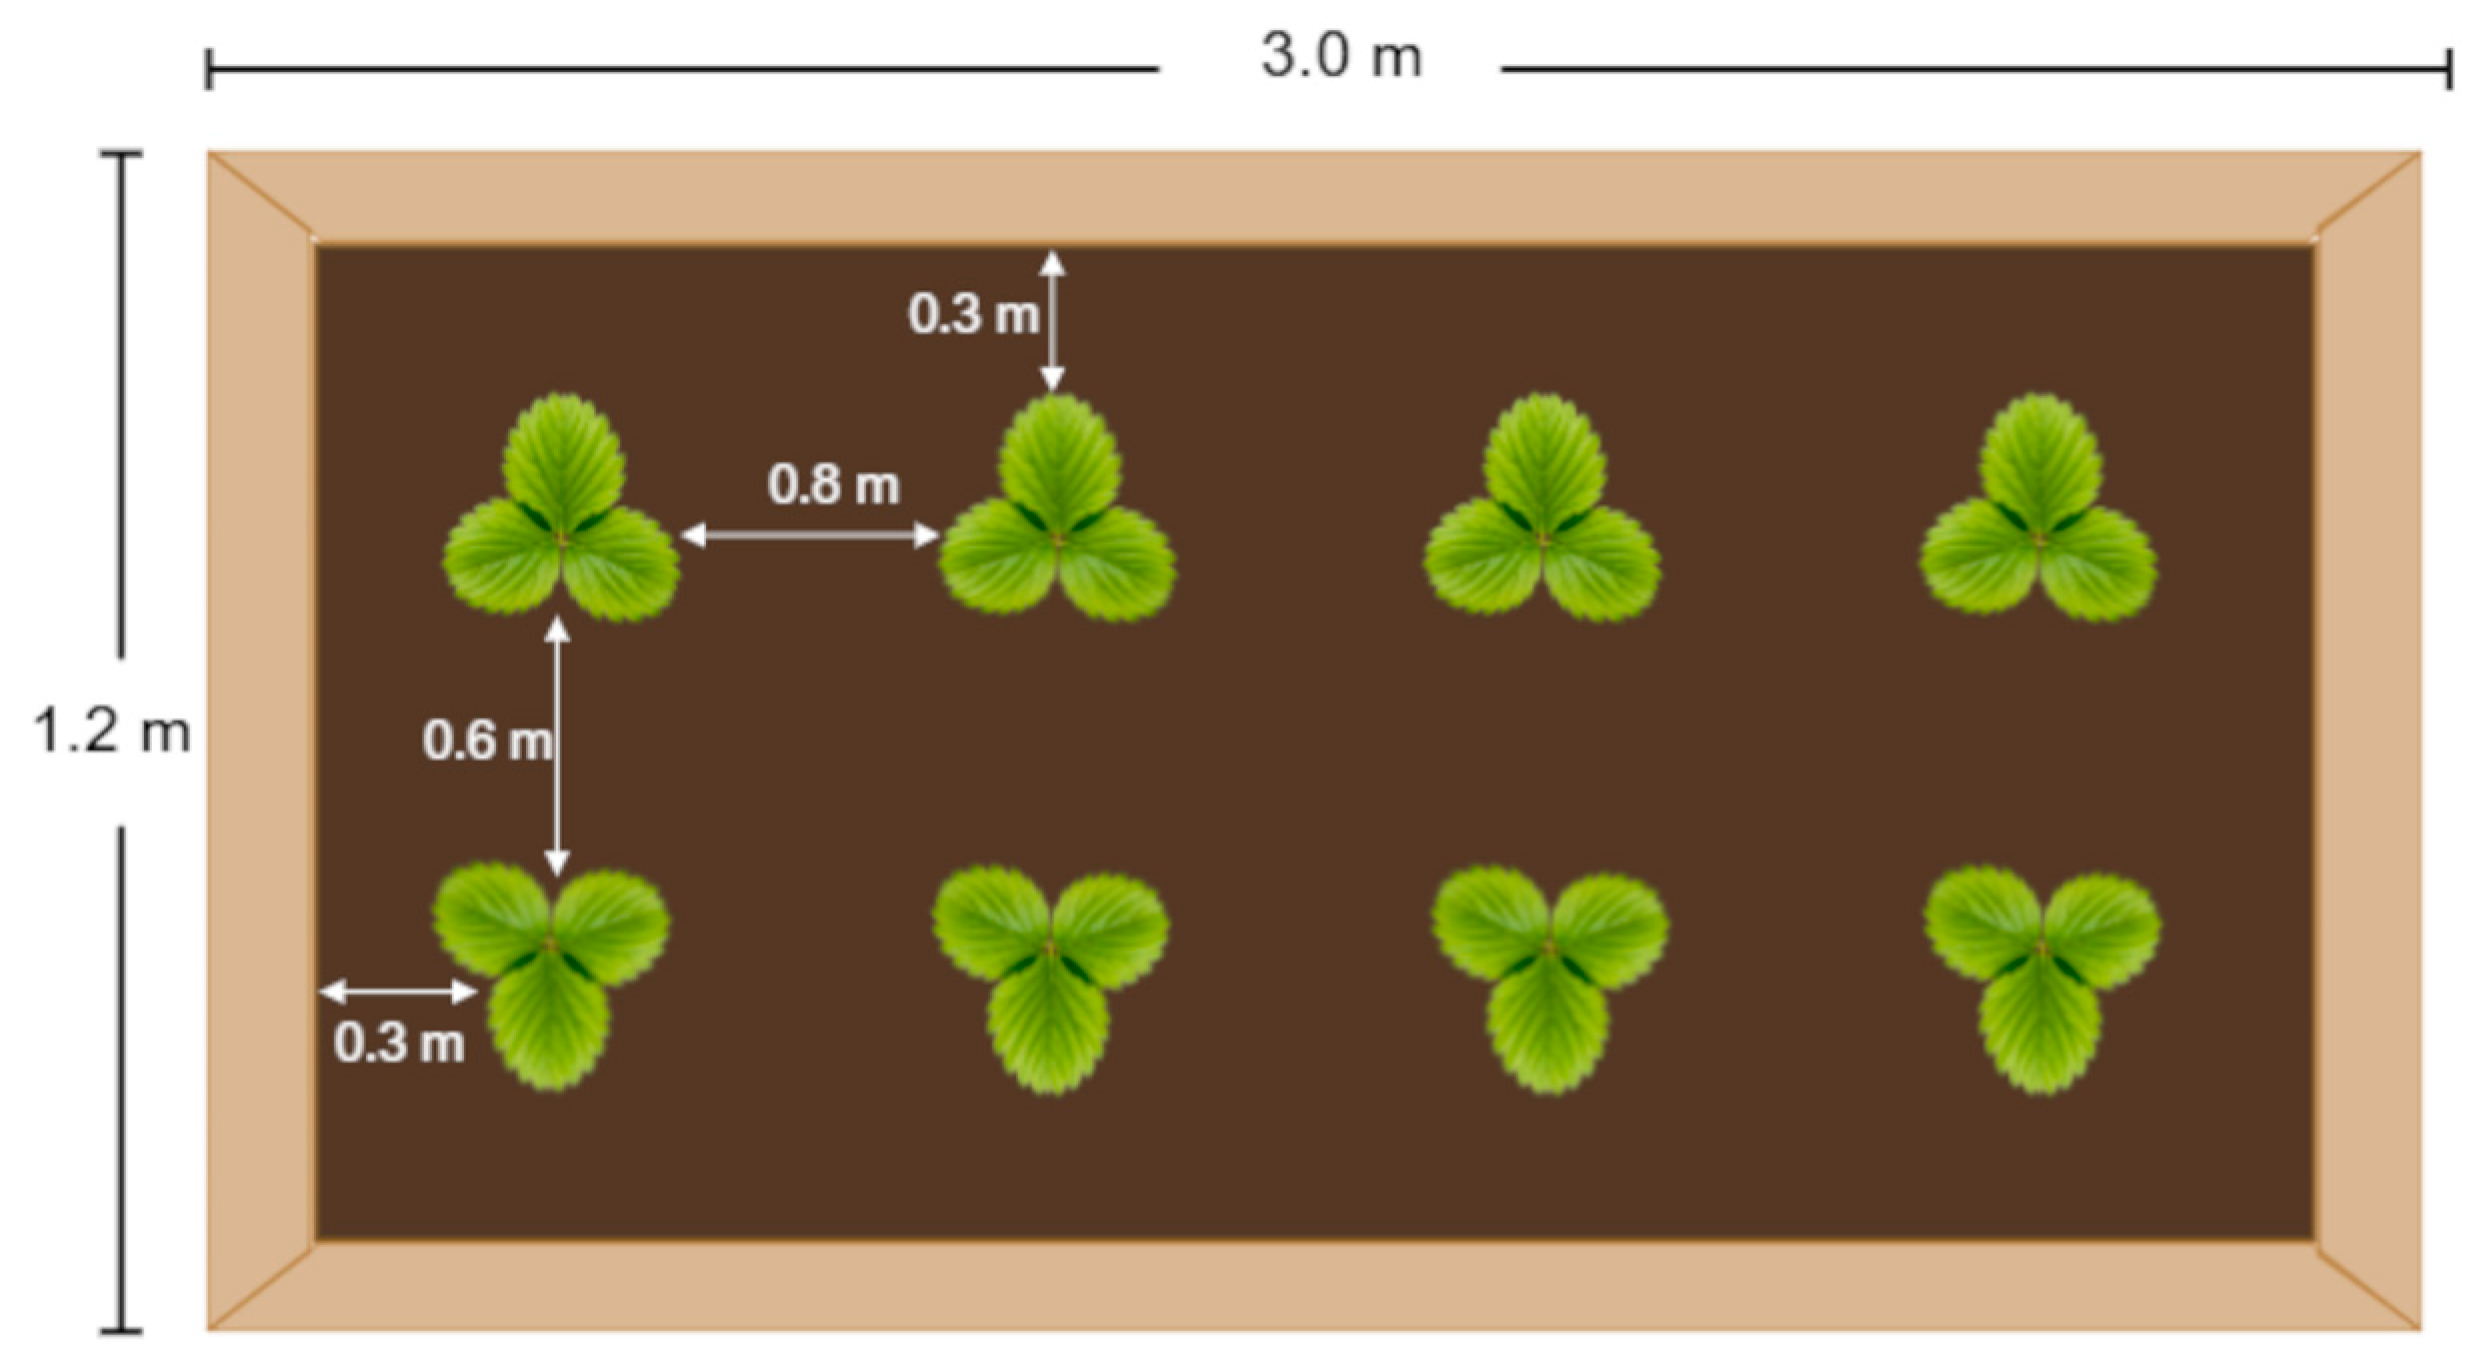
A small-plot (raised bed) field experiment was conducted from November 2024 through May 2025 at the North Carolina State University Research Annex in Raleigh, NC, USA (35°47′19.38″ N, 78°41′56.77″ W). The frames to hold soil for the three identical raised experimental beds (used before in earlier studies by Cave et al. [26] for cabbage) were constructed from untreated pine lumber (5 cm × 30 cm, width × height) sourced from Capitol City Lumber Co. in Raleigh, NC, USA. Each bed measured 3.0 m in length and 1.2 m in width. The wooden frames were evenly filled with new Miracle-Gro All-Purpose Garden Soil (a mixture of peat moss, compost, fertilizer and a wetting agent; Scotts Lawn, Marysville, OH, USA) placed on top of the existing ground that supported each wood frame.
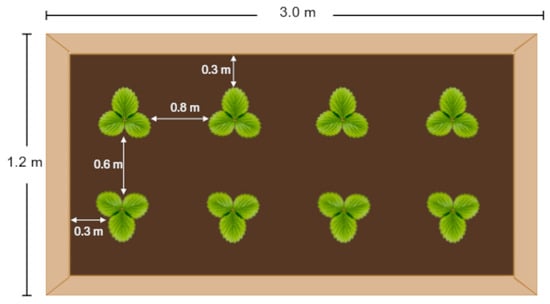
Sweet Charlie, a commercial strawberry (Fragaria × ananassa Duch.) cultivar, was used for the experiment. It is an early-season, short-day (June-bearing) strawberry cultivar developed by the University of Florida, Agricultural Research and Education Center, Dover, FL, USA. These plants are a hand-pollinated cross between an anthracnose-resistant clone (FL 80-456) and the high-yielding Pajaro cultivar [29]. Strawberry plants were locally sourced as four-week-old transplants from a vendor at the State Farmers Market in Raleigh, NC, USA. The plant material, initially established in nursery pots, was manually separated into individual rooted units (plugs) before transplanting. Eight strawberry plugs were then randomly selected and transplanted into each experimental bed on 4 November 2025. The planting followed a double-row configuration with four plants per row; the rows were positioned along the long axis of the raised bed (Figure 1). The plants were spaced 0.80 m apart and 0.30 m from the edge of the bed. The two rows were spaced 0.60 m apart. All transplants were placed by hand, ensuring the roots were fully covered.
Figure 1.
Schematic of raised bed, viewed from overhead, showing the dimensions and plant spacing. Created in Biorender. Gabriel Bamidele Olawuyi. (2026) https://app.biorender.com/illustrations/6a99ed7ce0d8f838e6b06f0a.
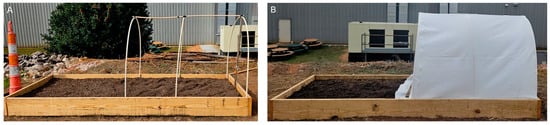
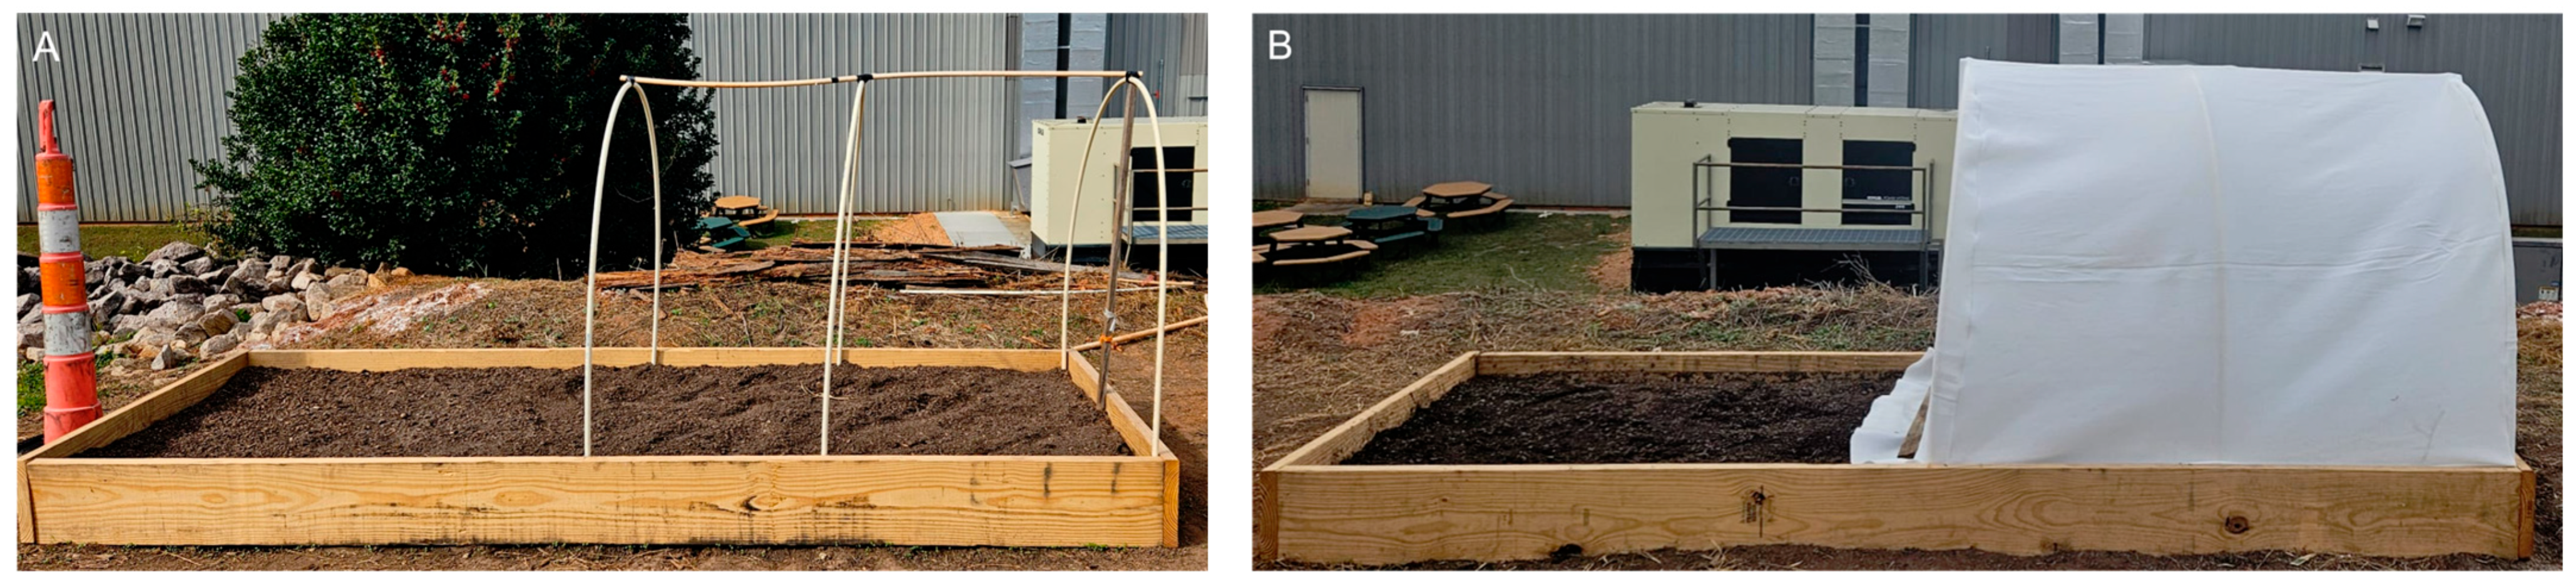
A knitted spacer fabric was evaluated as a crop cover for strawberry plants. The fabric, Plant Armor Generation 2 (PA Gen 2), was the optimum 3-D textile tested in the studies by Cave et al. [26] on cabbage. PA Gen 2 was produced on a Jacquard OVJA 106 E 3-wt weft knitting spacer machine (Mayer & Cie, Albstadt, Germany) with a 30-inch diameter and a gauge of 18 needles per inch. It was made from a 70-denier bright polyester multifilament containing 0.05% titanium dioxide (TiO2) as the outer layers and an inner layer of 9-denier polyester monofilament [26]. The fabric was custom-cut and sewn to shape to fit over a 1.0 m-tall hoop structure constructed from 1.3 cm-diameter PVC pipe. To maintain the integrity of the PA Gen 2 barrier and prevent pest infestation, the edges were tucked into the space between the supporting PVC pipe structure and the wooden border of the raised bed (Figure 2) with the end facing the uncovered area in each plot firmly sealed with heavy wood logs to prevent opening by wind. Plots were irrigated as needed by sprinkling from a garden hose with tap water topically with equal timing on the covered and uncovered plants. The water application was made on the outside surface of PA Gen 2.
Figure 2.
(A) Skeletal frame of a 1.0 m-tall hoop structure constructed from three connected PVC pipes (1.5 cm outside diameter), installed over half of a 3.0 m × 1.2 m raised bed (plot). (B) A representative experimental bed with the Plant Armor Generation 2 fabric cover installed over the PVC pipe hoops.
The experiment was conducted in a randomized complete block design using three raised beds. Each bed was divided into two equal halves. One half was assigned to PA Gen 2 covering, while the other remained uncovered, with four strawberry plants established per half.
2.2. Temperature and Relative Humidity
Weekly measurements of temperature and percentage relative humidity (RH) were recorded between 22 November 2024 and 25 April 2025. Data were not collected on rainy days. Measurements were made once in the morning (09:00) and once in the afternoon (15:00) Eastern Standard Time (EST) for each raised bed for the uncovered and PA Gen 2-covered areas. These specific times were selected to coincide with the period of increasing photosynthesis in the morning, and peak thermal stress in the afternoon, respectively [30]. Data were treated as a multivariate response vector consisting of morning temperature, afternoon temperature, morning RH, and afternoon RH to capture daily fluctuations over the duration of the study. Measurements were made with a Fluke temperature and humidity meter (Model 971, Fluke Corp., Everett, WA, USA). To ensure spatial consistency and avoid edge effects, the sensor was seated on the soil surface at the geometric center of each “half”. For each reading, the sensor was allowed to equilibrate for 60 s before taking a measurement.
2.3. Fruit Harvest
Strawberry fruits were harvested manually by hand-pulling three times per week (every other day) during the morning hours between 8:00 and 10:00 EST. Harvesting started on 4 April 2025 (150 days after transplanting) and continued through 16 May 2025. Fruits were picked once they had turned entirely red. On each harvest day, the total number and fresh wet weight of fruits per plant after fruit collection were recorded. Fruit collection was terminated when no further fruiting was observed.
2.4. Post-Harvest Plant Processing and Biomass Assessment
Following the cessation of fruiting, all plants were carefully uprooted to preserve the root systems. The roots were rinsed under gentle running tap water until all adhering soil was removed. Immediately following the rinse, excess water was blotted from the roots using paper towels to obtain a reasonably consistent total plant wet weight measurement. Each plant was then placed into separate envelopes constructed with aluminum foil. The weight of each empty foil pocket was recorded before the plant was inserted. Plant wet weight was determined by weighing the plant and its respective pocket on a Denver Instrument precision scale (Model X E-510, Denver Instrument Co., Denver, CO, USA), subtracting the aluminum foil weight. Afterwards, the samples were transferred to a Precision-Thelco convection oven (Model 28, Precision Scientific Co., Chicago, IL, USA) and dried at 70 °C. Plant weights were monitored every 24 h until the same dry weight was achieved over a two-day period. The final net dry weight was calculated by subtracting the respective foil pocket weight from the total combined weight.
2.5. Aphid Infestation and Species Identification
In March 2025, as temperatures rose during the Spring, an aphid infestation was observed on both PA Gen 2-covered and uncovered strawberry plots. These populations were treated with insecticidal soap (Natria Insecticidal Soap Ready-to-Use; Active Ingredient: Potassium salts of fatty acids; BioAdvanced Science-Based Solutions, Research Triangle Park, NC, USA) to prevent population buildup. The plants were sprayed one time using the Ready-to-Use applicator provided with the product following the company recommendation to “run-off” of the spray from leaves and stems. To identify the aphid species found on our plots, a #4 camel-hair brush was used to collect adult aphids from the infested plants. Aphids were preserved in 95% ethanol in 5.0 mL Eppendorf tubes (Eppendorf, Hamburg, Germany) and submitted to the North Carolina State University Plant Disease and Insect Clinic (Department of Entomology and Plant Pathology, Raleigh, NC, USA). Based on previous work with PA Gen 2 resistance to penetration of tobacco thrips, Frankliniella fusca Hinds (Thysanoptera: Thripidae) [26], a smaller insect compared to aphids, our hypothesis was that aphids would not be able to penetrate the PA Gen 2 covering. To confirm species identity, DNA was extracted from aphids collected on the strawberry plants using the Qiagen DNeasy Blood and Tissue kit (Qiagen, Hilden, Germany) according to the manufacturer’s protocol. Polymerase Chain Reaction (PCR) amplification of the DNA was performed using LCO1490F and HCO2198R primers (Integrated DNA Technologies, Coralville, IA, USA) [31] that amplified a segment of the mitochondrial cytochrome c oxidase subunit I (COI) gene. The amplified PCR products were purified with Exo-SAP-IT (Thermo Fisher Scientific, Waltham, MA, USA) according to the manufacturer’s instructions. Sequencing in both directions was performed by the North Carolina State University Genomic Sciences Laboratory (https://research.ncsu.edu/gsl/) using the same primers used for amplification, and sequences were identified using BLAST (https://blast.ncbi.nlm.nih.gov/Blast.cgi). Aphids were also slide-mounted for morphology identification using Favret and Aphid Taxon Community [32] and Blackman and Eastop [33].
2.6. Aphid Penetration Assay
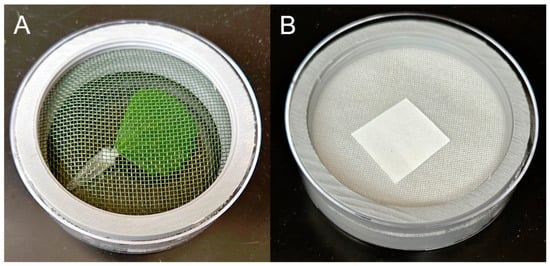
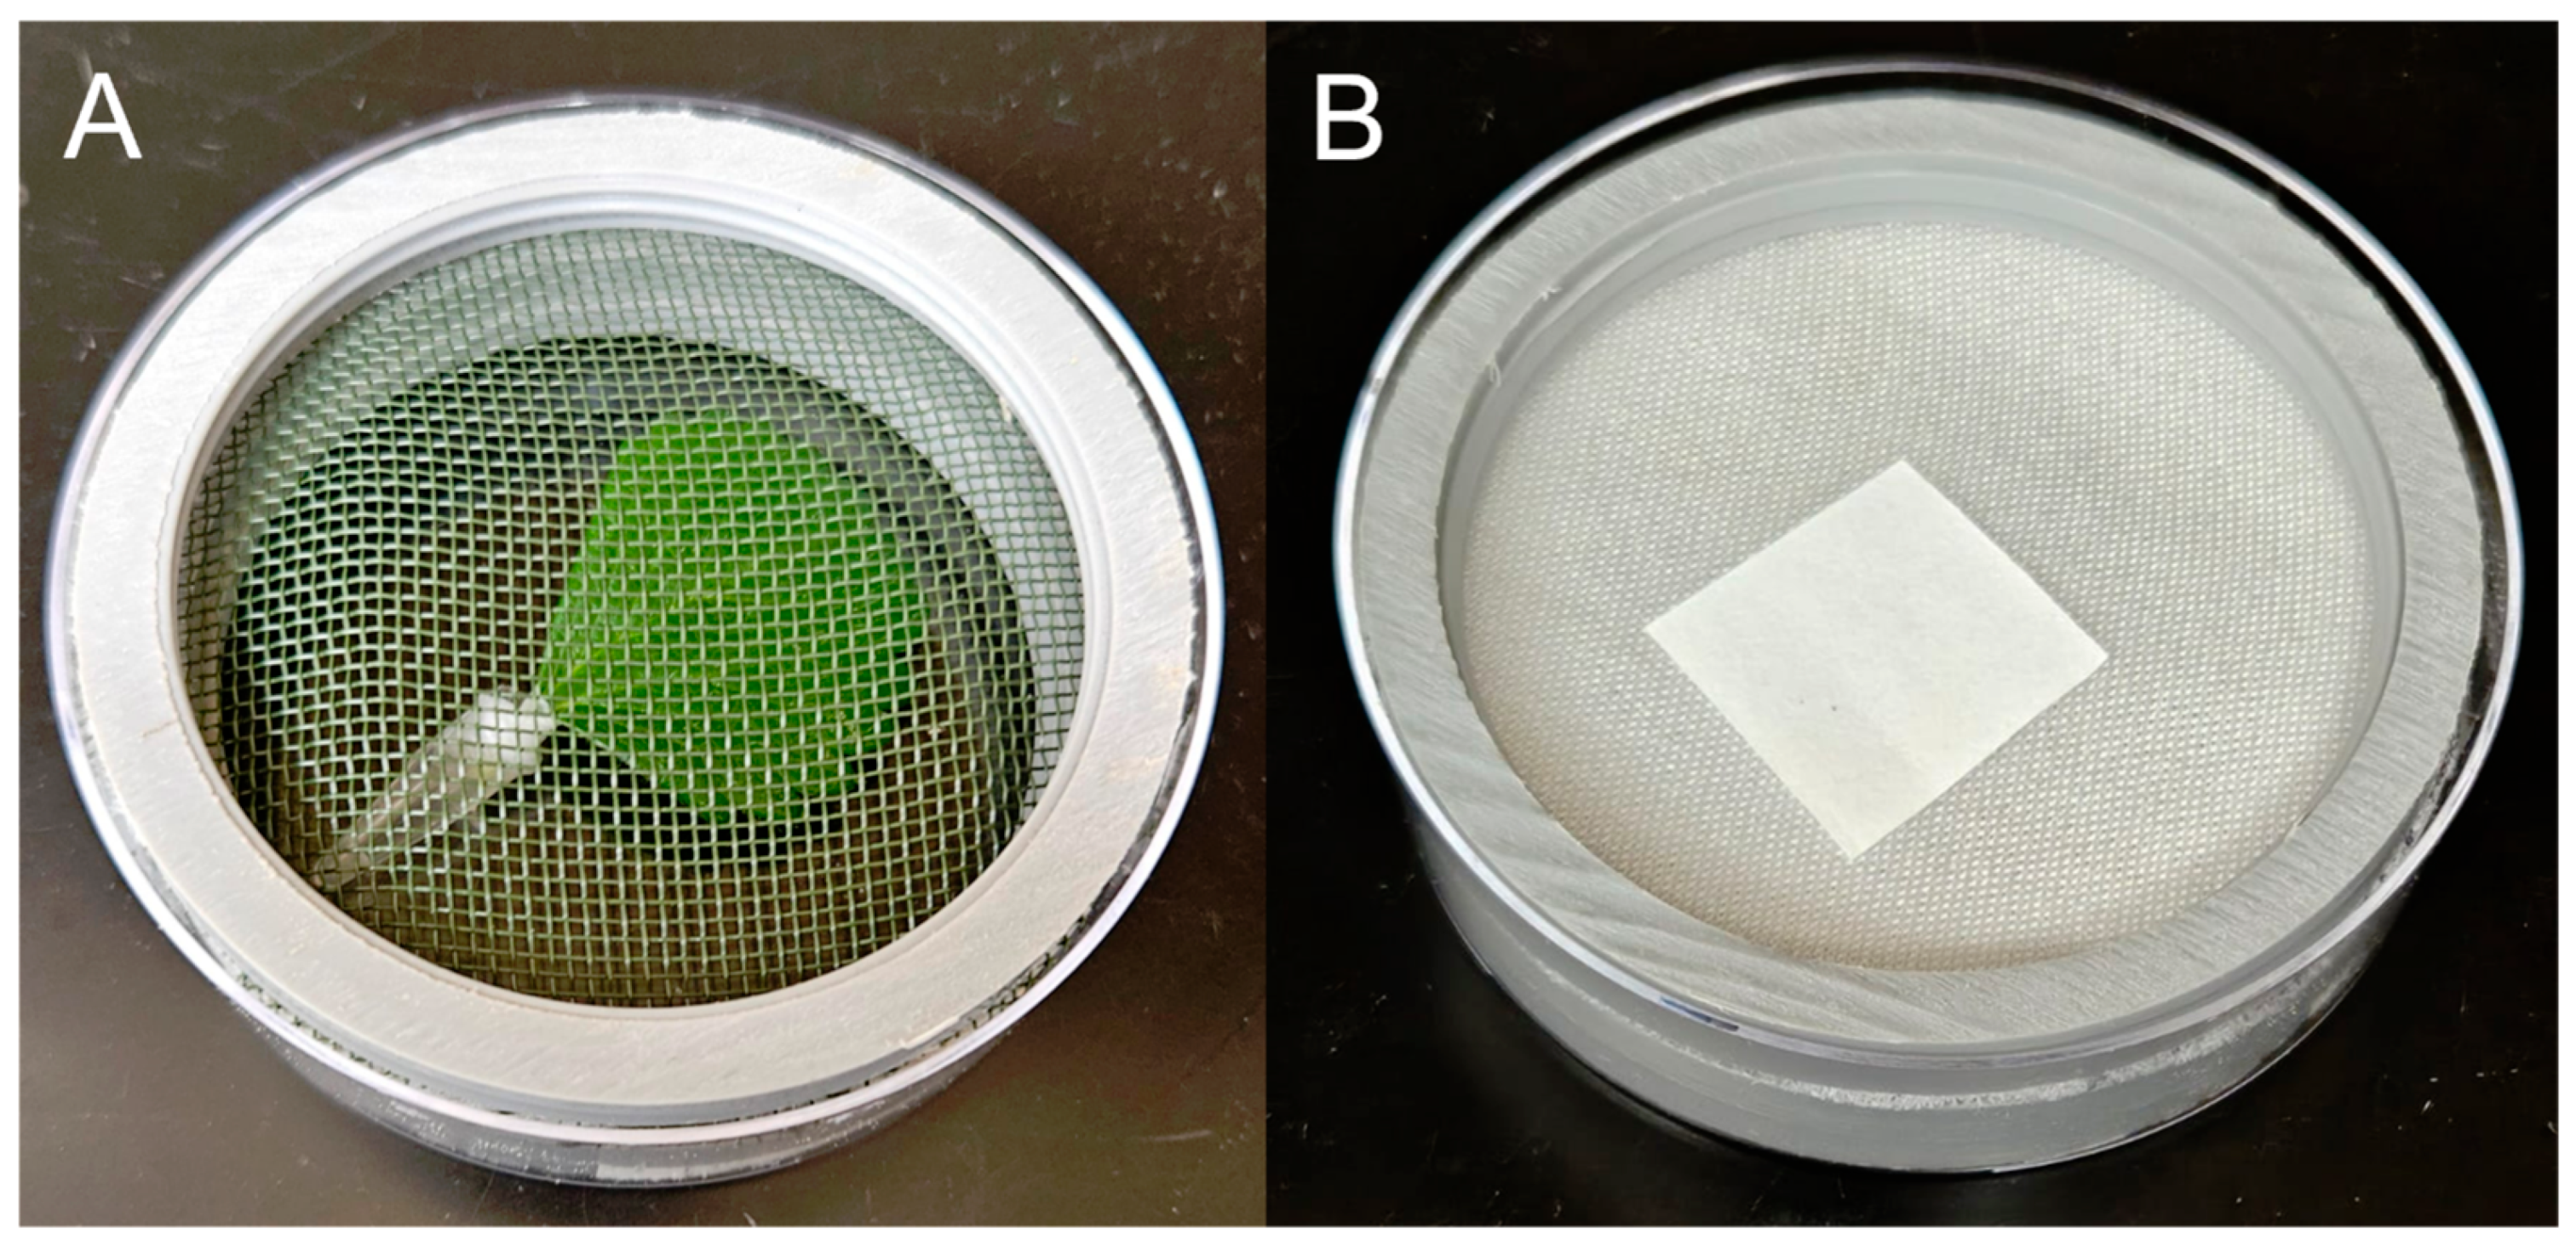
An aphid penetration assay of PA Gen 2 was conducted following the method described by Cave et al. [26] with a standard fly screen (18 × 16 mesh) positive control. The method uses a textile swatch cut to match the inner diameter of a 100 × 25 mm plastic Petri dish (Fisher brand, Waltham, MA, USA). The swatch was placed between two PVC rings in the Petri dish base. Each ring has an outer diameter equal to the inner diameter of the Petri dish base, an inner diameter of 7.5 cm, and a thickness of 0.5 cm. The first PVC ring is placed directly on the bottom of the Petri dish, and an aphid-free strawberry leaf obtained from extra plants not utilized in the experiment was placed on the inside bottom of the Petri dish. To maintain leaf turgidity and prevent desiccation throughout the experiment, the leaf petiole was inserted into a 0.5 mL Eppendorf tube with the snap cap cut off, the tube filled with distilled water, and the tube sealed with Parafilm® (Bemis Company, Inc., Neenah, WI, USA). The textile was then placed on top of the ring over the strawberry leaf, and the second PVC ring was placed over the textile (Figure 3A). Nymphal aphids collected from the infested foliage in our plots were used for the experiment, fifteen per assay and replicated three times. Aphids were transferred to the surface of a 1 cm × 1 cm Whatman No. 1 white filter paper (90 mm Ø) (Cytiva, Marlborough, MA, USA) placed on each barrier to be tested, on which the aphids were transferred and allowed to crawl onto the barrier (Figure 3B). Once all aphids had moved onto the barrier, the filter paper was carefully removed, and the Petri dish top and bottom were sealed together with Parafilm. The experiment was conducted in a controlled environmental chamber maintained at 27 ± 1 °C and 50 ± 5% relative humidity during the scotophase to eliminate visual cues and enhance olfactory-driven host-seeking behavior. Observations were recorded at 30 min intervals over 180 min. At each time point, assays were briefly brought out of the experimental chamber and promptly checked, and the number of aphids present on the top barrier surface recorded.
Figure 3.
Experimental setup for the aphid penetration assay. (A) What the strawberry leaf looks like under a barrier, in this case fly screening. The leaf was inserted into a water source to maintain plant hydration. (B) A 1 cm × 1 cm Whatman No.1 filter paper was placed on the barriers to be tested to facilitate natural aphid crawling onto the surface. Shown is Plant Armor Generation 2 fabric.
2.7. Rhizosphere Soil Sampling and Quantification of Culturable Bacteria
At the end of the experiment when the plants were uprooted, we measured the culturable bacteria density in the uncovered and PA Gen 2-covered plots. Rhizosphere soil samples were collected from the roots of plants in each plot. From the collected rhizosphere soil of each plot, 1 g of soil was suspended in 9 mL of sterile peptone water (0.1% w/v) to create a 10−1 dilution. This suspension was thoroughly homogenized using a vortex agitator. A 10-fold serial dilution series (10−2 to 10−5) was subsequently prepared by transferring 1 mL of the preceding dilution into 9 mL of fresh sterile peptone water followed by mixing. Bacterial quantification was performed using the drop-plate method [34] on two media: Tryptic Soy Agar (TSA) and Plate Count Agar (PCA) (Difco, Detroit, MI, USA). Both media were prepared according to the manufacturer’s specifications, autoclaved, and poured into separate sterile plastic Petri dishes to cool and solidify. Each plate was divided into four equal sections. For each medium (TSA and PCA), 20 µL aliquots from the dilutions were pipetted in duplicate, one drop next to the other, onto their designated sections and left to dry under a laminar flow hood. Covered plates were sealed with Parafilm along the edges and incubated at 27 ± 1 °C for 24 h. Following incubation, the number of colonies was counted and normalized based on the sample volume used for each dilution.
2.8. Statistical Analyses
Statistical analyses were performed using SAS software (version 9.4, SAS Institute Inc., Cary, NC, USA) and R software (version 4.5.1, “Great Square Root”). For all analyses, the threshold for statistical significance was set at α = 0.05.
Over the course of the experiment, fruit counts for each plant within each half plot were aggregated. The experimental unit with respect to the treatment was the half plot, and therefore, the plants constituted subsamples. The quantity of interest was the cumulative yield; therefore, the fruit counts for the plants within each half plot were summed to produce one total count for each experimental unit (the six half plots). This quantity was analyzed using a generalized linear mixed model (GLMM) in SAS’ PROC GLIMMIX. As the data represents counts, a Poisson distribution was used for the response with a log link function. The fixed effect was the treatment, and the random effect was the plot (or block). To address overdispersion (Pearson Chi-Square/degrees of freedom = 1.2), separate dispersion parameters were estimated for each treatment. Following Stroup et al. [35], the Kenward–Roger adjustment was applied to adjust for standard error bias. The least squares means were estimated and used to conduct inference about the treatments and their differences.
Temperature and relative humidity were analyzed using a multivariate repeated-measures model to account for temporal correlations among measurements taken on the same experimental units. The model was implemented using the PROC MIXED procedure in SAS. A direct product first-order autoregressive (AR (1)) covariance structure was used, with separate covariance parameters estimated for each condition (uncovered vs. PA Gen 2-covered). The Kenward–Roger degree of freedom adjustment was applied to ensure the accuracy of standard errors, and any multiple comparisons were further adjusted using Tukey’s adjustment. Model estimated means were used to conduct comparisons of interest.
Aphid penetration was modeled using GLMM. The Model was fitted in SAS’ PROC GLIMMIX. Given the nature of the data (number of successes out of a total), a binomial distribution with a logit link function was employed. A random intercept for each experimental unit accounted for repeated measurements over time. The penetration profile was evaluated using orthogonal polynomial contrasts, and the final model was fitted to obtain the estimated logistic regression equation.
Plant vegetative biomass and rhizosphere colony-forming units (CFUs) were analyzed in R (v4.5.1). Plant vegetative biomass was analyzed using linear mixed models (LMM) via the lme4 package, with treatment as a fixed effect and plot as a random effect. Log-transformed CFU data (log10) were analyzed using linear models (LMs) of the emmeans package. Analysis was performed to evaluate the interaction between condition and growth medium. Marginal means and 95% confidence intervals were estimated to compare treatments.
3. Results
3.1. Fruit Yield
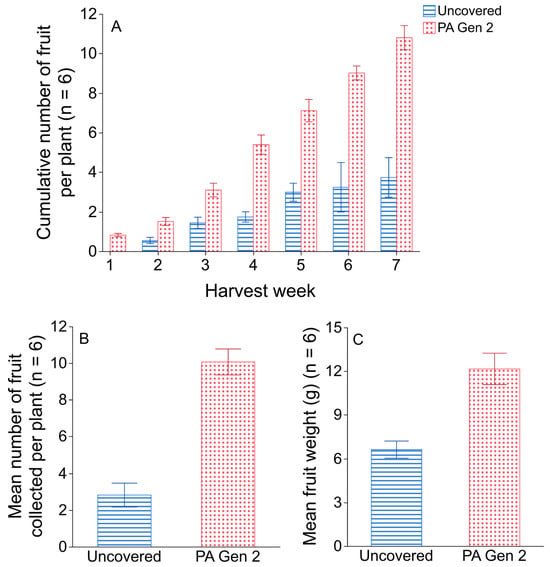
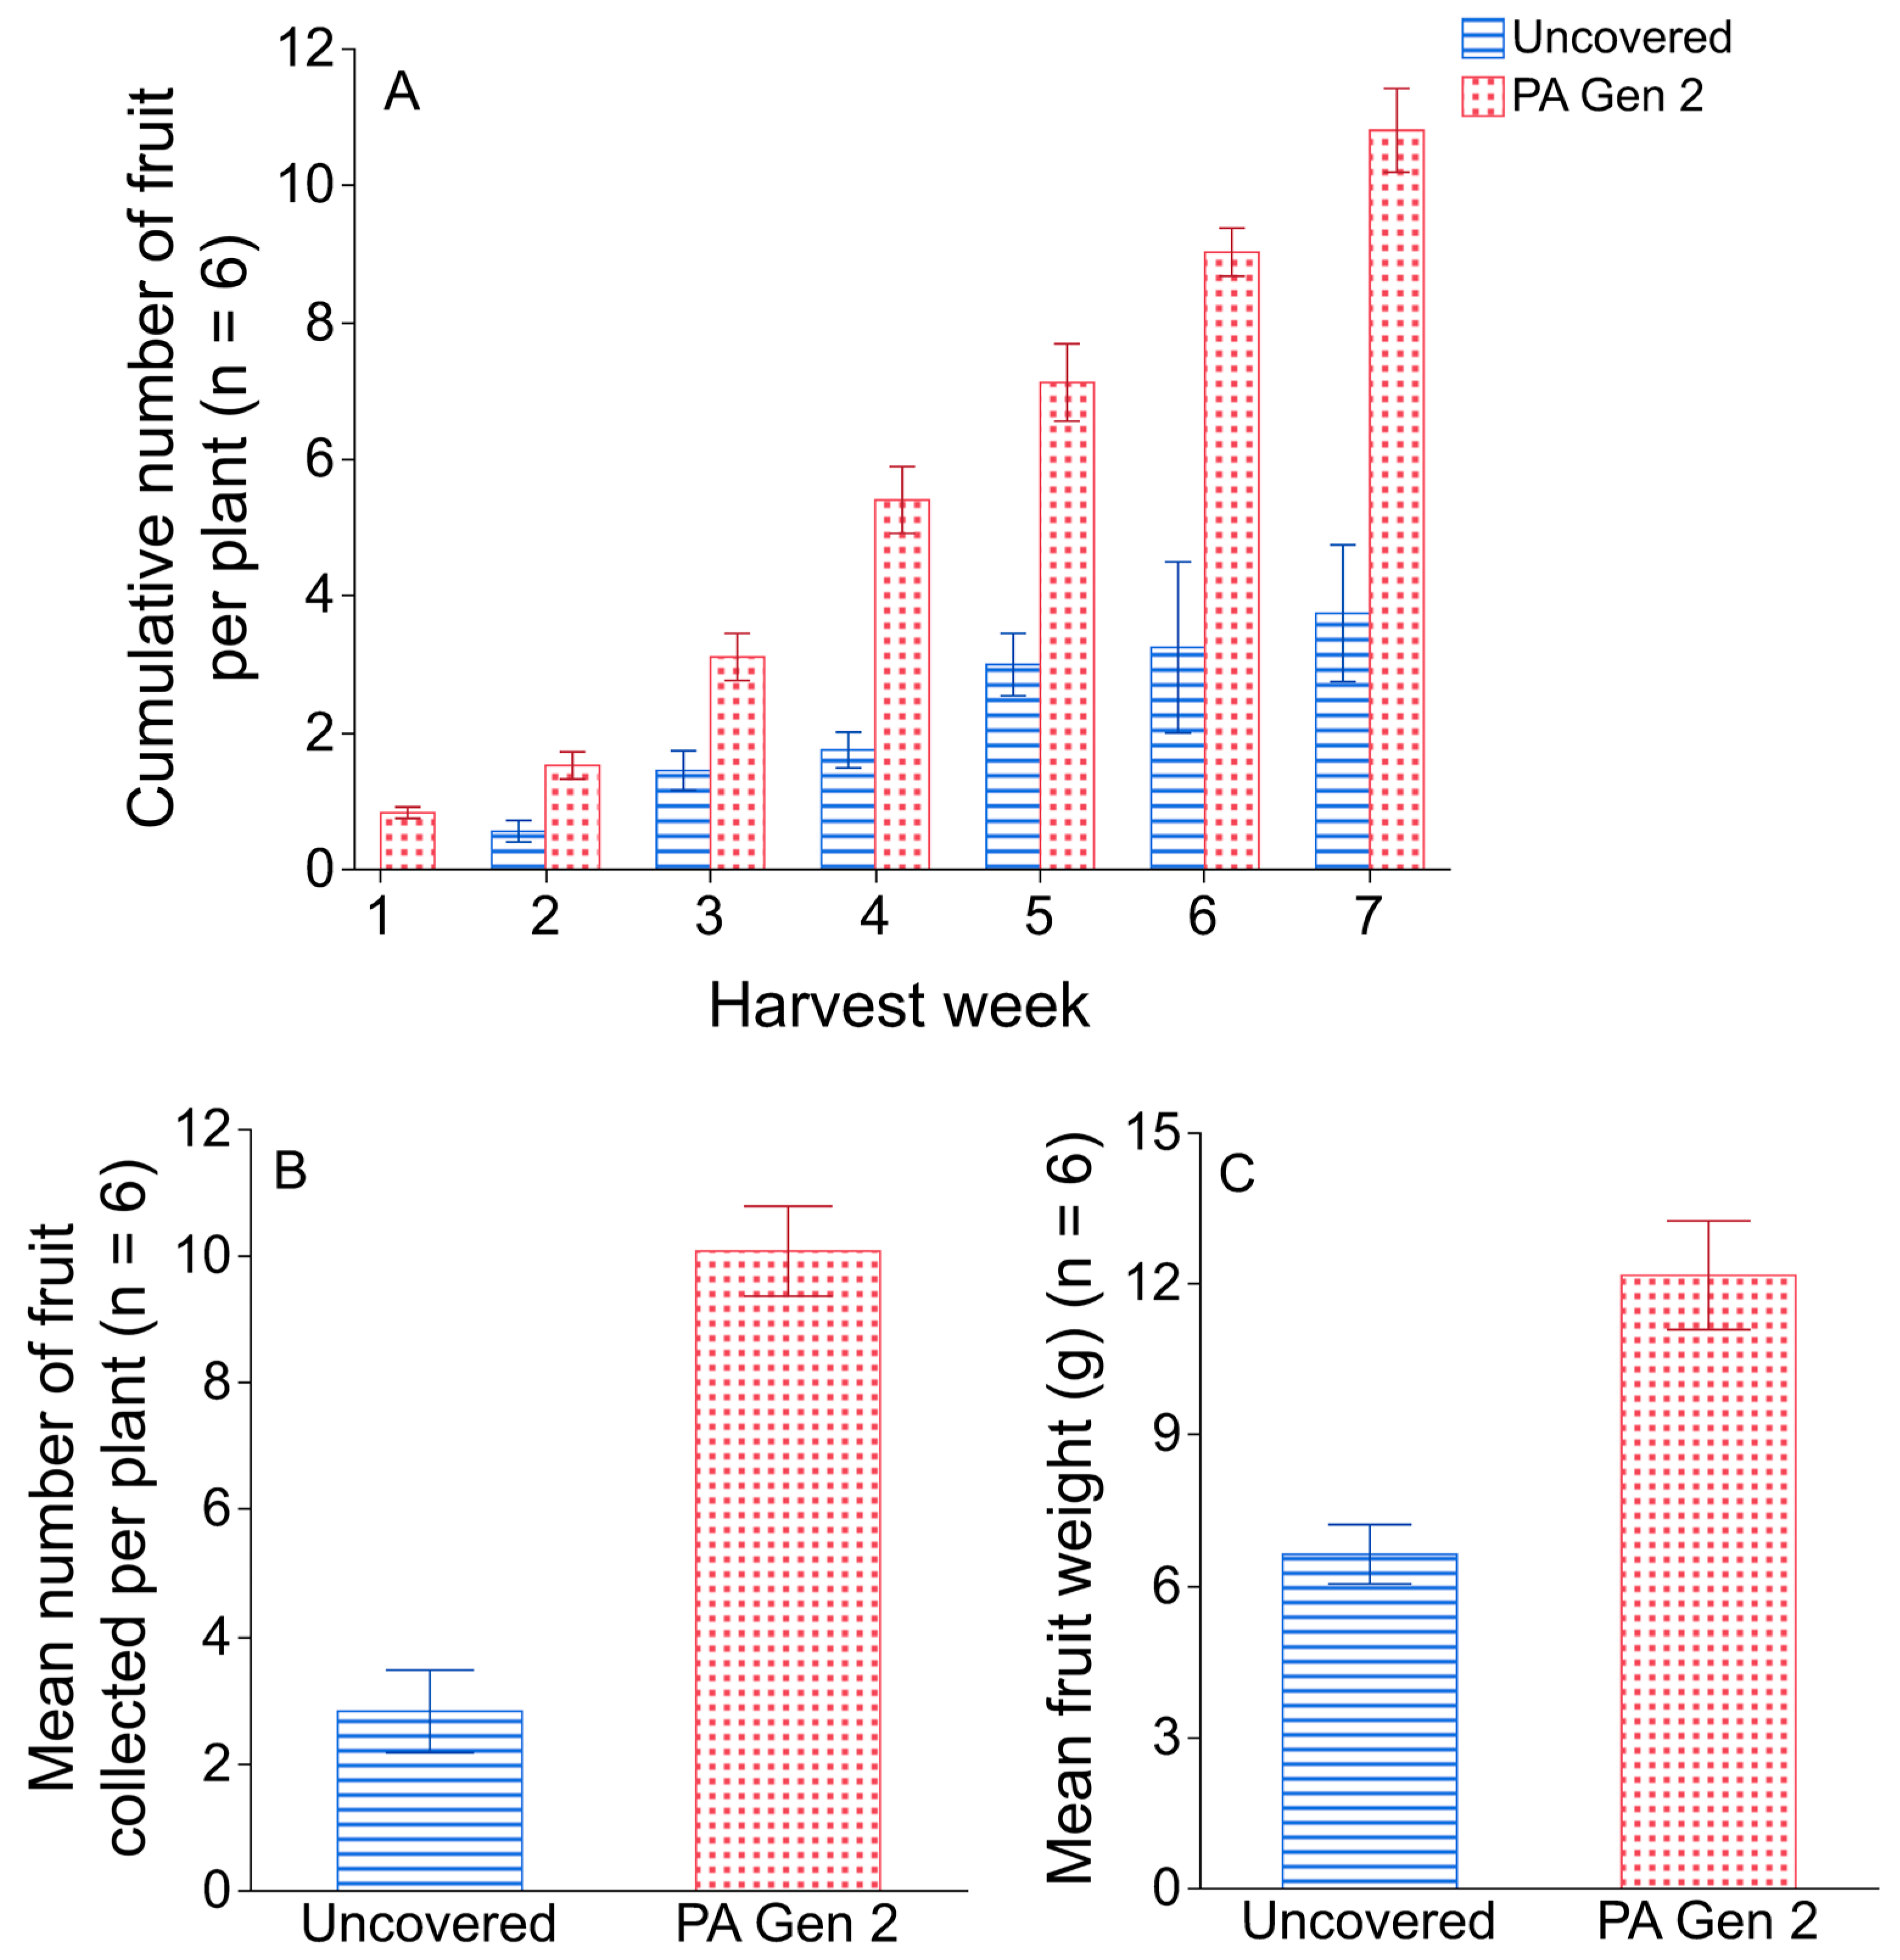
Figure 4A shows a trend that PA Gen 2-covered plants reached harvestable maturity one week earlier than the uncovered plants. The estimated average total fruit count for PA Gen 2-covered plants was 3.56-fold greater than that of uncovered plants over the seven weeks of harvesting (t2.375 = 5.28, p = 0.0233) with a significant increase in the total number of strawberry fruits per plant (10.8 ± 0.71; 95% CI: 7.44, 13.66) compared to the uncovered control (2.83 ± 0.65; 95% CI: 1.05, 7.61) (Figure 4B). Covering also increased total fruit weight 1.84-fold (t2 = 4.85, p = 0.04). PA Gen 2-covered plants yielded a mean fruit weight of 12.18 ± 1.08 g (95% CI: 8.32, 17.83) compared to 6.63 ± 0.59 g (95% CI: 4.53, 9.71) for uncovered plants (Figure 4C).
Figure 4.
Impact of Plant Armor Generation 2 (PA Gen 2) fabric cover on strawberry yield over a seven-week harvesting period from 4 April 2025, to 16 May 2025. (A) Descriptive cumulative progression of fruit production, demonstrating the harvest timeline and accumulation rate. No fruit was harvested from uncovered plants in week 1. (B) Mean number of fruits collected per plant. (C) Fruit weight in grams. Error bars represent ±1 standard error of the mean.
3.2. Plant Vegetative Biomass
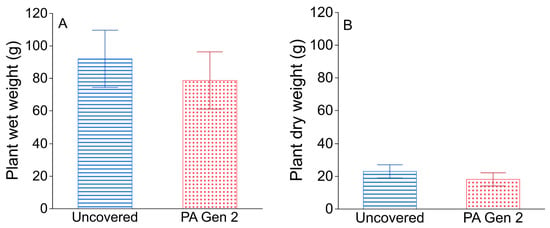
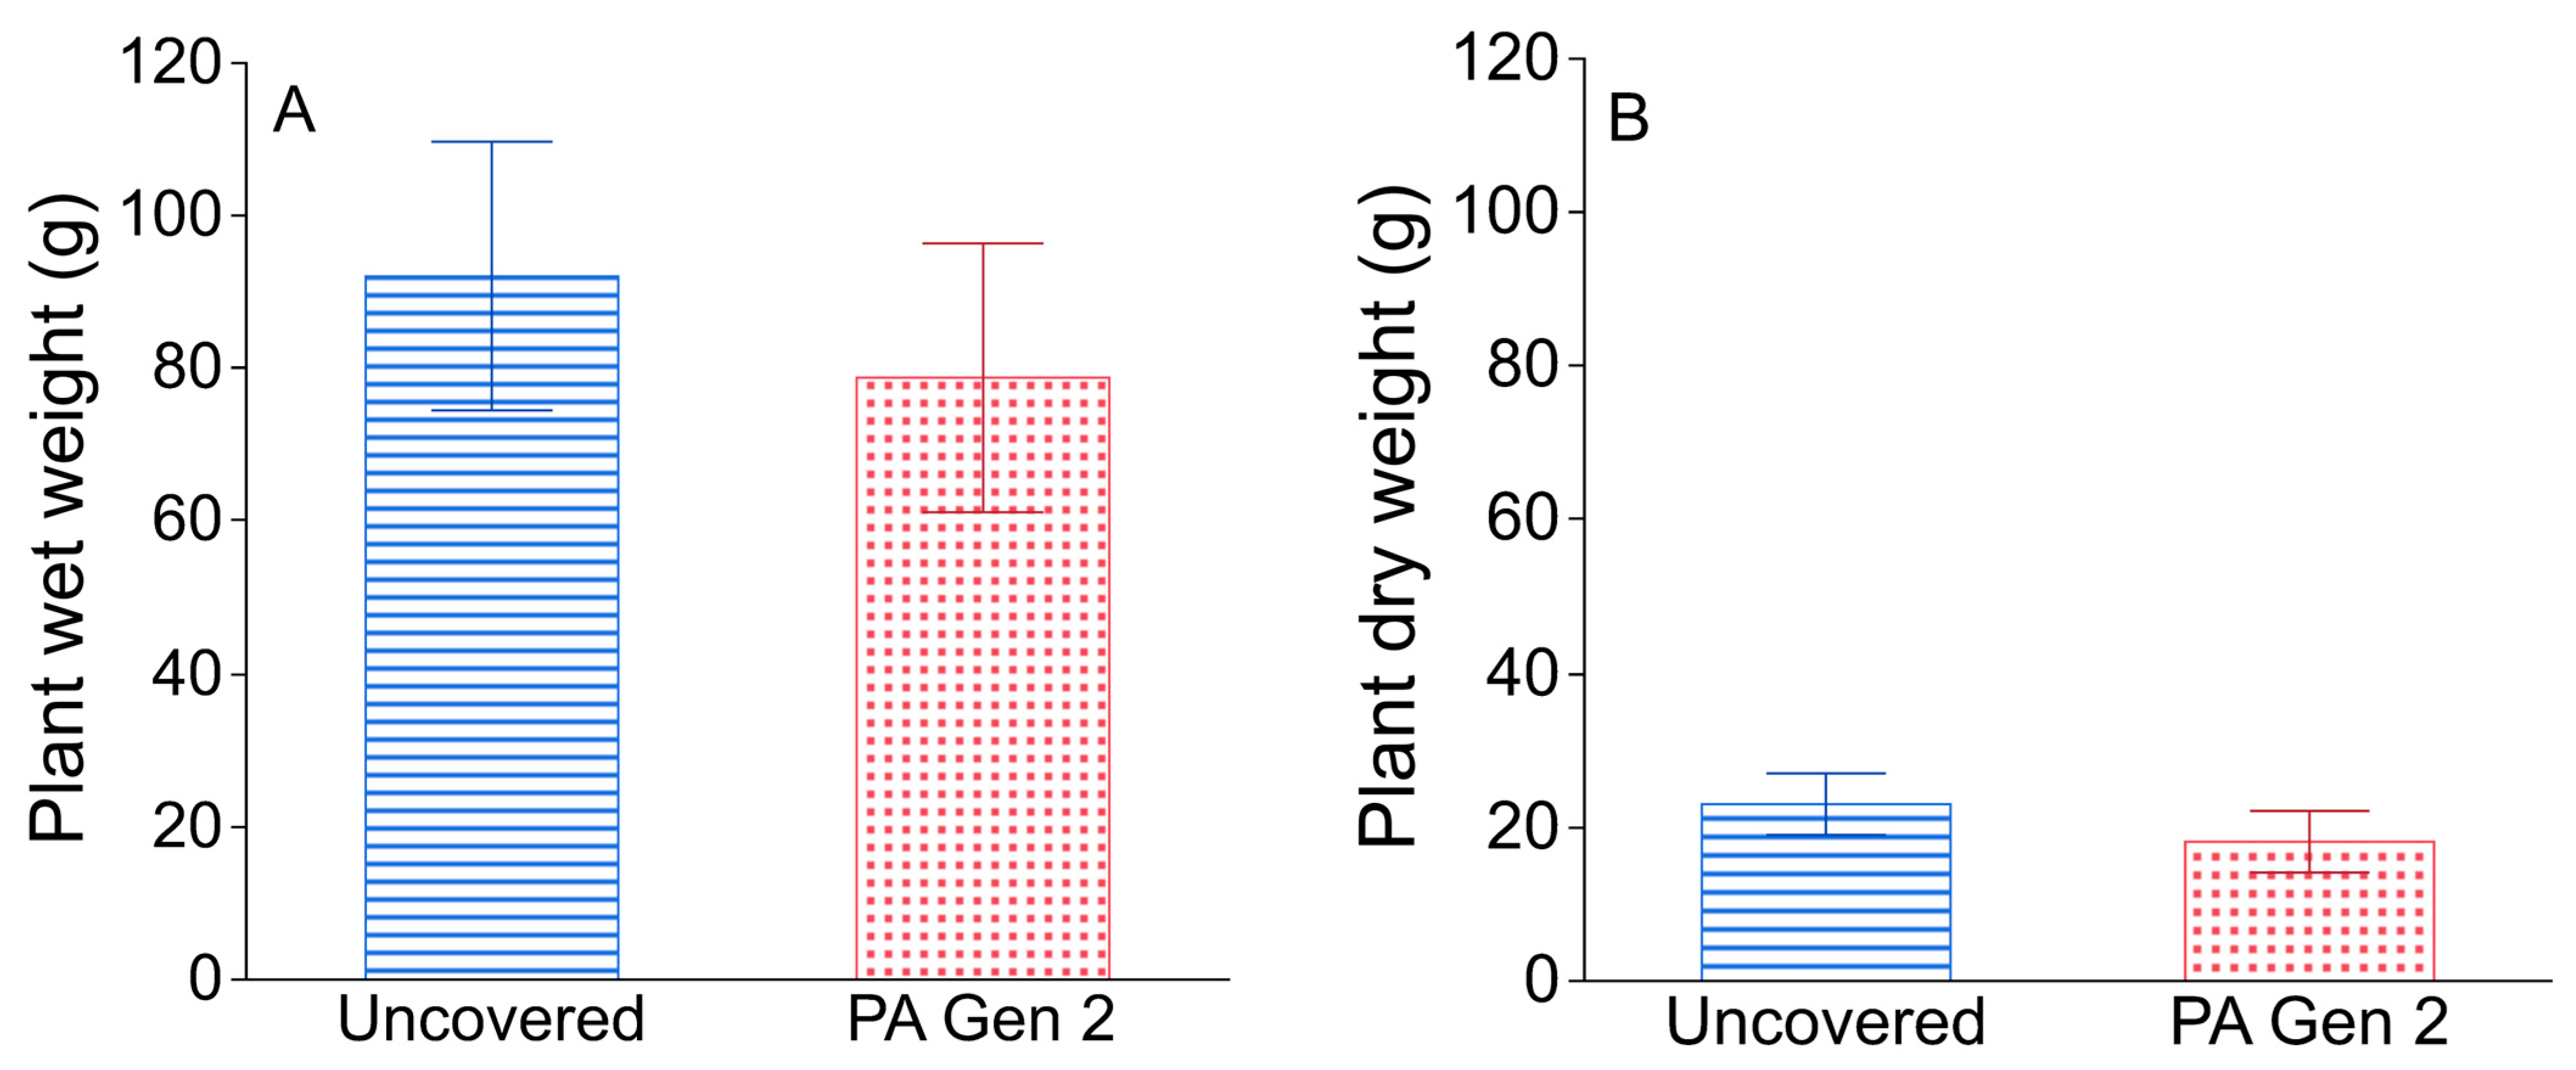
Vegetative biomass (leaves, stems, and roots) between PA Gen 2-covered and uncovered plants was not significantly different in either wet (t2 = 0.29, p = 0.65) or dry (t2 = 0.75, p = 0.45) weight although the trend was that uncovered plants presented a higher mean wet weight (92.1 ± 17.6 g; 95% CI: 16.42, 168) compared to the PA Gen 2-covered plants (78.8 ± 17.6 g; 95% CI: 3.04, 154) (Figure 5A). The same pattern was observed in the dry weight (Figure 5B), in which the uncovered group mean (23 ± 4.01 g; 95% CI: 5.79, 40.3) trend was higher than that of the PA Gen 2-covered group (18.1 ± 4.01 g; 95% CI: 0.88, 35.4).
Figure 5.
Vegetative biomass of uncovered and Plant Armor Generation 2-covered (PA Gen 2) strawberry plants. (A) Mean plant wet weight (g). (B) Mean plant dry weight (g). Values represent the mean of both conditions (n = 6), with error bars representing ±1 standard error of the mean.
3.3. Temperature and Relative Humidity
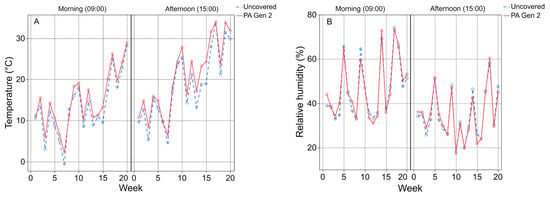
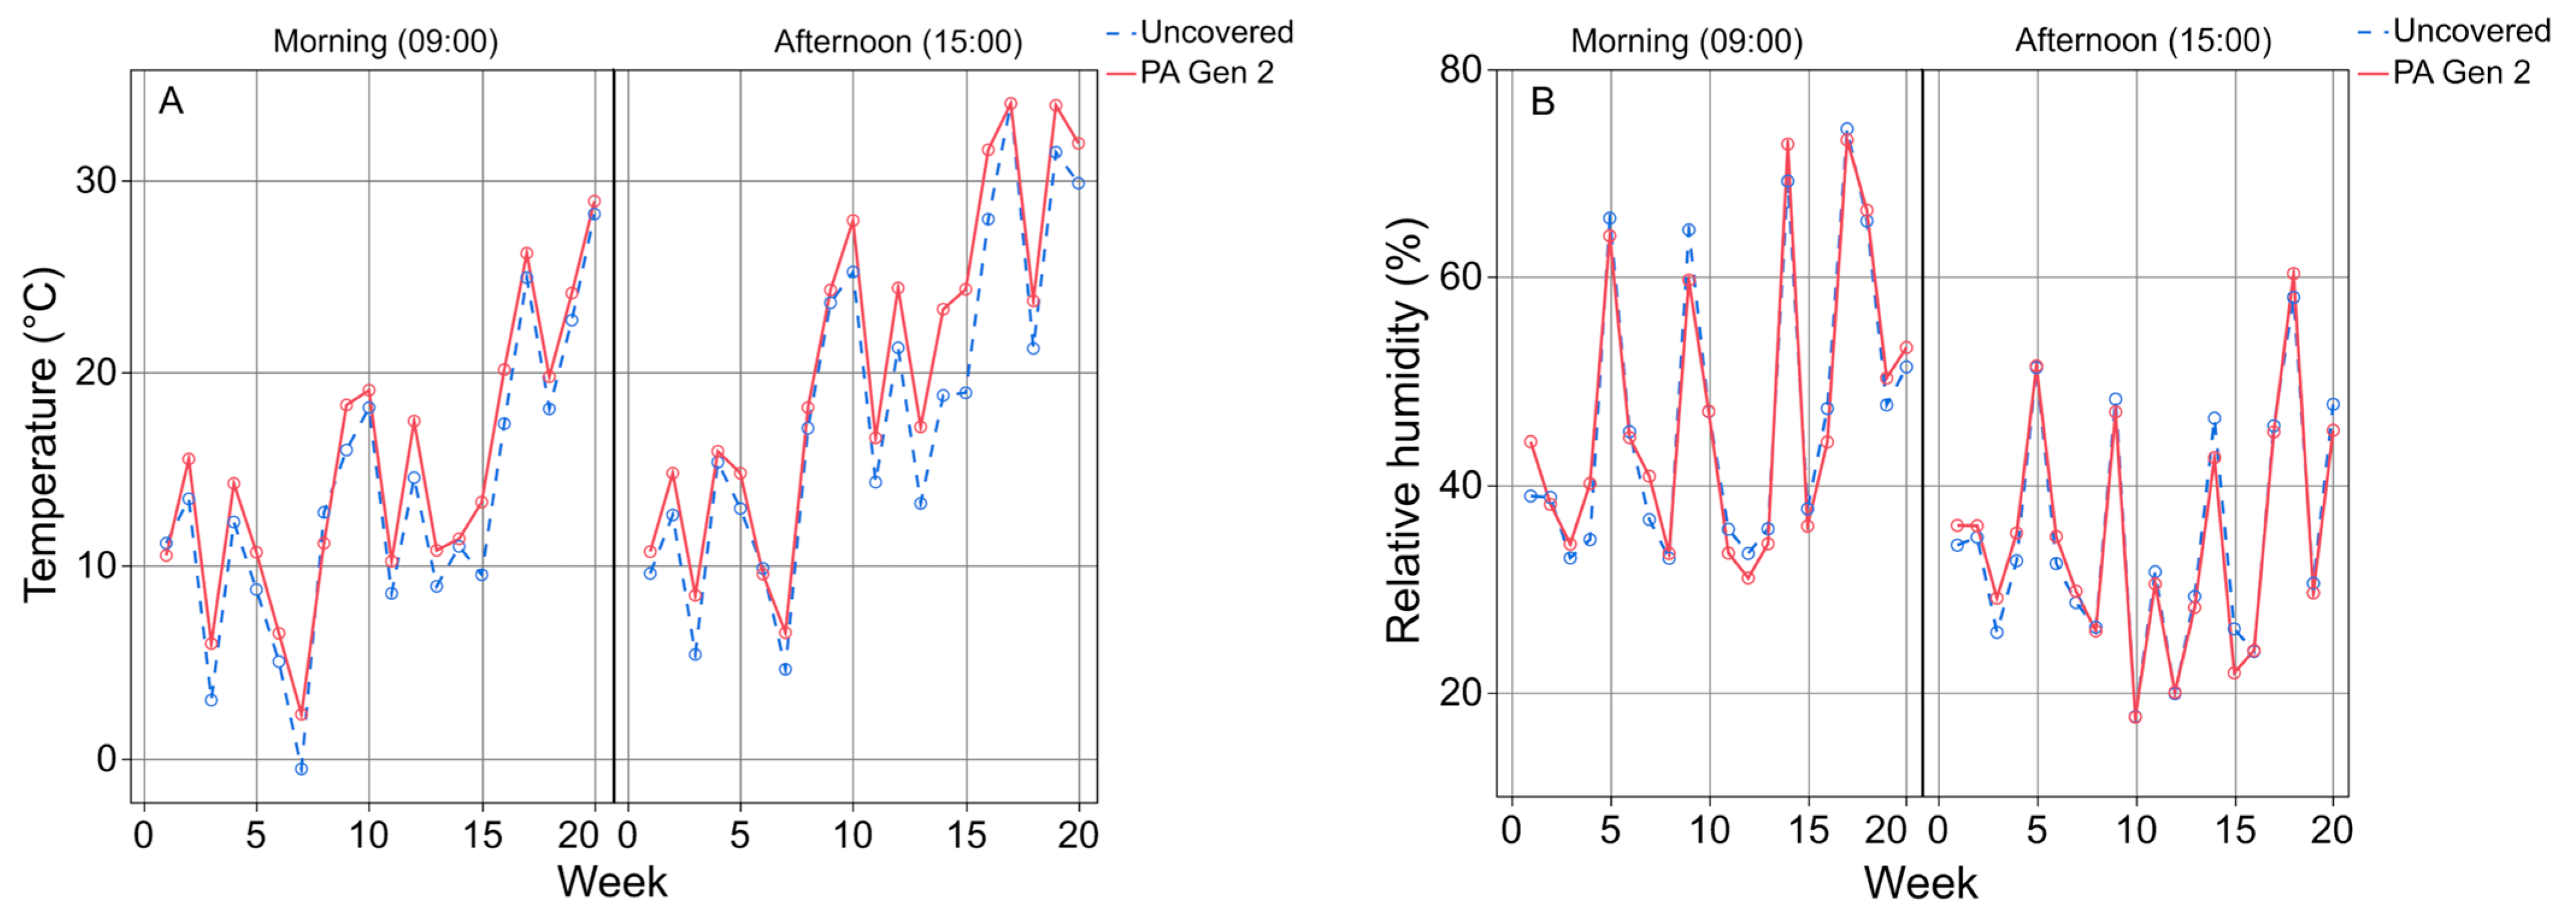
None of the interactions between conditions, i.e., uncovered versus PA Gen 2-covered and between temporal factors, i.e., week and for morning versus afternoon, were statistically different for both temperature and relative humidity. The lowest p-value among the interactions was 0.33. This was consistent with the visual profile of the means (Figure 6), as both profiles possessed almost identical shapes over time. The absence of these interactions justified the investigation of the main effect of condition for each response variable. Both conditions showed similar covariance parameters with respect to the multivariate responses. However, the estimated autoregressive parameter for the PA Gen 2 group was larger than that of the uncovered group (0.3671 vs. 0.1417, respectively), indicating that measurements (on the same experimental unit) from week to week were more strongly correlated in the PA Gen 2 group. Across weeks and times of day, mean temperature was statistically higher (t34.1 = 7.06, p < 0.0001) in PA Gen 2-covered plots than in uncovered plots (Figure 6A). The estimated overall main effect was 1.93 °C with an associated 95% confidence interval (1.19, 2.67). Conversely, relative humidity (RH) showed no statistical difference between the uncovered and PA Gen 2 groups (t48.3 = 0.18, p = 0.8576; Figure 6B).
Figure 6.
Weekly environmental data recorded between 22 November 2024, and 25 April 2025, for uncovered and Plant Armor Generation 2 (PA Gen 2)-covered strawberry plots. (A) Mean temperature (°C) and (B) mean relative humidity (%). Circles represent the estimated mean for each condition over the course of the experiment.
3.4. Identification of Aphid Species
The amplicon sequence of the partial COI gene obtained from the field collected aphids on strawberry plants in the study (uncovered and covered plants) most closely matched sequences from the strawberry yellow rose aphid, Rhodobium porosum Sanderson (Hemiptera: Aphididae) (i.e., a 99.84% match to GenBank accession number ON754832). Further, the specimens matched morphological descriptions of R. porosum. The COI sequence from this study is available in the National Institutes of Health GenBank (accession number PV944120).
3.5. Aphid Penetration Assay
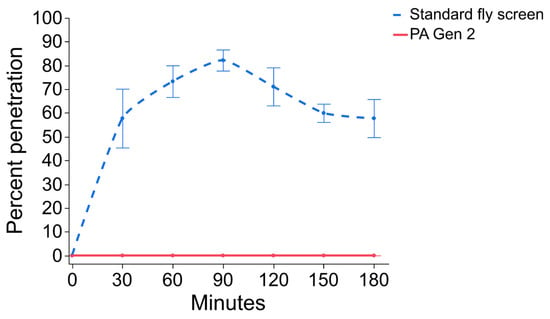
The PA Gen 2 fabric demonstrated absolute exclusion, with no aphid penetration (0%) at any time point during the 180 min assay (Figure 7). Conversely, the standard fly screen (1.5 mm × 1.2 mm mesh control) allowed penetration over time (a significant quadratic logistic regression model (t13 = −2.61, p = 0.0214).
Figure 7.
Percent penetration of aphids through standard fly screen (18 × 16 mesh count; positive control) and Plant Armor Generation 2 (PA Gen 2) over 180 min at 27 ± 1 °C and 50 ± 5% relative humidity during the scotophase. Error bars represent ±1 standard error of the mean.
3.6. Soil Sampling and Colony-Forming Unit
Mean colony-forming units (CFUs) were the same for all groups (Table 1). The CFU data revealed no significant difference in culturable bacterial abundance in the rhizosphere soil between the uncovered and PA Gen 2-covered plots (F1.8 = 0.55, p = 0.48). Similarly, there was no significant effect of the bacterial growth medium (p = 0.95) or the interaction between treatment and medium (p = 0.82).
Table 1.
Estimated marginal means of rhizosphere culturable bacterial populations associated with strawberry plants grown under Plant Armor Generation 2 (PA Gen 2)-covered and uncovered conditions.
4. Discussion
The primary objective of this study was to evaluate the performance of the 3-D spacer fabric, Plant Armor Generation 2 (PA Gen 2) developed by Cave et al. [26] for improving vegetative plant growth using cabbage on whether the same technology could enhance fruit production, using strawberry as a model system. The PA Gen 2-covered cabbage in the 3-mo small-plot study had an average 2.93-fold higher wet weight than uncovered cabbage. The strawberry study was conducted without the application of additional fertilizer other than in the potting mixture used, identical to the cabbage work. No fungicides were used from the time the plants were obtained from a commercial vendor until the end of the study. Insecticidal soap was used to manage an aphid strawberry infestation. We do not have a record of chemical pesticides or fertilizer use on the strawberry plants prior to our acquiring them.
The use of PA Gen 2 covering showed a trend of enhancing early strawberry fruit production. Fruits were harvested one week earlier from plants under the PA Gen 2 covering compared to the uncovered plants which had no harvestable fruits at that time (Figure 4A). This suggests that the microclimate created by PA Gen 2 effectively reduced the time from planting to first berry production, a critical factor for producers aiming for high-value, early-market windows. This effect could be greater or less depending on year-to-year variations in climate conditions and needs further evaluation over different years and geographical locations.
PA Gen 2 substantially improved overall yield metrics. We recorded a 3.56-fold increase in the total number of fruits harvested per plant and a 1.84-fold increase in average fruit weight compared to uncovered controls. Kadir et al. [36] using a single-layer of 0.153 mm thick greenhouse grade polyethylene sheeting compared to open field with Sweet Charlie and Chandler June-bearing strawberry cultivars found similar result to ours, with early fruit production and increase yield when the plants were covered. These results suggest crop coverage can enhance fruit production irrespective of the material used for coverage.
In agronomy, the concept of yield depends on the economic/harvestable part of the crop. Cave et al. [26] obtained a 2.93-increase in yield from PA Gen 2-covered cabbage, a leafy vegetable, compared to uncovered plants. Because strawberries are fruit-bearing rather than leafy, one might expect the fabric to trigger a shade-avoidance response, promoting foliar expansion rather than fruit development. However, we observed the opposite; there were no significant differences in the wet or dry vegetative biomass between covered and uncovered strawberry plants (Figure 5). For strawberries, PA Gen 2 did not cause vegetative “stretching.” Similar results were reported by Kadir et al. [36], who found no significant differences in total shoot biomass and numbers of leaves in Sweet Charlie strawberry plants grown in a tunnel treatment with polyethylene sheeting compared to the open field.
Stable environmental conditions are important in the growth and development of high-value horticultural crops such as strawberry, as fluctuation in environmental parameters such as temperature and relative humidity is known to impact plant health and productivity [37,38]. Extremely high or low temperatures can impair flower production, pollen germination, and photosynthesis, ultimately leading to a reduction in fruit size and fruit number [15,39]. Because of these effects, even a small modification to a crop microclimate can positively influence productivity. In the current study, PA Gen 2 covering increased daytime air temperature by an average of 1.93 °C (Figure 6A) but maintained similar relative humidity (Figure 6B) compared with uncovered plots across the weeks and times of day between November 2024 to April 2025. This indicated that PA Gen 2 provided a slight but consistent warming effect without altering relative humidity. In contrast, Kadir et al. [36], in a study conducted at Wichita, KS, USA, between December and March of 2003–04, reported larger differences between the polyethylene tunnel and open-field, with a 1–2 °C higher minimum and up to 13–14 °C higher maximum air temperature. In their study, retractable sidewalls of the tunnel had to be rolled up to prevent temperature buildup and to ventilate the tunnel, increasing the chance of plant disease, arthropod pest infestation, and labor cost, including monitoring the temperature under the cover in real time. In contrast, in our study, the hoops remained fully covered with PA Gen 2 throughout the experiment for a more controlled environment with lower management requirements.
The impact of relative humidity (RH) on plant disease development is clearly documented, with levels greater than 75% found to significantly promote the percent germination of Sphaerotheca macularis f. sp. fragariae, an obligate parasite that causes powdery mildew of strawberry worldwide [3]. In their review, Mditshwa et al. [25] associated higher RH under shade nets with a possible reduction in evapotranspiration and wind speed. In this present study and that of Cave et al. [26], the RH under the PA Gen 2 was the same as that of the uncovered control. This combined effect of consistent but minimal warming without an increase relative humidity makes PA Gen 2 well suited for environments where warming is beneficial but plant disease pressure from high relative humidity is a concern.
Strawberries are infested by several arthropod pests across different orders of insects and mites. Aphids rarely reach economically damaging levels but their ability to transmit viruses, including Strawberry crinkle cytorhabdovirus (SCrV) and Strawberry mottle virus (SMoV), is important [9,40,41]. In March 2025, we observed small aphid populations on both the PA Gen 2-covered and uncovered plants with no obvious differences in the level of infestation. DNA sequencing and morphological identification indicated the infestation was the yellow rose aphid, Rhodobium porosum (Sanderson) (Hemiptera: Aphididae), a species previously reported on strawberry [42,43,44]. To determine if the aphids crawled from the outside across the PA Gen 2 fabric to the plants, a penetration test was conducted. The test was considered a worst-case scenario that promoted penetration, since the insects were placed on the cloth top surface and confined to the top surface; their survival depended on PA Gen 2 penetration and reaching the strawberry leaf below. The PA Gen 2 fabric demonstrated complete exclusion, with no nymphal aphid penetration observed (Figure 7). Cave et al. [26] found that in small cage studies with PA Gen 2 covering potted cabbage plants the fabric was 100% resistant to penetration by unfed caterpillar neonates, Helicoverpa zea (Boddie), while uncovered plants were skeletonized after 10 d. PA gen 2 was also resistant to tobacco thrips, Frankliniella fusca (Hinds) adults [26]. These findings suggested that the aphids in the strawberry work did not infest the covered plants by penetrating the PA Gen 2 fabric. In North America, R. porosum exhibits a monoecious holocyclic life cycle [40]. Monoecious holocyclic aphids alternate between multiple generations of parthenogenetic reproduction initiated by fundatrices in Spring and a single sexual generation per year (holocyclic), while remaining on a single host plant species throughout their life cycle (monoecious). One explanation for the presence of aphids is infestation before planting, possibly as overwintering eggs. Other explanations could be that the aphids crawled under the fabric or were blown in by wind when the fabric was raised to take the temperature and humidity data. Using friction sealing similar to the strawberry work in lab cabbage bioassays under extreme insect pressure, neonate caterpillars were not able to move under the textile to plants even when they were placed directly on PA Gen 2 [26]. Alternative methods to prevent possible movement under the textile edges could include covering the edges with soil, binding the edges to weighted materials or a ground cover, increasing the drape distance, and treating the edges with a repellent or pesticide.
Soil microorganisms play an important role in maintaining soil health, driving nutrient cycling and supporting plant growth [45]. While the effects of shade nets and tunnels on crop microclimates are well-documented, their specific impact on the rhizosphere microbiota remains an emerging area of study [46,47]. Given the substantial yield disparities observed between the PA Gen 2-covered and uncovered plants in this study, we conducted preliminary studies to determine whether these differences were associated with shifts in soil microbial abundance. The total number of colony-forming units (CFUs) in our results indicated no significant difference in total rhizosphere microbial populations between the PA Gen 2 and uncovered plots (Table 1). Although no significant differences in total rhizosphere microbial populations were observed based on CFUs, it is important to recognize that culture-based approaches capture only a small fraction of the total microbial diversity present in soil. Most soil microorganisms are not readily culturable under standard laboratory conditions due to specific growth requirements and complex ecological interactions [48,49,50]. Therefore, the absence of differences in CFU counts between PA Gen 2 and uncovered plots does not necessarily reflect the global microbial community composition. Future studies using culture-independent approaches, such as high-throughput sequencing, will be needed for a deeper insight into whether PA Gen 2 influences specific rhizosphere microbial groups and might explain its contribution to improved strawberry yield beyond the microclimate modification we found. The sequencing approach although more comprehensive in describing the soil microbiome, requires a comparative analysis at both the microbial DNA and RNA levels; this level of analysis was outside the scope of our study to determine if PA Gen 2 could enhance fruit production like that for cabbage where vegetative growth was most important.
5. Conclusions
PA Gen 2 covering significantly enhanced strawberry yield with a trend for early fruit production. PA Gen 2 had no effect on relative humidity that could promote plant disease and did not elicit a shade-avoidance response. The 3-D structure of the fabric acts as a thermal barrier, keeping heat beneath the cover as outside temperatures decreased. Another advantage is that the textile is permeable to rain, reducing water use. Penetration assays confirmed complete aphid exclusion by the fabric, as previously shown for other arthropod pests [26]. The rhizosphere culturable soil microbial population was not significantly different between covered and uncovered plots in preliminary experiments; however, more work is needed using next-generation 16S rRNA gene sequencing to further characterize the total microbiome. On-farm testing is now needed to examine the utility of this new textile for a variety of crop plants in different geographical locations. The results in this paper teach us that applications in the materials sciences like textile structure, and potentially other non-chemical physical approaches, can be used to improve crop production.
Author Contributions
Conceptualization, A.J.W. and R.M.R.; methodology, G.B.O., J.C., M.A.B., G.L.C., R.A.G., L.P. and R.M.R.; validation, G.B.O., J.C., L.P. and R.M.R.; formal analysis, G.B.O. and J.C.; investigation, G.B.O., M.A.B., L.P. and R.M.R.; resources, M.A.B., G.L.C., A.J.W., L.P., C.E.S. and R.M.R.; data curation, G.B.O. and J.C.; writing—original draft preparation, G.B.O.; writing—review and editing, G.B.O., J.C., M.A.B., G.L.C., R.A.G., A.J.W., L.P., C.E.S. and R.M.R.; visualization, G.B.O.; supervision, L.P. and R.M.R.; project administration, R.M.R.; funding acquisition, R.M.R. and C.E.S. All authors have read and agreed to the published version of the manuscript.
Funding
This project was supported by a grant from the North Carolina Agricultural Foundation (grant number AG00463770). The work was also supported by the Research Capacity Fund (HATCH), project award no. 02853, from the U.S. Department of Agriculture’s National Institute of Food and Agriculture. Any opinions, findings, conclusions, or recommendations expressed in this publication are those of the authors and should not be construed to represent any official USDA or U.S. Government determination or policy.
Data Availability Statement
Data will be made available on request from the corresponding author.
Conflicts of Interest
G.B.O., J.C., M.A.B., G.L.C., R.A.G., L.P., and C.E.S. declare that they have no known competing financial interests or personal relationships that could have appeared to influence the work reported in this paper. The PA Gen 2 fabric studied in this paper was patented by North Carolina State University (US Patent No. 11,582,968 B2; 21 February 2023) with A.J.W. and R.M.R. among others as inventors and is licensed for commercial development by the University.
References
- Food and Agriculture Organization of the United Nations. FAOSTAT: Crops and Livestock Products—Strawberry Production Data. Available online: https://www.fao.org/faostat/en/#data/QCL (accessed on 14 November 2025).
- U.S. Department of Agriculture. Noncitrus Fruits and Nuts 2023 Summary (May 2024); National Agricultural Statistics Service: Washington, DC, USA, 2024.
- Amsalem, L.; Freeman, S.; Rav-David, D.; Nitzani, Y.; Sztejnberg, A.; Pertot, I.; Elad, Y. Effect of Climatic Factors on Powdery Mildew Caused by Sphaerotheca macularis f. sp. fragariae on Strawberry. Eur. J. Plant Pathol. 2006, 114, 283–292. [Google Scholar] [CrossRef] [Scilit]
- Avilés, M.; Pastrana, A.M.; Borrero, C. Emerging Diseases in Spain Strawberry Crops: Neopestalotiopsis Leaf and Crown Rot and Fusarium Wilt. Plants 2024, 13, 3441. [Google Scholar] [CrossRef] [Scilit]
- Rebollar-Alviter, A.; Silva-Rojas, H.V.; Fuentes-Aragón, D.; Acosta-González, U.; Martínez-Ruiz, M.; Parra-Robles, B.E. An Emerging Strawberry Fungal Disease Associated with Root Rot, Crown Rot and Leaf Spot Caused by Neopestalotiopsis rosae in Mexico. Plant Dis. 2020, 104, 2054–2059. [Google Scholar] [CrossRef] [Scilit]
- Bernardi, D.; Araujo, E.S.; Zawadneak, M.A.C.; Botton, M.; Mogor, A.F.; Garcia, M.S. Aphid Species and Population Dynamics Associated with Strawberry. Neotrop. Entomol. 2013, 42, 628–633. [Google Scholar] [CrossRef] [Scilit]
- Bi, J.-L.; Niu, Z.-M.; Yu, L.; Toscano, N.C. Resistance Status of the Carmine Spider Mite, Tetranychus cinnabarinus and the Twospotted Spider Mite, Tetranychus urticae to Selected Acaricides on Strawberries. Insect Sci. 2016, 23, 88–93. [Google Scholar] [CrossRef] [Scilit]
- Holmes, G.J. The California Strawberry Industry: Current Trends and Future Prospects. Int. J. Fruit Sci. 2024, 24, 115–129. [Google Scholar] [CrossRef] [Scilit]
- Liburd, O.; Rhodes, E.; Liburd, O.; Rhodes, E. Management of Strawberry Insect and Mite Pests in Greenhouse and Field Crops. In Strawberry—Pre- and Post-Harvest Management Techniques for Higher Fruit Quality; IntechOpen: London, UK, 2019; ISBN 978-1-83962-254-0. [Google Scholar]
- Khan, B.A.; Nadeem, M.A.; Nawaz, H.; Amin, M.M.; Abbasi, G.H.; Nadeem, M.; Ali, M.; Ameen, M.; Javaid, M.M.; Maqbool, R.; et al. Pesticides: Impacts on Agriculture Productivity, Environment, and Management Strategies. In Emerging Contaminants and Plants: Interactions, Adaptations and Remediation Technologies; Aftab, T., Ed.; Springer International Publishing: Cham, Switzerland, 2023; pp. 109–134. ISBN 978-3-031-22269-6. [Google Scholar]
- Dentzman, K.; Franklin, D.; Avemegah, E.; Goldberger, J.R. An Overview of Agricultural Neonicotinoid Regulation in the EU, Canada, and the United States. Pest Manag. Sci. 2025, 81, 7593–7601. [Google Scholar] [CrossRef] [Scilit]
- Nitzko, S. Consumer Evaluation of Food from Pesticide-Free Agriculture in Relation to Conventional and Organic Products. Farming Syst. 2024, 2, 100112. [Google Scholar] [CrossRef] [Scilit]
- Rahman, S.M.E.; Mele, M.A.; Lee, Y.-T.; Islam, M.Z. Consumer Preference, Quality, and Safety of Organic and Conventional Fresh Fruits, Vegetables, and Cereals. Foods 2021, 10, 105. [Google Scholar] [CrossRef] [Scilit]
- Anderson, H.C.; Rogers, M.A.; Hoover, E.E. Low Tunnel Covering and Microclimate, Fruit Yield, and Quality in an Organic Strawberry Production System. HortTechnology 2019, 29, 590–598. [Google Scholar] [CrossRef] [Scilit]
- Menzel, C.M. A Review of Fruit Development in Strawberry: High Temperatures Accelerate Flower Development and Decrease the Size of the Flowers and Fruit. J. Hortic. Sci. Biotechnol. 2023, 98, 409–431. [Google Scholar] [CrossRef] [Scilit]
- Prohaska, A.; Petit, A.; Lesemann, S.; Rey-Serra, P.; Mazzoni, L.; Masny, A.; Sánchez-Sevilla, J.F.; Potier, A.; Gaston, A.; Klamkowski, K.; et al. Strawberry Phenotypic Plasticity in Flowering Time Is Driven by the Interaction between Genetic Loci and Temperature. J. Exp. Bot. 2024, 75, 5923–5939. [Google Scholar] [CrossRef] [Scilit]
- Yadav, S.; Korat, J.R.; Yadav, S.; Mondal, K.; Kumar, A.; Homeshaveri; Kumar, S. Impacts of Climate Change on Fruit Crops: A Comprehensive Review of Physiological, Phenological, and Pest-Related Responses. Int. J. Environ. Clim. Change 2023, 13, 363–371. [Google Scholar] [CrossRef] [Scilit]
- Ingrao, C.; Strippoli, R.; Lagioia, G.; Huisingh, D. Water Scarcity in Agriculture: An Overview of Causes, Impacts and Approaches for Reducing the Risks. Heliyon 2023, 9, e18507. [Google Scholar] [CrossRef] [Scilit]
- Martínez-Ferri, E.; Soria, C.; Ariza, M.T.; Medina, J.J.; Miranda, L.; Domíguez, P.; Muriel, J.L. Water Relations, Growth and Physiological Response of Seven Strawberry Cultivars (Fragaria × ananassa Duch.) to Different Water Availability. Agric. Water Manag. 2016, 164, 73–82. [Google Scholar] [CrossRef] [Scilit]
- Dorugade, V.; Taye, M.; Qureshi, S.A.; Agazie, T.; Seyoum, B.; Abebe, B.; Komarabathina, S. Agrotextiles: Important Characteristics of Fibres and Their Applications—A Review. J. Nat. Fibers 2023, 20, 2211290. [Google Scholar] [CrossRef] [Scilit]
- Sharma, N.; Allardyce, B.; Rajkhowa, R.; Adholeya, A.; Agrawal, R. A Substantial Role of Agro-Textiles in Agricultural Applications. Front. Plant Sci. 2022, 13, 895740. [Google Scholar] [CrossRef] [Scilit]
- Nordey, T.; Deletre, E.; Mlowe, N.; Martin, T. Nethouses Protect Cucumber Plants from Insect Pests and Increase Yields in Eastern Africa. J. Hortic. Sci. Biotechnol. 2020, 95, 673–678. [Google Scholar] [CrossRef] [Scilit]
- Nordey, T.; Deletre, E.; Mlowe, N.; Martin, T. Small Mesh Nets Protect Tomato Plants from Insect Pests and Increase Yields in Eastern Africa. J. Hortic. Sci. Biotechnol. 2020, 95, 222–228. [Google Scholar] [CrossRef] [Scilit]
- Simon, S.; Komlan, F.A.; Adjaïto, L.; Mensah, A.; Coffi, H.K.; Ngouajio, M.; Martin, T. Efficacy of Insect Nets for Cabbage Production and Pest Management Depending on the Net Removal Frequency and Microclimate. Int. J. Pest Manag. 2014, 60, 208–216. [Google Scholar] [CrossRef] [Scilit]
- Mditshwa, A.; Magwaza, L.S.; Tesfay, S.Z. Shade Netting on Subtropical Fruit: Effect on Environmental Conditions, Tree Physiology and Fruit Quality. Sci. Hortic. 2019, 256, 108556. [Google Scholar] [CrossRef] [Scilit]
- Cave, G.L.; West, A.J.; Mccord, M.G.; Koene, B.; Beck, J.B.; Deguenon, J.M.; Luan, K.; Roe, R.M. Novel 3-D Spacer Textiles to Protect Crops from Insect Infestation and That Enhance Plant Growth. Agriculture 2022, 12, 498. [Google Scholar] [CrossRef] [Scilit]
- Luan, K.; West, A.J.; McCord, M.G.; DenHartog, E.A.; Shi, Q.; Bettermann, I.; Li, J.; Travanty, N.V.; Mitchell, R.D.; Cave, G.L.; et al. Mosquito-Textile Physics: A Mathematical Roadmap to Insecticide-Free, Bite-Proof Clothing for Everyday Life. Insects 2021, 12, 636. [Google Scholar] [CrossRef] [Scilit]
- Rutgers Cooperative Extension of Cumberland County. Spring Row Cover Management For Plasticulture Strawberries—RCE of Cumberland County. Available online: https://cumberland.njaes.rutgers.edu/2026/03/30/spring-row-cover-management-for-plasticulture-strawberries/ (accessed on 3 September 2026).
- Chandler, C.K.; Albregts, E.E.; Howard, C.M.; Brecht, J.K. ‘Sweet Charlie’ Strawberry. HortScience 1997, 32, 1132–1133. [Google Scholar] [CrossRef] [Scilit]
- Lloyd, J.; Farquhar, G.D. Effects of Rising Temperatures and [CO2] on the Physiology of Tropical Forest Trees. Philos. Trans. R. Soc. Lond. B Biol. Sci. 2008, 363, 1811–1817. [Google Scholar] [CrossRef] [Scilit]
- Folmer, O.; Black, M.; Hoeh, W.; Lutz, R.; Vrijenhoek, R. DNA Primers for Amplification of Mitochondrial Cytochrome C Oxidase Subunit I from Diverse Metazoan Invertebrates. Mol. Mar. Biol. Biotechnol. 1994, 3, 294–299. [Google Scholar]
- Favret, C.; Aphid Taxon Community. Blackman & Eastop’s Aphids on the World’s Plants, Version 2.0. Available online: https://aphidsonworldsplants.info/ (accessed on 10 March 2025).
- Blackman, R.; Eastop, V.F. Aphids on The World’s Trees—An Identification and Information Guide; CAB International: Wallingford, UK, 2000. [Google Scholar]
- Herigstad, B.; Hamilton, M.; Heersink, J. How to Optimize the Drop Plate Method for Enumerating Bacteria. J. Microbiol. Methods 2001, 44, 121–129. [Google Scholar] [CrossRef] [Scilit]
- Stroup, W.W.; Ptukhina, M.; Garai, J. Generalized Linear Mixed Models: Modern Concepts, Methods and Applications, 2nd ed.; Chapman and Hall/CRC: New York, NY, USA, 2024; ISBN 978-0-429-09206-0. [Google Scholar]
- Kadir, S.; Carey, E.; Ennahli, S. Influence of High Tunnel and Field Conditions on Strawberry Growth and Development. HortScience 2006, 41, 329–335. [Google Scholar] [CrossRef] [Scilit]
- Chowdhury, M.; Kiraga, S.; Islam, M.N.; Ali, M.; Reza, M.N.; Lee, W.-H.; Chung, S.-O. Effects of Temperature, Relative Humidity, and Carbon Dioxide Concentration on Growth and Glucosinolate Content of Kale Grown in a Plant Factory. Foods 2021, 10, 1524. [Google Scholar] [CrossRef] [Scilit]
- Lysenko, E.A.; Kozuleva, M.A.; Klaus, A.A.; Pshybytko, N.L.; Kusnetsov, V.V. Lower Air Humidity Reduced Both the Plant Growth and Activities of Photosystems I and II under Prolonged Heat Stress. Plant Physiol. Biochem. 2022, 194, 246–262. [Google Scholar] [CrossRef] [Scilit]
- Bhattacharya, A. Effect of Low-Temperature Stress on Germination, Growth, and Phenology of Plants: A Review. In Physiological Processes in Plants Under Low Temperature Stress; Bhattacharya, A., Ed.; Springer: Singapore, 2022; pp. 1–106. ISBN 978-981-16-9037-2. [Google Scholar]
- Barjadze, S.; Karaca, İ.; Yaşar, B.; Japoshvili, G. The Yellow Rose Aphid Rhodobium porosum: A New Pest of Damask Rose in Turkey. Phytoparasitica 2011, 39, 59–62. [Google Scholar] [CrossRef] [Scilit]
- Musaqaf, N.; Sigsgaard, L.; Markussen, B.; Stenberg, J.A. Effects of Strawberry Resistance and Genotypic Diversity on Aphids and Their Natural Enemies. Biol. Control 2022, 170, 104919. [Google Scholar] [CrossRef] [Scilit]
- MacGillivray, M.E. The Yellow Rose Aphid, Rhodobium porosum (Sanderson) (Homoptera: Aphididae), on Strawberry. Can. Entomol. 1963, 95, 892–896. [Google Scholar] [CrossRef] [Scilit]
- Stultz, H.T. APHIDS ON STRAWBERRY IN NOVA SCOTIA1. Can. Entomol. 1968, 100, 869–878. [Google Scholar] [CrossRef] [Scilit]
- Gaetani, R.; Lacotte, V.; Dufour, V.; Clavel, A.; Duport, G.; Gaget, K.; Calevro, F.; Da Silva, P.; Heddi, A.; Vincent, D.; et al. Sustainable Laser-Based Technology for Insect Pest Control. Sci. Rep. 2021, 11, 11068. [Google Scholar] [CrossRef] [Scilit]
- Bayu, T. Systematic Review on the Role of Microbial Activities on Nutrient Cycling and Transformation Implication for Soil Fertility and Crop Productivity. bioRxiv 2024. [Google Scholar] [CrossRef] [Scilit]
- Hoidal, N.; Bugeja, S.; Grossman, J.; Fernandez, A.; Cates, A.M.; LaBine, K.M.; Khokhani, D.; Pagliari, P. Managing Soil Sustainably on Small-Scale Vegetable Farms: Lessons Learned from High Tunnel and Open Field Vegetable Production. bioRxiv 2026. [Google Scholar] [CrossRef] [Scilit]
- Timper, M.H.; Schlatter, D.; Hoidal, N.; Khokhani, D. Comparative Analysis of Soil Microbial Communities in High-Tunnel and Field Agricultural Systems. bioRxiv 2026. [Google Scholar] [CrossRef] [Scilit]
- Lloyd, K.G.; Steen, A.D.; Ladau, J.; Yin, J.; Crosby, L. Phylogenetically Novel Uncultured Microbial Cells Dominate Earth Microbiomes. mSystems 2018, 3, e00055-18. [Google Scholar] [CrossRef] [Scilit]
- McCaig, A.E.; Glover, L.A.; Prosser, J.I. Numerical Analysis of Grassland Bacterial Community Structure under Different Land Management Regimens by Using 16S Ribosomal DNA Sequence Data and Denaturing Gradient Gel Electrophoresis Banding Patterns. Appl. Environ. Microbiol. 2001, 67, 4554–4559. [Google Scholar] [CrossRef] [Scilit]
- Staley, J.T.; Konopka, A. Measurement of in Situ Activities of Nonphotosynthetic Microorganisms in Aquatic and Terrestrial Habitats. Annu. Rev. Microbiol. 1985, 39, 321–346. [Google Scholar] [CrossRef]

Disclaimer/Publisher’s Note: The statements, opinions and data contained in all publications are solely those of the individual author(s) and contributor(s) and not of MDPI and/or the editor(s). MDPI and/or the editor(s) disclaim responsibility for any injury to people or property resulting from any ideas, methods, instructions or products referred to in the content. |
© 2026 by the authors. Licensee MDPI, Basel, Switzerland. This article is an open access article distributed under the terms and conditions of the Creative Commons Attribution (CC BY) license.