


Abstract
Understanding mass transfer mechanisms during coffee drying is essential for optimizing postharvest processing conditions. This study aimed to estimate the effective moisture diffusivity coefficient () and convective mass transfer coefficient () of Coffea arabica L. var. Catimor through mathematical modeling. Drying experiments were conducted in an automated convection dryer (CE 130) at four constant temperatures (40, 50, 60, and 70 °C) and an air velocity of 1.5 m/s. Drying time, equilibrium moisture content (), and critical moisture content () were determined. A MATLAB based algorithm was developed to solve Fick’s second law and estimate and during coffee drying. An Arrhenius-type model was further applied to describe the temperature dependence of both coefficients. Although the model captured the general increasing trend with temperature, only moderate coefficients of determination were obtained (R2 = 0.63 for and R2 = 0.74 for ). Drying times were 26.5, 17.5, 16.5, and 13.5 h at 40, 50, 60, and 70 °C, respectively. ranged from 11.30% to 11.76% (wet basis), while remained close to 46% (wet basis) at all temperatures. ranged from , whereas ranged from 1. Both coefficients increased with temperature, indicating enhanced internal diffusion and external mass transfer. These findings provide useful engineering parameters for modeling, design, and optimization of industrial coffee drying processes.
1. Introduction
The current development of the coffee market, characterized by increasing competition based on quality, requires reliable relationships within the supply chain and a willingness to address technological and engineering challenges aimed at improving agricultural management practices and product handling processes [1]. Coffee production in Peru, particularly of the Catimor variety, has become highly significant within the agricultural sector, not only because of its economic contribution but also due to its impact on the environmental and social sustainability of hundreds of coffee-growing families across the country [2,3,4]. Peru ranks among the top ten coffee producers worldwide, with an annual production of approximately 210,000 tons. This production generates around US$1.1 billion in revenue for small farming communities [5].
Drying is one of the most critical post-harvest operations in coffee processing because it directly affects physicochemical stability, microbial safety, sensory quality, and commercial value [6,7,8]. After harvesting and washing, coffee beans typically contain moisture contents close to 50–55% (wet basis), requiring controlled drying to ensure safe storage and preservation of quality attributes [9]. Traditional sun drying remains widely used in producing countries [10]; however, alternative techniques such as forced convection drying, intermittent drying, solar-assisted drying, and hybrid mechanical drying systems have been increasingly investigated to improve drying efficiency, reduce process variability, and preserve grain quality [7,11,12,13,14]. Compared with natural drying, controlled convective drying allows better regulation of air temperature and velocity, resulting in shorter drying times and improved uniformity of moisture removal [15].
From an engineering perspective, mathematical modeling plays a significant role in food processing [16,17,18]; it is also essential for describing the transport phenomena that occur during drying and for predicting the system’s behavior under different operating conditions [19,20,21]. Mechanistic and empirical models are widely used to estimate drying kinetics, optimize processing parameters, and support industrial equipment design and scale-up [14,22,23,24,25,26]. In coffee systems, predictive equations describing variations in bean volume, density, and internal structure have been successfully incorporated into heat and mass transfer simulations to improve the representation of moisture transport mechanisms during processing [19,27].
Fick’s law, which describes mass diffusion, has been fundamental in the study of mass transfer phenomena, particularly in food drying. In food drying processes, Fick’s second law is commonly applied to model moisture reduction in food products, which is a critical factor for maintaining product quality and shelf life [28]. Various mechanisms and modeling approaches have been proposed to describe this phenomenon, ranging from analytical solutions to numerical methods, reflecting the complexity of drying under different operating conditions. Studies on water diffusivity and drying modeling have revealed important challenges. For example, variability in the physical properties of foods, such as geometry and porosity, can significantly affect the water diffusion coefficient [29]. Recent studies have applied Fick’s law to estimate effective diffusion coefficients from experimental data obtained during convective drying processes of food products [28,30]. However, the regulation of mass transfer during drying is not constant: drying tends to be rapid during the initial stages and is followed by a slower drying period, which often requires adjustments in the mathematical model [21].
In addition, mathematical models describing moisture transfer from food to the surrounding environment during drying depend on parameters that are influenced, among other factors, by the structural and geometric characteristics of the food [12,13,14,31,32]. Two key parameters are the effective diffusivity coefficient (), which represents the rate at which water diffuses from the interior of the coffee bean toward its surface, and the convective mass transfer coefficient (), which represents the rate at which water is transferred from the bean surface to the surrounding air [7]. According to [33,34], one of the main challenges in drying research is obtaining explicit and reliable values for and . In practice, many researchers rely on previously published data for these coefficients because of the limited availability of experimentally determined values [35]. In the case of coffee drying, the one-dimensional diffusion problem is commonly approximated by assuming a spherical geometry with radius , and the analytical solution of Fick’s law can be expressed as an infinite series of dimensionless terms.
The availability of experimentally determined transport parameters remains a major limitation in the modeling and optimization of coffee drying processes. In particular, reliable estimates of effective moisture diffusivity () and convective mass transfer coefficient () are essential for accurately describing moisture transport, predicting drying times, and improving process control during convective drying [36]. However, experimental studies reporting the simultaneous estimation of these coefficients remain scarce, particularly for Coffea arabica L. var. Catimor under controlled drying conditions. Most previous coffee drying studies have focused primarily on drying kinetics, thin-layer modeling, moisture ratio prediction, or estimation of effective diffusivity, whereas limited information is available regarding the simultaneous determination of internal and external mass transfer parameters ( and ) under controlled drying conditions [37,38]. Consequently, the lack of experimentally determined and values restrict the development of reliable predictive models and limits the accurate design, simulation, optimization, and scale-up of industrial coffee drying systems. By providing simultaneous estimates of these transport coefficients and their temperature dependence, the present study contributes engineering parameters that can be directly incorporated into process simulation, dryer design, and drying optimization strategies for coffee processing.
Despite the importance of drying in coffee processing, limited experimental information is available on the estimation of effective diffusivity () and convective mass transfer coefficients () for specific coffee varieties under controlled drying conditions. Reliable estimation of these parameters is essential for improving the understanding and optimization of drying processes. Therefore, the objective of this study was to estimate the effective moisture diffusivity () and convective mass transfer coefficient () during convective drying of Coffea arabica L. var. Catimor using mathematical modeling based on Fick’s second law. Specifically, the study aimed to determine the critical moisture content ( and equilibrium moisture content (), both on a wet basis, construct drying kinetics curves at different temperatures (40, 50, 60, and 70 °C), develop a numerical solution algorithm for Fick’s second law using MATLAB, and evaluate the temperature dependence of the transport coefficients by estimating activation energy () and pre-exponential factors ( and ) through an Arrhenius-type model.
2. Materials and Methods
2.1. Study Materials
Twelve kilograms of coffee cherries were harvested from a farm located in the Meseta sector (lat: −5.311938°, long: −78.8877384°, altitude: 1513 m), El Cruce hamlet, Jaén district, Jaén province, Peru (August 2025). The cherries were manually and selectively harvested at full ripeness, pulped, and fermented in cement tanks for 14 h. After fermentation, the beans were washed to remove residual mucilage, resulting in washed parchment coffee (coffee beans enclosed by the parchment layer). The samples were then packed in polyethylene bags and transported to the laboratory, where damaged beans and foreign material were manually removed before the drying experiments.
2.2. Drying Process
The drying process was carried out in an automated convection dryer (model CE 130, GUNT Gerätebau GmbH, Hamburg, Germany), equipped with a drying channel, blower, heating device, and integrated scale. The blower had a power of 33 W and a mass flow rate of 700 m3/h. The equipment operates within measurement ranges of 0–100% relative humidity, 0–125 °C temperature, and 0–1.5 m/s air velocity.
The drying temperatures (40, 50, 60, and 70 °C) were selected to evaluate the temperature dependence of moisture transport parameters over a broad experimental range commonly employed in laboratory-scale drying studies of coffee and other agricultural products. While temperatures between 40 and 50 °C are generally recommended for commercial coffee drying to preserve physical and sensory quality, higher temperatures were included in the present study primarily to improve characterization of the thermal dependence of effective diffusivity and convective mass transfer coefficients and to support Arrhenius-type modeling. Similar temperature intervals have been used in previous drying kinetics studies of Coffea arabica under controlled convective drying conditions [7,11].
Air velocity inside the drying chamber was maintained at 1.5 m/s to ensure stable external mass transfer conditions and reduce boundary-layer resistance during drying. This velocity range is commonly recommended for thin-layer convective drying experiments aimed at estimating effective moisture diffusivity [25].
The drying experiments were conducted using a completely randomized experimental design with one factor (drying temperature) evaluated at four levels (40, 50, 60, and 70 °C), with three independent replicates per treatment. Air velocity (1.5 m/s) was maintained constant throughout the experiments to isolate the effect of temperature on moisture transport behavior. This design allowed evaluation of the temperature dependence of drying kinetics and estimation of effective diffusivity and convective mass transfer coefficients under controlled thin-layer drying conditions.
A total of 12 kg of washed parchment coffee was dried. The samples were weighed using an analytical balance (Gram Core EM, GRAM Precision S.L., L’Hospitalet de Llobregat, Barcelona, Spain) with a sensitivity of 0.1 mg and divided into 3 kg per temperature treatment (1 kg per replicate). The three replicates corresponding to each temperature treatment were dried independently in separate experimental runs to ensure the independence of the experimental units and account for run-to-run variability. Each replicate consisted of 1 kg of coffee uniformly distributed between two stainless-steel drying trays (398 mm × 320 mm each) supplied with the CE 130 convection dryer. Both trays were operated simultaneously and together constituted a single experimental unit rather than independent replicates. The coffee was arranged as a thin layer with an approximate thickness of 1–2 beans (approximately 8–15 mm), ensuring uniform airflow exposure and minimizing bed resistance to moisture transfer. Drying was conducted until the moisture content reached approximately 12% (wet basis), corresponding to the recommended safe storage moisture content for parchment coffee during postharvest handling and commercialization.
2.3. Calculation of Kinetic Parameters
2.3.1. Construction of Drying Curves and Drying Rate Curves
The drying curves for each study temperature (40, 50, 60, and 70 °C) were constructed using the wet basis moisture content () of each sample (y-axis) as a function of drying time (s) (x-axis). The weight of the samples was recorded every 30 min. The wet basis moisture content was calculated according to Equations (1)–(3) [14,22,23].
where is the moisture content on a wet basis at a given time (%), P is the weight of the sample at a given time (g), is the mass of dry solids over a given period (g), is the mass of water at a given time (g), and is the initial moisture content of the sample on a wet basis (%).
Likewise, the drying rate curves for each temperature were plotted with the free moisture values of each sample on the x-axis using Equation (4) versus the drying rate or speed on the y-axis using Equation (5) [39,40,41]. Data visualization and graphical representation of drying curves and drying rate profiles were performed using MATLAB R2024b (MathWorks Inc., Natick, MA, USA), generating plots of moisture content (% wet basis) versus time (), where the data points were connected by lines to illustrate the drying trend [42].
where is the free moisture content on a wet basis (%), is the equilibrium moisture content on a wet basis (%), is the drying rate (h−1), is the free moisture content at a given time (%), is the free moisture content at a subsequent time (%), is the specified drying time (h) and is the subsequent drying time (h).
2.3.2. Estimation of Equilibrium Moisture Content and Determination of Critical Moisture Content
The equilibrium moisture content ) used for the construction of drying rate curves was not determined using sorption isotherm models but was operationally estimated for each temperature level considering the relative humidity measured inside the drying chamber during the experiments. These values represent operational equilibrium conditions associated with the psychometric state of the drying air and were used as reference moisture contents for the calculation of free moisture during drying. This approach was adopted because the objective of the study was to characterize moisture transport under the specific drying conditions established in the convection dryer rather than to determine the thermodynamic sorption behavior of the coffee beans. The corresponding relative humidity and equilibrium moisture values for each temperature are summarized in Table 1. Although this approach provides practical reference values for drying analysis, the use of operationally estimated values may introduce uncertainty into the calculation of free moisture content and, consequently, into the estimation of transport parameters derived from the drying rate curves.
Table 1.
Relative humidity inside the drying chamber and equilibrium moisture content used to plot the drying rate curve.
The critical moisture content ((), % wet basis) was determined from the drying rate curves following the procedure described by Parra-Coronado et al. [43]. First, the drying rate for each consecutive interval was calculated as:
where () is the drying rate for interval () (h−1), () and () are the free moisture contents at two consecutive drying times, and () and () are the corresponding drying times. The maximum drying rate was then identified as:
The critical moisture content was defined as the wet-basis moisture content corresponding to () [14,31,32]. This criterion allowed objective identification of the transition between the constant-rate period and the falling-rate period.
2.4. Mathematical Modeling for Calculating the and Coefficients
2.4.1. Experimental Determination of and
For the experimental determination of the coefficients and , one-dimensional moisture diffusion in a sphere was assumed, considering that the coffee bean approximates this geometry [44,45]. A homogeneous sphere of radius , centered at the origin of the coordinate system (), was considered, with the spatial domain defined in the interval . The sphere was assumed to be immersed in an external medium maintained at constant temperature and humidity, with a uniform initial moisture distribution equal to . The equivalent radius of the coffee bean was calculated as . This parameter was experimentally determined from direct measurements of the orthogonal dimensions (length, width, and thickness) of 20 randomly selected coffee beans using a digital vernier caliper (model 2436616, RS PRO, RS Components Ltd., Corby, UK) with a resolution of 0.01 mm, in accordance with the methodology described Araujo et al. [46]. This value is consistent with the geometric dimensions reported for Coffea arabica beans under similar moisture conditions, where equivalent radius typically range between 3.5 and 4.5 mm depending on variety and drying stage [19,20,27].
The spherical geometry and constant-radius assumptions were adopted as practical simplifications commonly used in diffusion-based drying models for agricultural products [44,45]. Although coffee beans exhibit ellipsoidal shape and may undergo dimensional changes during drying, shrinkage was not measured in the present study and was therefore neglected in the mathematical formulation. The equivalent radius was assumed to remain constant throughout the drying process, allowing application of the analytical solution of Fick’s second law. Consequently, the estimated values of , and should be interpreted as effective transport parameters that incorporate the combined influence of geometry, structural heterogeneity, and dimensional changes occurring during drying rather than as intrinsic material properties.
The diffusion equation applied in this study is given in Equation (9) [35,47].
with the initial condition given in Equation (10)
and boundary conditions in Equation (11)
Mass transfer equation for a sphere under unsteady-state conditions (Equation (12)) [47].
where is the moisture content (% wet basis) at a specific time and position; is the equilibrium moisture content (% wet basis); is the initial moisture content (% wet basis), n is the term number of the infinite series solution, are the positive roots of the equation, is the radial coordinate inside the spherical geometry (m), L is the equivalent radius of the coffee bean (m), t is the drying time at a given moment (s) and is the effective diffusivity coefficient (m2/s).
To solve Equation (12), the monotonic convergence property was applied, and a least-squares fit of the experimental drying data (moisture content in % wet basis and time in seconds) to the first term of the infinite series was performed [36]. This approximation is commonly adopted for long drying periods, where the higher-order terms become negligible and moisture transport is predominantly governed by internal diffusion within the spherical geometry. Taking logarithms of the simplified expression yields Equation (13).
Thus, the experimental data were fitted to a straight line of the form: , where Equation (11) represents the y-axis, and represents the x-axis, corresponding to time (s). The coefficients and were determined using Equations (16) and (15), respectively.
From the intercept value b, the first root of Equation (15) was determined numerically using the bisection method implemented in MATLAB [48]. The iterative procedure was performed over the interval [2,3], which ensured convergence of the solution for spherical geometry. In addition, the dimensionless radial position was assumed to be equal to unity (), corresponding to moisture evaluation at the surface of the spherical particle, as commonly adopted in diffusion-based drying models. Convergence was achieved after 50 iterations using an absolute tolerance criterion of , resulting in a final numerical error of .
Using the calculated root , the coffee bean radius , and the negative slope of the fitted line, the effective diffusivity coefficient was calculated according to Equations (16) and (17). The negative sign reflects the decrease in moisture ratio with drying time.
Finally, the coefficient was obtained by calculating the modulus using the root according to Equations (18)–(20):
where is the Biot number for mass transfer (dimensionless), representing the ratio between internal diffusion resistance and external convective mass transfer resistance and is the convective mass transfer coefficient (m/s).
2.4.2. Prediction of and at Different Temperatures
The prediction of the and coefficients at different temperatures was performed assuming an Arrhenius-type dependence on temperature [49,50,51]. The coefficients were linearized according to the Arrhenius model using the corresponding drying temperatures. Equations (21) and (22) were used for the effective moisture diffusivity coefficient ():
Equations (23) and (24) were used for the convective mass transfer coefficient ():
where is the pre-exponential factor of effective moisture diffusivity (m2/s), is the pre-exponential factor of the convective mass transfer coefficient (m/s), is the activation energy associated with moisture diffusion or external mass transfer (kJ/mol), R is the universal gas constant (8.314 J/mol K), and is the drying air temperature (°C), expressed in absolute temperature as TA + 273.15 (K).
The and the pre-exponential factors and were obtained from the slopes and intercepts of the straight-line plots constructed from and versus respectively. Using the obtained values and the corresponding pre-exponential factors for each coefficient, the values of and were predicted at different coffee drying temperatures.
2.5. Data Analysis
The experiments were performed in triplicate, and results are expressed as means ± standard deviations. Differences among temperature treatments were evaluated using one-way analysis of variance (ANOVA) implemented in Python (version 3.10, Python Software Foundation, Wilmington, DE, USA) using the SciPy (version 1.13.1) and NumPy (version 1.26.4) scientific computing libraries. When significant differences were detected, Tukey’s multiple comparison test was applied at a 95% confidence level. Experimental drying data were recorded and organized using Microsoft Excel 365 (Microsoft Corp., Redmond, WA, USA). The numerical solution of Fick’s second law and estimation of effective diffusivity and convective mass transfer coefficients were implemented in MATLAB (version R2024b, MathWorks Inc., Natick, MA, USA). Mathematical model performance was evaluated using regression analysis and goodness-of-fit indicators, including the coefficient of determination (R2) and mean square error (MSE). Additionally, a comparative analysis between the transport coefficients obtained from Fick’s second law and those predicted using Arrhenius-type relationships was performed by calculating the relative error (%) between both approaches at each temperature level. This comparison allowed evaluation of the predictive capability of the Arrhenius model and verification of the consistency of temperature-dependent transport parameters derived from both analytical and empirical formulations.
3. Results
3.1. Drying Curves and Calculation of Kinetic Parameters
Table 2 shows the drying times required to achieve moisture reduction at the evaluated temperatures. Drying time decreased significantly with increasing temperature (p < 0.05), confirming the strong influence of temperature on the drying kinetics of Coffea arabica L. var. Catimor. The reduction in drying time with increasing temperature reflects the enhancement of moisture diffusion and vapor pressure gradients within the coffee bean matrix under higher thermal conditions.
Table 2.
Drying times for coffee (Coffea arabica L. var. Catimor) at the temperatures studied.
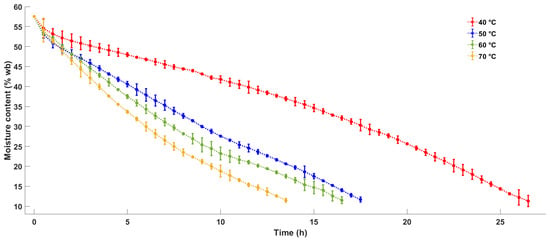
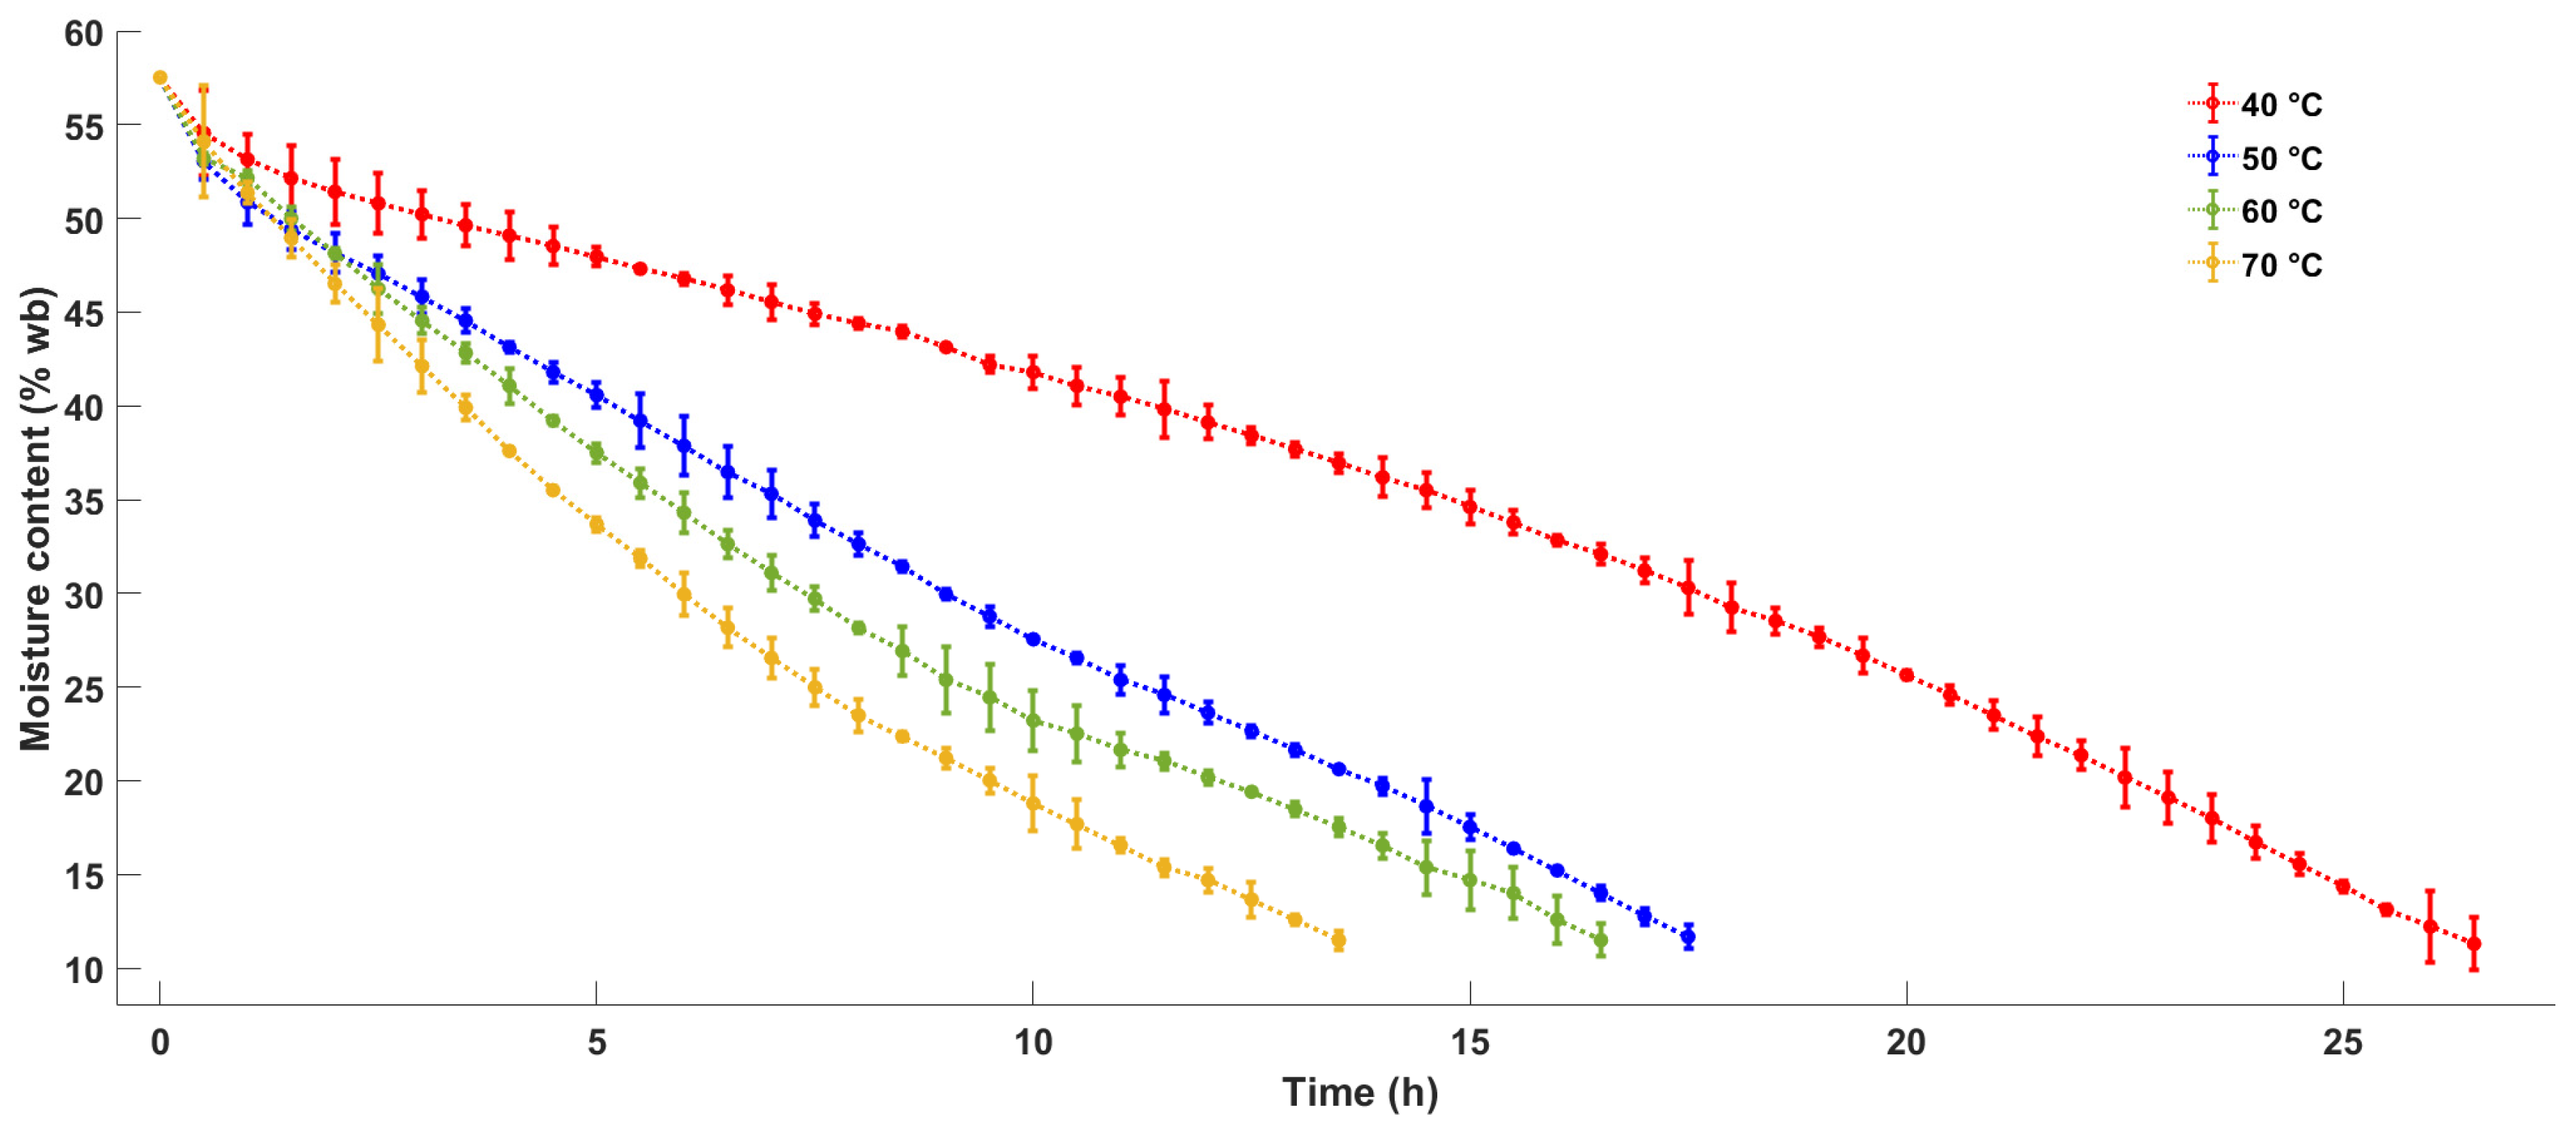
Figure 1 shows the evolution of the moisture content (% wet basis) of Coffea arabica L. Please confirm if the italics are necessary; if not, please remove them. The following highlight is the same. var. Catimor during the drying process at the temperatures used in this study. Each line connects the experimental moisture values measured at regular intervals. The curves exhibit behavior typical of a convective drying kinetic process controlled by internal diffusion, characterized by a rapid initial decrease in moisture (short constant-rate phase) followed by a slower reduction stage (prolonged falling-rate phase). The effect of temperature is exponential, significantly accelerating the mass transfer process and reducing the time required to reach the target moisture content (<12% wet basis).
Figure 1.
Drying curves of Coffea arabica L. var. Catimor at different drying temperatures (40, 50, 60, and 70 °C). Moisture content is expressed on a wet basis (% wb). Error bars represent standard deviation of three replicates.
3.2. Calculation of Kinetic Parameter
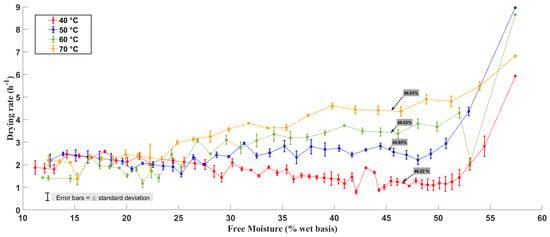
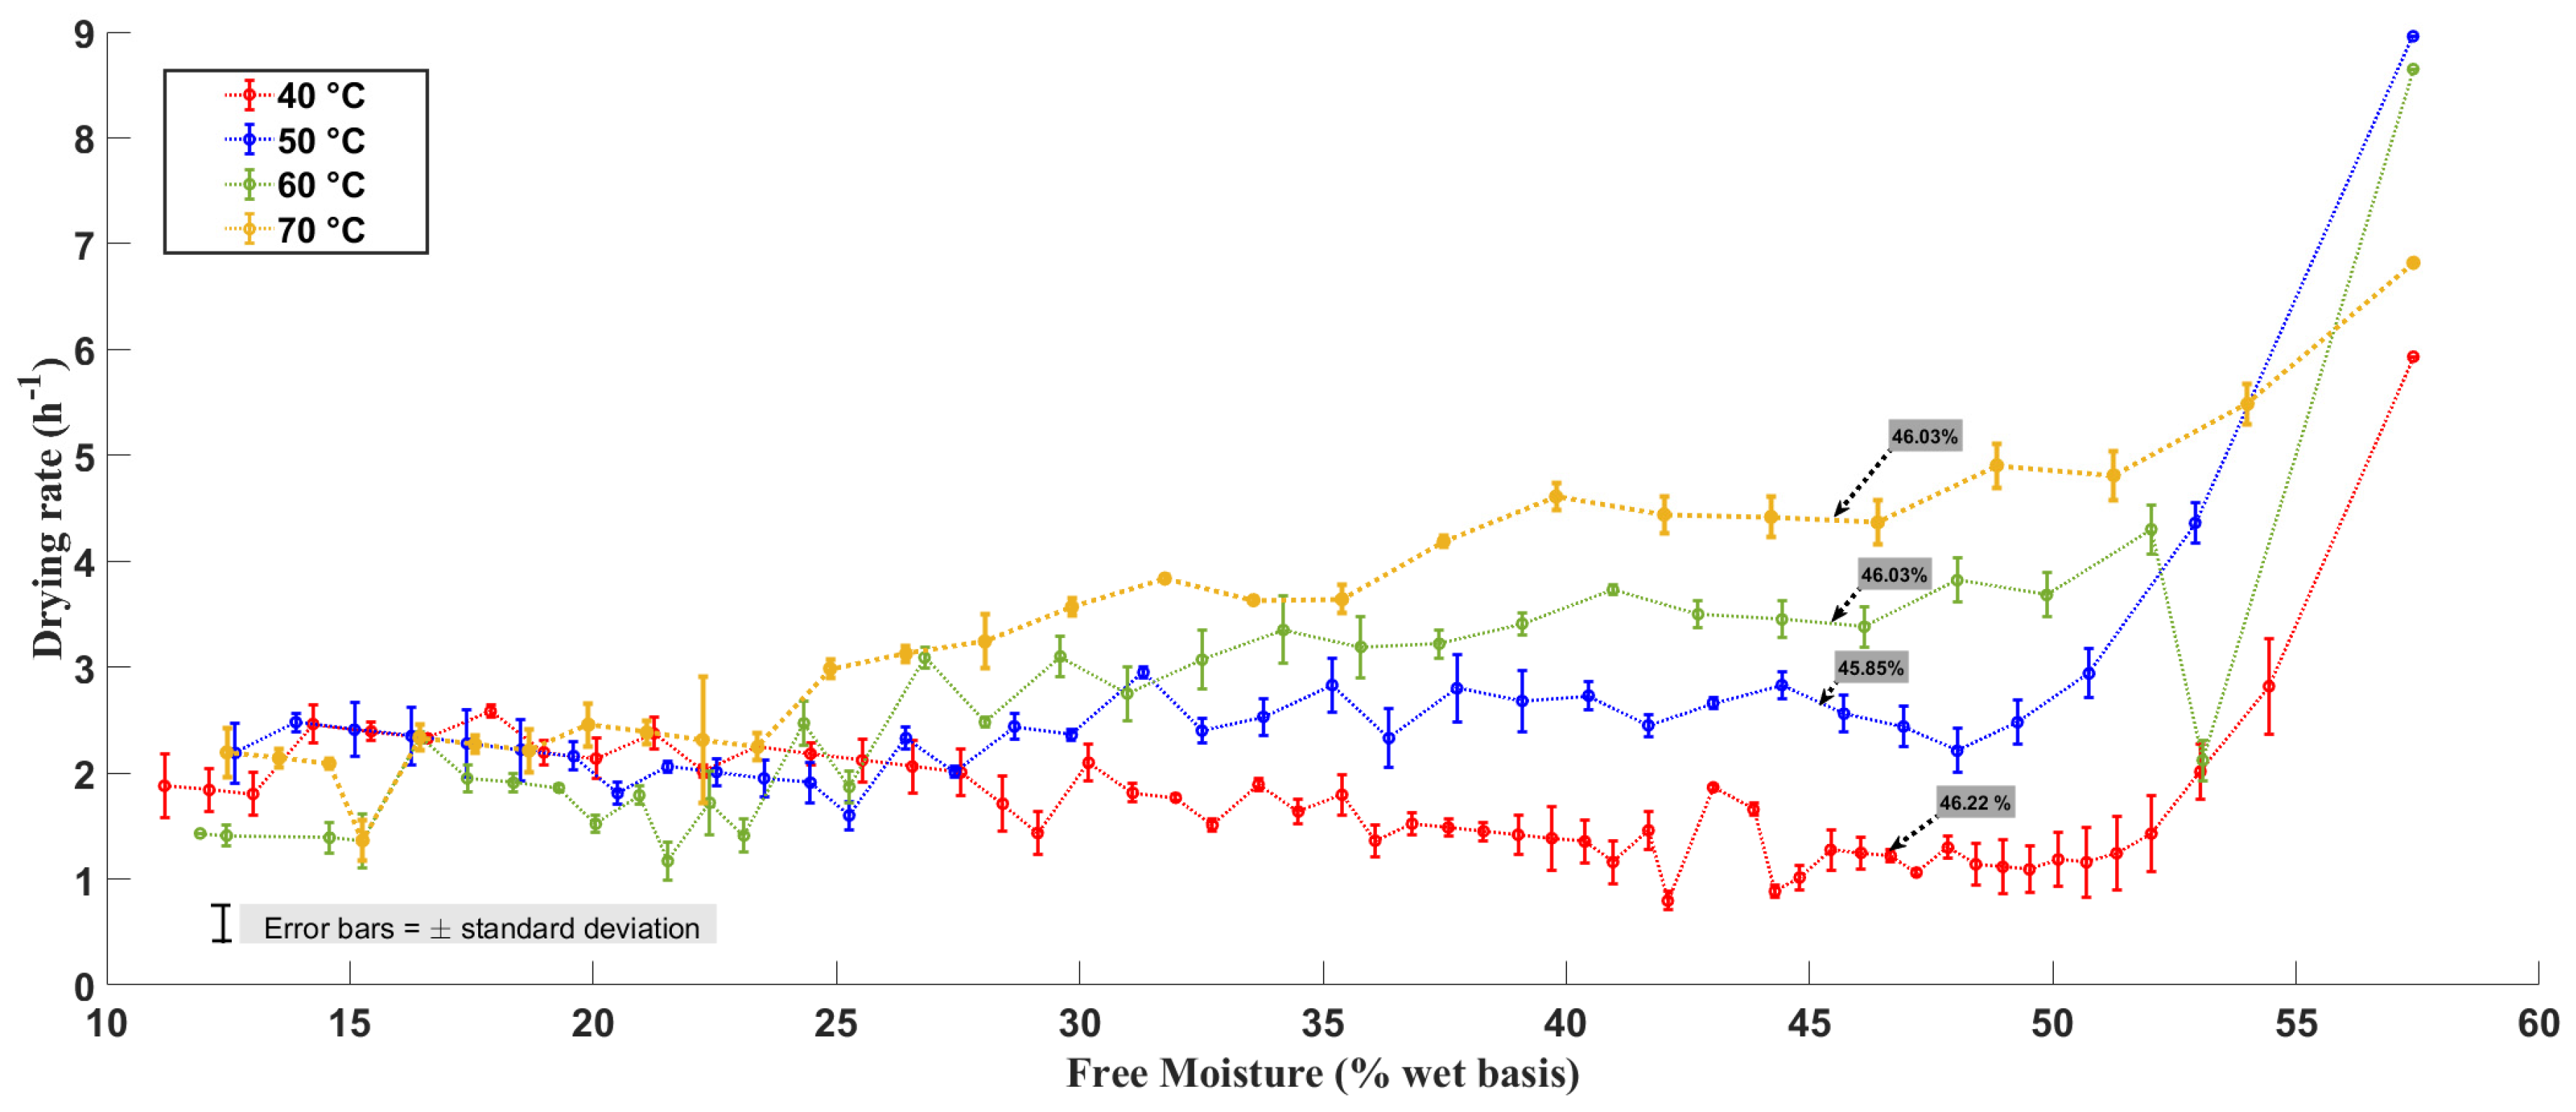
Figure 2 shows the drying rate curves describing how the rate of moisture loss in coffee varies as a function of free moisture content (), which represents the amount of water available for evaporation above the equilibrium moisture content (). In all cases, a typical two-phase drying behavior was observed, consisting of an initial period with maximum drying rate followed by a falling-rate period. The critical moisture content () was identified as the moisture content corresponding to the maximum drying rate () in each drying-rate curve, marking the transition between the initial stage and the falling-rate period, where internal diffusion becomes increasingly important in the overall moisture transport process. After this point, the drying rate gradually decreased as moisture transport became increasingly governed by internal diffusion mechanisms and water became more strongly bound within the coffee bean structure. The calculated values were 46.22%, 45.85%, 46.03%, and 46.03% (wet basis) for drying temperatures of 40, 50, 60, and 70 °C, respectively, corresponding to an average critical moisture content of approximately 46% (wet basis).
Figure 2.
Drying rate as a function of free moisture content during convective drying of Coffea arabica var. L. Catimor at different temperatures. The critical moisture content () occurred at approximately 46% (wb) for all treatments.
3.3. Estimation of the and Coefficients Using Mathematical Modeling
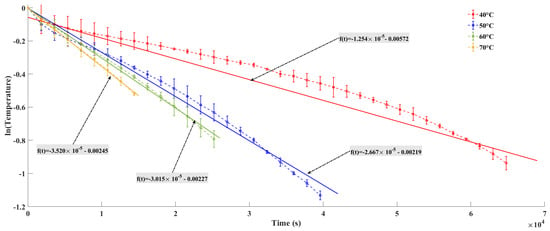
Figure 3 presents the linear regression models describing coffee drying at experimental temperatures, obtained from the logarithmic transformation of the data using Equation (10).
Figure 3.
Linear regression models obtained from the logarithmic transformation of drying data according to Equation (13) for Coffea arabica L. var. Catimor at the evaluated temperatures.
The parameters and obtained from the linear regression functions (Table 3) were used to determine the first root µ1 of Equation (15). The estimated values of µ1 for each drying temperature are presented in Table 4.
Table 3.
Linear regression parameters ( and ) obtained from the linearized solution of Fick’s second law for estimating µ1 at different drying temperatures.
Table 4.
Transport parameters (µ1, effective moisture diffusivity , mass transfer Biot number Bim, and convective mass transfer coefficient ) estimated at different drying temperatures during convective drying of Coffea arabica L var. Catimor.
With the root obtained from the function defined in Equation (15), the parameters and were determined by solving the nonlinear equations defined in Equations (17) and (18), respectively. Both parameters were calculated using the bisection method with 45 iterations over the interval yielding an absolute error of . Finally, the mass transfer coefficient was determined from the previously calculated parameters using Equation (20).
Table 4 presents the calculated values of , and for the four drying temperatures evaluated. The value of at 60 °C is noticeably higher than those obtained at the other temperatures. At 70 °C, however, the value decreases, suggesting a possible deviation from the expected temperature-dependent diffusion trend. The value of at 60 °C was higher than those obtained at the other temperatures. At 70 °C, however, decreased slightly, suggesting a deviation from the expected temperature-dependent trend. Because no structural, microstructural, or physicochemical analyses were performed, the mechanisms responsible for this behavior cannot be conclusively identified. Therefore, the observed decrease should be interpreted as experimental observation requiring further investigation.
Regarding the mass transfer coefficient , the values increase markedly from 40 to 50 °C and then tend to stabilize between 60 and 70 °C. This trend indicates that increasing the drying temperature beyond a certain threshold does not significantly enhance external convective mass transfer. Consequently, drying at 40 °C appears less efficient, whereas temperatures between 50 and 70 °C promote more stable and efficient mass transfer conditions.
The values remained low at all temperatures (0.0109–0.0285), indicating that external mass transfer resistance was not negligible under the evaluated drying conditions. Although both and increased with temperature, the low Biot numbers suggest that moisture removal was influenced by the combined effects of internal diffusion and external convective transfer rather than by a purely diffusion-controlled mechanism.
Table 5 summarizes the constants and correlation coefficients obtained from the Arrhenius model fitted to the experimental data using Equations (21)–(24). The activation energies () for moisture diffusion and mass transfer were estimated as 47.85 and , respectively.
Table 5.
Estimated Arrhenius parameters () for effective moisture diffusivity and convective mass transfer coefficient during convective drying of Coffea arabica L var. Catimor.
The Arrhenius model provided a simplified description of the temperature dependence of and , yielding activation energies of 47.85 and 24.96 kJ/mol, respectively. However, the relatively moderate coefficients of determination (R2 = 0.6293 for and R2 = 0.7351 for ) indicate that temperature alone does not fully explain the variability of the transport coefficients. This limitation may be partly attributed to the small number of experimental temperature levels evaluated (four temperatures) and to the influence of additional factors affecting moisture transport, including structural heterogeneity of the coffee beans, experimental variability, and potential moisture-dependent changes in material properties during drying. Therefore, the estimated activation energies should be interpreted as approximate indicators of temperature sensitivity rather than precise intrinsic material constants. This interpretation is consistent with the deviations observed between the coefficients predicted by the Arrhenius model and those obtained from Fick’s law, confirming that the Arrhenius relationship was more effective in reproducing the overall temperature trend than in providing highly accurate predictions at individual temperatures.
Table 6 presents the predicted values of the and coefficients at different drying temperatures. The effective diffusivity increases progressively with temperature, showing an approximately exponential trend, which is consistent with the Arrhenius dependence typically observed in moisture transport processes. The mass transfer coefficient also increases with temperature, following an approximately linear trend. At lower temperatures (25–35 °C), the values are relatively small, whereas from 55 °C onwards they increase markedly, reaching values approximately three times higher.
Table 6.
Arrhenius-based prediction of effective moisture diffusivity and convective mass transfer coefficient at different drying temperatures for Coffea arabica L var. Catimor.
A comparison between the effective moisture diffusivity and convective mass transfer coefficient obtained from Fick’s second law (Equations (17) and (20) and those predicted using Arrhenius-type relationships (Equations (22) and (24)) is presented in (Table 7). Relative deviations ranged from 19.6% to 62.3% for and from 9.9% to 70.3% for with average differences of 43.7% and 30.0%, respectively. Although considerable deviations were observed at some temperature levels, particularly at 40 °C and 50 °C, the Arrhenius model was able to reproduce the general temperature-dependent trend of both transport coefficients. These results suggest that the Arrhenius approach is useful for describing the overall thermal dependence of moisture transport parameters, although its predictive accuracy remains limited at specific temperatures.
Table 7.
Comparison between transport coefficients obtained from Fick’s second law and Arrhenius-type predictions at different drying temperatures.
The observed deviations may be attributed to the simplified nature of the Arrhenius model, which assumes a single exponential relationship between temperature and transport coefficients. In contrast, moisture diffusion and external mass transfer in coffee beans are influenced by multiple factors, including structural heterogeneity, moisture-dependent changes in physical properties, and potential shrinkage effects during drying. These factors may contribute to departures from ideal Arrhenius behavior, particularly at the lower and upper ends of the evaluated temperature range.
4. Discussion
Drying kinetics is governed by the combined effects of air temperature, relative humidity, and air velocity, as well as by the geometric and physicochemical characteristics of the material, since these factors determine the vapor-pressure gradient, the external mass transfer resistance, and the internal moisture diffusivity during convective drying [52,53]. The results obtained in this study for coffee (Coffea arabica L. var. Catimor) show trends consistent with those reported in previous drying studies of coffee beans [37], particularly the reduction in drying time with increasing temperature, the predominance of the falling-rate period controlled by internal diffusion, and the increase in effective moisture diffusivity within the typical range reported for convective drying of agricultural products [7,54]. In general, increasing the drying temperature reduced the time required to reach the desired moisture level, confirming the inverse relationship between temperature and drying time observed in convective drying processes [55]. Higher temperatures increase the vapor pressure gradient between the product and the surrounding air, accelerating moisture migration and evaporation [25].
The exponential effect of temperature on moisture transport is associated with the increase in the vapor pressure gradient between the internal moisture of the coffee bean and the surrounding drying air, as well as with the increase in molecular mobility within the porous structure of the material. As drying temperature increases, the saturation vapor pressure rises and internal resistance to moisture migration decreases, enhancing effective moisture diffusivity and accelerating mass transfer. This behavior is commonly described by an Arrhenius-type relationship between temperature and diffusivity, which has been widely reported in convective drying processes of agricultural materials, including coffee beans and similar porous biological matrices [46,55,56,57]. Experimental studies have consistently shown that effective moisture diffusivity increases significantly with drying temperature due to thermally activated transport mechanisms governing internal moisture movement during the falling-rate period [58,59].
The estimated equilibrium moisture content values (11.30–11.67% wet basis) are consistent with the safe commercial moisture levels typically recommended for green coffee beans prior to storage and roasting. The observed decrease in with increasing temperature reflects the reduction in relative humidity inside the drying chamber and confirms the expected thermodynamic dependence of equilibrium moisture content on air temperature and humidity conditions under convective drying environments. This trend is associated with the reduced moisture retention capacity of materials at higher temperatures and the corresponding changes in relative humidity of the drying air [60,61]. As air temperature increases, its capacity to retain water vapor also increases, leading to lower relative humidity and enhanced moisture removal from the product. In coffee drying operations, controlling these conditions is essential to ensure that the beans reach safe storage moisture levels without compromising their physical integrity.
A limitation of the present study is that the equilibrium moisture content was operationally estimated from the relative humidity measured inside the drying chamber rather than determined from sorption isotherm models. Consequently, the reported values should be interpreted as practical equilibrium conditions associated with the drying environment rather than true thermodynamic equilibrium moisture contents. Because was used to calculate free moisture content during drying, uncertainties associated with its estimation may propagate into the determination of drying rates and transport parameters such as and . Nevertheless, the relatively narrow range of values observed among temperature treatments suggests that the resulting effect on the estimated coefficients was limited within the experimental conditions evaluated.
The critical moisture content () obtained in this study was approximately 46% (wet basis) for all evaluated temperatures, indicating that the transition between the constant-rate period and the falling-rate period occurred at a relatively high moisture level. This behavior is consistent with convective drying characteristics reported for coffee beans and other hygroscopic agricultural materials, where the constant-rate period is typically short and limited to the early stages of drying due to rapid removal of free surface water [11,12,13]. Above the critical moisture content, moisture migration is mainly governed by surface evaporation, whereas below this threshold internal diffusion becomes the dominant transport mechanism, leading to a progressive reduction in drying rate as water becomes increasingly bound within the cellular structure of the bean [25,62]. Similar ranges of critical moisture content have been reported for parchment and green coffee during convective drying under controlled air conditions, confirming that the transition to diffusion-dominated drying behavior generally occurs when loosely bound water at the surface is depleted and moisture transport shifts toward capillary and intracellular diffusion mechanisms [54,63].
The drying rate curves showed a short constant-rate period at the beginning of the process, followed by a falling-rate period, indicating that internal moisture diffusion becomes the dominant mechanism as drying progresses. This behavior is typical of convective drying processes for many agricultural products and has been reported in similar studies [64,65,66]. For coffee beans, this transition reflects the progressive reduction in free surface moisture and the increasing importance of internal moisture migration within the bean structure.
The estimated values of and increased with temperature, indicating improved internal and external mass transfer under higher thermal conditions. The values obtained for , ranging between and , fall within the typical range reported for coffee drying and other biological materials [44,45,55,63,67]. These results are also consistent with the general diffusivity range reported for agricultural products subjected to convective drying, typically between and [33,68]. Similar temperature-dependent increases in diffusivity have been described for Coffea arabica during convective drying, where enhanced thermal energy promotes internal moisture migration. Although direct quantitative comparisons among studies should be made cautiously due to differences in coffee variety, processing conditions, geometry assumptions, and drying configurations, the observed magnitude of is consistent with previously reported values for coffee drying and supports the applicability of diffusion-based models for describing moisture transport in parchment coffee [37,38].
The increase in these parameters with temperature reflects the enhanced mobility of water molecules within the coffee matrix and the improvement of external mass transfer conditions. However, the deviation observed at 70 °C suggests that further increases in temperature may not necessarily lead to proportional increases in effective diffusivity. Although one possible explanation could involve structural modifications of the coffee matrix, such as shrinkage effects, pore collapse, or changes in moisture binding mechanisms [62,69], the present study did not include structural, microstructural, or physicochemical analyses capable of confirming these mechanisms. Therefore, these interpretations should be regarded as hypotheses rather than experimentally verified explanations. Similar deviations from ideal temperature-dependent diffusivity behavior have been reported in coffee drying and other biological materials subjected to elevated drying temperatures [7,11,27,54]. Additional studies incorporating structural characterization techniques would be necessary to verify the mechanisms responsible for the observed decrease in at 70 °C.
An additional limitation of the present modeling approach is the assumption of spherical geometry with a constant equivalent radius throughout drying. Coffee beans exhibit non-spherical geometry and may undergo shrinkage as moisture is removed. Neglecting these dimensional changes may introduce some uncertainty into the estimated values because the diffusion path length is assumed to remain constant. Nevertheless, the use of an equivalent radius is a common approximation in drying studies and provides a practical framework for comparing transport coefficients across drying conditions [44,45].
Consistently, the relatively stable values of the observed between 50 and 70 °C indicate that external convective resistance becomes less limiting within this temperature interval. Under these conditions, moisture transport is predominantly governed by internal diffusion mechanisms rather than by surface evaporation control, which is characteristic of the falling-rate drying period commonly reported for coffee beans and other biological materials [23,25]. Similar behavior has been described in convective drying studies of Coffea arabica and other porous agricultural products, where increasing temperature enhances moisture transport and reduces external mass transfer resistance [7,11,54,55].
The mass transfer Biot numbers obtained in this study ranged from 0.0109 to 0.0285, indicating that external convective resistance remained significant throughout the drying process. Since values were substantially lower than unity, moisture transport cannot be considered exclusively diffusion controlled. Instead, the results suggest that external mass transfer and internal diffusion contributed to the overall drying behavior, with external resistance playing an important role under the evaluated drying conditions. The relatively stable values observed between 50 and 70 °C indicate that the balance between internal and external mass transfer resistances remained similar across this temperature range despite the increase in and .
These findings indicate that temperatures between 50 and 70 °C enhance moisture transport and improve drying efficiency from a mass transfer perspective. However, the present study focused exclusively on transport phenomena and did not evaluate physical, chemical, or sensory quality attributes. Therefore, the results should not be interpreted as a recommendation for commercial drying at 70 °C. Additional studies incorporating quality assessments would be necessary to determine the suitability of such temperatures for industrial coffee processing.
Furthermore, this behavior is consistent with the temperature-dependent evolution of the convective mass transfer coefficient predicted by the Arrhenius model. The predicted values of hm showed an approximately linear increase with temperature over the range 25–65 °C, with relatively low values at 25–35 °C and a marked increase above 55 °C, where reached values nearly three times higher. This behavior reflects the progressive reduction in the external boundary-layer resistance surrounding the coffee bean as air temperature increases, which enhances vapor pressure gradients and promotes more efficient moisture removal from the product surface [23,25]. Similar temperature-dependent increases in external mass transfer coefficients have been reported during convective drying of Coffea arabica and other biological materials, where higher air temperatures improve surface evaporation rates while maintaining diffusion-controlled transport within the porous matrix [7,11,55]. The observed transition from relatively low hm values at mild drying temperatures to significantly higher coefficients above 55 °C therefore confirms the thermally enhanced nature of external mass transfer and supports the applicability of Arrhenius-type relationships for predicting transport parameters under practical drying condition.
The Arrhenius model was used to evaluate the effect of temperature on the estimated transport parameters. The activation energies obtained (47.85 kJ/mol for and 24.96 kJ/mol for ) fall within the ranges commonly reported for convective drying of coffee beans and other biological materials, where activation energies for moisture diffusion typically vary between 12 and 110 kJ/mol depending on product structure and drying conditions [44,55,69,70]. These values confirm the thermally activated nature of moisture transport in the coffee matrix and support the applicability of Arrhenius-type relationships for describing temperature dependence of effective diffusivity. Although the model presented moderate coefficients of determination, this behavior is frequently observed in drying studies of porous biological materials such as coffee beans, where shrinkage effects, structural rearrangements, and changes in moisture binding mechanisms modify internal diffusion pathways during drying and lead to deviations from ideal Arrhenius behavior [7,23,62].
The deviations observed between transport coefficients obtained from Fick’s second law and those predicted using Arrhenius-type relationships are consistent with the empirical nature of temperature-dependent diffusivity models and the limited number of experimental temperature levels considered. Similar discrepancies have been reported in convective drying studies of coffee beans and other biological materials, where Arrhenius-type formulations adequately reproduce the temperature dependence of effective moisture diffusivity despite localized variations at specific temperatures [71,72]. Therefore, the Arrhenius model should be interpreted primarily as a tool for representing the overall temperature trend rather than as a highly accurate predictor of transport coefficients at individual temperatures.
From a transport-phenomena perspective, increasing the drying temperature enhanced moisture transport and reduced drying time under the experimental conditions evaluated. Nevertheless, because the present study focused exclusively on drying kinetics and transport parameters, no conclusions can be drawn regarding the effects of temperature on coffee quality attributes. Future studies integrating physicochemical, sensory, and structural analyses would provide a more comprehensive basis for defining optimal drying conditions for industrial coffee processing.
5. Conclusions
Drying Coffea arabica L. var. Catimor at 40, 50, 60, and 70 °C exhibited two distinct kinetic phases (rapid and slow moisture reduction), with equilibrium moisture contents between 11.30 and 11.67% (wet basis) and a critical moisture content near 46% (wet basis). The application of Fick’s second law using a MATLAB-based numerical approach enabled estimation of effective moisture diffusivity () and convective mass transfer coefficients (), both generally increasing with temperature and remaining within ranges reported in the literature. The Arrhenius model reproduced the general temperature dependence of the transport parameters and yielded activation energies consistent with previous studies. The experimentally determined transport coefficients provide useful inputs for mathematical simulations, process modeling, and scale-up analyses of convective drying systems for Coffea arabica L. var. Catimor. However, the present study focused exclusively on drying kinetics and transport phenomena and did not evaluate physical, chemical, structural, or sensory quality attributes. Therefore, although temperatures up to 70 °C were useful for characterizing moisture transport behavior and developing Arrhenius-type relationships, these conditions were included primarily for modeling purposes and should not be interpreted as recommended commercial drying temperatures. Additional studies integrating quality assessments are required before establishing practical recommendations for industrial coffee drying operations.
Author Contributions
Conceptualization, F.F.-R., L.F.-R., S.G.C., M.G.V.-E. and C.R.B.-Z.; methodology, F.F.-R., E.M.C.-B., F.V.-V., L.F.-R. and S.G.C.; software, E.H.-M., F.V.-V., N.A.S.-G. and C.R.B.-Z.; validation, F.F.-R., E.H.-M., N.A.S.-G. and C.R.B.-Z.; formal analysis, F.F.-R., E.M.C.-B., E.H.-M., J.C.D.-S. and L.F.-R.; investigation, F.F.-R., L.F.-R., S.G.C. and M.G.V.-E.; resources, F.F.-R., J.C.D.-S., F.V.-V., S.G.C., M.G.V.-E. and C.R.B.-Z.; data curation, E.M.C.-B., E.H.-M., J.C.D.-S., L.F.-R. and N.A.S.-G.; writing—original draft preparation, F.F.-R., E.M.C.-B., S.G.C., M.G.V.-E. and C.R.B.-Z.; writing—review and editing, F.F.-R., E.M.C.-B., F.V.-V., N.A.S.-G. and C.R.B.-Z.; visualization, E.M.C.-B., E.H.-M., J.C.D.-S., L.F.-R. and N.A.S.-G.; supervision, F.F.-R., E.M.C.-B., S.G.C. and C.R.B.-Z.; project administration, F.F.-R. and E.M.C.-B.; funding acquisition, F.F.-R., F.V.-V., S.G.C. and C.R.B.-Z. All authors have read and agreed to the published version of the manuscript.
Funding
The APC was financed by the Vicerrectorado de Investigación-Universidad Nacional Toribio Rodríguez de Mendoza de Amazonas.
Institutional Review Board Statement
Not applicable.
Data Availability Statement
The raw data supporting the conclusions of this article will be made available by the authors on request.
Acknowledgments
The authors thank the Institute for Research for Sustainable Development of Ceja de Selva (INDES-CES) of the National University Toribio Rodríguez de Mendoza for providing us with the equipment of the Plant Physiology and Biotechnology Laboratory (FISIOBVEG) with which the experiments were developed.
Conflicts of Interest
The authors declare no conflicts of interest.
References
- Petkova, I. Shifting Regimes of Governance in the Coffee Market: From Secular Crisis to a New Equilibrium? Rev. Int. Political Econ. 2006, 13, 313–339. [Google Scholar] [CrossRef] [Scilit]
- Hernández-Amasifuen, A.D.; Rivadeneyra-Chisquipama, L.; Padilla-Dominguez, A.; Paredes-Espinosa, R.; Guerrero-Abad, J.C.; Torres-Flores, E.; Peláez-Rivera, J.L.; Carvajal-Vallejos, F.M.; Gutiérrez-Reynoso, D.L.; Corazon-Guivin, M.A. Massive Production of Hemileia Vastatrix Uredospores for Infection of Coffea Arabica Seedlings. Sci. Agropecu. 2023, 14, 259–267. [Google Scholar] [CrossRef] [Scilit]
- Jezeer, R.E.; Santos, M.J.; Verweij, P.A.; Boot, R.G.A.; Clough, Y. Benefits for Multiple Ecosystem Services in Peruvian Coffee Agroforestry Systems without Reducing Yield. Ecosyst. Serv. 2019, 40, 101033. [Google Scholar] [CrossRef] [Scilit]
- Le, C.T.M.; Okane, I.; Ono, Y.; Tsuda, Y.; Yamaoka, Y. Incidence of Coffee Leaf Rust in Vietnam, Possible Original Sources and Subsequent Pathways of Migration. Front. Plant Sci. 2022, 13, 872877. [Google Scholar] [CrossRef] [Scilit] [PubMed]
- Corazon-Guivin, M.A.; Romero-Cachique, G.; Del Aguila, K.M.; Padilla-Domínguez, A.; Hernández-Amasifuen, A.D.; Cerna-Mendoza, A.; Coyne, D.; Oehl, F. Rhizoglomus Variabile and Nanoglomus Plukenetiae, Native to Peru, Promote Coffee Growth in Western Amazonia. Microorganisms 2023, 11, 2883. [Google Scholar] [CrossRef] [Scilit] [PubMed]
- Alves, G.E.; Borém, F.M.; Isquierdo, E.P.; Siqueira, V.C.; Cirillo, M.Â.; Pinto, A.C.F. Physiological and Sensorial Quality of Arabica Coffee Subjected to Different Temperatures and Drying Airflows. Acta Sci. Agron. 2017, 39, 225. [Google Scholar] [CrossRef] [Scilit]
- Coradi, P.C.; Martens, S.; Rodrigues, H.E.; Leal, A.F.; Costa, D.R.D.; Saath, R.; Borém, F.M. Development and Validation of a Heated Drying Air Diffusion System to Optimize Rotary Dryers and Final Coffee Quality. PLoS ONE 2021, 16, e0251312. [Google Scholar] [CrossRef] [Scilit] [PubMed]
- Ponder, A.; Krakówko, K.; Kruk, M.; Kuliński, S.; Magoń, R.; Ziółkowski, D.; Jariene, E.; Hallmann, E. Organic and Conventional Coffee Beans, Infusions, and Grounds as a Rich Sources of Phenolic Compounds in Coffees from Different Origins. Molecules 2025, 30, 1290. [Google Scholar] [CrossRef] [Scilit] [PubMed]
- Borém, F.M.; Andrade, E.T. de Processing and Drying of Coffee. In Drying and Roasting of Cocoa and Coffee; CRC Press: Boca Raton, FL, USA, 2019. [Google Scholar]
- Hashim, N.; Daniel, O.; Rahaman, E. A Preliminary Study: Kinetic Model of Drying Process of Pumpkins (Cucurbita Moschata) in a Convective Hot Air Dryer. Agric. Agric. Sci. Procedia 2014, 2, 345–352. [Google Scholar] [CrossRef] [Scilit]
- Borém, F.M.; Ribeiro, D.M.; Pereira, R.G.F.A.; Rosa, S.D.V.F.D.; Morais, A.R. de Qualidade do café submetido a diferentes temperaturas, fluxos de ar e períodos de pré-secagem. Coffee Sci. 2006, 1, 55–63. [Google Scholar]
- Vega-Gálvez, A.; López, J.; Miranda, M.; Di Scala, K.; Yagnam, F.; Uribe, E. Mathematical Modelling of Moisture Sorption Isotherms and Determination of Isosteric Heat of Blueberry Variety O′Neil. Int. J. Food Sci. Technol. 2009, 44, 2033–2041. [Google Scholar] [CrossRef] [Scilit]
- Vega-Gálvez, A.; Lara, E.; Flores, V.; Di Scala, K.; Lemus-Mondaca, R. Effect of Selected Pretreatments on Convective Drying Process of Blueberries (Var. O’neil). Food Bioprocess Technol. 2012, 5, 2797–2804. [Google Scholar] [CrossRef] [Scilit]
- Onwude, D.I.; Hashim, N.; Janius, R.B.; Nawi, N.M.; Abdan, K. Modeling the Thin-Layer Drying of Fruits and Vegetables: A Review. Compr. Rev. Food Sci. Food Safe 2016, 15, 599–618. [Google Scholar] [CrossRef] [Scilit] [PubMed]
- Chaikham, P.; Kingwascharapong, P.; Pongsetkul, J.; Rawdkuen, S.; Jung, Y.H.; Zhang, W.; Yutsapremanon, S.; Sai-Ut, S. Comparative Evaluation of Drying Techniques on Quality Attributes, Phytochemicals, and Antioxidant Capacity of Coffea Arabica Var. Typica Pulp. J. Agric. Food Res. 2025, 23, 102274. [Google Scholar] [CrossRef] [Scilit]
- Fito, P.; LeMaguer, M.; Betoret, N.; Fito, P.J. Advanced Food Process Engineering to Model Real Foods and Processes: The “SAFES” Methodology. J. Food Eng. 2007, 83, 173–185. [Google Scholar] [CrossRef] [Scilit]
- Trystram, G. Modelling of Food and Food Processes. J. Food Eng. 2012, 110, 269–277. [Google Scholar] [CrossRef] [Scilit]
- Erdogdu, F. Mathematical Modeling of Food Thermal Processing: Current and Future Challenges. Curr. Opin. Food Sci. 2023, 51, 101042. [Google Scholar] [CrossRef] [Scilit]
- Al-Shemmeri, M.; Fryer, P.; Farr, R.; Lopez-Quiroga, E. Development of Coffee Bean Porosity and Thermophysical Properties during Roasting. J. Food Eng. 2024, 378, 112096. [Google Scholar] [CrossRef] [Scilit]
- Duque-Dussán, E.; Sanz-Uribe, J.R.; Dussán-Lubert, C.; Banout, J. Thermophysical Properties of Parchment Coffee: New Colombian Varieties. J. Food Process Eng. 2023, 46, e14300. [Google Scholar] [CrossRef] [Scilit]
- Silva Júnior, M.A.V.; Leite, M.A.; Dacanal, G.C. Modelling of Convective Drying of Potatoes Polyhedrons. Int. J. Food Eng. 2023, 19, 605–617. [Google Scholar] [CrossRef] [Scilit]
- Andrade, P.S.; Duarte, C.R.; Barrozo, M.A.S. An Innovative Dryer for Arabica Coffee (Coffea arabica L.) Drying: Investigating Heat and Mass Transfer. Dry. Technol. 2024, 42, 1065–1076. [Google Scholar] [CrossRef] [Scilit]
- Erbay, Z.; Icier, F. A Review of Thin Layer Drying of Foods: Theory, Modeling, and Experimental Results. Crit. Rev. Food Sci. Nutr. 2010, 50, 441–464. [Google Scholar] [CrossRef] [Scilit] [PubMed]
- García-Alvarado, M.A.; Pacheco-Aguirre, F.M.; Ruiz-López, I.I. Analytical Solution of Simultaneous Heat and Mass Transfer Equations during Food Drying. J. Food Eng. 2014, 142, 39–45. [Google Scholar] [CrossRef] [Scilit]
- Mujumdar, A.S. (Ed.) Handbook of Industrial Drying; CRC Press: Boca Raton, FL, USA, 2006. [Google Scholar]
- Szpicer, A.; Bińkowska, W.; Stelmasiak, A.; Zalewska, M.; Wojtasik-Kalinowska, I.; Piwowarski, K.; Piepiórka-Stepuk, J.; Półtorak, A. Computational Fluid Dynamics Simulation of Thermal Processes in Food Technology and Their Applications in the Food Industry. Appl. Sci. 2025, 15, 424. [Google Scholar] [CrossRef] [Scilit]
- Bustos-Vanegas, J.D.; Corrêa, P.C.; Martins, M.A.; Baptestini, F.M.; Campos, R.C.; de Oliveira, G.H.H.; Nunes, E.H.M. Developing Predictive Models for Determining Physical Properties of Coffee Beans during the Roasting Process. Ind. Crops Prod. 2018, 112, 839–845. [Google Scholar] [CrossRef] [Scilit]
- Guine, R.P.F.; Brito, M.F.S.; Ribeiro, J.R.P. Evaluation of Mass Transfer Properties in Convective Drying of Kiwi and Eggplant. Int. J. Food Eng. 2017, 13, 20160257. [Google Scholar] [CrossRef] [Scilit]
- Ramallo, L.A.; Albani, O.A. Water Diffusion Coefficient and Modeling of Water Uptake in Packaged Yerba Mate. J. Food Process. Preserv. 2007, 31, 406–419. [Google Scholar] [CrossRef] [Scilit]
- Ribeiro, M.A.A. Comparison of Analytical and Numerical Simulations of Cowpea (Vigna unguiculata) Grain Drying Using Fick’s Law and the Finite Element Method. Glob. J. Eng. Technol. Adv. 2025, 23, 1–15. [Google Scholar] [CrossRef] [Scilit]
- Burmester, K.; Eggers, R. Heat and Mass Transfer during the Coffee Drying Process. J. Food Eng. 2010, 99, 430–436. [Google Scholar] [CrossRef] [Scilit]
- Vasić, M.; Grbavčić, Ž.; Radojević, Z. Determination of the Moisture Diffusivity Coefficient and Mathematical Modeling of Drying. Chem. Eng. Process. Process Intensif. 2014, 76, 33–44. [Google Scholar] [CrossRef] [Scilit]
- Tripathy, P.P.; Kumar, S. A Methodology for Determination of Temperature Dependent Mass Transfer Coefficients from Drying Kinetics: Application to Solar Drying. J. Food Eng. 2009, 90, 212–218. [Google Scholar] [CrossRef] [Scilit]
- Tripathy, P.P.; Kumar, S. Neural Network Approach for Food Temperature Prediction during Solar Drying. Int. J. Therm. Sci. 2009, 48, 1452–1459. [Google Scholar] [CrossRef] [Scilit]
- Tripathy, P.P.; Kumar, S. Determination of Temperature Dependent Drying Parameters for Potato Cylinders and Slices during Solar Drying. Energy Convers. Manag. 2008, 49, 2941–2948. [Google Scholar] [CrossRef] [Scilit]
- Alqahtani, N.; Fikry, M. Impact of Microwave Pretreatment on Drying Kinetics, Mass Transfer and Thermodynamic Characteristics of Barhi Dates during Drying Process. Sci. Rep. 2026, 16, 9022. [Google Scholar] [CrossRef] [Scilit] [PubMed]
- Duque-Dussán, E.; Banout, J. Improving the Drying Performance of Parchment Coffee Due to the Newly Redesigned Drying Chamber. J. Food Process Eng. 2022, 45, e14161. [Google Scholar] [CrossRef] [Scilit]
- Duque-Dussán, E.; Villada-Dussán, A.; Roubík, H.; Banout, J. Modeling of Forced and Natural Convection Drying Process of a Coffee Seed. J. ASABE 2022, 65, 1061–1070. [Google Scholar] [CrossRef] [Scilit]
- Akpinar, E.K. Determination of Suitable Thin Layer Drying Curve Model for Some Vegetables and Fruits. J. Food Eng. 2006, 73, 75–84. [Google Scholar] [CrossRef] [Scilit]
- Simal, S.; Femenia, A.; Garau, M.C.; Rosselló, C. Use of Exponential, Page’s and Diffusional Models to Simulate the Drying Kinetics of Kiwi Fruit. J. Food Eng. 2005, 66, 323–328. [Google Scholar] [CrossRef]
- Vega Gálvez, A.; Tello Ireland, C.; Lemus Mondaca, R. Simulación Matemática Del Proceso De Secado De La Gracilaria Chilena (Gracilaria Chilensis). Ingeniare Rev. Chil. Ing. 2007, 15, 55–64. [Google Scholar] [CrossRef] [Scilit]
- Romero, J.; Cabrera, T.P.; Mesa-Mazo, M.J.; Eraso-Checa, F.; Lagos, C.; Sekkak, I. Mathematical Modeling of Coffee Beans Drying: Addressing Challenges of Determining Moisture Ratio under Natural Conditions. Coffee Sci. 2025, 20, e202385. [Google Scholar] [CrossRef] [Scilit]
- Parra-Coronado, A.; Roa-Mejía, G.; Oliveros-Tascón, C.E. SECAFÉ Parte I: Modelamiento y Simulación Matemática En El Secado Mecánico de Café Pergamino. Rev. Bras. Eng. Agríc. Ambient. 2008, 12, 415–427. [Google Scholar] [CrossRef] [Scilit]
- Kumar, S.N.; Rajabathar, J.R.; Karnan, M.; Kavitha, N.P. Estimation of Effective Diffusivity, Thermodynamic Parameter and Drying Kinetics Exploration in Coffee Berries Drying. React. Kinet. Mech. Catal. 2023, 136, 1371–1384. [Google Scholar] [CrossRef] [Scilit]
- Reyes-Chaparro, J.E.; Arballo, J.R.; Campañone, L.A. Experimental Study of Parchment Coffee Drying Using the Combined Fluidization and Microwave Process: Analysis of Drying Curves and Thermal Imaging. J. Food Eng. 2024, 383, 112214. [Google Scholar] [CrossRef] [Scilit]
- de Araujo, M.E.V.; Corrêa, P.C.; Barbosa, E.G.; Martins, M.A. Determination and Modeling of Physical and Aerodynamic Properties of Coffee Beans (Coffea arabica) during the Drying Process. J. Food Process. Preserv. 2021, 45, e15698. [Google Scholar] [CrossRef] [Scilit]
- Çengel, Y.A.; Ghajar, A.J. Transferencia de Calor y Masa: Fundamentos y Aplicaciones, 4th ed.; McGraw-Hill: Ciudad de Mexico, Mexico, 2011. [Google Scholar]
- Gulshan, G.; Budak, H.; Hussain, R.; Sadiq, A. Generalization of the Bisection Method and Its Applications in Nonlinear Equations. Adv. Contin. Discret. Models 2023, 2023, 18. [Google Scholar] [CrossRef] [Scilit]
- Bottazzi, D.; Farina, S.; Milani, M.; Montorsi, L. A Numerical Approach for the Analysis of the Coffee Roasting Process. J. Food Eng. 2012, 112, 243–252. [Google Scholar] [CrossRef] [Scilit]
- Heyd, B.; Broyart, B.; Hernandez, J.A.; Valdovinos-Tijerino, B.; Trystram, G. Physical Model of Heat and Mass Transfer in a Spouted Bed Coffee Roaster. Dry. Technol. 2007, 25, 1243–1248. [Google Scholar] [CrossRef] [Scilit]
- Mohapatra, D.; Rao, P.S. A Thin Layer Drying Model of Parboiled Wheat. J. Food Eng. 2005, 66, 513–518. [Google Scholar] [CrossRef] [Scilit]
- Alves, G.E.; Isquierdo, E.P.; Borém, F.M.; Siqueira, V.C.; Oliveira, P.D.; Andrade, E.T. Drying Kinetics of Natural Coffee for Different Temperatures and Low Relative Humidity. Coffee Sci. 2013, 8, 238–247. [Google Scholar] [CrossRef] [Scilit]
- de Andrade, E.T.; Lemos, I.A.; Dias, C.d.A.; Rios, P.d.A.; Borém, F.M. Mathematical Modelling and Immediate and Latent Quality of Natural Immature Coffee Under Different Drying Conditions. Eng. Agríc. 2019, 39, 630–638. [Google Scholar] [CrossRef] [Scilit]
- Isquierdo, E.P.; Borém, F.M.; de Andrade, E.T.; Corrêa, J.L.G.; de Oliveira, P.D.; Alves, G.E. Drying Kinetics and Quality of Natural Coffee. Trans. ASABE 2013, 56, 995–1001. [Google Scholar] [CrossRef] [Scilit]
- Phitakwinai, S.; Thepa, S.; Nilnont, W. Thin-layer Drying of Parchment Arabica coffee by Controlling Temperature and Relative Humidity. Food Sci. Nutr. 2019, 7, 2921–2931. [Google Scholar] [CrossRef] [Scilit] [PubMed]
- Nilnont, W.; Thepa, S.; Janjai, S.; Kasayapanand, N.; Thamrongmas, C.; Bala, B.K. Finite Element Simulation for Coffee (Coffea arabica) Drying. Food Bioprod. Process. 2012, 90, 341–350. [Google Scholar] [CrossRef] [Scilit]
- Stephenus, F.N.; Benjamin, M.A.Z.; Anuar, A.; Awang, M.A. Effect of Temperatures on Drying Kinetics, Extraction Yield, Phenolics, Flavonoids, and Antioxidant Activity of Phaleria Macrocarpa (Scheff.) Boerl. (Mahkota Dewa) Fruits. Foods 2023, 12, 2859. [Google Scholar] [CrossRef] [Scilit] [PubMed]
- Gómez-de la Cruz, F.J.; Palomar-Torres, A.; Torres-Jiménez, E.; Cruz-Peragón, F. Drying Kinetics of Crushed Mango Stone: Analysis of Effective Moisture Diffusivity and Drying Rate for Any Drying Condition. Therm. Sci. Eng. Prog. 2026, 71, 104571. [Google Scholar] [CrossRef] [Scilit]
- Zeng, Z.; Han, C.; Wang, Q.; Yuan, H.; Zhang, X.; Li, B. Analysis of Drying Characteristic, Effective Moisture Diffusivity and Energy, Exergy and Environment Performance Indicators during Thin Layer Drying of Tea in a Convective-Hot Air Dryer. Front. Sustain. Food Syst. 2024, 8, 1371696. [Google Scholar] [CrossRef] [Scilit]
- Coelho, E.G.; Bertarini, P.L.L.; Gomes, M.S.; Amaral, L.R.; Zotarelli, M.F.; Santos, L.D.; Santana, R.C. Physicochemical and Sensory Properties of Arabica Coffee Beans of Arara Cv. Dried Using Different Methods. Foods 2024, 13, 642. [Google Scholar] [CrossRef] [Scilit] [PubMed]
- dos Santos, S.G.F.; da Silva, D.P.; Sarti, J.K.; Almeida, V.G.; Rodovalho, R.S. Adsorption Isotherms and Isosteric Heat in Coffea Arabica Beans. Pesqui. Agropecu. Trop. 2020, 50, e58128. [Google Scholar] [CrossRef] [Scilit]
- Mayor, L.; Sereno, A.M. Modelling Shrinkage during Convective Drying of Food Materials: A Review. J. Food Eng. 2004, 61, 373–386. [Google Scholar] [CrossRef] [Scilit]
- Torres-Valenzuela, L.S.; Martínez, K.G.; Serna-Jimenez, J.A.; Hernández, M.C. Secado de Pulpa de Café: Condiciones de Proceso, Modelación Matemática y Efecto Sobre Propiedades Fisicoquímicas. Inf. Tecnol. 2019, 30, 189–200. [Google Scholar] [CrossRef] [Scilit]
- Cwiková, O.; Komprda, T.; Šottníková, V.; Svoboda, Z.; Simonová, J.; Slováček, J.; Jůzl, M. Effects of Different Processing Methods of Coffee Arabica on Colour, Acrylamide, Caffeine, Chlorogenic Acid, and Polyphenol Content. Foods 2022, 11, 3295. [Google Scholar] [CrossRef] [Scilit] [PubMed]
- Baidhe, E.; Clementson, C.L. A Review of the Application of Modeling and Simulation to Drying Systems for Improved Grain and Seed Quality. Comput. Electron. Agric. 2024, 222, 109094. [Google Scholar] [CrossRef] [Scilit]
- Castro, A.M.; Mayorga, E.Y.; Moreno, F.L. Mathematical Modelling of Convective Drying of Fruits: A Review. J. Food Eng. 2018, 223, 152–167. [Google Scholar] [CrossRef] [Scilit]
- de Carvalho, A.J.B.; Silveira, P.G.; Mequelino, D.B.; Corrêa, J.L.G.; Nascimento, S.M.; Petri-Júnior, I. Experimental and Numerical Study via CFD of A Rotating Drum Dimensioning Applied in the Microwave-Assisted Convective Drying of Specialty Coffees. J. Food Process Eng. 2025, 48, e70214. [Google Scholar] [CrossRef] [Scilit]
- Siagian, P.; Napitupulu, F.H.; Ambarita, H.; Sihombing, H.V.; Siagian, H. Comparative Analysis of Coffee Drying on Quality with Variations in Dryers Made Solar Collectors. In AIP Conference Proceedings; AIP Publishing: Kolkata, India, 2024; p. 020042. [Google Scholar]
- Zogzas, N.P.; Maroulis, Z.B.; Marinos-Kouris, D. Moisture Diffusivity Data Compilation in Foodstuffs. Dry. Technol. 1996, 14, 2225–2253. [Google Scholar] [CrossRef] [Scilit]
- Barreira, E.; Delgado, J.M.P.Q.; Ramos, N.M.M.; de Freitas, V.P. Drying Kinetics of External Thermal Insulation Composite Systems (ETICS). Defect Diffus. Forum 2012, 326–328, 662–667. [Google Scholar] [CrossRef] [Scilit]
- Siqueira, V.C.; Resende, O.; Chaves, T.H. Determination of the Volumetric Shrinkage in Jatropha Seeds during Drying. Acta Sci. Agron. 2012, 34, 231–238. [Google Scholar] [CrossRef] [Scilit]
- Srikiatden, J.; Roberts, J.S. Predicting Moisture Profiles in Potato and Carrot during Convective Hot Air Drying Using Isothermally Measured Effective Diffusivity. J. Food Eng. 2008, 84, 516–525. [Google Scholar] [CrossRef] [Scilit]

Disclaimer/Publisher’s Note: The statements, opinions and data contained in all publications are solely those of the individual author(s) and contributor(s) and not of MDPI and/or the editor(s). MDPI and/or the editor(s) disclaim responsibility for any injury to people or property resulting from any ideas, methods, instructions or products referred to in the content. |
© 2026 by the authors. Licensee MDPI, Basel, Switzerland. This article is an open access article distributed under the terms and conditions of the Creative Commons Attribution (CC BY) license.