


Featured Application
The developed in-house measurement system, incorporating different electrode configurations relative to muscle fibre orientation, may have potential for the non-destructive assessment of selected beef quality traits during ageing. The results indicate that Z and Y, and more selectively also Cs, may provide useful information on selected technological traits and compositional characteristics of beef, provided that measurement conditions are strictly standardised.
Abstract
This study examined relationships between electrical parameters, namely impedance (Z), admittance (Y), parallel capacitance (Cp), and series capacitance (Cs), and beef tenderness in the semimembranosus muscle during ageing for 3, 7, 14, and 28 days at 4 ± 1 °C. It also assessed selected compositional traits after 14 days. The effects of electrode configuration and signal frequency on measurement sensitivity were evaluated. Beef from Holstein–Friesian bulls (n = 8) representing two feeding treatments was used. Electrical measurements were performed with an in-house sensor and an LCR-based system. Two electrode configurations were applied: T, across the muscle fibres, and L, along the fibres. pH, Warner–Bratzler shear force (WBSF), and cooking loss were determined during ageing. Chemical composition and fatty acid profile were analysed after 14 days. WBSF decreased during ageing, whereas cooking loss showed a non-linear pattern, increasing up to day 14 and decreasing after 28 days. Electrical parameters were strongly affected by frequency and electrode configuration. After 14 days of ageing, the strongest relationship with tenderness was found for Z in the T configuration at 1 kHz (r = −0.834). The T configuration better reflected moisture content and fatty acid groups, whereas the L configuration was more informative for ash. Cs provided additional information related to protein. These findings indicate the potential usefulness of this approach for rapid beef quality screening under strictly standardised measurement conditions, although the observed relationships require confirmation in a larger sample set.
1. Introduction
Ensuring consistent beef quality, particularly in terms of tenderness and key technological traits, remains one of the major challenges facing the meat industry. Tenderness is a highly variable trait, and its reliable assessment in practice usually requires either time or laboratory-based analyses. Therefore, there is growing interest in non-destructive methods that can be applied in-line or at-line to complement time-consuming measurements of WBSF, chemical composition, and water-loss-related traits [1,2,3]. Among these, biophysical approaches based on the electrical properties of meat are being developed to assess quality, freshness, and postmortem changes [3,4,5,6]. At the same time, variability in measurement conditions, including electrode arrangement, electrical contact, temperature, and frequency range, together with the lack of a standardised measurement and data-processing framework, remains a major barrier to practical implementation and hampers comparisons across studies [3,5,7].
After slaughter, muscle undergoes a series of postmortem changes, including pH decline, rigor mortis, and proteolysis, which lead to structural remodelling and improved tenderness [8,9]. At the same time, traits related to hydration and water retention, including water-holding capacity and fluid loss, also change depending on ageing and chilling conditions [10,11,12]. These processes are accompanied by the redistribution of water and electrolytes, as well as a progressive loss of cell membrane integrity, which affects the resistive and capacitive components of the tissue. This provides the basis for the use of impedance measurements to monitor ageing, freshness, and quality-related changes in meat [3,5,13,14].
Meat is a heterogeneous and anisotropic system, and its electrical response therefore depends on the direction of current flow relative to muscle fibres. In practice, this means that measurements taken parallel and perpendicular to the fibres may differ, which is important for both repeatability and data interpretation [13,15,16]. For this reason, control of electrode arrangement, sample temperature, and frequency range is essential for obtaining comparable results [3,5]. It has also been shown that relationships between electrical parameters and texture may vary among muscles and may differ in strength depending on the direction of measurement relative to the fibres [5,13,15,17], which is particularly relevant for muscles such as m. semimembranosus, which undergoes pronounced structural changes during ageing.
In recent years, impedance-based measurements and predictive quality models have developed rapidly, with particular emphasis on the selection of informative features and appropriate measurement conditions [3,18]. In beef, bioimpedance has shown potential for predicting intramuscular fat and selected physicochemical traits [19], as well as for assessing beef freshness under retail display conditions [14]. However, only a limited number of studies have simultaneously addressed ageing-related electrical responses, texture-related traits, and measurement anisotropy under controlled electrode orientation conditions [17,19,20]. As a result, it remains unclear which electrical parameters and measurement conditions, particularly frequency and electrode orientation relative to muscle fibres, best reflect technologically relevant changes in beef during ageing, especially in m. semimembranosus.
To address this gap, the present study applied multi-frequency LCR measurements (100 Hz–100 kHz) using two controlled electrode configurations relative to muscle fibres in beef m. semimembranosus during ageing. Electrical parameters, namely impedance (Z), admittance (Y), parallel capacitance (Cp), and series capacitance (Cs), were measured and related to technological quality traits of beef during ageing, as well as to selected compositional traits after 14 days of ageing. This approach was intended to identify the parameters most useful for tenderness and composition assessment within a procedure that could potentially be applied at-line.
Accordingly, the following research objectives were formulated:
- To determine the relationships between selected electrical parameters of beef (Z, Y, Cp, and Cs) and technological quality traits, including tenderness and cooking loss during ageing (3, 7, 14, and 28 days).
- To assess the relationships between selected electrical parameters and the chemical composition and fatty acid profile of beef after 14 days of ageing, treated as a technologically relevant stage of wet-aged beef.
- To evaluate the effect of signal frequency (100 Hz–100 kHz) and electrode configuration relative to muscle fibres (T, across the fibres; L, along the fibres) on the usefulness of electrical parameters as indicators of beef quality.
The working hypothesis was that the measured electrical parameters of beef (Z, Y, Cp, and Cs) may be related to tenderness and selected composition-related traits, and that these relationships depend on signal frequency and electrode configuration relative to muscle fibre orientation.
2. Materials and Methods
2.1. Experimental Material
The experimental material consisted of black-and-white Holstein–Friesian bulls aged approximately 18 to 22 months (n = 8). During the rearing period, the animals were assigned to two feeding treatments. Bulls in the first group were fed diets supplemented with Optirum, a preparation containing herbal extracts intended to improve gastrointestinal function in cattle (n = 4), whereas bulls in the second group received diets supplemented with both Optirum and Stresomix, the latter being used to reduce stress (n = 4). Details of animal rearing, slaughter, and postmortem carcass chilling were described by Modzelewska-Kapituła et al. [21]. The feeding treatments were part of the original animal experiment from which the beef samples were obtained and were not considered the primary factor in evaluating the electrical measurements. In the present study, feeding treatment was included as an additional source of biological variation in the experimental material and was considered in the statistical analysis and interpretation of the results.
The study was carried out on beef semimembranosus muscles collected from each carcass following 24 h of postmortem chilling (n = 8). The same muscle was selected for all animals in order to minimise variability related to muscle type. Four separate steaks (approximately 500 g each) were prepared from each muscle, and each steak was assigned to a single aging period: 3, 7, 14, or 28 days. Thus, the successive ageing stages were evaluated on separate steaks obtained from the same muscle and prepared according to the same portioning scheme. Steaks intended for ageing for 7 to 28 days were individually vacuum-packaged in PA/PE film (70 μm thick; Inter Arma sp. z o.o., Rudawa, Poland), with overall migration not exceeding 10 mg/dm2 in food simulants (3% acetic acid and 50% ethanol, 10 days at 40 °C; isooctane, 2 days at 20 °C), and aged at 4 ± 1 °C in a climate chamber (Memmert GmbH, Schwabach, Germany). On day 3, steaks were subjected to electrical measurements and pH determination, after which the samples were heat-treated, and cooking loss and Warner–Bratzler shear force (WBSF) were determined. Samples aged under vacuum were treated analogously. Additionally, after 14 days of ageing, the basic chemical composition and fatty acid composition were determined to explore the relationships between electrical parameters and selected compositional traits at a technologically relevant stage of wet ageing.
2.2. Measurement of Electrical Parameters
Electrical measurements were carried out after 3, 7, 14, and 28 days of ageing under refrigerated conditions (4.0 ± 0.1 °C; ICP500, Memmert GmbH + Co. KG, Schwabach, Germany). Prior to each measurement, chilled meat samples were kept in a climate chamber for approximately 3 h in order to stabilise the temperature of the meat throughout the sample volume at 4 °C. Because the duration of a single measurement was short (approximately 2–3 min.), no substantial temperature change in the sample was expected during the measurement.
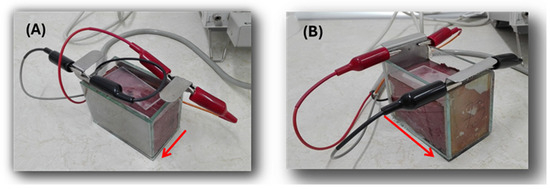
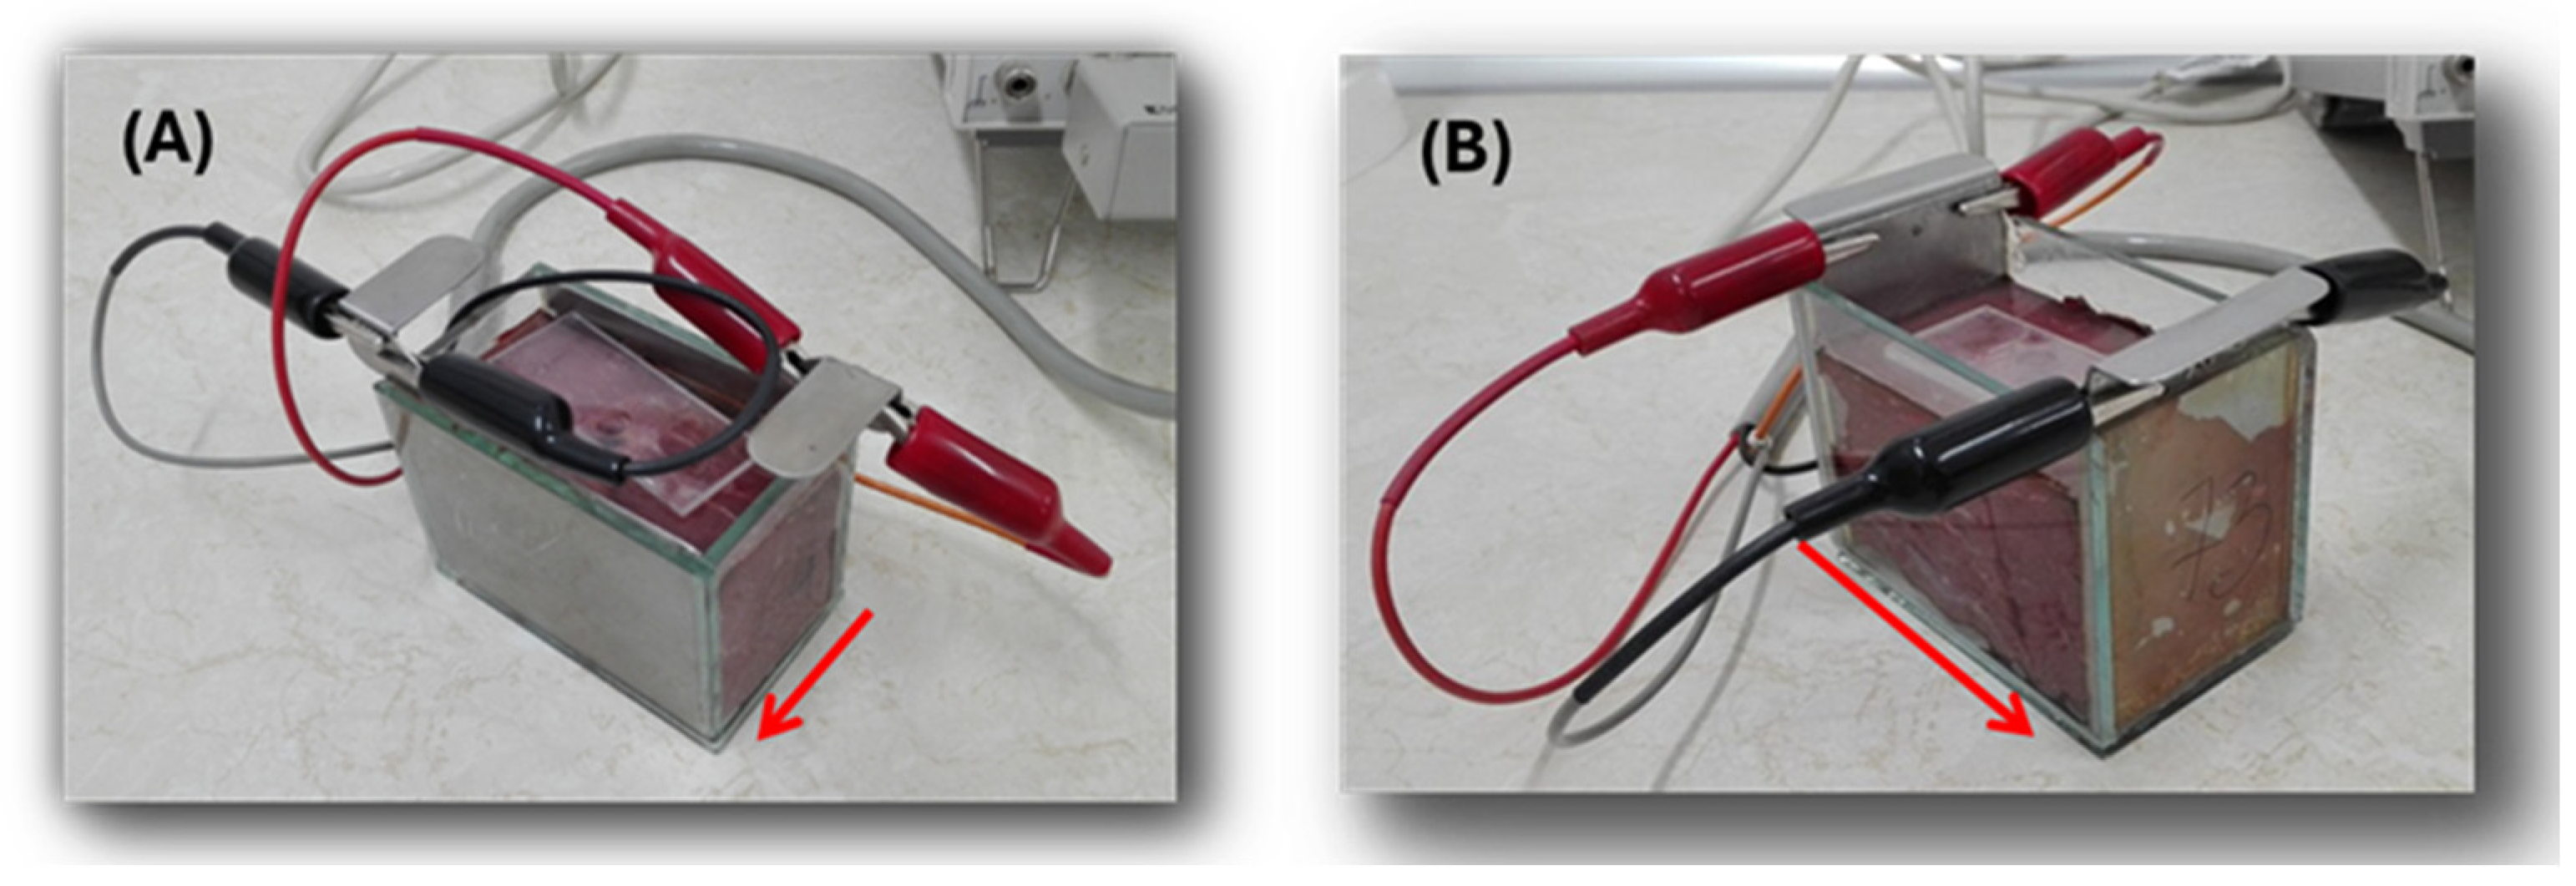
The measurements were performed using an in-house sensor consisting of a glass measurement cell (105 × 60 × 80 mm) fitted with electrodes mounted flush against two opposite walls. The electrodes were made of stainless steel. In the T configuration (Figure 1A), the electrode dimensions were 89 × 77 mm each, and the distance between the electrodes was 47 mm. In the L configuration (Figure 1B), the electrode dimensions were 73 × 54 mm each, and the distance between the electrodes was 91 mm. This arrangement allowed current to flow either across the muscle fibres (T, transverse; Figure 1A) or along the muscle fibres (L, longitudinal; Figure 1B). Muscle samples cut into cuboid-shaped pieces (approximately 500 g; about 120 × 70 × 60 mm each) were placed in the measurement cells and covered with insulating plates. The prepared measurement sensor was then connected to the LCR meter using 1 m measuring cables, which had been compensated in advance using the internal function of the device.
Figure 1.
In-house measuring sensor with two electrode configurations: (A) transverse (T) and (B) longitudinal (L) relative to the muscle fibres. Red arrows indicate the direction of the muscle fibres used as the reference for electrode configuration.
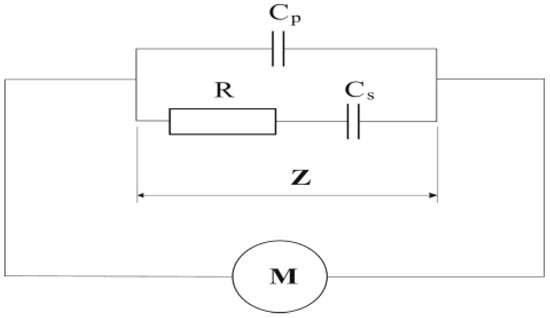
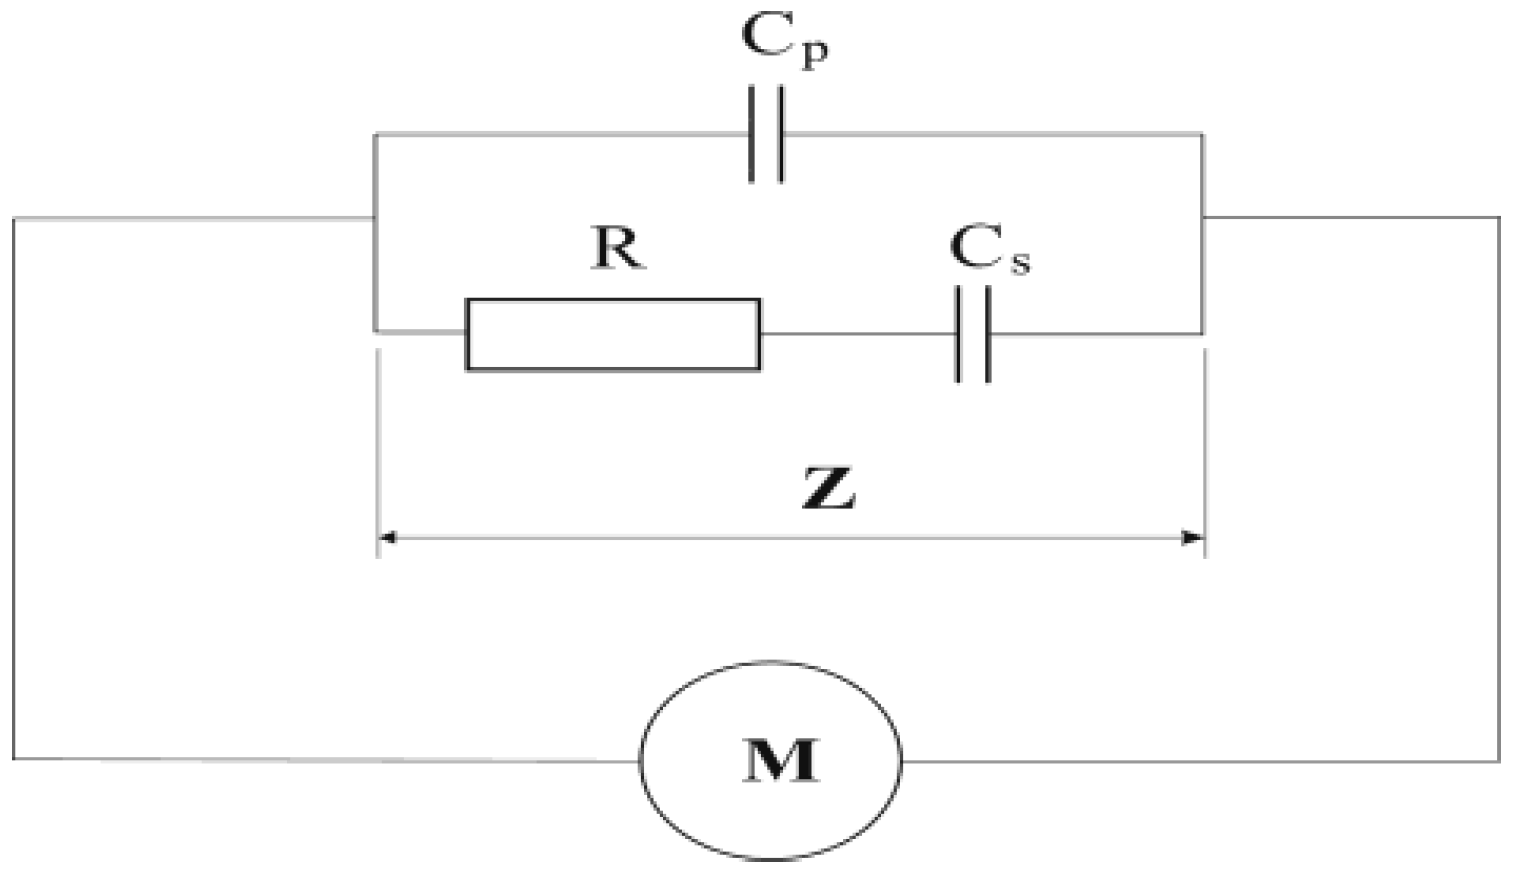
Electrical parameters, namely impedance (Z), admittance (Y), parallel capacitance (Cp), and series capacitance (Cs), were measured using an HP 4263B LCR meter (Hewlett-Packard Company, Palo Alto, CA, USA) at a measuring voltage of 250 mV over a frequency range of 100 Hz to 100 kHz, with three replicates per sample. A low excitation signal was used to ensure stable readings without affecting the muscle tissue. The data were interpreted using an RCC equivalent model for food products (resistance + series–parallel capacitance; Figure 2), which had also been applied in our previous studies to evaluate quality changes in animal-derived products [22,23]. In this model, the resistive component (R) reflects the conductive contribution of the water–electrolyte phase of muscle tissue, whereas the capacitive components (Cs and Cp) reflect polarisation phenomena associated with cell membranes, fibre boundaries, and other structural interfaces in the tissue [5]. The results were recorded in the external memory of the meter.
Figure 2.
RCC equivalent model used for the measurement of electrical properties of food products (Z—impedance; R—resistance; Cs—series equivalent capacitance; Cp—parallel equivalent capacitance; M—measuring device).
2.3. pH Measurement
pH was measured in the muscles after trimming (24 h postmortem chilling) and after 28 days of ageing using a HI 8314 pH meter (Hanna Instruments, Inc., Woonsocket, RI, USA) equipped with a PFC 200 penetration electrode. Before measurement, the instrument was calibrated with pH 7.0 and pH 4.0 buffers. Sample temperature was approximately 10 °C. All measurements were performed in triplicate. pH determination was used as a control measure to assess the experimental material and to confirm the normal course of postmortem acidification.
2.4. Warner–Bratzler Shear Force (WBSF)
After electrical and pH measurements, a meat portion weighing approximately 300 g was excised from each sample, vacuum-packaged in polyethylene film, and pasteurised in a water bath (Memmert GmbH, Schwabach, Germany) at 72 ± 0.1 °C for approximately 90 min. The heat-treated product was then cooled in water for about 30 min. Muscle samples were cut parallel to the muscle fibre direction into cuboid-shaped pieces measuring 10 × 10 × 30 mm and used for tenderness evaluation using a universal testing machine (Instron 4301, Instron, Norwood, MA, USA). Shear force was determined using a Warner–Bratzler single-blade shear device (type 2830-013, Norwood, MA, USA), with the muscle fibres oriented perpendicular to the direction of blade movement and a crosshead speed of 50 mm/min. Maximum shear force (WBSF, expressed in N) was measured after 3, 7, 14, and 28 days of storage, with nine replicates per sample. The test results were analysed using Bluehill II software.
2.5. Cooking Loss
Cooking loss was calculated according to the following equation:
where a is the sample weight before cooking (g) and b is the sample weight after cooking (g).
Cooking loss (%) = ((a − b)/a) × 100
2.6. Chemical Composition
The 100 g samples were ground twice using a 3 mm mesh; the ground bulk was thoroughly mixed, and samples were taken for the determination of moisture, protein, fat, and ash. Moisture was determined using the oven-drying method (drying at 103 ± 2 °C to a constant weight [24]), crude protein content using the Kjeldahl method [25] (AOAC, 2006b, No. 992.15), fat content using the Soxhlet method [26] (AOAC, 2006a, No. 991.36), and ash according to PN-ISO 936 [27].
2.7. Fatty Acid Composition
Fat was extracted by the method of Folch, Less, and Sloane-Stanley [28] using chloroform/methanol (2:1 v/v).
Fatty acid composition was determined using the method of Peisker [29]. Samples were transesterified with a mixture of chloroform, methanol, and sulfuric acid (100:100:1).
Chromatographic separation of fatty acid methyl esters (FAMEs) was performed using an Agilent Technologies 7890A gas chromatograph (Agilent Technologies, Inc., Santa Clara, CA, USA). The chromatograph was equipped with a flame ionization detector (FID) and a 30 m long, 0.32 mm internal diameter capillary column (active group matrix: poly (ethylene glycol) phase, Supelco, Bellefonte, PA, USA). The liquid phase was Supelcowax 10, and the layer thickness was 0.25 μm. Helium was used as the carrier gas; flow rate: 1 mL/min. Separation was performed under the following conditions: detector temperature 250 °C; injector temperature 230 °C; column temperature 195 °C. To identify individual fatty acids (FAs), retention times were compared with standards (Supelco™ 37 Component FAME Mix, Supelco, Bellefonte, PA, USA). Fatty acid content was presented as a relative percentage (% of total FAs) in beef.
2.8. Statistical Analysis
Differences between mean values were assessed by analysis of variance (ANOVA). A two-way ANOVA (feeding treatment × ageing time) was used for technological traits, whereas a four-way ANOVA was applied to electrical parameters (Z, Y, Cp, and Cs), with feeding treatment, ageing time (3, 7, 14, and 28 days), measurement frequency (100 Hz–100 kHz), and electrode configuration (T/L) included as factors. When significant differences were detected, means were compared using Tukey’s honestly significant difference (HSD) test at p < 0.05 [30,31]. For technological traits, the statistical model included feeding treatment and ageing time as fixed effects. For electrical parameters, the model included feeding treatment, ageing time, measurement frequency, and electrode configuration as fixed effects. Because measurements obtained at different frequencies and ageing times from material originating from the same animals were not fully independent, the data were additionally interpreted as repeated observations. Therefore, supplementary analyses were performed using mixed-effects models in which bull identity was included as a random effect. The results of these analyses were consistent with the general pattern obtained from the analysis of variance and with those presented in Section 3.
Relationships between electrical parameters and technological traits of meat were evaluated using PROFIT analysis. The analysis was performed separately for each feeding group in order to account for differences in tenderisation kinetics identified by ANOVA. Additionally, a pooled analysis was conducted as a complementary approach to explore general patterns independent of feeding treatment; however, its results were interpreted with caution due to potential confounding effects arising from group differences [32,33]. In the PROFIT analysis, external variables (technological traits) were projected onto the two-dimensional space obtained for the electrical parameters. For each variable, a linear regression model was fitted to the coordinates of the observations in this space. The direction of the vector corresponded to the direction of the regression gradient, whereas its length was proportional to the coefficient of determination (R2), reflecting the strength of the relationship between a given trait and the two-dimensional ordination.
Relationships between electrical parameters and the chemical composition and fatty acid profile of beef after 14 days of ageing were analysed by principal component analysis (PCA) using standardised data. The analyses were performed separately for each electrode configuration. All statistical analyses were carried out using Statistica 13.3 software (StatSoft). Due to the limited sample size (n = 8 after 14 days of ageing), 95% confidence intervals and exact p-values were reported for all Pearson correlation coefficients presented in Section 3. In addition, a leave-one-out sensitivity analysis was performed and showed the relative stability of the observed relationships. Given the sample size, the correlation analyses were treated as exploratory and hypothesis-generating. No formal correction for multiple comparisons or predictive validation was applied, and the results were interpreted primarily on the basis of consistency, effect size (r), and confidence interval width.
3. Results and Discussion
3.1. Changes in Beef Tenderness and Cooking Loss During Ageing
The pH range of the analysed samples (5.4–5.7) indicated a normal course of postmortem glycolysis and the absence of quality deviations associated with atypical ultimate pH. This suggests that the observed differences in WBSF and cooking loss were not caused by abnormalities in postmortem acidification. Therefore, the variation in these parameters should primarily be attributed to the ageing process and the accompanying structural and biochemical changes in muscle tissue [4,9].
Ageing time had a significant effect on WBSF (p < 0.001; Table 1). In both groups, a typical tenderisation pattern was observed, with the greatest reduction in shear force occurring by day 14, followed by a marked slowing of further changes. In group F1, WBSF decreased from 79.76 N (3 d) to 52.75 N (14 d) and 38.79 N (28 d), whereas in group F2 it decreased from 56.26 N (3 d) to 40.79 N (14 d) and 39.53 N (28 d) (Table S1). This pattern is consistent with the mechanism of wet ageing, in which proteolysis of proteins stabilising myofibrillar ultrastructure, including cytoskeletal–myofilament complexes, plays a key role, leading to weakening of fibre integrity and a reduction in WBSF [8,9].
Table 1.
Effects of feeding (F) and ageing time (A) on beef tenderness (WBSF) and cooking loss (means ± SEM).
Analysis of variance showed a significant effect of feeding treatment and the feeding treatment (F) × ageing time (A) interaction on WBSF values (p < 0.001; Table 1), indicating different tenderisation kinetics between the experimental groups. The differences between groups were most pronounced during the early stage of ageing, whereas after 28 days the WBSF values converged (Table S1). From a technological point of view, this phenomenon may be related to preslaughter factors, including feeding strategies affecting the initial variability of meat quality traits and the early course of postmortem tenderisation, while their influence generally diminishes as ageing progresses [21,34,35]. With regard to herbal feed additives, the literature indicates that selected beef quality traits may be modified, although the direction and magnitude of the effects depend on the composition of the mixtures, the dose applied, and production conditions [21]. It should also be noted that post-slaughter technological factors, including electrical stimulation, may markedly affect the rate of postmortem changes and the development of tenderness [23].
Cooking loss was significantly affected by ageing time (A, p < 0.001; Table 1), whereas no effect of feeding treatment (F) or A × F interaction was found. Detailed data in Table S2 show an increase in cooking loss to approximately 29% on day 14 (F1—29.36%; F2—29.19%), followed by a decrease to about 22% after 28 days (F1—21.80%; F2—22.70%). This non-linear pattern may be explained by the fact that cooking loss reflects the combined effects of several overlapping processes, including remodelling of the myofibrillar microstructure and changes in water distribution within the tissue during ageing, as well as protein responses to heating, such as denaturation, thermal shrinkage, and water displacement from sites of water retention. In addition, after prolonged wet ageing, part of the water may already have been lost before cooking as storage exudate, which could reduce the subsequent mass loss observed during heat treatment. This indicates that improvements in tenderness during ageing do not necessarily occur in parallel with changes in cooking loss, which remains strongly dependent on heating conditions, muscle properties, and the structural state of the tissue at the time of cooking [9,10,11,36].
These findings provide the basis for the interpretation of the electrical data presented in the following section. The postmortem changes responsible for improved tenderness, together with changes in the distribution of water and electrolytes, simultaneously affect the electrical properties of muscle tissue [4,5]. The next subsection presents changes in electrical parameters (Z, Y, Cp, and Cs) at the same ageing time points as a function of frequency and electrode configuration (L/T). A similar link between postmortem age and changes in beef bioimpedance has also been reported in studies on beef longissimus muscle under retail-display conditions, where impedance values changed with increasing postmortem age [14].
3.2. Changes in Electrical Parameters During Meat Ageing
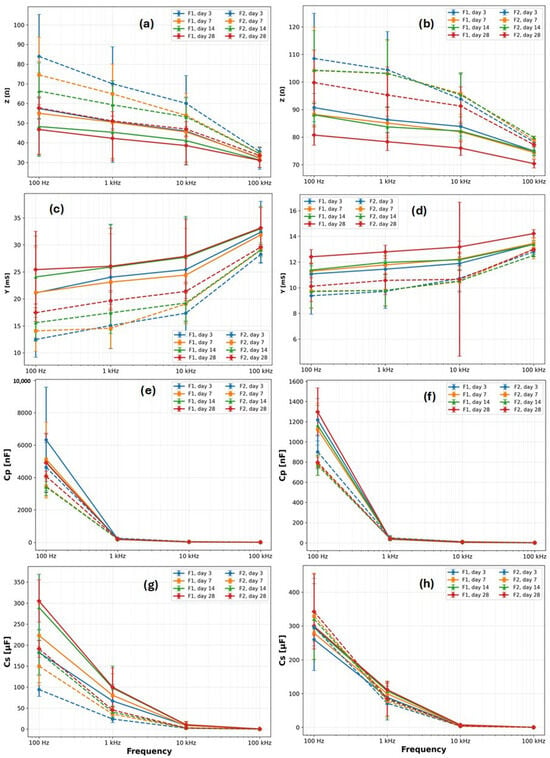
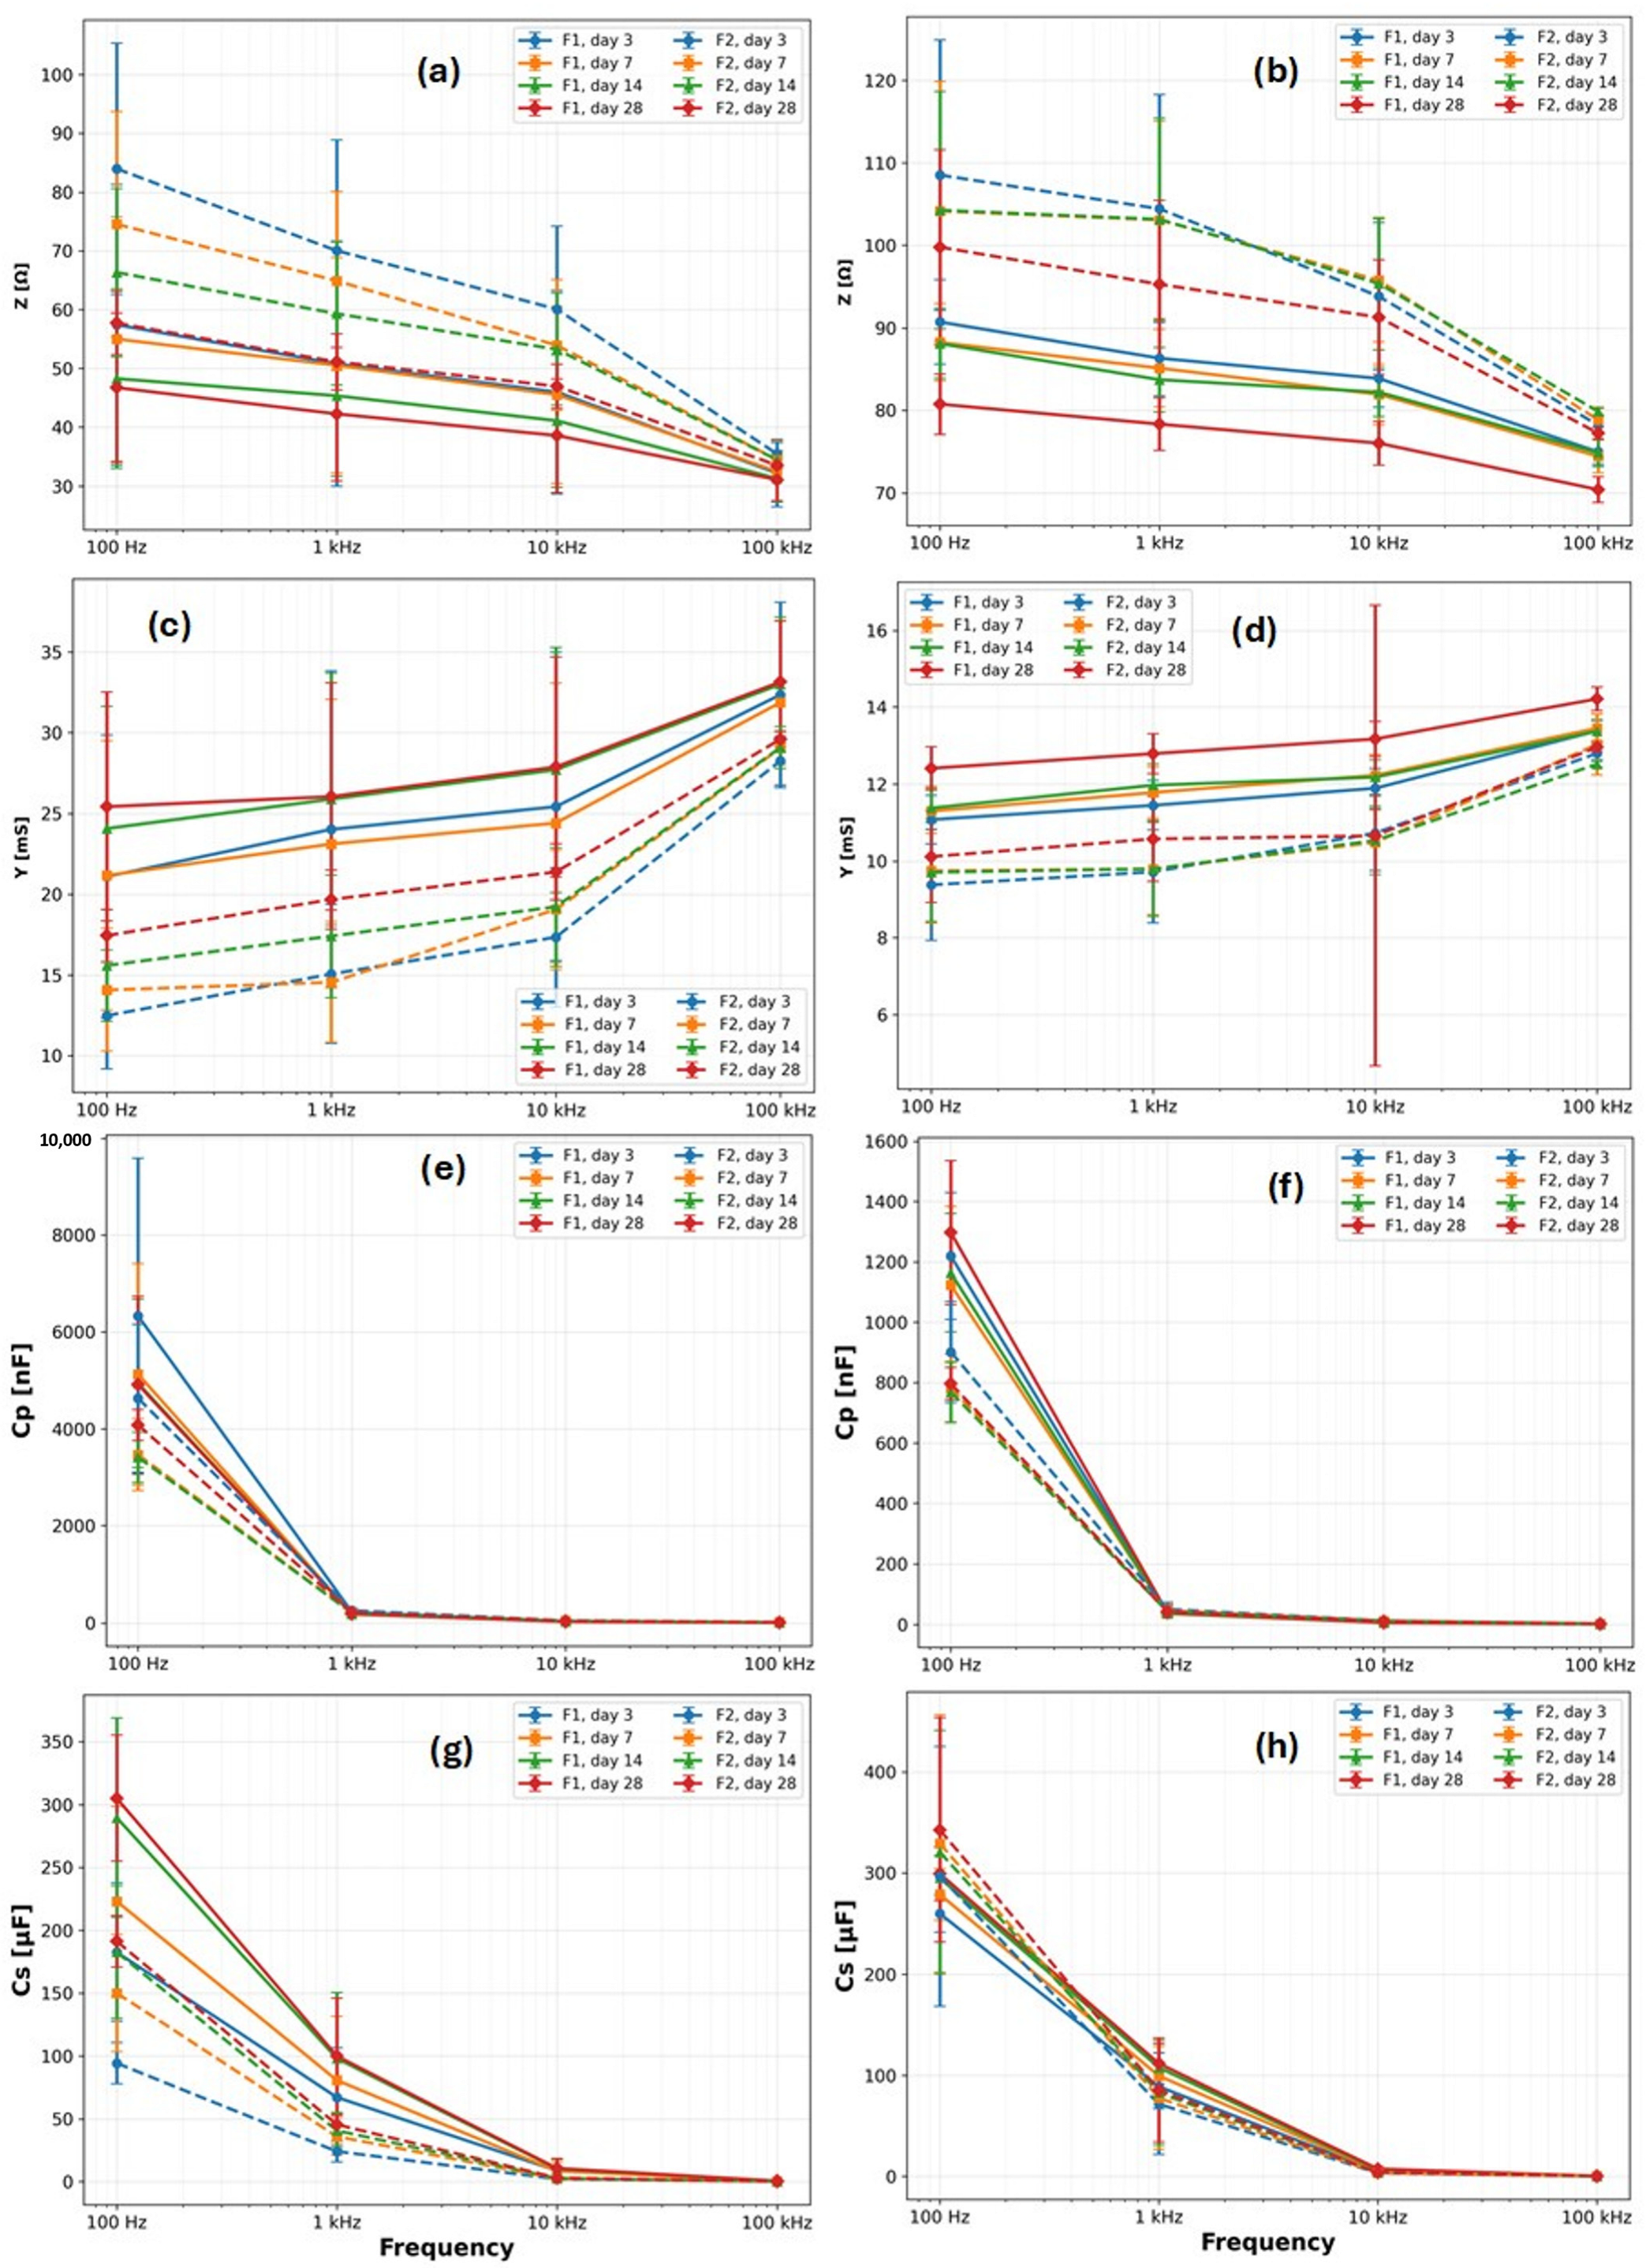
The electrical parameters of beef (m. semimembranosus) (Z, Y, Cp, and Cs) were analysed during ageing over a frequency range of 100 Hz–100 kHz, taking into account feeding treatment and electrode configuration (L/T). The results are shown in Figure 3a–h (Tables S3 and S4), and the effects of the factors and their interactions were assessed by ANOVA.
Figure 3.
Frequency-dependent changes (100 Hz–100 kHz) in electrical parameters of beef during ageing (3, 7, 14, and 28 days) for two feeding groups (F1, F2) and two electrode configurations: T (transverse, across fibres) and L (longitudinal, along fibres). Panels (a,b) show impedance (Z), panels (c,d) admittance (Y), panels (e,f) parallel capacitance (Cp), and panels (g,h) series capacitance (Cs). In each pair of panels, the left panel corresponds to the T configuration and the right panel to the L configuration. Values are mean ± SD.
In both feeding treatments (F1, F2), a frequency-dependent pattern typical of biological tissues was observed. As frequency increased, Z decreased, and Y increased (Figure 3a–d). This phenomenon can be attributed to the reduced contribution of the capacitive barrier of cell membranes and the easier flow of current through tissue structures at higher frequencies. This indicates that different frequency ranges provide different information about tissue hydration and cell membrane integrity, as also reported in review papers on electrical impedance spectroscopy (EIS) in meat [3,5]. In biological tissues, this behaviour is associated with dispersion processes linked to interfacial polarisation and membrane-related dielectric effects, which are particularly relevant in the low- and intermediate-frequency range used in meat studies [5].
Furthermore, the results clearly confirm the electrical anisotropy of muscle tissue. Z and Y values differed between the L and T electrode configurations (Figure 3a–d), indicating that the orientation of the current pathway relative to the muscle fibres is a critical methodological factor and should therefore be standardised. The differences between L and T arose from the directional organisation of muscle tissue (fibres, bundles, and intercellular spaces), which modifies the effective conduction pathway and the contribution of phase boundaries when current flows either parallel or perpendicular to the fibres.
Consequently, electrode configuration affects not only the absolute values of the measured parameters but also their technological interpretation and usefulness in quality assessment. A mechanistic explanation is that current flowing perpendicular to the fibres encounters a greater contribution of membrane-related barriers and capacitive effects, whereas current flowing parallel to the fibres may bypass these barriers more easily, which is consistent with the bioelectrical anisotropy of skeletal muscle described in the literature [16].
This is consistent with reports showing that anisotropy and the state of cellular structures shape the impedance response of muscle [5,13,15]. A similar importance of measurement conditions has also been demonstrated in beef, where bioimpedance depends on the location and mode of measurement and correlates with selected freshness and quality attributes [14]. Our previous studies further confirmed the usefulness of conductive properties for assessing the degree of meat ageing and their sensitivity to technological factors [22,23]. Zhao et al. [5] further highlighted that measurements should be performed at a specific sample location with controlled electrode orientation and temperature, as muscle anisotropy and measurement setup strongly affect data interpretation.
The results of the analysis of variance confirmed the dominant influence of measurement-related factors (Table 2). For impedance (Z), feeding (F), frequency (freq), and electrode configuration (E) were all significant (p < 0.001). This confirms the occurrence of frequency dispersion and conduction anisotropy typical of muscle tissue. For admittance (Y), which reflects both conductive and capacitive components, significant interactions were also found in addition to the main effects (p < 0.001), namely F × E (p = 0.03) and freq × E (p = 0.01). This indicates that Y, more than Z, captures the interdependence between raw material variability, measurement geometry, and frequency selection, because parameters with a greater contribution of the capacitive component are more sensitive to structural changes in the tissue and to variation in the measurement system [3,5,7].
Table 2.
Effects of feeding (F), ageing time (A), measurement frequency (freq), and electrode configuration (E) on the values of Z, Y, Cp, and Cs.
In contrast to frequency and electrode configuration, ageing time (A) did not show a significant main effect on Z, Y, Cp, or Cs (Table 2). The absence of a significant main effect of ageing time in the analysis of variance does not mean that such an effect was absent. Rather, it indicates that its influence became apparent only within specific frequency ranges and under a specific electrode configuration. Therefore, the electrical parameters should be regarded as a set of variables describing the structural state of the tissue, and that their interpretation requires multivariate analysis
It should also be noted that the strong effect of frequency is partly related to the repeated-observation structure of the data, which may have led to an overestimation of the degrees of freedom in classical ANOVA. Therefore, this effect should be interpreted qualitatively. In the measurement system used, the variability of the electrical parameters was more strongly determined by measurement conditions than by ageing time itself.
However, the absence of a main ageing effect does not rule out relationships with quality traits such as WBSF. The effect of ageing became apparent only within selected frequency ranges and under a specific electrode configuration, whereas it was attenuated when the entire frequency range was considered. This explains why ageing-related patterns could still be observed in multivariate analyses despite the absence of a significant main ageing effect in Table 2.
In practice, impedance measurements (Z, Y, Cp, and Cs recorded as a function of frequency and electrode configuration) should be regarded as a multidimensional set of descriptors for quality assessment rather than as a single indicator for the direct classification of ageing time. This interpretation is consistent with reports indicating that the diagnostic value of impedance signals depends on the appropriate selection of frequency, electrode configuration, and measurement geometry, as well as on the methods used for data processing and analysis [3,5,7].
The capacitive parameters Cp and Cs showed a strong dependence on frequency (Table 2; p < 0.001). This is consistent with the fact that the capacitive component reflects polarisation phenomena associated with cellular structures and phase boundaries in muscle tissue [5]. For Cp, the freq × E interaction was significant (p < 0.001), indicating that Cp is particularly sensitive to measurement conditions, especially measurement geometry and interfacial effects. For this reason, the interpretation of Cp requires particularly strict standardisation of measurement conditions. Key factors include constant sample temperature, reproducible electrode contact, and a fixed electrode configuration (T/L). For Cs, both feeding treatment (p < 0.05) and the F × freq interaction (p = 0.017) were significant. This suggests that differences in raw material characteristics are revealed selectively within specific frequency ranges. In turn, this may indicate that Cs reflects more subtle differences in phase organisation and tissue hydration status that are not equally evident across the entire frequency range analysed. A similar interpretation is supported by the membrane-related origin of dielectric dispersion phenomena, which are associated with dielectric behaviour at cell interfaces and changes in membrane permeability during postmortem ageing [5].
As shown in Table 2, the statistical significance of the electrical parameters was more often determined by measurement-related factors (frequency and electrode configuration) and feeding treatment than by ageing time. Therefore, further analysis of the relationships between Z, Y, Cp, and Cs and tenderness-related and technological traits was performed under strict control of electrode configuration (L/T) and at selected frequencies. In addition, these relationships were analysed separately for the L and T configurations in order to minimise the influence of tissue anisotropy on the interpretation of the results
3.3. PROFIT Analysis: Electrical Parameters vs. Technological Traits During Ageing
The relationships between electrical parameters (Z, Y, Cp, and Cs) and meat technological quality traits, namely WBSF and cooking loss, were evaluated using PROFIT analysis [33]. The analysis was performed separately for the two electrode configurations (L and T). This approach made it possible to compare relationships within each configuration and to reduce the influence of fibre orientation on the interpretation of the results. It should be emphasised that the pooled analysis for both feeding groups was complementary and exploratory in nature. Because significant differences in tenderisation kinetics (WBSF) were observed between the feeding groups, the results of this pooled analysis were interpreted in the context of the analyses performed separately for each group.
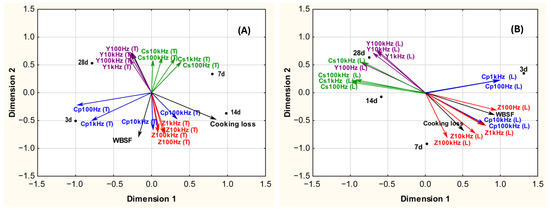
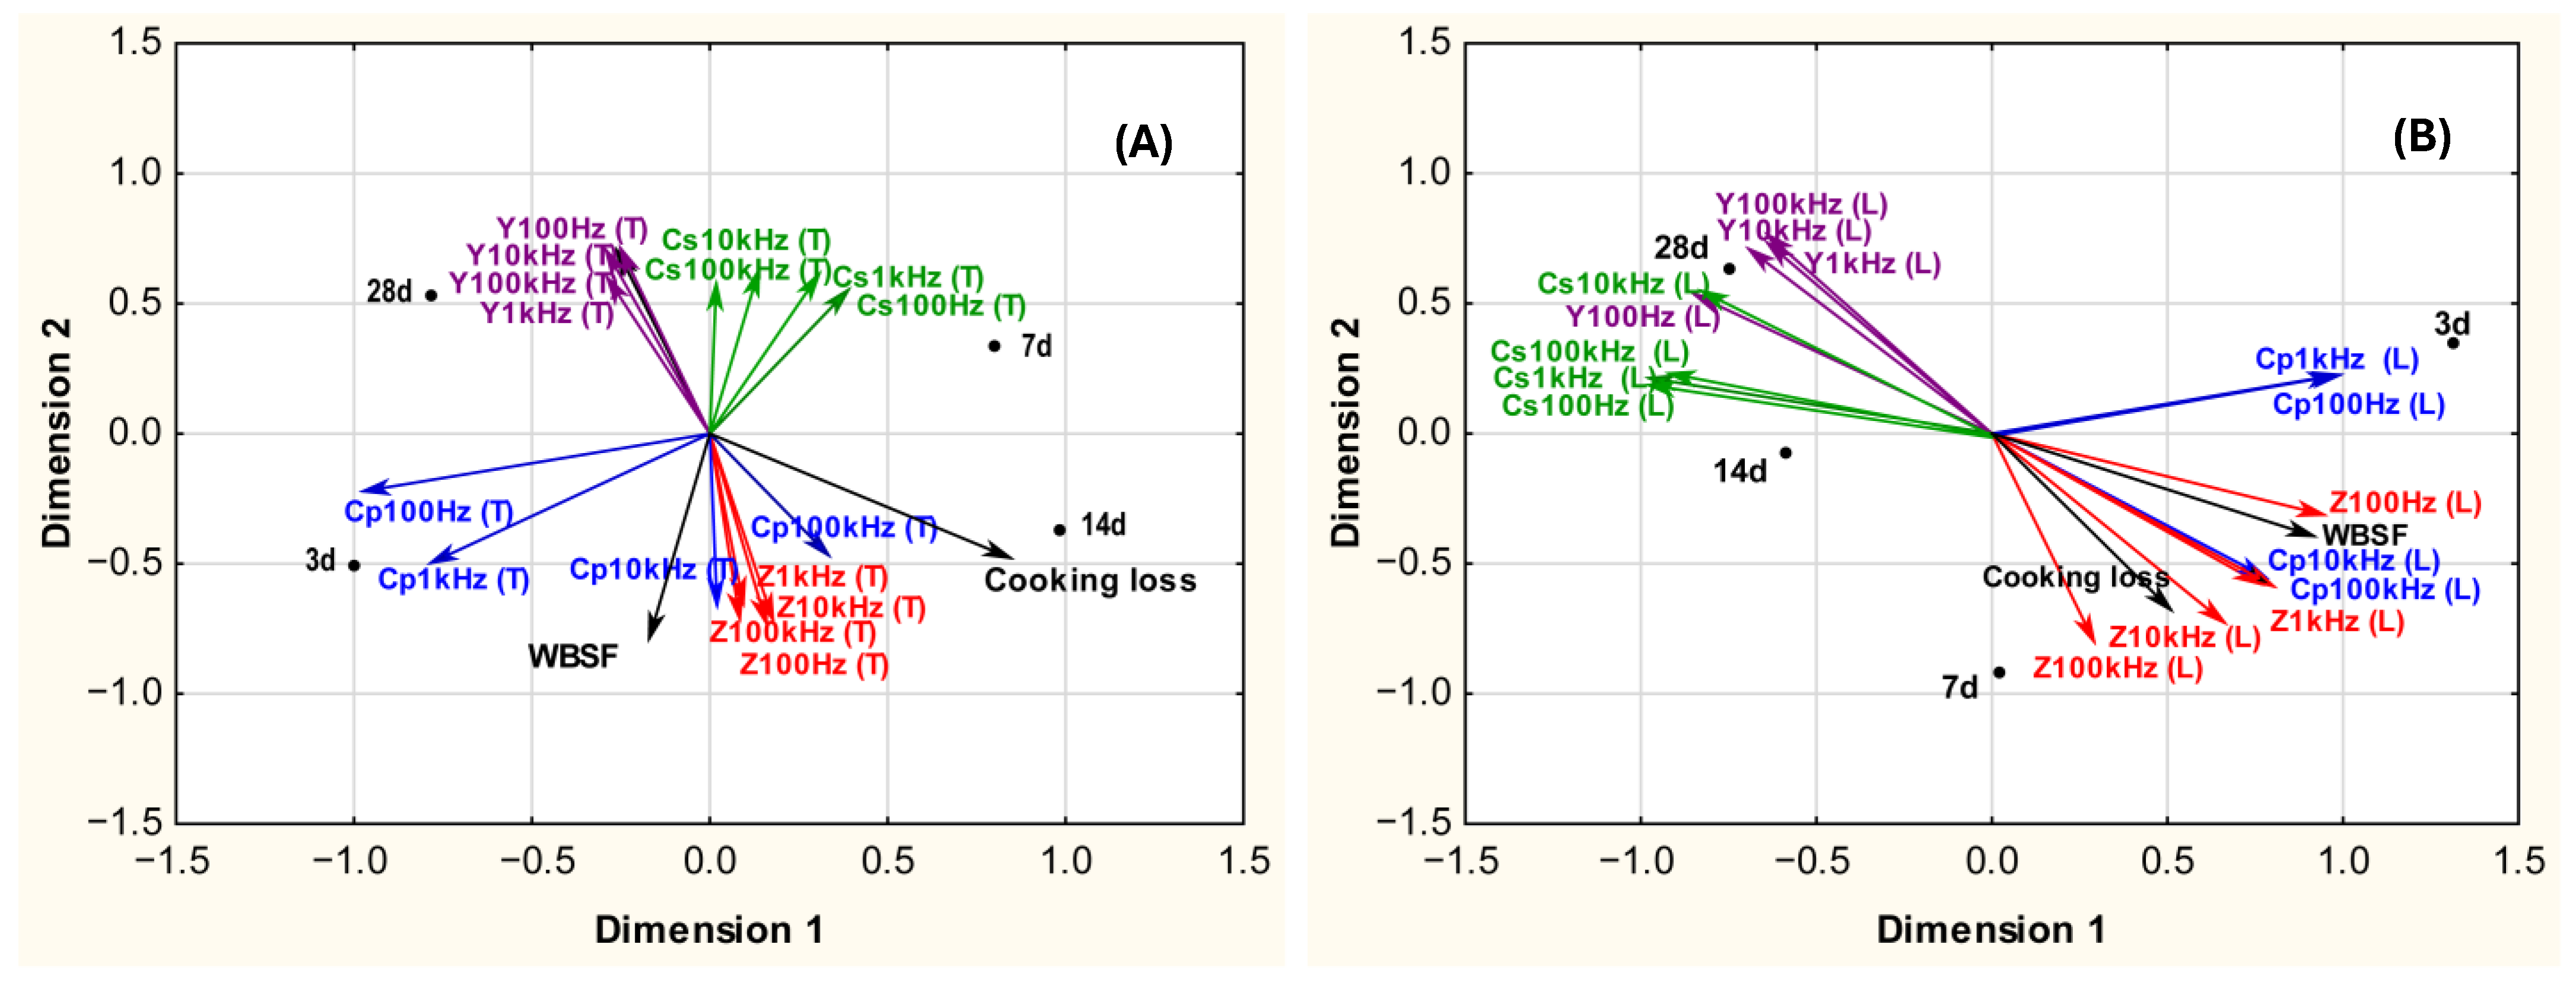
In Figure 4A,B, the samples are arranged according to ageing time. Points corresponding to successive ageing times (3, 7, 14, and 28 days) were distributed along the main direction of variation. This indicates that the electrical profile of meat changed as ageing progressed. The graphical interpretation is quantitative, i.e., the direction of a vector indicates the direction of the greatest increase in a given trait within the two-dimensional space, whereas its length reflects the strength of the relationship (R2) with the analysed dimensions.
Figure 4.
PROFIT analysis of relationships between electrical parameters (Z, Y, Cp, Cs) and technological quality traits (WBSF and cooking loss) during beef ageing (3, 7, 14, and 28 days) under two electrode configurations: (A) L (longitudinal, along fibres) and (B) T (transversal, across fibres).
At the same time, the direction of this variation was consistent with the vectors representing technological traits. The WBSF vector was aligned with the main gradient of sample variability, indicating that variation in the electrical signal was related to changes in meat texture. In contrast, the cooking loss vector followed a different direction, suggesting that the electrical parameters may describe two components of quality differently, namely texture as reflected by shear force and water behaviour during heating. A similar technological relevance of bioelectrical measurements in beef was reported by Afonso et al. [19], who demonstrated significant relationships between BIA parameters and both WBSF and cooking loss.
This finding is consistent with studies in which impedance-based methods have been used to monitor wet-aged beef. Damez et al. [17] showed that the impedance response of meat depends on the direction of measurement relative to muscle fibres and that it reflects structural changes occurring during ageing, whereas Zhao et al. [5] emphasised the importance of frequency selection and measurement configuration in signal interpretation. Zhao et al. [5] also pointed out that muscle anisotropy, electrode orientation, and measurement setup configuration complicate direct interpretation of EIS data and should be strictly controlled. In addition, Lepetit et al. [15] demonstrated that impedance measurements in beef may reflect tenderisation-related changes and that the diagnostic value of the signal depends on both muscle characteristics and measurement direction. In this context, PROFIT analysis makes it possible to assess whether the main directions of variation in electrical parameters align with the directions of change in WBSF and cooking loss, and therefore whether the signal carries technological rather than merely metrological information.
In the T electrode configuration (Figure 4B), the relationships between conductive parameters (Z, Y), capacitive parameters (Cp, Cs), and technological traits were more distinct. The conductive parameters, together with some of the capacitive parameters, were aligned with the direction of changes in WBSF and cooking loss. This may be due to the fact that, in the T configuration, microstructural barriers intersected by the current path, including cell membranes and fibre boundaries, as well as heterogeneity in the distribution of the water–electrolyte phase, play a greater role, thereby increasing the sensitivity of the measurement to changes occurring during ageing.
The greater ability of the T configuration to distinguish between ageing stages is consistent with the anisotropic nature of muscle. Damez et al. [17] showed that the impedance response depends on the direction of measurement relative to muscle fibres and may reflect structural changes occurring during tenderisation. A similar relationship between impedance and beef tenderisation was described by Lepetit et al. [15], who indicated that the usefulness of electrical measurements in texture assessment depends on both the muscle examined and the direction of current flow relative to the fibres. Similar conclusions were reported by Zhao et al. [5], who also emphasised the importance of electrode configuration and frequency range in signal interpretation. Our previous studies, in turn, confirmed the usefulness of the conductive properties of beef for assessing the degree of ageing and their sensitivity to technological factors [22,23].
In the L electrode configuration (Figure 4A), a different pattern of relationships was observed: some of the capacitive parameters and selected conductive parameters were grouped differently than in the T configuration. This indicates that measurement along the fibres emphasises a different contribution of conduction pathways and polarisation phenomena in the tissue, in accordance with muscle anisotropy and the different geometry of current pathways in the two configurations [16,17]. The differences between the L and T configurations show that electrode arrangement (L/T) affects the values of the electrical parameters. Therefore, the same configuration should be used consistently in analyses and in comparative quality assessment, and the measurement setup should be taken into account when comparing results across studies [3,5].
PROFIT analysis showed that the relationships between electrical parameters and technological traits depended on electrode configuration, which provided a rationale for extending the analysis to chemical composition and fatty acid profile after 14 days of ageing. This time point was selected because compositional data from the same experimental material were available [21], and because samples aged for 14 days occupied an intermediate position within the overall pattern of variation. At the same time, these compositional data were used only as a reference set for correlation analysis and not as a basis for modelling compositional changes throughout the entire ageing process. This approach is also consistent with the view that impedance-derived variables should be interpreted as a multidimensional set of descriptors whose usefulness depends on the selected frequency range, measurement configuration, and subsequent multivariate analysis, rather than as a single universal indicator [5,7].
3.4. PCA Analysis and Correlations: Electrical Parameters vs. Chemical Composition and Fatty Acid Profile of Beef After 14 Days of Ageing
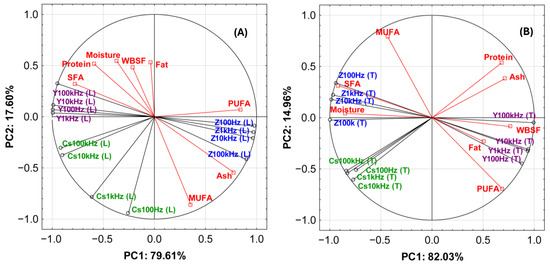
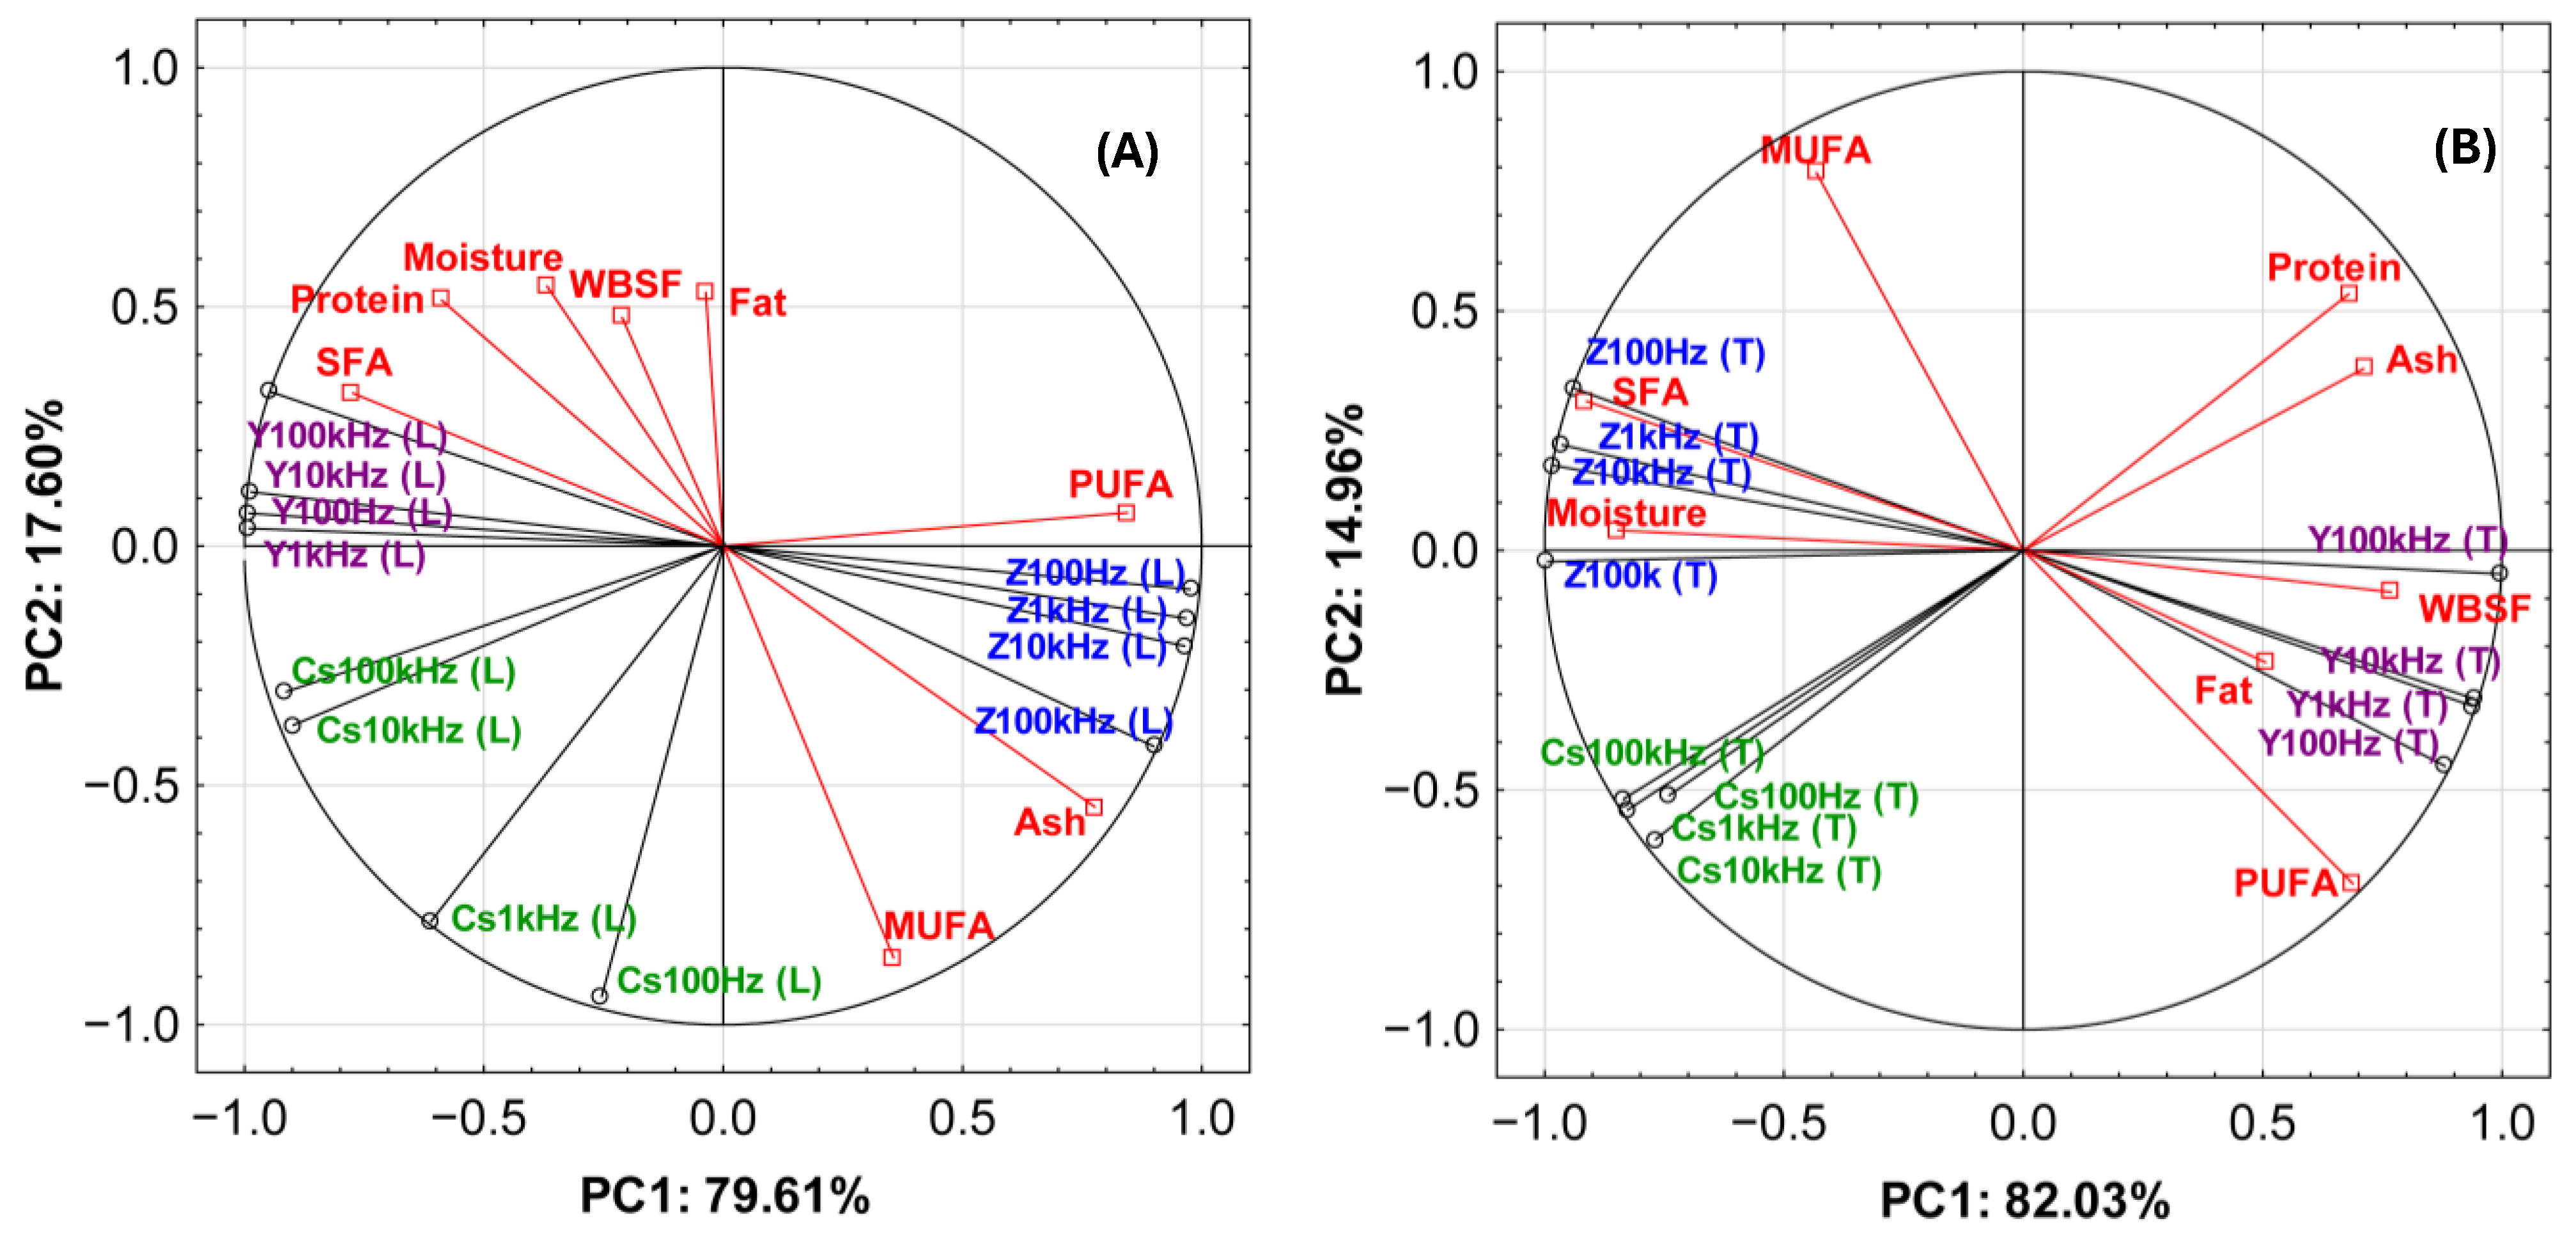
PCA showed that the first two principal components (Figure 5A,B) explained almost all of the variability in the dataset. In the L configuration (along the fibres), PC1 and PC2 accounted for 79.61% and 17.60% of the total variance, respectively (Figure 5A), whereas in the T configuration (across the fibres), the corresponding values were 82.03% and 14.96% (Figure 5B). Thus, in both configurations, the first two principal components together explained more than 97% of the total variance.
Figure 5.
PCA analysis of electrical parameters (Z, Y, Cp, Cs; f = 100 Hz–100 kHz) in relation to the chemical composition and fatty acid profile of beef after 14 days of ageing: (A) electrode configuration L (longitudinal, along fibres); (B) electrode configuration T (transverse, across fibres).
The main contribution to PC1 came from the conductive parameters (Z and Y), whereas PC2 reflected to a greater extent the contribution of the capacitive component (particularly Cs) and selected compositional traits. PCA was used to describe the co-variation of the parameters after 14 days of ageing and to identify the dominant relationships among the groups of variables analysed.
In both configurations, the Z and Y vectors were oriented in opposite directions along PC1, which is consistent with their physically inverse relationship. At the same time, the arrangement of variables depended on electrode configuration. In the T configuration, the associations between Z and Y and the composition were more distinct, particularly for moisture content, ΣSFA, and ΣPUFA.
This suggests that in the T configuration, conductive parameters more strongly reflect variation in the water–electrolyte phase. A similar general utility of bioelectrical measurements for describing physicochemical variation in beef, including traits related to fat content and meat quality, was reported by Afonso et al. [19]. It should be emphasised, however, that very high correlation coefficients (e.g., for ΣSFA) obtained with such a small sample size may be prone to overestimation. Therefore, the observed relationships should be interpreted with caution as preliminary findings require confirmation in replication studies. In the L configuration, variables related to ash and some lipid traits contributed more to the separation of variables, indicating a significant effect of conduction geometry along the fibres on the relationship between the electrical signal and meat properties.
The capacitive parameters, particularly Cs, provided information that was partly independent of the Z–Y axis and more often differentiated variables along PC2. This suggests that they may be useful for describing traits associated with cellular structures and interfacial phenomena [5]. At the same time, Cs require strict standardisation of measurement conditions, including contact, geometry, and sample temperature, which is consistent with recommendations presented in the review papers on impedance-based methods for meat evaluation [3,5].
The correlation analysis confirmed that the strength and direction of the relationships between electrical parameters and meat compositional traits and fatty acid profile depended on electrode configuration and frequency. Table 3 and Table 4 summarise the relevant correlation coefficients (r), 95% confidence intervals, and exact p-values, whereas only the most consistent and strongest relationships are discussed in the text. Given the number of tested relationships and the limited sample size, the correlation results should be interpreted with caution. Therefore, emphasis was placed not only on formal significance levels, but also on the consistency of the relationships across frequencies and configurations, as well as on the magnitude of the correlation coefficients and the width of the 95% confidence intervals.
Table 3.
Pearson correlation coefficients (r), 95% confidence intervals, and exact p-values between electrical parameters (Z, Y, Cs) and selected beef quality traits (WBSF, proximate composition, and fatty acid profile) after 14 days of ageing for electrode configuration T (transverse, across fibres).
Table 4.
Pearson correlation coefficients (r), 95% confidence intervals, and exact p-values between electrical parameters (Z, Y) and selected beef quality traits (proximate composition and fatty acid profile) after 14 days of ageing for electrode configuration L (longitudinal, along fibres).
With regard to technological traits, significant relationships with WBSF were observed only in the T configuration. The strongest relationship with WBSF was observed for impedance (Z) in the T configuration at 1 kHz after 14 days of ageing (r = −0.834; exact p = 0.0101). This relationship, therefore, refers to a single ageing time point and does not indicate that the same association was confirmed at the other ageing times analysed in the study. Moreover, this result is based on a limited sample (n = 8) and should therefore be interpreted with caution. For moisture content in the T configuration, a consistent pattern was observed: positive relationships with Z and negative relationships with Y, with |r| values reaching approximately 0.81–0.87 at several frequencies. In the L configuration, no analogous relationships with moisture were found, indicating that the T configuration was more informative for describing tissue hydration after 14 days of ageing (Table 3). This is in line with the view that the informative value of conductive bioelectrical parameters depends on measurement configuration and may reflect variation in physicochemical traits associated with the aqueous phase of muscle tissue [5,17].
For protein content, the strongest relationships involved Cs in the T configuration (r = −0.808 to −0.847; exact p = 0.0080–0.0152), whereas relationships with the conductive parameters were weaker and did not reach significance (Table 3 and Table 4). For ash, the pattern of relationships was different: in the T configuration, the association was mainly reflected by a significant relationship with Cs at 100 Hz (Table 3), whereas in the L configuration, consistently positive correlations were obtained for Z across the entire frequency range, particularly at f = 100 kHz (r = 0.949; exact p = 0.0003), together with negative relationships with Y that were significant over the 10–100 kHz range (Table 4).
Within the fatty acid profile, the strongest correlations were observed for ΣSFA. In the T electrode configuration, ΣSFA showed consistently strong relationships with Z and Y across the entire frequency range (|r| = 0.918–0.971; Table 3). In the L configuration, ΣSFA was also consistently associated with Z across the entire frequency range (r = −0.883 to −0.897), whereas the relationships with Y were weaker and less consistent (Table 4). For ΣPUFA, relationships were observed in both electrode configurations, although they were more frequency-dependent than those found for ΣSFA. In contrast, relationships for ΣMUFA were sparse and weaker (Table 3 and Table 4). These results support the view that impedance-derived descriptors may reflect differences in meat composition, although the strength and direction of the relationships depend on the selected electrical parameter, frequency range, and measurement geometry [7,19].
Taken together, the PCA results (Figure 5A,B) and the correlation analysis (Table 3 and Table 4) indicate that, after 14 days of ageing, the conductive parameters Z and Y were the most informative for describing variation in chemical composition and fatty acid groups. A similar general utility of bioelectrical parameters for describing physicochemical variation in beef was reported by Afonso et al. [19], although that study was based on a different BIA approach and a different muscle. The T configuration better reflected relationships with moisture and lipid fractions, whereas the L configuration was more informative for ash, particularly within the 10–100 kHz range. Cs correlated mainly with protein and, in the T configuration, partly also with ash. Overall, these findings show that the informative value of electrical measurements depended strongly on electrode configuration and frequency range, which has important implications for their practical application in beef quality assessment.
3.5. Practical Aspects of Electrical Measurements in Beef Quality Evaluation
The results of this study show that the usefulness of electrical measurements for beef quality assessment depends not only on the type of parameter analysed, but also on the conditions under which the signal is recorded. In particular, signal frequency and electrode configuration relative to muscle fibre orientation (L/T) affected both the values of the electrical parameters and the strength of their relationships with technological and compositional traits. This indicates that electrical measurements should not be interpreted as universal descriptors independent of measurement setup, but rather as condition-dependent indicators whose practical value relies on a consistent and rigorously controlled measurement procedure [3,5]. This interpretation is also consistent with earlier studies on beef, which show that electrical properties are strongly affected by technological conditions and may reflect postmortem changes in muscle tissue [22,23]. At the current stage, the observed relationships should not be treated as a standardised basis for direct practical application. Rather, they indicate which measurement conditions and electrical descriptors may be the most informative and therefore should be taken into account in further work aimed at developing a robust and standardised assessment protocol.
These findings refer specifically to m. semimembranosus and should not be directly generalised to other beef muscles of commercial importance, such as longissimus dorsi or psoas major, which differ in fibre structure, connective tissue content, metabolic profile, and ageing behaviour. Therefore, the transferability of the observed relationships to other muscles requires separate validation.
Among the analysed electrical parameters, the conductive parameters Z and Y showed the broadest and most consistent relationships with beef quality traits. They were most strongly associated with WBSF, moisture content, and fatty acid groups, especially in the T configuration. This suggests that conductive parameters may be the most useful for rapid screening of variability related to tissue hydration, structural changes during ageing, and selected composition-related traits. At the same time, the opposite directions of the Z and Y vectors and correlations indicate substantial co-variation between these parameters, suggesting that they partly reflect the same dimension of variability within the muscle tissue system [19]. The present results should be regarded as a proof of concept, showing that electrode configuration and frequency selection are of key importance for the informative value of the measurements. In its current form, the study does not allow predictive models to be formulated or their predictive ability to be assessed, and the observed relationships require validation in larger datasets.
The capacitive parameters, particularly Cs, provided more selective information. Although their relationships were less consistent across traits and frequencies, they appeared useful for describing variability in protein content and, to some extent, ash content. This suggests that capacitive information may complement conductive descriptors, especially when the aim is to capture traits more closely associated with interfacial phenomena and cellular structures. However, because capacitive parameters were more sensitive to electrode configuration, frequency range, and other measurement conditions, their practical use requires particularly strict standardisation of the measurement procedure [3,5].
From an applied perspective, the results suggest that electrical measurements may be considered as a potential rapid screening approach for beef quality evaluation during ageing. However, the practical usefulness of the method depends on strict control of measurement conditions, including electrode arrangement, frequency selection, sample temperature, and electrode–tissue contact. Without such control, the interpretation of the results and comparisons across studies may be limited [5,13,17]. This is in agreement with earlier findings indicating that the electrical behaviour of beef may change depending on post-slaughter technological conditions, which should be taken into account when developing practical measurement procedures [23].
The present findings also indicate that further work should focus on validating the analytical utility of the most informative parameters across a broader range of raw materials and processing conditions. Future studies should include assessments of repeatability, robustness to interfering factors, and verification with an independent sample set. Such work would help determine whether the relationships observed here can be translated into a stable and practically useful tool for beef quality assessment. A similar need for careful selection of measurement conditions and appropriate analytical treatment of impedance-derived data has also been highlighted in recent studies on meat quality evaluation [3,7].
4. Limitations of the Study
The present study has several limitations that should be considered when interpreting the results. The small sample size (n = 8; n = 4 per feeding group) should be regarded as the primary limitation of this study. Such a limited number of observations reduces the statistical power of the analyses and increases the uncertainty of correlation estimates, particularly for the relationships evaluated after 14 days of ageing.
Second, the study was conducted on a single muscle (m. semimembranosus), and therefore the observed relationships should not be directly extrapolated to other beef muscles differing in structure and ageing behaviour. Third, the experimental material originated from two feeding treatments, which increased the biological variability of the dataset and, given the limited sample size, reduced the statistical strength of factor-based comparisons and complicated the interpretation of relationships of a methodological nature. Therefore, the results should be regarded as exploratory rather than definitive.
Finally, because chemical composition and fatty acid profile were determined only after 14 days of ageing, it was not possible to assess how composition–electrical parameter relationships changed dynamically over the entire ageing period. Therefore, these results should be interpreted as complementary and exploratory rather than as evidence of time-dependent compositional modelling across all ageing stages. Further studies on a larger sample set, including more muscles and independent validation material, are needed to confirm the robustness and practical applicability of the proposed approach.
5. Conclusions
- Measurement frequency and electrode configuration relative to muscle fibre orientation significantly affected the values of the electrical parameters and their relationships with beef quality traits.
- The differences between the T and L electrode configurations confirmed the anisotropic nature of conduction in muscle tissue. The T configuration was more informative for moisture content and fatty acid groups, whereas the L configuration was more informative for ash content.
- Among the analysed electrical descriptors, the conductive parameters Z and Y showed the strongest relationships with selected beef quality traits, while the capacitive parameter Cs provided more selective information, particularly in relation to protein content.
- The results indicate that electrical measurements may provide useful information on selected technological and compositional characteristics of beef, but their value depends strongly on measurement conditions, especially frequency and electrode configuration.
- The observed relationships should be interpreted with caution and require confirmation in studies conducted on a larger and more diverse experimental material.
Supplementary Materials
The following supporting information can be downloaded at: https://www.mdpi.com/article/10.3390/app16094234/s1, Table S1: Shear force (mean ± SD) of m. semimembranosus from young bulls during storage in feeding groups (F1, F2); Table S2: Cooking loss (mean ± SD) of m. semimembranosus from young bulls during storage in feeding groups (F1, F2); Table S3: Electrical parameters—Z, Y, Cp, Cs (mean ± SD) for feeding 1 (F1), measured at f = 100 Hz–100 kHz in electrode configurations T and L; Table S4: Electrical parameters—Z, Y, Cp, Cs (mean ± SD) for feeding 2 (F2) measured at f = 100 Hz–100 kHz in electrode configurations T and L; Figure S1: PROFIT analysis of the relationships between electrical parameters (Z, Y, Cp, Cs) and technological traits (WBSF, cooking loss) during beef ageing (3, 7, 14, and 28 days; VAC; 4 ± 1 °C). (A): F1, electrode configuration T (transverse, across fibres); (B): F1, electrode configuration L (longitudinal, along fibres); (C): F2, electrode configuration T; (D): F2, electrode configuration L.
Author Contributions
Conceptualization, J.K.B., M.G.-R., R.P.-F., L.M., Z.N. and M.M.-K.; methodology, J.K.B., M.G.-R., R.P.-F. and M.M.-K.; software, J.K.B. and M.G.-R.; validation, J.K.B., M.G.-R. and M.M.-K.; formal analysis, J.K.B., M.G.-R., R.P.-F. and M.M.-K.; investigation, J.K.B., R.P.-F., Z.N. and M.M.-K.; resources, J.K.B., Z.N., R.P.-F. and M.M.-K.; data curation, J.K.B., R.P.-F. and M.M.-K.; writing—original draft preparation, J.K.B., M.G.-R., Z.N. and M.M.-K.; writing—review and editing, J.K.B., M.G.-R., R.P.-F., L.M. and M.M.-K.; visualization, J.K.B. and M.G.-R.; supervision, J.K.B., M.G.-R., R.P.-F., L.M. and M.M.-K.; project administration, J.K.B.; funding acquisition, J.K.B. and R.P.-F. All authors have read and agreed to the published version of the manuscript.
Funding
This work was supported by the University of Warmia and Mazury in Olsztyn (project No. 22.610.100-110). Part of this manuscript was prepared during the research internship of Joanna K. Banach at the Instituto de Agroquímica y Tecnología de Alimentos, Consejo Superior de Investigaciones Científicas (IATA-CSIC), Valencia, Spain, under the supervision of Dr. Leticia Mora.
Data Availability Statement
The original contributions presented in this study are included in the article and Supplementary Materials. Further inquiries can be directed to the corresponding author.
Conflicts of Interest
The authors declare no conflicts of interest.
References
- Damez, J.-L.; Clerjon, S. Meat quality assessment using biophysical methods related to meat structure. Meat Sci. 2008, 80, 132–149. [Google Scholar] [CrossRef] [Scilit]
- Wu, X.; Liang, X.; Wang, Y.; Wu, B.; Sun, J. Non-destructive techniques for the analysis and evaluation of meat quality and safety: A review. Foods 2022, 11, 3713. [Google Scholar] [CrossRef] [Scilit]
- Wang, S.; Zhang, Z.; Zhao, X.; Xiao, X. Electrical impedance spectroscopy for non-destructive meat freshness assessment. Discov. Food 2024, 4, 177. [Google Scholar] [CrossRef] [Scilit]
- Byrne, C.E.; Troy, D.J.; Buckley, D.J. Postmortem changes in muscle electrical properties of bovine M. longissimus dorsi and their relationship to meat quality attributes and pH fall. Meat Sci. 2000, 54, 23–34. [Google Scholar] [CrossRef] [Scilit] [PubMed]
- Zhao, X.; Zhuang, H.; Yoon, S.-C.; Dong, Y.; Wang, W.; Zhao, W. Electrical impedance spectroscopy for quality assessment of meat and fish: A review on basic principles, measurement methods, and recent advances. J. Food Qual. 2017, 1, 6370739. [Google Scholar] [CrossRef] [Scilit]
- León-Ecay, S.; Insausti, K.; López-Maestresalas, A.; Prieto, N. Non-destructive spectroscopy-based technologies for meat and meat product discrimination—A review. Meat Sci. 2025, 228, 109893. [Google Scholar] [CrossRef] [Scilit]
- Qiu, J.; Lin, Y.; Wu, J.; Xiao, Y.; Cai, H.; Ni, H. Rapid beef quality detection using spectra pre-processing methods in electrical impedance spectroscopy and machine learning. Int. J. Food Sci. Technol. 2024, 59, 1624–1634. [Google Scholar] [CrossRef] [Scilit]
- Koohmaraie, M.; Kent, M.P.; Shackelford, S.D.; Veiseth, E.; Wheeler, T.L. Meat tenderness and muscle growth: Is there any relationship? Meat Sci. 2002, 62, 345–352. [Google Scholar] [CrossRef] [Scilit] [PubMed]
- Huff-Lonergan, E.; Lonergan, S.M. Mechanisms of water-holding capacity of meat: The role of postmortem biochemical and structural changes. Meat Sci. 2005, 71, 194–204. [Google Scholar] [CrossRef] [Scilit]
- Kim, S.; Kim, G.; Moon, C.; Ko, K.; Choi, Y.; Choe, J.; Ryu, Y. Effects of aging methods and periods on quality characteristics of beef. Food Sci. Anim. Resour. 2022, 42, 953–967. [Google Scholar] [CrossRef] [Scilit]
- Khazzar, S.; Segato, S.; Riuzzi, G.; Serva, L.; Garbin, E.; Gerardi, G.; Tenti, S.; Mirisola, M.; Catellani, P. Influence of ageing time and method on beef quality and safety. Foods 2023, 12, 3250. [Google Scholar] [CrossRef] [Scilit]
- Yu, Q.; Gu, X.; Liu, Q.; Wen, R.; Sun, C. Effect of wet-aging on meat quality and exudate metabolome changes in different beef muscles. Food Res. Int. 2024, 184, 114260. [Google Scholar] [CrossRef] [Scilit]
- Damez, J.-L.; Clerjon, S.; Abouelkaram, S.; Lepetit, J. Electrical impedance probing of the muscle food anisotropy for meat ageing control. Food Control 2008, 19, 931–939. [Google Scholar] [CrossRef] [Scilit]
- Najar-Villarreal, F.; Boyle, E.A.E.; Vahl, C.I.; Kang, Q.; Houser, T.A.; Gonzalez, J.M.; Amamcharla, J.; Vega, D.; Kastner, J.J.; Cox, M.K. Correlation of bioelectrical impedance with freshness quality attributes of beef longissimus lumborum steaks. Meat Muscle Biol. 2021, 5, 1–11. [Google Scholar] [CrossRef] [Scilit]
- Lepetit, J.; Salé, P.; Favier, R.; Dalle, R. Electrical impedance and tenderisation in bovine meat. Meat Sci. 2002, 60, 51–62. [Google Scholar] [CrossRef] [Scilit] [PubMed]
- Šmerc, R.; Miklavčič, D.; Mahnič-Kalamiza, S. Skeletal muscle death from the perspective of electrical impedance as evidenced by experiment and numerical modelling. Comput. Biol. Med. 2025, 197, 111073. [Google Scholar] [CrossRef] [Scilit] [PubMed]
- Damez, J.-L.; Clerjon, S.; Abouelkaram, S.; Lepetit, J. Beef meat electrical impedance spectroscopy and anisotropy sensing for non-invasive early assessment of meat ageing. J. Food Eng. 2008, 85, 116–122. [Google Scholar] [CrossRef] [Scilit]
- Huh, S.; Kim, H.-J.; Lee, S.; Cho, J.; Jang, A.; Bae, J. Utilization of electrical impedance spectroscopy and image classification for non-invasive early assessment of meat freshness. Sensors 2021, 21, 1001. [Google Scholar] [CrossRef] [Scilit]
- Afonso, J.; Guedes, C.; Santos, V.; Morais, R.; Silva, J.; Teixeira, A.; Silva, S. Utilization of bioelectrical impedance to predict intramuscular fat and physicochemical traits of the beef Longissimus Thoracis et Lumborum Muscle. Foods 2020, 9, 836. [Google Scholar] [CrossRef] [Scilit]
- Ihara, S.; Islam, M.Z.; Kitamura, Y.; Kokawa, M.; Lee, Y.-C.; Chen, S. Nondestructive Evaluation of Wet Aged Beef by Novel Electrical Indexes: A Preliminary Study. Foods 2019, 8, 313. [Google Scholar] [CrossRef] [Scilit]
- Modzelewska-Kapituła, M.; Tkacz, K.; Nogalski, Z.; Karpińska-Tymoszczyk, M.; Draszanowska, A.; Pietrzak-Fiećko, R.; Purwin, C.; Lipiński, K. Addition of herbal extracts to the Holstein-Friesian bulls’ diet changes the quality of beef. Meat Sci. 2018, 145, 163–170. [Google Scholar] [CrossRef] [Scilit] [PubMed]
- Banach, J.K.; Żywica, R. Usability of beef conductivity properties for assessment and control of its ripeness. Pol. J. Food Nutr. Sci. 2007, 57, 25–28. [Google Scholar]
- Banach, J.K.; Żywica, R. The effect of electrical stimulation and freezing on electrical conductivity of beef trimmed at various times after slaughter. J. Food Eng. 2010, 100, 119–124. [Google Scholar] [CrossRef] [Scilit]
- PN-ISO1442; Meat and Meat Products. Determination of Water Content (Reference Method). Polish Committee for Standardization: Warsaw, Poland, 2000.
- AOAC. Proximate analysis and calculations crude protein meat and meat products including pet foods. In Official Methods of Analysis Method 992.15, 17th ed.; Association of Analytical Communities: Gaithersburg, MD, USA, 2006. [Google Scholar]
- AOAC. Fat (Crude) in meat and meat products. In Official Method of Analysis Method 991.36, 18th ed.; Association of Analytical Communities: Gaithersburg, MD, USA, 2006. [Google Scholar]
- PN-ISO 936; Meat and Meat Products—Determination of Total Ash. Polish Committee for Standardization: Warsaw, Poland, 2000.
- Folch, J.; Lees, M.; Stanley, G.H.S. A simple method for the isolation and purification of total lipides from animal tissues. J. Biol. Chem. 1957, 226, 497–509. [Google Scholar] [CrossRef] [Scilit]
- Peisker, K.V. A rapid semi-micro method for preparation of methyl esters from triglycerides using chloroform, methanol, sulphuric acid. J. Am. Oil Chem. Soc. 1964, 41, 87–88. [Google Scholar] [CrossRef] [Scilit]
- Montgomery, D.C. Design and Analysis of Experiments; John Wiley & Sons: Hoboken, NJ, USA, 2017. [Google Scholar]
- Quinn, G.P.; Keough, M.J. Experimental Design and Data Analysis for Biologists; Cambridge University Press: Cambridge, UK, 2002. [Google Scholar]
- Stanisz, A. Tom 3: Analizy wielowymiarowe. In Przystępny Kurs Statystyki z Zastosowaniem Statistica PL; StatSoft: Kraków, Poland, 2007. (In Polish) [Google Scholar]
- Zaborski, A.; Pełka, M. Geometrical presentation of preferences by using profit analysis and R program. Acta Univ. Lodz. Folia Oeconomica 2013, 285, 191–197. [Google Scholar]
- Moholisa, E.; Hugo, A.; Strydom, P.E.; van Heerden, I. The effects of animal age, feeding regime and a dietary beta-agonist on tenderness of three beef muscles. J. Sci. Food Agric. 2017, 97, 2375–2381. [Google Scholar] [CrossRef] [Scilit]
- Ellies-Oury, M.P.; Insausti, K.; Papillon, S.; Albechaalany, J.; Cantalapiedra-Hijar, G. Effect of residual feed intake on meat quality in fattening charolais bulls fed two contrasting diets. Meat Sci. 2024, 214, 109536. [Google Scholar] [CrossRef] [Scilit]
- Modzelewska-Kapituła, M.; Tkacz, K.; Zduńczyk, W.; Ozturk-Kerimoglu, B.; Nogalski, Z. Is prolonged ageing a necessity for improving the quality of sous-vide cooked beef? Appl. Sci. 2024, 14, 5180. [Google Scholar] [CrossRef] [Scilit]

Disclaimer/Publisher’s Note: The statements, opinions and data contained in all publications are solely those of the individual author(s) and contributor(s) and not of MDPI and/or the editor(s). MDPI and/or the editor(s) disclaim responsibility for any injury to people or property resulting from any ideas, methods, instructions or products referred to in the content. |
© 2026 by the authors. Licensee MDPI, Basel, Switzerland. This article is an open access article distributed under the terms and conditions of the Creative Commons Attribution (CC BY) license.