


Abstract
Addressing the low efficiency associated with single-frequency serial acquisition in urban exploration using traditional electrical resistivity tomography (ERT) instruments, this study introduces a Frequency Division Multiplexing Electrical Resistivity Tomography (FDM-ERT) method and hardware system. By utilizing transmission modules that simultaneously output AC excitation signals at distinct frequencies, coupled with receiver modules that enable multi-channel parallel acquisition and data transmission, the system achieves a “one-time layout, multi-frequency synchronous measurement” workflow. Laboratory tests under controlled conditions and preliminary field tests conducted at the Xiangjiang River beach demonstrate that this method maintains relatively high consistency with traditional single-frequency measurements. The relative error of apparent resistivity across frequency points remains below 2%, with an inversion root mean square error (RMSE) of 0.4%. Furthermore, the multi-frequency synchronous mode reduces total measurement time by approximately 66.7%. While these results were obtained in relatively controlled environments, they substantiate the core feasibility of the FDM-ERT system for multi-frequency synchronous measurement, providing a certain hardware foundation for subsequent validation and optimization in complex, real-world urban settings.
1. Introduction
The ERT is a crucial technique in geophysical exploration. Based on the differences in electrical conductivity of rock and soil media, allowing for the investigation of underground conduction current distribution patterns through the application of an artificial stable current field [1]. Renowned for its precision and efficiency, ERT is widely applied across a broad spectrum of fields. Its key applications span engineering and hydrogeology (e.g., urban and engineering geological surveys [2,3,4,5,6], hydrogeological investigations [7,8,9]), geo-hazard and environmental monitoring (e.g., hazard early warning, environmental assessment, and landfill monitoring [10,11,12,13,14,15,16,17]), and infrastructure assessment (e.g., piping detection, highway exploration, landslide investigation, and dam leakage detection [18,19,20,21,22,23,24]).
Breakthroughs in resistivity inversion imaging theory are prerequisites for achieving data visualization in ERT [25]. Early studies established the foundation for both 2D and 3D inversion [26,27], while subsequent research has continuously refined the theoretical framework of inversion. In recent years, advancements in algorithms and computational power have significantly propelled the development of this field. For instance, Jaysaval [28] et al. implemented efficient 3D finite volume inversion based on large-scale parallel computing; Blanchy [29] et al. introduced the open-source framework ResIPy, enhancing the transparency and standardization of inversion algorithms. Furthermore, the latest imaging algorithms have optimized robustness for complex terrain conditions [30]. In terms of software engineering, the Res2DInv/Res3DInv series, continuously updated by Seequent (Christchurch, New Zealand) and Aarhus Geosoftware (Aarhus, Denmark), remains the internationally recognized industrial standard. In this study, ZondRes2D (version 6.1) was used for the data processing and inversion. Significant contributions have also been made by domestic scholars. Wan [31] proposed the Supervised Descent Method (SDM), significantly improving the intelligence and resolution of inversion. Ren [32] et al. utilized unstructured grids to address the challenges of high-precision forward modeling with topography. Meanwhile, Xu [33] et al. achieved a precise simulation of anisotropic media by enhancing the Green’s function.
In the field of instrument hardware development, both domestic and international markets have seen the emergence of mature commercial equipment. Notable international products include the Terrameter LS, a distributed ERT instrument manufactured by ABEM (Guideline Geo, Stockholm, Sweden); the SuperString R8/IP Wi-Fi®, a dual-mode eight-channel instrument produced by Advanced Geosciences, Inc. (Austin, TX, USA); and the RESECS II 3D electrical instrument from DMT GmbH & Co. KG (Essen, Germany), which features comprehensive process control based on the Windows operating system. Domestically, significant examples encompass the DUK-3/4 series developed by Chongqing Geological Instrument Co., Ltd. (CGE, Chongqing, China); the E60DN3D three-dimensional distributed system created by Beijing Geopen Instrument Co., Ltd. (Beijing, China); and the WGMD-10X/V multi-channel measurement system from the Chongqing Benteng CNC Technical Institute (Chongqing, China). In recent years, significant advancements have been achieved in hardware redundancy elimination, resolution enhancement, and embedded system integration. For instance, Xia, X. et al. significantly reduced system costs by designing a hierarchical electrode switching device (HESD) [34]. Urruela, A. et al. improved the investigation resolution by 80% under limited-electrode conditions using an enhanced roll-along data integration method [35]. Regarding system integration and real-time performance, Park, K. proposed an FPGA-based adaptive optimal measurement algorithm, which substantially increased the data acquisition frame rate [36]. Meanwhile, research on embedded data acquisition systems has become increasingly sophisticated; Wiranata, L.F. utilized a microcontroller to coordinate multiplexers and relays, effectively mitigating the impact of internal resistance on excitation currents, and achieved high-quality embedded image reconstruction through 12-bit high-resolution sampling and the Jacobian Gauss-Newton method [37].
While ERT technology has achieved a high degree of maturity, traditional instruments still encounter challenges such as limited operational efficiency and susceptibility to interference in complex urban environments characterized by numerous noise sources [38]. Incorporating Frequency Division Multiplexing (FDM) theory aims to address the inefficiencies associated with conventional serial acquisition; however, achieving reliable “synchronous multi-frequency acquisition” at the hardware level requires overcoming two primary technical hurdles. The first is the challenge of synchronization, where multi-channel acquisition demands precise temporal alignment, as even minute timing discrepancies may introduce phase errors that could subsequently interfere with signal separation. The second involves the complexity of multi-frequency separation, as the receiving unit must accurately extract weak potential differences for each independent frequency from superimposed complex signals while minimizing potential distortion.
In response to the aforementioned technical requirements, our paper proposes an ERT instrument hardware system based on FDM. Unlike conventional ERT instruments, which typically employ a single-frequency serial acquisition mode, the core design of this study is primarily reflected in three aspects: First, to ensure the temporal consistency of multi-channel data, the system utilizes a CPLD within a single receiver to simultaneously trigger six ADCs for parallel sampling, allowing signals at different frequencies to share the same time origin. When multiple receivers operate collaboratively, the sampling clock is synchronized via the GPS 1 PPS pulse signal, thereby providing a fundamental time reference for subsequent frequency-domain analysis. Second, after completing synchronous acquisition at the hardware level and performing preliminary denoising using low-pass filters, the system employs a self-developed Android application to clearly separate individual frequency components in the frequency domain through the Fast Fourier Transform (FFT) algorithm. This facilitates a smooth implementation of the “one-time layout, multi-frequency synchronous measurement“ testing process. Third, during field operations, once the measuring electrodes are deployed, the operator can adjust the working configuration simply by changing the position and spacing of the current electrodes as needed. This design helps reduce the workload of on-site wiring to some extent and enhances the flexibility of practical operations.
To verify the fundamental performance of the system, preliminary tests were conducted under controlled laboratory conditions and in a relatively low-noise environment—specifically, the mudflat of the Xiangjiang River. These tests primarily focused on assessing the accuracy and efficiency of multi-frequency synchronous measurement. The results indicate that the system exhibits good data consistency and efficiency advantages in such mild environments, and the results have preliminarily confirmed the feasibility of the proposed design. Future research will systematically validate the system in real-world high-noise urban environments, such as along subway lines and within industrial plants, based on the existing hardware platform. Furthermore, upon obtaining additional comparative data, an in-depth comparison with existing FDM-related studies and patents will be conducted to comprehensively evaluate the innovative contributions and applicable scope of this system.
The remainder of this paper is organized as follows: Section 2 details the measurement principle of the proposed FDM-ERT method; Section 3 describes the overall hardware architecture of the instrument, including the design of the multi-frequency transmitter system, the high-precision synchronous receiver system, and its core control circuit; Section 4 presents the performance test results of the hardware system in both laboratory and field environments; Section 5 provides an in-depth discussion of the physical significance of the performance test data, the limitations of the hardware, the impact of errors on inversion, etc.; Section 6 summarizes the main conclusions of this study and outlines prospects for future work.
2. Materials and System Design (Data and Hardware)
2.1. Principles of FDM-ERT
The Induced Polarization (IP) Intermediate Gradient Method involves the injection of current through electrodes A and B, which are positioned at a fixed distance apart. In the central region where the electric field remains uniform, potential electrodes M and N are utilized to capture both primary and secondary fields. From these measurements, polarizability and resistivity can be calculated, which are essential for reconnaissance surveys [39]. Compared to the three-electrode array, which requires frequent relocation of supply electrodes, the intermediate gradient method presents several advantages. These include a stable field source, consistent anomaly patterns, high lateral resolution, and reduced susceptibility to topographic effects or the influence of the ‘infinite’ electrode. As a result, this method demonstrates enhanced reliability in urban exploration environments that are often characterized by significant interference.
As illustrated in Figure 1, the conventional intermediate gradient method utilizes single-frequency current injection, which is associated with relatively low efficiency. Moreover, during the measurement process, the positions of the measurement electrodes need to be moved manually (i.e., manual electrode moving), which is relatively time-consuming. In contrast, as demonstrated in Figure 2, the frequency-division electrical system we have designed achieves an intelligent substitution for manual electrode moving through its hardware design: each receiver is deployed with a total of 25 electrodes (where E1–E2, E2–E3,…, E24–E25 can each be regarded as a mapping of the M-N electrode pair in a conventional gradient array). This means that 24 potential difference data points can be obtained from a single acquisition using the 25 electrodes, thereby shortening the electrode-moving time and improving exploration efficiency.
Figure 1.
Schematic diagram of the intermediate gradient array.
Figure 2.
Schematic Illustration of FDM-ERT Operating Principle.
In the practical operation of the FDM-ERT instrument (version 1.0, developed in-house by our laboratory in Changsha, China), a transmitter capable of simultaneously generating three mutually non-interfering and independent current signals at different frequencies is employed. These signals are injected synchronously into the subsurface through three pairs of current electrodes placed at varying spacings, thereby establishing an artificial electrical field. Within the target area situated between the current electrodes, n FDM-ERT acquisition units (each equipped with a 24-channel distributed acquisition system) are utilized to measure the composite electrical field signal between adjacent potential electrodes. This composite signal is subsequently demodulated and separated to extract the potential difference data corresponding to each frequency. Finally, the apparent resistivity is calculated according to the conventional formula used in direct current resistivity methods:
denotes the potential difference in each separated frequency component, measured in Volts (V). represents the current intensity at the corresponding frequency, measured in Amperes (A). The apparent resistivity value for each separated frequency is denoted as , expressed in Ohm-meters (). K refers to the geometric factor, also known as the array coefficient. The general calculation formula for the geometric factor K is as follows:
In this equation:
In this equation, the variables () denote the 3D geodetic coordinates of the current electrode , while () represent the 3D geodetic coordinates of the current electrode . Additionally, () indicate the 3D geodetic coordinates of the potential electrode M, and () represent the 3D geodetic coordinates of the potential electrode N.
After obtaining the apparent resistivity data of the target area, inversion processing is performed to reconstruct the true resistivity distribution characteristics. Subsequently, geological interpretation is conducted based on these true resistivity results to complete the exploration workflow.
The conventional intermediate gradient method typically utilizes a single-frequency power supply, which generally limits the acquisition of apparent resistivity data to a single set per measurement cycle. In contrast, the proposed FDM-ERT system injects mutually independent AC excitation signals of varying frequencies into the ground simultaneously through three pairs of current electrodes. This multi-frequency power supply approach allows the receiver to concurrently collect potential difference data containing multiple frequency components. Consequently, it facilitates the simultaneous acquisition of apparent resistivity and polarization data across various frequencies, thereby effectively enhancing field exploration efficiency.
In theory, the physical foundation that enables the FDM-ERT system to achieve “one-time layout, multi-frequency synchronous measurement” relies on the concept of spectral orthogonality. When AC excitation currents of different frequencies (e.g., 1 Hz, 2 Hz, 4 Hz) are simultaneously injected into the earth, they linearly superimpose in the time domain to form a complex mixed potential field. According to Fourier analysis theory, ideal sinusoidal signals of different frequencies are orthogonal to each other in the frequency domain. This means that, provided the signals are recorded without significant distortion, the individual frequency components within the mixed signal generally do not interfere with one another and can be independently decoupled and extracted via the FFT algorithm.
In practical geophysical explorations, maintaining this prerequisite of theoretical orthogonality places relatively high demands on the system’s hardware architecture. To mitigate phase errors that could disrupt frequency-domain separation, the proposed system is specifically designed to ensure temporal alignment: within a single receiver, a CPLD utilizes hardware logic to synchronously trigger parallel sampling across the ADCs; in multi-device coordinated scenarios, a GPS 1 PPS signal combined with FPGA phase-locked loop (PLL) technology is employed to assist in aligning the timing across different physical nodes. For the signal separation phase, the superimposed mixed signal is digitized at a fixed sampling rate of 250 Hz, and a hardware low-pass filter is utilized to attenuate high-frequency interference (above 20 Hz) to prevent aliasing distortion. Subsequently, the self-developed Android application executes the FFT to extract the respective frequency components.
2.2. Overall Research Methodology Model
To systematically present the work of this study, the overall data acquisition and system validation process can be framed using the modified CRISP-DM (Cross-Industry Standard Process for Data Mining) model adapted for non-destructive testing (NDT) [40]. This iterative methodology provides a relatively rigorous structural framework for our research. In the initial understanding phase, we comprehensively analyzed the limitations of traditional ERT instruments in noisy urban environments. This theoretical foundation directly guided the subsequent hardware implementation and measurement system setup, leading to the design of the Frequency Division Multiplexed High-Density Electrical Resistivity Tomography (FDM-ERT) instrument hardware. Subsequently, in the data understanding and data preparation phases, we processed signals acquired from both laboratory and field experiments. By combining hardware filtering with software-based Fast Fourier Transform (FFT), we achieved relatively accurate decoupling of frequency components and removal of noise. Once the data were ready, the modeling phase converted the extracted potential differences into apparent resistivity, and a 2D inversion algorithm (e.g., ZondRes2D) was applied to reconstruct the spatial distribution model of subsurface resistivity. Finally, in the evaluation phase, this study objectively verified the accuracy and robustness of the system by introducing repeatability statistical analysis and the bootstrap method. This lays a foundation for the future practical deployment of the system in complex urban geological surveys.
2.3. Transmitter Hardware Architecture
2.3.1. Integrated Hardware Architecture of the Transmitter System
To satisfy the requirements of the FDM-ERT method for multi-channel synchronous transmission, the transmitter adopts a modular and integrated design. Figure 3 illustrates the integrated hardware architecture and internal control logic of the entire transmitter system. The system primarily consists of a power supply link, a core control unit (featuring STM32 and FPGA synergy), and three independent transmission circuits.
Figure 3.
Integrated hardware architecture and internal control logic of the FDM-ERT transmitter system.
Power Supply Circuit: The system’s primary energy is supplied by a single-phase generator. The AC output is rectified and regulated through three independent sets of Switch Mode Power Supply (SMPS) modules, providing a stable and secure power source for the subsequent three independent transmission channels.
Transmitter Core Control Unit: Serving as the “control brain” of the transmitter, this module is primarily composed of an STM32 microcontroller, a GPS module, and FPGA logic circuitry.
- (1)
- The transmitter is controlled by the host software (version 1.0), with which the STM32 core controller interacts via RS232 or Wi-Fi. The selection of the STM32 as the primary control chip is based on its robust processing performance and extensive peripheral interface resources, enabling it to simultaneously manage the operation of communication protocol stacks and the precise execution of real-time control tasks. The primary responsibilities of the STM32 are as follows:
- Waveform and Parameter Control: It receives and parses waveform control parameters (such as square wave selection and transmission frequencies for each channel) and transmits them to the FPGA via the SPI interface.
- High-Precision GPS Synchronization: It parses the serial data from the GPS module to obtain the lock status and timing information, which is then transmitted back to the host software in real-time. One second prior to the scheduled synchronization time, the STM32 outputs a synchronization signal to trigger the FPGA to generate precise waveform control signals.
- Status Monitoring and Interaction: It retrieves status data from the FPGA through the SPI interface and drives LED indicators via GPIO to provide a real-time display of the system status.
- (2)
- To achieve synchronization of the three-channel drive signals and ensure a rapid response to high-voltage faults, the system employs an FPGA as the core controller. Its parallel data stream processing mechanism enables the simultaneous generation of multi-channel signals and status monitoring within the same clock cycle. Combined with programmable timing logic, this ensures the output stability and operational safety of the transmitter. Its core functions can be summarized into the following four parts:
- Communication and Command Parsing: The main control state machine interacts with the STM32 via the SPI interface to parse the frequency and waveform parameters for each transmission source while returning system status in real-time.
- Precision Drive Generation: The main control state machine drives the square wave generator to output the target waveforms. These waveforms are processed by a dead-time module to provide drive pulses with safety protection intervals for the IGBTs.
- Multidimensional Monitoring and Protection: The status detection and protection module monitors overvoltage, overcurrent, and over-temperature signals in real-time, triggering protection mechanisms to ensure the safety of the power circuitry.
- Clock and Synchronization Management: It contains a synchronization control module and a DCM clock management module. The synchronization control module calibrates the time base of the drive waveforms based on the 1PPS signal to meet the requirements for transceiver synchronization. The DCM module handles clock synthesis and domain synchronization, enhancing system operational stability through frequency synthesis technology.
- (3)
- Three-Channel Transmission Circuits: The synchronous drive signals generated by the FPGA are fed into three parallel transmission channels. Each channel comprises a gate drive circuit, an H-bridge inverter circuit, and a snubber circuit. The H-bridge inverter utilizes robust IGBT modules to modulate high-voltage DC into AC square-wave signals at the target frequencies. The snubber circuit is designed to suppress voltage spikes generated when disconnecting inductive loads to a certain extent. Finally, the AC excitation signals of various frequencies are synchronously injected into the subsurface through the corresponding power electrode pairs (A1–B1, A2–B2, A3–B3).
2.3.2. H-Bridge Inverter Circuit and Absorption Circuit
Figure 4 illustrates the schematic diagram of the H-bridge inverter circuit and the absorption circuit. Mature IGBT modules are chosen as the switching devices due to their advantages, including fast switching speeds and low saturation voltage drops. Additionally, an RCD absorption circuit is implemented to mitigate voltage spikes generated during the turn-off of the inductive load, thereby ensuring the power transmission circuit operates safely and reliably.
Figure 4.
Schematic diagram of the H-bridge inverter circuit and absorption circuit.
2.3.3. Protection and Detection Circuit
The schematic block diagram of the protection and detection circuit is illustrated in Figure 5. This circuit comprises current sensors, voltage sensors, temperature sensors, protection voltage setting circuits, protection detection comparator circuits, and magnetic coupling isolation circuits. The system front-end utilizes Hall-effect voltage and current sensors, leveraging their galvanic isolation characteristics to ensure the safety of both the high-voltage loops and the low-voltage digital circuits. Considering that noise during the exploration process can easily trigger false alarms in the protection circuitry, the comparator circuit adopts a hysteresis comparator design. By setting dual thresholds to form a hysteresis band, it effectively suppresses the frequent switching of protection states that occurs in single-limit comparators due to threshold fluctuations. The detection signals, once processed by the comparators, are interfaced to the FPGA via magnetic-coupling isolation devices. This two-stage isolation design further strengthens the electrical safety and reliability of the overall system.
Figure 5.
Schematic block diagram of the protection and detection circuit.
2.3.4. Transmitter Specifications
The main specifications of the FDM-ERT transmitter are shown in Table 1.
Table 1.
Main Technical Specifications of the FDM-ERT Instrument Transmitter.
2.4. Receiver Hardware Architecture
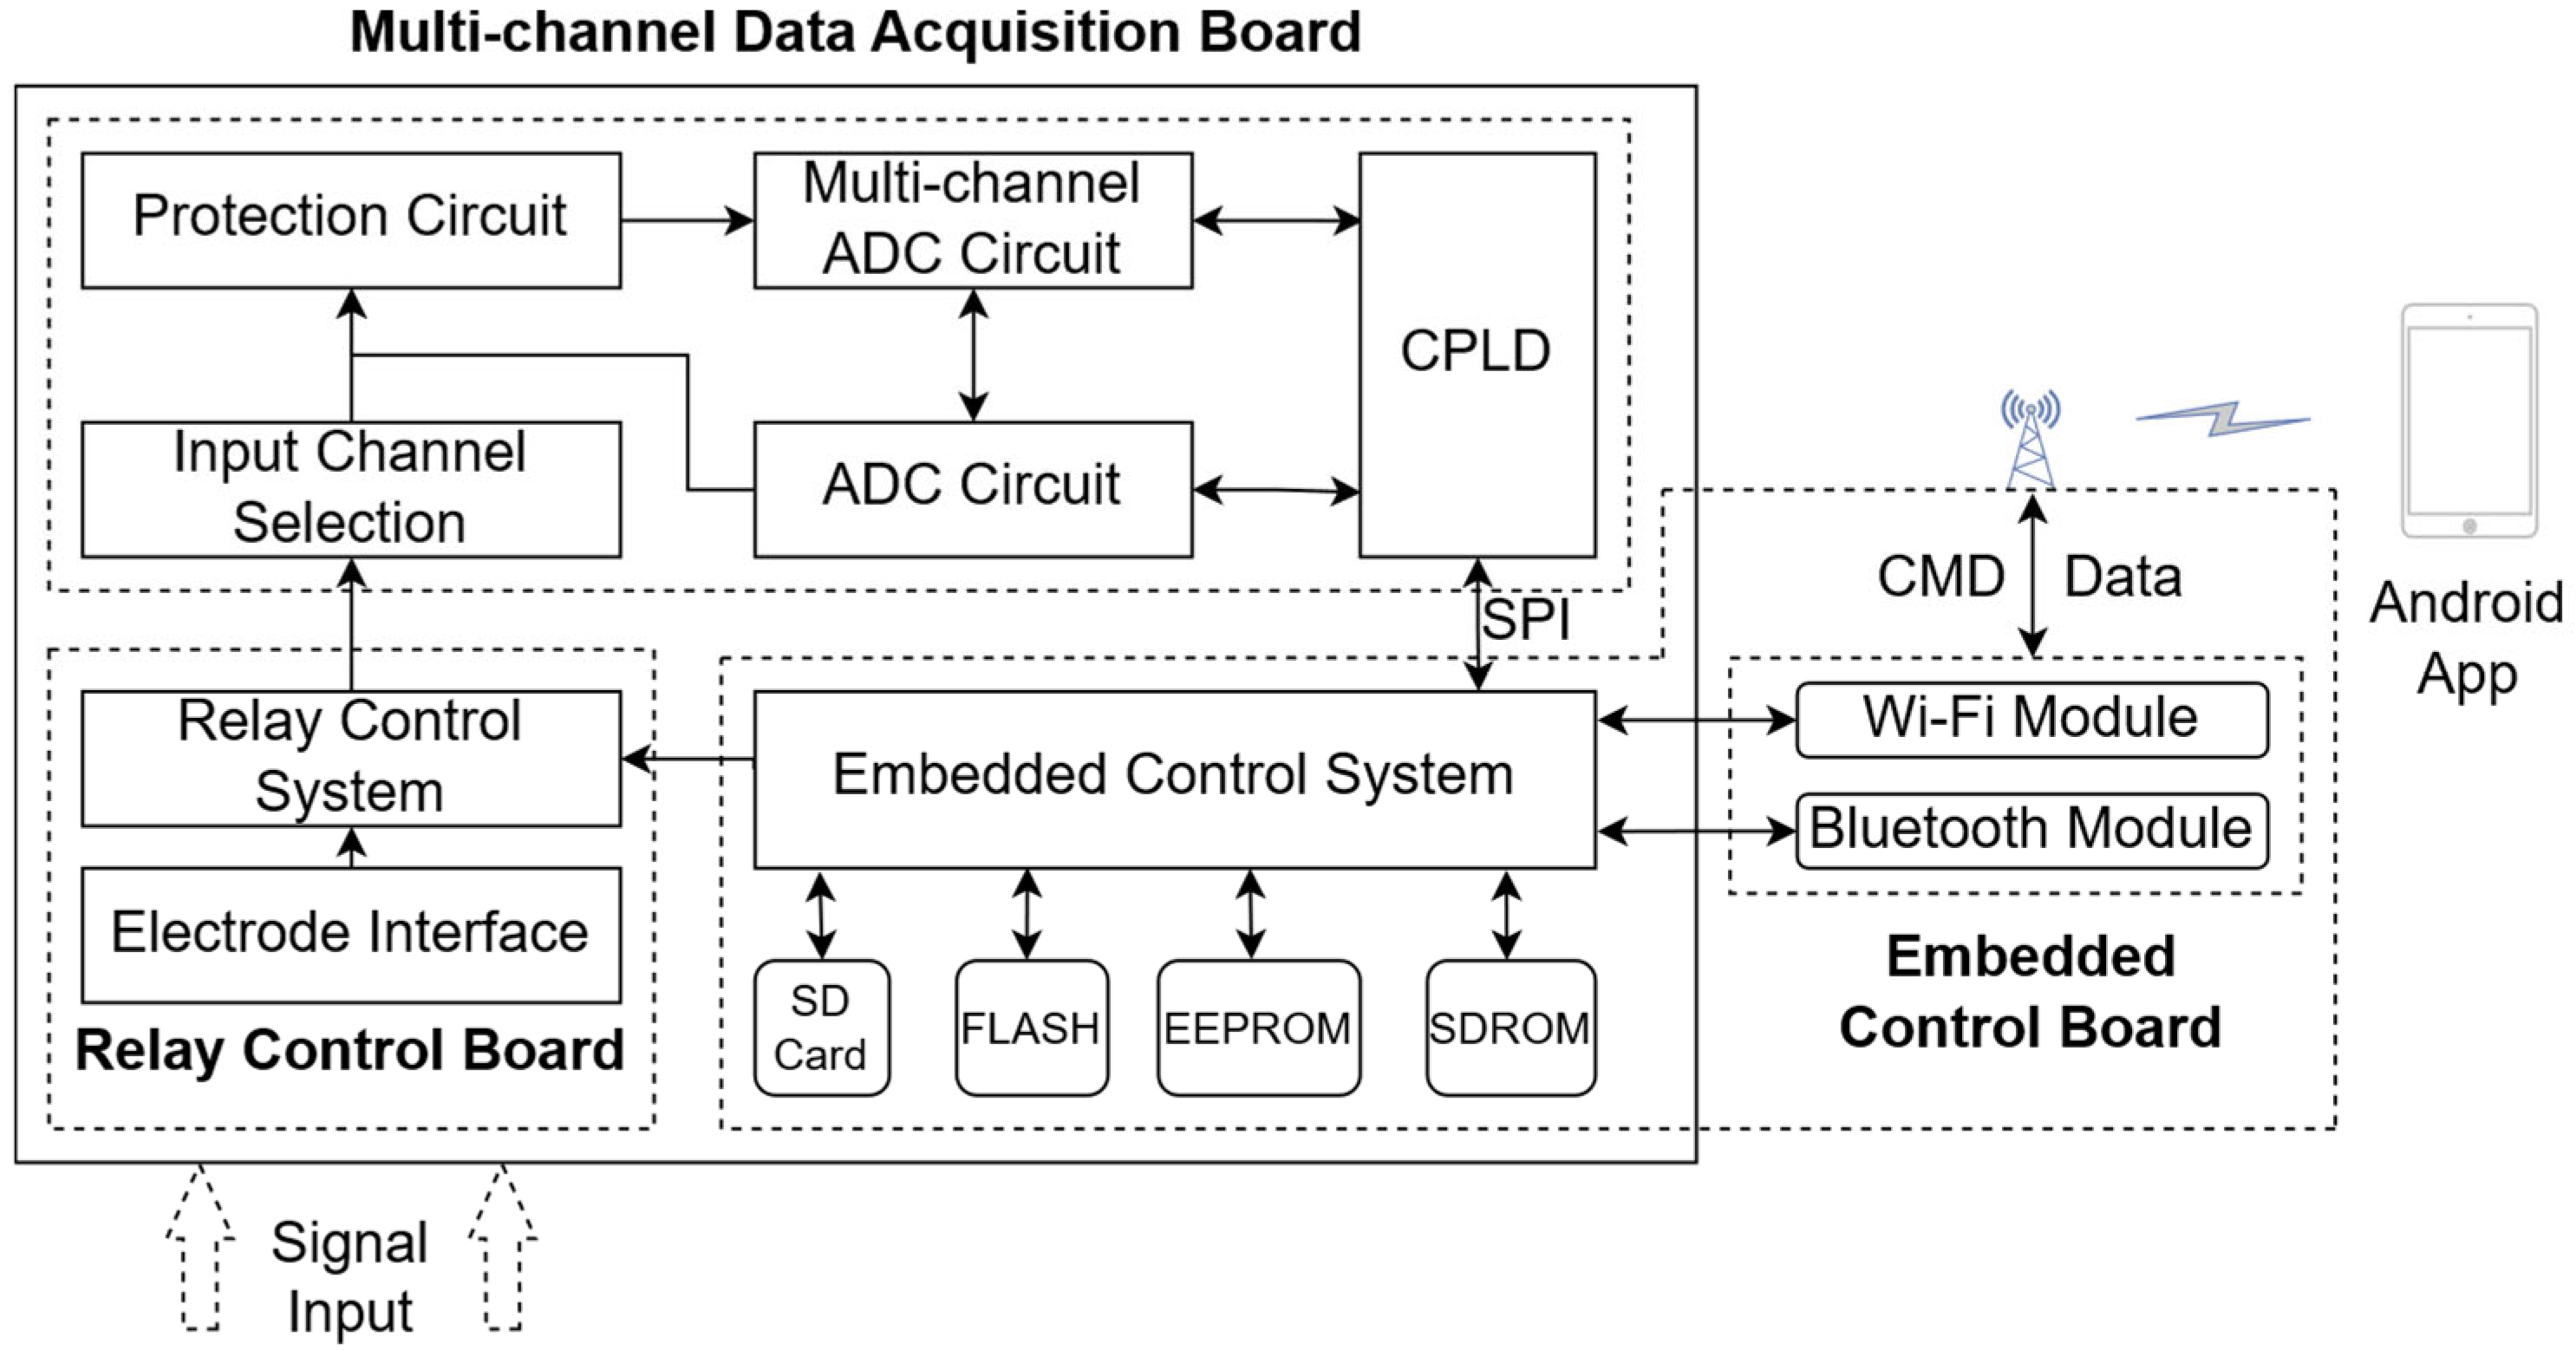
The overall design block diagram of the FDM-ERT Instrument Receiver is presented in Figure 6. The system primarily comprises three modules: the Relay Control Board, the Multi-channel Data Acquisition Board, and the Embedded Control Board. The functions and logical relationships of each module are outlined as follows:
- (1)
- Relay Control Board (Channel Switching): A single receiver is capable of connecting 25 measurement electrodes, thereby forming 24 channels for measurement. Prior to data acquisition, the embedded system manages the relay array to select 6 channels from the 24 available analog signals, which serve as input signals for the subsequent parallel acquisition unit.
- (2)
- Multi-channel Data Acquisition Board (Signal Processing): To meet the requirements for real-time performance and flexibility in multi-channel synchronous acquisition and preprocessing, this module adopts the Lattice MachXO2 series CPLD as its core. Leveraging its flexible programmable I/Os, low-latency parallel processing capabilities, and integrated on-chip memory and PLL resources, the CPLD executes preprocessing tasks such as parallel sampling and buffering of multi-channel data. Simultaneously, it facilitates data interaction with the embedded control board via the SPI bus protocol.
- (3)
- Embedded Control Board (Main Control Hub): Serving as the communication core that connects the lower-layer acquisition hardware with the Android mobile terminal, its primary functions include:
- Receiving and parsing configuration parameters and acquisition instructions from the Android terminal involves issuing control signals to the data acquisition module. This process ensures that the data acquisition module operates efficiently and accurately, facilitating the collection of necessary data for analysis.
- Data management involves receiving monitoring data uploaded by the acquisition module. This process includes sequentially performing frame header verification, data buffering, local SD card storage, and protocol encapsulation. Ultimately, the data is transmitted back to the Android terminal in real time.
Figure 6.
Overall Design Block Diagram of the FDM-ERT Receiver.
Given that the hardware system of the current station is a simplified version based on the receiver architecture, this paper will focus primarily on a detailed discussion of the receiver’s hardware architecture in the following sections.
2.4.1. Data Acquisition System Design
The design of the data acquisition channel is illustrated in Figure 7. The channel consists of a Lightning Surge Protection (LSP) circuit, an Overvoltage Protection (OVP) circuit, an anti-aliasing filter, a Programmable Gain Amplifier (PGA), an ADC circuit, a calibration circuit, and a CPLD control module. To address high-interference environments such as urban engineering exploration, this design employs multiple optimization strategies to enhance interference immunity and operational reliability.
Figure 7.
Overall Design Block Diagram of the Data Acquisition System.
- (1)
- Protection Circuit: Considering the energy levels of transient overvoltages and the requirements for response speed, a Gas Discharge Tube (GDT) is selected to handle the primary discharge of high-current surges. Complementing this, a Transient Voltage Suppressor (TVS) diode is responsible for the rapid suppression of residual voltage and electrostatic pulses. Together, they construct a multi-stage protection scheme capable of quickly discharging transient overvoltages caused by lightning or static electricity, thereby effectively suppressing surge impacts.
- (2)
- Anti-aliasing Filter: Based on the Nyquist sampling theorem, high-frequency components exceeding the folding frequency must be filtered out prior to analog-to-digital conversion to prevent aliasing distortion and ensure signal integrity. The anti-aliasing filter is selected for its sharp transition band and sufficient stopband attenuation, which strictly limit the input signal bandwidth to satisfy sampling requirements, thereby avoiding signal distortion caused by spectral overlapping.
- (3)
- ADC Circuit: FDM-ERT signals require high resolution to distinguish the minute potential differences across various frequency points. The ADS1282 not only provides 32-bit no-missing-code resolution, but its integrated low-noise Programmable Gain Amplifier (PGA) and sharp digital filters can effectively filter out out-of-band noise. This is crucial for ensuring the data purity of each frequency point during multi-frequency parallel acquisition.
- (4)
- DAC Circuit: Performs dual functions: (1) Self-test: Generates high-precision signals to calibrate the performance of the acquisition circuit. (2) Automated Contact Detection: Replaces manual measurement to enable rapid compliance verification of the contact resistance for each channel.
- (5)
- CPLD Circuit: The CPLD circuit functions as the core logic unit of the acquisition board, receiving instructions from the embedded control board and synchronously driving six ADCs to perform parallel sampling.
2.4.2. Embedded Control Board Design
The design block diagram of the embedded control board is illustrated in Figure 8. Based on the STM32 microcontroller, the board integrates memory and storage units, along with wireless communication modules, to facilitate efficient control and multi-mode communication.
Figure 8.
Overall Design Block Diagram of the Embedded Control Board.
- (1)
- STM32 Core Controller: A high-performance, low-power STM32F429 microcontroller, manufactured by STMicroelectronics (Geneva, Switzerland), is selected as the control core of the embedded board. This series offers a balance of computational performance, extensive peripheral interface resources, and flexible power management modes. It efficiently coordinates multi-module tasks and satisfies real-time control requirements, taking primary responsibility for task scheduling, logic control, and data processing across the entire system.
- (2)
- Storage Unit: Utilizes an SD card as the non-volatile storage medium. Its characteristics of compact size, high capacity, and data retention meet the requirements for high-volume cyclic reading and writing of field acquisition data.
- (3)
- Memory Unit: Consists of FLASH, EEPROM, and SDRAM, which work synergistically to ensure the stable operation of the program and real-time data buffering.
- (4)
- Wireless Wi-Fi Communication Module: Considering that Wi-Fi offers high physical layer throughput and relatively extensive coverage, it is selected to address the high-speed transmission requirements for large volumes of data between the embedded system and the host software.
- (5)
- Wireless Bluetooth Communication Module: Leveraging the technical advantages of Bluetooth Low Energy (BLE) and rapid connection, this module establishes connectivity with mobile terminals to primarily facilitate the real-time interaction of control commands.
- (6)
- NB-IoT Module: It provides access to the Huawei Cloud IoT Platform through the NB-IoT network, enabling users to issue remote commands and retrieve data via 5G/4G networks on an Android client.
2.4.3. Receiver Specifications
The main specifications of the FDM-ERT receiver are shown in Table 2.
Table 2.
Main Technical Specifications of the FDM-ERT Instrument Receiver.
2.5. Materials for Validation
All laboratory measurements were conducted under controlled conditions (ambient temperature: 25 ± 2 °C). The equipment, components, and parameter settings utilized in the laboratory are as follows:
- (1)
- Signal Generator: A Rigol DG1022U dual-channel arbitrary function generator (maximum output frequency: 25 MHz; sampling rate: 100 MSa/s) was employed to generate sinusoidal excitation signals for receiver testing.
- (2)
- Oscilloscope: A Tektronix TBS1202C digital storage oscilloscope was used (bandwidth: 200 MHz; 2 analog channels; sampling rate: 1 GS/s; rise time: 1.75 ns; vertical resolution: 8-bit).
- (3)
- Resistors and Capacitors: In the resistive voltage divider tests, six 1 kΩ metal film resistors (UNI-ROYAL, ±1% precision) were connected in series. For the RC model tests, six parallel RC units were constructed using 1 kΩ metal film resistors (same model as above) and 10 μF capacitors (Dersonic, ±10% tolerance).
- (4)
- Data Acquisition: All voltage measurements were performed using the FDM-ERT receiver prototype. The cutoff frequency of the hardware anti-aliasing filter was set to 20 Hz. The sampling rate was fixed at 250 Hz, and the internal Programmable Gain Amplifier (PGA) of the 32-bit ADS1282 ADC was uniformly configured with a gain of 1. Acquired data were transmitted via Wi-Fi to an Android device and simultaneously stored on an SD card.
- (5)
- Current Measurement: In the transmitter tests, the output current was sensed by a GSTI-HS0010 Hall-effect current sensor (sensitivity: 62.5 mV/A). The sensor output was recorded by an independent current acquisition station and transmitted wirelessly to the Android terminal.
3. Methodology
3.1. Laboratory Calibration Protocol
3.1.1. Transmitter Test Scheme
The primary function of the transmitter is to convert the DC power output from the rectified power supply into multi-frequency AC power. During the test, a regulated power supply was used, with input parameters set to 10 V and 0.792 A. By transmitting AC currents at three distinct frequencies (1 Hz, 2 Hz, and 4 Hz) through the transmitter, the signals are converted into voltage signals using a current transducer (Model: GSTI-HS0010; conversion coefficient: 62.5 mV/A) and subsequently acquired by a current acquisition station. Based on the conversion coefficient of the current transducer, the theoretical peak-to-peak voltage (Vpp) was calculated to be 0.0990 V. The raw data from five repeatability tests are then analyzed against theoretical values to verify the transmitter’s repeatability, accuracy, and channel consistency. Figure 9 illustrates the physical photograph of the current acquisition module.
Figure 9.
Physical photograph of the current acquisition module.
3.1.2. Receiver Test Scheme
Photographs of the acquisition board hardware and the assembled frequency-division electrical resistivity instrument are shown in Figure 10.
Figure 10.
Photograph of the Acquisition Board Hardware and the FDM-ERT Instrument: (a) Photograph of the Acquisition Board Hardware. (b) Photograph of the FDM-ERT Instrument.
Two test schemes, a resistance-only model and an RC model, were designed for testing the receiver.
- (1)
- Resistance-only Model: Six resistors of the same model (Resistance: 1 ; Accuracy: 1%) were connected in series to construct the test model. Signals at different frequencies were input at both ends of the model, and the receiver was used to acquire voltage data across each resistor. The schematics of the resistor model test setup and photographs of the test site are shown in Figure 11a,b, respectively.Figure 11. Schematics of the Resistor Model Test Setup and Photographs of the Test Site: (a) Schematics of the Resistor Model Test Setup. (b) Photographs of the Test Site.
- (2)
- RC Model: An RC model was constructed by connecting a resistor (Resistance: 1 ; Accuracy: 1%) in parallel with a capacitor (Capacitance: 10 μF; Accuracy: 10%). Six identical RC models were then connected in series to form the RC test model required for this test. Signals at different frequencies were input at both ends of the RC model, and the receiver was used to acquire voltage data across each RC unit. The schematics of the RC model test setup and photographs of the test site are shown in Figure 12a,b, respectively.Figure 12. Schematics of the RC Model Test Setup and Photographs of the Test Site: (a) Schematic of the RC Model Test Setup. (b) Photographs of the Test Site.
The receiver outputs at a fixed sampling rate of 250 Hz. According to the voltage divider principle, the theoretical voltage value allocated to each single channel is 1/6 of the input voltage value from the signal generator, for both the pure resistance model and the RC model. Finally, by analyzing the raw voltage data obtained from five repeatability tests using both models against the theoretical voltage values, the receiver’s repeatability, accuracy, and channel consistency are verified.
3.1.3. Power Supply Test Scheme
Three AC-DC switching power supplies are connected to a 220 VAC single-phase mains supply. Their outputs are respectively connected to the high-voltage input terminals of the transmitter. Simultaneously, the three output channels of the transmitter are connected to load circuits of 250 Ω, 500 Ω, and 250 Ω, respectively. By examining the output results of the three power supplies, it can be determined whether the power supplies are functioning correctly. The experimental power supply setup during operation is illustrated in Figure 13.
Figure 13.
Experimental Power Supply Setup.
3.2. Field Experimental Design
3.2.1. Field Test Site and Conditions
The field experiment was conducted on a floodplain grassland along the Xiangjiang River in Changsha, Hunan Province (28°10′ N, 112°58′ E). The site is situated within the city but outside the dense downtown area, and thus serves as a representative environment for validating the fundamental performance of the system before its deployment in more challenging urban settings.
- (1)
- Geological Conditions: Based on general soil resistivity reference data, the Quaternary alluvial layers (primarily silty clay and fine sand) along the Xiangjiang River typically exhibit resistivities ranging from 20 to 300 Ω·m under natural moisture conditions.
- (2)
- Electrode Array: Along the survey line, two receivers were deployed, with a total of 50 measurement electrodes. The two measurement electrodes at the connection point between the two receivers are considered as a single measurement point, resulting in a total of 49 measurement points (i.e., 48 acquisition channels). The spacing between any two adjacent measurement electrodes is 1 m. Starting 20 m from the nearest measurement electrodes on the same horizontal line on both sides of the survey line, three pairs of current injection electrodes were arranged (three on each side, with a spacing of 20 m between adjacent electrodes).
- (3)
- Electrodes: Aluminum rods (diameter: 22 mm; length: 35 cm) driven approximately 25 cm into the ground were used as power electrodes, while copper rods (diameter: 10 mm; length: 30 cm) driven 20 cm deep served as potential electrodes. To improve electrical contact, a small amount of saline solution was poured around each electrode prior to measurement.
- (4)
- Reference Measurements: To evaluate the feasibility and accuracy of multi-frequency testing, three rectifier power supplies were first used to simultaneously transmit signals at three frequencies, followed by the sequential transmission of single-frequency signals at 1 Hz, 2 Hz, and 4 Hz under the same conditions to serve as a reference baseline for the multi-frequency test results.
- (5)
- Environmental Conditions: Testing was conducted on 26 December 2025, under clear skies, with ambient temperatures ranging from a high of approximately 11 °C to a low of 2 °C.
3.2.2. Field Ground Resistance Testing
During the field tests conducted on the Xiangjiang River floodplains, standard procedures for electrode contact and inspection were implemented to ensure the reliability of the measurement data. During the deployment phase, aluminum electrodes were driven into the ground to a depth of approximately 20 cm to 30 cm. In areas with relatively dry surface layers, a saline solution was applied around the electrodes to improve the electrochemical coupling between the electrodes and the soil. Once the layout was completed, the system transmitted low-voltage test signals to detect the contact impedance of each channel. The multi-frequency synchronous acquisition process was officially initiated only after confirming that the contact impedance of the vast majority of the participating electrodes had been reduced to a reasonable range.
3.2.3. Design Scheme
To further validate the instrument’s performance, field data acquisition tests were conducted on the grassland along the Xiangjiang River in Hunan Province, employing a multiple intermediate gradient array. The schematic diagram of the survey line is presented in Figure 14, while the field test site and photograph of the complete set of instrumentation equipment are depicted in Figure 15a,b.
Figure 14.
Schematic Diagram of the Survey Line. (The current electrode spacing: 20 m; potential electrode spacing: 1 m, and the distance between the current electrodes (A1, B1) and their respective nearest potential electrodes is 20 m).
Figure 15.
Field Test Site and Photograph of the Complete Set of Instrumentation Equipment: (a) Field Test Site. (b) Photograph of the Complete Set of Instrumentation Equipment.
To quantitatively evaluate the performance of multi-frequency synchronous transmission and data fidelity of the instrument, the following verification was conducted: First, baseline data were collected by independently transmitting single-frequency signals at 1 Hz, 2 Hz, and 4 Hz. Subsequently, the instrument’s multi-frequency synchronous mode was activated to simultaneously transmit signals at these three frequencies and collect mixed response data. By comparing and analyzing the raw voltage data collected in single-frequency mode and multi-frequency mode, the performance of the instrument in field operations is verified.
3.3. Data Processing and Inversion
In the data processing and inversion phase, raw data from both single-frequency and multi-frequency transmissions were extracted using a self-developed Android application for Fast Fourier Transform (FFT). These data were then analyzed through point-by-point comparison to validate the instrument’s performance in field experiments. Additionally, the apparent resistivity values calculated from single-frequency and multi-frequency transmissions were inverted using ZondRes2D software (version 6.1), and the inversion results served to further verify the instrument’s capabilities.
4. Results
4.1. Transmitter and Receiver Lab Performance
4.1.1. Transmitter Lab Performance
Figure 16 plots the distribution of the mean peak amplitudes for each channel, extracted from these five independent tests. This figure intuitively demonstrates the system’s output performance and inter-channel consistency.
Figure 16.
Distribution of mean peak amplitudes across the three transmitter channels for five independent tests at 1 Hz, 2 Hz, and 4 Hz.
As shown in Figure 16, the measured mean amplitudes are in good agreement with the theoretical expectations. Within each frequency band, the heights of the bar charts for the three independent channels remain almost identical, demonstrating good hardware consistency among the parallel transmission channels.
To further quantify the system uncertainty, Table 3 summarizes the data from these five measurements, including the mean () and standard deviation ().
Table 3.
Statistical results of transmitter waveform amplitude accuracy and repeatability (Mean ± Standard Deviation of five independent measurements).
4.1.2. Receiver Lab Performance
(1) Test results of the resistance model
To comprehensively evaluate the acquisition accuracy and repeatability of the collection channels under various conditions, the measurement process covered three target frequencies (1 Hz, 2 Hz, and 4 Hz) and multiple input amplitudes. Furthermore, to evaluate concerns regarding the measurement uncertainty of the system, we performed five independent repetitive measurements continuously for each test configuration. To demonstrate the system’s performance across different channel groups and parameter settings, Table 4 extracts the statistical results of representative channels (1–3, 7–9, 13–15, and 19–21) under various testing conditions, including the mean () and standard deviation () of the five measurements.
Table 4.
Statistical results of resistance model measurements and repeatability (Mean ± Standard Deviation of five independent measurements).
(2) RC model test results. In the experiment, the 24 receiving channels were divided into four groups, with each group (comprising 6 channels) connected in parallel across a corresponding RC unit to collect the voltage signals. To evaluate the measurement uncertainty of the system, five independent repetitive measurements were performed continuously for each test configuration. To demonstrate the system’s performance across different channel groups and parameter settings, Table 5 presents the statistical results for representative channels (Channels 1–3, 7–9, 13–15, and 19–21) under various testing conditions, including the mean () and standard deviation () of the five measurements.
Table 5.
Statistical results of RC model measurement accuracy and repeatability (Mean ± Standard Deviation of five independent measurements).
4.1.3. Power Supply Test Results
During the test, the actual measured outputs are: Channel 1 at 751 V and 3 A, Channel 2 at 1000 V and 2.03 A, and Channel 3 at 742 V and 3 A. The output signals are square waves with frequencies of 1 Hz, 0.5 Hz, and 0.25 Hz, respectively, indicating normal operation.
4.2. Field Acquisition Metrics
As shown in Figure 17a–c, comparative analysis indicates that the relative error in apparent resistivity between the response data obtained in synchronous transmission mode and that in independent transmission mode is less than 2%. In terms of measurement efficiency, this method offers a significant advantage over single-frequency sequential measurements. Under the premise of maintaining the same sampling duration and stacking counts, the traditional approach requires the excitation and acquisition of three frequency points sequentially, resulting in a total duration approximately three times that of the three-frequency synchronous mode. Taking this verification as an example, if the measurement of each frequency point individually takes time T, the total duration for sequential measurement is 3T; however, using the three-frequency synchronous mode only takes time T, reducing the overall measurement time by approximately 66.7%. This result demonstrates that the instrument can significantly enhance exploration efficiency while ensuring data quality.
Figure 17.
Comparison and Error Analysis of Apparent Resistivity Extracted from Single-Frequency and Multi-Frequency Synchronous Transmission (Apparent Resistivity Error < 2%): (a) Synchronous Multi-frequency Extraction (1 Hz) and Single-frequency Transmission (1 Hz). (b) Synchronous Multi-frequency Extraction (2 Hz) and Single-frequency Transmission (2 Hz). (c) Synchronous Multi-frequency Extraction (4 Hz) and Single-frequency Transmission (4 Hz).
4.3. Inversion Outcomes
Furthermore, data collected using single-frequency independent excitation and three-frequency synchronous excitation were processed using the same inversion algorithm and parameters via ZondRes2D software. As illustrated by the results in Figure 18a,b, the inversion outcomes of the two modes are highly consistent, with a root-mean-square (RMS) error of only 0.4%. These results confirm the reliability of the data quality in the multi-frequency parallel operating mode, thereby significantly improving exploration efficiency without sacrificing exploration precision.
Figure 18.
Comparison of Data Inversion Results between Single-Frequency Independent Transmission and Multi-Frequency Synchronous Transmission: (a). Inversion Results of Multi-Frequency Synchronous Transmission. (b). Inversion Results of Single-Frequency Independent Transmission.
5. Discussion
5.1. Analysis of Data Fidelity
In the five independent performance tests of the transmitter, the peak output values of the three channels exhibited strong stability at frequencies of 1 Hz, 2 Hz, and 4 Hz. The standard deviation () across multiple measurements for all frequency bands remained at a low level (typically below 60 V). Although the relative amplitude error at 4 Hz showed a slight increase (approximately 1.7%), the parallel transmission channels overall demonstrated relatively high output consistency.
In the multi-channel resistance model tests of the receiver, the results of five repetitive samplings for the acquisition channels showed that the standard deviation of the extracted voltage was strictly controlled within the microvolt range (mostly below 30 V). This suggests, to a certain extent, that the CPLD-based multi-channel synchronous sampling architecture possesses excellent channel matching and measurement repeatability. Even under weak signal input conditions, the system maintains stable signal acquisition and resolution capabilities.
In the RC model test, we employed six identical RC parallel units to form the test link. This design theoretically cancels out the influence of frequency-dependent capacitive reactance on the voltage division ratio, aiming to more purely observe the instrument’s performance under capacitive loading. Statistical results from five independent repeated measurements show that, when faced with complex impedance signals, not only are the measured means of each channel relatively concentrated, but the standard deviations of the extracted voltages are also controlled at the microvolt level (typically below 100 V). This minor fluctuation objectively reflects that the instrument’s receiving chain and digital separation algorithm do not introduce significant random uncertainty during the decoupling of complex impedance, thereby demonstrating good operational stability.
Field data acquisition tests show that the relative error in apparent resistivity between multi-frequency synchronous extraction and single-frequency independent transmission modes is less than 2%. In geophysical inversion theory, raw data errors exceeding 5% typically lead to fabricated anomalies in reconstructed 2D or 3D resistivity models. The FDM-ERT hardware’s ability to strictly control the separation and extraction error of mixed signals within 2% ensures, to some extent, that the inversion algorithm does not “overfit” the noise. Consequently, the root mean square (RMS) misfit between the inversions of the single-frequency and multi-frequency datasets is only 0.4%. This low RMS misfit geologically indicates that the FDM architecture adequately preserves the fidelity of the raw observed data, ensuring that the increase in acquisition speed does not compromise data quality.
In the absence of field comparisons with commercial instruments, these standard physical model tests serve a critical “hardware calibration” role. This objectively demonstrates, from a physical perspective, that the instrument possesses a degree of accuracy in measuring actual impedance, thereby providing metrological support for the validity of field exploration data.
5.2. Compared with Traditional ERT Instruments
Traditional resistivity imaging instruments typically operate in a single-frequency sequential measurement mode, requiring multiple transmissions to acquire data for different depths or different arrays, which results in relatively low fieldwork efficiency. In contrast, the proposed FDM-ERT system injects three independent frequencies simultaneously through three electrode pairs, with the receiver recording all frequency components in a single measurement. Field data comparisons show that the apparent resistivity values extracted in multi-frequency synchronous mode deviate by less than 2% from those obtained with single-frequency transmission, and the inversion results are nearly identical (with an RMS error of 0.4%). This indicates that the multi-frequency approach significantly improves efficiency without sacrificing data quality.
To further demonstrate the feasibility of our design, Table 6 compares the core parameters of our instrument with those of other commercial instruments.
Table 6.
Comparison Table of Core Parameters.
As shown in Table 6, the theoretical noise floor (2 μV) of our proposed FDM-ERT system is objectively slightly higher than that of single-frequency TDM instruments. To compensate for this difference and ensure data quality, we have adopted a high-power compensation strategy in our design: increasing the single-channel transmission power to 3 kW (1000 V). This high-power output helps generate a greater effective potential difference in high-resistivity formations. Furthermore, compared to single-frequency sequential measurements, our design achieves a time savings of approximately 66.7% under identical acquisition conditions.
5.3. Evaluation of Signal Separation
5.3.1. Statistical Validation of Software Signal Separation and Its Corroboration of Hardware Robustness
In our design, the hardware receiver is primarily responsible for data acquisition and transmission to the host computer, while the subsequent frequency-domain separation (FFT) of the multi-frequency signals is implemented in software. During signal processing, the accuracy and stability of the software-based FFT separation are closely related to the quality of the data provided by the underlying hardware. If the hardware exhibits channel timing skew or significant noise, it often induces spectral leakage during the software processing stage. Therefore, conducting statistical validation and robustness analysis of the separation algorithm within the Android application can, to some extent, indirectly reflect the reliability and stability of this hardware acquisition system.
We extracted raw potential difference data from nearly 50 independent spatial measurement points along the survey line. For each point, we compared, point by point, the raw voltage (Vm) decoupled from the mixed signal by the Android app with the reference voltage (Vs) measured under the single-frequency independent transmission mode. The relative discrepancy at each measurement point was calculated as E = | (Vm − Vs)/Vs | × 100%. The statistical characteristics of the raw voltage signal discrepancies between the multi-frequency and single-frequency modes are shown in Table 7.
Table 7.
Statistical Characteristics of Raw Voltage Signal Discrepancies Between Multi-Frequency and Single-Frequency Modes (Mean ± SD).
As shown in Table 7, the mean relative discrepancy at 1 Hz is approximately 0.15%. As the frequency increases to 4 Hz, the mean relative discrepancy rises to 9.30%. Considering the laboratory results from both the resistance model and the RC model, where the average errors at 4 Hz were all less than 1.0%, it can be inferred, to some extent, that this increase in discrepancy is not an algorithmic error of the Android software (version 1.0), but rather a physical phenomenon caused by the power allocation at the hardware level. In multi-frequency simultaneous transmission mode, the total power of the transmitter is distributed among multiple frequency components, resulting in the actual injected current for each frequency point being slightly lower than that in the single-frequency independent transmission mode. Consequently, the measured raw potential difference decreases proportionally. An effective indicator of the stability of the signal separation algorithm is its standard deviation. The standard deviations of the extraction ratios for each frequency band are all controlled within a relatively small range, from ±0.0006 to ±0.01. To further observe this stability, we introduced the Bootstrap method for non-parametric statistical inference. After performing 1000 resampling iterations on this batch of spatial samples, the resulting 95% confidence intervals were relatively concentrated.
This convergent error fluctuation indicates that the Android-side separation algorithm possesses good robustness. At the same time, it indirectly suggests that the underlying hardware acquisition circuit can provide relatively stable data support for signal separation in actual field environments.
5.3.2. Analysis of System Spectral Characteristics, Crosstalk, and Expected Signal-to-Noise Ratio
In the FDM system, the harmonic content of square-wave excitation, potential crosstalk between frequencies, and the attenuation of the signal-to-noise ratio in different frequency bands are important factors affecting the quality of signal separation. During the design phase of this study, these issues were specifically addressed and validated.
- (1)
- Avoidance of Square-Wave Harmonic Interference
Traditional square-wave excitation inevitably generates odd-order harmonics of the fundamental frequency (i.e., 3f0, 5f0, 7f0…). If the frequencies are not chosen properly, harmonics from lower-frequency components will directly contaminate the measurement windows of higher-frequency components. To address this issue, the system intentionally selects 1 Hz, 2 Hz, and 4 Hz (following a geometric progression of 2n) as the simultaneous excitation frequencies at the transmitter side. According to the spectral distribution characteristics, and given that square waves contain only odd-order harmonics, the odd-order harmonics of 1 Hz (3, 5, 7… Hz) and those of 2 Hz (6, 10, 14… Hz) do not fall on the target measurement frequency points of 2 Hz and 4 Hz on the frequency axis, thereby achieving a natural staggering of frequency points. Furthermore, in conjunction with the 20 Hz low-pass anti-aliasing filter configured at the hardware front-end, the system can effectively mitigate the potential interference from higher-order harmonics and out-of-band noise on the target measurement frequency bands.
- (2)
- Actual Performance of Inter-Frequency Crosstalk
To verify whether there is significant energy crosstalk between multiple channels and multiple frequencies, we can refer to the comparative data of raw voltages between multi-frequency and single-frequency modes presented in Section 5.5. If issues existed in the analog link or the digital separation process, the extracted multi-frequency voltage values would exhibit significant errors compared to the single-frequency voltage values. However, the statistical results of the samples indicate that, across a complex formation spanning dozens of meters, the standard deviations of the extracted signals at 1 Hz, 2 Hz, and 4 Hz are all less than 1.0%. This objectively reflects, from the perspective of measured data, that the frequency crosstalk effect within the system is suppressed to a low level and does not have a substantial impact on signal decoupling.
- (3)
- Expected SNR Evaluation for Each Frequency Band
In multi-frequency transmission mode, because the total transmission power is evenly distributed across multiple frequency bands and high-frequency alternating currents experience more significant attenuation in subsurface media, the received voltage in the high-frequency band is lower than that in the low-frequency band. Analysis of raw voltage data from tests conducted by the Xiangjiang River shows that at the same measurement point, the received voltage at 1 Hz is typically around 10 mV, while the received voltage at 4 Hz attenuates to approximately 1 mV. Although the high-frequency signal undergoes noticeable physical attenuation, the receiver employs a 32-bit high-precision ADC with a theoretical noise floor of only 2 μV (RMS). Based on the estimation using the formula SNR = 20 log (Vsignal/Vnoise), the expected signal-to-noise ratio for the 4 Hz band (evaluated at 1000 μV) can still reach approximately 54 dB. This indicates that, relying on the forced current injection from a high-power transmitter of up to 3 kW, the system successfully elevates the response signals of all frequencies to a safe range well above the instrument’s noise floor, thereby ensuring the effective extraction of weak high-frequency signals.
5.4. Technical Limitations and Future Challenges
5.4.1. Technical Limitations
- (1)
- Constraints of Hardware Resources on Exploration Capabilities
In terms of exploration capabilities, constrained by the current number of acquisition channels, a single receiver supports a maximum of 25 measurement electrodes (24 acquisition channels). While this configuration is suitable for surveys of conventional scale, scenarios involving ultra-long profiles or large detection ranges require either moving the receiver multiple times or cascading multiple devices, thereby increasing the complexity and time cost of field operations. Furthermore, due to physical limitations of transmission power and signal attenuation, the effective exploration depth of multi-frequency transmission technology still requires systematic validation under more diverse geological conditions.
- (2)
- High Power Consumption
The issue of high power consumption is one of the most significant engineering challenges facing the current system. With a maximum power of 3 kW per channel for the transmitter, the total power consumption reaches 9 kW when all three channels operate simultaneously, which completely rules out the possibility of using lightweight built-in batteries. Compared to conventional battery-powered resistivity imaging instruments, this system must rely on a heavy single-phase fuel generator for power. This severely limits the equipment’s portability and operational range in rugged mountainous areas, dense forests, or remote regions with inconvenient transportation.
- (3)
- Adaptability Challenges in High-Contact-Impedance Environments
This study aims to propose the FDM-ERT hardware system and validate its fundamental performance; therefore, the current tests were mainly conducted under controlled laboratory conditions and on a mudflat along the Xiangjiang River (a relatively low-noise environment). However, when the system is extended to real-world complex urban environments (such as subways, industrial plants, etc.), high contact impedance will become a critical factor restricting its performance.
Typical urban exploration surfaces (e.g., asphalt, concrete, dry gravel) offer poor coupling conditions, with electrode contact resistances often reaching up to several thousand ohms. The impact of high contact impedance on the FDM-ERT system is mainly reflected in two aspects: Firstly, when the transmission voltage is limited, excessively high electrode contact resistance restricts the strength of the injected current. Secondly, the combination of high electrode contact resistance and the parasitic capacitance of multi-core cables forms a low-pass filter, causing amplitude attenuation of high-frequency signals.
To mitigate this issue, physical measures must be taken during field operations to improve electrode contact conditions. These mainly include infusing saturated saline solution around the electrode points to moisten the surrounding medium and using longer, thicker steel electrodes driven deeper to reach more humid strata. Although these methods are effective to a certain extent, they increase the labor intensity and time cost of fieldwork, creating a conflict with the high-efficiency exploration goals pursued by FDM-ERT technology. This limitation indicates that further research is still needed in both hardware front-end optimization and field operation techniques to transition from testing in simple low-noise environments to applications in complex, high-noise urban settings.
5.4.2. Future Challenges
To address the hardware limitations, future research will focus on the following aspects:
First, regarding the constraints of hardware resources on exploration capability, subsequent studies will focus on the optimization and expansion of the system hardware architecture. By integrating more transmission channels and expanding the receiver arrays, the system aims to meet the requirements for ultra-long profiles and large-scale detection.
Second, addressing the challenges of field portability under high-power operating conditions, future work will explore lightweight, low-power transmitter circuit topologies and novel portable energy solutions.
Third, to address the adaptability challenges in high-interference environments, we will conduct systematic validation in real-world, high-noise urban scenarios (such as areas along subway lines and industrial plants).
Finally, at the data interpretation level, specialized inversion algorithms will be developed for the multi-frequency synchronous data acquired via FDM technology. This aims to fully exploit the potential of multi-frequency information in enhancing spatial resolution and suppressing complex noise.
5.5. Quantitative Evaluation of System Design
To more clearly illustrate the distinctions between the FDM-ERT system proposed in this paper and conventional instrument designs, Table 8 presents a preliminary quantitative evaluation and comparison between conventional instrument designs and our design.
Table 8.
Quantitative Comparison Between Conventional Instrument Design and FDM-ERT.
As shown in Table 8, the proposed system demonstrates certain advantages in engineering practice. For instance, when conducting multi-frequency geological response tests, conventional methods require sequential measurements for each frequency individually, which is time-consuming. In contrast, our design accomplishes three-frequency exploration simultaneously. This approach not only theoretically reduces the measurement time by approximately 66.7% but also ensures that data for all frequencies are acquired under essentially identical environmental conditions.
6. Conclusions
Addressing the limitations of traditional ERT instruments in urban environments, such as low operational efficiency and susceptibility to interference, this study proposes and designs an ERT instrument hardware system based on FDM. The primary work and quantitative conclusions of this study are as follows:
- (1)
- The electrode layout scheme separates the power electrodes from the potential electrodes. Once the potential electrodes are installed, switching between operating modes only requires adjusting the positions and spacing of the power electrodes. In practical operations, this significantly enhances the flexibility of field wiring.
- (2)
- Hardware-Software Collaborative Multi-frequency Synchronous Transceiver System: At the hardware level, to address high-impedance urban environments, the system increases the maximum single-channel transmission power to 3 kW. Compared to conventional commercial equipment with an internal power of approximately 250 W, its signal injection capability has been enhanced. On this basis, the system executes Fast Fourier Transform (FFT) via a self-developed Android application to achieve frequency-domain separation of the multi-frequency mixed signals. This architecture, which couples decoupled underlying hardware acquisition with high-level software algorithms, effectively ensures the quality of the final data.
- (3)
- Quantitative verification of the system’s measurement stability and high efficiency: Five independent repetitive tests in the laboratory demonstrate that the amplitude standard deviation of the transceiver link is strictly controlled at the microvolt level (<100 μV). Statistical analysis of field measurement data further confirms that the error standard deviation of the FDM frequency-domain decoupling algorithm is maintained within 1.0%. Under the premise of ensuring high-quality data (relative error of apparent resistivity at each frequency point < 2%, and an inversion RMS error of only 0.4%), the system theoretically reduces the field signal acquisition time for three frequency bands by approximately 66.7%.
Author Contributions
Conceptualization, R.C. and C.L.; methodology, R.C., C.L., R.S. and S.C.; software, D.Y., R.S., Z.L. and S.C.; validation, D.Y. and K.Y.; formal analysis, R.C. and S.C.; investigation, D.Y. and S.C.; resources, D.Y. and K.Y.; data curation, D.Y.; writing—original draft preparation, D.Y.; writing—review and editing, R.C. and C.L.; visualization, D.Y.; supervision, R.C.; project administration, S.C. and R.S.; funding acquisition, C.L. and S.C. All authors have read and agreed to the published version of the manuscript.
Funding
This research was funded by Deep Earth Probe and Mineral Resources Exploration-National Science and Technology Major Project (No. 2025ZD1007800), Guangzhou Construction Group Science and Technology Plan Project (No. 2022-KJ005), the School-level Natural Science Research and Innovation Team Project (ZKTD202403), the Jiangsu Province Higher Education Basic Science (Natural Science) Research General Project (22KJB510044), the Jiangsu Province “Shuangchuang doctor” Program (JSSCBS20221066), the Jiangsu Province University Science and Technology Innovation Team Project.
Institutional Review Board Statement
Not applicable.
Informed Consent Statement
Not applicable.
Data Availability Statement
Data is contained within the article; further inquiries can be directed to the corresponding author.
Acknowledgments
We would like to thank Hongchun Yao, Zhongjiang Wu, Shenglan Hou and Xin Peng from Central South University for their valuable support with this research. This manuscript has utilized LLM assistance for language polishing in certain parts. We affirm that the AI was used solely for language optimization; all data analysis, scientific reasoning, and final conclusions presented in this article were independently completed by all the authors, who assume full responsibility.
Conflicts of Interest
The authors declare no conflicts of interest.
References
- Qian, D.Z. Application of Electrical Resistivity Tomography (ERT) in Highway Engineering Geological Investigation. Transp. World 2022, 23, 75–77. [Google Scholar]
- Cheng, Q.; Chen, X.; Tao, M.; Binley, A. Characterization of karst structures using quasi-3D Electrical Resistivity Tomography. Environ. Earth Sci. 2019, 78, 285. [Google Scholar] [CrossRef] [Scilit]
- Robert, T.; Dassargues, A.; Brouyère, S.; Kaufmann, O.; Hallet, V.; Nguyen, F. Assessing the contribution of electrical resistivity tomography (ERT) and self-potential (SP) methods for a water well drilling program in fractured/karstified limestones. J. Appl. Geophys. 2011, 75, 42–53. [Google Scholar] [CrossRef] [Scilit]
- Huang, S.K.; Ouyang, Y.F. Application of High Density Electrical Method to Karst Exploration. Chin. J. Eng. Geophys. 2009, 6, 720–723. [Google Scholar]
- Yue, M.; Wang, X.; Gu, H. Enhanced Boulder Detection in Subway Construction through 3D Cross-Hole Electrical Resistivity Tomography. Appl. Sci. 2024, 14, 6749. [Google Scholar] [CrossRef] [Scilit]
- Li, N.; Dong, Z.; Liu, Z.; Yan, B.; Wang, K.; Nie, L.; Lin, C.; Shen, J.; Ma, Z.; Zhang, Y. Synthetic Study of Boulder Detection Using Multi-Configuration Combination of Cross-Hole ERT and Its Field Application in Xiamen Metro, China. Appl. Sci. 2021, 11, 11860. [Google Scholar] [CrossRef] [Scilit]
- Brunet, P.; Clément, R.; Bouvier, C. Monitoring soil water content and deficit using Electrical Resistivity Tomography (ERT)—A case study in the Cevennes area, France. J. Hydrol. 2010, 380, 146–153. [Google Scholar] [CrossRef] [Scilit]
- Camarero, P.L.; Moreira, C.A.; Pereira, H.G. Analysis of the Physical Integrity of Earth Dams from Electrical Resistivity Tomography (ERT) in Brazil. Pure Appl. Geophys. 2019, 176, 5363–5375. [Google Scholar] [CrossRef] [Scilit]
- Carrasco-García, P.; Herrero-Pacheco, J.L.; Carrasco-García, J.; Porras-Sanchiz, D. Electrical Resistivity Tomography and 3D Modeling for Groundwater Salinity Assessment in Volcanic Islands: A Case Study in Los Cristianos (Tenerife, Spain). Appl. Sci. 2025, 15, 11215. [Google Scholar] [CrossRef] [Scilit]
- Liu, H.Y. The Application of DC Resistivity to Shallow Marine Engineering Exploration. Geophys. Geochem. Explor. 2013, 37, 756–760. [Google Scholar]
- Cuong, L.P.; Van Tho, L.; Juzsakova, T.; Rédey, Á.; Hai, H. Imaging the movement of toxic pollutants with 2D electrical resistivity tomography (ERT) in the geological environment of the Hoa Khanh Industrial Park, Da Nang, Vietnam. Environ. Earth Sci. 2016, 75, 286. [Google Scholar] [CrossRef] [Scilit]
- Rucker, D.F.; Fink, J.B.; Loke, M.H. Environmental monitoring of leaks using time-lapsed long electrode electrical resistivity. J. Appl. Geophys. 2011, 74, 242–254. [Google Scholar] [CrossRef] [Scilit]
- He, W.G.; Deng, W. Research on the Application of High Density Electrical Method in Monitoring Landfills. Sci. Technol. Innov. 2025, 16, 26–29. [Google Scholar]
- De Carlo, L.; Perri, M.T.; Caputo, M.C.; Deiana, R.; Vurro, M.; Cassiani, G. Characterization of a dismissed landfill via electrical resistivity tomography and mise-à-la-masse method. J. Appl. Geophys. 2013, 98, 1–10. [Google Scholar] [CrossRef] [Scilit]
- Isobe, Y.; Ishimori, H. Continuous Electrical Resistivity Tomography Monitoring in Waste Landfill Sites with Different Properties and Visualization of Water Channels. Appl. Sci. 2025, 15, 6920. [Google Scholar] [CrossRef] [Scilit]
- Alam, M.J.; Ahmed, A.; Alam, M.Z. Application of Electrical Resistivity Tomography in Geotechnical and Geoenvironmental Engineering Aspect. Geotechnics 2024, 4, 399–414. [Google Scholar] [CrossRef] [Scilit]
- Li, W.; Liu, H.; Yang, S.; Zhu, D.; Zhao, Y.; Luo, M.; Zeng, B.; Xiao, X. Prediction of Spatial Distribution of Soil Heavy Metal Pollution Using Integrated Geochemistry and Three-Dimensional Electrical Resistivity Tomography. Appl. Sci. 2025, 15, 10969. [Google Scholar] [CrossRef] [Scilit]
- Zhang, Z.B.; Song, P.B.; Han, W.Y.; Zhao, H.C.; Li, H.L.; Wang, K. Application of High-Density Electrical Method in Urban Underground Piping Investigation. Geotech. Eng. 2025, 39, 131–133, 149. [Google Scholar]
- Chang, X.L. Research on Application of High Density Electrical Method in Highway Engineering Geological Survey. Henan Sci. Technol. 2020, 23, 102–103. [Google Scholar]
- Kundu, S.K.; Saha, A.; Dey, A.K. Electrical resistivity tomography to check compaction control of road embankment made of partially saturated soil. Innov. Infrastruct. Solut. 2024, 9, 283. [Google Scholar] [CrossRef] [Scilit]
- Jiang, Q.K. Application of High-Density Electrical Method in Highway Landslide Exploration. Value Eng. 2024, 43, 139–141. [Google Scholar]
- Li, H.; Wang, F.; Tang, J.; Liu, Y.; Wang, G.; Jia, X. Study on Detection Technology for High-Speed Railway Slope Sliding Surface Based on Complex Observation of Electrical Resistivity Tomography. Appl. Sci. 2025, 15, 9091. [Google Scholar] [CrossRef] [Scilit]
- Xiao, S.; Yang, J.; Ma, C.; Li, P.; Zhang, Z.; Cheng, L.; Tong, F. Nondestructive testing of seepage in check dams using electrical resistivity tomography based on laboratory test. Constr. Build. Mater. 2024, 411, 134265. [Google Scholar] [CrossRef] [Scilit]
- Fang, N.F.; Zeng, Y.; Ni, L.S.; Shi, Z.H. Estimation of sediment trapping behind check dams using electrical resistivity tomography. J. Hydrol. 2019, 568, 1007–1016. [Google Scholar] [CrossRef] [Scilit]
- Li, F.; Ouyang, Y.C. Visual Expression of Soil Layers Based on Electrical Resistivity Imaging Technology. West. Explor. Eng. 2021, 33, 122–125. [Google Scholar]
- Pelton, W.; Rijo, L.; Swift, C., Jr. Inversion of two-dimensional resistivity and induced polarization data. Geophysics 1978, 43, 788–803. [Google Scholar] [CrossRef] [Scilit]
- Petrick, W.R., Jr.; Sill, W.R.; Wards, S. Three-dimensional resistivity inversion using alpha centers. Geophysics 1981, 46, 1148–1162. [Google Scholar] [CrossRef] [Scilit]
- Jaysaval, P.; Hammond, G.E.; Johnson, T.C. Massively parallel modeling and inversion of electrical resistivity tomography data using PFLOTRAN. Geosci. Model Dev. 2023, 16, 961–976. [Google Scholar] [CrossRef] [Scilit]
- Blanchy, G.; Saneiyan, S.; Boyd, J.; McLachlan, P.; Binley, A. ResIPy, an intuitive open source software for complex geoelectrical inversion/modeling. Comput. Geosci. 2020, 137, 104423. [Google Scholar] [CrossRef] [Scilit]
- Zhao, M.; Jia, M.; Yang, L.; Suo, K.; Lu, Y.; Wei, Q.; Zhang, Y. Correction methods and applications of ERT in complex terrain. MethodsX 2024, 13, 103012. [Google Scholar] [CrossRef] [Scilit]
- Wan, T.L. Three-Dimensional DC Resistivity Inversion Study Based on Supervised Descent Method. Ph.D. Thesis, Jilin University, Changchun, China, 2025. [Google Scholar]
- Ren, Z.Y.; Qiu, L.W.; Tang, J.T.; Zhou, F.; Chen, C.J.; Chen, H.; Hu, S.G. 3D modeling of direct-current anisotropic resistivity using the adaptive finite-element method based on continuity of current density. Chin. J. Geophys. 2018, 61, 331–343. [Google Scholar]
- Xu, Z.F.; Xiong, X.R.; Xiong, B.; Shi, J.; Lu, Y.G.; Li, M.S. Three-dimension resistivity forward for anisotropic media basedon scalar Green’s function. Chin. J. Geophys. 2025, 68, 4005–4011. [Google Scholar]
- Xia, X.; Pan, Y.-Y.; Liu, X.-L.; Jia, Y.-G. Hierarchical Electrode Switching Device Design for Distributed Single-Channel Electrical Resistivity Tomography System. Appl. Sci. 2021, 11, 5746. [Google Scholar] [CrossRef] [Scilit]
- Urruela, A.; Rivero, L.; Casas, A.; Garcia-Artigas, R.; Sendrós, A.; Lovera, R.; Himi, M. Improving the resolution of investigation using ERT instruments with a reduced number of electrodes. J. Appl. Geophys. 2021, 186, 104239. [Google Scholar] [CrossRef] [Scilit]
- Park, K.; Lee, H.; Kuchenbecker, K.J.; Kim, J. Adaptive Optimal Measurement Algorithm for ERT-Based Large-Area Tactile Sensors. IEEE/ASME Trans. Mechatron. 2022, 27, 304–314. [Google Scholar] [CrossRef] [Scilit]
- Wiranata, L.F.; Putra, N.K.; Kurniadi, D. Embedded System for Image Reconstruction in Electrical Resistance Tomography. In Proceedings of the 2023 8th International Conference on Instrumentation, Control, and Automation (ICA), Bandung, Indonesia, 9–11 August 2023; pp. 42–47. [Google Scholar] [CrossRef] [Scilit]
- Chen, R.J.; Tang, D.C.; Liu, C.M.; Wang, X.Y.; Shen, R.J.; Yao, H.C.; Liu, Z.T.; Chen, X.S.; Wang, Z.H. Development of Frequency Division Multiplexing (FDM) 3D Electrical Resistivity Tomography (ERT) Instrument. In Proceedings of the China Geoscience Union Academic Annual Meeting, Chongqing, China, 18 October 2020. [Google Scholar]
- Wu, L.L.; Jia, H. Discussion on the Exploration Depth of IP Intermediate Gradient Array. Heilongjiang Sci. Technol. Inf. 2015, 8, 87. [Google Scholar]
- Frankowski, P.K.; Majzner, P.; Mąka, M.; Stawicki, T.; Chady, T. Magnetic Non-Destructive Evaluation of Reinforced Concrete Structures—Methodology, System, and Identification Results. Appl. Sci. 2024, 14, 11695. [Google Scholar] [CrossRef] [Scilit]
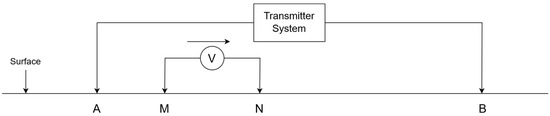
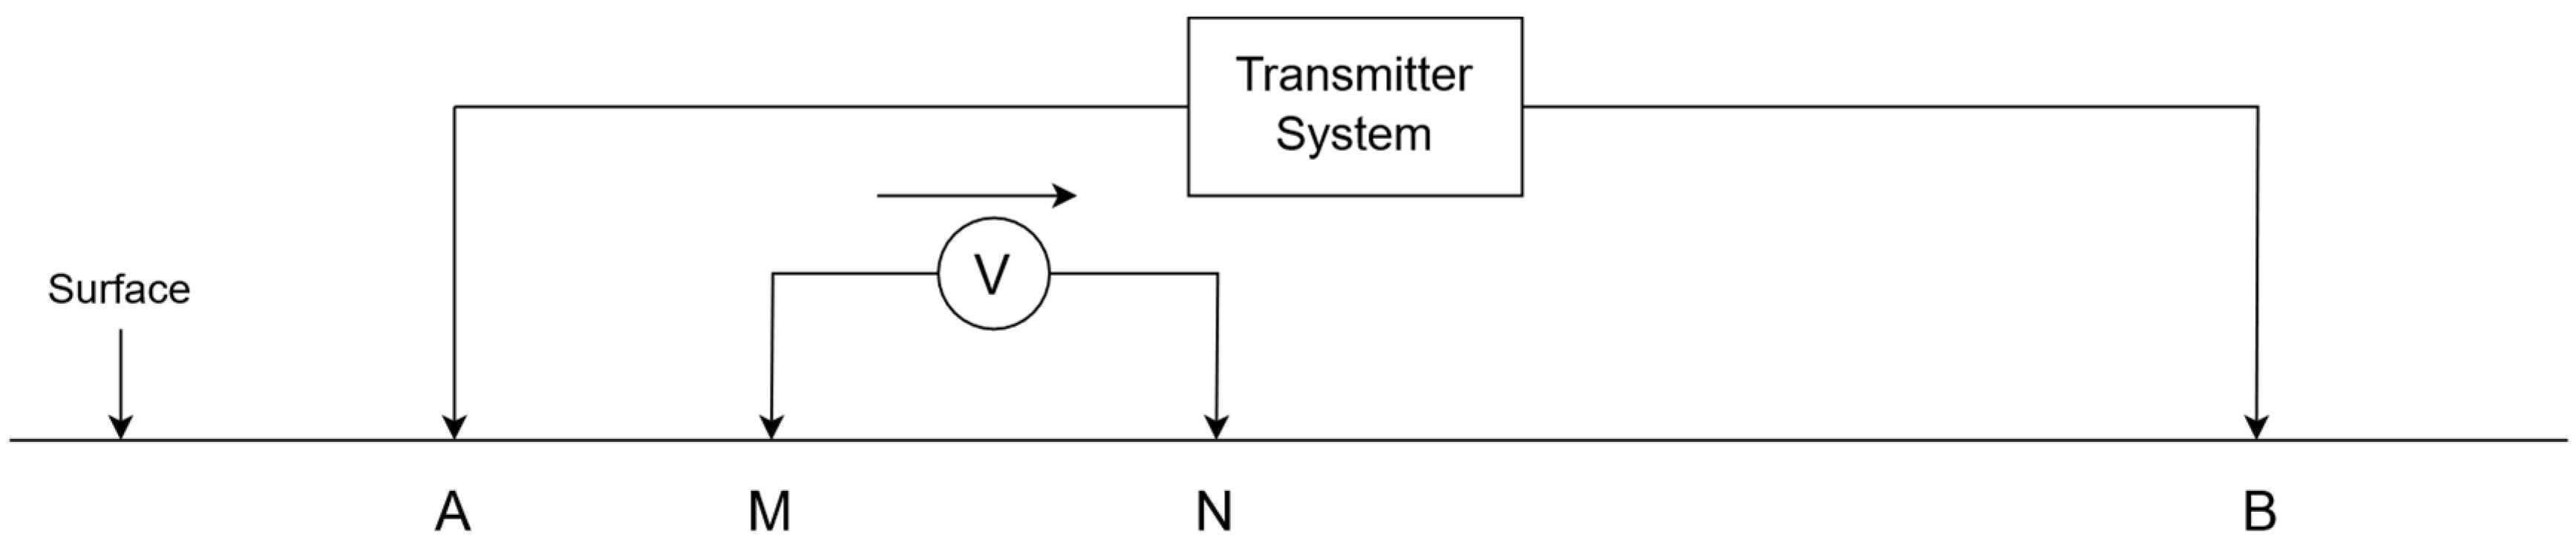


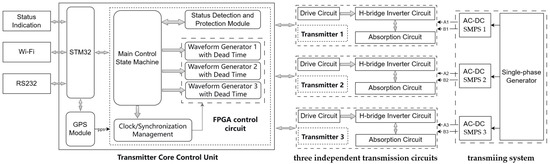
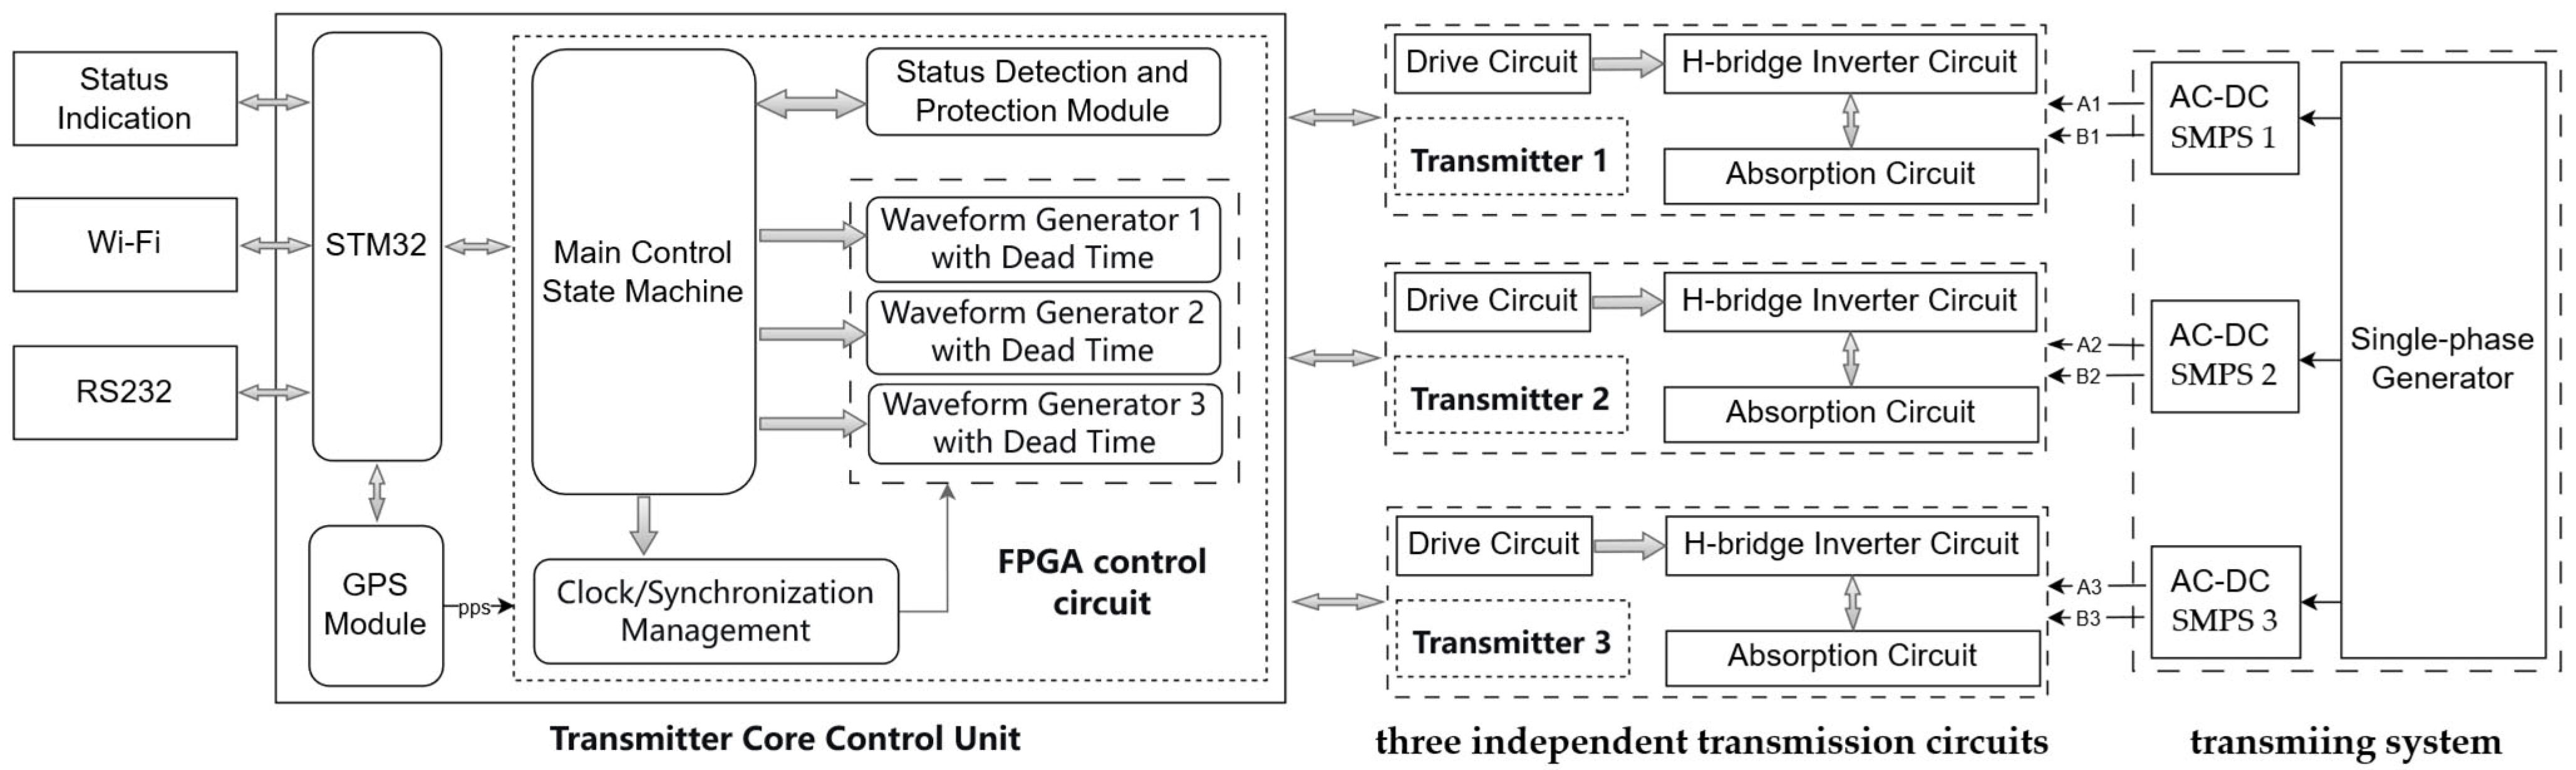
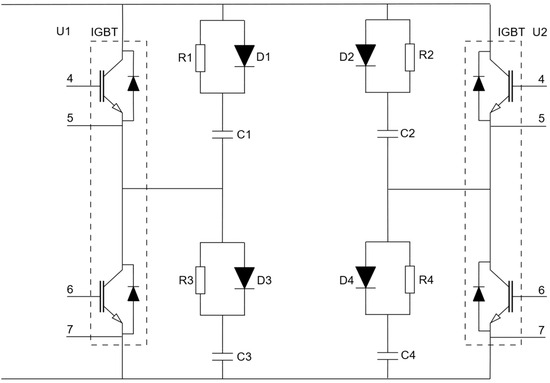
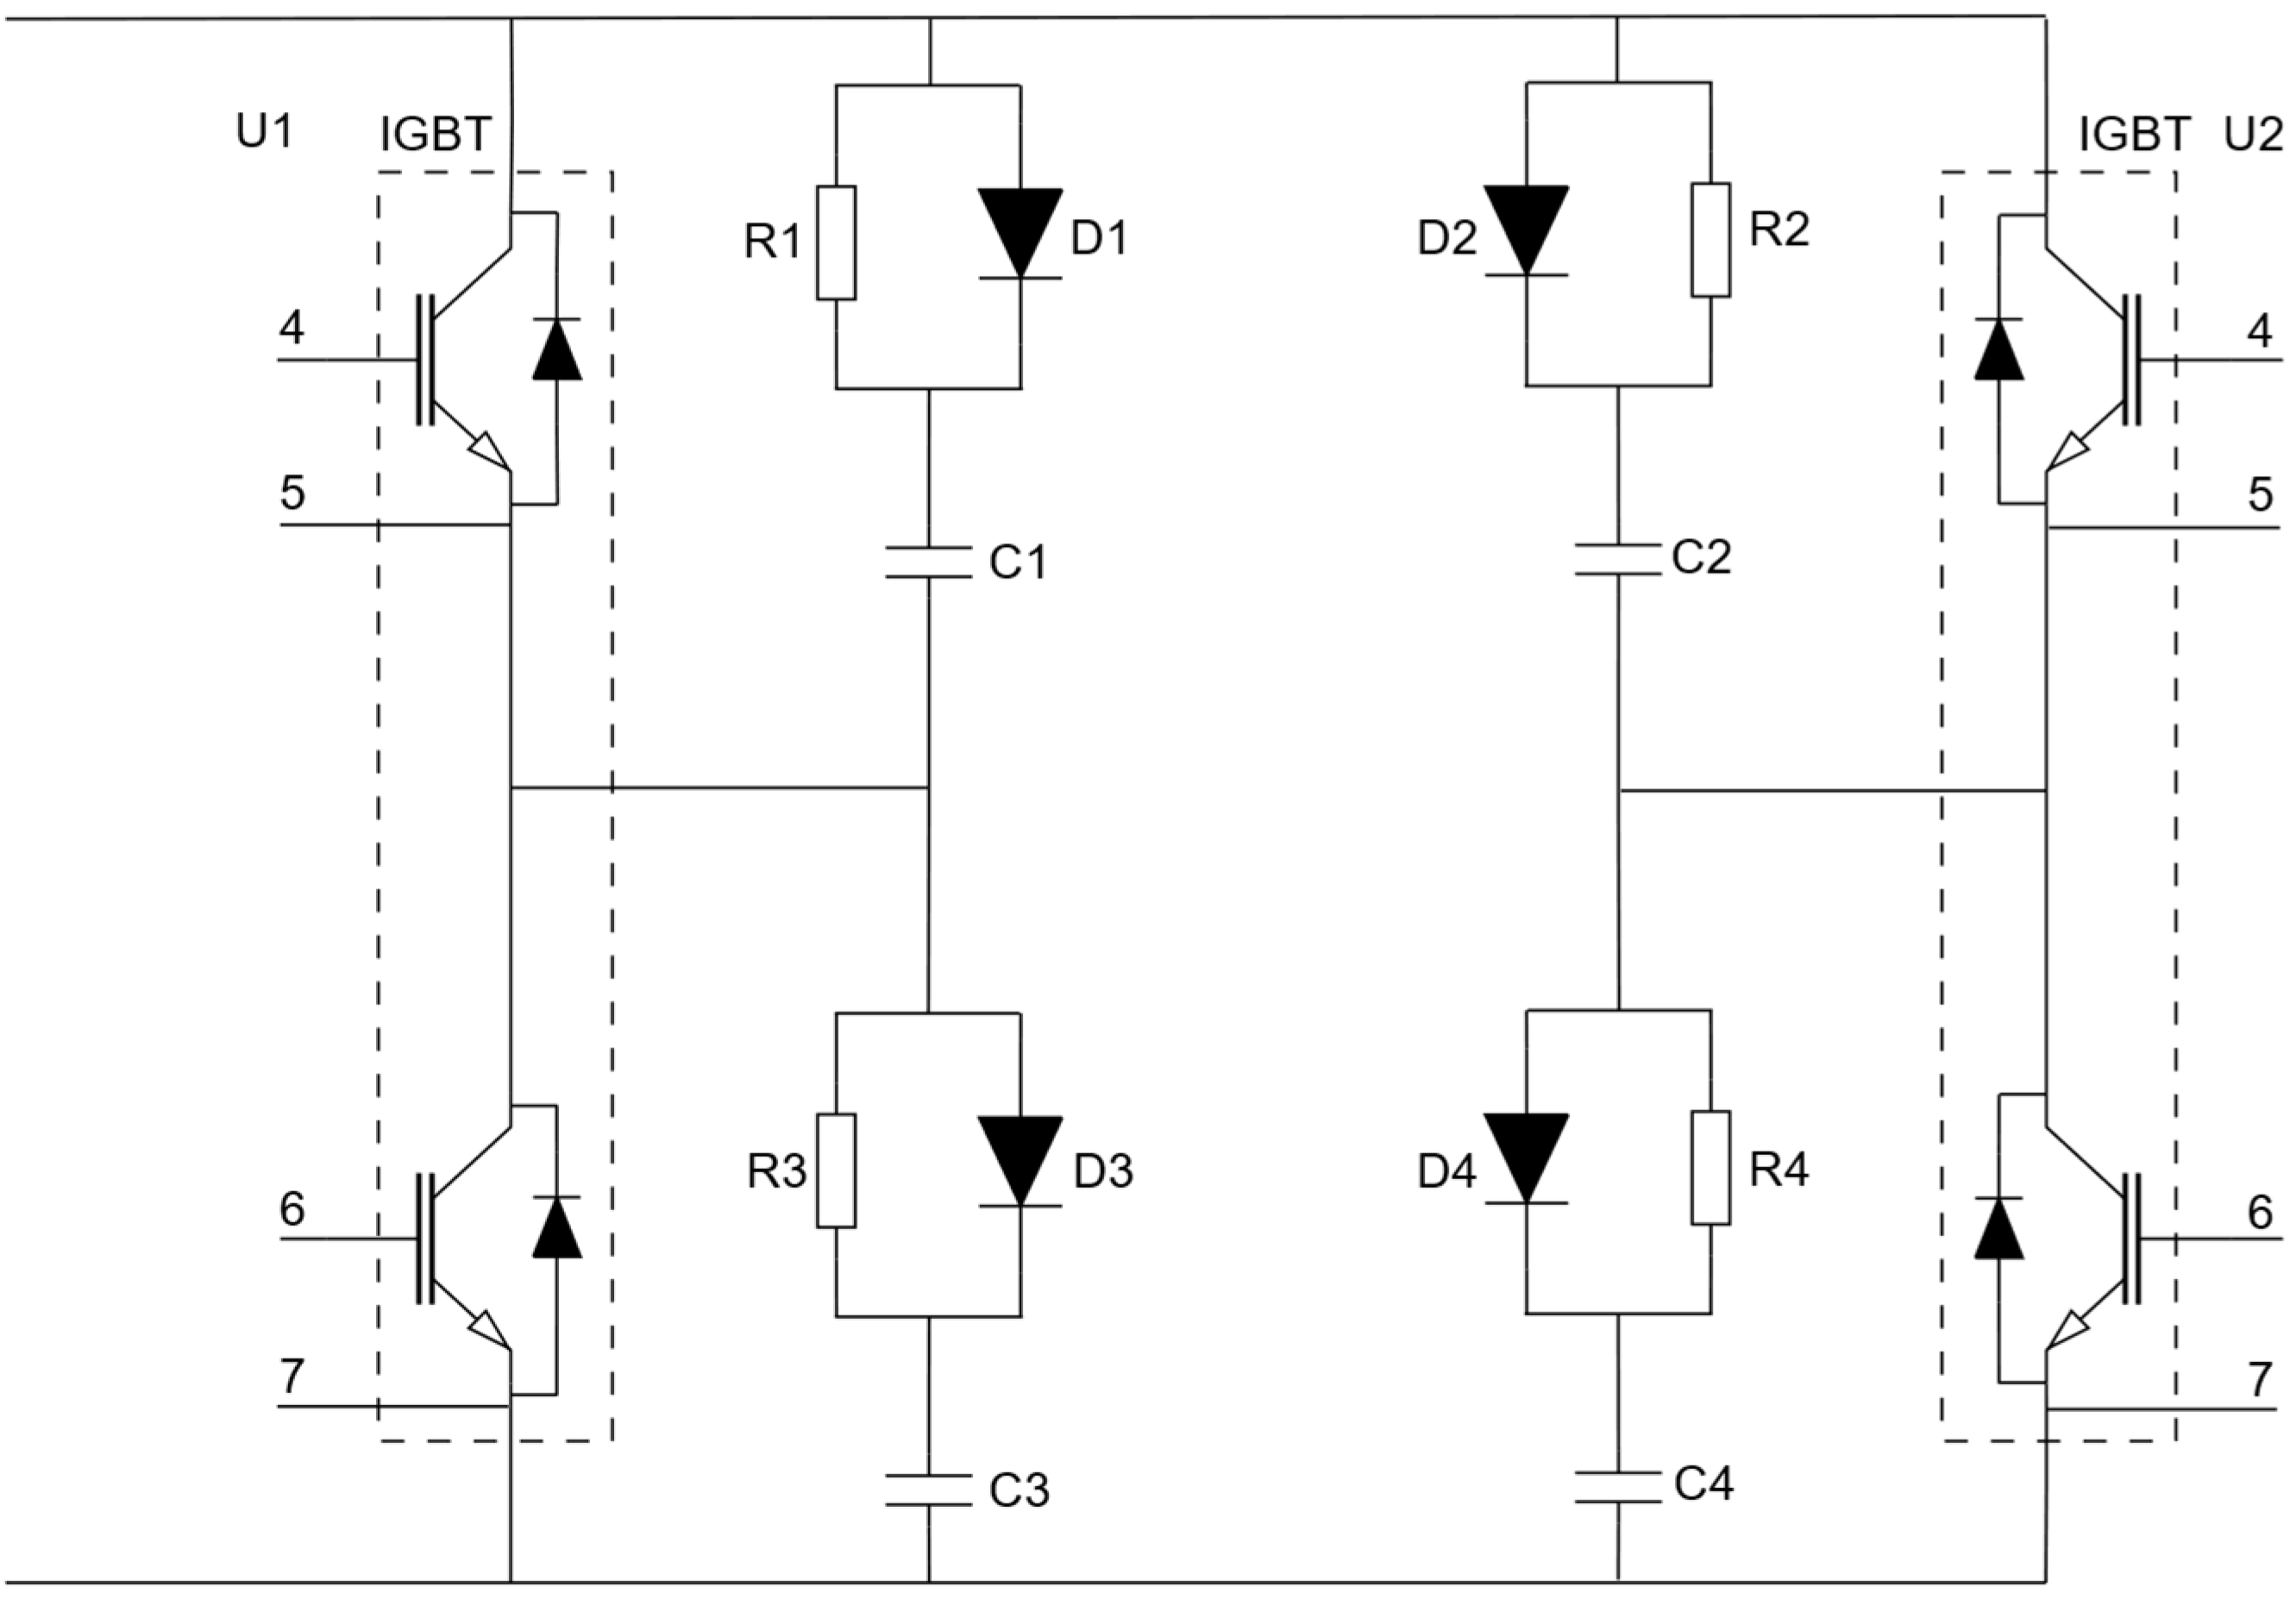
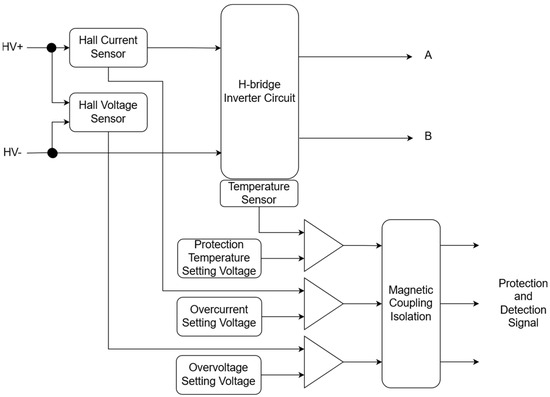
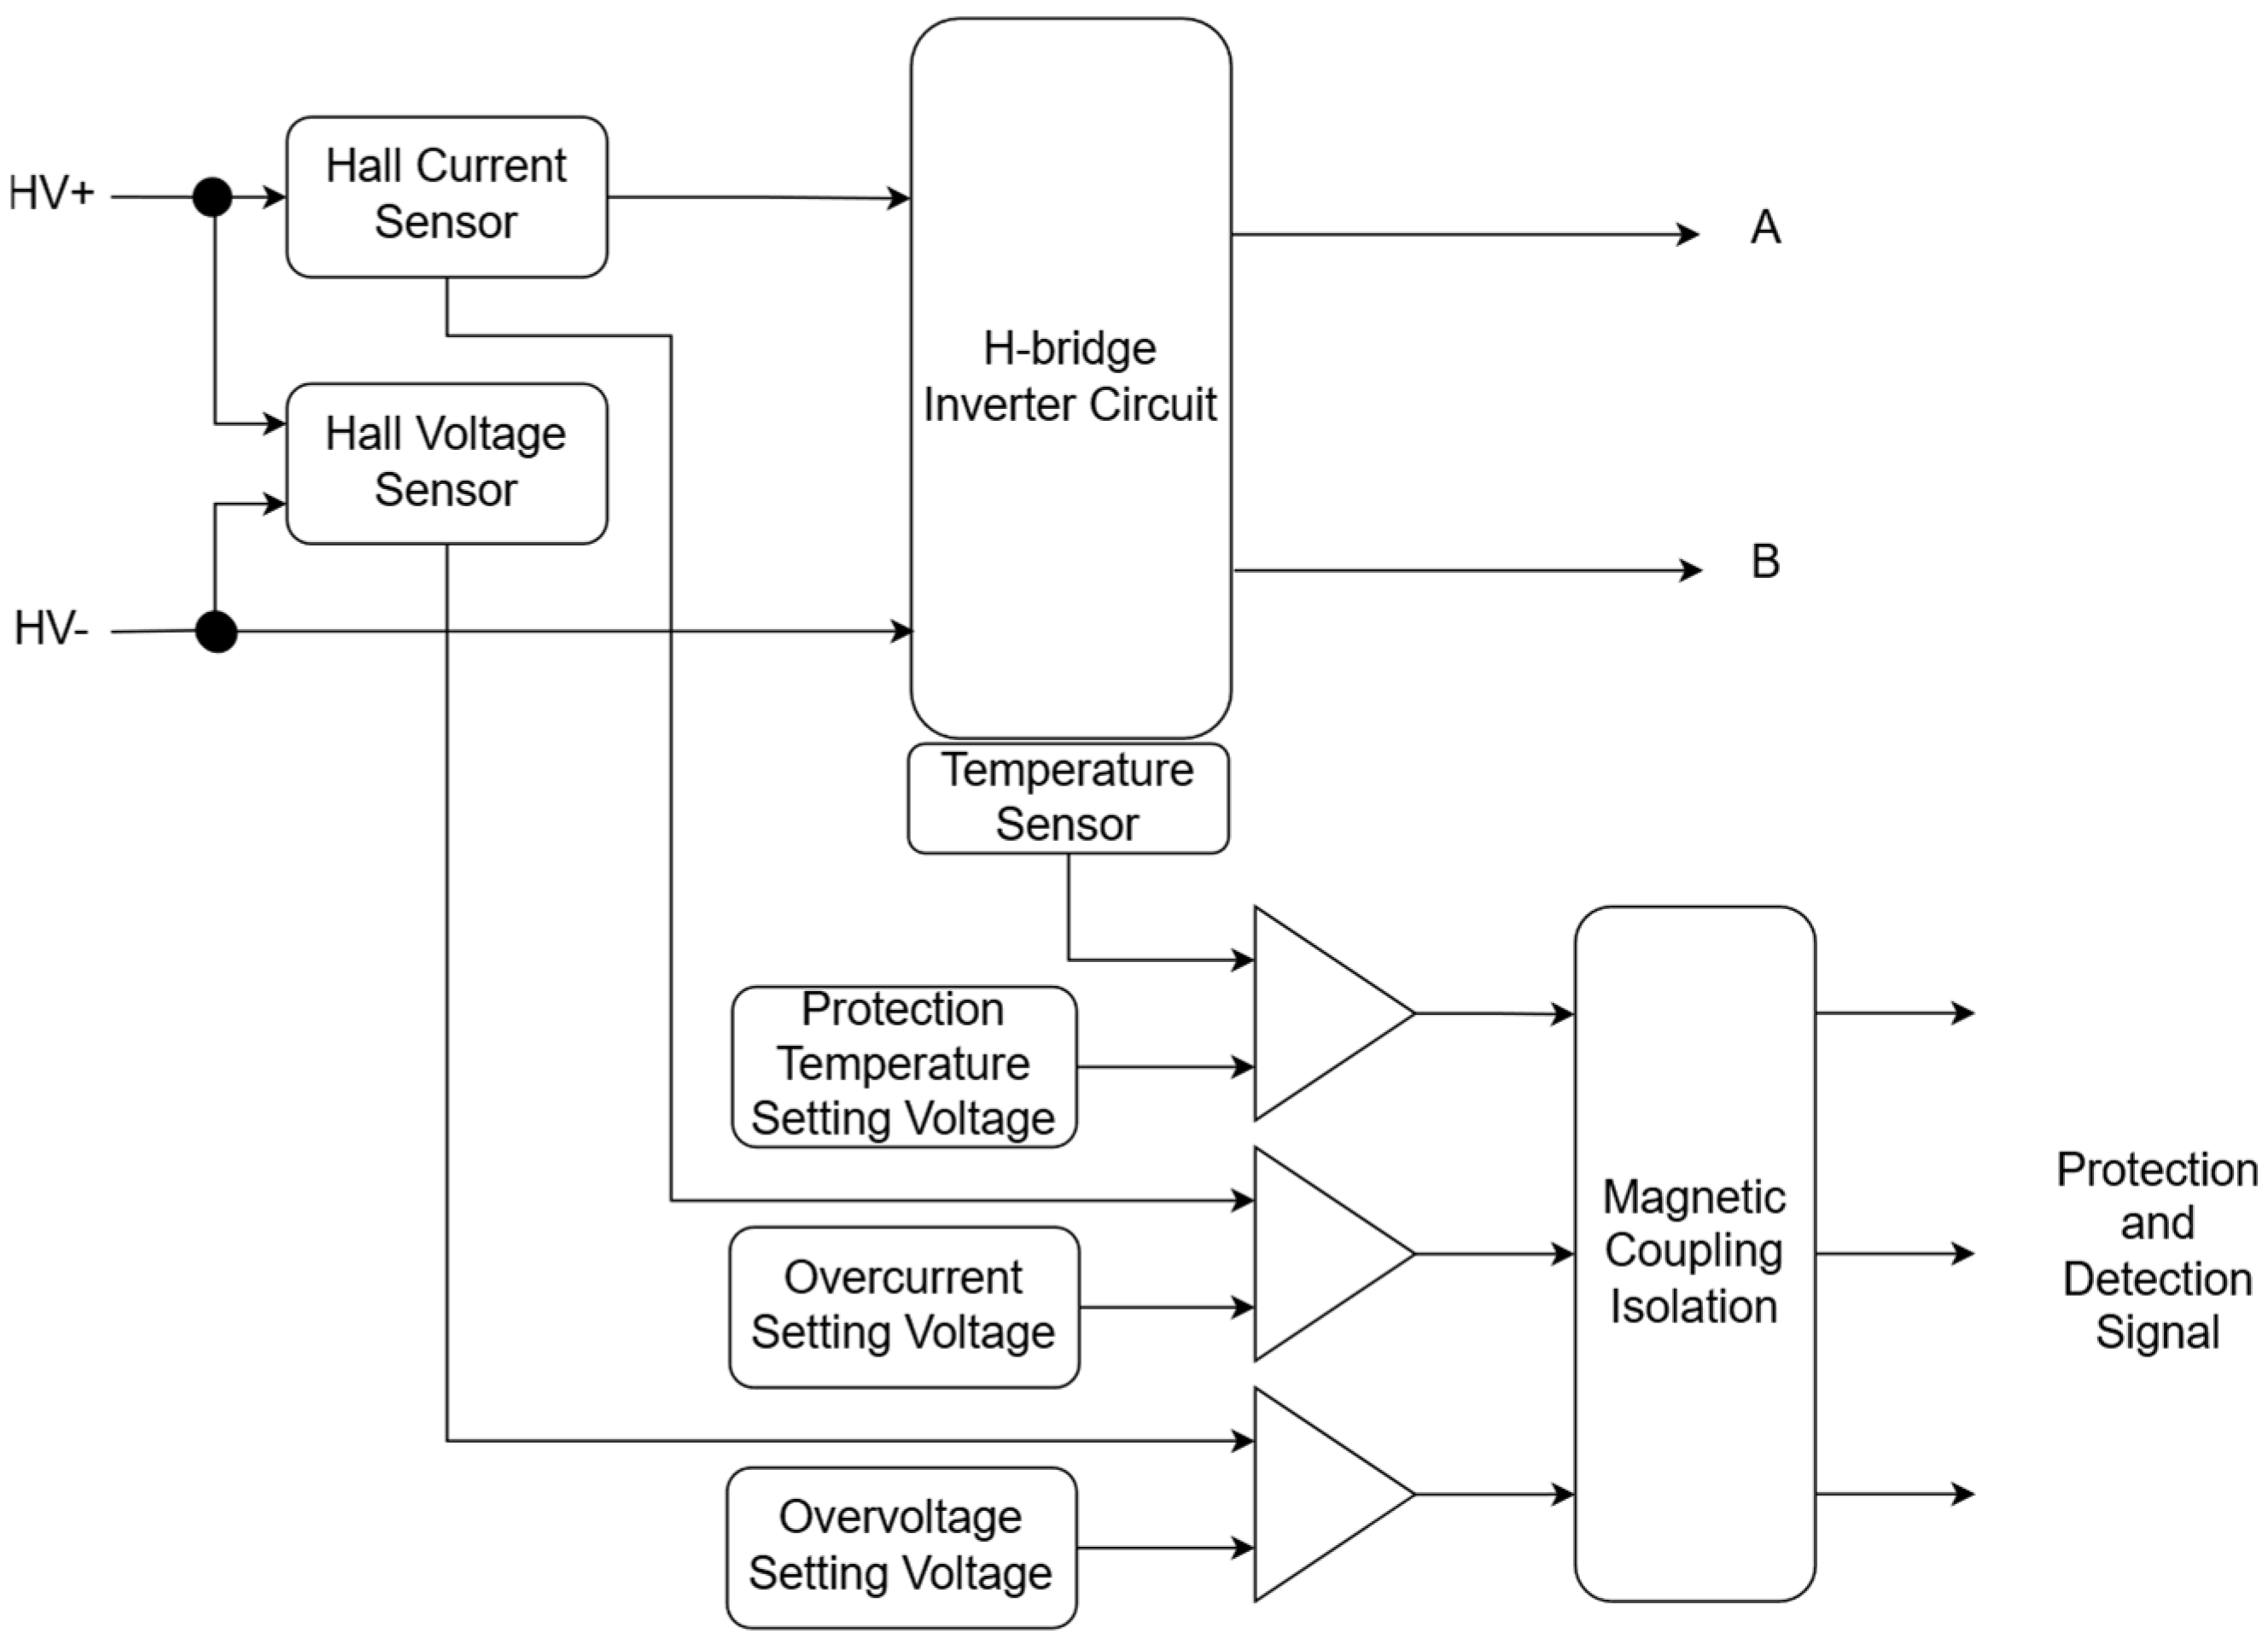
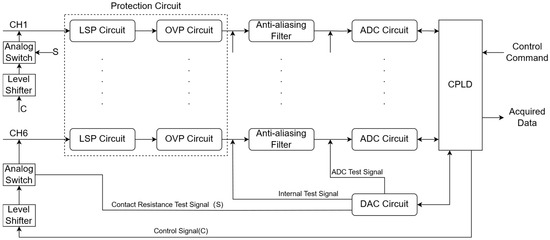
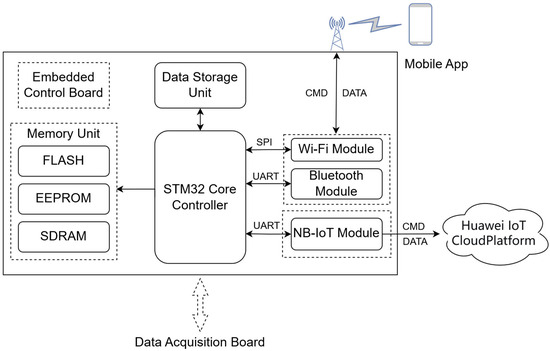
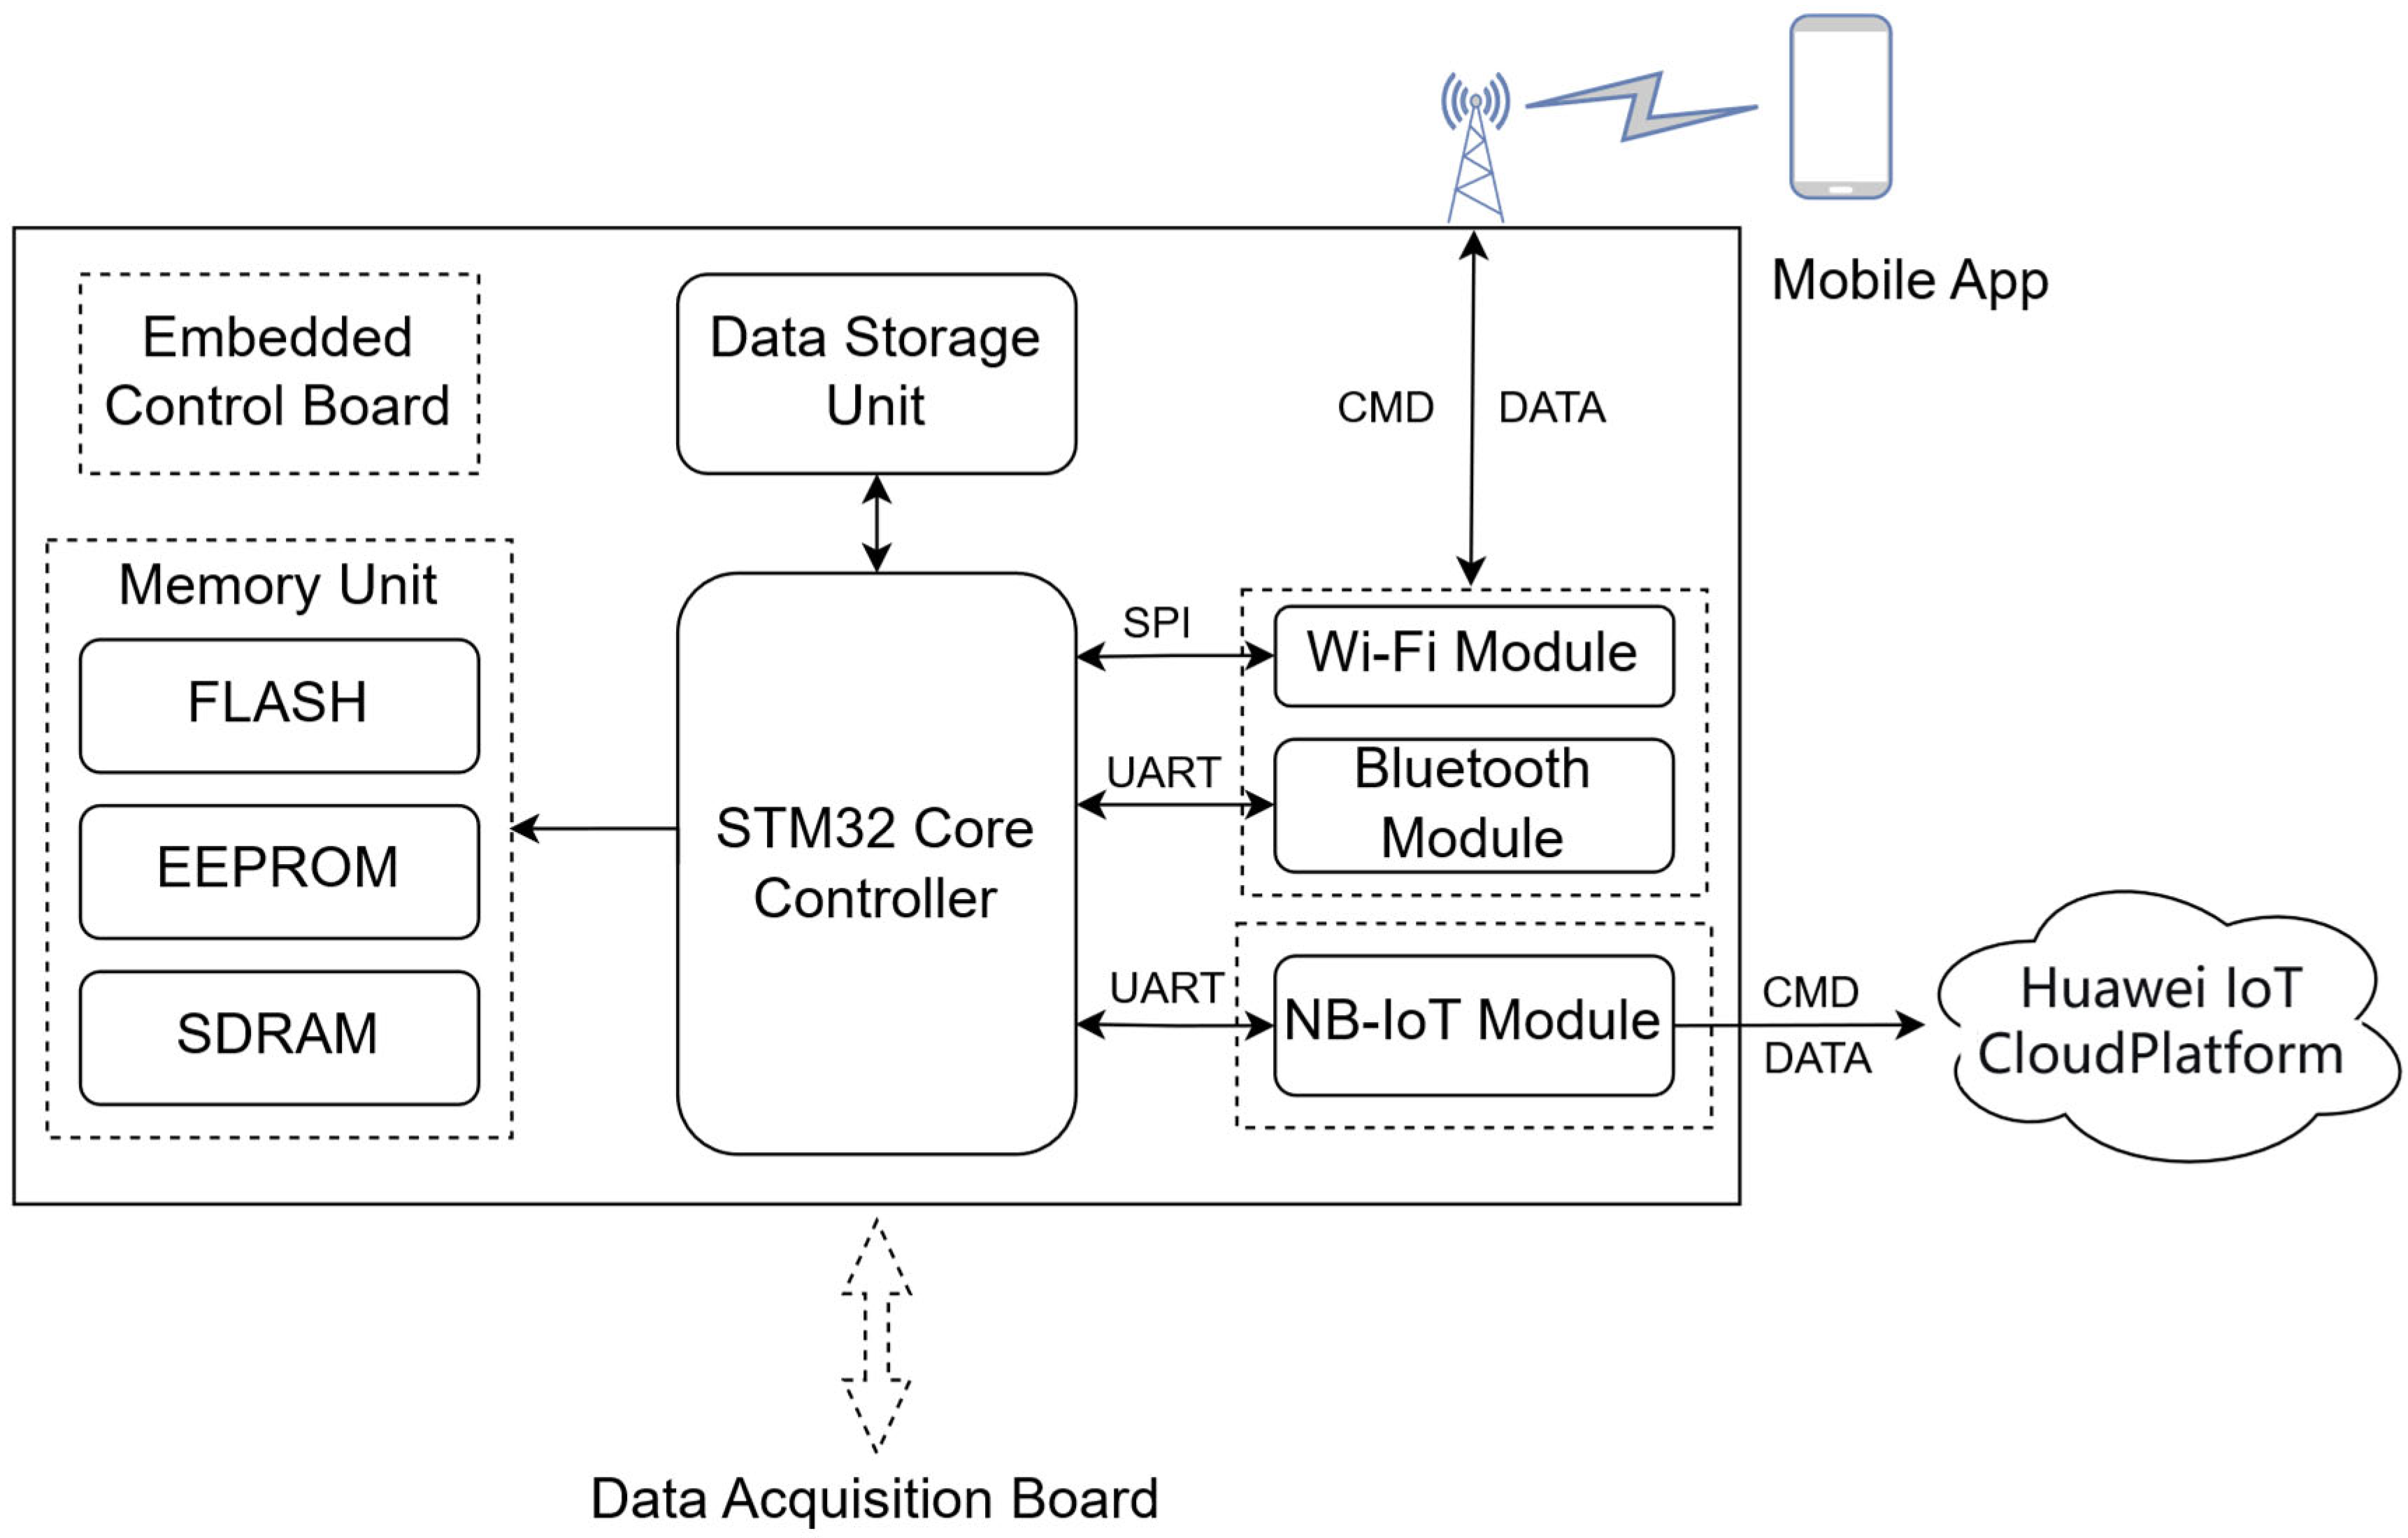
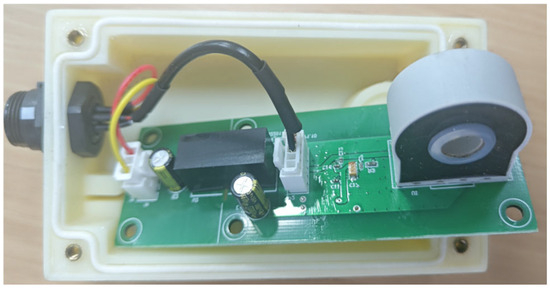
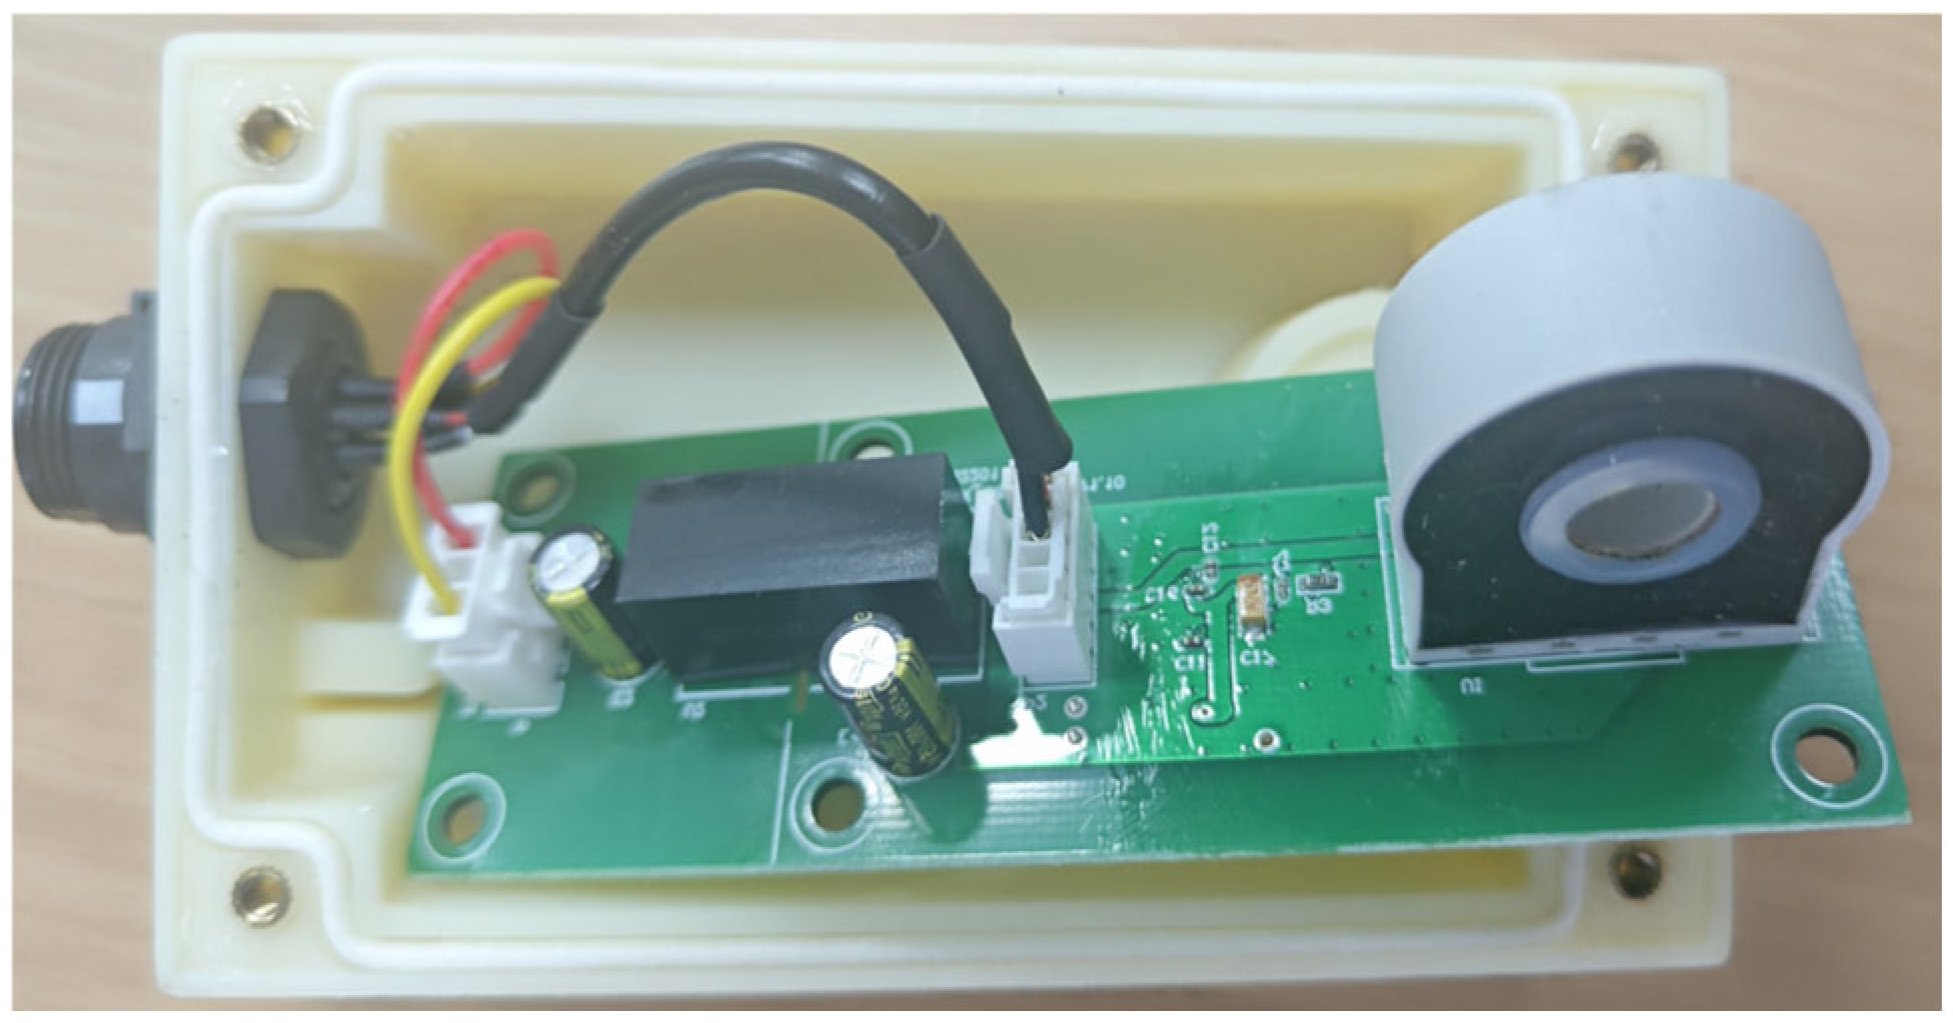
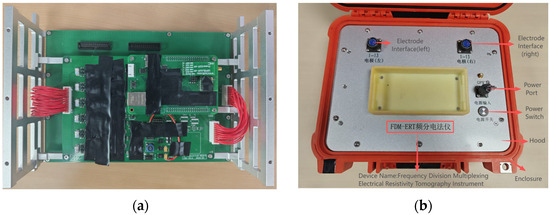
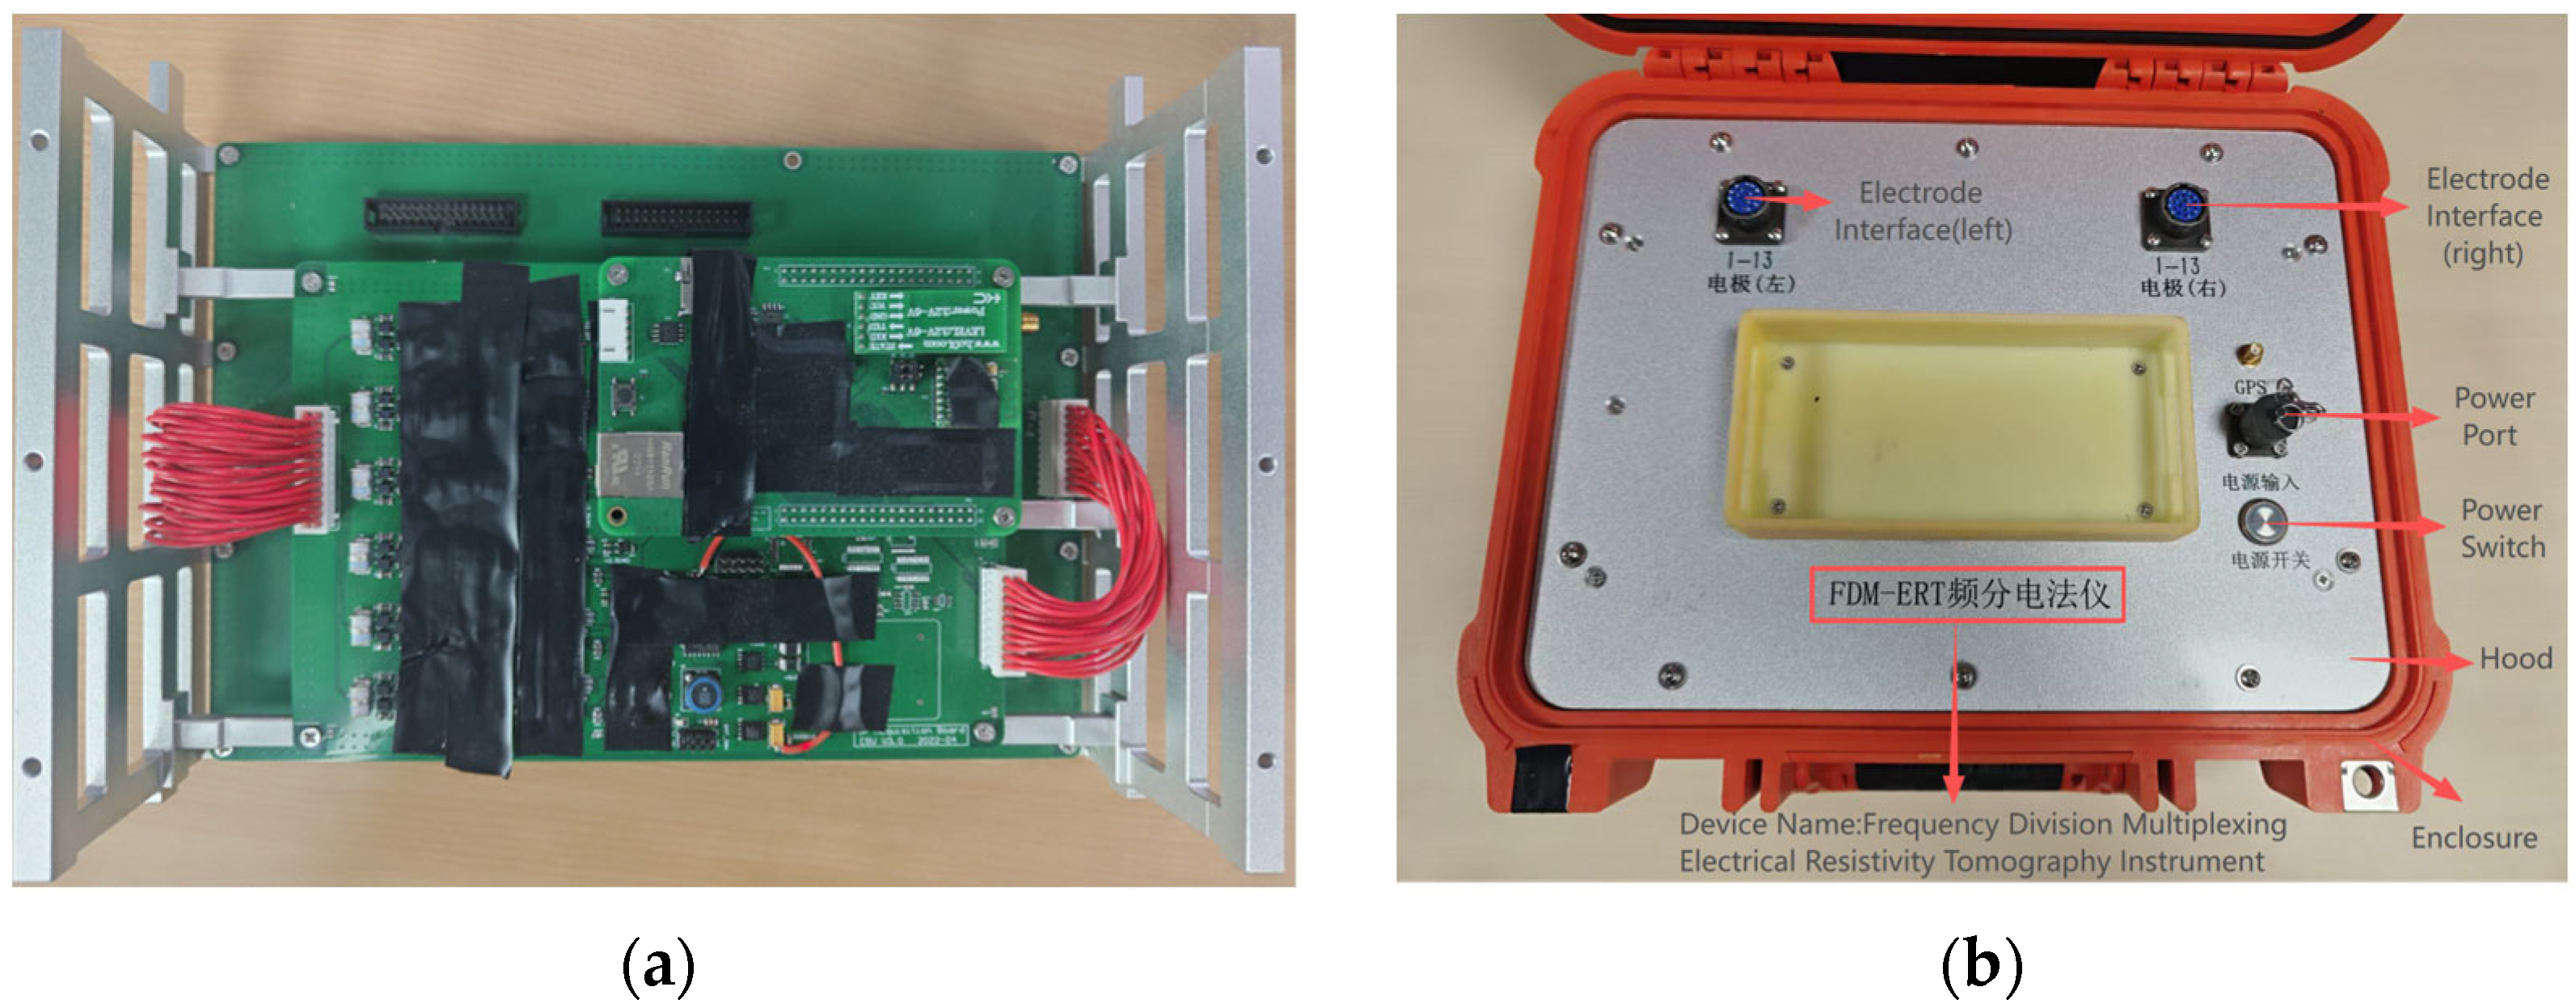
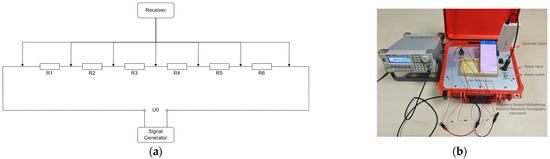
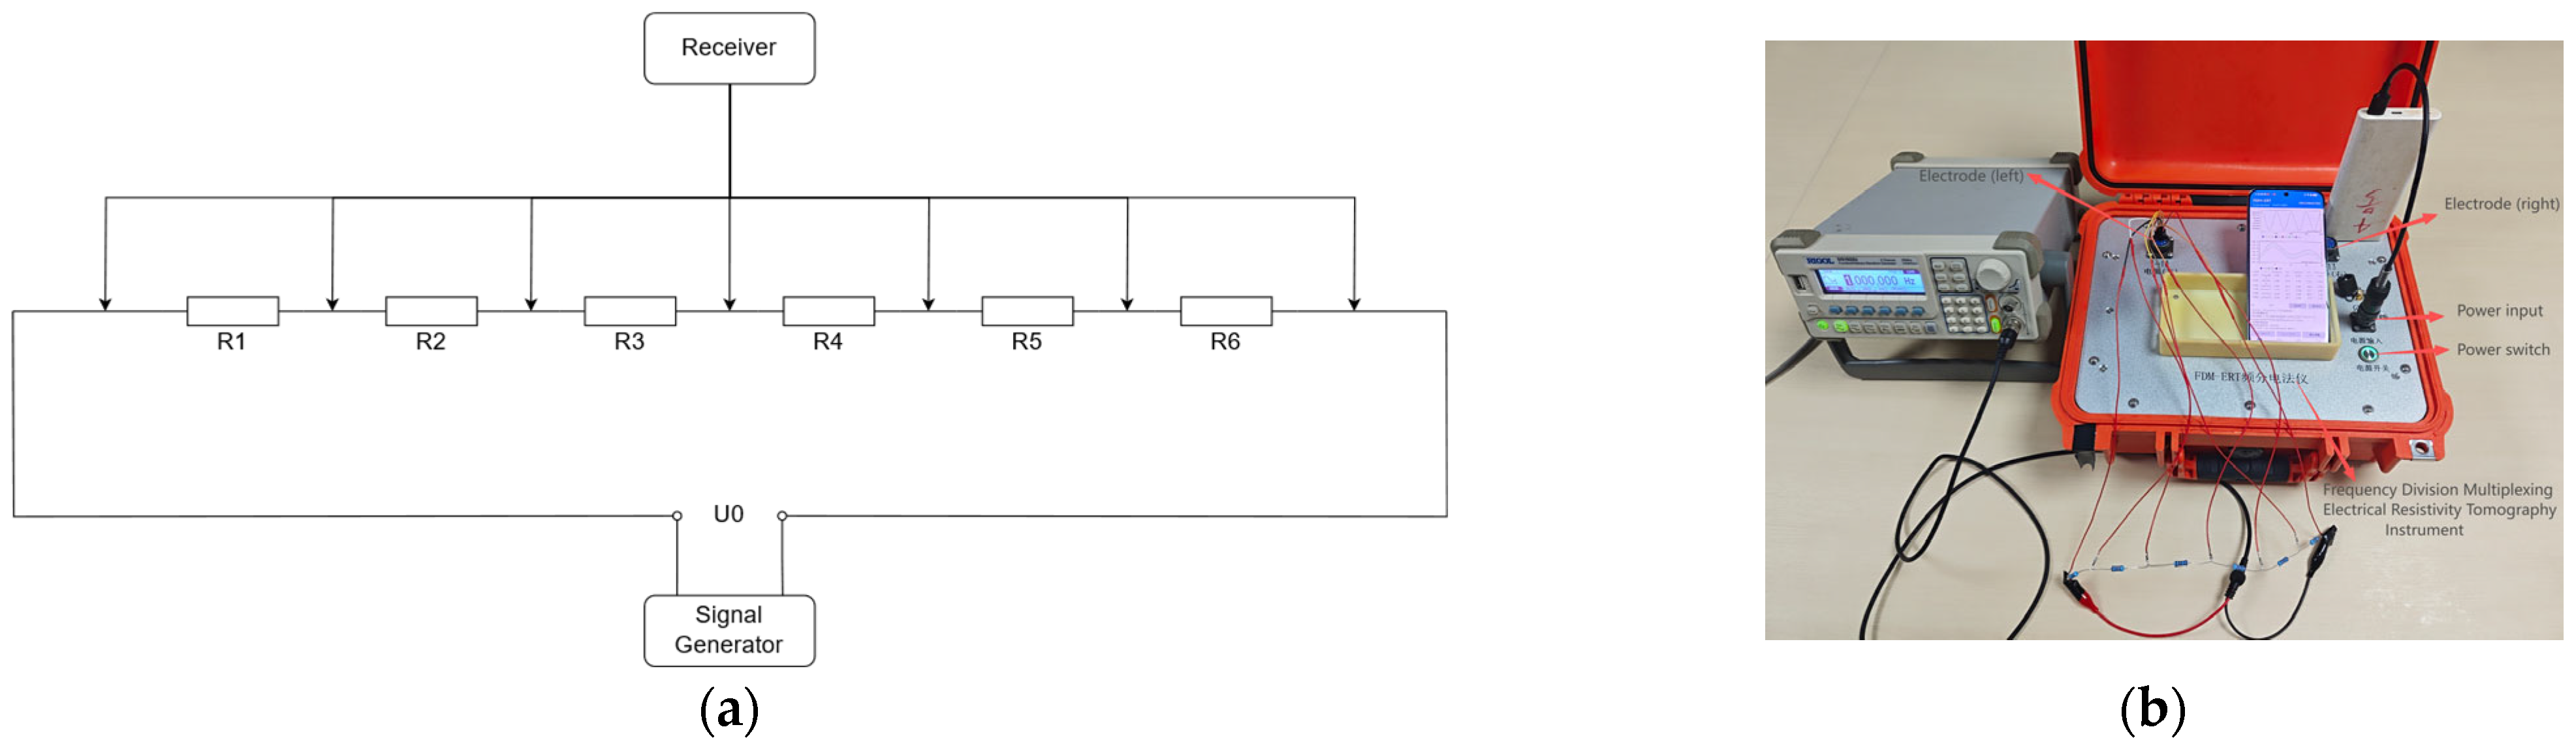
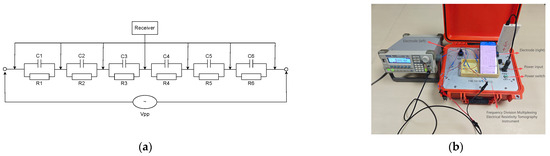
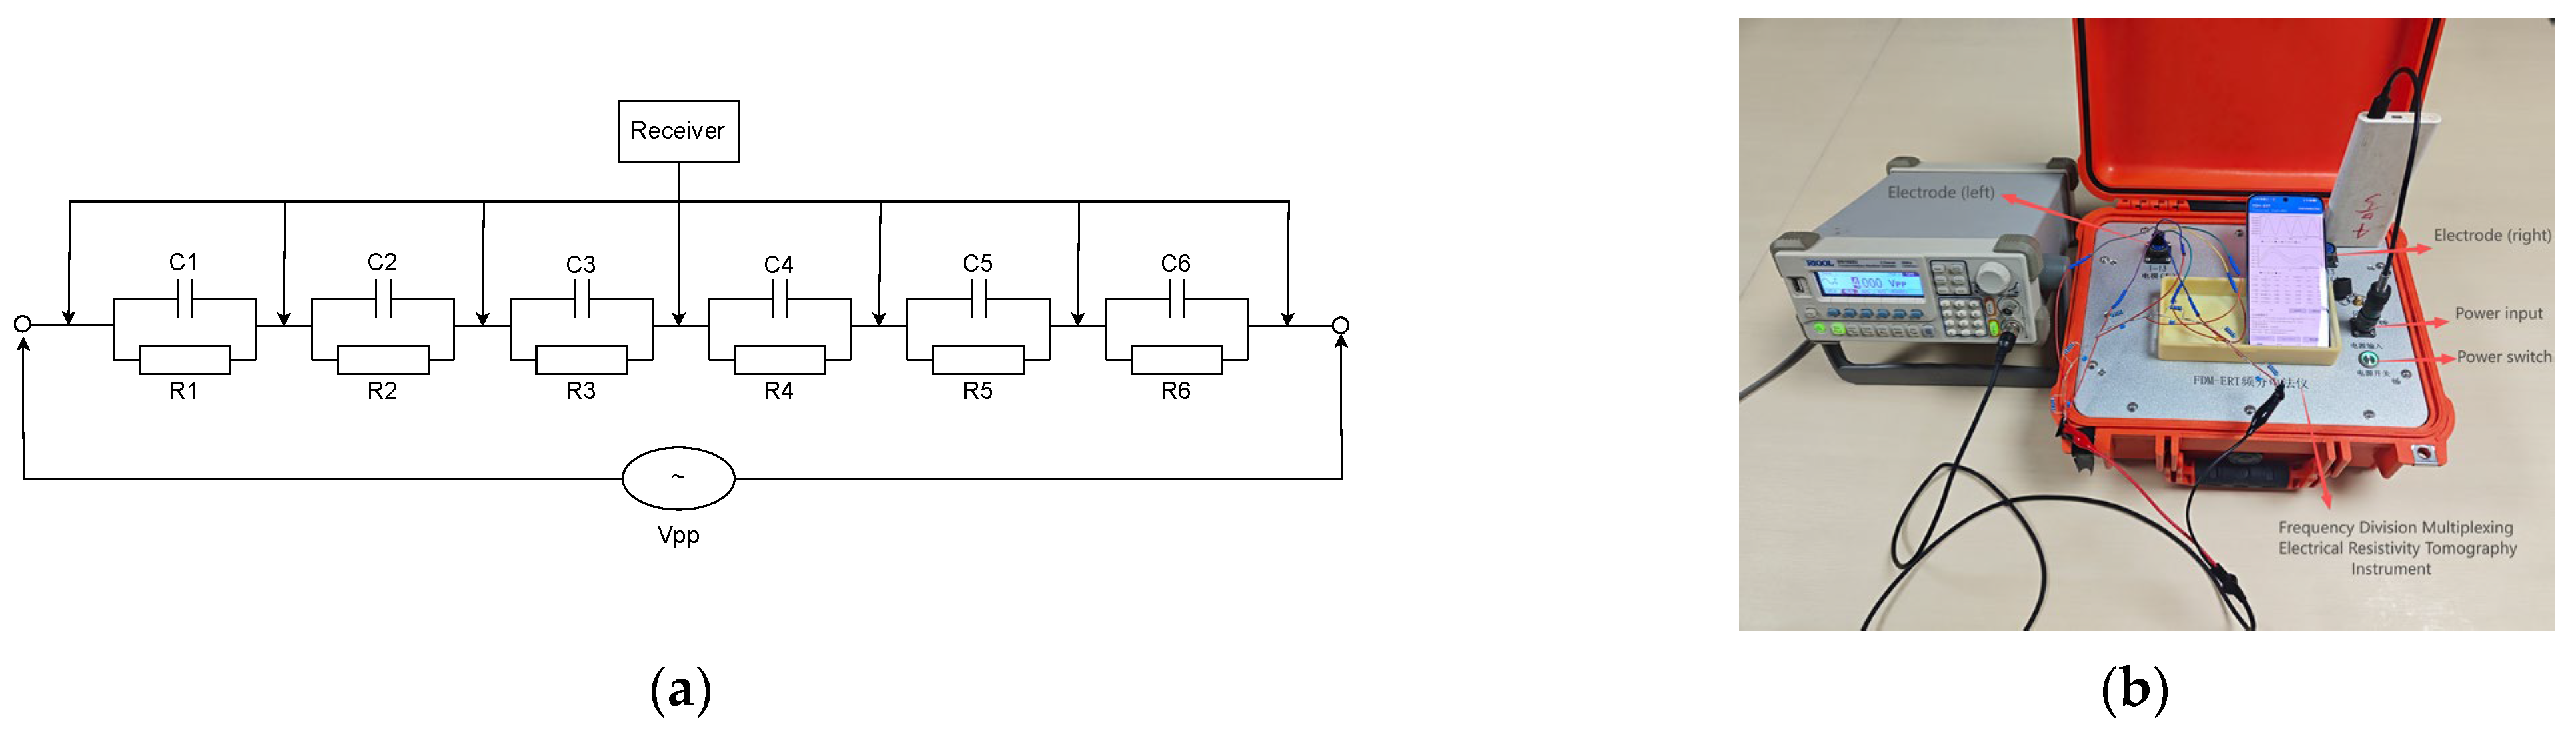
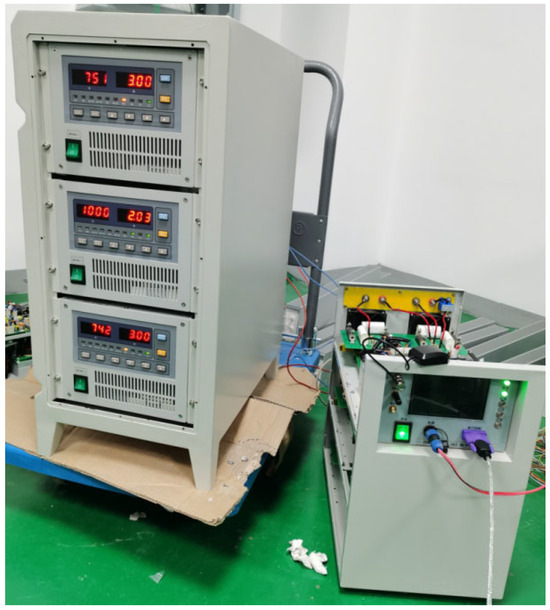
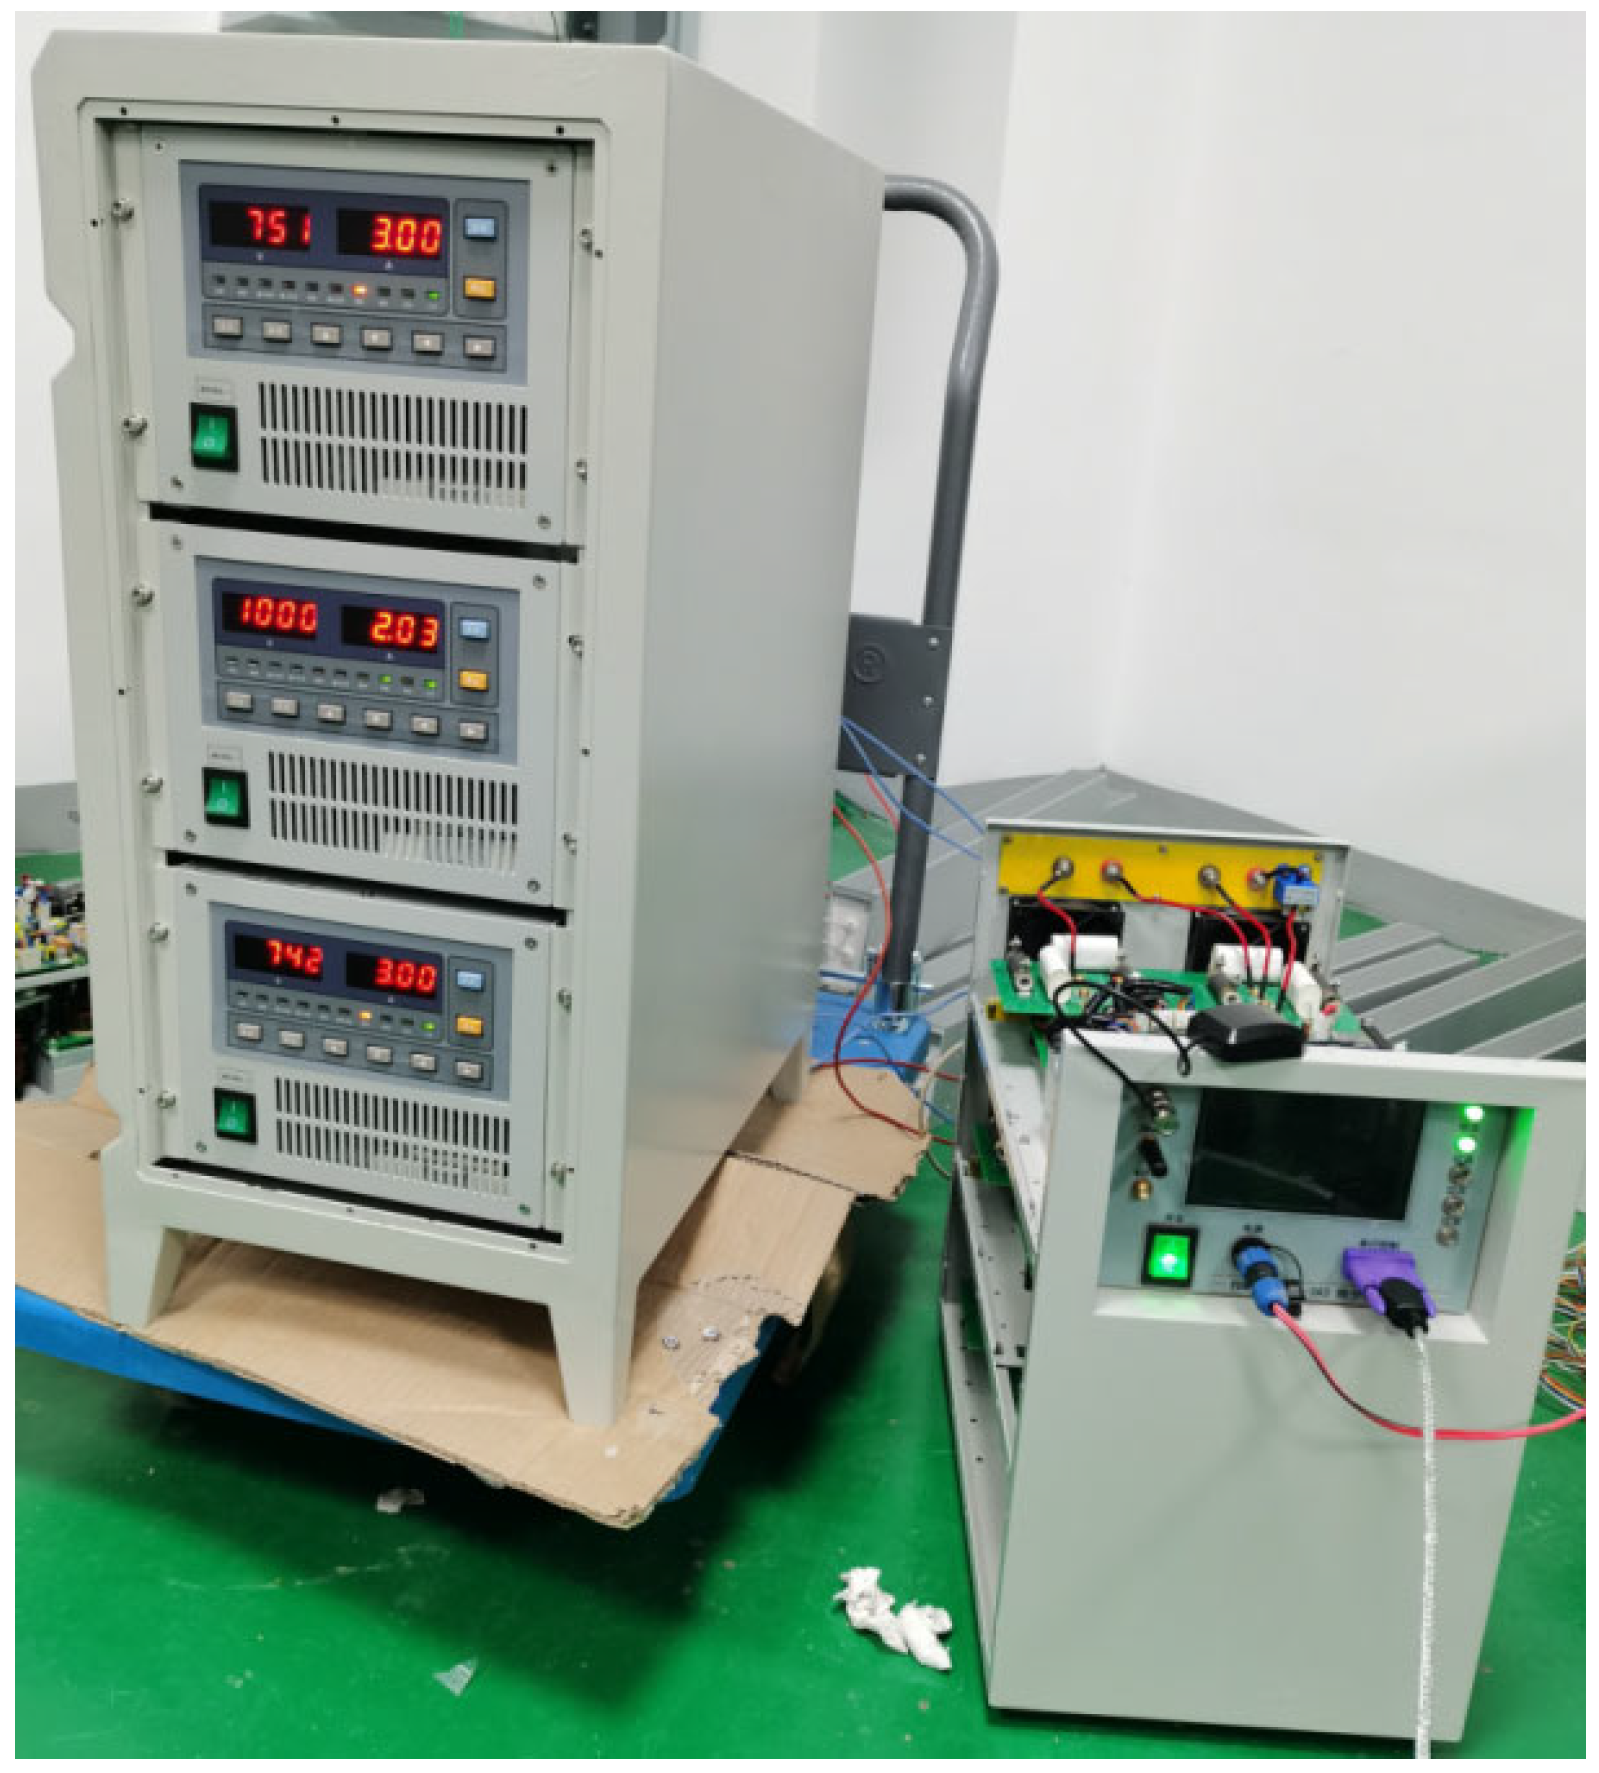


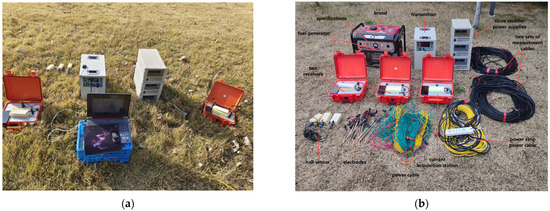
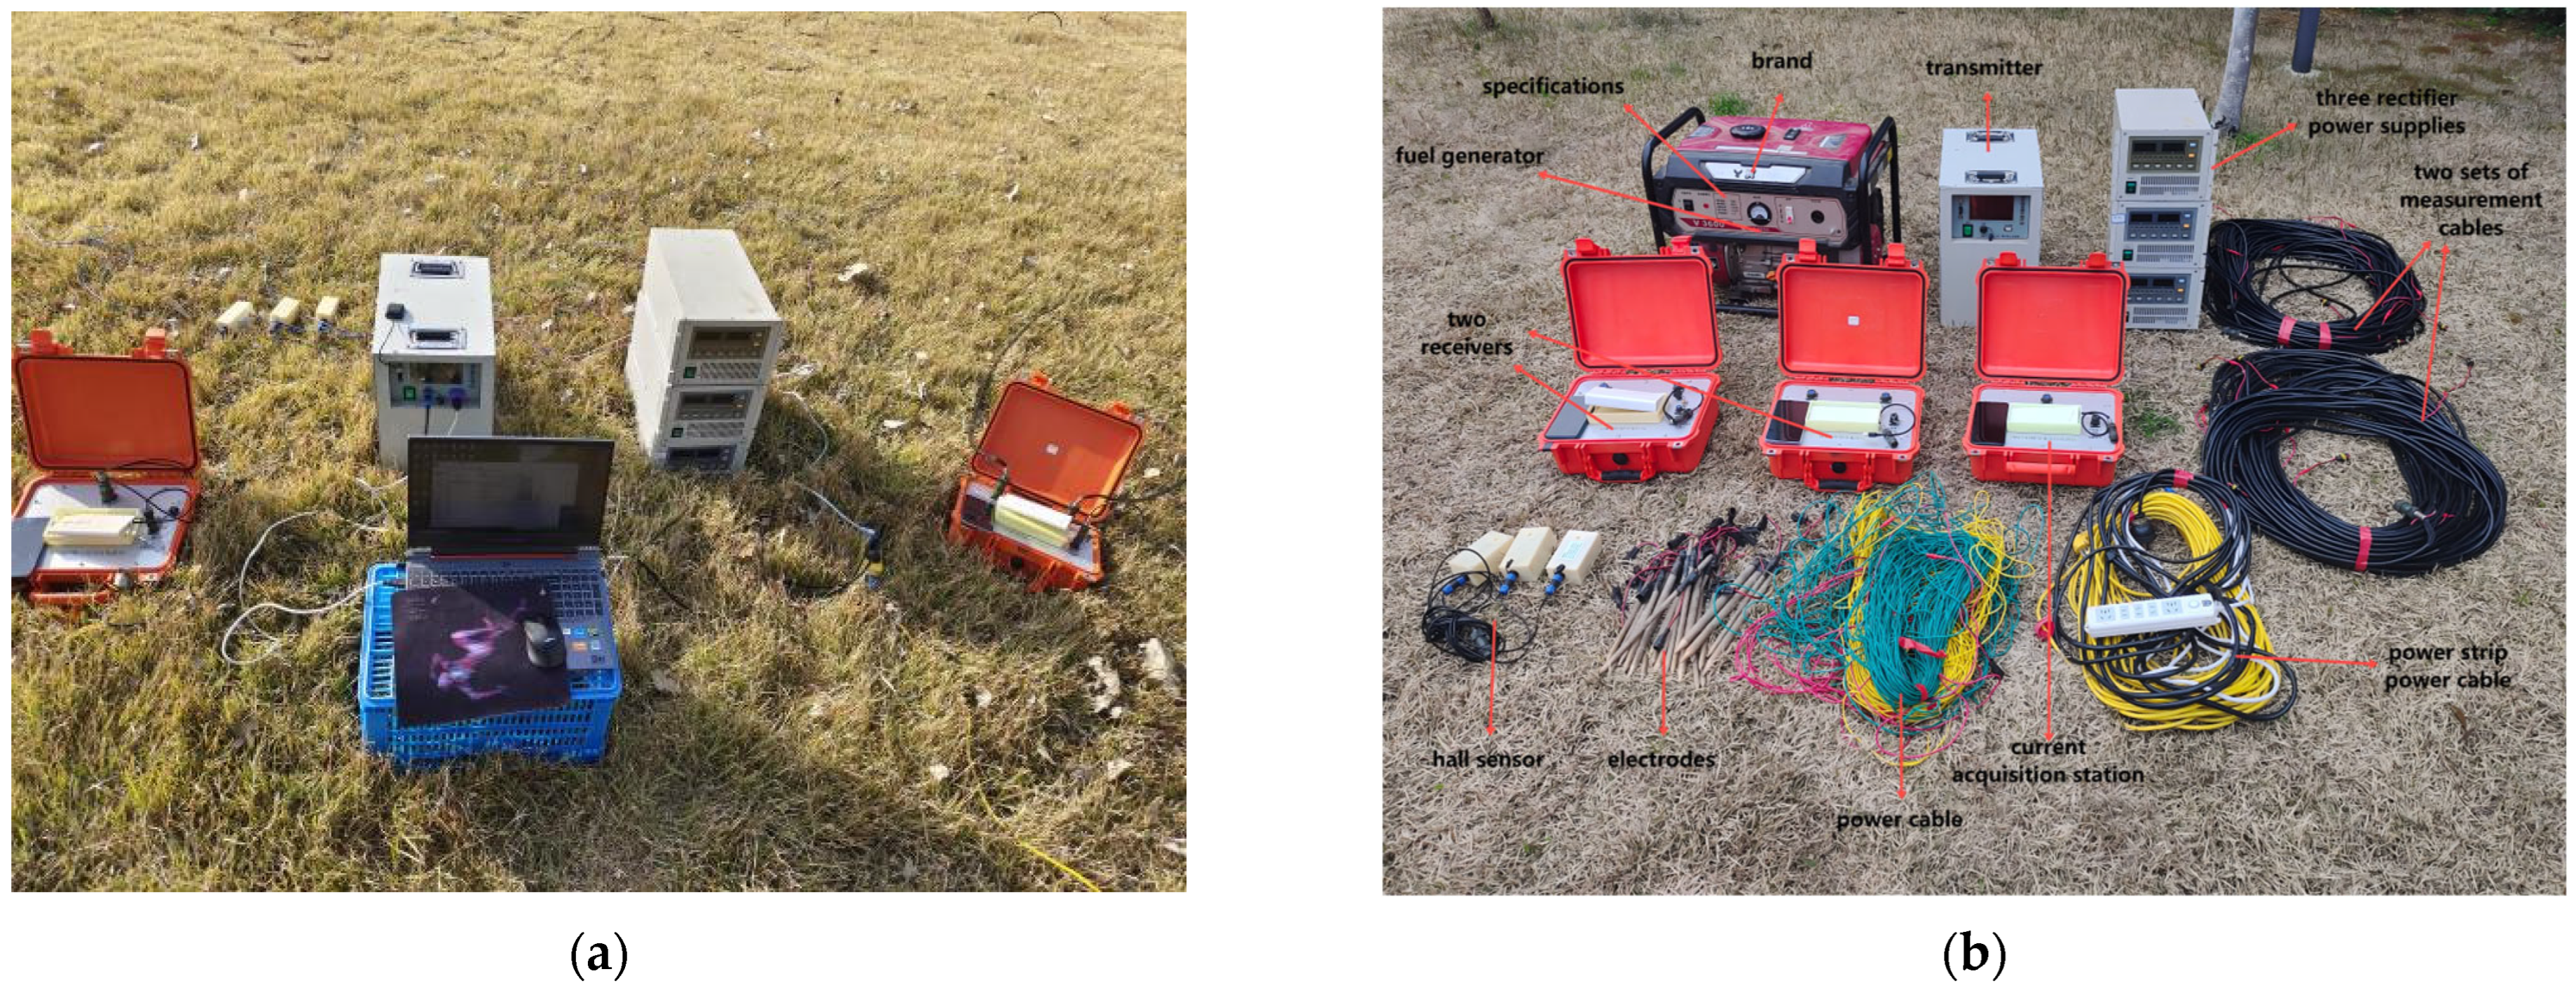
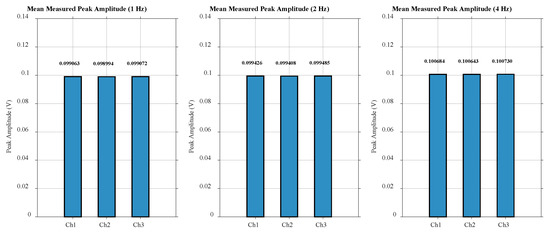
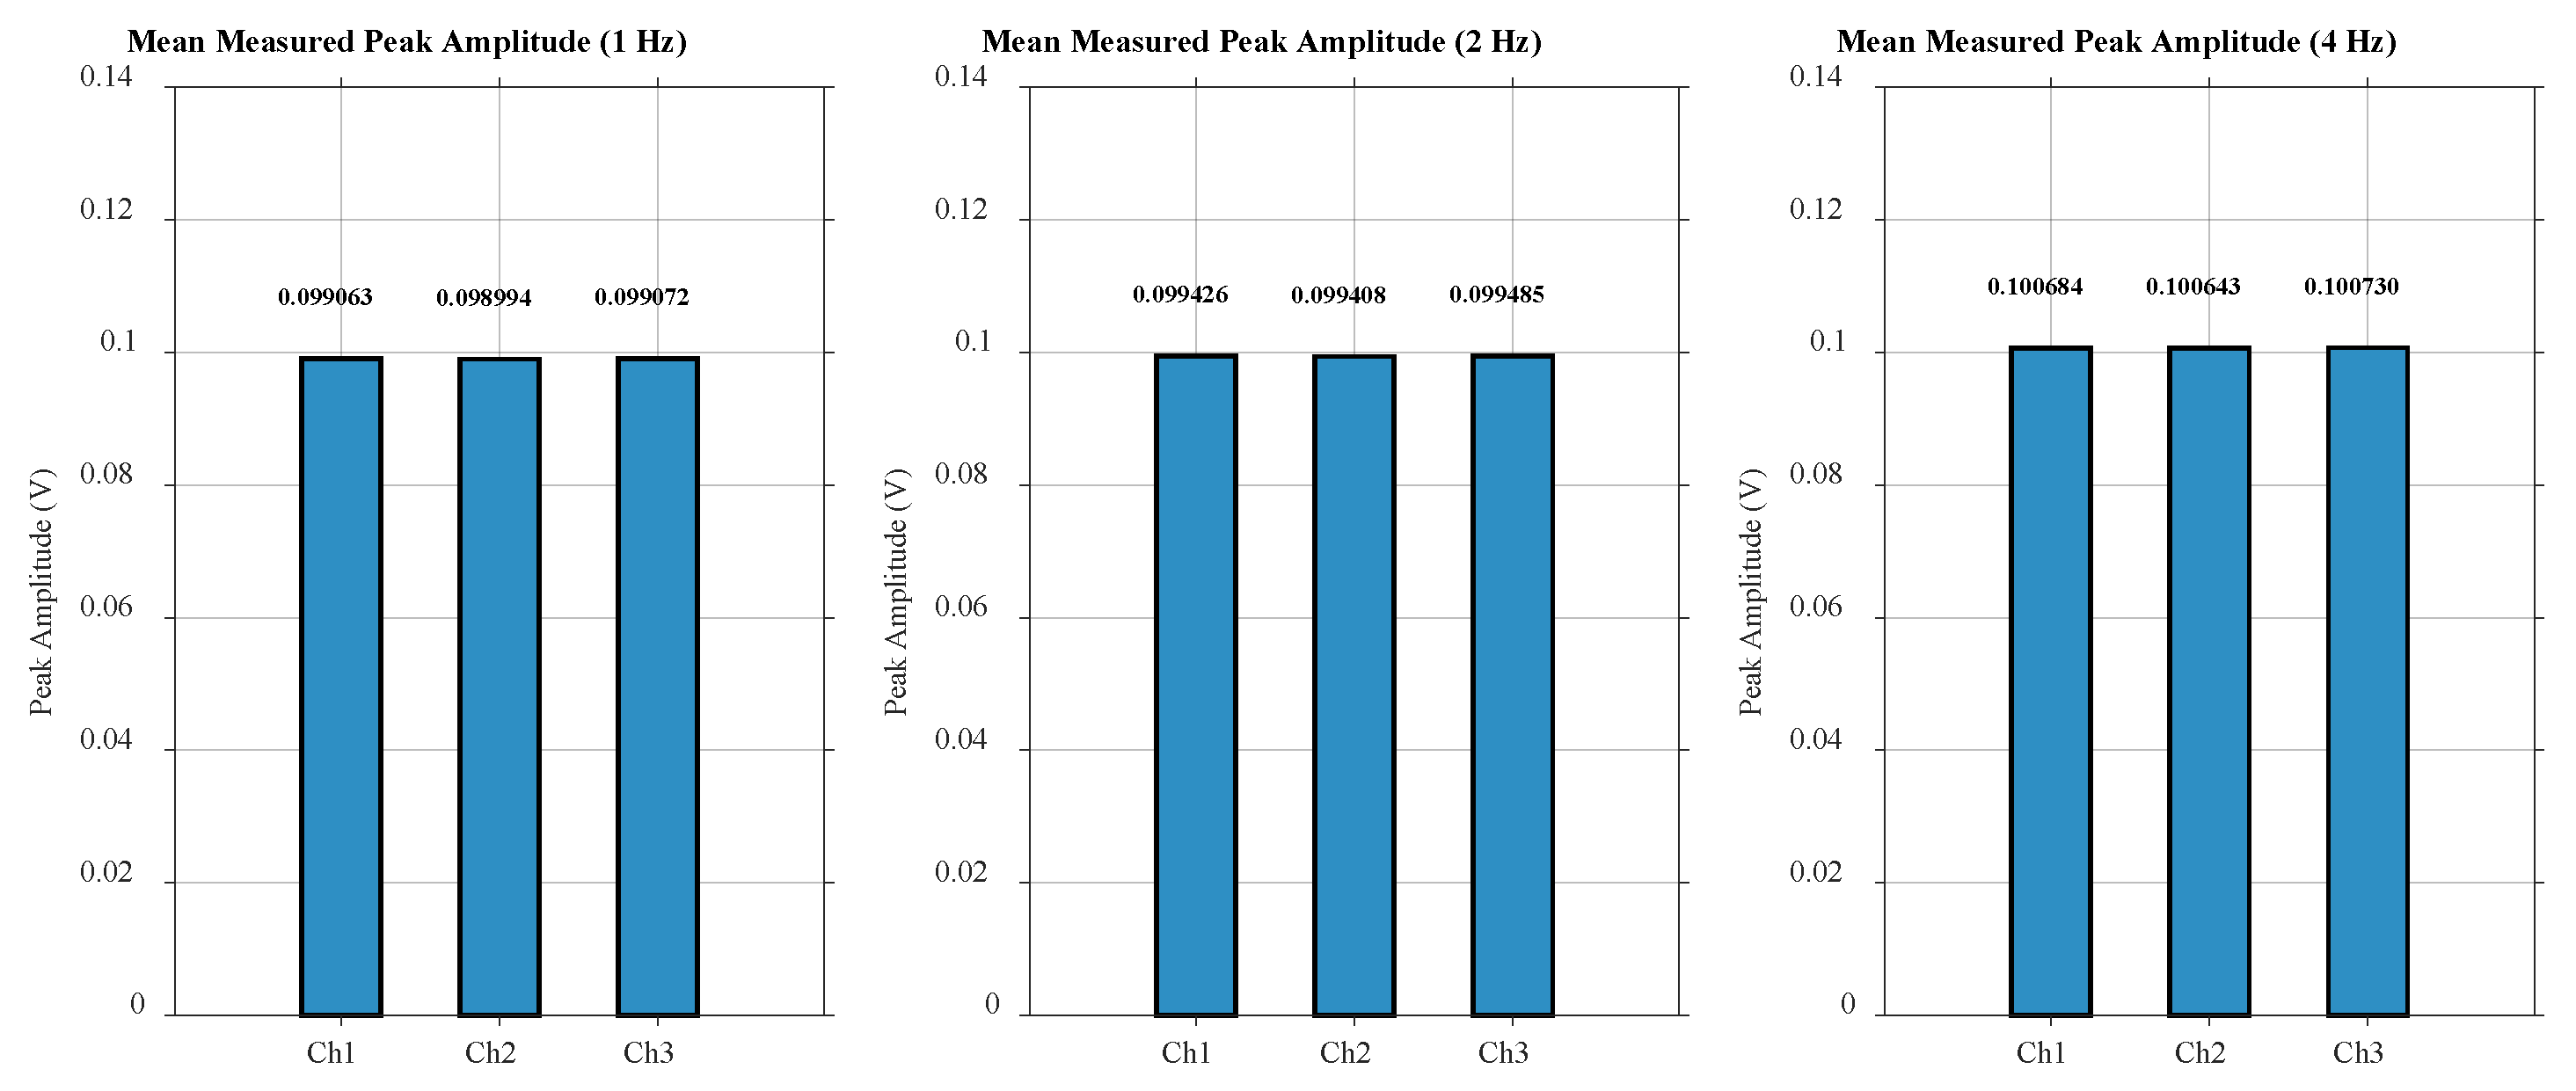
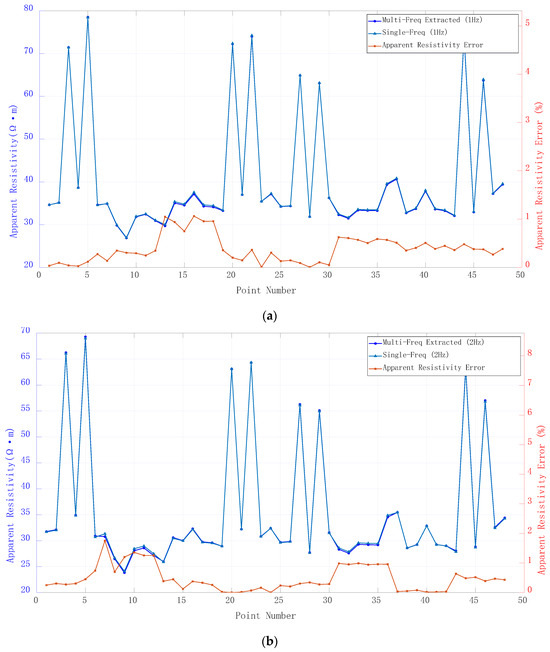
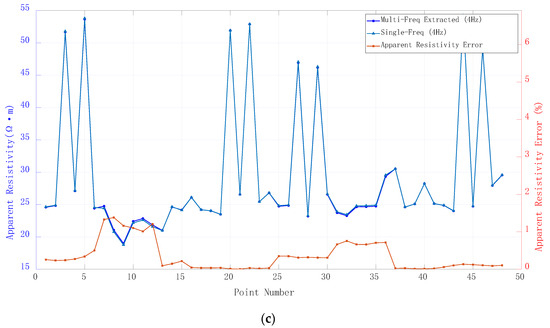
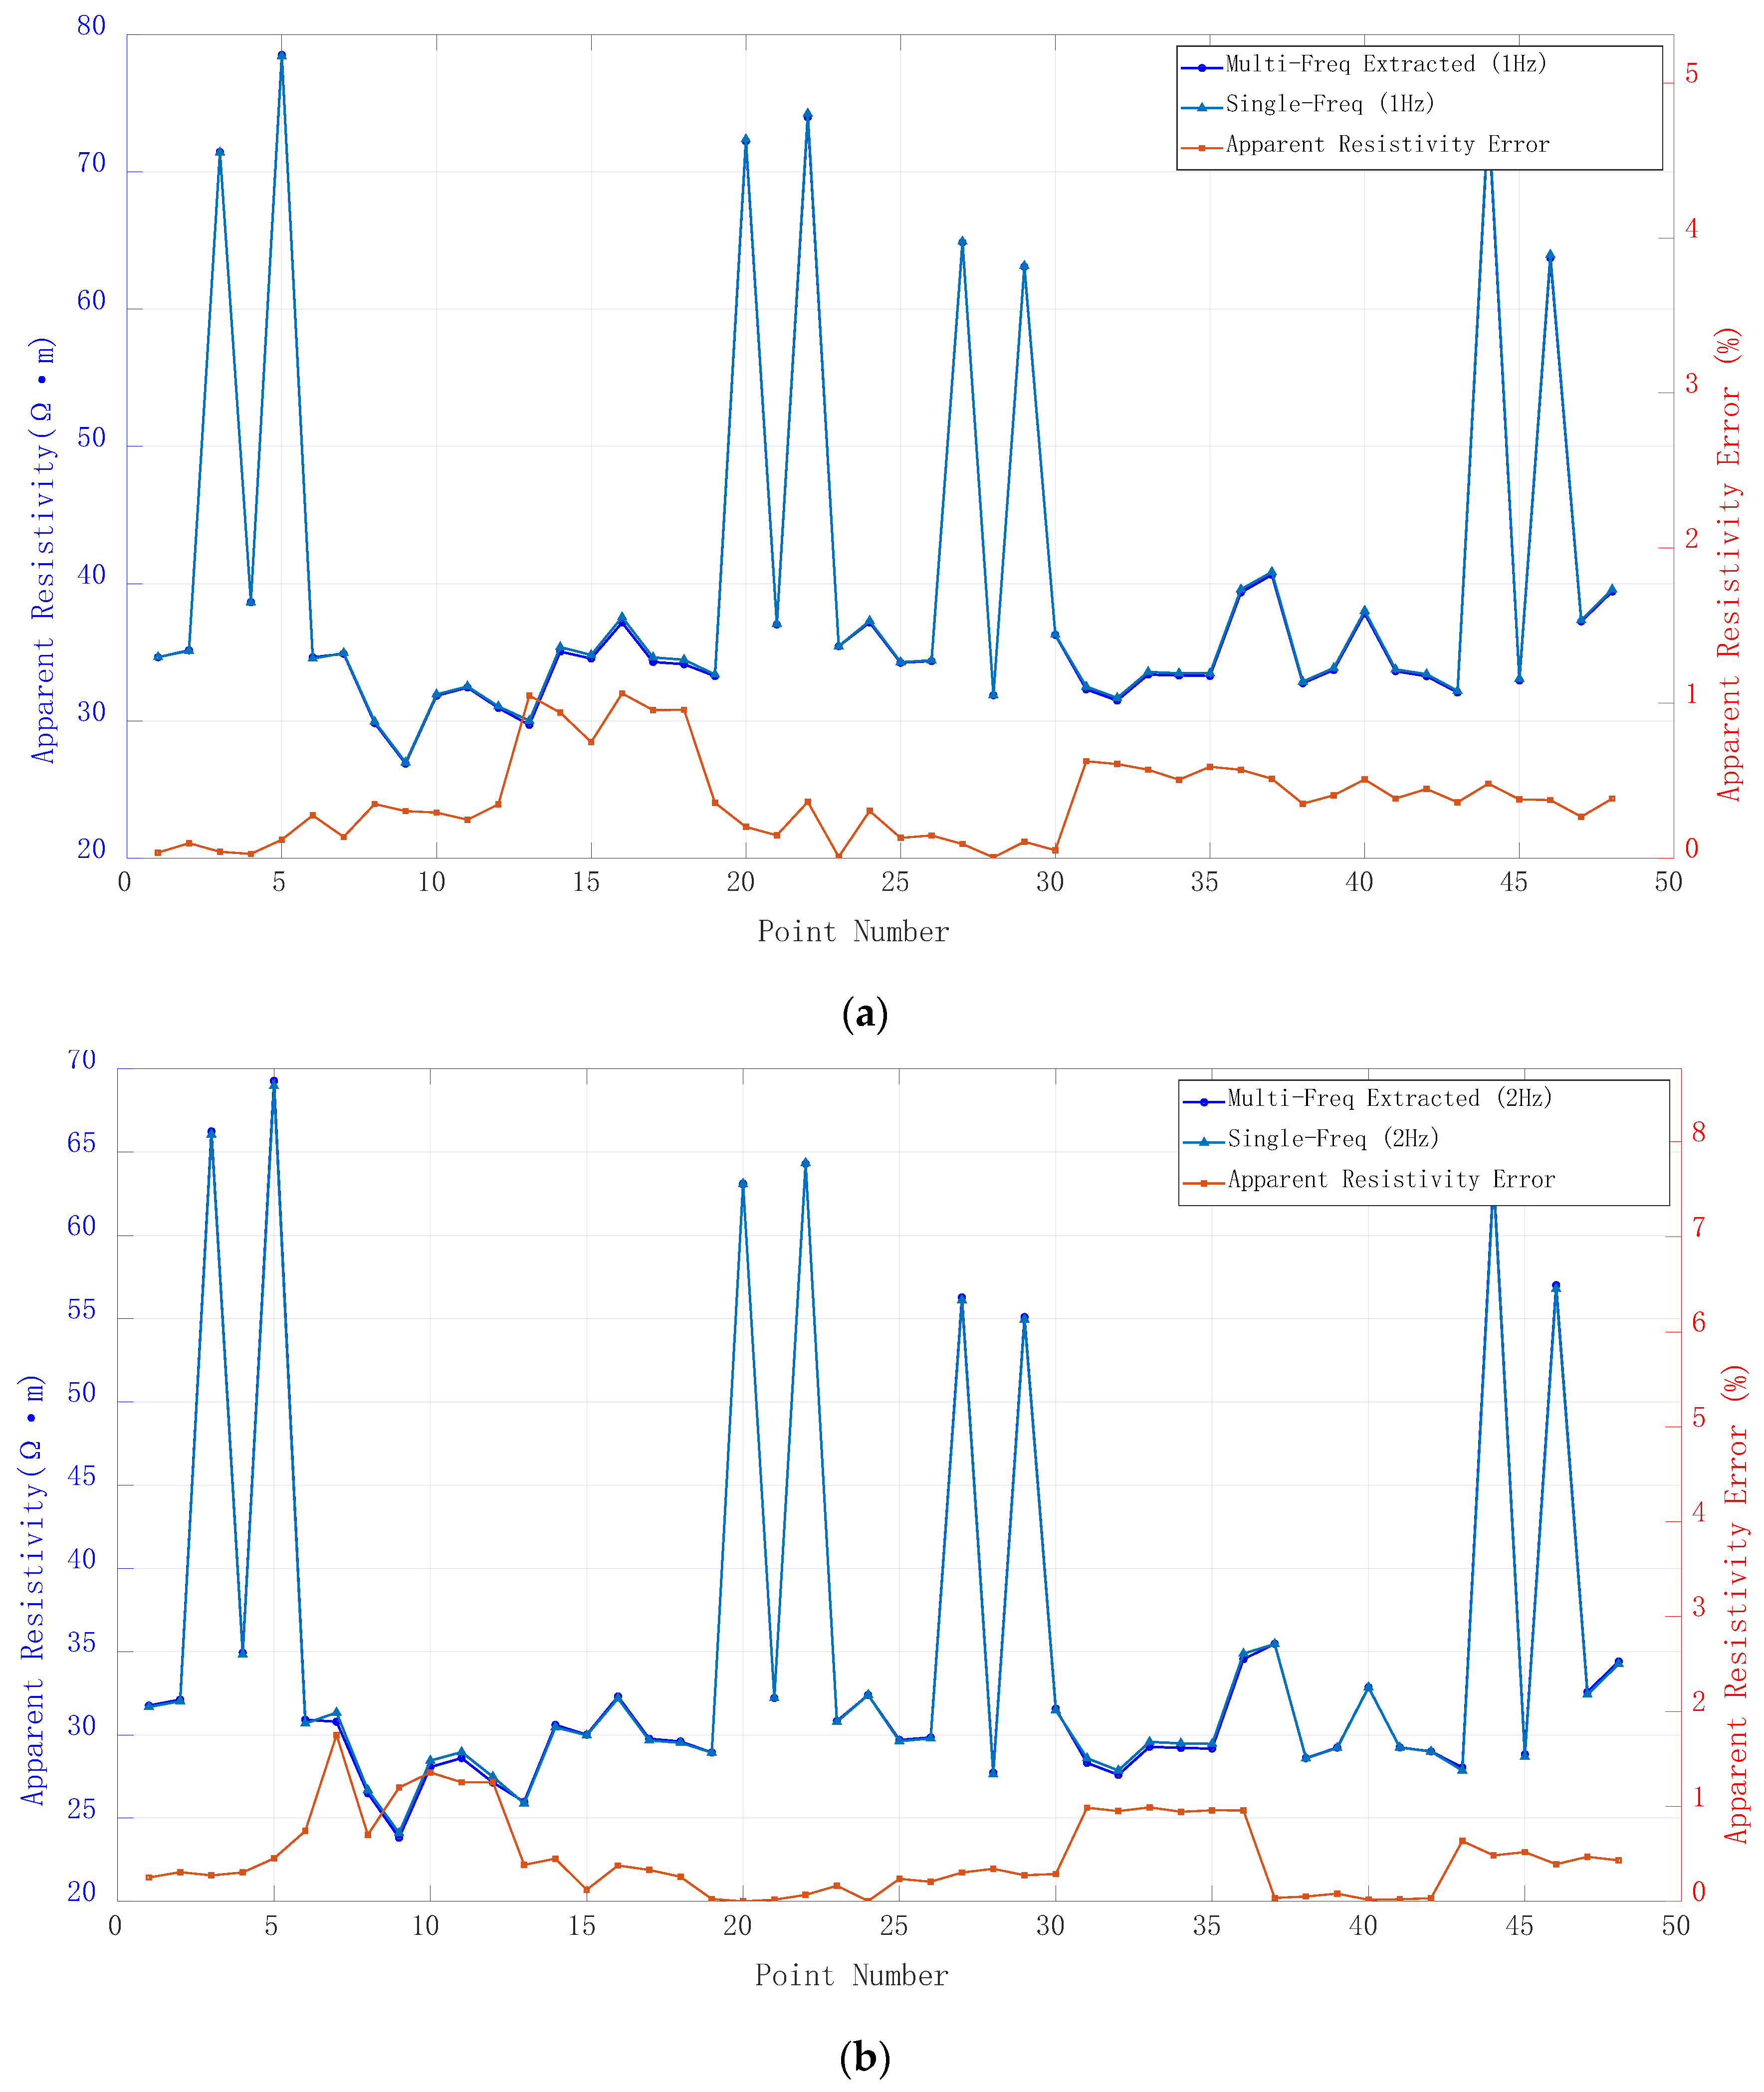
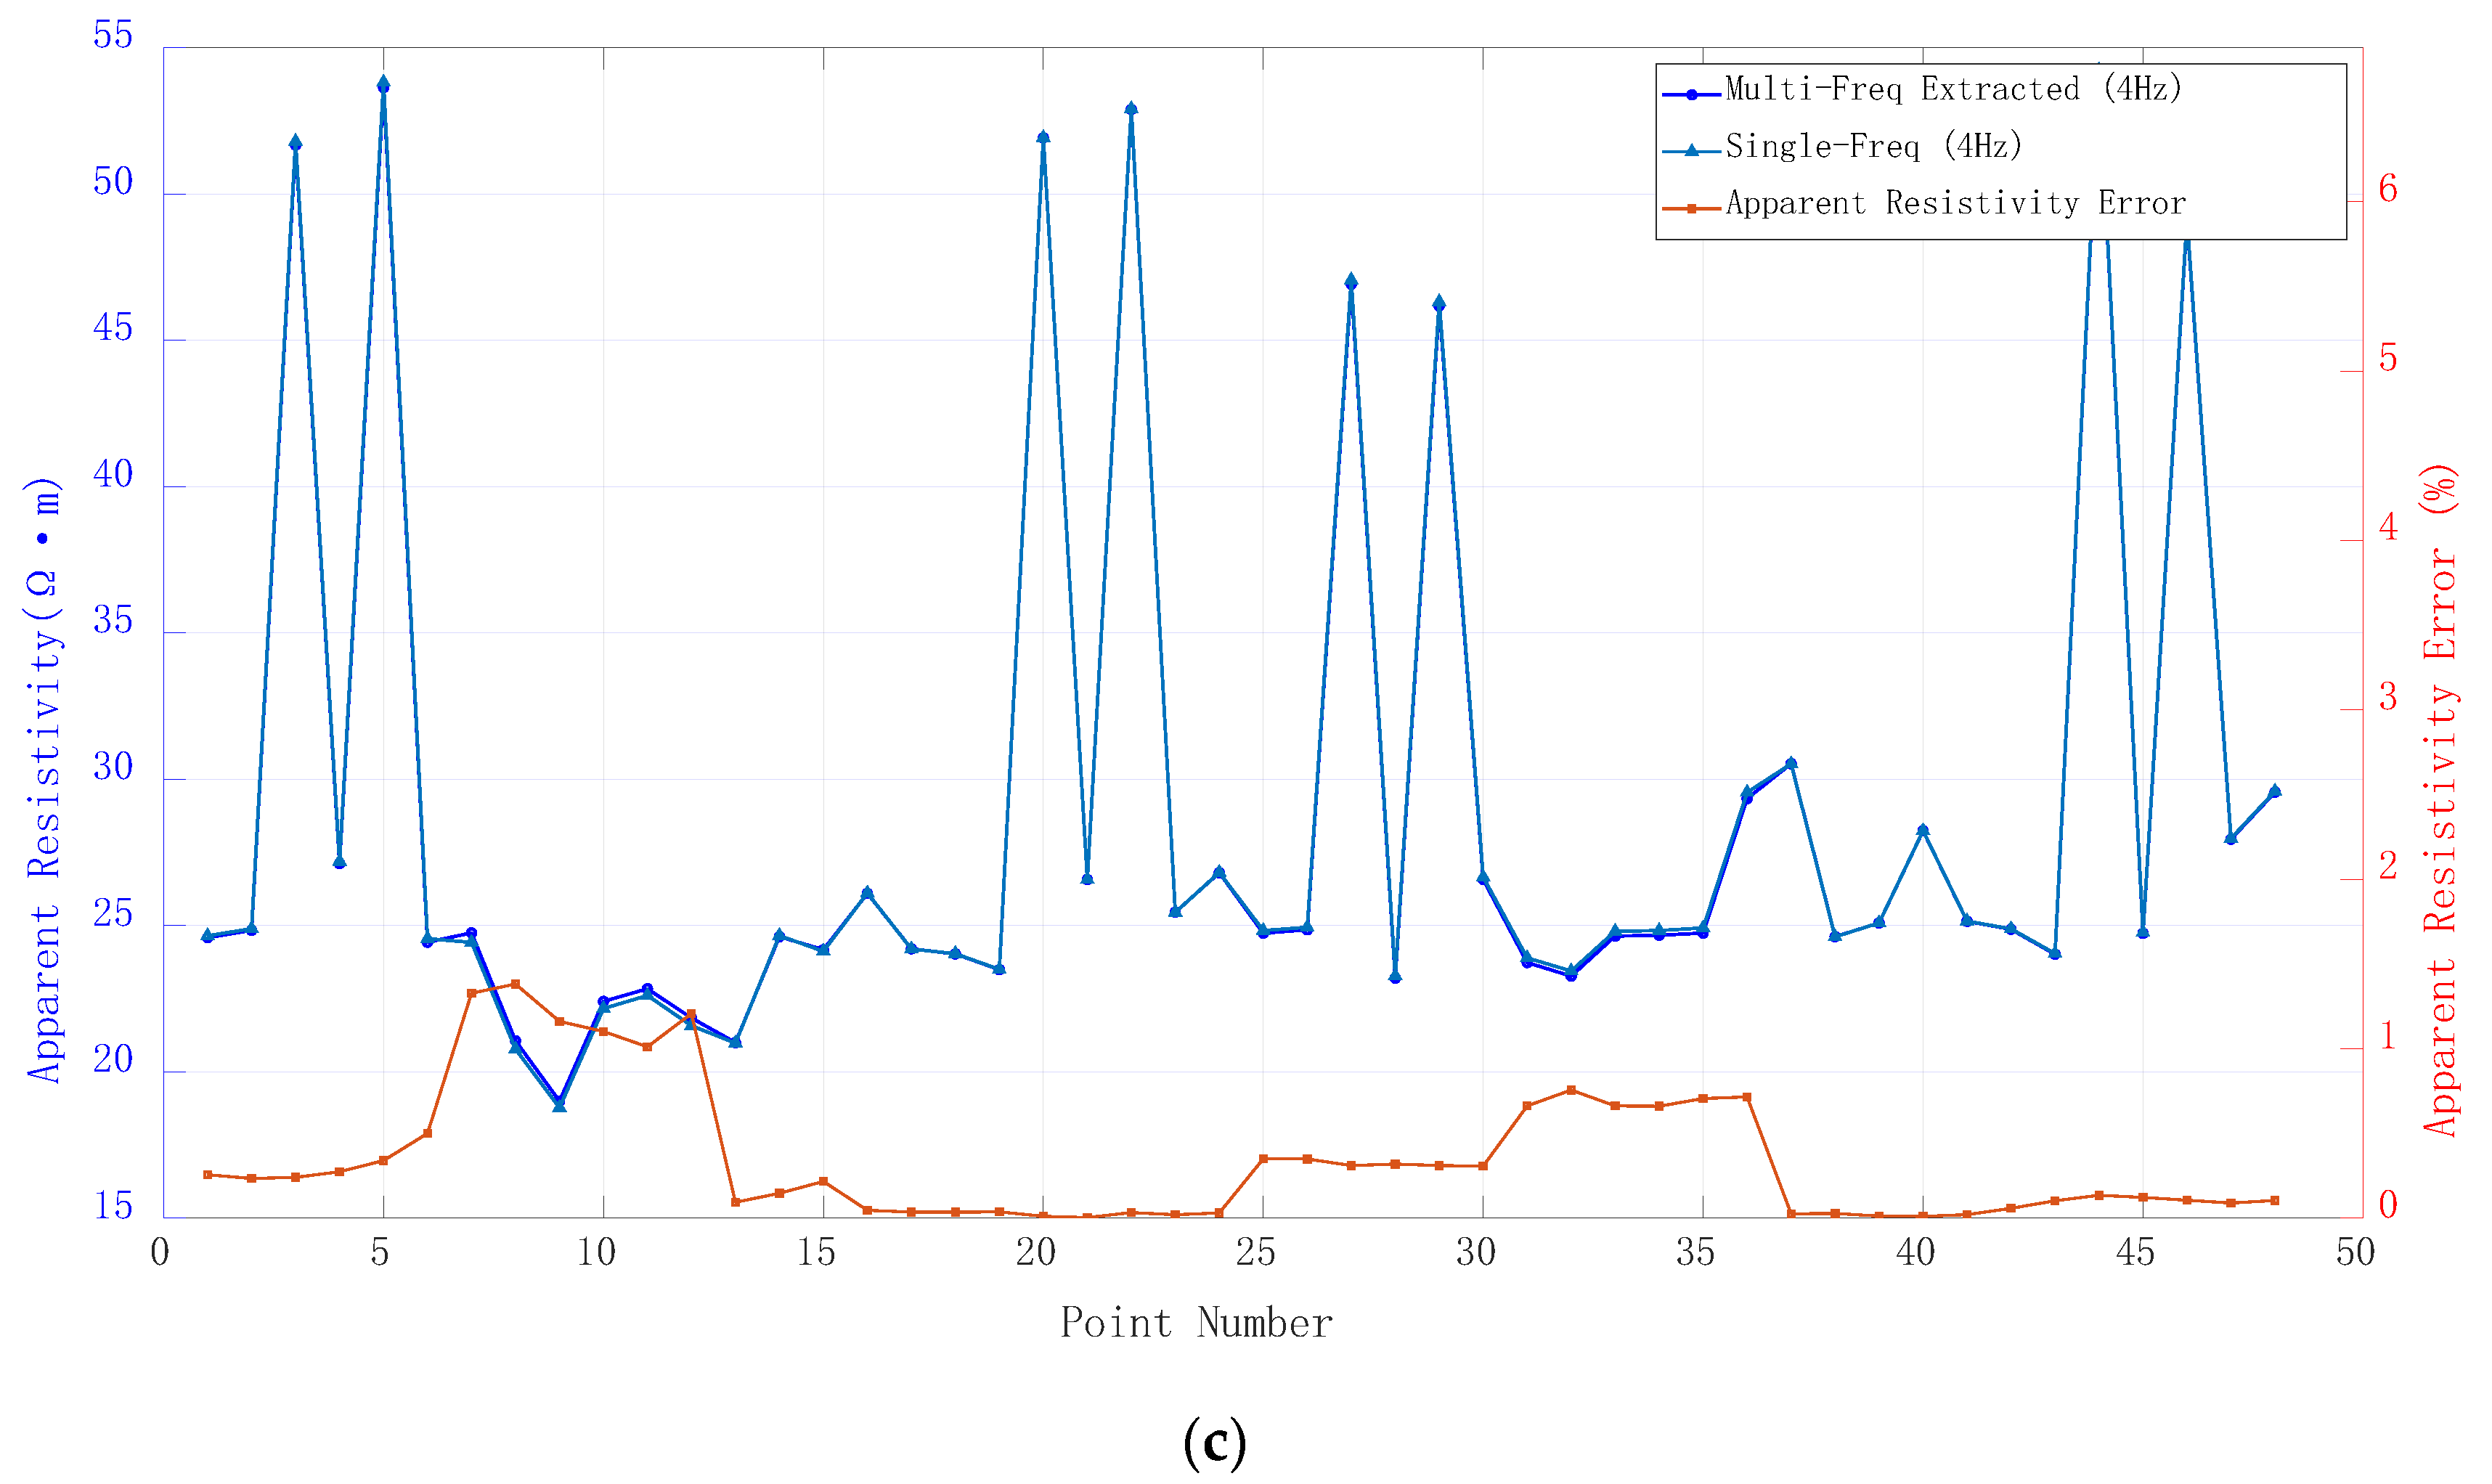
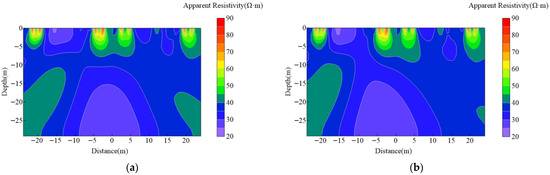
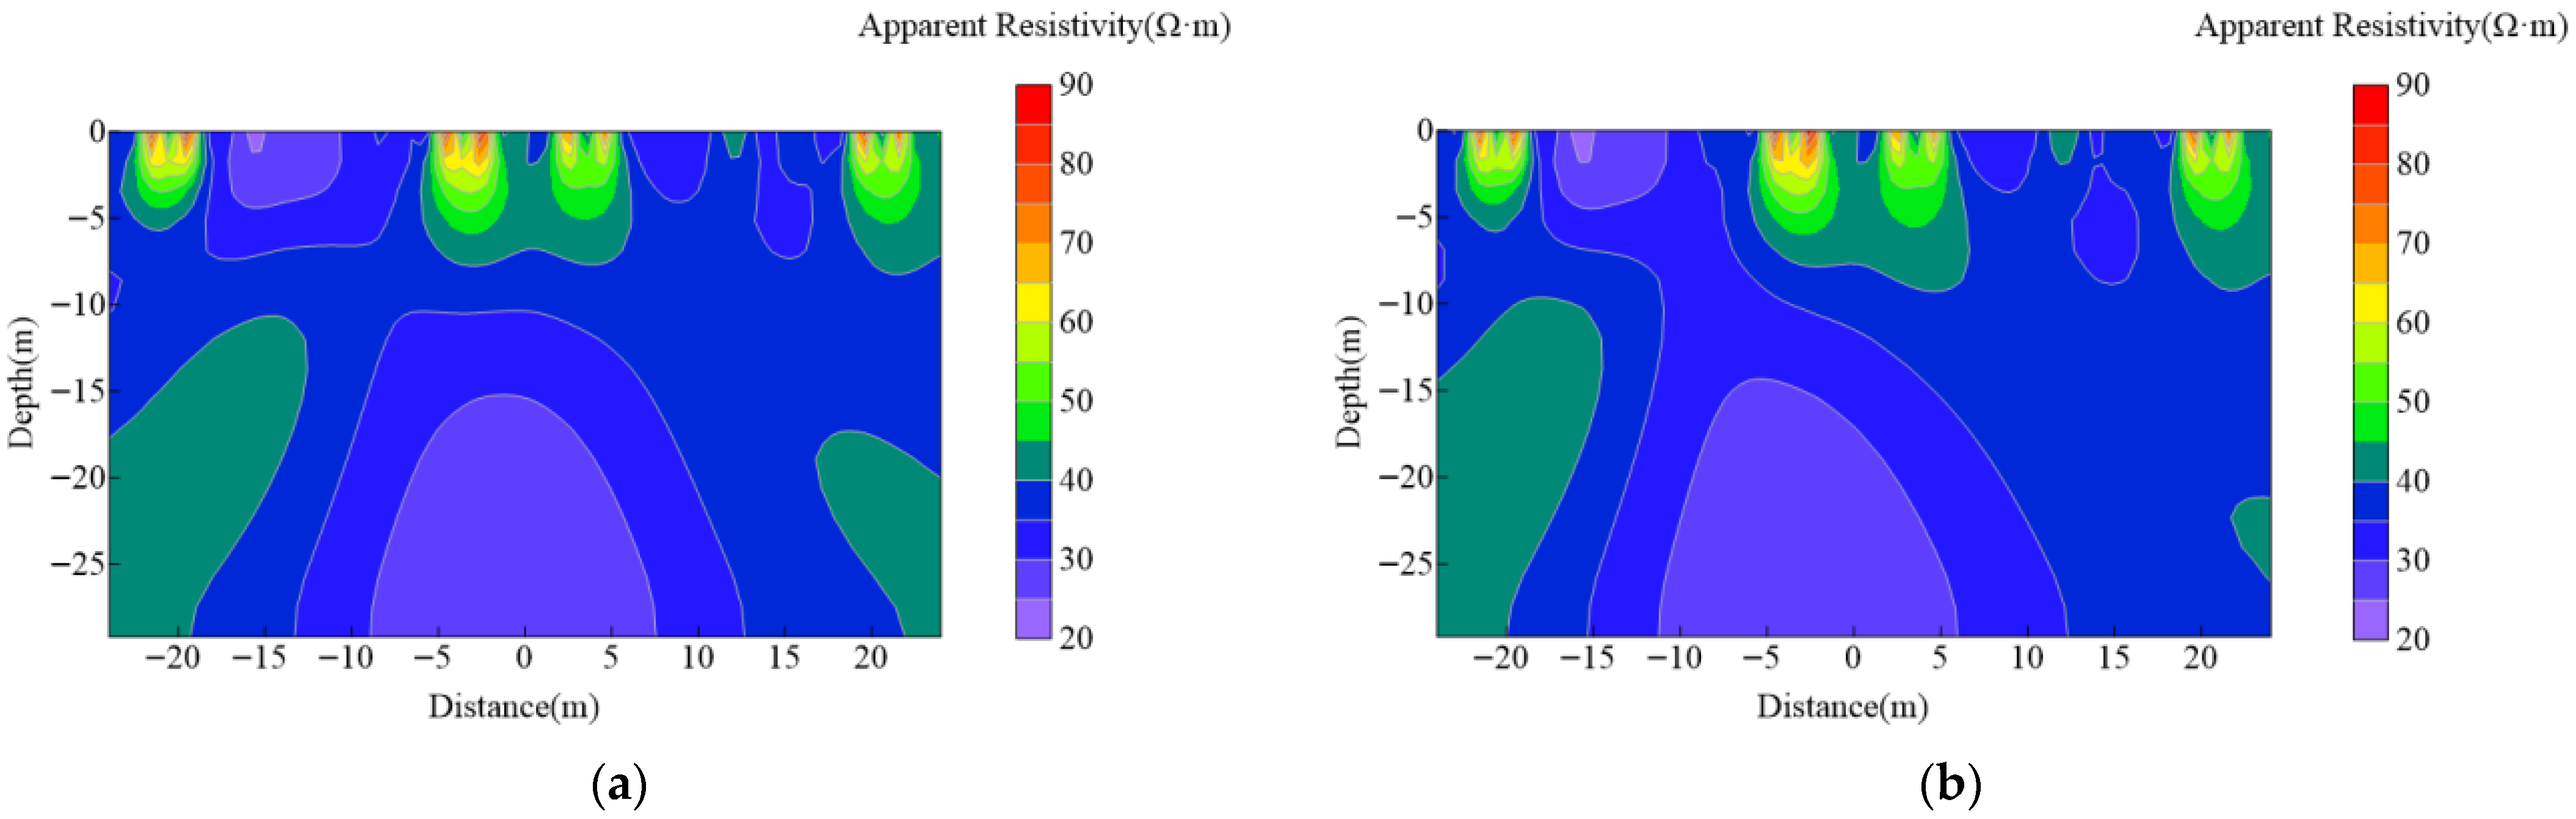

Disclaimer/Publisher’s Note: The statements, opinions and data contained in all publications are solely those of the individual author(s) and contributor(s) and not of MDPI and/or the editor(s). MDPI and/or the editor(s) disclaim responsibility for any injury to people or property resulting from any ideas, methods, instructions or products referred to in the content. |
© 2026 by the authors. Licensee MDPI, Basel, Switzerland. This article is an open access article distributed under the terms and conditions of the Creative Commons Attribution (CC BY) license.