1. Introduction
Urban freight transport plays a crucial role in supporting economic activity, e-commerce, and everyday consumer services in modern cities. At the same time, last-mile logistics is widely recognized as one of the most inefficient and environmentally burdensome segments of the supply chain, contributing disproportionately to traffic congestion, greenhouse gas emissions, noise pollution, and energy consumption. These challenges are further intensified by increasing urbanization, rising customer expectations for fast and flexible delivery, and increasingly strict environmental regulations imposed on urban transport systems.
In response to these pressures, cities and logistics service providers have begun to explore alternative delivery concepts aimed at reducing the environmental footprint of last-mile distribution while maintaining acceptable service levels. Micromobility-based delivery systems, such as cargo bikes, electric scooters, and small electric vehicles, have emerged as promising solutions, particularly in dense urban environments where conventional vans face spatial, regulatory, and congestion-related constraints. Empirical and modeling studies consistently indicate that micromobility solutions can significantly reduce CO2 emissions, energy consumption, and local externalities, especially when compared to diesel-based delivery fleets.
Despite their environmental advantages, the operational performance of micromobility-based delivery systems strongly depends on how resources are allocated and managed under dynamic urban conditions. Many existing last-mile logistics models rely on static or offline planning assumptions, such as deterministic demand, fixed travel times, and predefined routes. Classical vehicle routing formulations and their green or electric variants provide valuable insights at the planning level, but they often fail to capture real-world operational variability caused by fluctuating order arrivals, traffic congestion, weather conditions, and battery constraints. As a result, solutions derived from static optimization frequently lose effectiveness when implemented in practice.
The growing availability of real-time data enabled by Industry 4.0 technologies has opened new possibilities for adaptive and data-driven control of last-mile logistics operations. Real-time and dynamic optimization approaches allow logistics systems to continuously adjust routing, dispatching, and capacity allocation decisions based on live information. While such methods have been extensively studied for conventional vehicle fleets, their application to micromobility-based last-mile delivery systems remains limited, often restricted to simplified models or single-mode settings.
Another important limitation in the existing literature concerns the integration of sustainability objectives into operational decision-making. Although environmental performance indicators such as emissions and energy consumption are increasingly incorporated into logistics models, they are frequently treated as static constraints or evaluated ex post. In practice, environmental impacts evolve dynamically with operational decisions, spatial deployment of vehicles, and temporal variations in demand and energy sources. Real-time optimization frameworks that explicitly integrate sustainability metrics into operational control remain relatively rare, particularly in the context of micromobility-based logistics systems.
This paper addresses these gaps by proposing a real-time optimization framework for micromobility-based last-mile logistics that integrates operational adaptability and environmental performance within a unified modeling structure. The core contribution of the study is a zone-based backlog dynamic model that aggregates urban delivery demand spatially while remaining directly responsive to real-time data streams. By coupling this dynamic representation with a rolling-horizon optimization scheme, the proposed approach enables frequent and computationally tractable reallocation of micromobility capacity in response to evolving demand, congestion, and sustainability-related factors. In doing so, the framework advances existing research beyond static planning models and provides a practical pathway toward greener and more resilient urban last-mile logistics systems.
To clarify the contribution of the study, it is important to emphasize that the novelty of the proposed framework does not lie in introducing a new routing heuristic or a purely numerical optimization routine. Rather, the contribution is structural and methodological in nature. The paper develops a zone-based backlog dynamic model that connects real-time operational data streams with fleet allocation decisions in an analytically consistent manner. By aggregating urban delivery processes at the zone level, the model preserves the essential system dynamics while remaining computationally manageable for frequent re-optimization. An important structural property of the framework is that the continuous-time backlog dynamics admit a closed-form discrete-time representation under piecewise-constant assumptions. This enables analytical state prediction without repeated numerical simulation and supports rolling-horizon real-time control.
Furthermore, the allocation problem is formulated as a convex quadratic program with linear constraints, ensuring global optimality and stable numerical behavior. Sustainability considerations are embedded directly into the operational objective, allowing explicit management of the emission–service trade-off at each control step. These elements position the framework as a theoretically grounded yet practically oriented approach to real-time micromobility-based last-mile logistics control.
The remainder of the paper is structured as follows.
Section 2 presents a systematic literature review that summarizes existing research on micromobility-based last-mile logistics, real-time optimization, and sustainability assessment, and identifies key research gaps.
Section 3 introduces the proposed modeling framework and optimization methodology.
Section 4 presents numerical results from a case study to demonstrate the effectiveness of the approach, while
Section 5 presents the discussions and
Section 6 presents conclusions.
2. Literature Review
In this section, a systematic literature review is conducted to identify existing research gaps. The section is structured into three subsections: a descriptive analysis of the available literature, a content analysis, and the formulation of research gaps.
2.1. Descriptive Analysis of Research Results
As part of the systematic literature review, the following steps were undertaken: defining the research questions, selecting relevant sources from Scopus, refining the article set through detailed reading and identification of their main themes, analyzing the selected studies, synthesizing key scientific findings, and identifying research gaps and bottlenecks.
To search the Scopus database, we used the following keywords: “urban logistics” AND “last mile delivery” AND “optimization”. Initially, this search resulted in 300 articles. We then refined the selection using the following keywords: (TITLE-ABS-KEY (urban AND logistics) AND TITLE-ABS-KEY (last AND mile AND delivery) AND TITLE-ABS-KEY (optimization)) AND (LIMIT-TO (DOCTYPE, “ar”)) AND (LIMIT-TO (LANGUAGE, “English”)) AND (LIMIT-TO (OA, “all”)). We also included only journal articles published in English, reducing the total to 111 articles.
Our search was conducted in January 2026, so additional relevant articles may have been published since then.
The reduced articles can be classified depending on the research area.
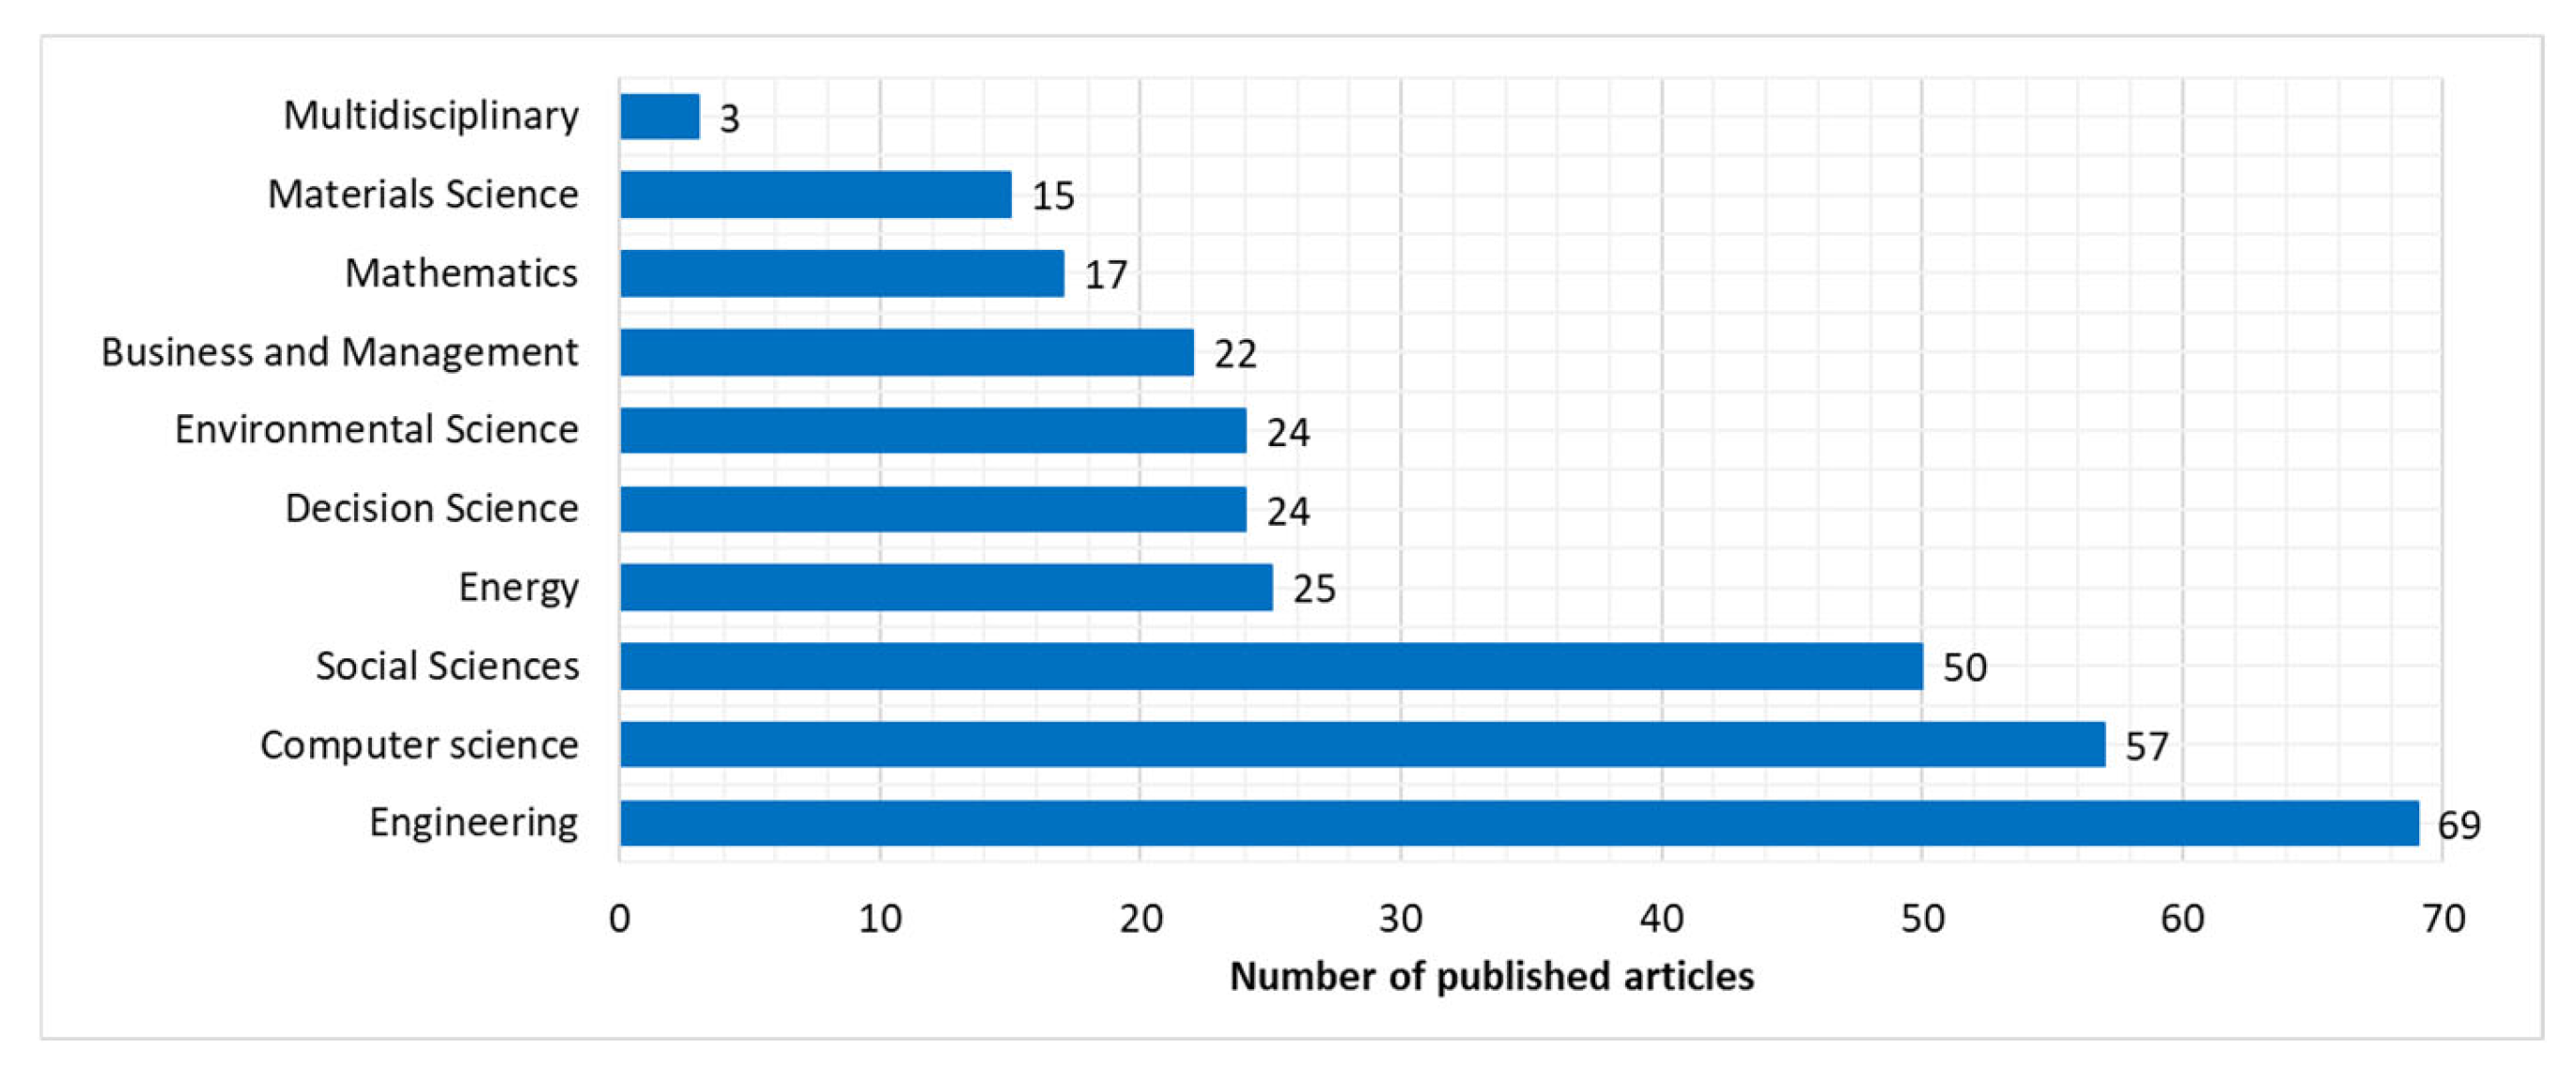
Figure 1 shows the classification of these 111 articles considering ten subject areas. This classification shows that the majority are on engineering and computer science, whilst environmental science and energy highlight the increased sustainability aspects of last-mile delivery operations and solutions; mathematics and decision sciences focus on the optimization of micromobility-based last-mile delivery solutions.
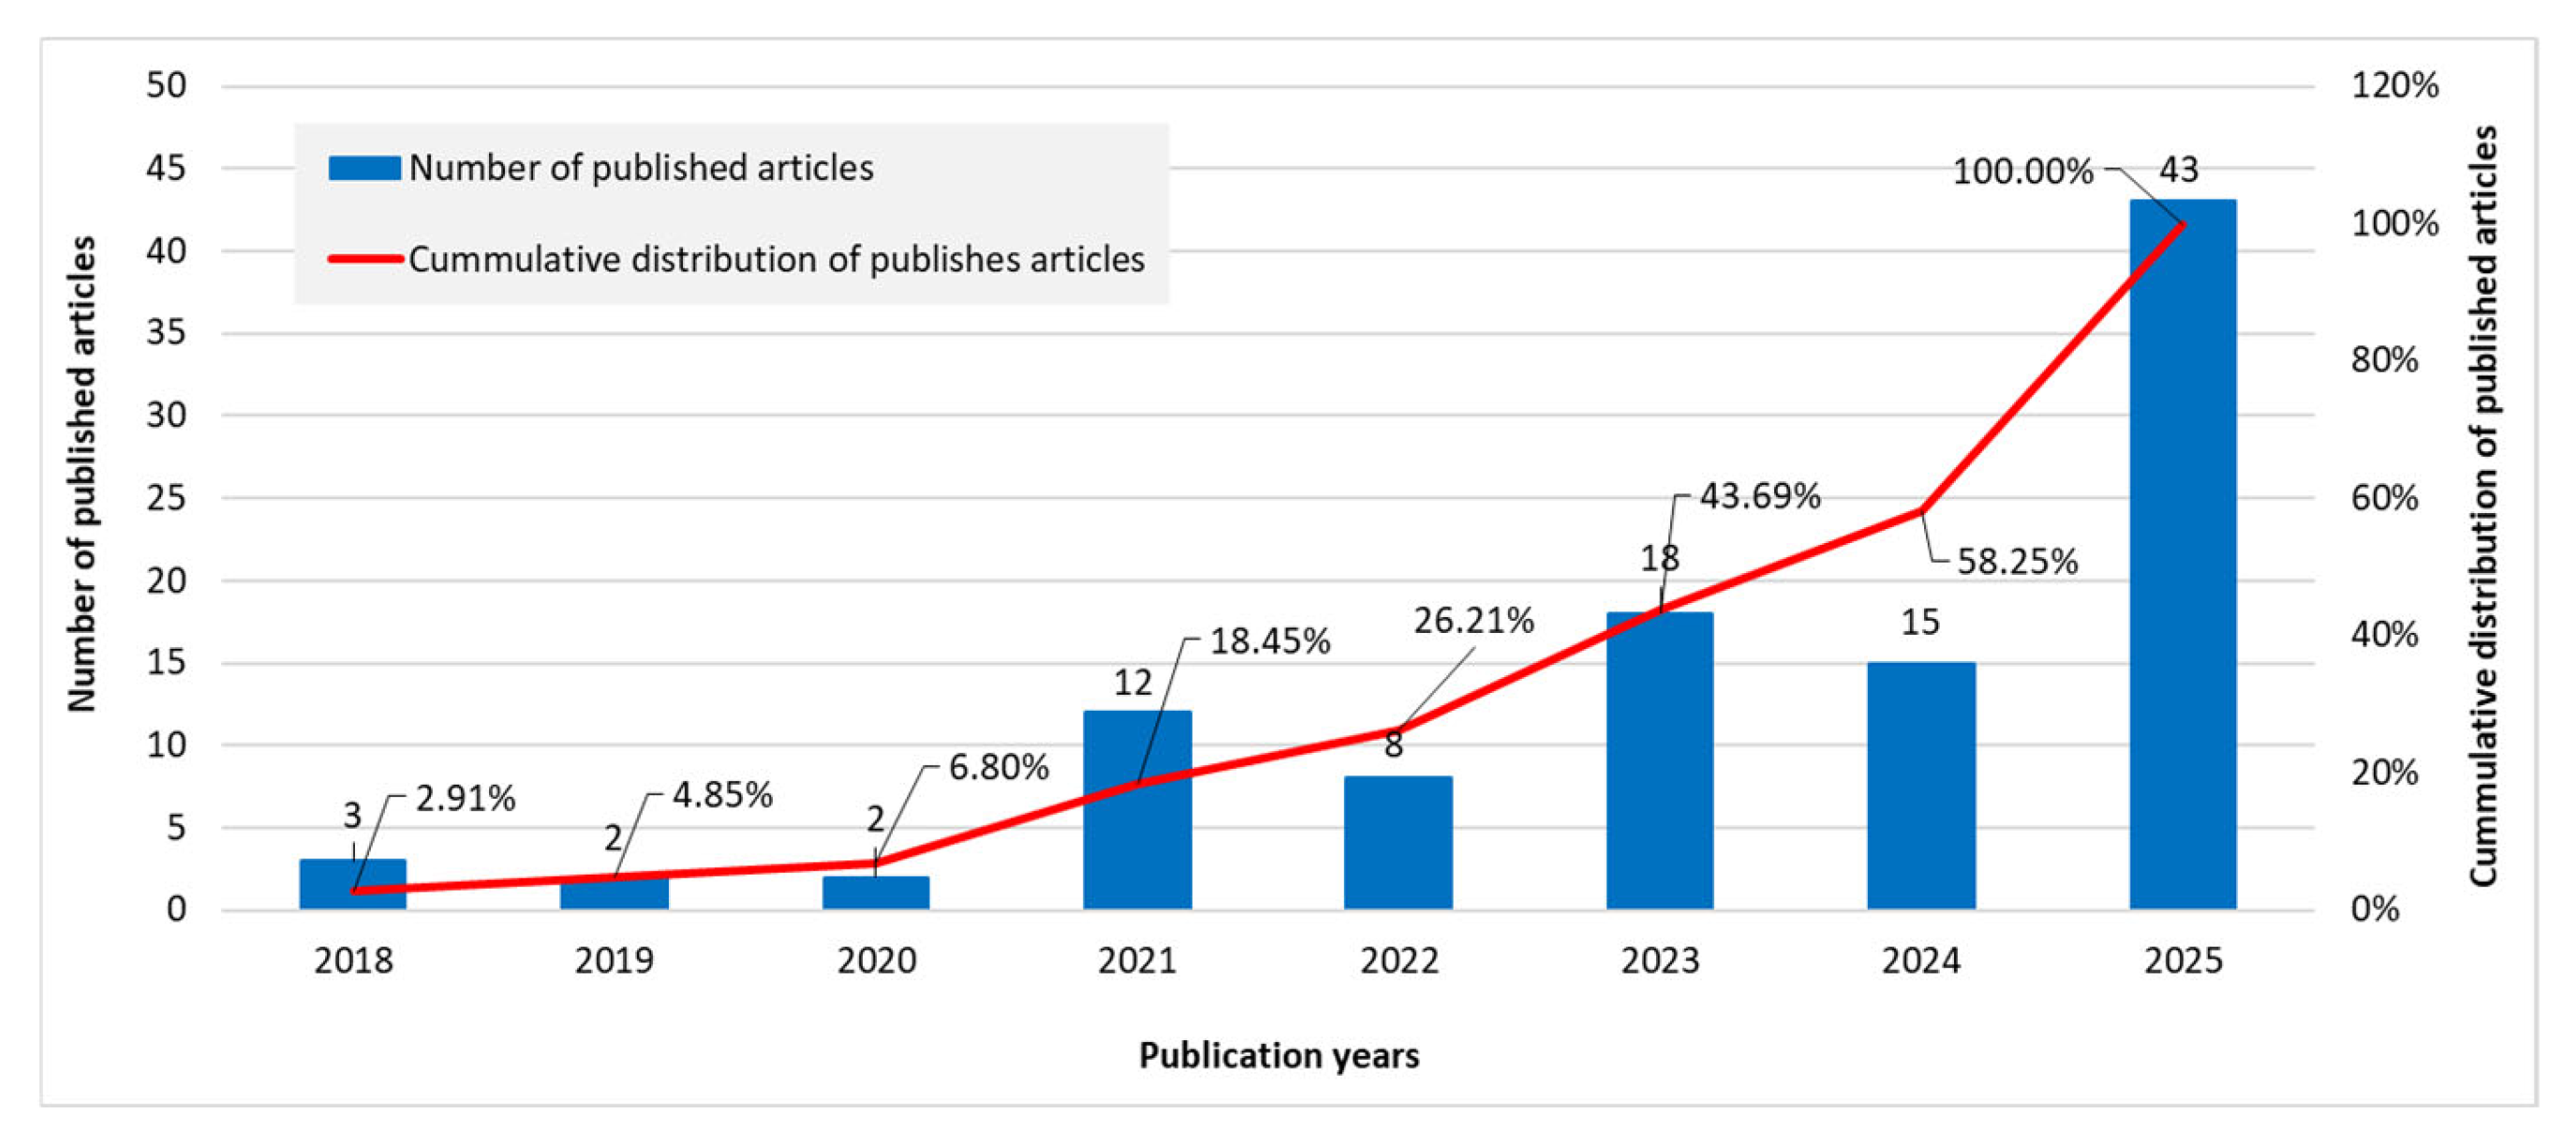
As
Figure 2 demonstrates, the research on last-mile delivery optimization has been published in the past 8 years. The number of published papers has significantly increased in recent years which shows the importance of this research field.
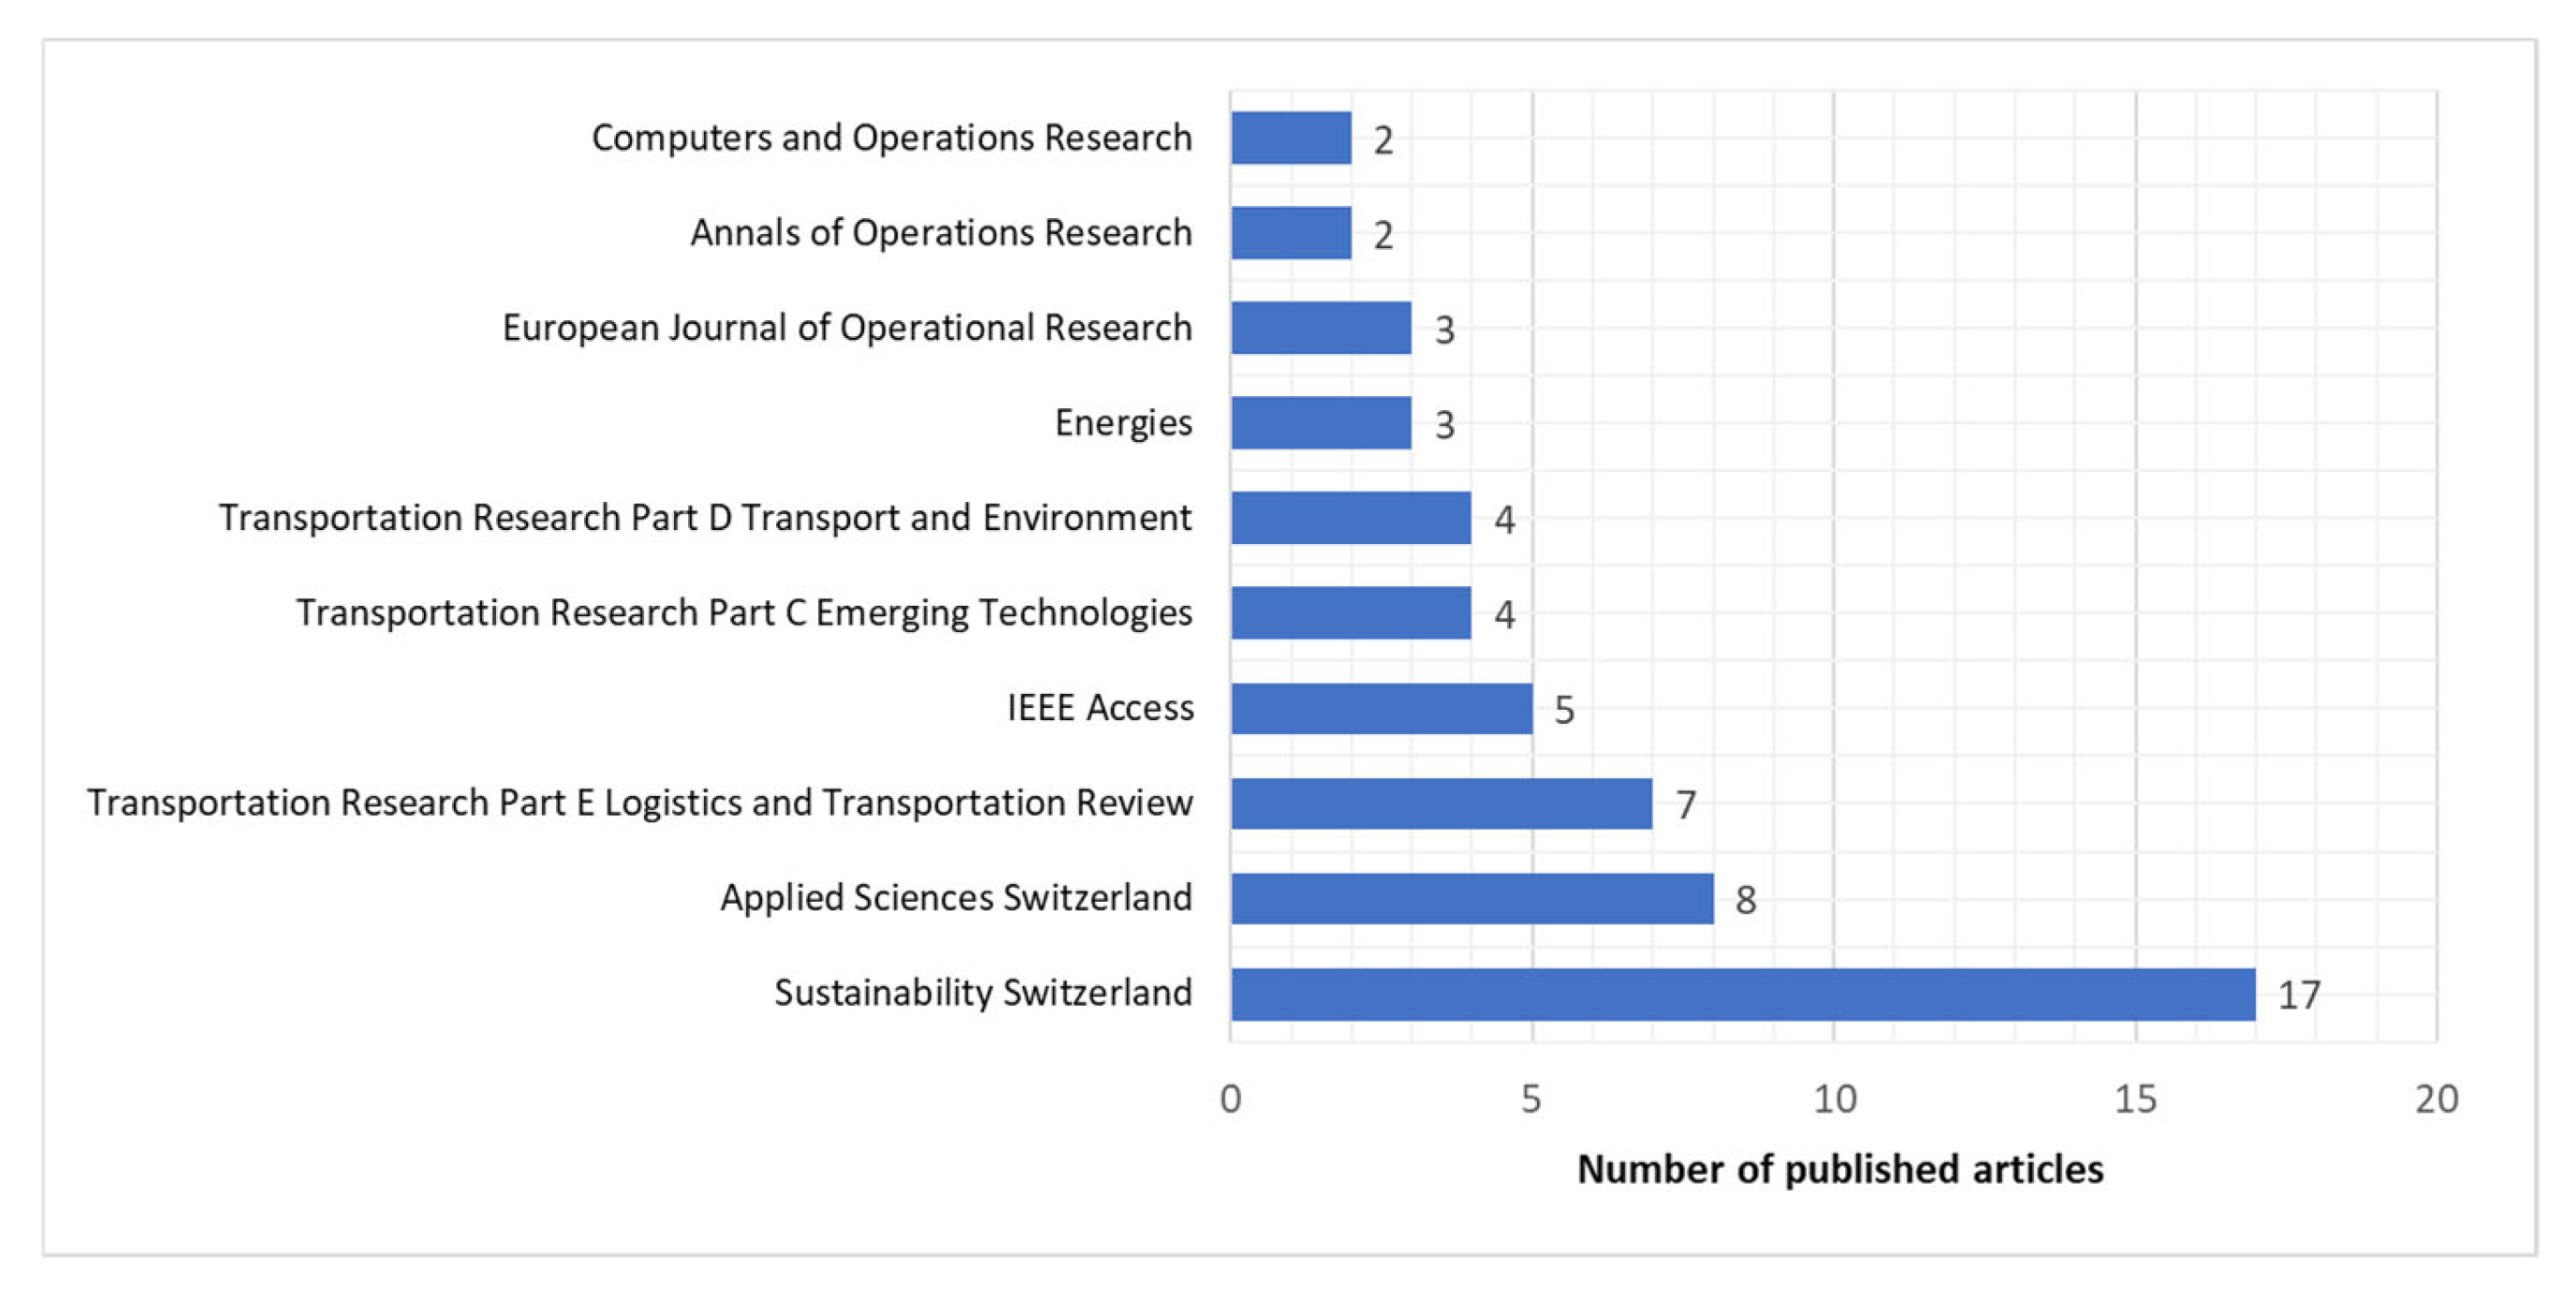
As
Figure 3 demonstrates, most of the articles were published in journals with transportation topics, but a significant number of the papers were accepted for publication in journals focusing on sustainability and energy, while optimization and operation research applications are also significant. The distribution of journals shows that the design and operation problems of micromobility-based last-mile delivery solutions are multidisciplinary problems.
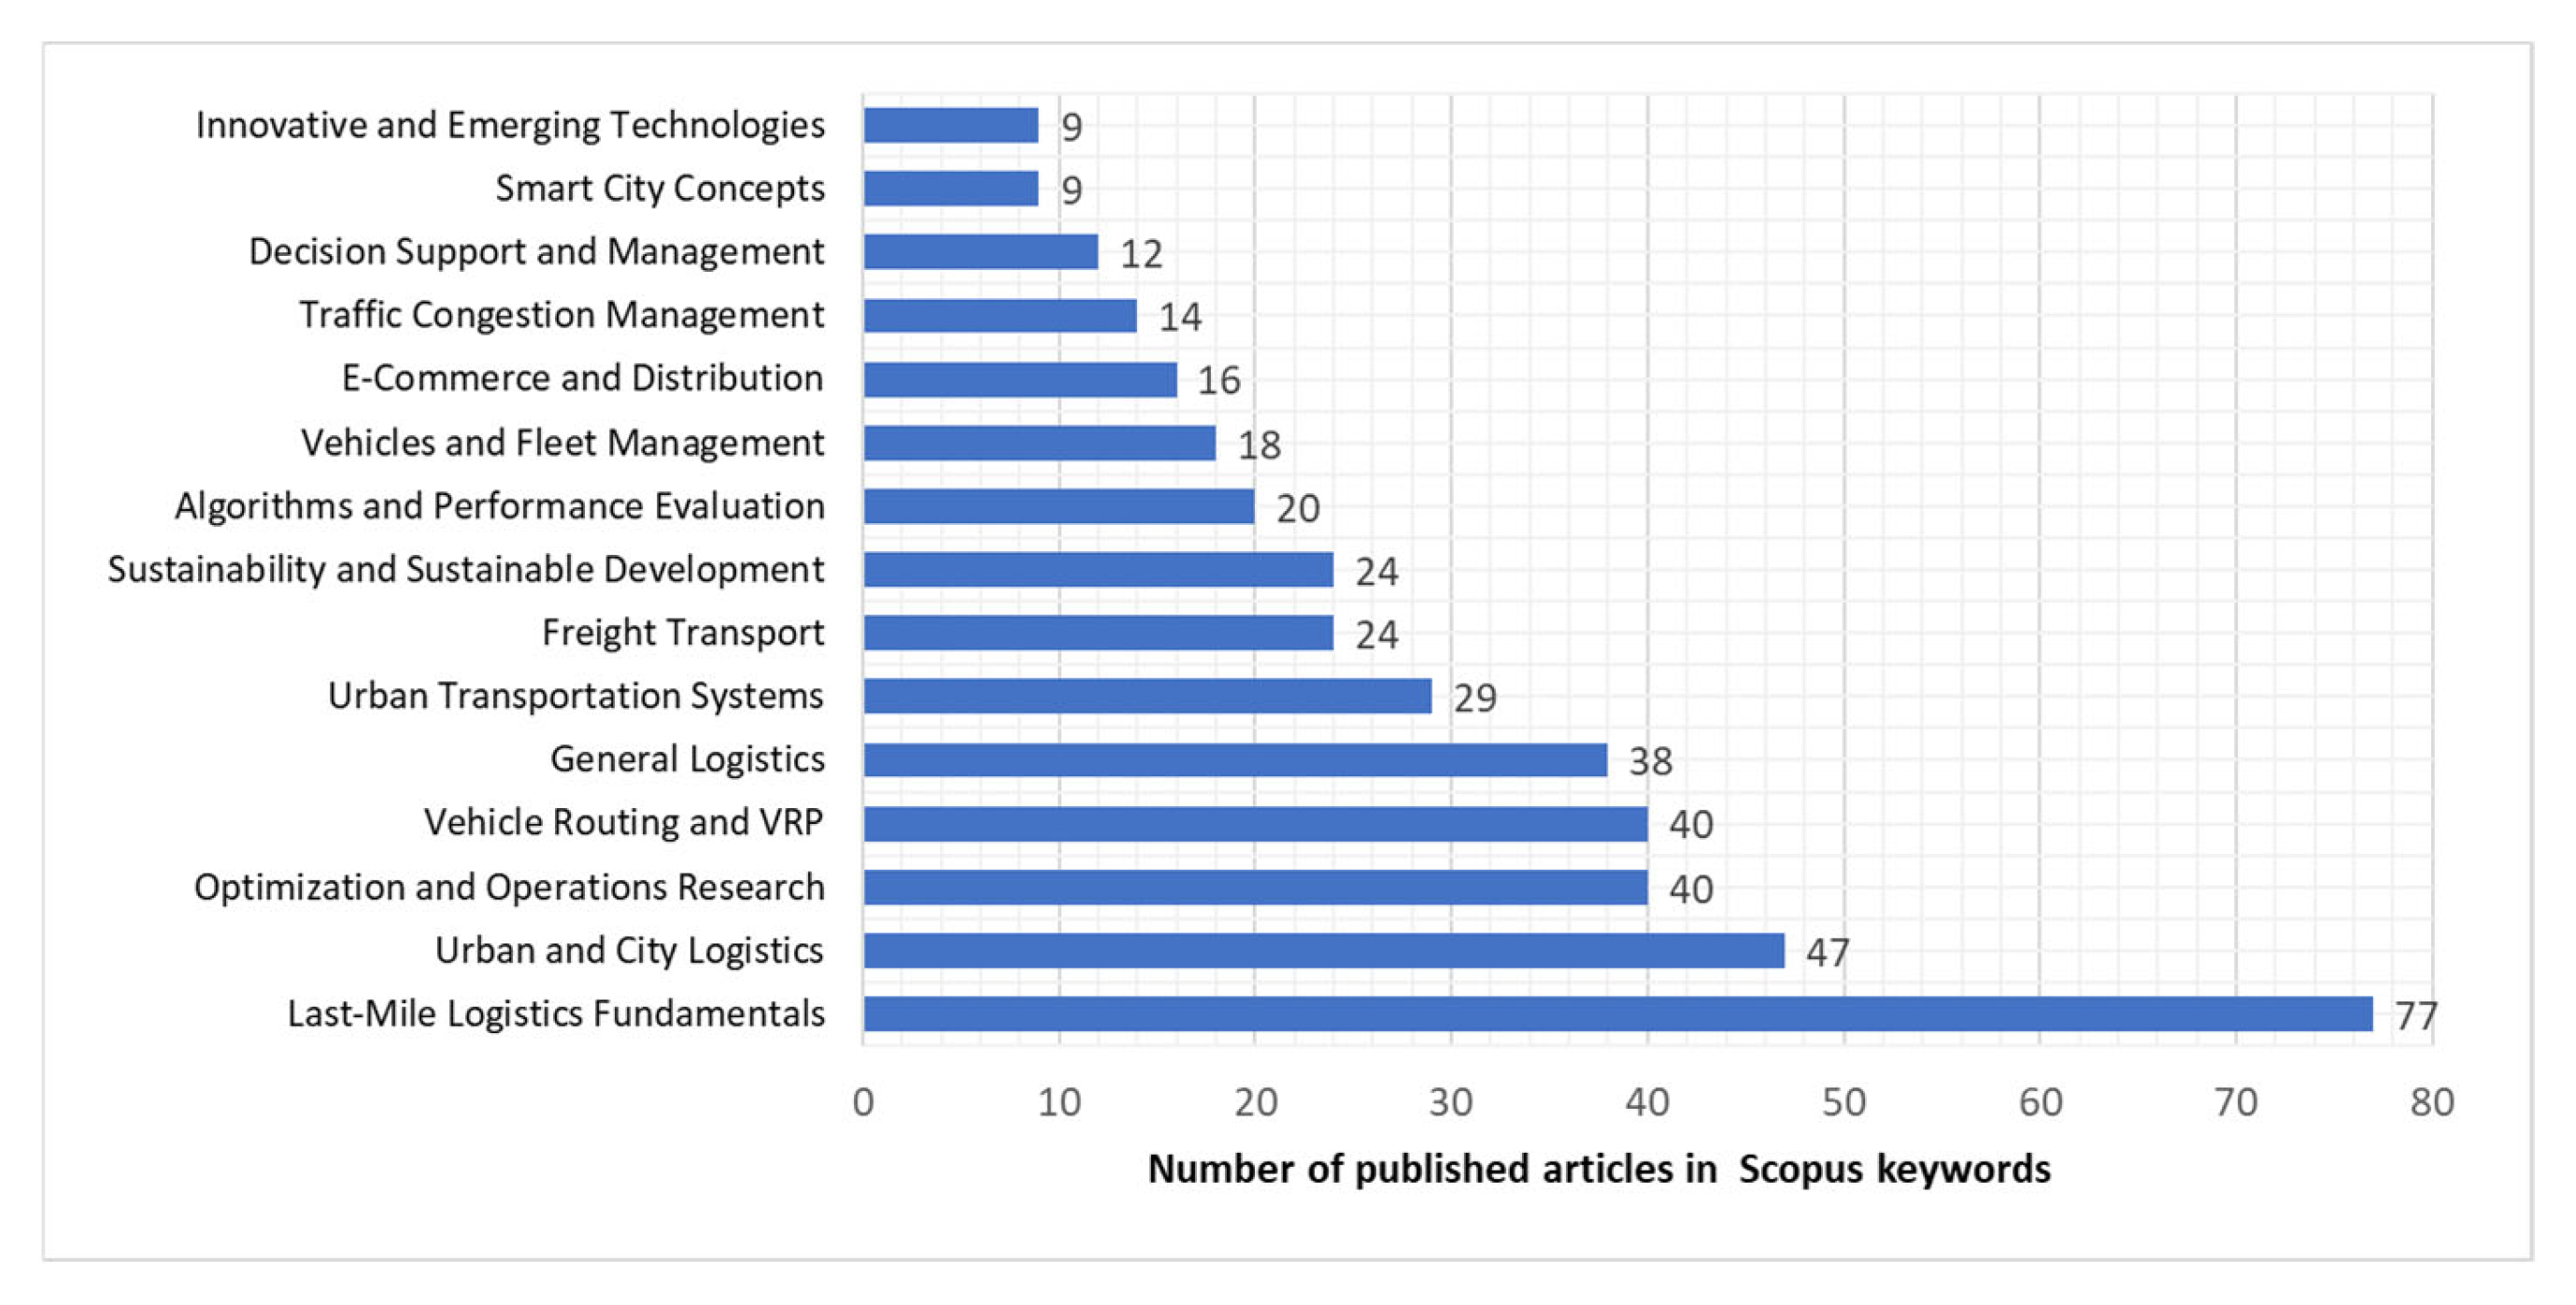
We have analyzed the published articles from the Scopus keywords point of view. We have analyzed the distribution of articles in the following categories: last mile, logistics, optimization, urban logistics, vehicle routing, city logistics, urban transportation, electronic commerce, traffic congestion, sustainability, freight transport, decision making, vehicle routing problem, algorithm, trucks, sustainable development, smart city, drones, benchmarking, vehicles.
Figure 4 depicts the distribution of the categories. As the categories show, the optimization of micromobility-based last-mile delivery solutions is based on multidisciplinarity.
In the following step, the 111 articles were reduced after reading them. We excluded articles whose topic did not fit our interest and did not address the optimization of micromobility-based last-mile delivery.
2.2. Content Analysis of Available Research Results
This section reviews recent academic contributions addressing sustainable last-mile logistics, with particular attention to micromobility solutions and real-time optimization methods. Rather than following a purely methodological taxonomy, the discussion highlights how different modeling paradigms respond to operational complexity, uncertainty, and environmental objectives.
Recent research demonstrates a growing integration of artificial intelligence techniques with classical optimization. For example, a hybrid framework for the Multi-Depot Vehicle Routing Problem with split deliveries and multiple trips combines scheduling heuristics with Transformer architectures, Deep Reinforcement Learning, and evolutionary search procedures. Empirical validation on Istanbul-based data and benchmark MDVRP instances shows that the proposed List Scheduling + Transformer (LST-Former) approach improves route cost efficiency, workload balance, and robustness, while remaining suitable for hardware-constrained logistics environments [
1].
Capacity shortages and underutilized resources in urban delivery systems have also been addressed through crowdsourcing mechanisms. A mixed-integer programming model solved by an adaptive large neighborhood search heuristic and tested in Chongqing reports an 18.1% cost reduction relative to conventional distribution structures [
2]. Decision support tools based on fuzzy multi-criteria evaluation (Fuzzy FARE and ADAM) have been applied to compare six last-mile alternatives under stakeholder-defined criteria such as cost, flexibility, accessibility, and sustainability. In that setting, automated pickup points emerged as the most balanced solution, outperforming home delivery in cost-efficiency and operational adaptability despite its higher convenience [
3].
Traffic uncertainty and operational variability are increasingly embedded directly into routing models. A traffic-aware optimization framework (T-ALNS-RRD), combining adaptive large neighborhood search, multi-layer Tabu memory, and rollout-based real-time dispatch, achieved a 24.3% cost reduction and increased on-time deliveries to 92.8% under highly variable traffic conditions [
4]. Uncertainty is also incorporated through fuzzy mixed-integer programming in home healthcare routing, where a Q-learning-based metaheuristic improves reliability under time-dependent travel and workload variability [
5]. Similarly, the PSOT + Prediction-and-Scheduling framework refines order transfers between urban hubs and delivery stations by modeling couriers’ remaining working time and spatial order distribution, reducing transfer times by up to 59% in real-world tests [
6].
Dynamic decision-making under uncertainty is another prominent research direction. A stochastic parcel locker assignment model addresses real-time acceptance and allocation decisions, where a classification-based policy trained on deterministic optimal solutions outperforms traditional sampling and tree-based strategies [
7]. In parallel, digital twin architectures have been proposed to coordinate autonomous delivery robots with public transport networks using Multi-Agent Reinforcement Learning, Graph Neural Networks, and large language models. Experimental results indicate scalability and delivery success rates above 90%, alongside improved routing and energy utilization [
8]. Partial crowd-shipping integration has been formulated as a two-stage stochastic optimization problem, with adaptive large neighborhood search enabling efficient large-scale solution and cost reductions under uncertain demand and supply [
9]. Environmental sustainability has also been embedded in route optimization models that jointly consider parcel delivery and reusable packaging collection; a Cross-Entropy heuristic demonstrated cost-efficiency and scalability in a Seoul case study [
10].
Taken together, these contributions illustrate a broader movement toward hybrid AI-supported and stochastic optimization frameworks that explicitly account for traffic variability, demand uncertainty, and environmental metrics. At the same time, increased methodological sophistication often entails higher computational and implementation complexity.
Air–ground collaborative systems form another dominant research stream. Energy-aware drone–truck coordination based on Theta* routing incorporates payload, elevation, and obstacle avoidance considerations, improving both operational efficiency and profit–energy balance [
11]. The Customer-Centric UAV Last-Mile Delivery (CULMD) framework eliminates truck dependency by combining MILP with a parallel optimal algorithm (POAM), achieving global optimality with substantial runtime reductions [
12]. Advances in drone path planning include enhanced A*-based three-dimensional routing with safety altitude constraints and directional reward factors, producing smoother and safer trajectories in dense urban airspaces [
13].
Multi-vehicle and multi-drone coordination has been explored through hybrid NSGA-II–VND metaheuristics, revealing nonlinear trade-offs between efficiency and sustainability and diminishing emission benefits beyond certain fleet sizes [
14]. Branch-and-Price approaches have been applied to multimodal routing problems integrating autonomous delivery vehicles, drones, and micro-hubs, yielding significant cost and service reliability improvements [
15]. Graph-based formulations address centralized drone routing with collision avoidance, where scalable heuristics provide tractable alternatives to exact MILP formulations for large instances [
16]. Hybrid airship–vehicle–drone routing models demonstrate cost and service gains over conventional routing [
17], while bi-objective truck–UAV formulations balance equity and efficiency in humanitarian logistics using NSGA-II-based approaches [
18].
Robotic micro-hubs integrated into truck–robot delivery systems have been shown to reduce completion times and CO
2 emissions, revealing nonlinear efficiency effects in hub deployment density [
19]. Broader assessments confirm that hybrid truck–drone and autonomous robotic systems can reduce costs, energy use, and operational risk under dynamic demand conditions [
20,
21,
22]. Advanced locker–drone systems, time-dependent truck–UGV routing, and multi-visit collaboration frameworks further illustrate the efficiency and resilience gains achievable through coordinated air–ground automation [
23,
24,
25].
Integrated public transport–drone systems optimized via Branch-Price-and-Benders-Cut algorithms achieve cost savings exceeding 6% compared to sequential planning [
26]. Bilevel UAV–UGV formulations with dynamic charging strategies reduce delivery time by 33.9% and UAV flight distance by 24.3%, strengthening the sustainability case for coordinated energy-aware routing [
27].
Beyond air–ground integration, micromobility and sustainability-oriented studies broaden the perspective. Hydrogen-powered cargo bikes outperform battery-electric variants in range and uptime according to simulations using Rome-based data, suggesting resilience advantages for mid-distance urban logistics [
28]. Research on light electric freight vehicles in zero-emission zones highlights planning and infrastructural challenges that extend beyond simple electrification policies [
29]. Network-science-based parcel locker placement using multilayer Social Network Analysis improves resilience and connectivity relative to traditional coverage-based methods [
30]. Electric vehicle fleets combined with AI-based optimization have demonstrated reductions in delivery time, energy consumption, and CO
2 emissions in Lisbon case studies [
31].
Vehicle-type heterogeneity has been examined through multi-objective NSGA-II optimization, supporting mixed-fleet strategies tailored to environmental and operational priorities [
32]. Behavioral aspects are addressed through stated-preference surveys of European riders, revealing strong preferences for income stability and safety, with implications for workforce design in urban logistics [
33]. Hybrid evaluation frameworks combining multi-criteria decision-making and social cost–benefit analysis have been applied to sustainable city logistics initiatives, demonstrating measurable reductions in externalities [
34]. User-centric locker selection models based on trajectory mining reduce pickup detours by up to 68% [
35], while synthetic demand generation through heuristic optimization supports realistic modeling of food retail last-mile flows [
36].
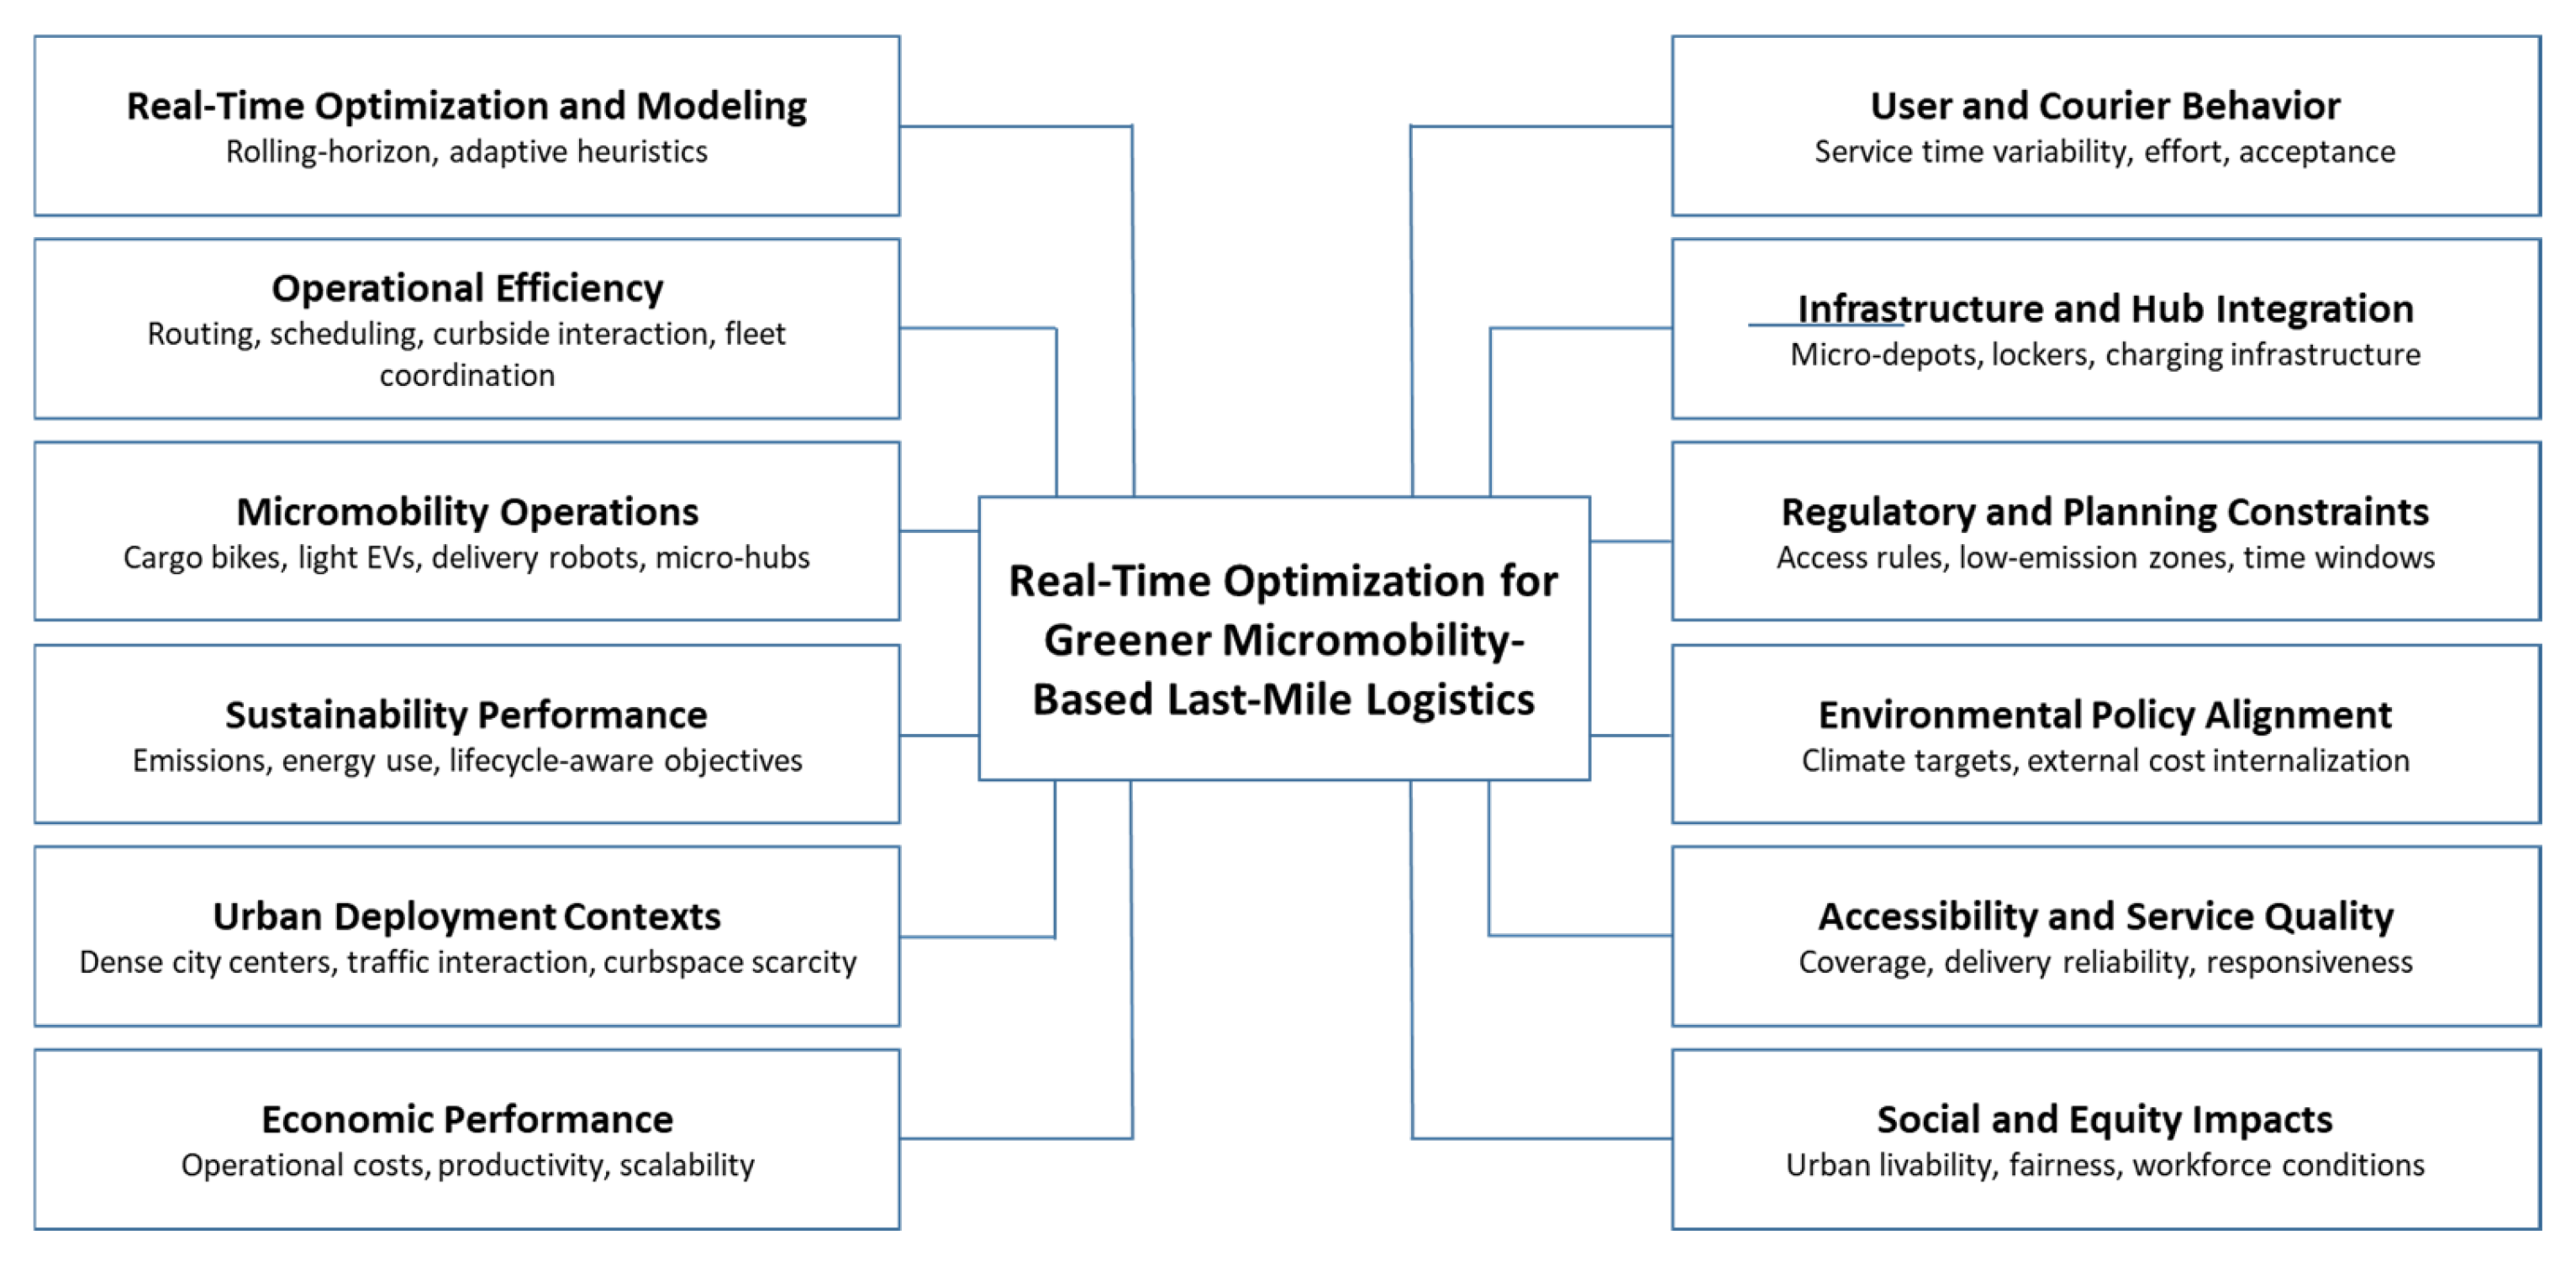
Figure 5 summarizes the main topics of the above-mentioned micromobility-related research fields.
Overall, the literature reflects substantial progress in integrating electrification, alternative vehicles, AI-based optimization, and behavioral insights into urban freight systems. These developments collectively emphasize that sustainable last-mile logistics requires not only cleaner vehicle technologies but also adaptive allocation mechanisms, data-driven decision support, and coordinated governance structures.
Despite this progress, much of the recent research centers on drone-assisted or multimodal configurations. Comparatively fewer contributions examine micromobility fleets as the primary operational control layer within real-time urban allocation frameworks. This imbalance motivates a closer investigation of micromobility-centered, dynamically controlled fleet allocation models.
2.3. Research Gap Identification
The review of recent literature reveals substantial progress in last-mile logistics optimization, particularly in multimodal coordination, UAV-assisted delivery systems, stochastic modeling, and computationally efficient solution techniques. Numerous studies have incorporated real-time elements, uncertainty-aware formulations, and sustainability-oriented objectives into routing and system-level design problems. However, several important research gaps remain when focusing specifically on micromobility-dominated urban delivery systems operating at the operational control level.
First, although micromobility solutions such as cargo bikes and light electric freight vehicles have gained increasing attention in urban logistics research, existing studies predominantly concentrate on routing optimization, infrastructure planning, hub location decisions, or static fleet sizing. Comparatively limited attention has been devoted to real-time operational control and dynamic zone-level fleet allocation of micromobility assets under time-varying demand conditions. In many cases, micromobility vehicles are treated as fixed routing resources rather than dynamically reallocatable capacity units within a supervisory control framework.
Second, while a considerable body of literature investigates multimodal coordination among trucks, UAVs, autonomous vehicles, and other delivery technologies, most contributions focus on route-level integration or pre-planned coordination schemes. Real-time supervisory control structures that dynamically allocate micromobility resources within multimodal systems remain relatively scarce. In particular, micromobility fleets are seldom modeled as adaptive operational buffers capable of mitigating short-term spatial demand imbalances in dense urban environments.
Third, despite the growing incorporation of stochastic and uncertainty-aware optimization models in last-mile logistics, comparatively fewer studies provide analytically tractable real-time update mechanisms tailored to micromobility fleet control. Explicit feasibility guarantees are rarely formulated within a convex operational control framework suitable for rapid online deployment.
Fourth, although scalable and computationally efficient optimization techniques have been proposed in various logistics contexts, fewer contributions formulate micromobility fleet allocation as a convex, efficiently solvable zone-level control problem with provable real-time implementability. The development of quadratic programming-based formulations that ensure computational tractability while preserving operational realism remains underexplored in micromobility-centered systems.
Finally, sustainability objectives are frequently incorporated at strategic or routing levels in the literature. However, their integration into short-horizon, zone-level operational fleet allocation remains limited. The ability to dynamically balance service efficiency and environmental impact within an operational control structure represents an important yet insufficiently addressed research direction.
In summary, while existing studies have made significant advances in multimodal logistics optimization and uncertainty-aware modeling, comparatively limited attention has been devoted to real-time, zone-level operational control of micromobility fleets with convex, feasibility-preserving formulations and embedded sustainability trade-offs. Addressing this gap requires the integration of analytically tractable control-oriented optimization with dynamically reallocatable micromobility capacity in urban last-mile systems. This article directly addresses these gaps by focusing on real-time optimization mechanisms tailored to micromobility-based delivery systems. By integrating operational adaptability and environmental performance within a unified framework, the study advances existing literature beyond static planning models. Moreover, by treating micromobility as a dynamically controlled component of urban logistics rather than a fixed alternative mode, the article contributes to both theoretical development and practical implementation of sustainable last-mile solutions. In the context of increasing urbanization and stringent environmental targets, real-time optimized micromobility-based logistics represents a critical pathway toward greener and more resilient urban freight systems.
3. Materials and Methods
Modern last-mile logistics systems increasingly operate within the paradigm of Industry 4.0, where decisions are continuously informed by real-time data collected from digital platforms, sensors, and cyberphysical systems. In micromobility-based delivery networks, such data streams include live order inflows, vehicle positions, battery states, traffic conditions, and infrastructure availability. While this abundance of data enables unprecedented situational awareness, it also necessitates models that can react quickly and reliably to changing operational conditions.
3.1. Conceptual Model
The main modeling challenge is to represent the last-mile system in a way that is both responsive to real-time data and computationally manageable, allowing frequent re-optimization without excessive overhead. The zone-based backlog model addresses this by aggregating urban spatial complexity into a limited number of operational zones, while retaining the dynamics necessary for real-time control.
From an Industry 4.0 standpoint, this aggregation is a deliberate abstraction rather than a loss of information. Real-time data streams are noisy, heterogeneous, and high-dimensional. Directly exploiting them at the level of individual customers or routes would require repeatedly solving large-scale combinatorial problems, which is incompatible with real-time operation.
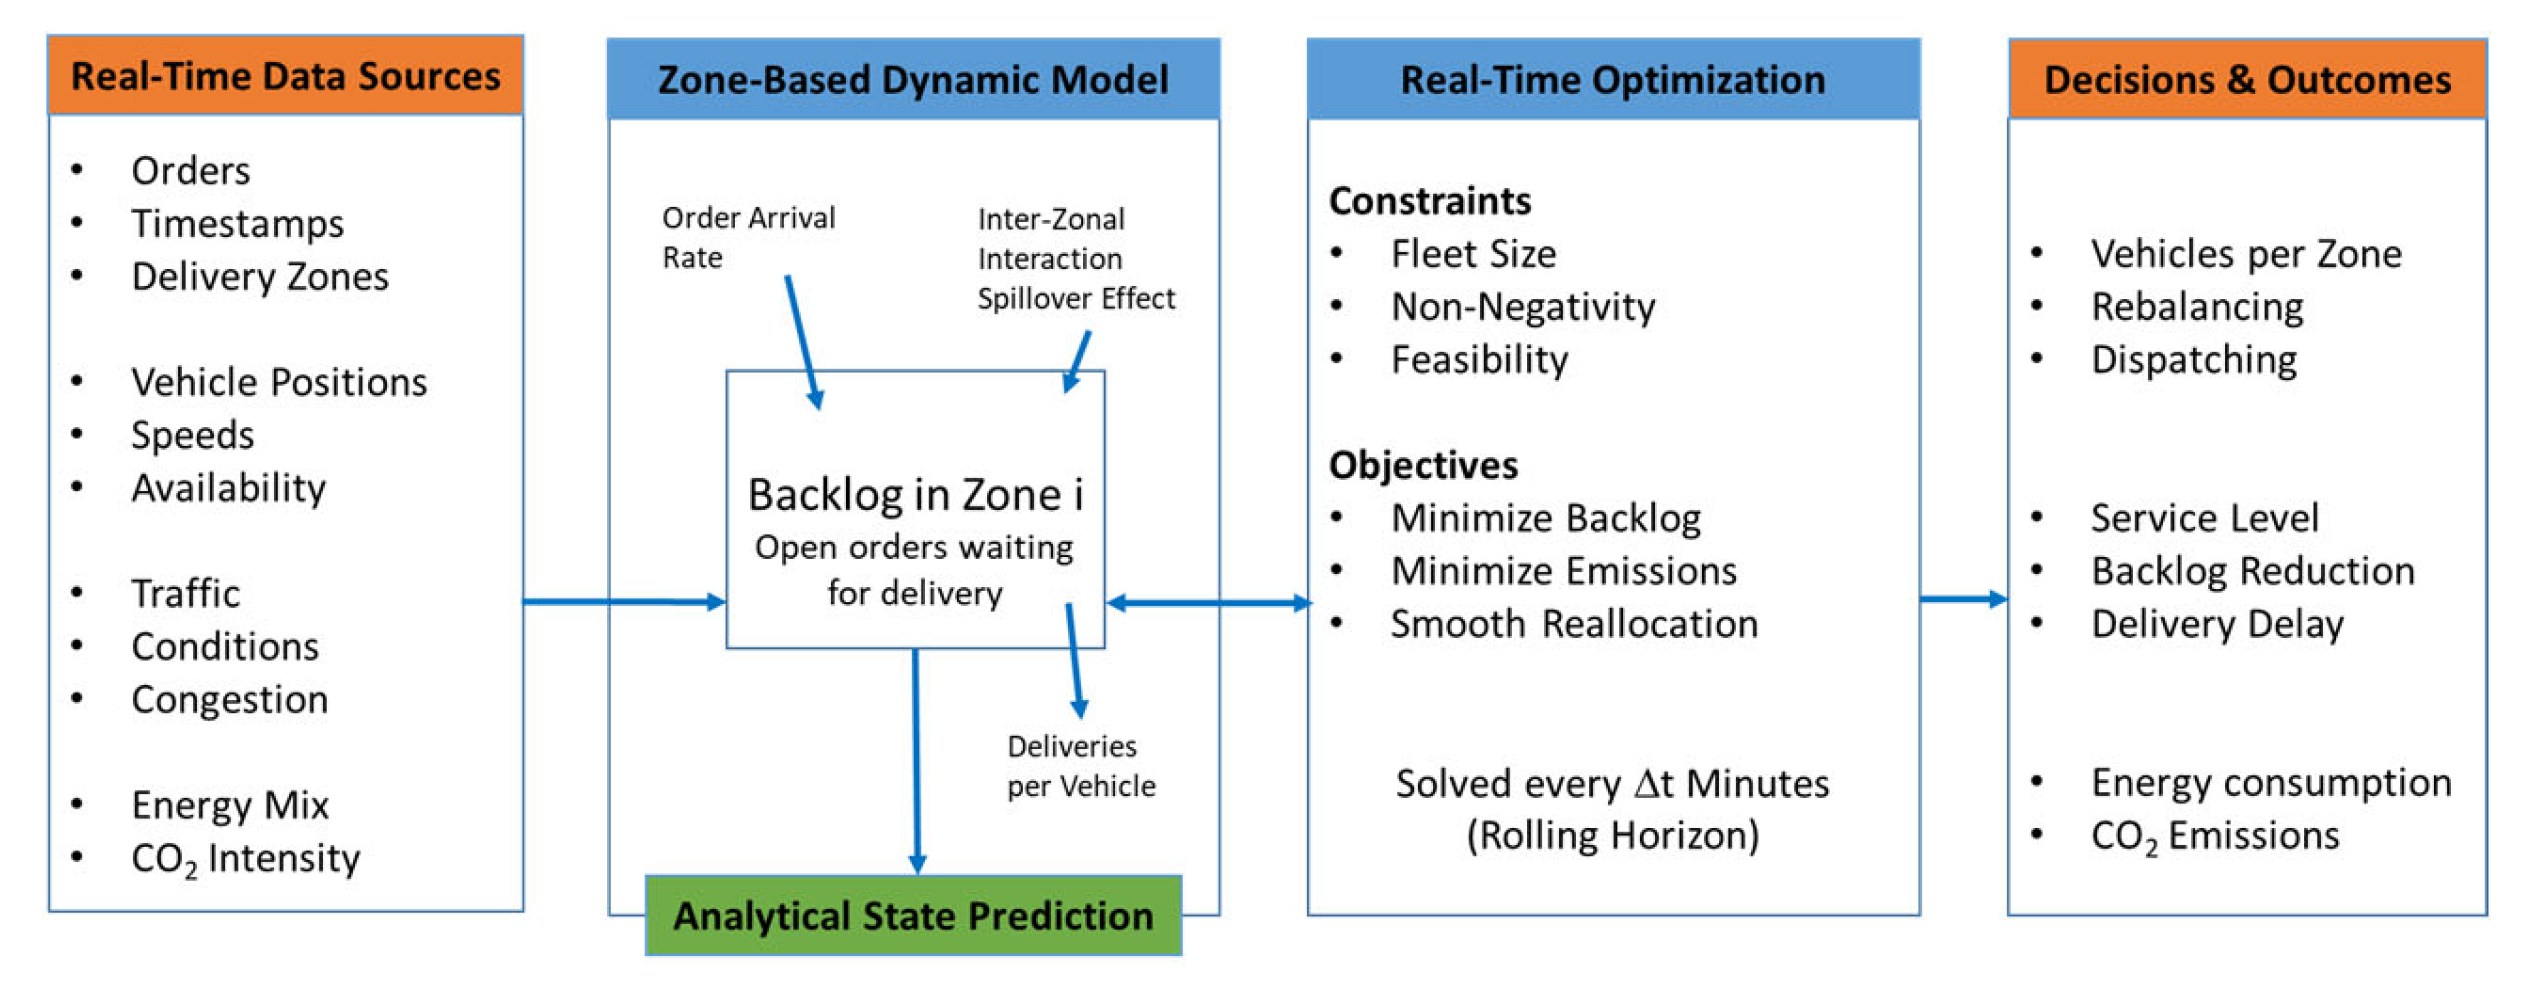
Figure 6 outlines the data-driven architecture of the proposed model. Inputs from order management systems, fleet GPS tracking, IoT traffic sensors, and energy management platforms are mapped to model states and parameters. The resulting state dynamics support analytical prediction and rolling-horizon optimization, enabling real-time, sustainability-aware decision-making.
By contrast, zone-based aggregation allows real-time data to be filtered and interpreted at an operationally meaningful level. Within each zone, individual orders are not modeled separately; instead, their aggregate effect is captured through the backlog variable. This provides a compact state description that can be updated frequently and used directly in optimization routines.
Within the proposed framework, backlog serves as the primary system state. At any point in time, the backlog in a zone reflects the cumulative effect of past demand arrivals and service decisions. It is directly observable or estimable from operational data such as open orders and pending deliveries, and it evolves continuously over time, making it suitable for dynamic modeling and short-term prediction.
Backlog also links past allocation decisions to future system behavior. Capacity assignments in the previous interval determine the current backlog, which in turn influences subsequent allocation decisions. This feedback structure is consistent with data-driven control architectures commonly associated with Industry 4.0 systems.
The evolution of backlog reflects the interaction of demand inflow, service execution, and spatial coupling between zones. Demand varies over time due to customer behavior, external conditions, and events, and is continuously estimated from live data. Service execution depends on the allocation of micromobility resources, which constitutes the main control decision. In addition, spatial spillover effects allow congestion or imbalance in one zone to influence neighboring zones in an aggregated manner, without requiring explicit route-level modeling.
The zone-based backlog formulation is designed to support rolling-horizon optimization. By assuming that demand and control decisions remain approximately constant over short time intervals, the continuous-time dynamics admit closed-form analytical solutions within each interval. This avoids the need for computationally intensive numerical simulation during online operation and enables frequent re-optimization.
Beyond operational performance, the model supports sustainability-oriented decision-making. In micromobility-based logistics, energy consumption and emissions depend strongly on how capacity is deployed across space and time. The backlog-based formulation allows environmental considerations to be incorporated directly into operational decisions by linking allocation choices to both service performance and emission outcomes.
Within the framework, the zone-based backlog dynamics provide the state evolution mechanism connecting real-time data, control decisions, and sustainability objectives. This structure enables real-time optimization while remaining computationally tractable and aligned with data-driven logistics operations.
3.2. Mathematical Model
This section presents the mathematical formulation of the proposed real-time optimization framework for micromobility-based last-mile logistics. The model is developed in a structured, bottom-up manner, progressing from spatial aggregation and state definition to dynamic system representation and analytical prediction suitable for rolling-horizon control. First, the urban service area is partitioned into operationally homogeneous zones, and backlog is introduced as the central state variable capturing the accumulation of outstanding delivery demand. Next, the allocation of micromobility capacity and its translation into service rates are formalized, followed by the incorporation of inter-zonal interactions to reflect spatial dependencies in urban logistics operations. Based on these components, continuous-time backlog dynamics are derived using flow-balance principles and subsequently transformed into a discrete-time analytical prediction model through piecewise-constant approximation. Finally, physical feasibility constraints are imposed to ensure non-negativity of backlog and real-time solvability of the resulting optimization problem. Together, these elements form a coherent mathematical foundation that directly links real-time data, control decisions, and system-level performance within an Industry 4.0-enabled operational setting.
3.2.1. Spatial Aggregation and Definition of Backlog States
We consider an urban last-mile delivery region partitioned into
Z operationally homogeneous zones. Let
denote the number of outstanding delivery orders (backlog) in zone
i at time
t. The state vector is
Orders arrive to zone i with (possibly time-varying) rate (orders per unit time), collected into the vector This aggregation deliberately avoids order-level routing complexity and yields a state representation compatible with real-time updates from Industry 4.0 data streams (order platforms, GPS telemetry, IoT traffic feeds).
3.2.2. Capacity Allocation and Service-Rate Representation
Let
denote the effective micromobility capacity allocated to zone
i at time
t (vehicle-equivalents). The allocation vector is
and it satisfies the fleet conservation constraint
where
M is the total available fleet size.
To translate capacity into a service (order completion) rate, we introduce a zone-specific productivity coefficient
measured in orders per vehicle per unit time. Over a short interval, a common and tractable approximation is linear productivity:
The linear relation is used as a simple approximation over short control intervals. In practice, service productivity may saturate due to operational limits. Such effects can be represented by piecewise-linear or saturating service-rate functions without changing the overall structure of the proposed model.
Stacking these relations for all zones yields
3.2.3. Inter-Zonal Coupling
Urban delivery processes exhibit spatial interactions: overload in one zone can influence adjacent zones via vehicle movements, boundary effects, and operational spillovers. Rather than tracking these movements explicitly, we model their aggregate effect through a linear coupling term.
We assume the net inter-zonal effect can be written as a linear map of the current backlog:
where
is the net spatial interaction effect,
is chosen such that the dynamics are stable (intuitively, backlogs do not diverge without sustained demand). A standard, interpretable construction is a “ring” neighborhood graph with coupling strength
and local dissipation
:
3.2.4. Continuous-Time Backlog Dynamics
The backlog in zone
i increases with arrivals and decreases with completions, plus inter-zonal interaction effects. A standard flow-balance argument over a small increment
gives the expected new arrivals:
the expected completions:
and the inter-zonal net effect:
where
is the expected new arrival,
is the expected completion, and
is the inter-zonal net effect.
Divide by
and let
Stacking all components produces the compact state-space form:
3.2.5. Analytical Prediction over a Rolling-Horizon Interval
In real-time control, decisions are updated at discrete intervals of length
. Over the interval
, demand and control are assumed piecewise constant:
Under this assumption, the linear backlog dynamics
admit the closed-form discrete-time solution
where
The derivation follows directly from standard linear systems theory and is omitted for brevity.
The discretized transition matrix preserves the dissipative structure of the continuous-time coupling matrix. Because the coupling matrix is constructed to be diagonally dominant with positive dissipation terms, the matrix exponential has eigenvalues strictly inside the unit circle. Consequently, the homogeneous system is asymptotically stable. Under bounded demand inputs, the forced system therefore produces bounded backlog trajectories. In this study, stability is interpreted in this operational sense: the allocation mechanism does not induce divergence in the aggregated backlog dynamics.
3.2.6. Physical Feasibility: Non-Negativity of Backlog
The backlog must remain non-negative: . Because the service model does not automatically shut off when a zone becomes empty, we enforce feasibility at the discrete update level.
Imposing
yields
Thus, backlog non-negativity translates into linear inequalities in the decision variable , which preserves convexity and real-time solvability.
Together with fleet conservation and non-negativity of
u, the feasibility set becomes
and optionally
.
3.2.7. Real-Time Optimization with Sustainability Objectives
The control goal is to allocate capacity to reduce backlog while accounting for environmental impact and operational stability. Let
be backlog importance weights, and let
denote zone-specific emission/energy factors (e.g., kgCO
2 per vehicle-hour). A standard rolling-horizon cost for interval
k is
with
and
We can convert
into a linear term in
u. Using Equation (19),
, we obtain
The constant term does not affect the optimizer and can be dropped.
Expand the quadratic smoothing term
The final term is constant and can be dropped.
Combining Equations (22) and (24) and removing constants yields
This is a convex quadratic program of the standard form
with
Subject to the linear constraints from feasibility:
This structure is directly solvable with MATLAB’s quadprog (or linprog if ) (MATLAb R2024b Version).
The main symbols used in the mathematical model are summarized in
Table 1.
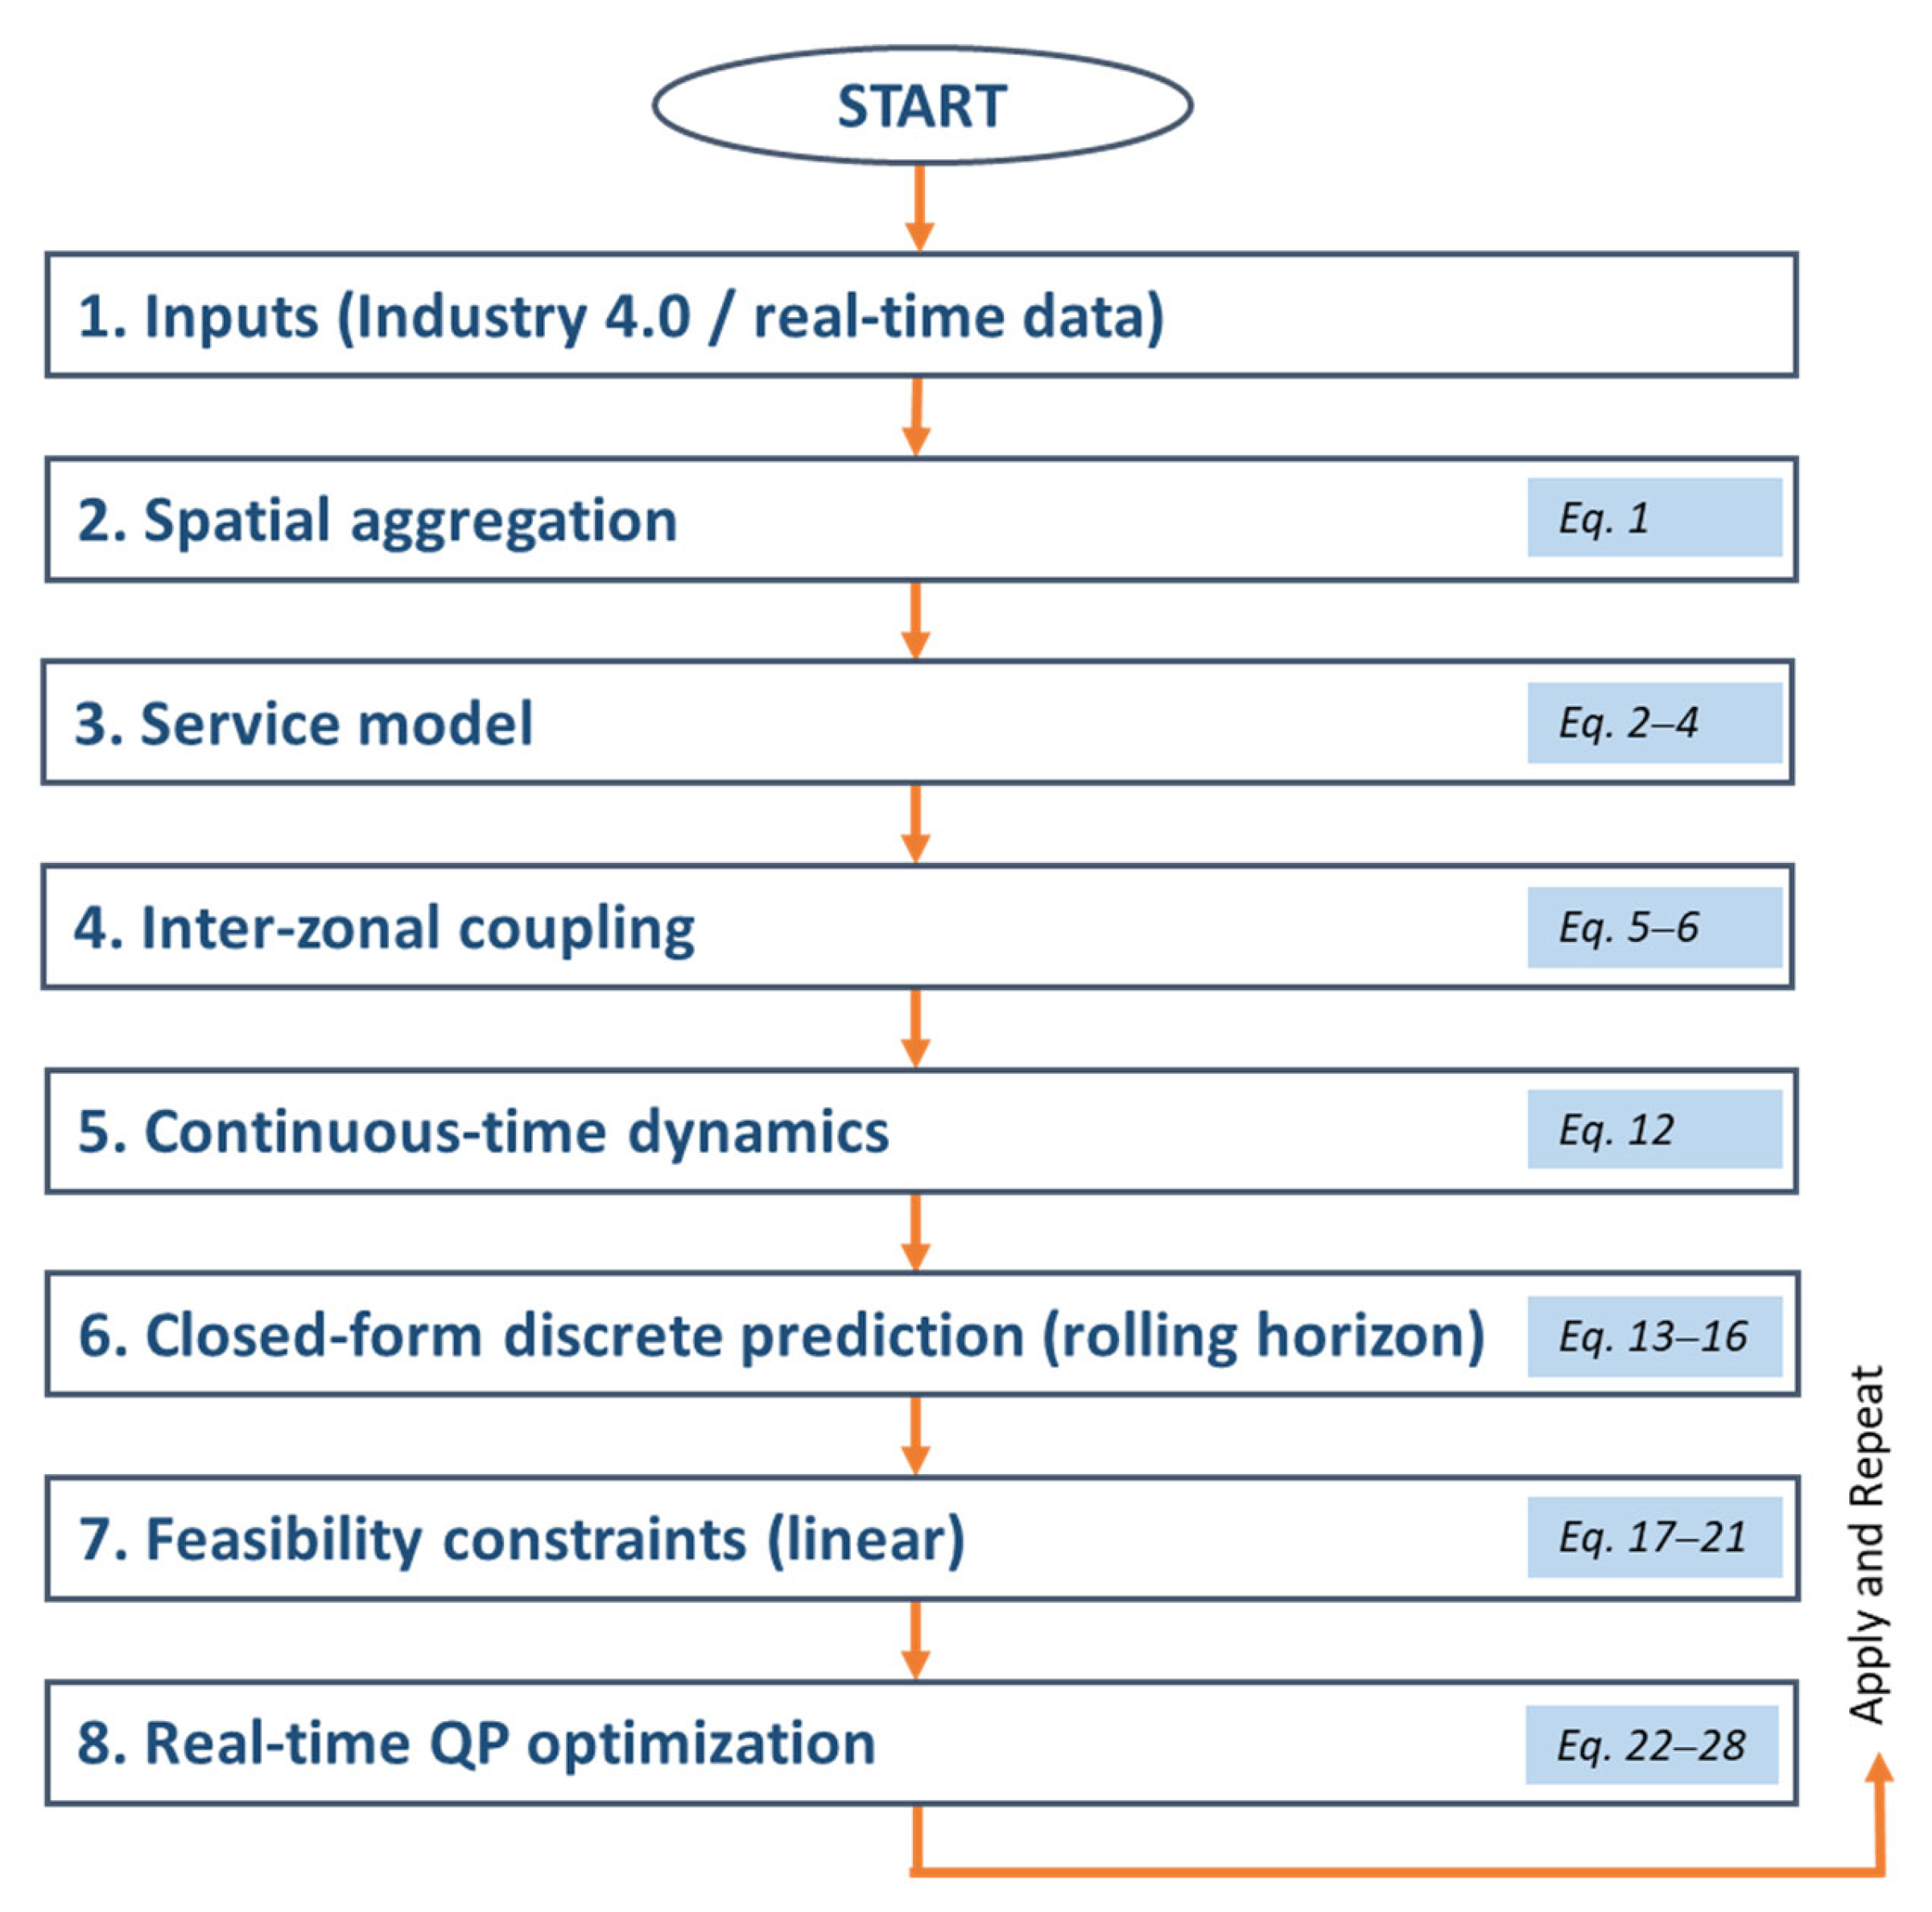
Figure 7 shows the step-by-step construction of the analytical zone-based backlog model and real-time QP control.
The model was implemented in MATLAB using a rolling-horizon QP scheme.
4. Numerical Analysis and Results
To evaluate the proposed quadratic programming–based fleet allocation framework, a representative numerical case study was constructed for a zone-based micromobility last-mile logistics system. The objective of the example is to demonstrate feasibility, stability, and the sustainability–service trade-off under realistic heterogeneous operating conditions.
The numerical example is intentionally constructed at a moderate scale to ensure transparency and interpretability of the structural properties of the model. The objective of the case study is not to replicate the full complexity of a large metropolitan logistics system, but to demonstrate feasibility, stability, and the emission–service trade-off within a controlled setting. Since the framework operates at the aggregated zone level and is formulated as a convex quadratic program, its computational complexity grows primarily with the number of zones rather than with the number of individual deliveries. Therefore, the approach is structurally scalable to larger systems, provided that zone-level aggregation remains meaningful.
4.1. Model Parameters
The service region is divided into interconnected zones arranged in a ring-topology spatial structure. The total available fleet size is fixed at vehicle-equivalent units. The optimization is performed in discrete time with a rolling horizon interval of h.
The initial backlog state is defined as:
representing moderate congestion across all zones, with elevated pressure in Zones 3 and 7. Forecasted demand arrival rates (orders/hour) are given by
introducing spatial heterogeneity in incoming workload.
Zone-specific service productivity parameters (orders/hour/vehicle) are defined as
and collected into the diagonal matrix
. These coefficients capture operational variability such as traffic density and spatial accessibility.
Spatial interaction between zones is modeled using a ring-topology coupling matrix
K. The neighbor interaction coefficient is set to
while local dissipation parameters are
The resulting matrix is diagonally dominant, ensuring dissipative backlog dynamics. The discrete-time state transition matrix is obtained as , preserving system stability.
Sustainability is incorporated via zone-specific emission factors (kgCO
2 per vehicle-hour),
with emission weight parameter
. Service priority is modeled using backlog weights
To prevent excessive fleet reconfiguration between time steps, a quadratic smoothing penalty with parameter
is introduced. The previous allocation is
and box constraints
are imposed.
Based on these parameters, the discrete-time system matrices A, F, and G are constructed, and the quadratic optimization problem is solved under fleet conservation and backlog non-negativity constraints. The resulting allocation, system response, and trade-off characteristics are analyzed in the following subsection.
4.2. Numerical Results
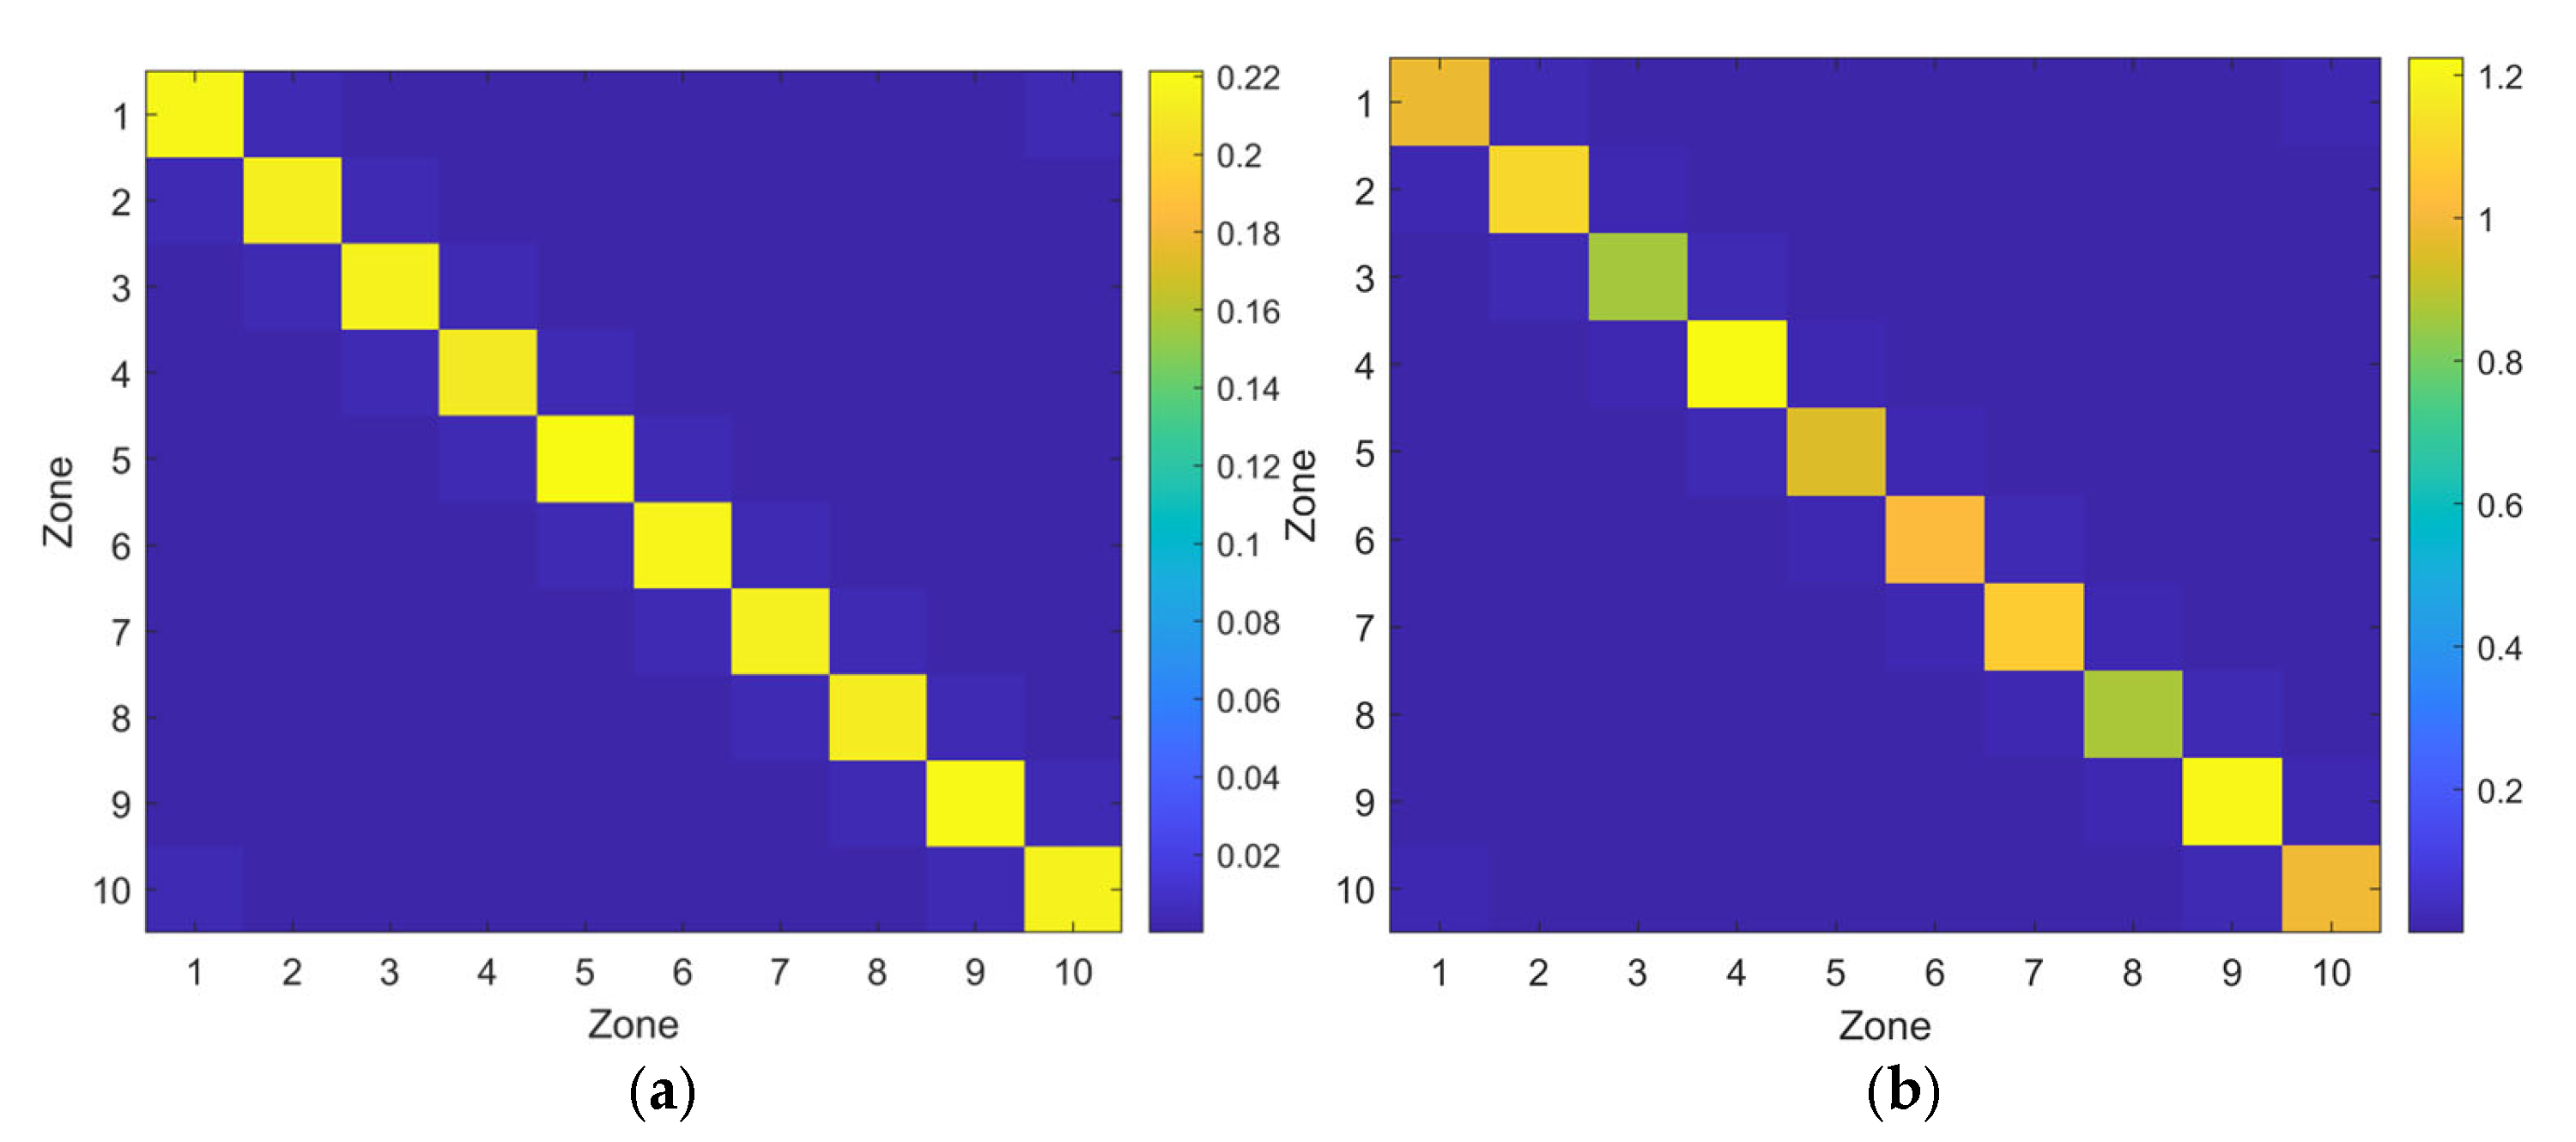
The structural properties of the dynamic model are illustrated in
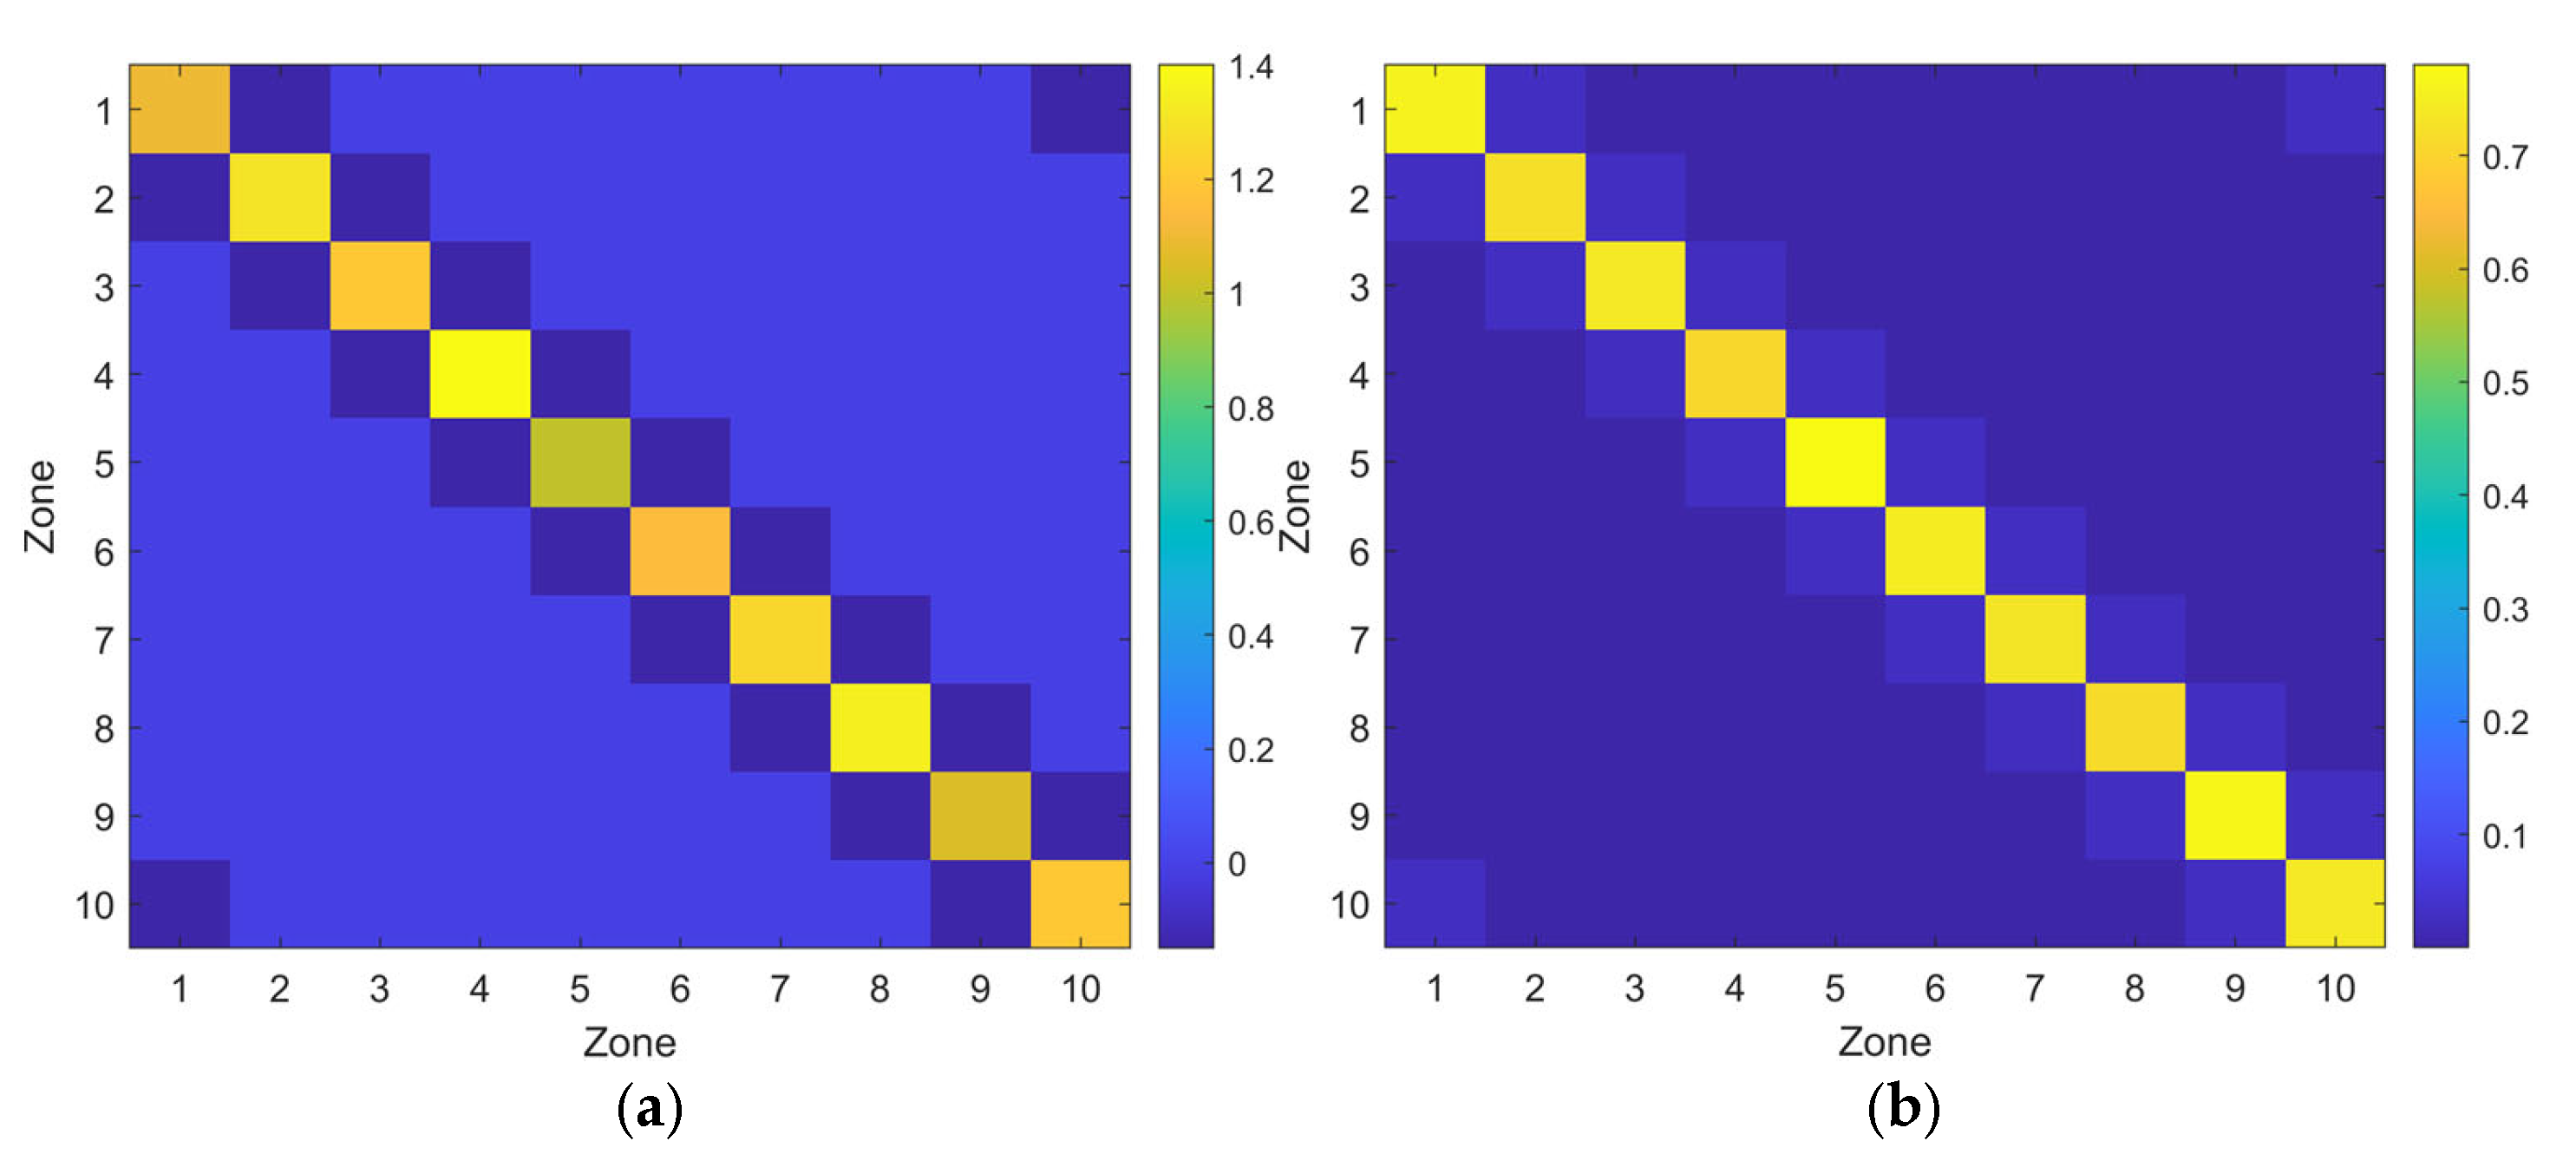
Figure 8 and
Figure 9. The continuous-time coupling matrix
K exhibits diagonal dominance, indicating dissipative backlog dynamics with local interactions between neighboring zones. After discretization, the transition matrix
A retains these properties. The eigenvalue analysis presented later confirms that stability is preserved under the chosen sampling interval. Matrices
F and
G describe how external demand and fleet allocation influence backlog evolution. Matrix
F maps incoming order intensity to backlog growth over one control interval, while matrix
G captures the effect of allocation decisions on backlog reduction across zones. Together, these matrices provide a direct link between model inputs, control actions, and state evolution.
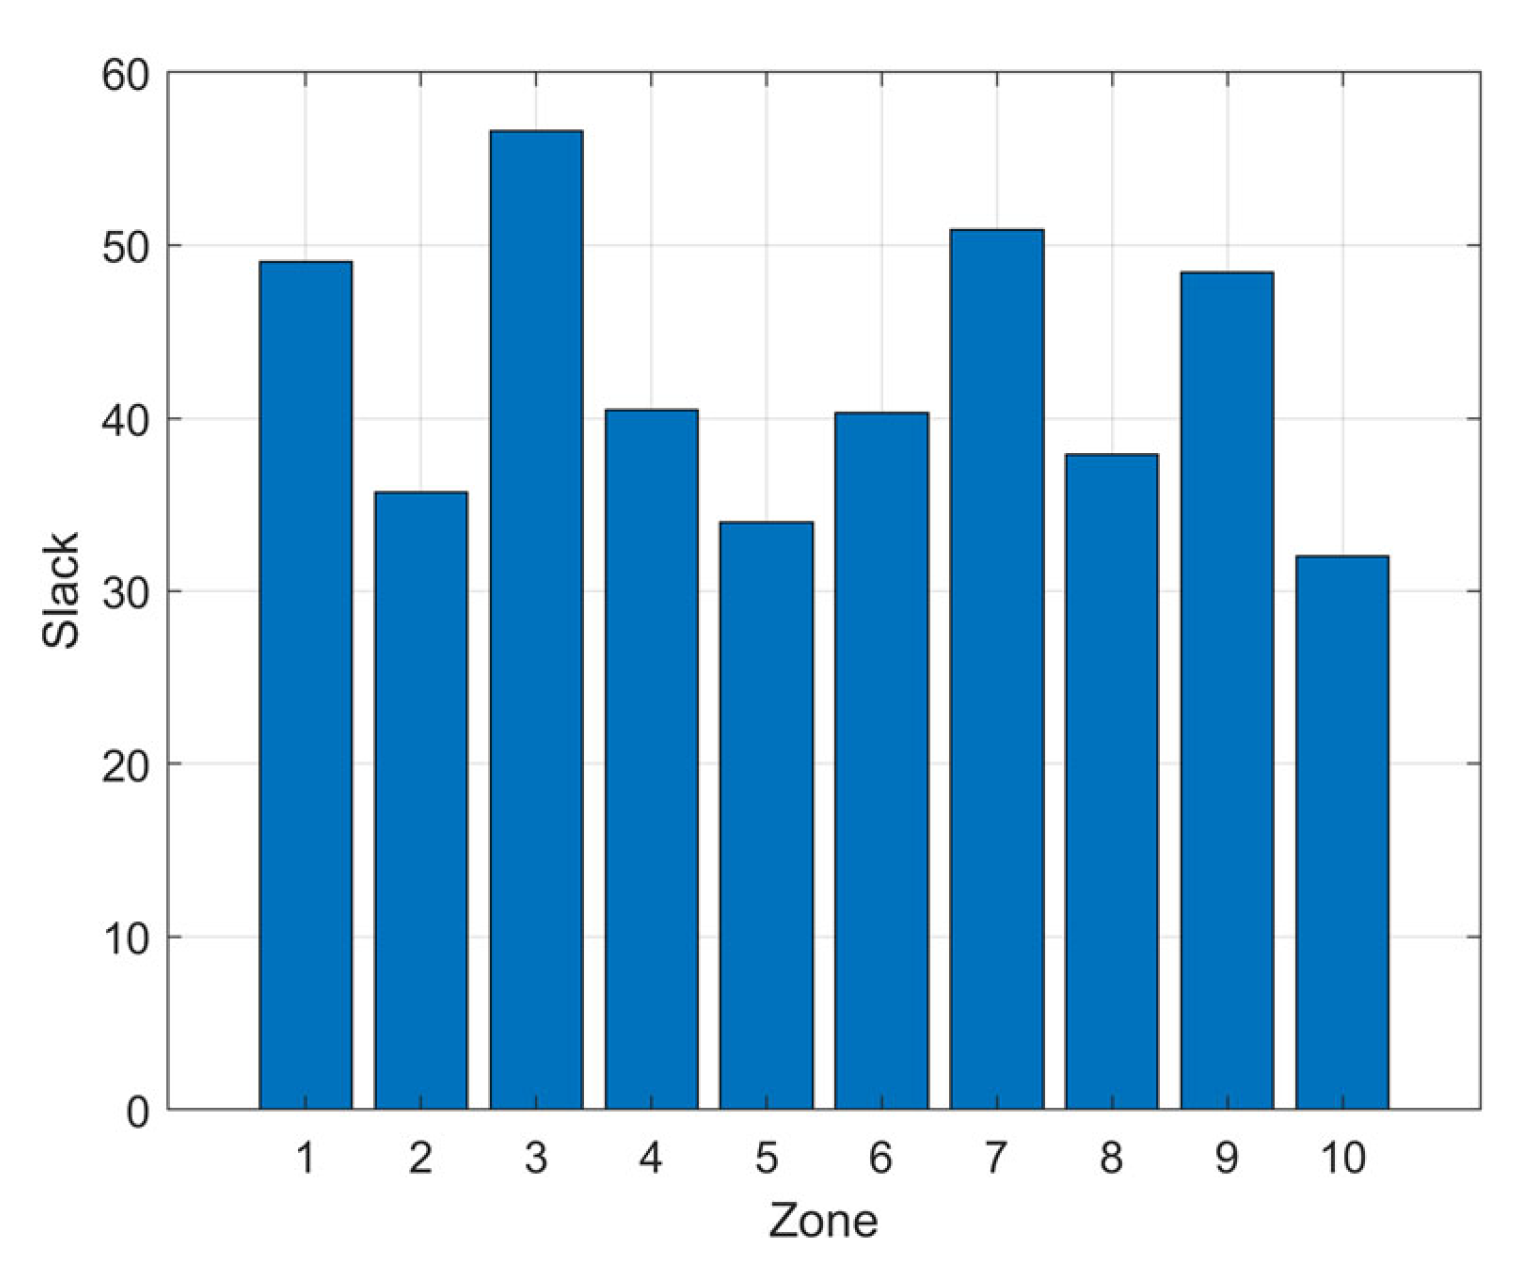
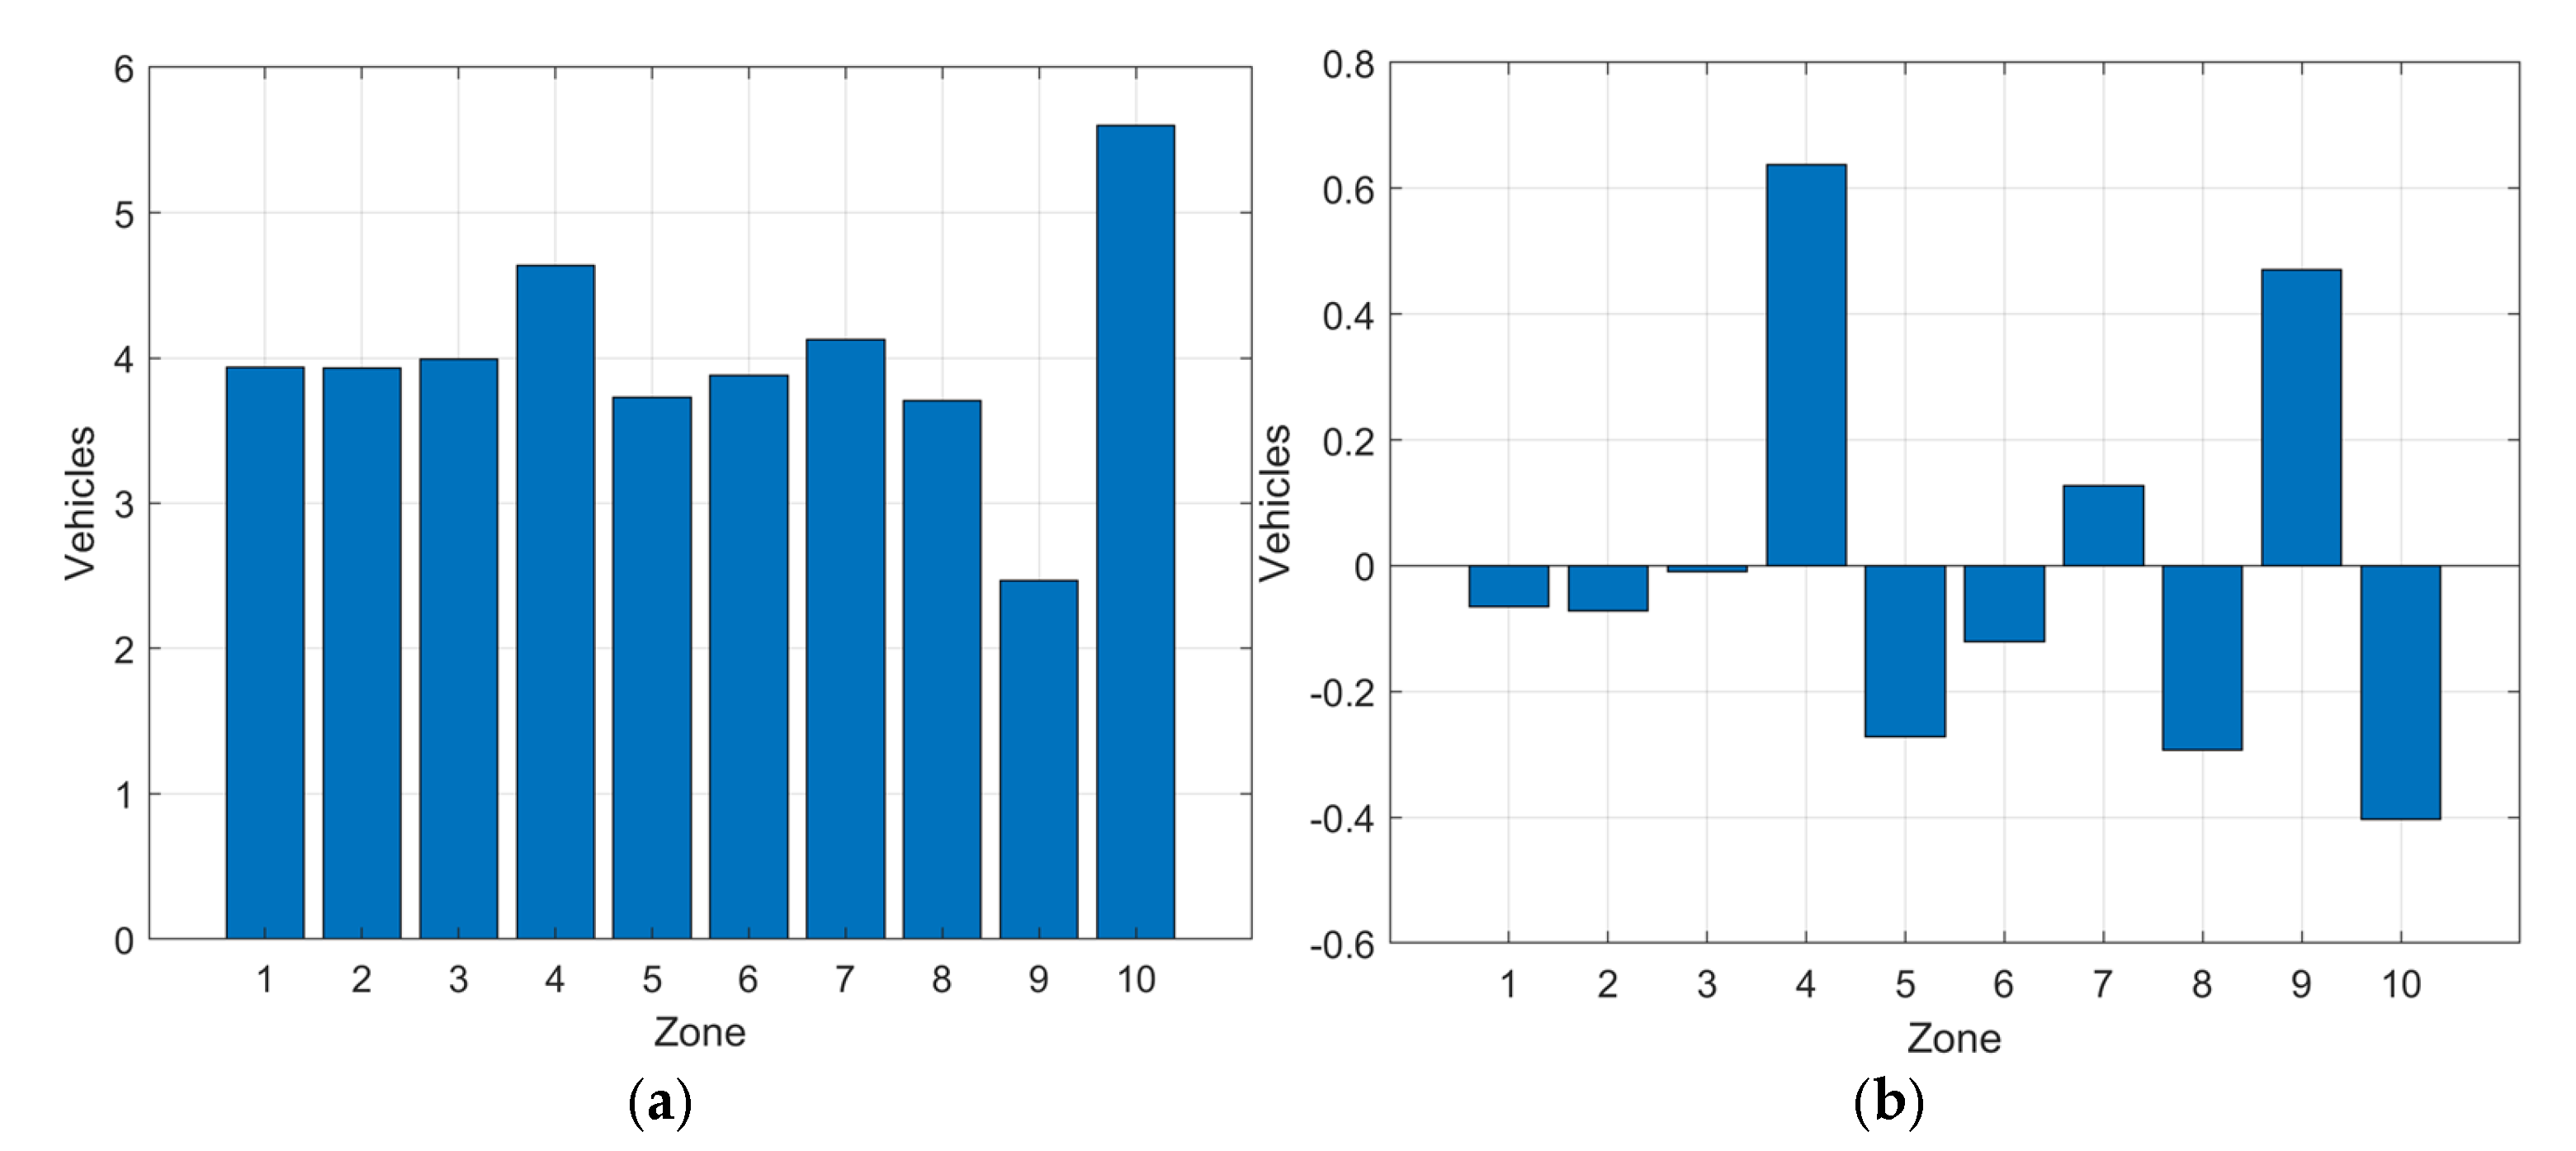
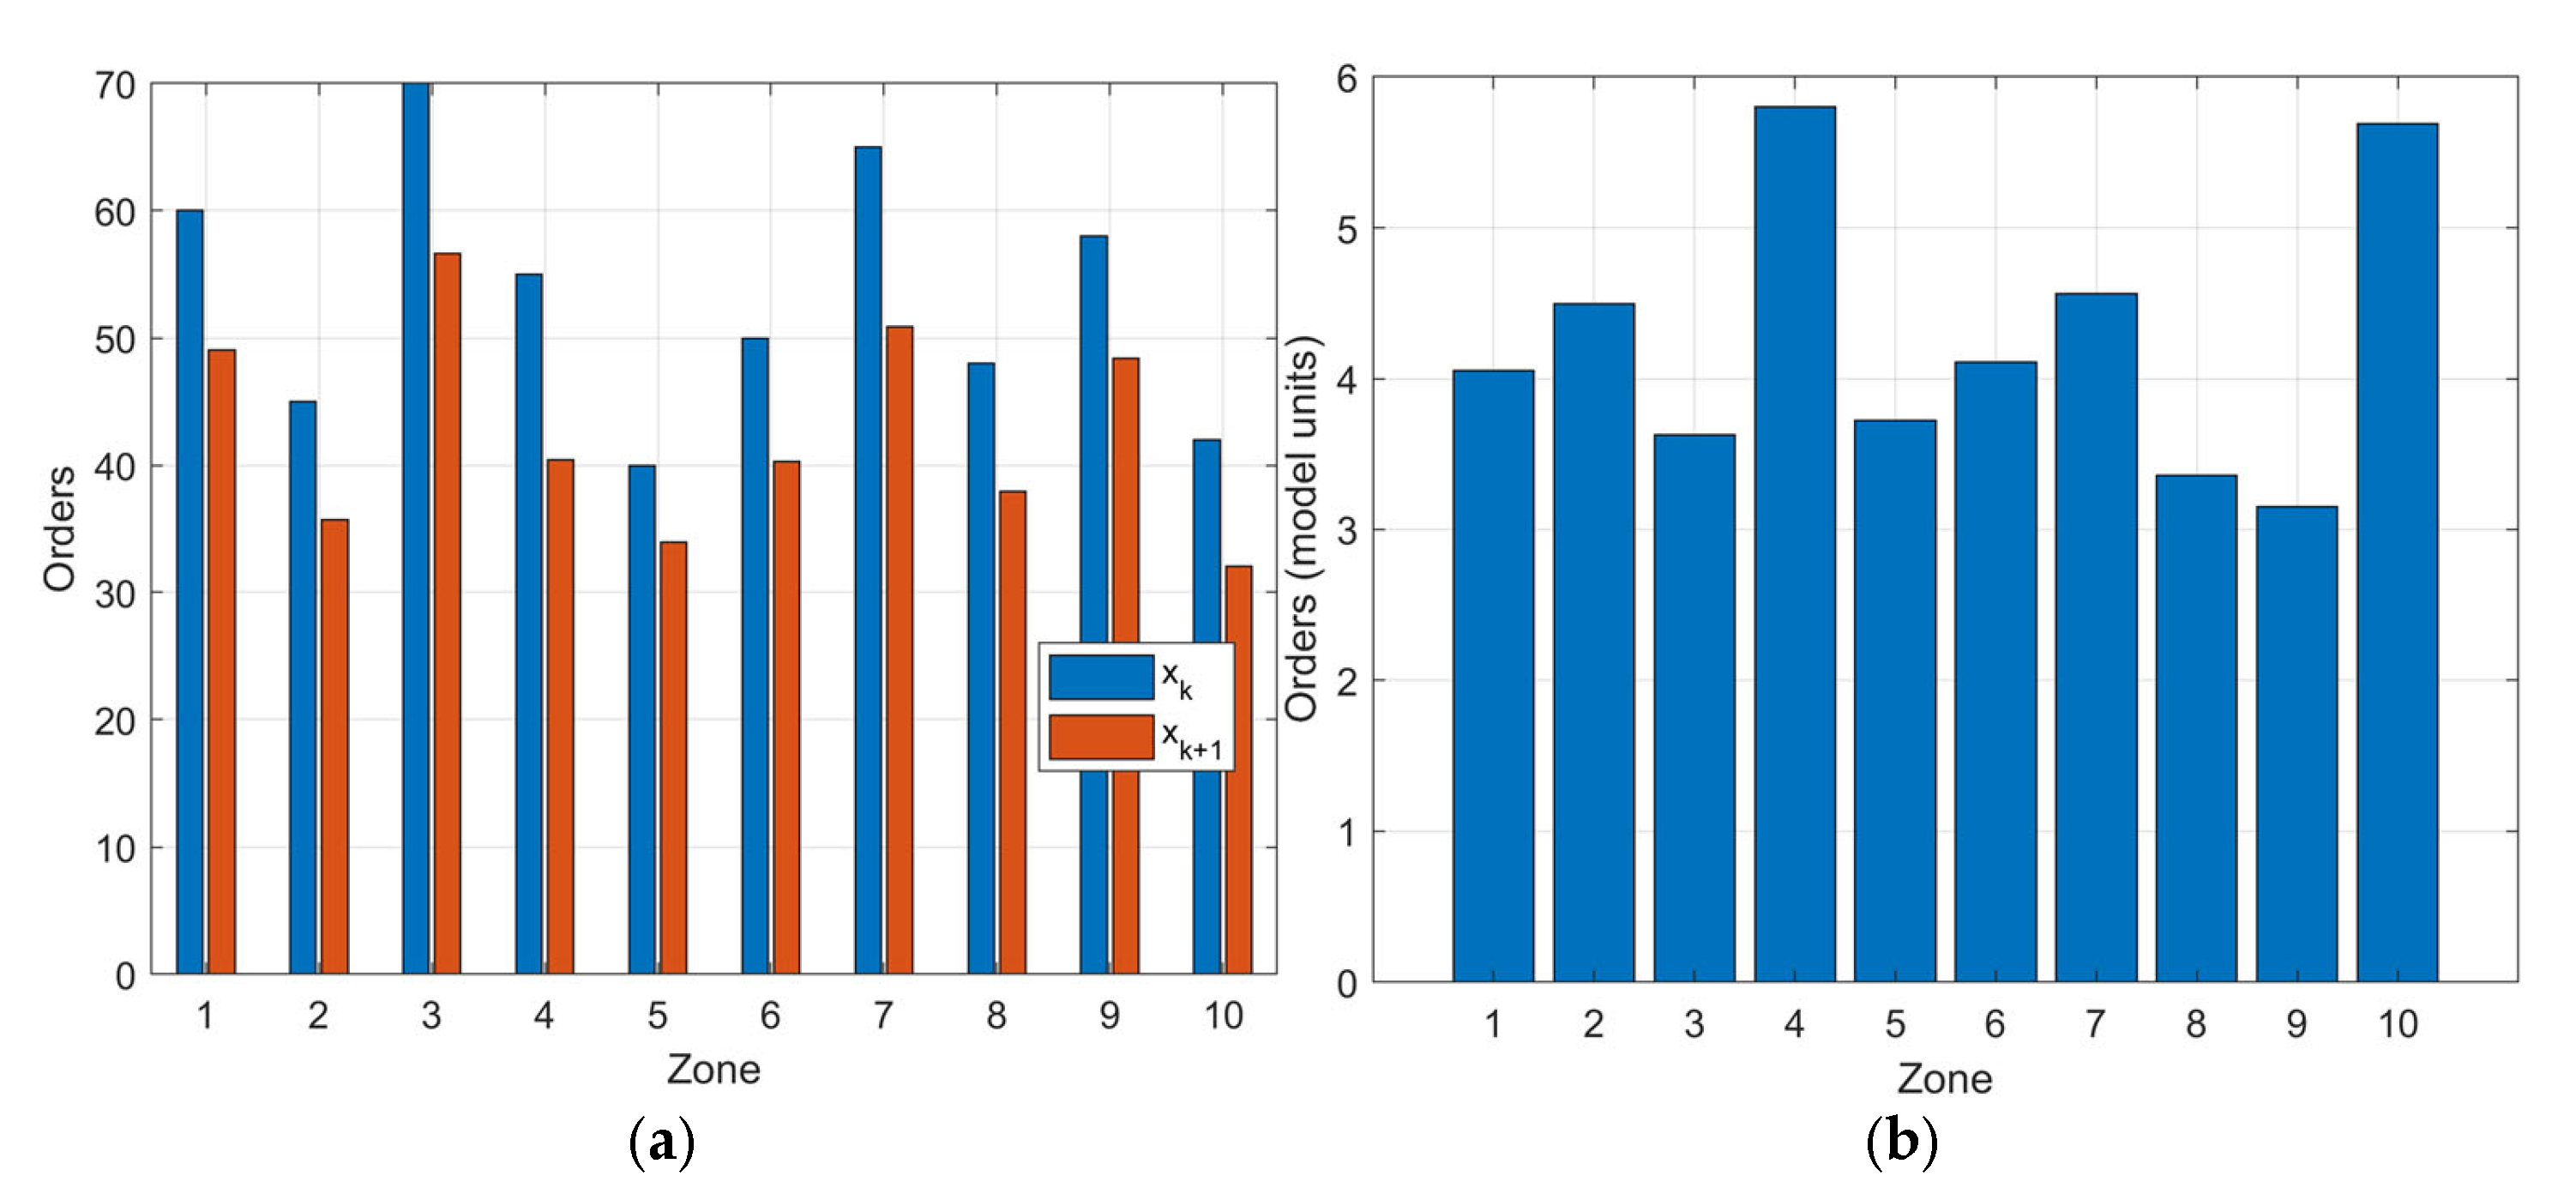
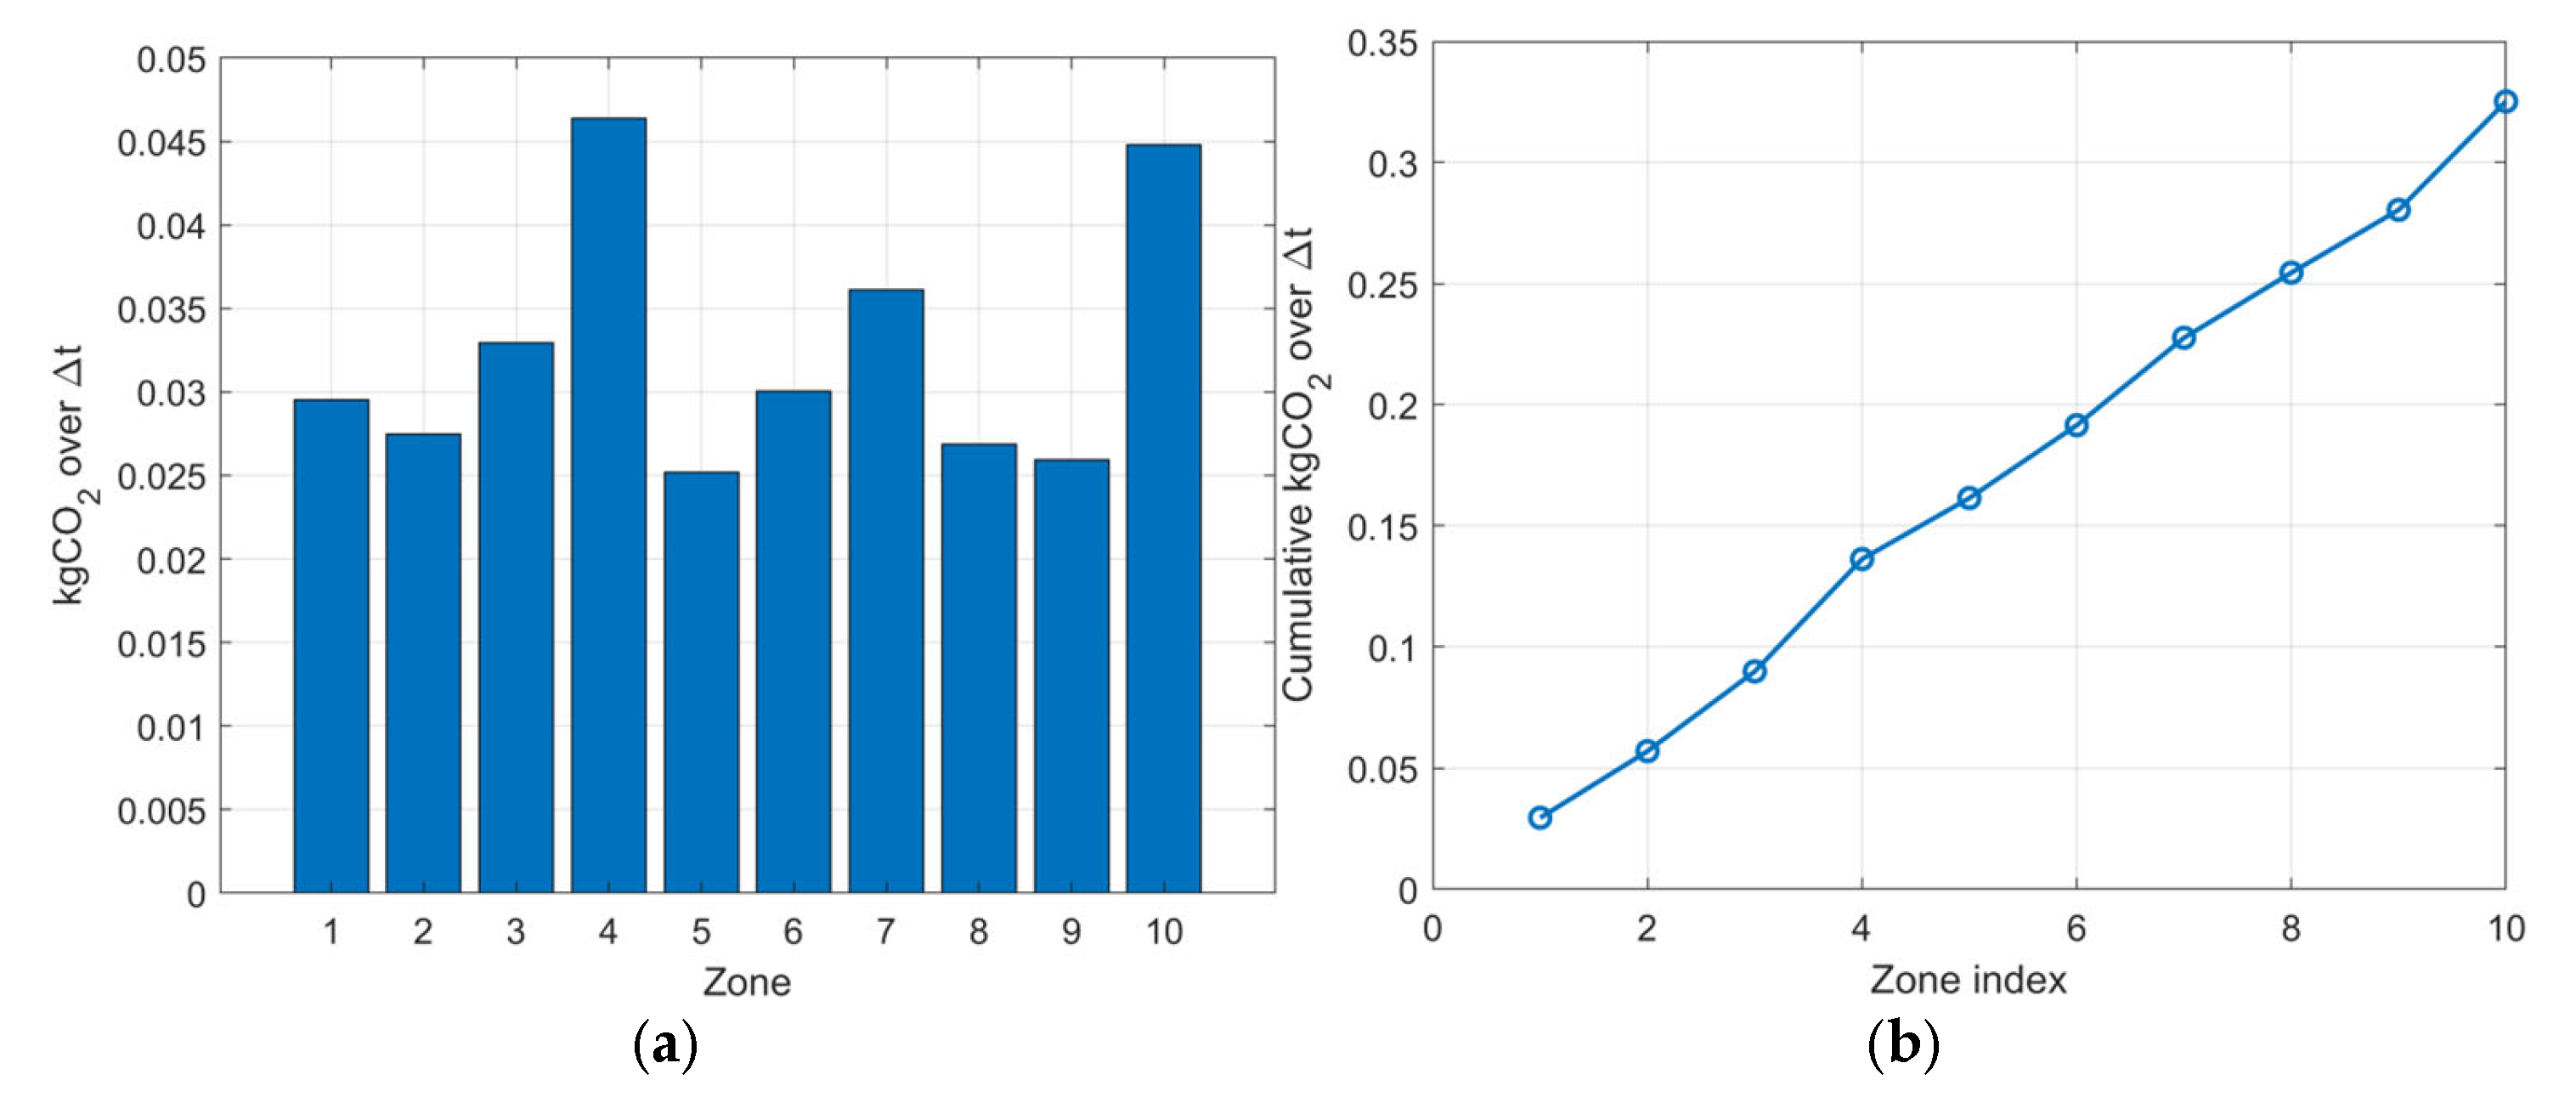
The optimization results are summarized in
Figure 10,
Figure 11 and
Figure 12. The computed fleet allocation is non-uniform across zones, reflecting differences in backlog intensity, emission penalties, and smoothing constraints. Compared to the previous allocation, adjustments remain moderate due to the quadratic smoothing term. The predicted next-state backlog decreases in all zones while remaining non-negative. Slack values associated with the inequality constraints remain positive, indicating that the solution operates within feasible limits. Zones with near-zero slack can be interpreted as operating close to capacity saturation. The modeled backlog reduction term
highlights where capacity deployment has the strongest marginal impact. This provides additional insight into the internal structure of the optimization outcome.
Figure 13 reports the emission outcomes associated with the optimal allocation. Emissions scale with allocated capacity and zone-specific emission factors. The cumulative representation allows comparison of environmental contributions across zones and reflects the spatial distribution implied by the objective function.
The objective decomposition in
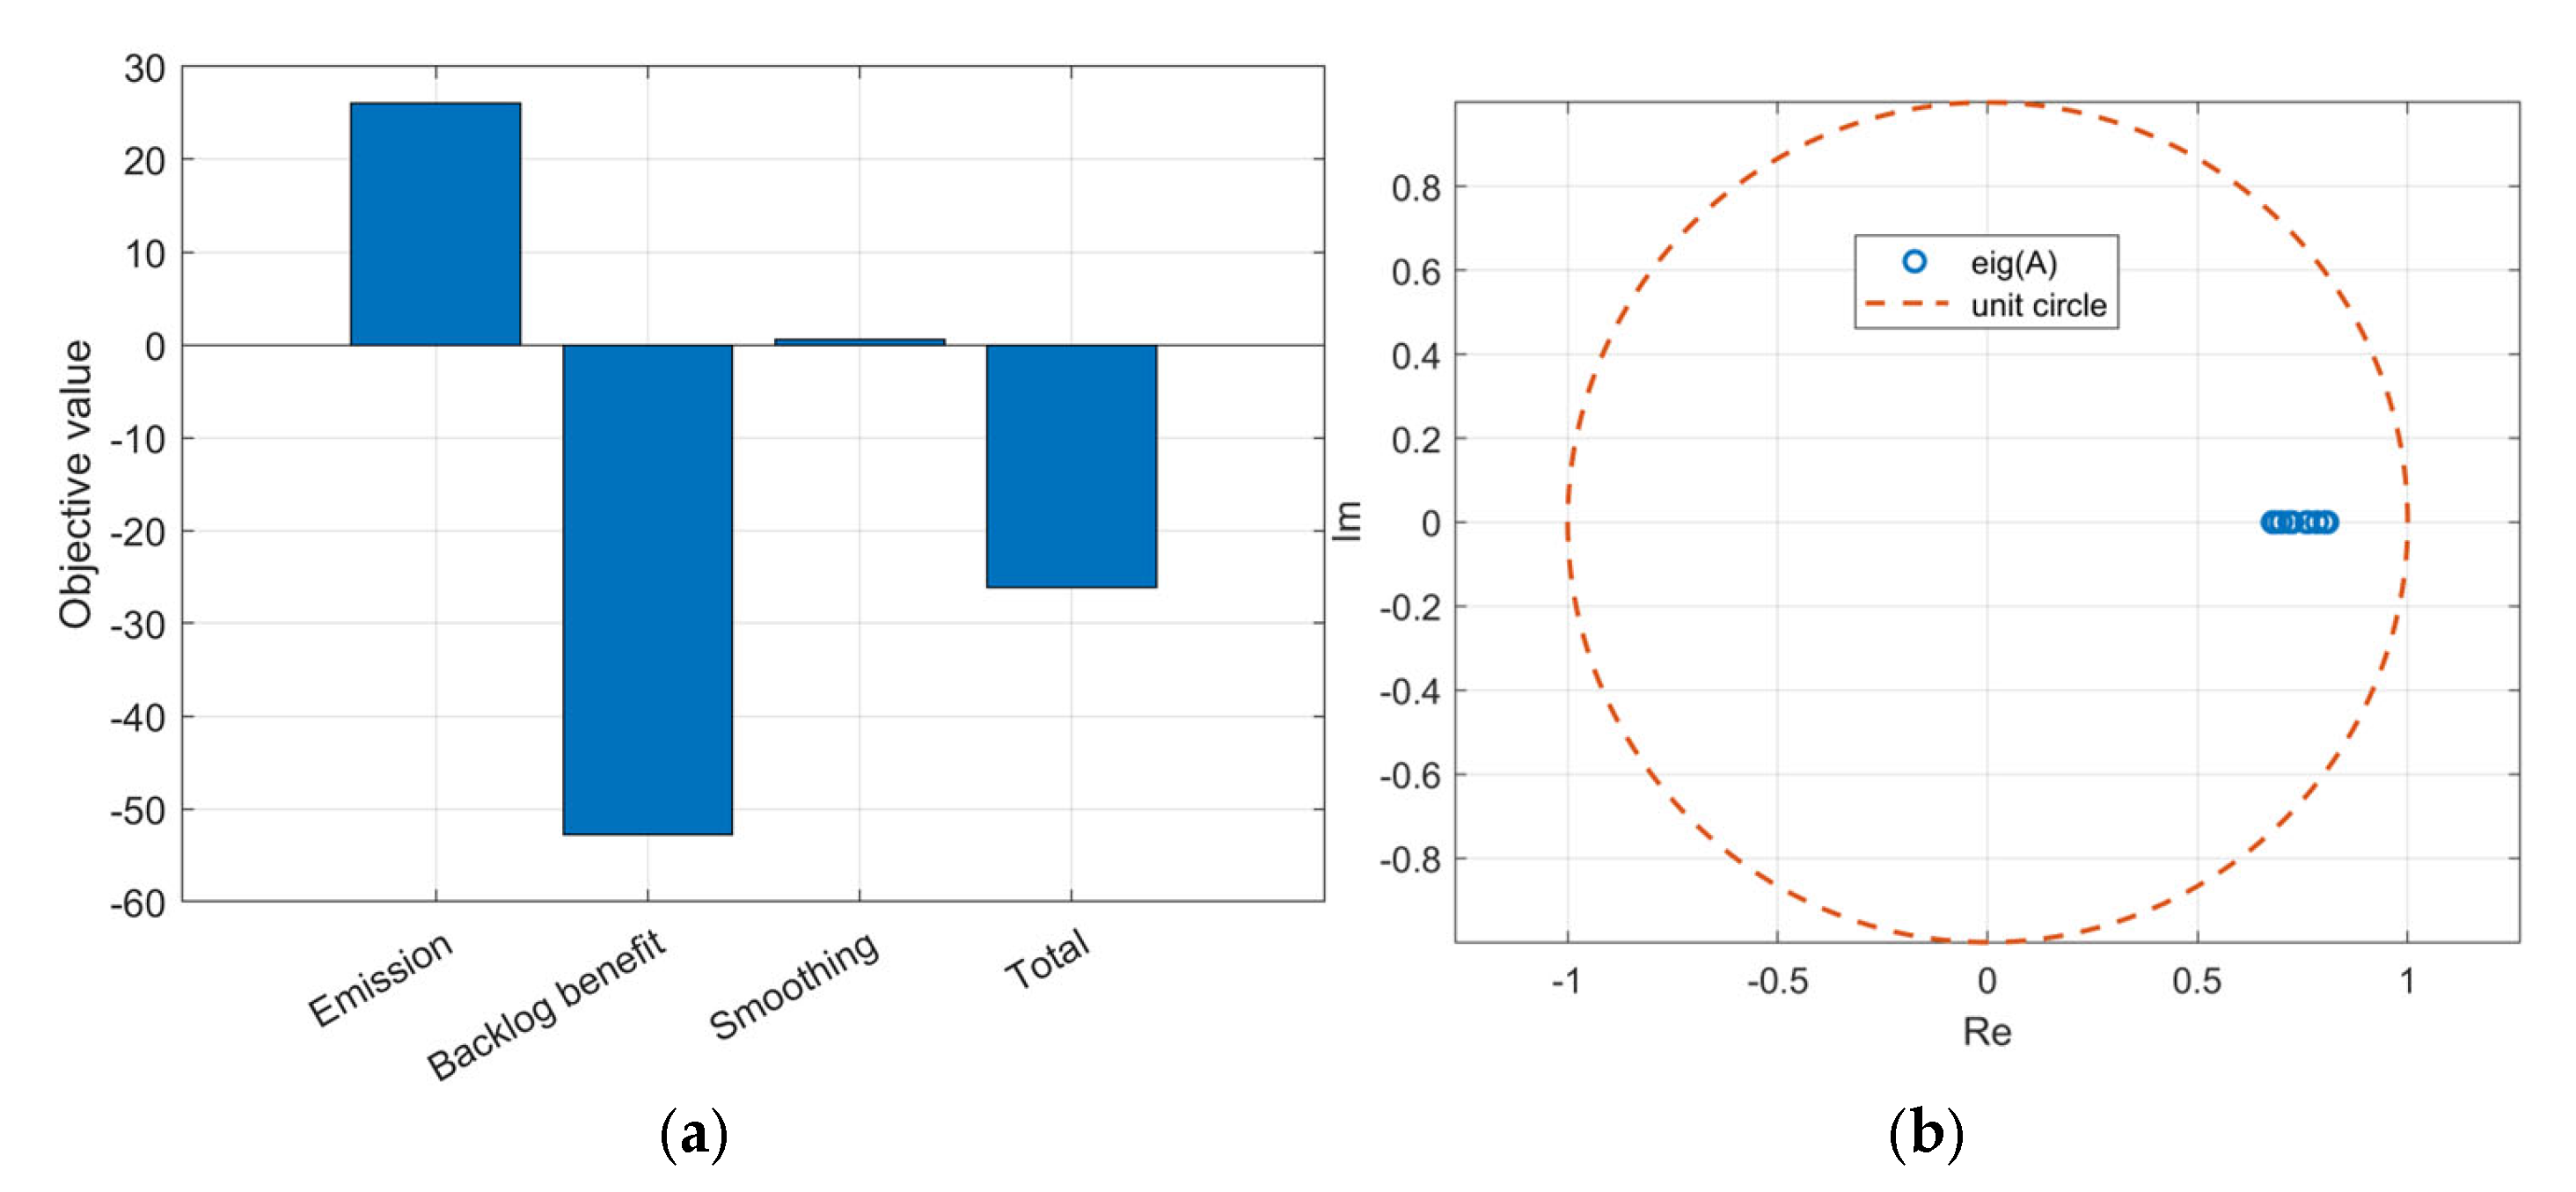
Figure 14a separates the emission cost, backlog-reduction benefit, and smoothing penalty. The backlog term constitutes the dominant component, while emission and smoothing terms act as moderating factors. Eigenvalue plots in
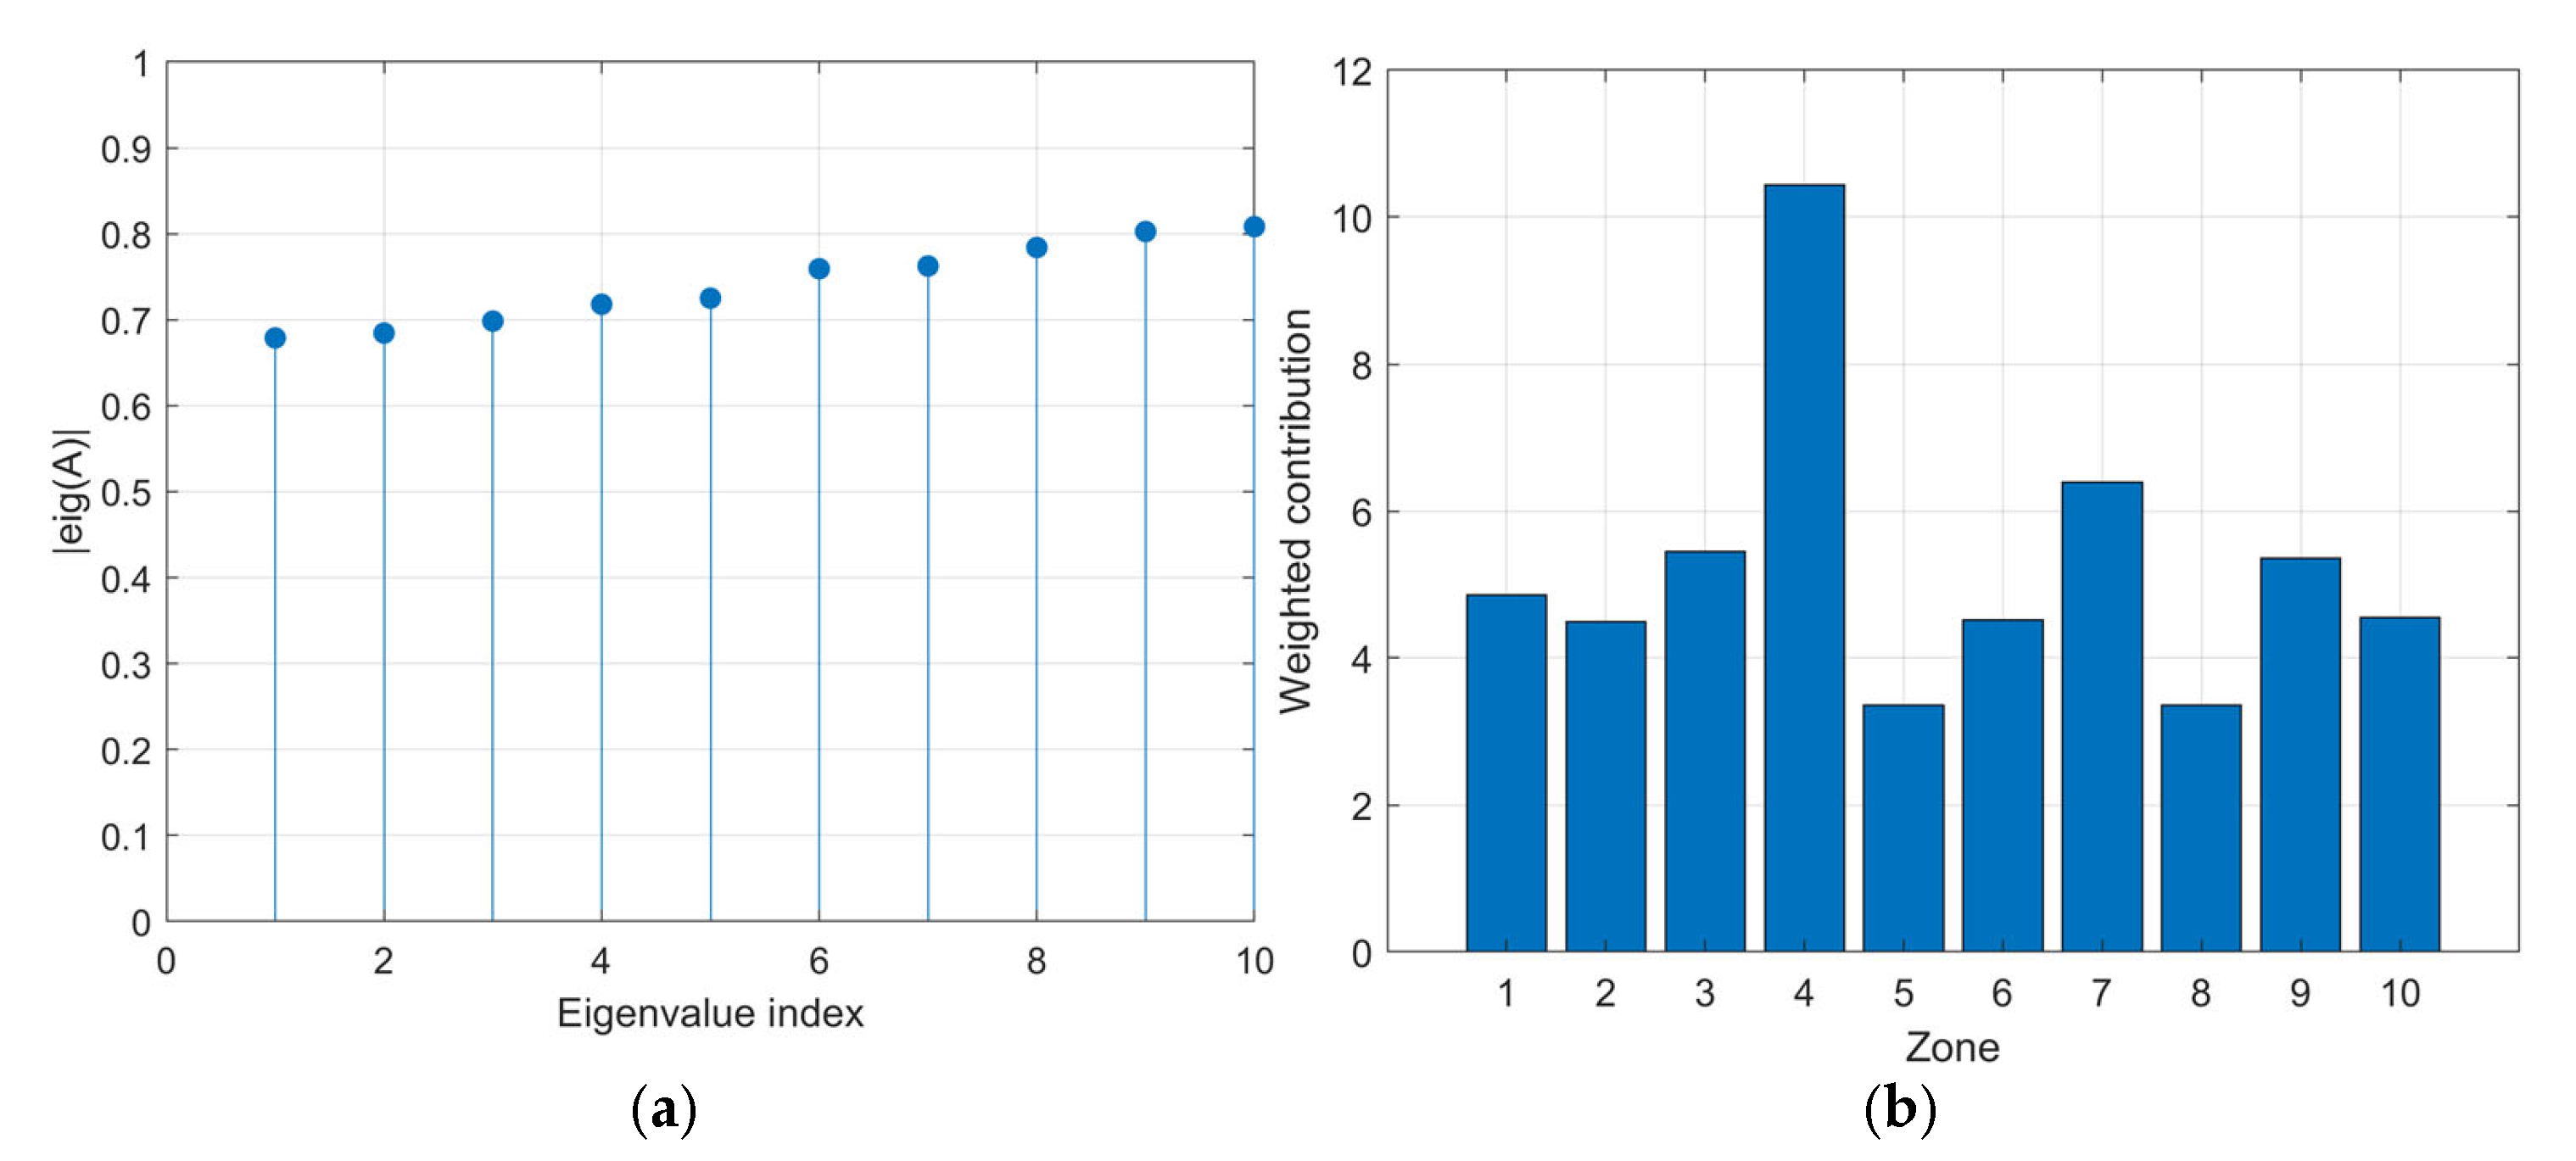
Figure 14b and
Figure 15a show that all eigenvalues of the discretized transition matrix lie inside the unit circle. The spectral radius remains below one, indicating asymptotic stability of the discrete-time system under the assumed demand conditions.
Figure 15b presents the weighted contribution
per zone, combining service effectiveness with priority weighting. Zones with higher values play a more influential role in the objective structure.
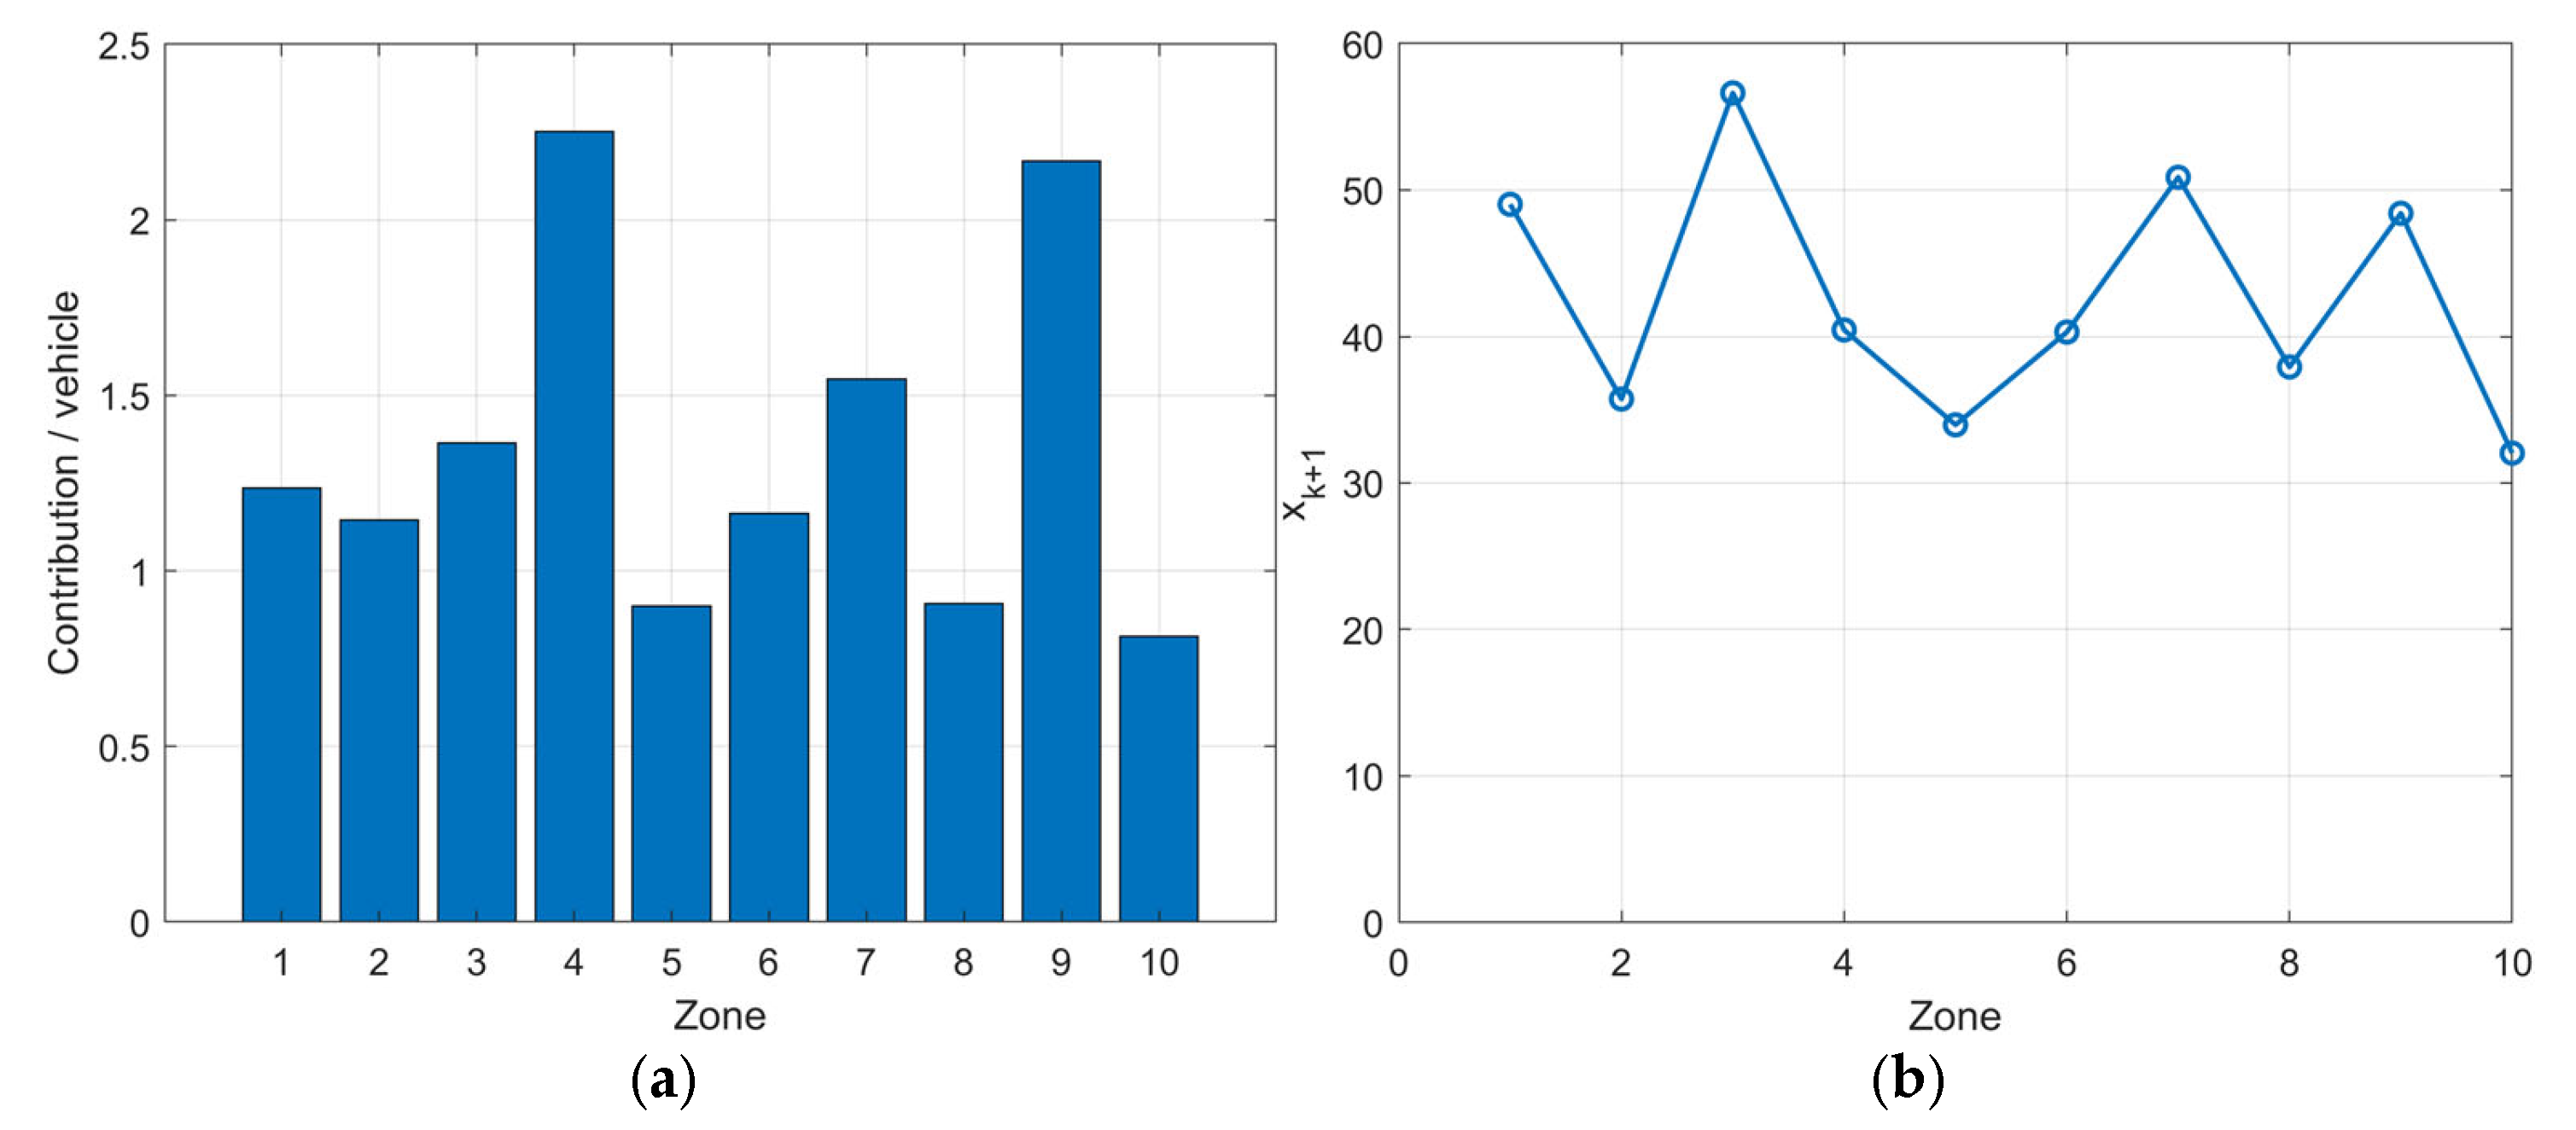
Figure 16a displays the weighted backlog reduction per allocated vehicle, which can be interpreted as a marginal efficiency indicator. Differences across zones reflect spatial heterogeneity in service productivity.
Figure 16b verifies that the predicted backlog remains non-negative after the allocation step, confirming feasibility of the optimization result.
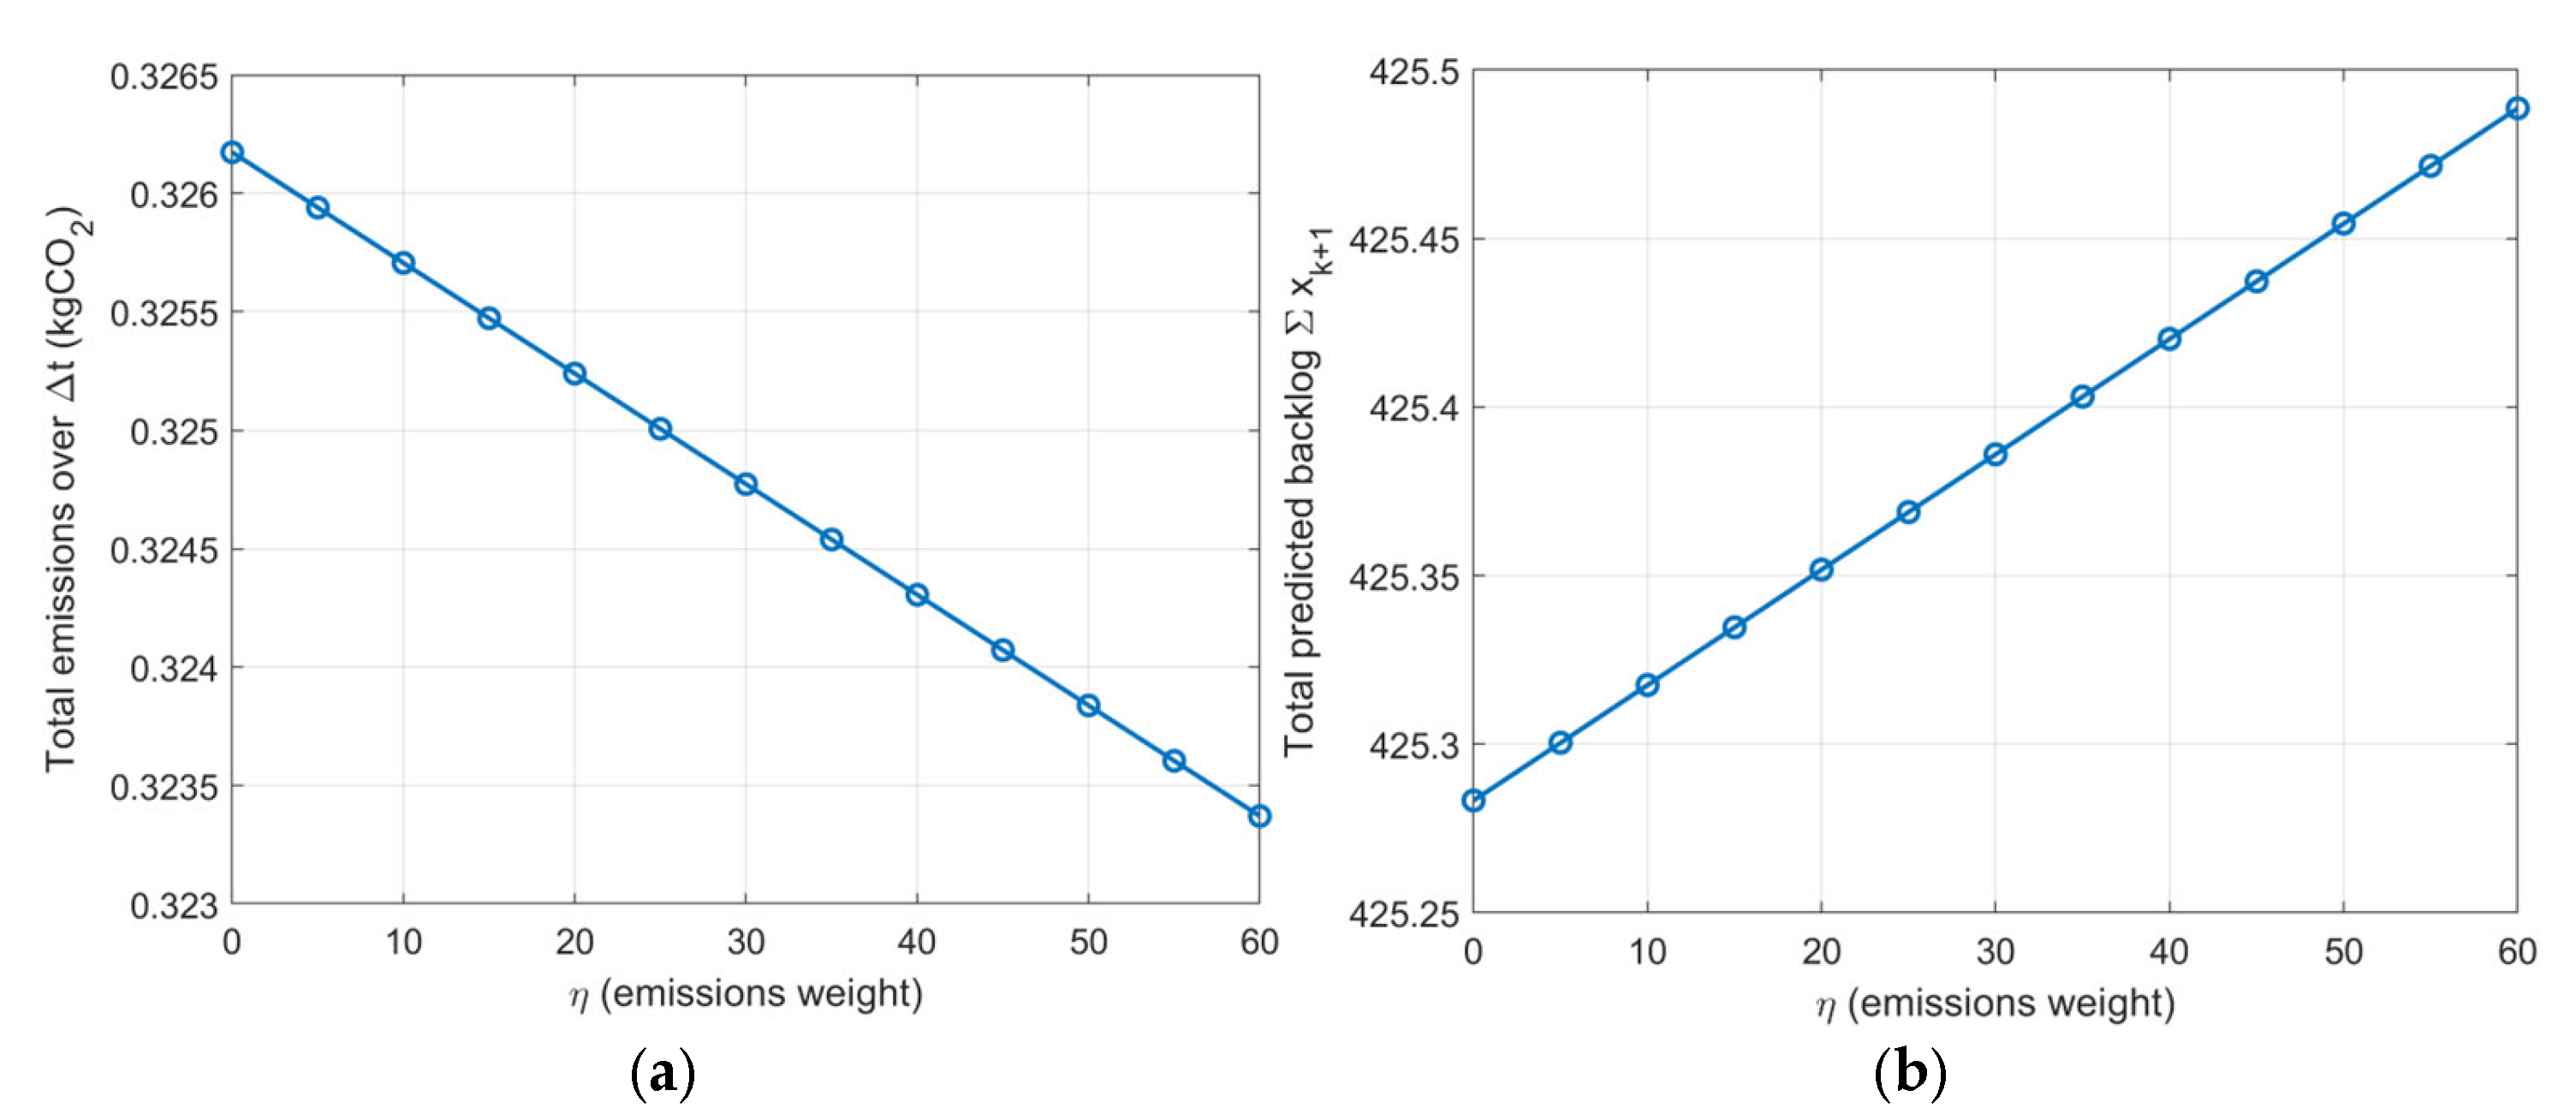
Figure 17 and
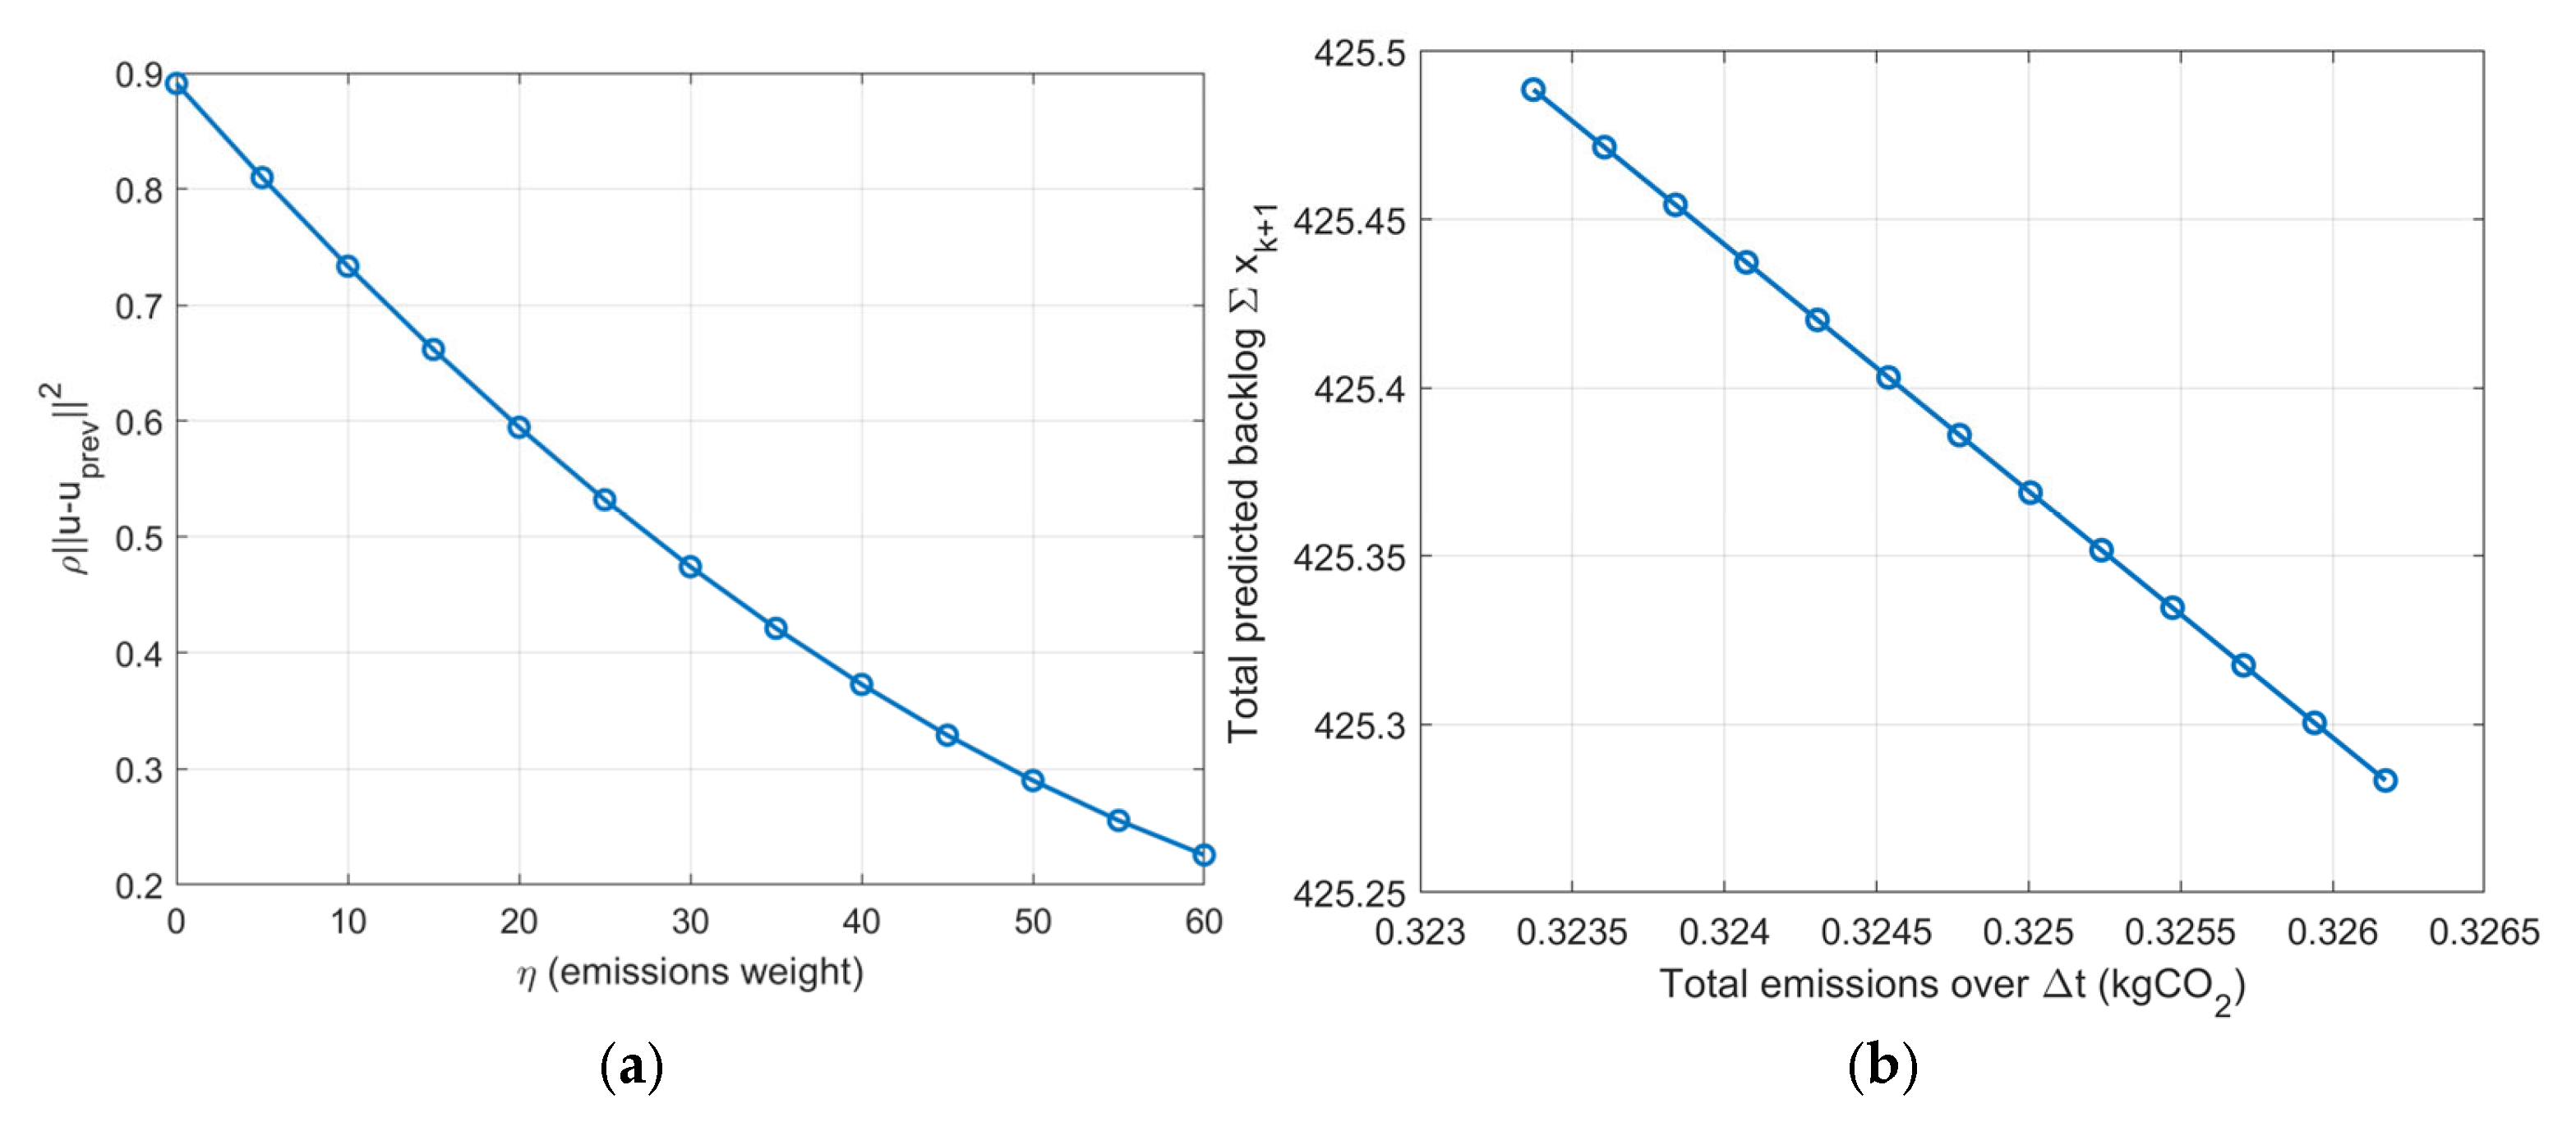
Figure 18 examine sensitivity to the emission weight parameter. As the emission weight increases, total emissions decrease, while predicted backlog increases moderately. This reflects the trade-off between environmental performance and service level.
The emission–backlog curve in
Figure 18b forms a Pareto-type relationship, representing alternative operating points corresponding to different environmental priorities. Changes in the emission weight also influence smoothing cost, indicating interaction between environmental emphasis and reallocation intensity.
To better assess the practical advantage of the proposed optimization framework, the optimal allocation was compared with two simple baseline strategies. The first baseline distributes the available fleet uniformly across all zones, while the second allocates vehicles proportionally to the current backlog levels. These strategies represent intuitive heuristic rules that do not require solving an optimization problem and therefore provide a useful reference point for evaluating the proposed method.
As shown in
Table 2, the proposed quadratic programming approach achieves the best overall objective value among the tested strategies. In particular, the optimized allocation results in the lowest emission level while maintaining a backlog level comparable to the heuristic allocation rules.
The small differences in backlog values indicate that the optimization primarily improves environmental performance without significantly affecting service levels. This confirms that the proposed framework provides a more balanced trade-off between service efficiency, sustainability, and allocation stability.
The matrix visualizations (
Figure 8 and
Figure 9) show that the continuous-time coupling matrix
K is diagonally dominant, leading to dissipative behavior, while the discretized transition matrix
A preserves stability, as reflected in the eigenvalue distributions (
Figure 14b and
Figure 15a). The matrices
F and
G clarify how demand inflow and fleet allocation influence backlog evolution, linking control decisions to state dynamics in a transparent manner.
The optimization outcomes (
Figure 10,
Figure 11,
Figure 12 and
Figure 13) yield a non-uniform yet balanced fleet distribution across zones. Allocation reflects backlog reduction efficiency, emission weighting, and smoothing constraints. The predicted next-state backlog decreases across all zones while remaining non-negative, and slack values remain positive, indicating that feasibility constraints are satisfied without operating at their limits.
Figure 13,
Figure 17 and
Figure 18 illustrate the trade-off between environmental impact and service performance. Increasing the emission weight reduces total emissions at the cost of a moderate increase in predicted backlog, forming a Pareto-type curve (
Figure 18b). This allows the allocation strategy to be adjusted according to operational or policy priorities rather than enforcing a single fixed operating point.
The objective decomposition (
Figure 14a) shows that backlog reduction constitutes the dominant component of the objective, with emission and smoothing terms acting as moderating factors. The eigenvalues of the discretized system lie inside the unit circle, corresponding to asymptotically stable behavior.
The case study suggests that the zone-based backlog model combined with quadratic programming can be implemented in real time while maintaining feasibility and stability. The allocation strategy reduces backlog effectively and allows environmental considerations to be incorporated directly into operational decisions.
However, these results should be interpreted in light of the modeling assumptions. The zone-level aggregation abstracts from route-level heterogeneity, and demand is treated as piecewise constant within each control interval. While these assumptions enable analytical prediction and computational efficiency, further investigation would be needed to assess performance under highly volatile demand patterns or more detailed spatial representations. The proposed model offers a tractable formulation for real-time micromobility allocation under dynamic demand conditions.
The zone-based representation therefore does not attempt to reproduce detailed route-level dynamics. Instead, it captures their aggregate operational effect through the backlog state variable, which represents the number of outstanding delivery orders within each zone. The purpose of the framework is to support real-time supervisory fleet allocation rather than detailed routing decisions. In practical implementations, route optimization can still be performed locally within each zone after the fleet allocation decision has been determined. Future work may integrate the proposed zone-level allocation mechanism with route-level simulation models to further evaluate aggregation effects.
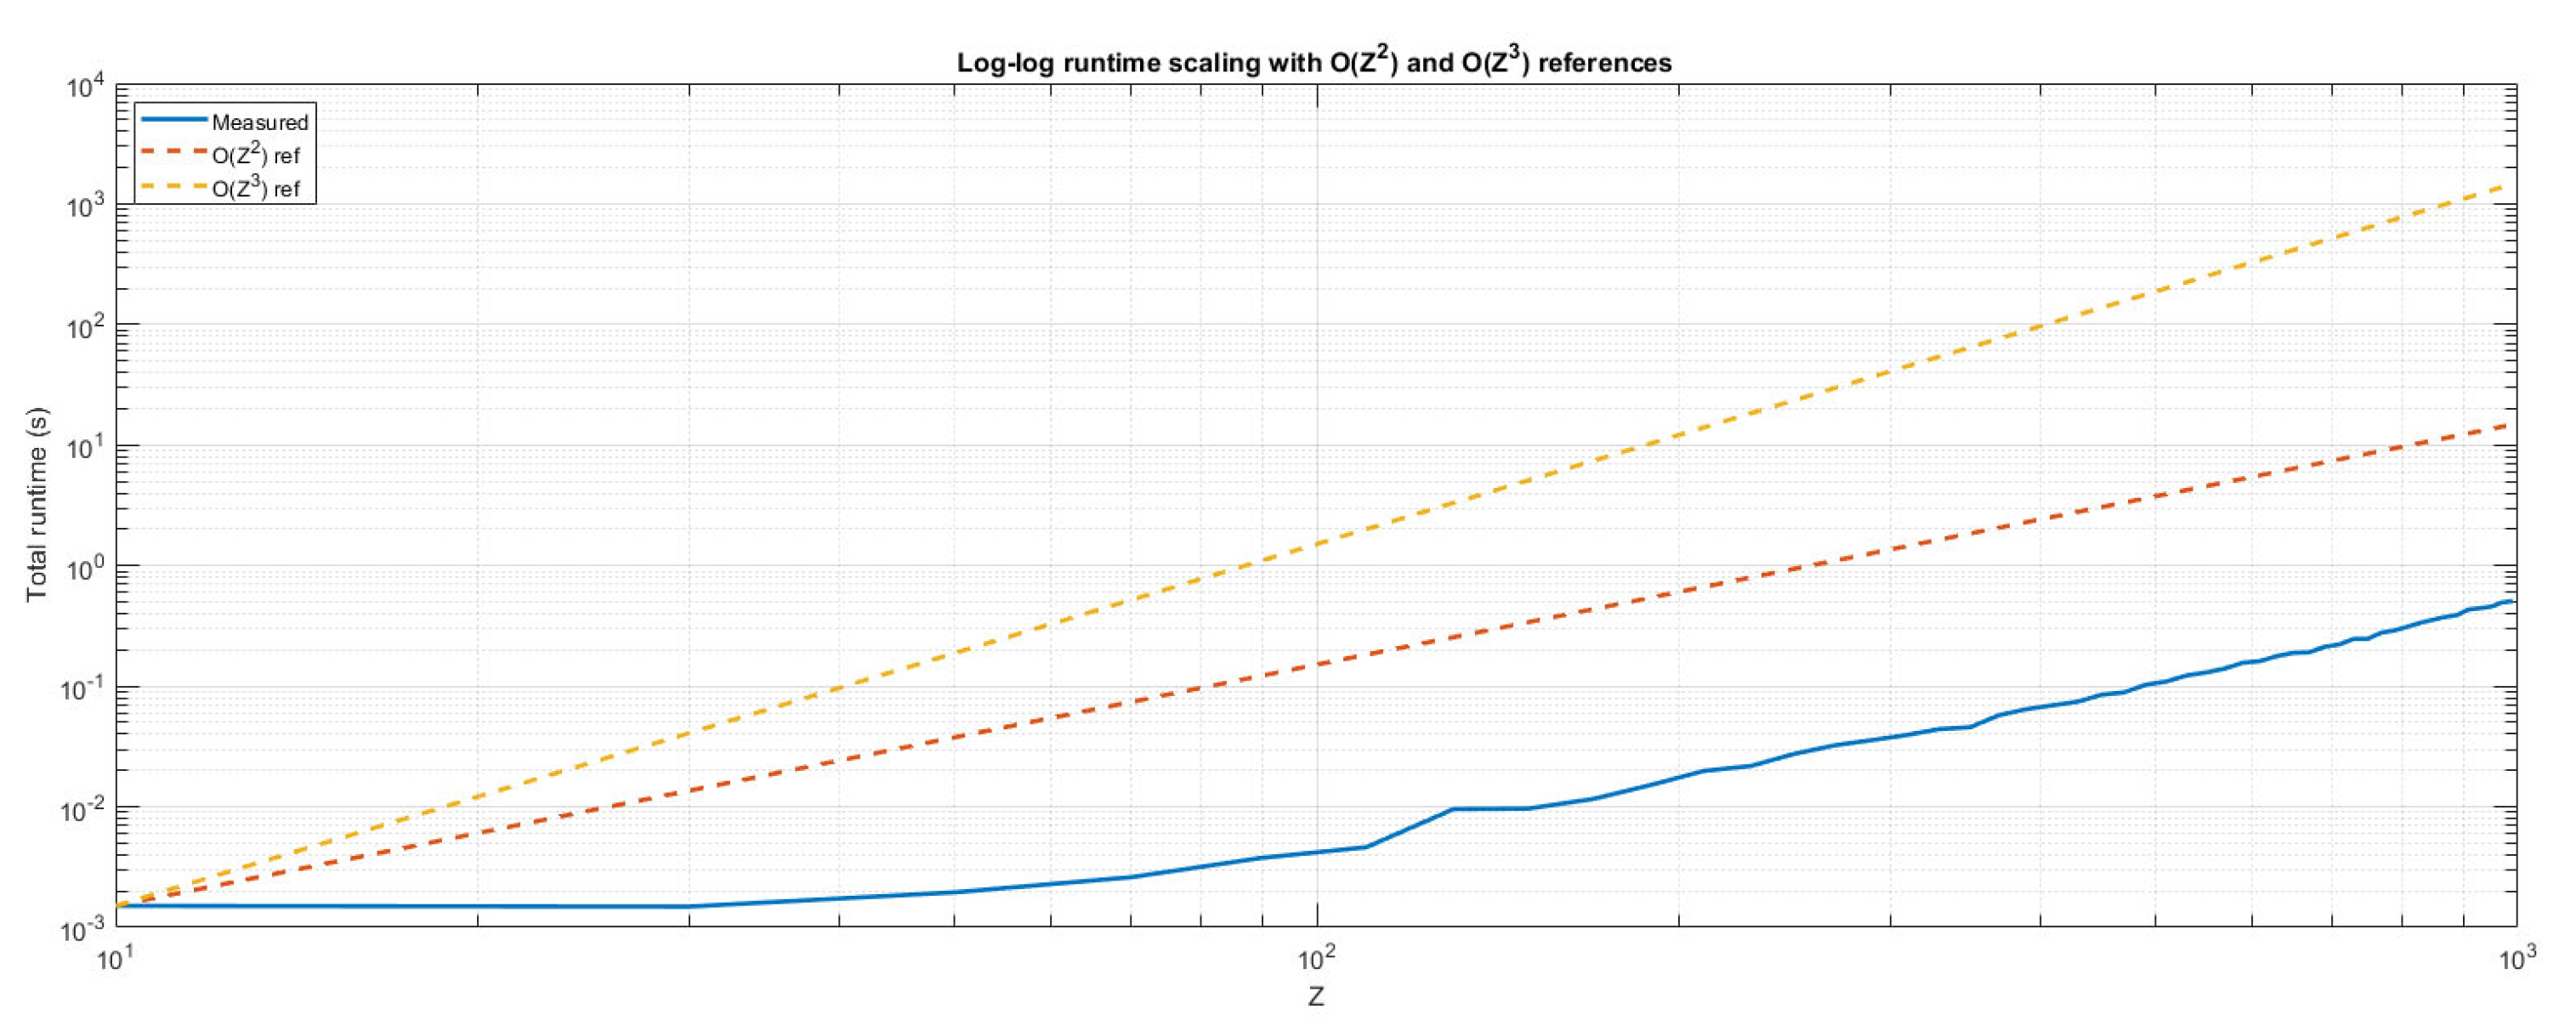
To assess the computational performance of the proposed optimization framework, an additional experiment was conducted by varying the number of operational zones. The optimization problem was solved repeatedly for zone counts ranging from to in increments of 20. For each case, the total solver runtime was recorded using MATLAB’s quadprog solver.
Figure 19 shows the measured runtime on a log–log scale together with reference curves
and
. The empirical runtime growth remains significantly below these theoretical bounds, indicating favorable computational scaling of the quadratic programming formulation.
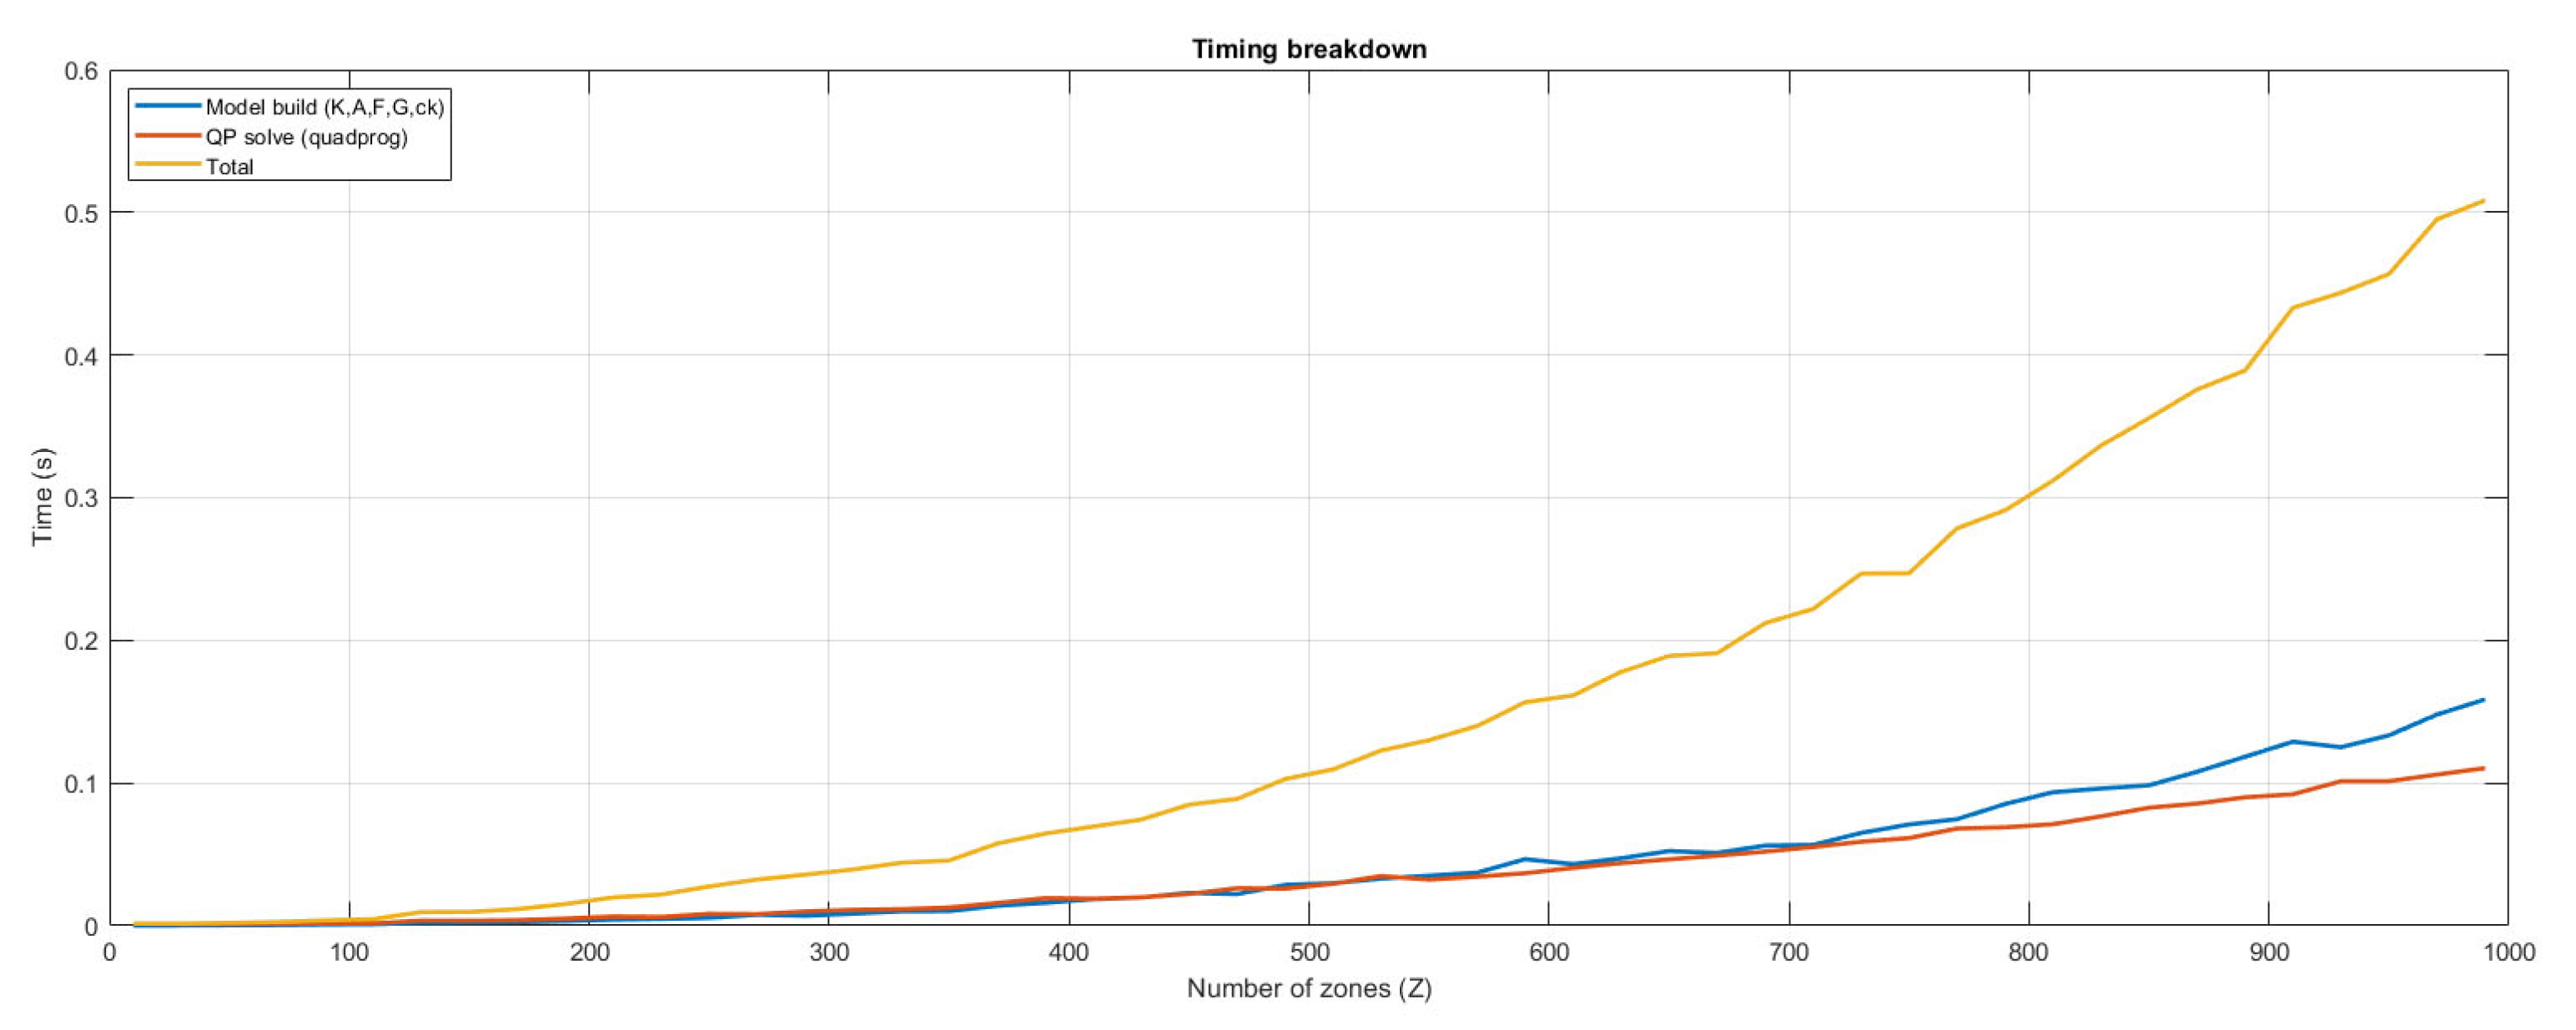
The timing breakdown analysis provides insight into which components dominate the total computation time as the problem size grows. In
Figure 20, the total runtime (yellow curve) is decomposed into the model build time (blue curve) and the quadratic programming (QP) solve time (red curve). The model build time includes the construction of matrices such as
, and the vector
, while the QP solve time corresponds to the quadprog solver execution. As shown, while both components increase with the number of zones, the overall runtime remains moderate, and the QP solve time scales predictably, supporting the feasibility of real-time implementation.
Overall, the results confirm that the zone-based backlog optimization framework is computationally efficient and suitable for real-time fleet allocation in large urban logistics systems.
5. Discussion
The numerical example supports the structural consistency and computational feasibility of the proposed model. Unlike classical vehicle routing formulations, the presented approach avoids combinatorial route-level complexity and instead focuses on aggregated backlog dynamics, which are directly observable in Industry 4.0-enabled logistics platforms.
A key strength of the framework lies in its analytical state prediction. The closed-form discrete-time update eliminates the need for numerical integration during online operation, preserving convexity and ensuring that the optimization problem remains a small-scale quadratic program. This property is essential for real-time deployment, where decisions must be updated every few minutes.
From a system-theoretic perspective, the eigenvalue analysis confirms asymptotic stability of the discretized dynamics. The spectral radius strictly below one ensures bounded backlog evolution under bounded demand conditions, which follows from the structural properties of the coupling matrix and the resulting transition matrix
The proposed framework operates at an aggregated control level and is therefore structurally different from classical vehicle routing models or detailed dispatching heuristics. Its objective is not to replace route-level optimization but to provide a real-time supervisory allocation mechanism based on backlog dynamics. For this reason, direct quantitative benchmarking against established routing algorithms is not straightforward, as the decision scope and temporal resolution differ. Future research may integrate the proposed zone-based allocation layer with route-level models or compare its performance against heuristic rebalancing strategies in large-scale simulation environments.
The numerical example assumes linear service productivity for simplicity. In practice, service rates may exhibit saturation effects. However, the proposed framework can also accommodate piecewise-linear or nonlinear productivity functions, since these only affect the service-rate representation while the backlog dynamics and optimization structure remain unchanged.
The results further highlight the explicit trade-off between sustainability and service performance. The decomposition of the objective function shows that backlog reduction dominates the solution structure, while emission penalties shape allocation patterns without destabilizing the system. Sensitivity analysis of the emission weight parameter illustrates a Pareto-like frontier, allowing decision-makers to adjust environmental emphasis according to policy or regulatory priorities. Future research may also explore the integration of real-time optimization with human-centered decision-support systems, such as augmented-reality-assisted process planning frameworks proposed in recent Industry 4.0 manufacturing studies [
37]. Future research may investigate the integration of the proposed optimization framework with discrete-event simulation and digital value stream models in order to evaluate allocation strategies under more detailed operational scenarios [
38].
Importantly, the inequality constraints associated with backlog non-negativity remain non-binding in the presented scenario, indicating operational feasibility margins. In more congested settings, however, these constraints would likely become active, providing an interpretable indicator of capacity scarcity and system-critical zones.
Compared to existing literature summarized in
Section 2, the proposed framework directly addresses identified research gaps: it integrates sustainability as a dynamic operational objective, applies real-time optimization specifically to micromobility systems, and maintains scalability through aggregation-based modeling. While the current numerical example focuses on a single fleet type and ring-topology structure, the formulation is extendable to multimodal settings, heterogeneous vehicle classes, and time-dependent emission factors.
Nevertheless, several limitations remain. The demand arrival process is assumed piecewise constant within control intervals, and travel times are implicitly embedded in productivity coefficients. Future research could incorporate stochastic demand modeling, adaptive estimation of productivity parameters, and integration with route-level optimization layers. Additionally, empirical validation using real operational datasets would further strengthen practical applicability.
The presented results demonstrate that real-time, sustainability-aware optimization of micromobility-based last-mile logistics is not only theoretically sound but also computationally tractable and operationally interpretable.
The zone-based aggregation inevitably abstracts from route-level heterogeneity and detailed spatial variability. This modeling choice reflects a deliberate trade-off between granularity and real-time solvability. The objective of the framework is not to replace detailed vehicle routing models but to provide a supervisory allocation layer that can operate at short time intervals with limited computational overhead. In practical logistics systems, zone-level backlog and demand intensity indicators are commonly used for operational control. Future research may compare the proposed aggregated approach with route-level simulation models to quantify potential approximation effects under highly heterogeneous urban conditions.
The assumption of linear service productivity represents a deliberate simplification. In practice, congestion effects and operational frictions may lead to diminishing marginal returns as additional vehicles are allocated to the same zone. Within short control intervals, however, productivity can be reasonably approximated as locally linear around the current operating state. This approximation preserves convexity and enables reliable real-time optimization. Future research may incorporate nonlinear or piecewise-linear productivity functions to capture congestion effects more explicitly, potentially at the cost of increased computational complexity.
6. Conclusions
This paper introduced a real-time, sustainability-aware optimization framework for micromobility-based last-mile logistics within an Industry 4.0 environment. The proposed approach combines a zone-based backlog dynamic model with a convex quadratic programming formulation that enables computationally efficient fleet reallocation over rolling time horizons. By explicitly incorporating emission costs, backlog reduction benefits, and operational smoothing into a unified objective function, the framework addresses both service-level and environmental requirements in a structured and scalable manner.
The analytical discretization of the backlog dynamics ensures numerical stability and preserves convexity, making the method suitable for real-time deployment. The numerical case study demonstrated feasibility, stability, and controllable trade-offs between sustainability and operational performance. Importantly, the model maintains interpretability at the system level while avoiding route-level combinatorial complexity.
The proposed formulation establishes a bridge between micromobility operations, sustainability metrics, and real-time optimization control. Future research directions include stochastic demand modeling, integration with multimodal fleets, and validation using real-world operational datasets.