


Abstract
The increasing demand for sustainable materials has accelerated the development of environmentally friendly filaments for fused deposition modeling (FDM). In this study, the surface roughness and thermal degradation behavior of sustainable PLA-based filaments, including PLA, recycled PLA (Re–PLA), and wood-filled PLA (Wood–PLA), were systematically investigated under different FDM printing conditions. A full factorial experimental design was employed to identify the dominant processing parameters and optimize surface quality. Surface roughness was evaluated using values Ra, Rz, and Rq parameters measured on three different surface orientations (top surface at 0°, top surface at 45°, and side surface). Scanning electron microscopy (SEM) was used to examine the relationship between roughness measurements and surface morphology, while thermogravimetric analysis (TGA) was performed to evaluate the thermal degradation behavior of the filaments in relation to printing temperature. The results have shown that filament material is the most important parameter affecting surface roughness. While Wood–PLA exhibited the highest roughness due to fiber-induced surface heterogeneity, recycled Re–PLA showed moderate surface irregularities resulting from degradation compared to pure PLA. Despite a rougher filament surface prior to production, recycled PLA exhibited a surface morphology similar to that of pure PLA after printing, influenced by the processing parameters. Furthermore, SEM findings indicated that the Ra parameter predominantly reflects macro-scale surface topography, while local microstructural heterogeneity can be better characterized by complementary roughness parameters such as Rz. These findings support optimizing printing conditions to improve surface quality and more widespread use of sustainable FDM filaments in applications where surface roughness is critical.
Keywords:
FDM; sustainable filaments; PLA; Wood–PLA; recycled PLA; surface roughness; statistical optimization; SEM; TGA 1. Introduction
Additive Manufacturing (AM) technologies have gained increasing attention in recent years due to their ability to facilitate the production of parts with complex geometries, prevent material waste, and offer lower production costs. Among these technologies, Fused Deposition Modeling (FDM) has become one of the most widely used AM techniques in both academic studies and industrial applications, thanks to its low equipment cost, ease of use, and flexible adjustment of production parameters. One of the most important advantages of the FDM method is that basic printing parameters such as nozzle diameter, printing speed, and extrusion temperature can be easily changed and defined by the user to suit different needs.
The advantages of AM techniques have led to its increasing adoption in customized, low-volume production scenarios where design flexibility is critical [1]. Within this context, Fused Deposition Modeling (FDM) has emerged as one of the most widely used AM techniques in both academic research and industrial practice, owing to its low equipment cost, ease of operation, and flexibility in adjusting process parameters. One of the most important advantages of the FDM method is that basic printing parameters, such as nozzle diameter, printing speed, and extrusion temperature, can be easily adjusted by the user to suit different needs.
Because these parameters directly affect the melt flow behavior of the material, interlayer bonding, and surface formation mechanisms during production, printing parameters can be optimized to meet specific requirements, particularly for improving the surface quality and mechanical performance of FDM-produced parts [2,3,4,5,6]. Sustainability and environmental effects have become increasingly important concepts in additive manufacturing [7]. Polylactic acid (PLA) stands out as an environmentally friendly alternative due to its derivation from renewable raw materials, biodegradability, and ease of processing. Compared to petroleum-based thermoplastics, PLA has certain critical environmental weaknesses, although it emits less carbon during production [8]. The slow rate of its natural decomposition, its dependence on specific environmental conditions, and the limitations in recycling processes necessitate a comprehensive analysis of its environmental impact [9,10]. To reduce the environmental impact of PLA, improve its mechanical properties, and decrease its density, biocomposite filaments containing natural fibers and particles have been developed. Despite this, PLA-based filaments are known to have limitations in terms of surface quality and thermal stability under various FDM printing conditions [11,12]. Furthermore, products made from PLA, similar to many thermoplastics FDM materials are very sensitive to environmental conditions, such as humidity [13].
Researchers aimed to obtain biopolymer filaments that support environmental sustainability while also offering functional properties by incorporating natural wood particles into the PLA matrix [14,15]. Biopolymers reinforced with natural fibers are gaining an increasing share among filament materials due to their low cost, low density, high specific energy absorption capacity, and less abrasive nature for processing equipment [16]. These types of materials are often referred to as “green composites” due to their renewable and biodegradable nature [17].
The mechanical and surface properties of biocomposite filaments depend on many factors, including fiber type, fiber dimensions, fiber ratio, and matrix-fiber interface interaction [18]. Although cellulose fibers have been shown to be an effective reinforcement for polymer composites, the incompatibility between the fibers’ hydrophilic nature and the PLA matrix’s hydrophobicity leads to poor interfacial bonding and fiber aggregation [19]. This situation can result in void formation, limited load transfer, and surface irregularities, especially in wood-filled PLA biocomposites [20,21]. Improving interface compatibility through additives or fiber surface modifications can enhance the mechanical performance of these materials [22]. The use of fiber or particle-reinforced composites in FDM-manufactured parts holds promise for improving mechanical properties. However, the presence of fillers poses manufacturing challenges, including particle aggregation, void formation, poor fiber-matrix adhesion, nozzle clogging, and increased extrusion forces [23]. Increasing fiber content increases melt viscosity, requiring higher extrusion temperatures; however, this increases the risk of clogging and surface defects [24].
Another important sustainability approach is the recycling of filaments, whose use is increasing. Recycling PLA waste and converting it into recycled (Re–PLA) filaments both reduce the negative environmental impact and provide economic advantages [25]. The recycling cycle begins with the collection and grinding of filament waste, followed by homogenization of the material and its reshaping through hot extrusion [26]. However, repeated heat treatment during the recycling process can alter the polymer chain structure, affecting melt flow behavior, thermal degradation characteristics, and surface quality [27]. Therefore, it is of great importance to evaluate the performance of Re–PLA filaments in the FDM process in comparison with pure PLA.
Surface quality and dimensional accuracy are among the most important quality indicators for FDM-produced parts [28]. Surface roughness is directly affected by interlayer adhesion and the thermal effects of the manufacturing process. Studies in the literature have shown that surface roughness is significantly influenced by printing parameters, including layer height, nozzle diameter, printing speed, extrusion temperature, and measurement direction [29,30,31]. Furthermore, determining dominant parameters and calculating optimum pressure conditions using statistical methods and experimental design approaches has become a common area of research [32,33,34,35]. Bakhtiari et al. investigated the effects of four process parameters (layer height, extrusion width, nozzle temperature, and printing speed) on the compression properties and surface smoothness of PLA parts. Their results showed that layer height had a significant impact on surface quality, followed by nozzle temperature. Based on SEM observations, they identified interlayer separation occurring near the seam line of PLA prints as the main failure mechanism. They also determined the optimal printing parameters using the Taguchi method [36]. Many studies have shown that the step effect becomes more pronounced with increasing layer thickness, leading to increases in surface roughness parameters Ra, Rq, and Rz, especially on lateral surfaces [37,38]. It has been noted that the printing direction also significantly affects surface topography, increasing surface roughness by making layer marks more prominent, especially on sloped and steep surfaces [39]. Irene Buj-Corral et al. investigated the effects of 3D printing parameters on roughness on curved surfaces. They evaluated both the outer and inner surfaces of the parts using different roughness parameters. They also examined the parameters Rz, Rku, and Rsk, as the Ra parameter did not provide information on the roughness profile shape. The results showed that all surface roughness parameters depend primarily on the layer height and nozzle diameter [40]. Kočiško et al. investigated the effectiveness of mechanical finishing in improving the surface properties of components produced by additive manufacturing. They experimentally examined the suitability of sanding and grinding to improve the surface quality of samples produced with metal-reinforced PLA-based filaments. The finishing methods resulted in a consistent 80–90% reduction in surface roughness parameters (Ra, Rz). During grinding, the thermal sensitivity of PLA and the variability in metal particle distribution led to local surface finishing problems, affecting surface consistency [41].
Studies on recycled PLA (Re–PLA) show that, compared with pure PLA, its surface quality is similar in its sensitivity to printing parameters, but re-extrusion and thermal history make the surface formation mechanism more complex [38]. It has been reported that in Re–PLA samples, surface roughness increases significantly with increasing layer thickness, which is attributed to fluctuations in melt flow stability and differences in interlayer bonding [42]. Furthermore, various studies have shown that Re–PLA exhibits a more irregular microstructure than pure PLA, which can lead to increased surface roughness [43]. In their study, Finnerty et al. investigated the mechanical recyclability of PLA and PLA-based natural fiber-reinforced composites (NFRC). They used injection molding to examine the impact and tensile strengths of products made from recycled material. Mechanical recycling of pure PLA resulted in a significant color change, indicating that the polymer was degraded during thermal processing due to chromatophore formation within its structure. They observed a significant decrease in tensile properties in PLA/BF NFRCs after three recycling steps, due to a reduction in fiber length. SEM micrographs revealed a decrease in fiber length and poor interfacial adhesion with increasing recycling steps [44]. Similarly, Karayer et al. investigated the mechanical, surface, degradation, and biocompatibility properties of PLA and Re–PLA samples. They also evaluated the effects of the sterilization process on the film material. The results showed that the filler ratio was the main parameter affecting flexural strength and surface quality, while the raster angle increased roughness. While PLA and Re–PLA exhibited more brittle fractures, sterilized samples showed ductile properties [26].
In the case of Wood–PLA composites, surface quality is evaluated not only by printing parameters but also by the size and distribution of wood particles, as well as the filler-matrix interface compatibility. Studies have shown that in PLA filaments containing wood flour, surface roughness increases and fiber- or particle-induced protrusions become more prominent as layer thickness increases [37]. However, it has been noted that the incompatibility between the hydrophilic nature of natural fibers and the hydrophobic nature of the PLA matrix can negatively affect surface topography by causing voids and particle coating at the interface [17]. SEM analyses have revealed that the flaked and torn surface areas observed in Wood–PLA samples are associated with poor interfacial bonding and an irregular particle distribution [20]. In their study aimed at characterizing wood-filled PLA composite filaments, Tomec et al. utilized filaments produced with varying mass fractions of wood particles (10% or 20% wt.). These wood particles were obtained by grinding and sieving unmodified beechwood and thermally modified beechwood. Filaments containing thermally modified wood particles exhibited lower surface roughness and porosity compared to those containing unmodified wood particles. As the wood content increased, both the surface roughness and porosity of the filaments also increased. The researchers noted that extrusion parameters should be better optimized to obtain high-quality filaments with wood particles [21]. Ayrilmis (2018) [37] investigated the effect of printing layer thickness on the surface roughness and wettability of 3D-printed specimens produced from Wood–PLA filaments. To evaluate the surface properties of the specimens, average roughness (Ra), mean peak-to-valley height (Rz), and maximum peak-to-valley height (Ry) were considered. The study demonstrated that layer thickness has a direct impact on the surface roughness of 3D-printed Wood–PLA surfaces. In their study aimed at developing biocompatible components, Kechagias et al. investigated the tensile mechanical and surface properties of multi-layered specimens produced in a 4–5–4 layer sandwich configuration, featuring polylactic acid (PLA)/wood on the outer surfaces and pure PLA in the core. In their experiments, designed according to the Taguchi L9 orthogonal array, tests were conducted on pure PLA, sandwich PLA/wood–PLA–PLA/wood, and composite PLA/wood specimens. The sandwich specimens improved tensile strength and elastic modulus by 100% and 50%, respectively, compared to PLA/wood components, while exhibiting approximately 10% lower surface roughness parameters [45].
In this context, when the literature is evaluated as a whole, it is observed that surface quality in PLA and Re–PLA is predominantly controlled by process parameters, whereas in Wood–PLA products, microstructural and interfacial effects significantly alter surface roughness. However, studies that directly compare these materials under the same FDM printing conditions are limited. Consequently, improving the surface quality of additive-filled PLA filaments requires not only optimizing printing parameters but also considering thermal variations and interfacial interactions simultaneously. Although numerous studies in the literature focus on pure PLA and various composite filaments, research systematically examining the interaction of sustainable filaments such as Re–PLA and Wood–PLA with FDM printing parameters, including surface roughness and thermal degradation behavior, remains limited. Therefore, to better understand the surface formation behavior of PLA, Re–PLA, and Wood–PLA and to determine the optimum processing conditions, a systematic comparison under the same printing conditions is necessary. Furthermore, the evaluation of surface roughness values in relation to measurement direction and surface morphology has not been adequately addressed in the literature. In this study, a sustainability-oriented approach was adopted, using pure PLA, Re–PLA, and Wood–PLA filaments. The surface roughness properties of the FDM specimens were evaluated using a full factorial experimental design across various printing parameters. Surface roughness analyses were conducted using Ra, Rz, and Rq parameters across three different surface orientations, and the obtained results were supported by SEM imagery. Furthermore, the thermal degradation behavior of the sustainable filaments was examined by TGA, and their relationship with printing temperatures was established. The novelty of this study lies in the holistic evaluation and optimization of the surface roughness and thermal behaviors of sustainable PLA-based filaments.
2. Materials and Methods
2.1. Filament Materials and Properties
In this study, three different polylactic acid-based filaments pure PLA, Re–PLA, and Wood–PLA were utilized to investigate the effects of sustainable filament types on surface roughness and thermal behavior in FDM processes. To minimize material-induced variability and ensure a systematic comparison, all filaments were sourced from the same manufacturer, Porima (Yalova, Turkey). The recycled PLA filament was produced entirely from waste generated during filament production. The recycled material was reprocessed and recolored to obtain a usable filament suitable for FDM printing. The utilization of Re–PLA aims to reduce material waste and environmental impact by reintegrating waste polymers into the production cycle. However, the recycling process may alter the molecular weight distribution and microstructural homogeneity, thereby influencing melt flow behavior, thermal stability, and surface formation during printing. The Wood–PLA filament was selected as a sustainable biocomposite filament containing natural fillers. The filament consists of a PLA matrix reinforced with approximately 30% by weight of real wood fibers, providing a characteristic wood-like texture and appearance. The incorporation of natural fibers aims to enhance sustainability by utilizing renewable resources; however, the presence of wood fibers can lead to structural heterogeneity in the material due to fiber size distribution, orientation, and natural color variations. These characteristics can influence extrusion stability, interlayer bonding, and surface roughness in FDM-printed parts.
2.2. Experimental Design and Printing Parameters
An experimental design method was used to evaluate the effect of printing parameters on surface roughness. In the experimental design, filament type, nozzle diameter, printing speed, and printing temperature were determined as control factors. Nozzle diameter directly affects the surface topography by determining the path width and layer geometry of the extruded filament. Nozzle diameter is a particularly influential factor since reinforced filaments contain particles of different sizes. Printing speed plays a critical role in surface continuity and roughness formation by controlling the melt deposition time and interlayer bonding behavior. Printing temperature, on the other hand, determines melt viscosity and material flow stability, thus influencing interlayer bonding, surface smoothness, and thermal degradation tendencies. These three parameters were chosen because they are both the most frequently studied printing variables in the literature and fundamental control variables in characterizing the thermal and surface properties of sustainable PLA-based filaments.
Filament type was defined at three levels: pure PLA, recycled PLA (Re–PLA), and wood-filled PLA (Wood–PLA); other parameters were evaluated at two levels each. The selected factors and their corresponding levels are given in Table 1. A full factorial experimental design was employed to systematically investigate the effects of the selected printing parameters on surface roughness [46]. This approach allowed for the evaluation of all possible parameter combinations within defined factor levels (3 × 2 × 2 × 2, 24 experiments). The 24 experimental runs obtained from the full factorial design were labeled sequentially as L1–L24 for identification and comparison purposes (Table 2).
Table 1.
Factors and levels of the full factorial experimental design.
Table 2.
Parameters of the full factorial experimental design.
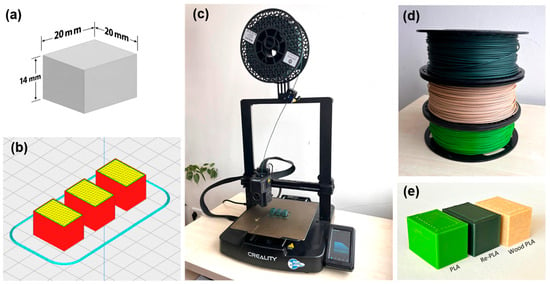
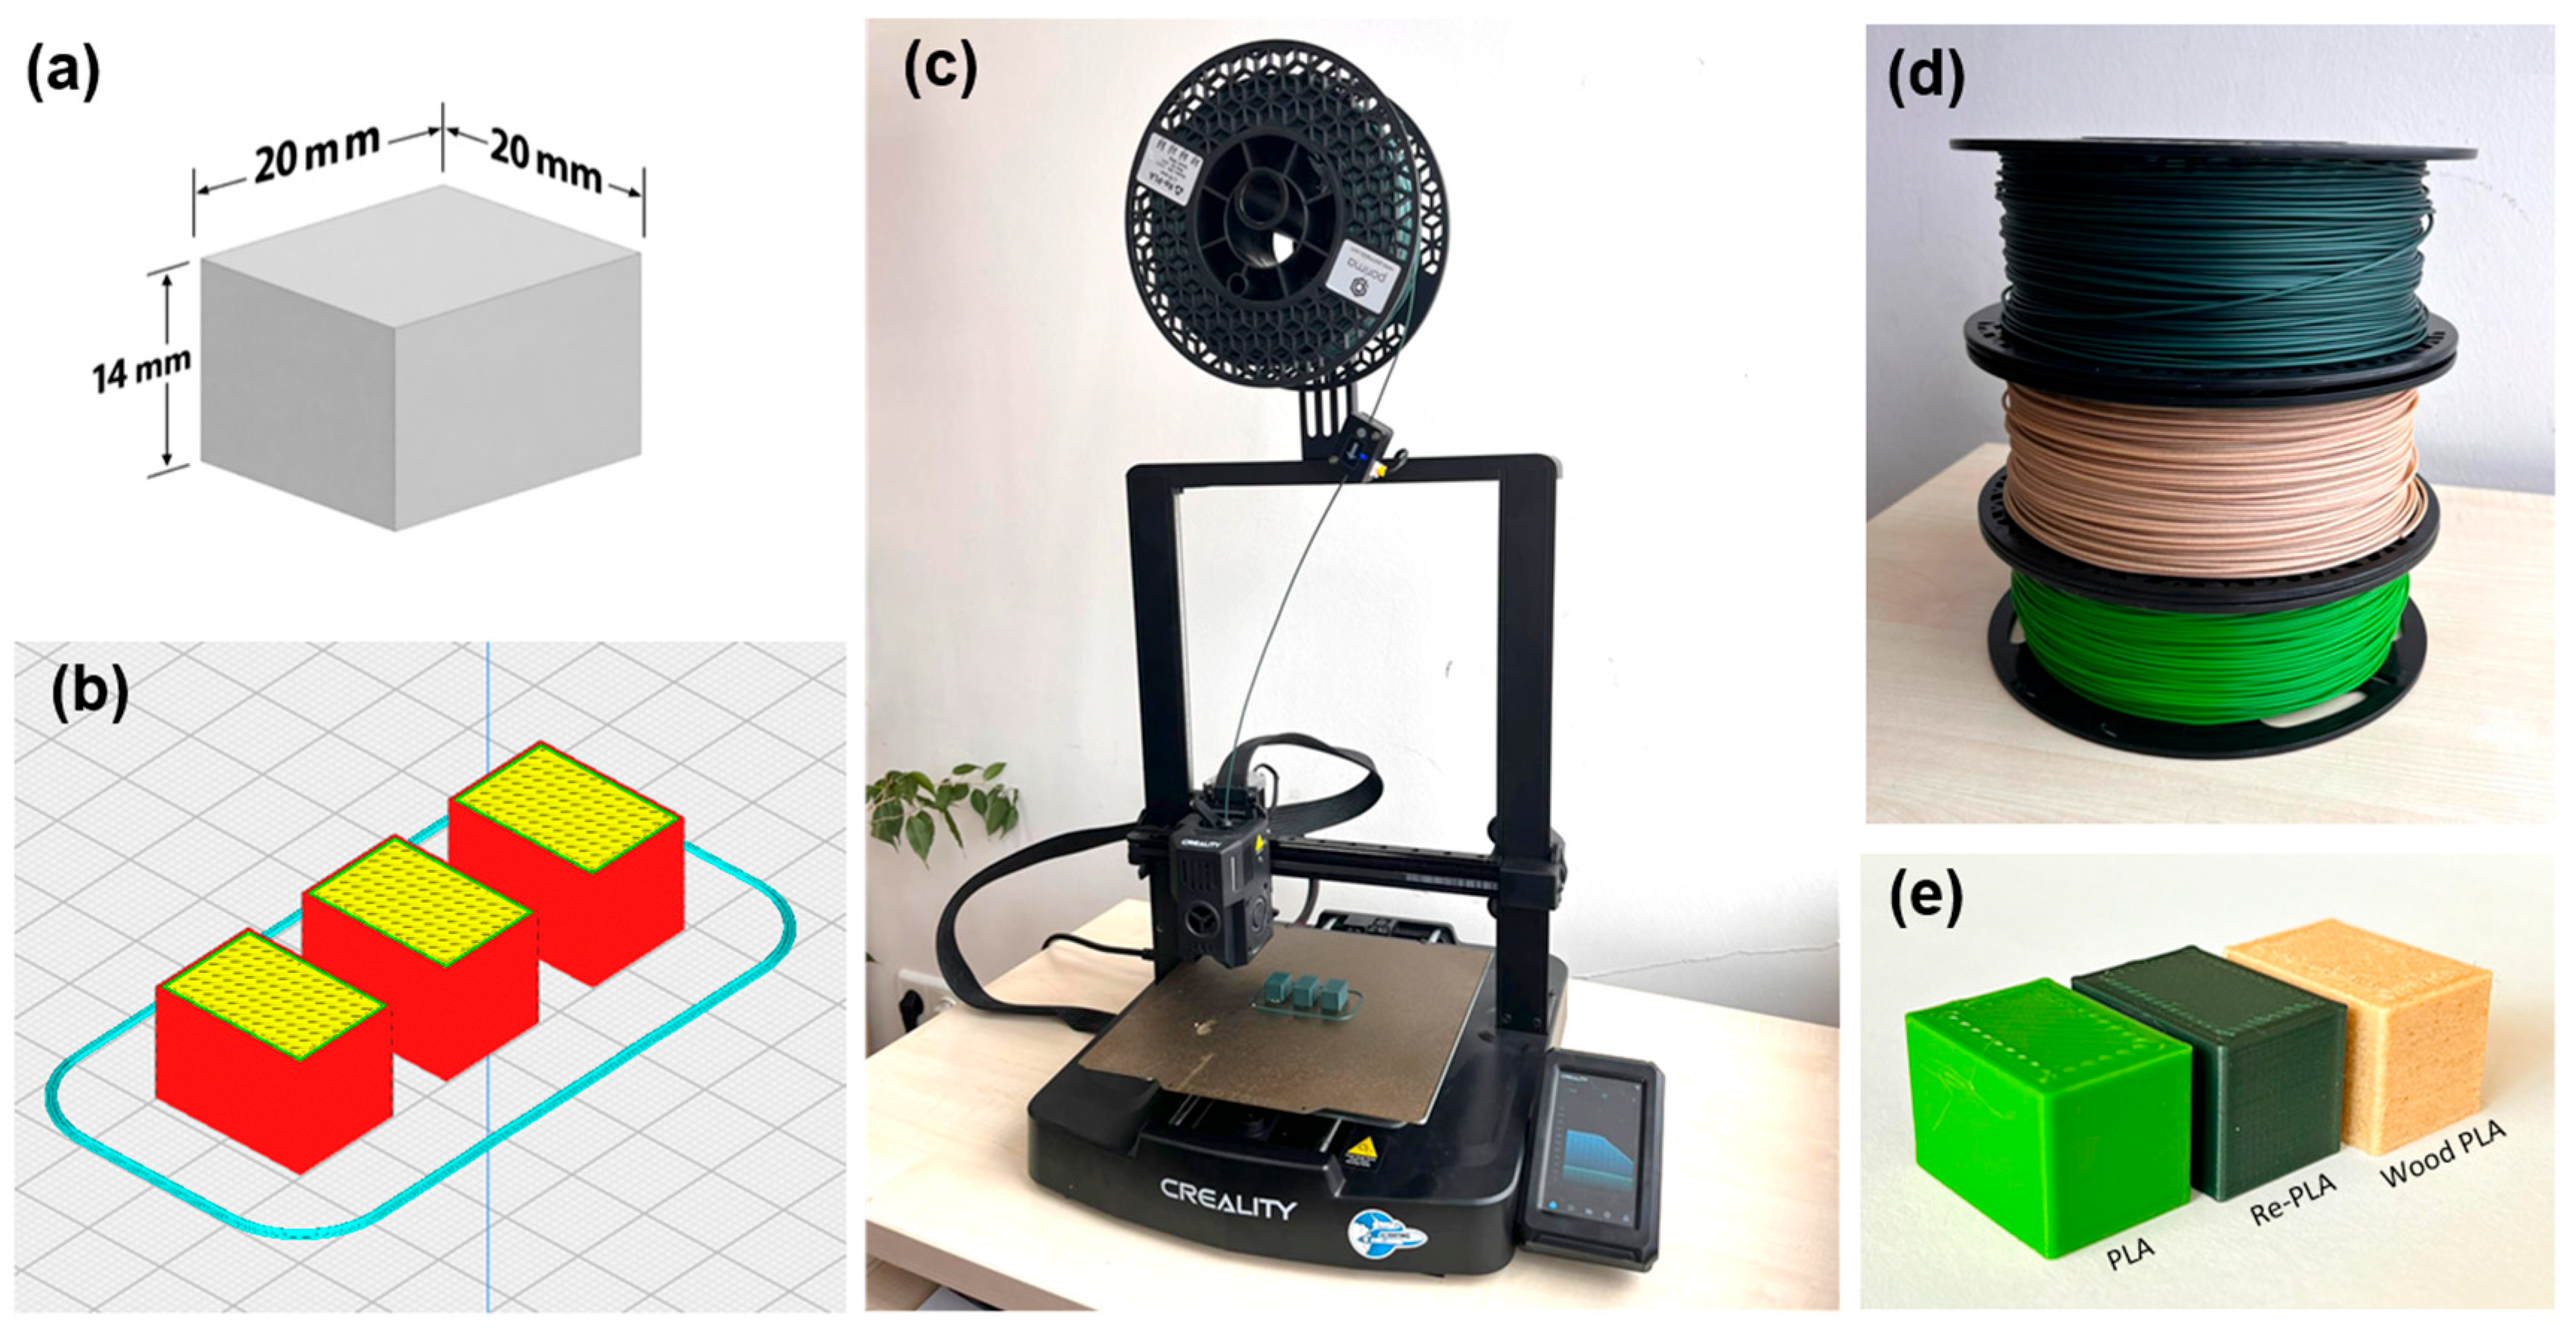
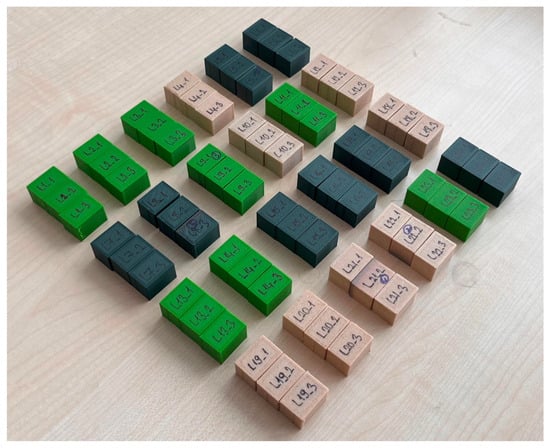
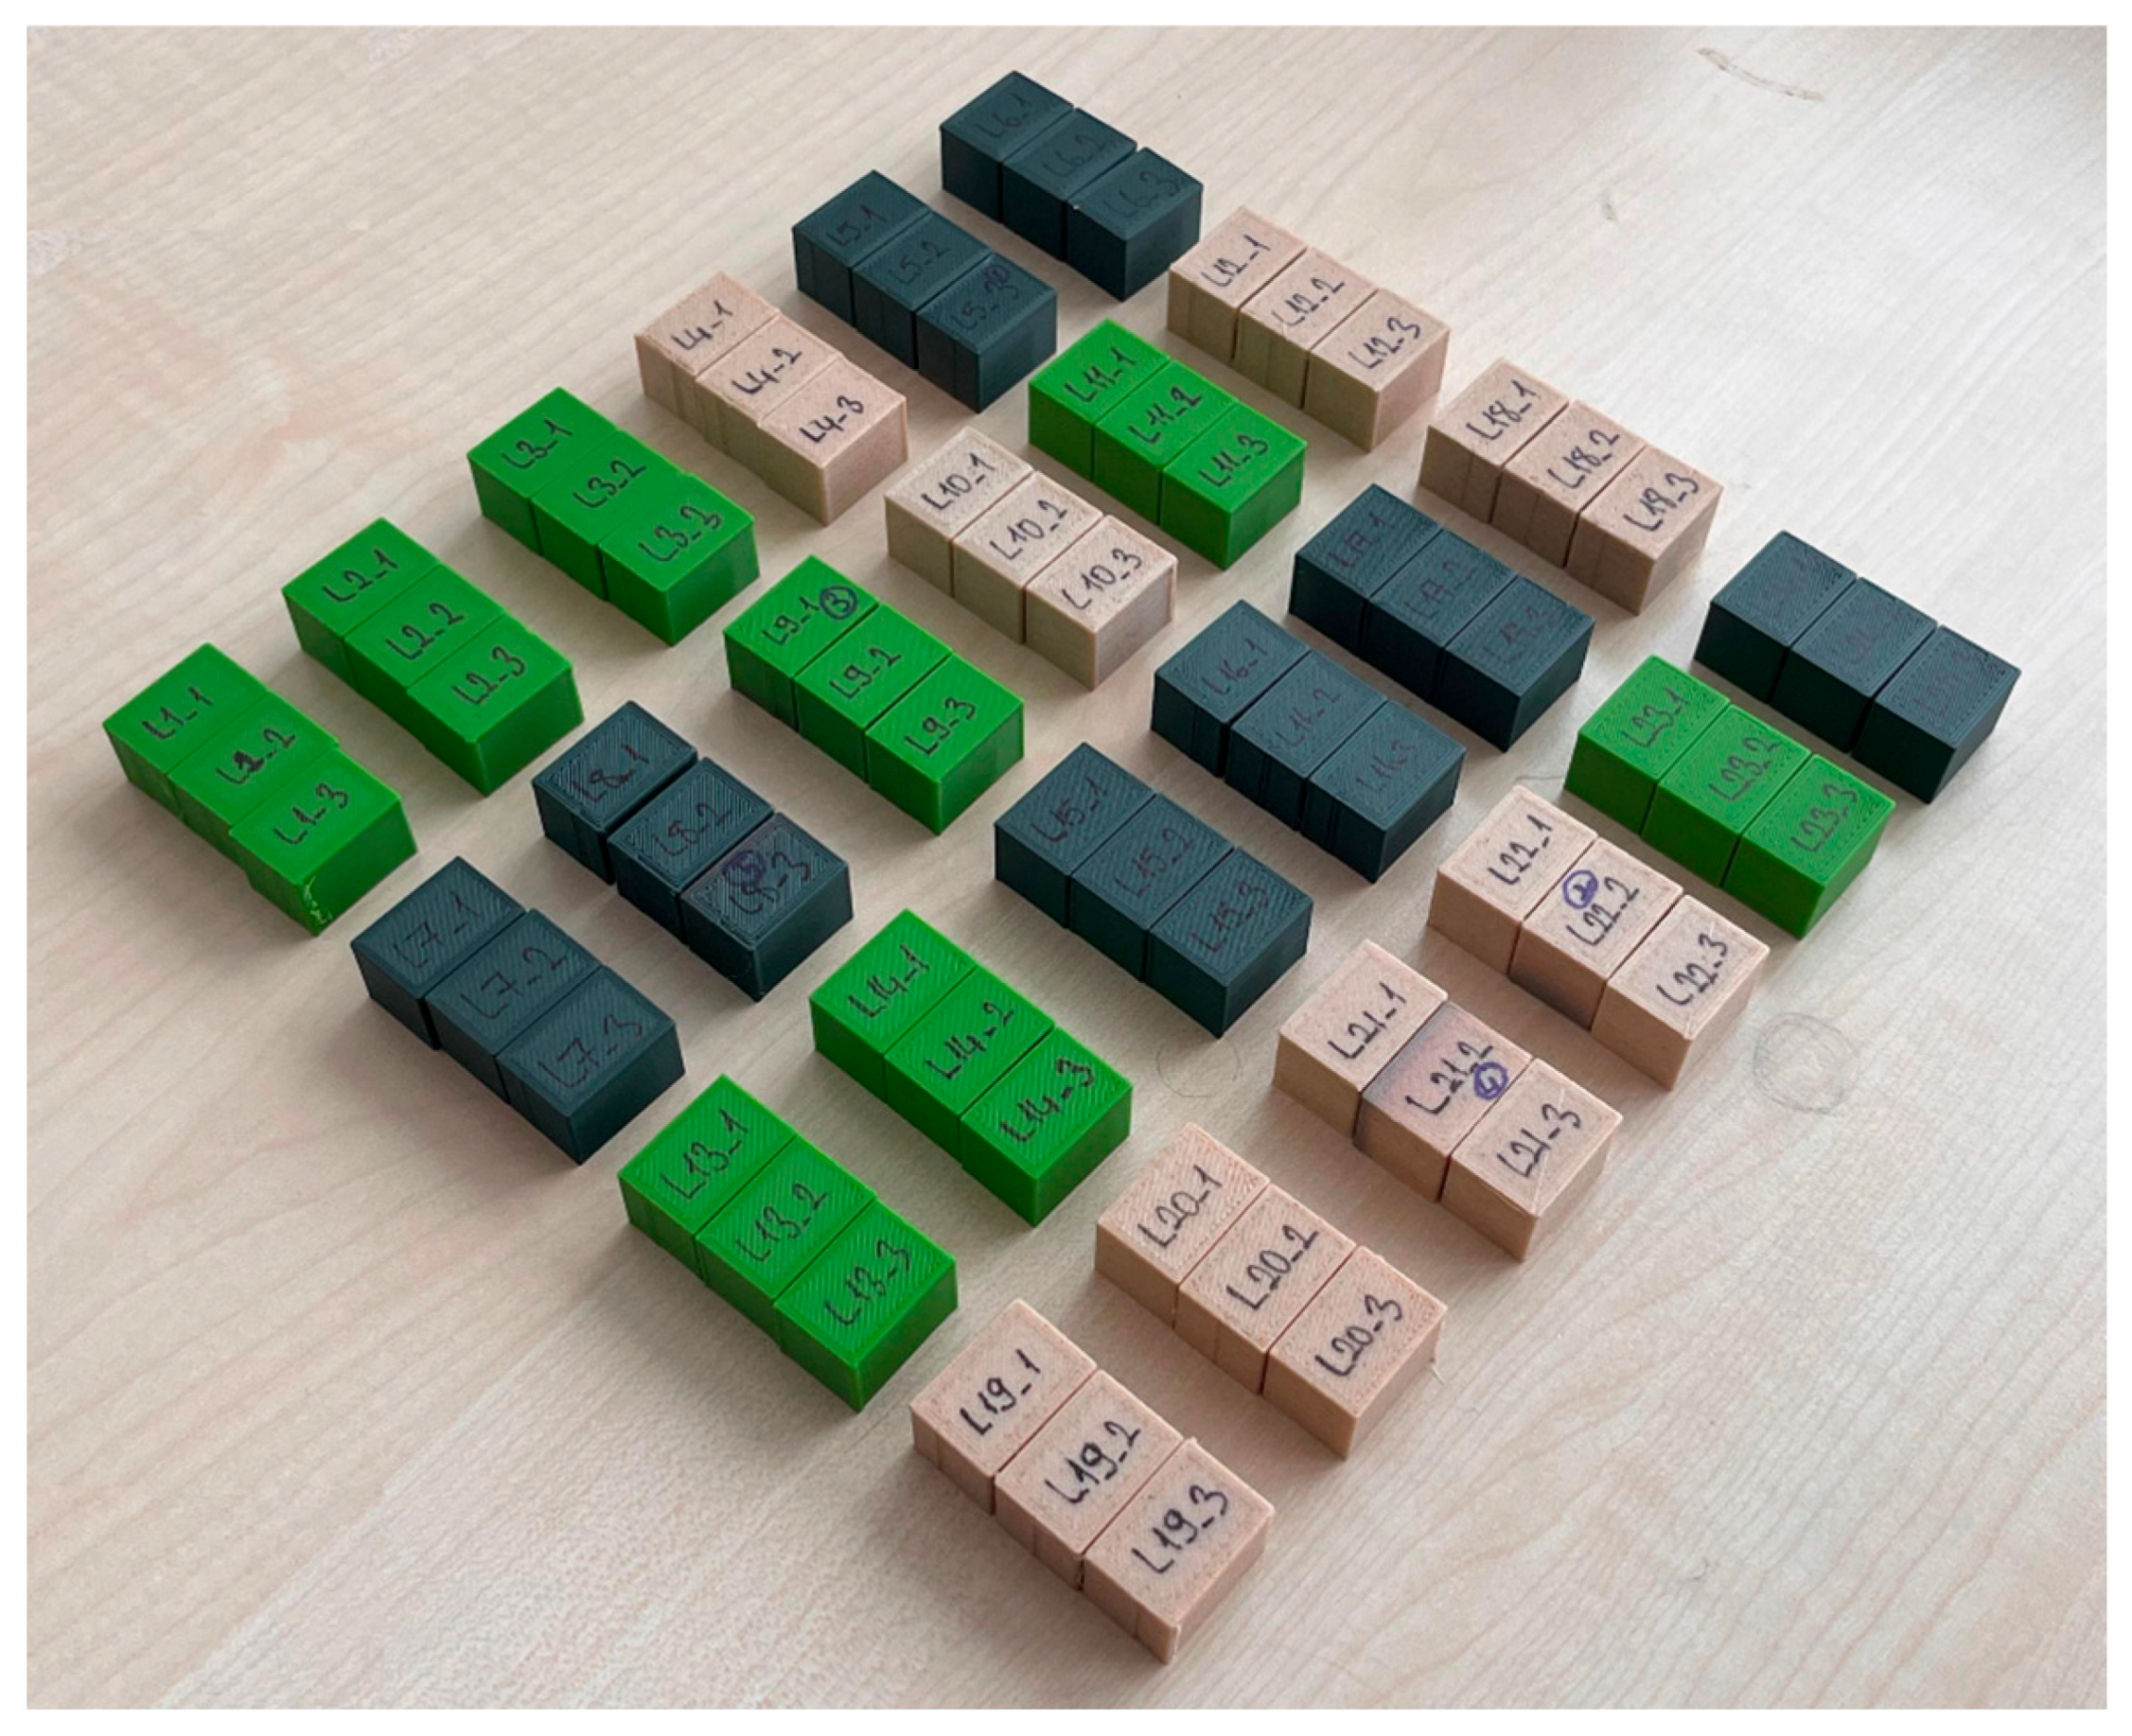
To evaluate surface roughness, rectangular prism specimens measuring 14 × 20 × 14 mm were designed (Figure 1a). These geometric dimensions were determined to enable reliable and reproducible surface roughness measurements on both the top and side surfaces. The G-codes for all test specimens were generated using Ultimaker Cura (version 5.10.2) in accordance with the experimental design parameters (Figure 1b). The production was carried out at room temperature using a Creality Ender-3 V3 3D printer (Creality, Shenzhen, China) (Figure 1c). To isolate the effects of the selected control factors, the parameters listed in Table 3, which have been shown in the literature not to be directly related to surface quality, were kept constant. Layer height was also set constant because it affects side surface quality, and there is a clear linear relationship between it and surface roughness. The raster angle was set to 45° for all specimens to ensure consistent material deposition and to investigate anisotropic surface roughness via multi-directional measurements. To enhance experimental accuracy, 72 specimens were produced, with three replicates per specimen (Figure 1e). The fabricated experimental test specimens are presented in Figure 2.
Figure 1.
Production of experimental test specimens: (a) specimen dimensions, (b) sliced models, (c) 3D printer, (d) filaments, and (e) specimens.
Table 3.
Constant printing parameters.
Figure 2.
3D printed experimental test specimens.
2.3. Surface Roughness Measurement and Evaluation
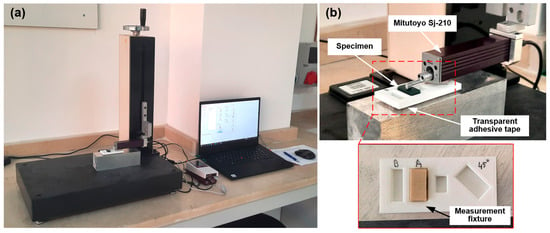
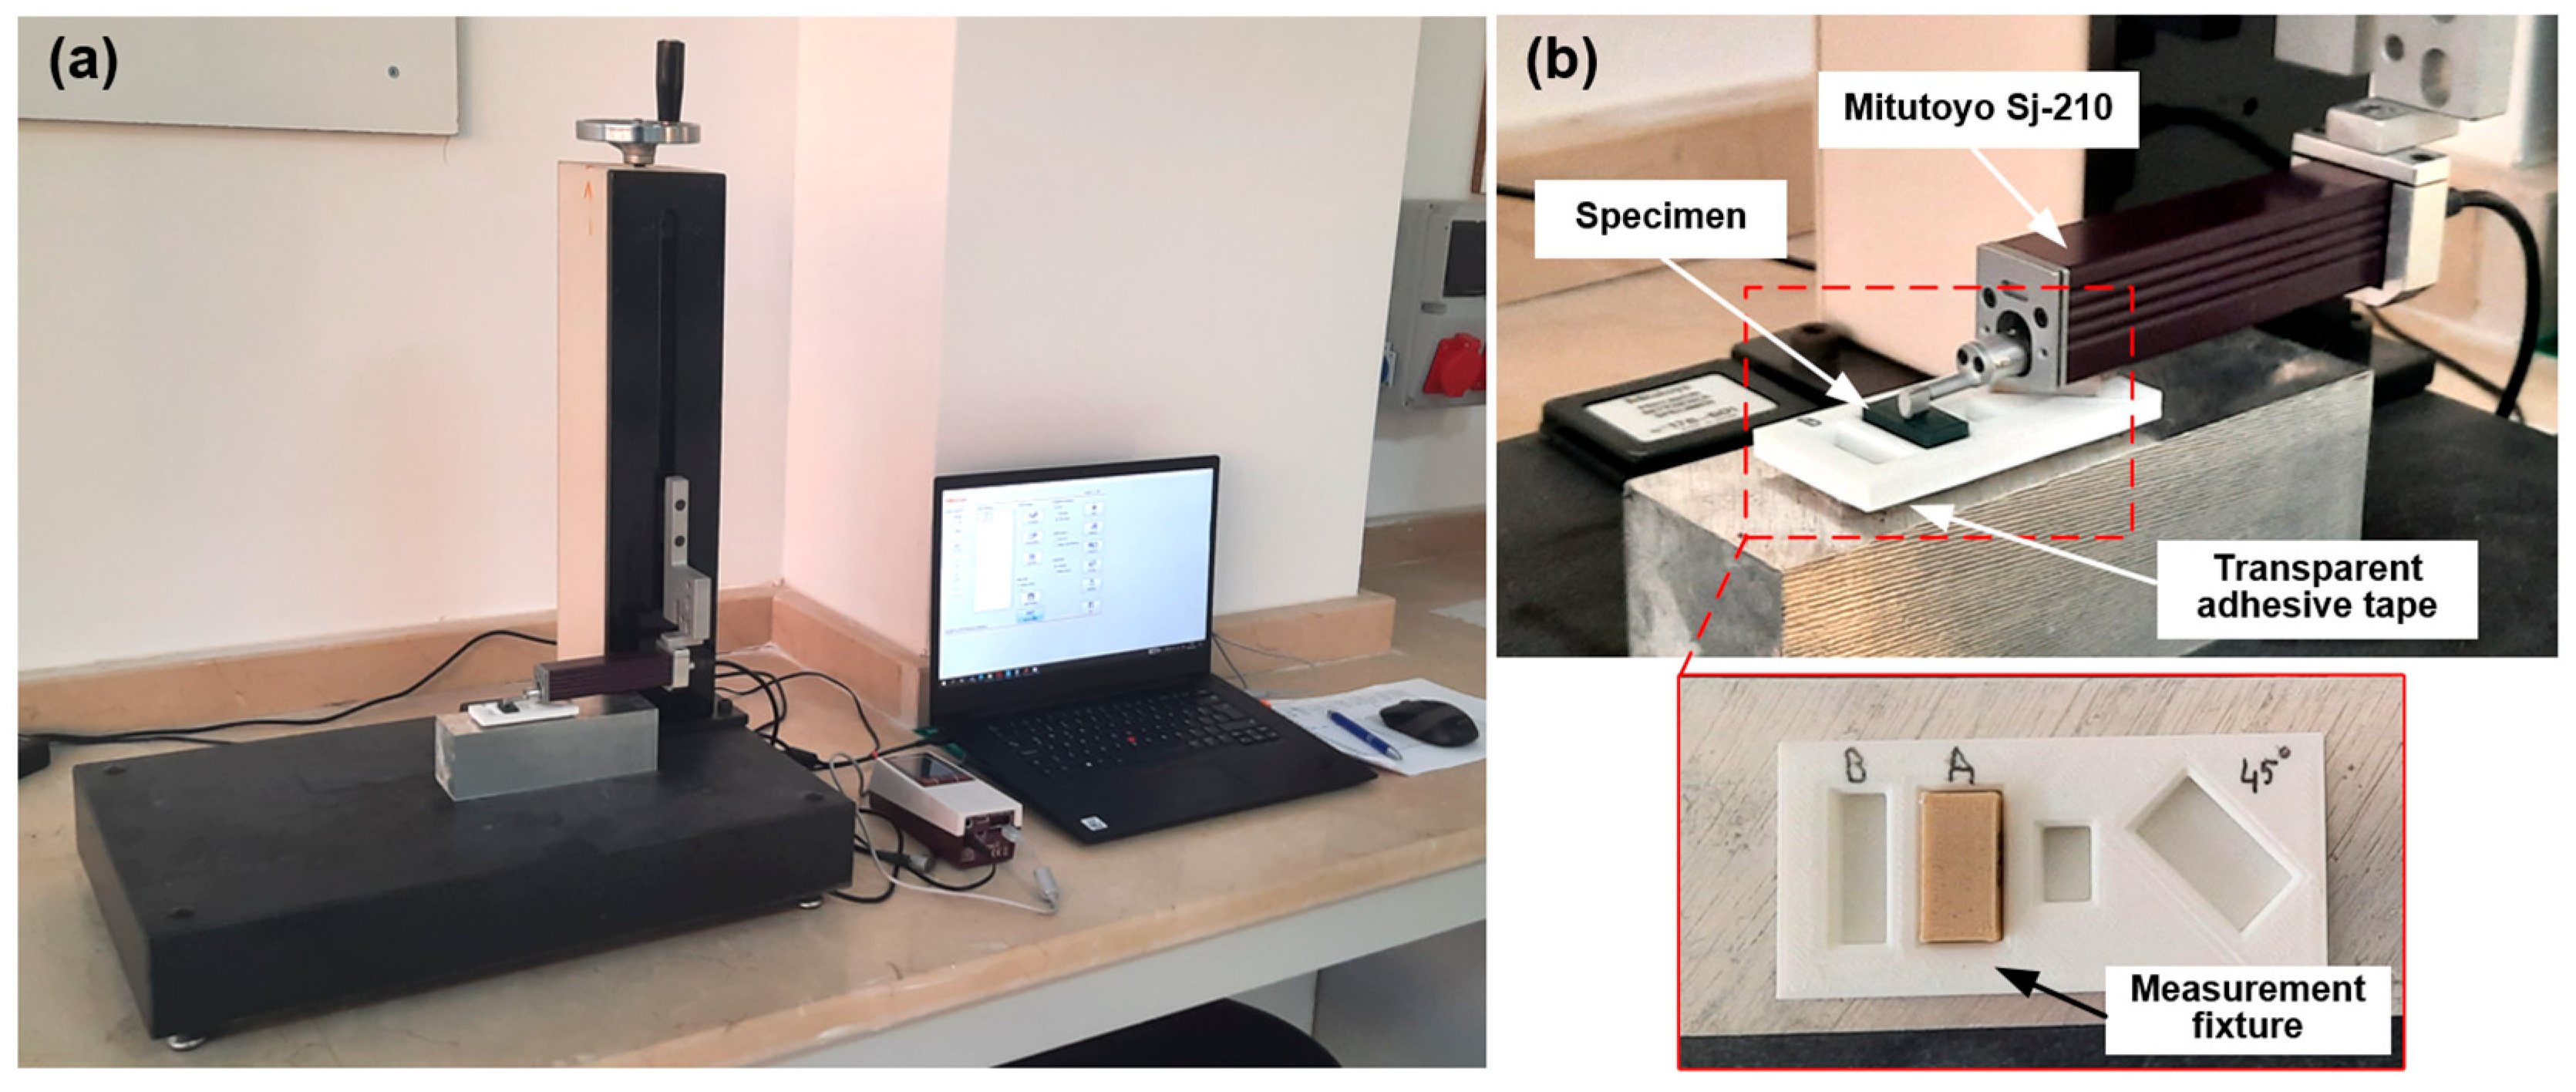
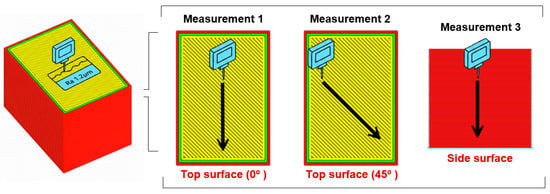
Surface roughness measurements were conducted to evaluate the surface quality of the specimens produced under different printing conditions. The measurements were performed in accordance with ISO 21920-2:2021 [47] standards using a Mitutoyo Surftest SJ-210 surface roughness tester (Mitutoyo Corp., Kawasaki, Japan) (Figure 3a). To capture surface irregularities related to layer deposition and inter-raster interactions, a Gaussian filter was applied, and the cut-off length (λc) was set to 0.8 mm based on the measured roughness range. The evaluation length was set to 4.80 mm, corresponding to the device’s ISO-compliant default measurement configuration, which includes the required evaluation length as well as additional approach and return lengths to ensure stable and repeatable measurements. The measurement speed was set to 0.5 mm/s. The device was calibrated before testing to ensure measurement accuracy and repeatability. A custom plastic fixture was used to measure all specimen surfaces according to the measurement directions and to ensure measurement repeatability; the measurements were conducted by placing the specimens in this setup (Figure shown as the white component in Figure 3b). The fixture was modeled according to the predefined measurement directions (0°, 45°, and side orientation), and cavities were created with dimensions matching the specimen geometry. These cavities allowed the specimens to be inserted without clearance, thereby mechanically constraining lateral and angular movement. The fixture constrains specimen motion and preserves measurement direction during roughness evaluation. To prevent sample movement during measurement, the plastic fixture is bonded to an aluminum base block using transparent double-sided adhesive tape, ensuring stable fixation throughout the measurement. To comprehensively characterize the anisotropic surface structure of the FDM-printed parts, surface roughness measurements were performed on two different surfaces across three distinct measurement directions (Figure 4). This approach was adopted to account for the effects of raster direction, material deposition paths, and layer stacking on surface roughness. In accordance with the experimental design, measurements were taken from three different specimens produced for each condition, and the average was calculated. The triplicate measurement approach is a common practice in engineering to obtain accurate results. This repetition rate helps improve the accuracy of results by minimizing measurement variability. It also ensures that potential production-related variability is accounted for. The combination of multifaceted measurements and multiple roughness parameters provided a comprehensive evaluation of surface roughness characteristics.
Figure 3.
Experimental configuration for surface roughness measurements: (a) Measurement setup and (b) custom measurement fixture.
Figure 4.
Measurement directions and surfaces used in surface roughness evaluation.
The first measurement was conducted on the top surface at a 0° measurement angle, representing the overall surface quality formed by the raster tracks deposited along the printing direction. This surface provides a fundamental assessment of the surface roughness resulting from material flow and solidification behavior during extrusion. The second measurement was performed on the top surface at a 45° angle, perpendicular to the raster angle. This measurement direction is aligned with the FDM raster (material deposition) angle to capture surface roughness characteristics along the build orientation. Such an approach aims to more accurately capture surface irregularities caused by raster overlap, inter-raster gaps, and deposition inconsistencies. The third measurement was conducted on the side surface, which is produced by the layer-by-layer stacking process unique to FDM. This surface exhibits visible staircase effects and interlayer interfaces, and its roughness is strongly influenced by parameters such as nozzle diameter, printing temperature, and material flow behavior. Measuring the side surface enables the evaluation of surface roughness associated with the vertical printing direction and interlayer formation. Surface roughness for each specimen was measured using three roughness parameters: arithmetic average roughness, average maximum height of the profile, and root mean square roughness (Figure 3). The arithmetic mean roughness (Ra) is defined as the arithmetic average of the absolute deviations of the surface profile from the mean line reference measured throughout the evaluation length (Equation (1)). Ra is the most widely used parameter for overall surface roughness; however, it does not fully capture the peak-to-valley distribution when used alone.
where n is the total number of discrete profile points within the evaluation length, and yi represents the deviation of the surface profile at the ith position relative to the mean line.
Root mean square roughness (Rq) is defined as the square root of the average of the squares of the deviations of the surface profile from the mean line. Rq gives more weight to large deviations than Ra does. The Rq parameter is preferred, especially for evaluating contact mechanics and micro-geometric irregularities [48]. The Rq value is computed as shown in Equation (2).
where n is the total number of discrete profile points within the evaluation length, and yi denotes the deviation of the surface profile at the ith position relative to the mean line.
The average maximum height of the profile (Rz) is defined as the average distance between the highest peak and the lowest valley measured in each sub-length obtained by dividing the evaluation length into equal parts. Typically, the evaluation length is divided into five equal regions and calculated using Equation (3). The Rz parameter is particularly important for wear and contact problems because it highlights the most prominent surface irregularities and is preferred for evaluating micro-geometric irregularities.
where represents the maximum peak height in the ith segment, and represents the minimum valley depth in the ith segment. n denotes the number of measurement points.
2.4. Thermogravimetric Analysis
Thermogravimetric analysis was performed to investigate the thermal behavior and degradation properties of pure PLA, Re–PLA, and Wood–PLA filaments used in this study. The purpose of the TGA analysis is to evaluate the thermal stability of sustainable filaments and to correlate their degradation behavior with the printing temperature range used in the FDM process. Accordingly, TGA was not intended as a preliminary tool for process window determination, but as a complementary analysis to assess thermal stability within the selected FDM temperature range. Additionally, for wood-filled PLA filaments, the effect of natural wood fibers on the multi-stage degradation behavior of the PLA matrix was investigated. TGA measurements were performed using a STA7300 (Hitachi High-Tech Corporation, Tokyo, Japan) thermogravimetric analyzer. To fully capture the thermal degradation of PLA-based filaments and the multi-stage decomposition behavior of wood-filled filaments, the TGA analysis parameters were selected with a temperature range of 25–600 °C and a heating rate of 10 °C min−1.
2.5. SEM Characterization
Before production, pure PLA filaments were examined as reference specimens using SEM to evaluate the relative homogeneity and surface morphologies resulting from the polymer structure. Analyses were performed using a Quanta FEG 250 (FEI Company, Hillsboro, OR, USA) operating under appropriate acceleration voltage and vacuum conditions. Subsequently, the surfaces of specimens produced according to the experimental design were examined for morphological features, including surface undulation, voids, filament deposition paths, and material discontinuities.
3. Results and Discussion
3.1. Surface Roughness Results and ANOVA Analysis
Surface roughness measurements obtained from specimens produced according to the experimental design were used to evaluate surface quality and to perform the optimization procedure, with the results summarized in Table 4. In this study, the optimization procedure was carried out using the Ra parameter as the main surface roughness indicator. The main reason for this is that Ra represents the arithmetic mean of all irregularities in the surface profile and is the most widely used roughness parameter in the literature as a general indicator of surface quality [49]. Measurement uncertainty was accounted for based on repeated measurements and instrument characteristics. The slightly higher variations observed in Wood–PLA samples are attributed to the heterogeneous distribution of wood fibers within the PLA matrix rather than measurement instability [37]. The Ra value is directly related to surface quality in FDM-produced parts and provides a metric sensitive to changes in process parameters. Therefore, Ra allows for comparison between different filament types and printing conditions, and for reliable determination of optimum process parameters. In addition, the Rz and Rq parameters were used as complementary indicators to validate the optimization results obtained with Ra and to support surface characterization, as they reflect local surface irregularities, such as the peak-pit distribution, in more detail.
Table 4.
Experimental results of surface roughness measurements.
Analysis of variance (ANOVA) is a statistical method widely used, particularly in manufacturing, to identify factors influencing a response variable in factorial experimental designs and to determine the contribution of each factor [36,50]. Compared to other statistical approaches, ANOVA provides a clear interpretation of factor significance in experimental design. ANOVA was applied to the measurement results to determine the relative effect and contribution percentages of each factor on the surface roughness parameters. The statistical significance level was set at a 95% confidence interval (p < 0.05). The analyses were performed separately for three different measurement results: top surface (0°), top surface (45°), and side surface, as previously determined. The ANOVA results for Ra are given in Table 5.
Table 5.
Analysis of variance table for Ra.
ANOVA results indicate that surface roughness is primarily determined by material type and selected printing parameters, depending on the measurement direction, with statistically significant effects identified at the 95% confidence level (p < 0.05). This situation results from the sensitivity of filament materials to printing parameters such as temperature and speed, stemming from their intrinsic properties. For example, Re–PLA can be more sensitive to printing conditions due to chain breaks and microstructural changes that occur during the recycling process, which affect the polymer’s structural integrity and, consequently, its surface roughness. On the other hand, Wood–PLA may exhibit a different surface response due to factors such as heterogeneous material structure, poor fiber-matrix adhesion, and differences in melt flow behavior. These material-specific characteristics contributed to the different doping ratios observed in the ANOVA results. Furthermore, these findings demonstrate that the main contributors to Ra depend on the surface orientation, thus indicating that FDM-printed specimens are direction-dependent in terms of surface roughness. Factors with higher contribution values represent the dominant parameters affecting surface quality [51]. In the measurements conducted on the top surface in the (0°) direction, the filament material provided the highest contribution (29.47%), followed by printing temperature (18.72%) and printing speed (18.33%). The most significant effects of printing temperature and printing speed on surface roughness were measured on this surface. This situation reveals that the nozzle diameter provided a negligible contribution (0.35%). A similar trend was observed for the top surface measured in the 45° direction; however, while the contribution of the filament type increased further (86.71%), the influence of other factors decreased. The lowest error rate was observed in this measurement. This result shows that measurements perpendicular to the raster increase the sensitivity to material-induced surface heterogeneity. In measurements taken from the flanks, the filament material plays a dominant role, explaining 66.48% of the variation in surface roughness. The influence of other factors is quite low on this surface as well. The dominance of the material on the flank results from the cumulative effect of layer stacking; in this case, the microstructural inconsistencies of the filament become more pronounced.
When the three different measurement directions are evaluated together, the ANOVA results confirm the expected anisotropic surface roughness behavior inherent to the FDM process. Specifically, the 45° measurement direction, thanks to its raster angle measurement approach, provides a more sensitive assessment of material-induced surface irregularities. These findings confirm that representing surface roughness with a single measurement direction is insufficient and that direction-dependent analyses are necessary. Following the ANOVA-based evaluation (Table 5), regression analysis was applied to further examine direction-dependent differences in surface roughness predictability. The regression model explains approximately 66.9% of the total variance for the top surface measured in the 0° direction (R2 = 0.6688). In contrast, the top surface measured in the 45° direction showed the best model performance, with an R2 of 0.9113. For the side surface, the regression model showed a moderate explanatory power (R2 = 0.7761). These results reflect the increasing influence of layer stacking effects and microstructural variability, indicating that surface roughness behavior is influenced by additional factors that extend beyond the scope of a simple regression description. Overall, the regression results suggest that the 45° measurement direction offers relatively higher predictability compared to the other investigated orientations.
3.2. Taguchi-Based S/N Ratio Analysis for Ra
Signal-to-noise (S/N) ratio analysis was used to investigate the effects of experimental design parameters on surface roughness and to optimize surface roughness. In this technique, the obtained data is converted into an S/N ratio value [50]. The signal factor (S) represents the experimental results, while the noise factor (N) represents parameters that were not considered in the experiments but that affect the results. The parameters that make up the noise factor are those that prevent achieving the desired optimal experimental result [52]. Since the primary objective of this study was to minimize surface roughness, the “smaller-the-better” approach was used as the objective function in the analysis. The S/N ratio was calculated for each experimental condition using Equation (4).
where yi represents the measured surface roughness value and n denotes the number of repetitions for each experimental condition.
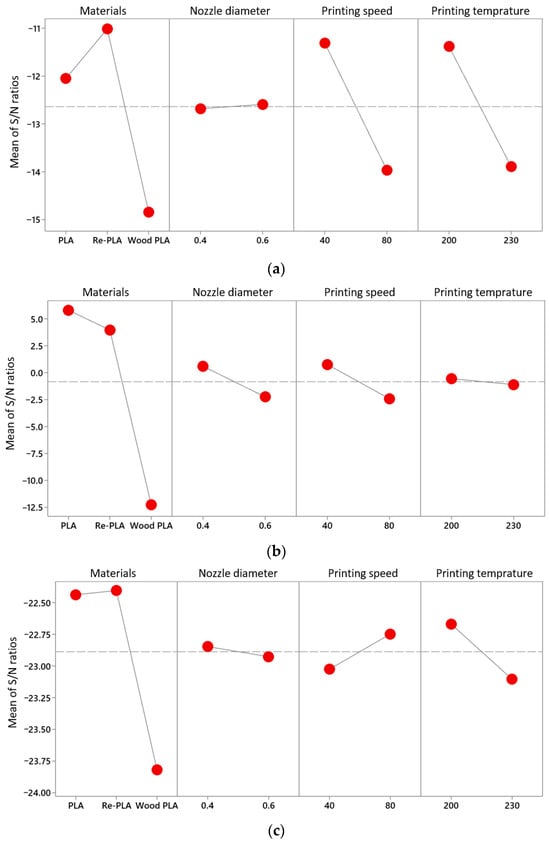
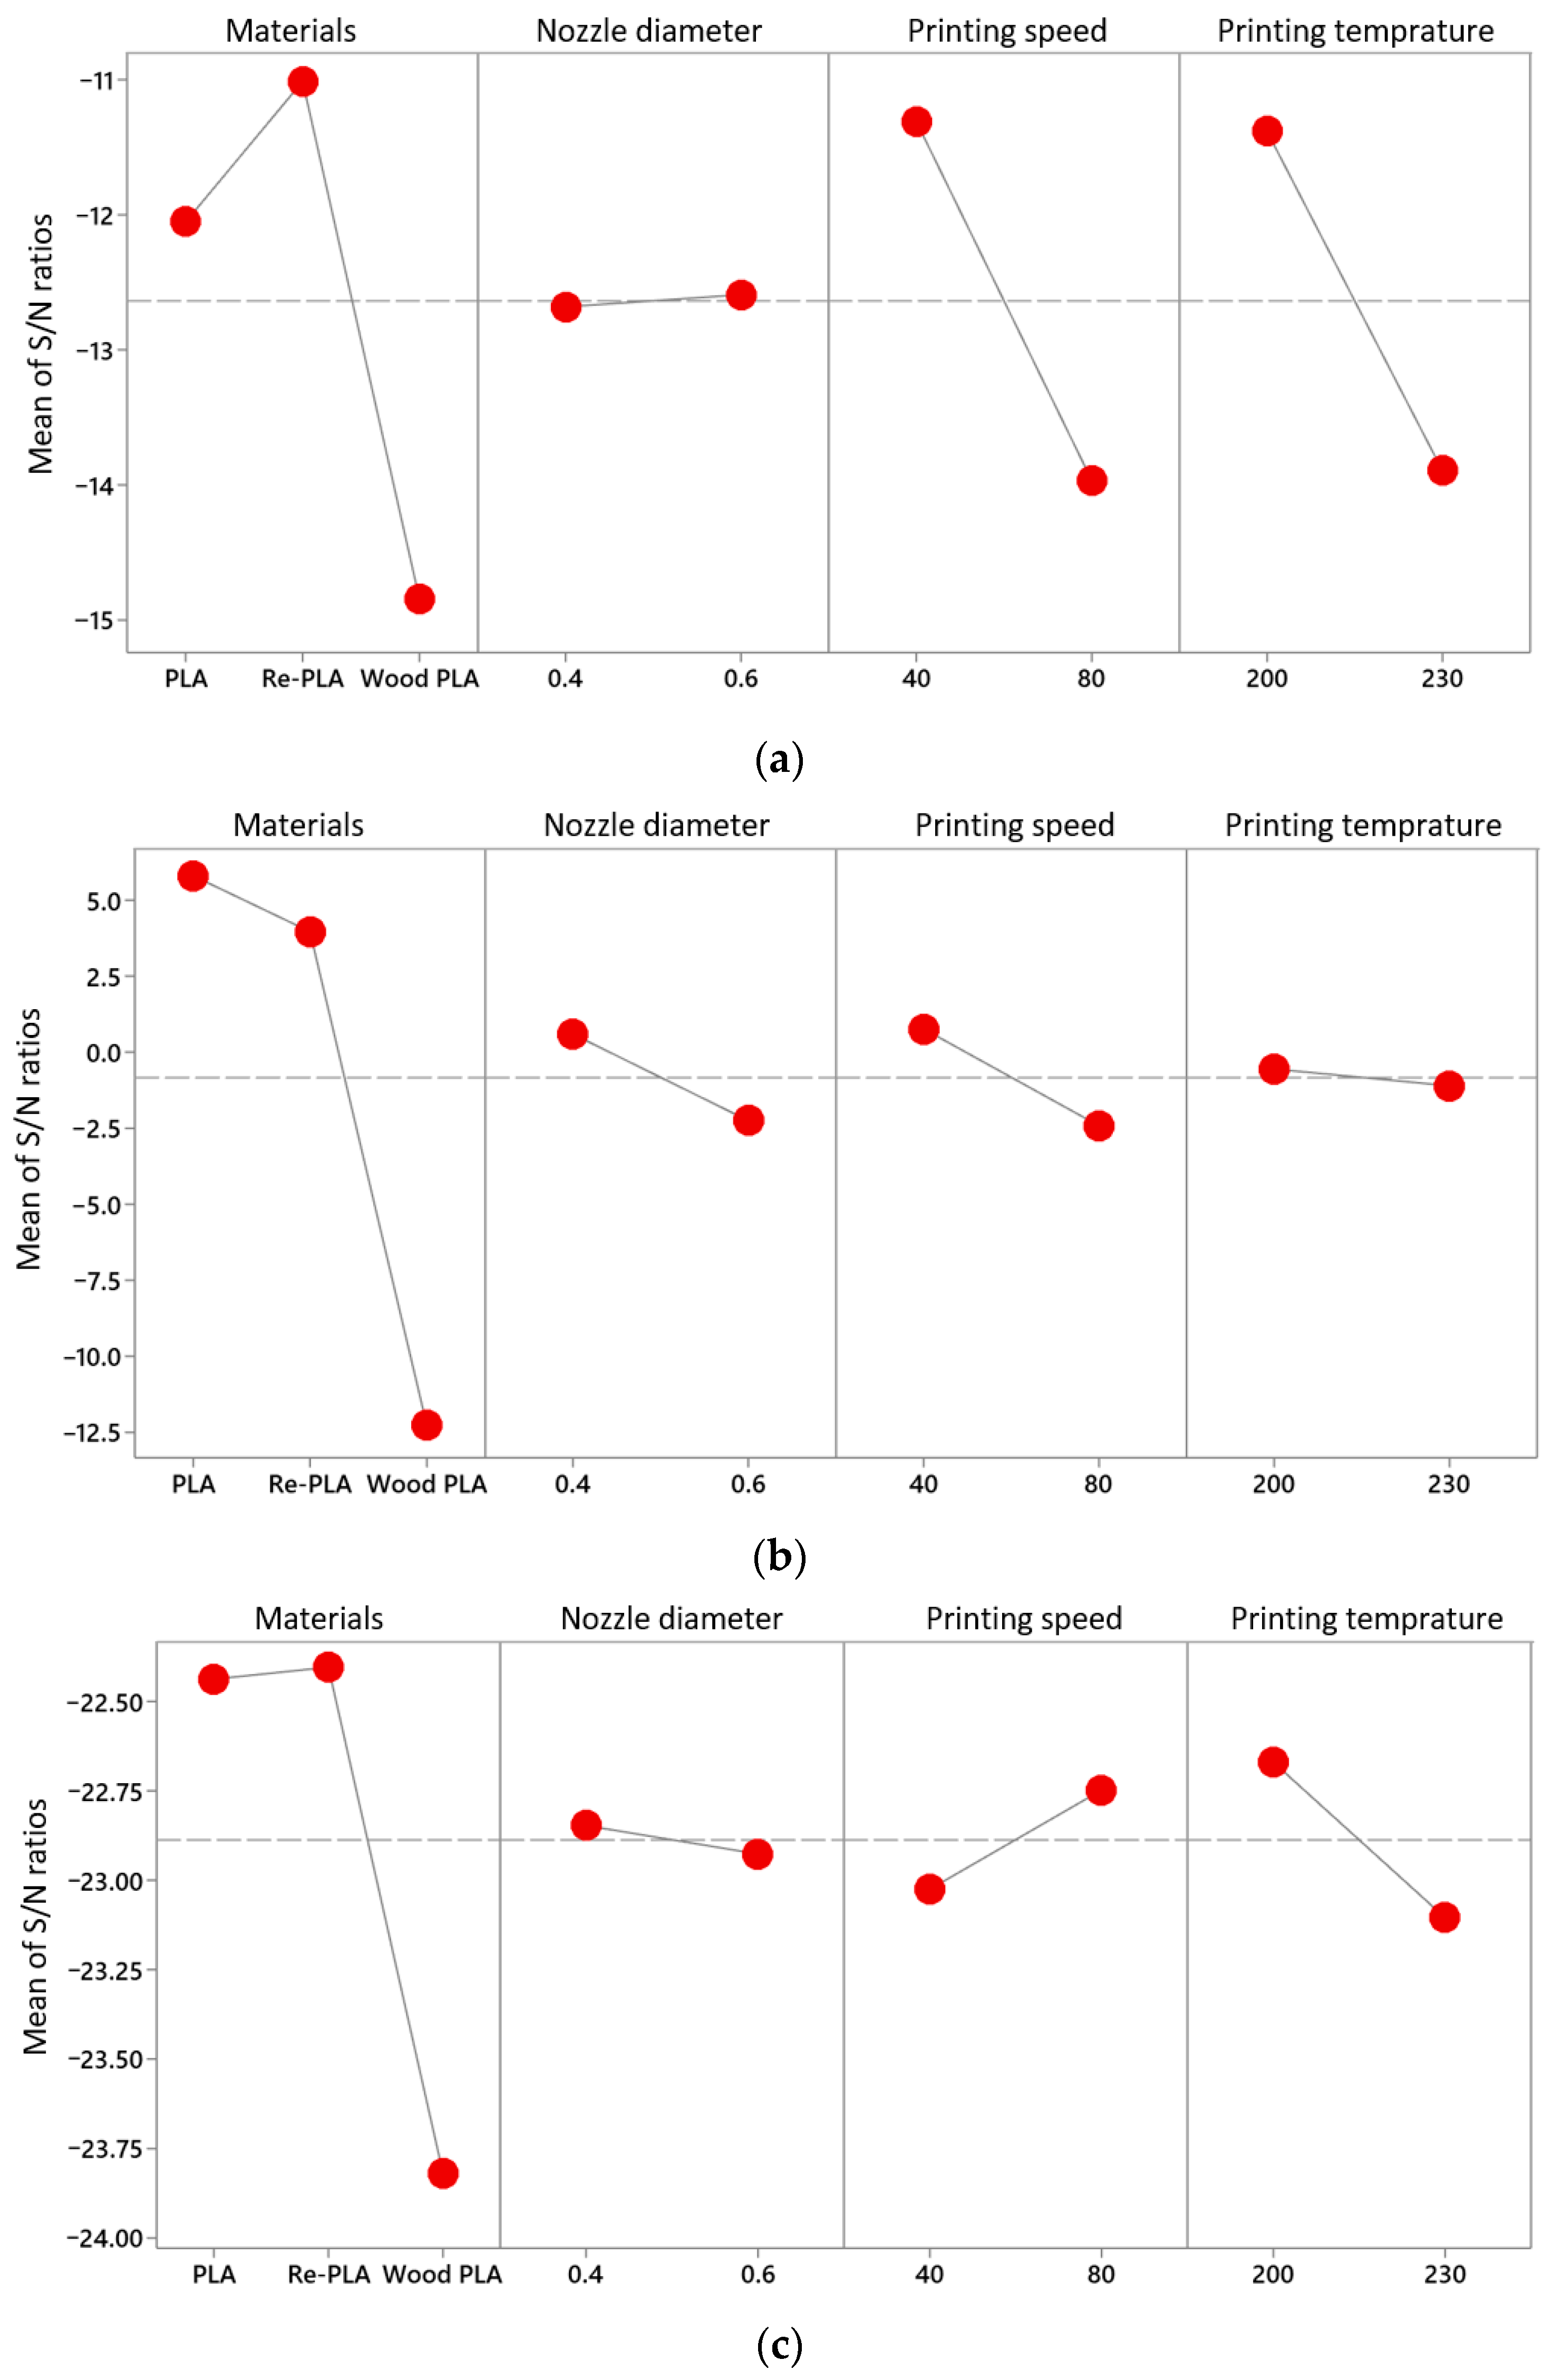
S/N ratio analysis was performed separately for each measurement direction (Table 6). The analysis determined the optimum printing parameter levels required to minimize Ra while accounting for surface anisotropy. The factor level with the highest S/N ratio was considered optimal, as it indicated improved surface quality with reduced sensitivity to noise factors. Thus, optimum printing parameters were determined for each measurement surface. The optimum filament material and processing parameters calculated for different surfaces and measurement directions are given in Table 7. Main effect graphs of S/N ratios were created to evaluate the effects of printing parameters on surface roughness. Figure 5 shows the main effect graphs of treatment parameters on S/N ratios for Ra at different surface orientations. These graphs illustrate the effect of a single factor on the response variable, independent of the effects of other factors.
Table 6.
Full factorial design matrix and corresponding Ra and S/N results.
Table 7.
Response table for S/N Ratios.
Figure 5.
Main effects plots of S/N ratios for Ra: (a) top surface (0°), (b) top surface (45°), and (c) side surface.
While the Re–PLA filament provided the lowest surface roughness values for the top surface in the 0° direction and the side surface, the Wood–PLA filament yielded the lowest surface roughness on the top surface in the 45° measurement direction. While the 0.6 mm nozzle provided the optimal Ra value for the top surface in the 0° direction, the 0.4 mm nozzle yielded lower surface roughness in other measurements. Surface roughness was optimized at low printing speeds on the top surface, whereas high printing speed was best for the side surface. The optimum printing temperature for all factors was determined to be the lowest level (200°). This result can be attributed to the fact that while a more uniform filament deposition onto the layers is achieved at appropriate temperature levels, flow instabilities lead to surface fluctuations at high temperatures [53]. This result is because the interlayer fusion time significantly influences the surface morphology. Wood–PLA is not recommended, as it increased surface roughness the most across all surfaces. The parameter combinations yielding the lowest Ra values within the investigated factor levels for each measurement direction are summarized in Table 8.
Table 8.
Parameter combinations yielding minimum Ra within the investigated factor levels.
3.3. Comparative Evaluation of Rz and Rq
To provide a more comprehensive assessment of surface quality, the surface roughness results obtained using Rz and Rq parameters were evaluated and compared with the Ra-based findings. While Ra represents the overall surface roughness level, Rz and Rq provide complementary information by emphasizing extreme surface features and statistically weighted height deviations, respectively [54,55]. The general trends observed in Rz and Rq values were largely consistent with those obtained from Ra analysis, thus confirming the reliability of the primary surface roughness assessment. Specimens with low Ra values generally showed lower Rz and Rq values, indicating smoother surfaces with reduced peak-valley variation and a lower overall height distribution. Conversely, higher Ra values were accompanied by increased Rz and Rq values, reflecting the presence of significant surface irregularities.
Among the investigated filament types, Wood–PLA consistently exhibited higher Rz values, particularly on the top surface in the 0° direction and on the side surfaces. This behavior indicates the presence of more pronounced surface peaks and valleys, which can be attributed to the filament’s heterogeneous structure and interactions between the wood fibers and the extrusion process. The Rz parameter has proven particularly sensitive to these localized surface defects, highlighting extreme surface features that cannot be fully captured by Ra alone. The Rq parameter showed similar trends to Ra; however, it exhibited a higher sensitivity to larger surface deviations. In several experimental conditions, the variations in Rq were more pronounced than those observed in Ra, suggesting that Rq is more sensitive to fluctuations in filament deposition and interlayer bonding quality. This effect was particularly evident in the Re–PLA specimens, where slight increases in Rq indicated occasional surface deviations associated with microstructural variations induced by the recycling process.
3.4. Correlation Analysis of Rz and Rq with Ra
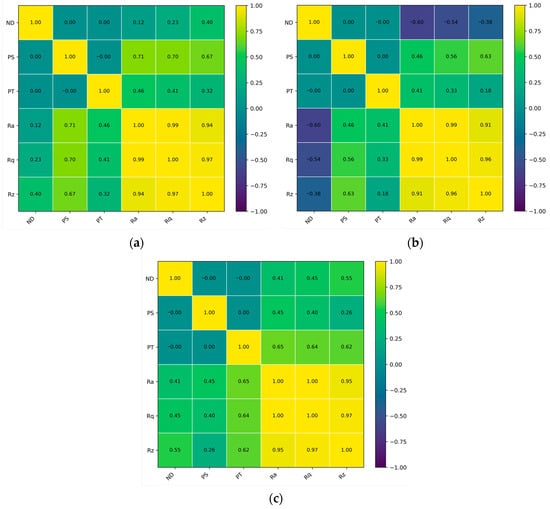
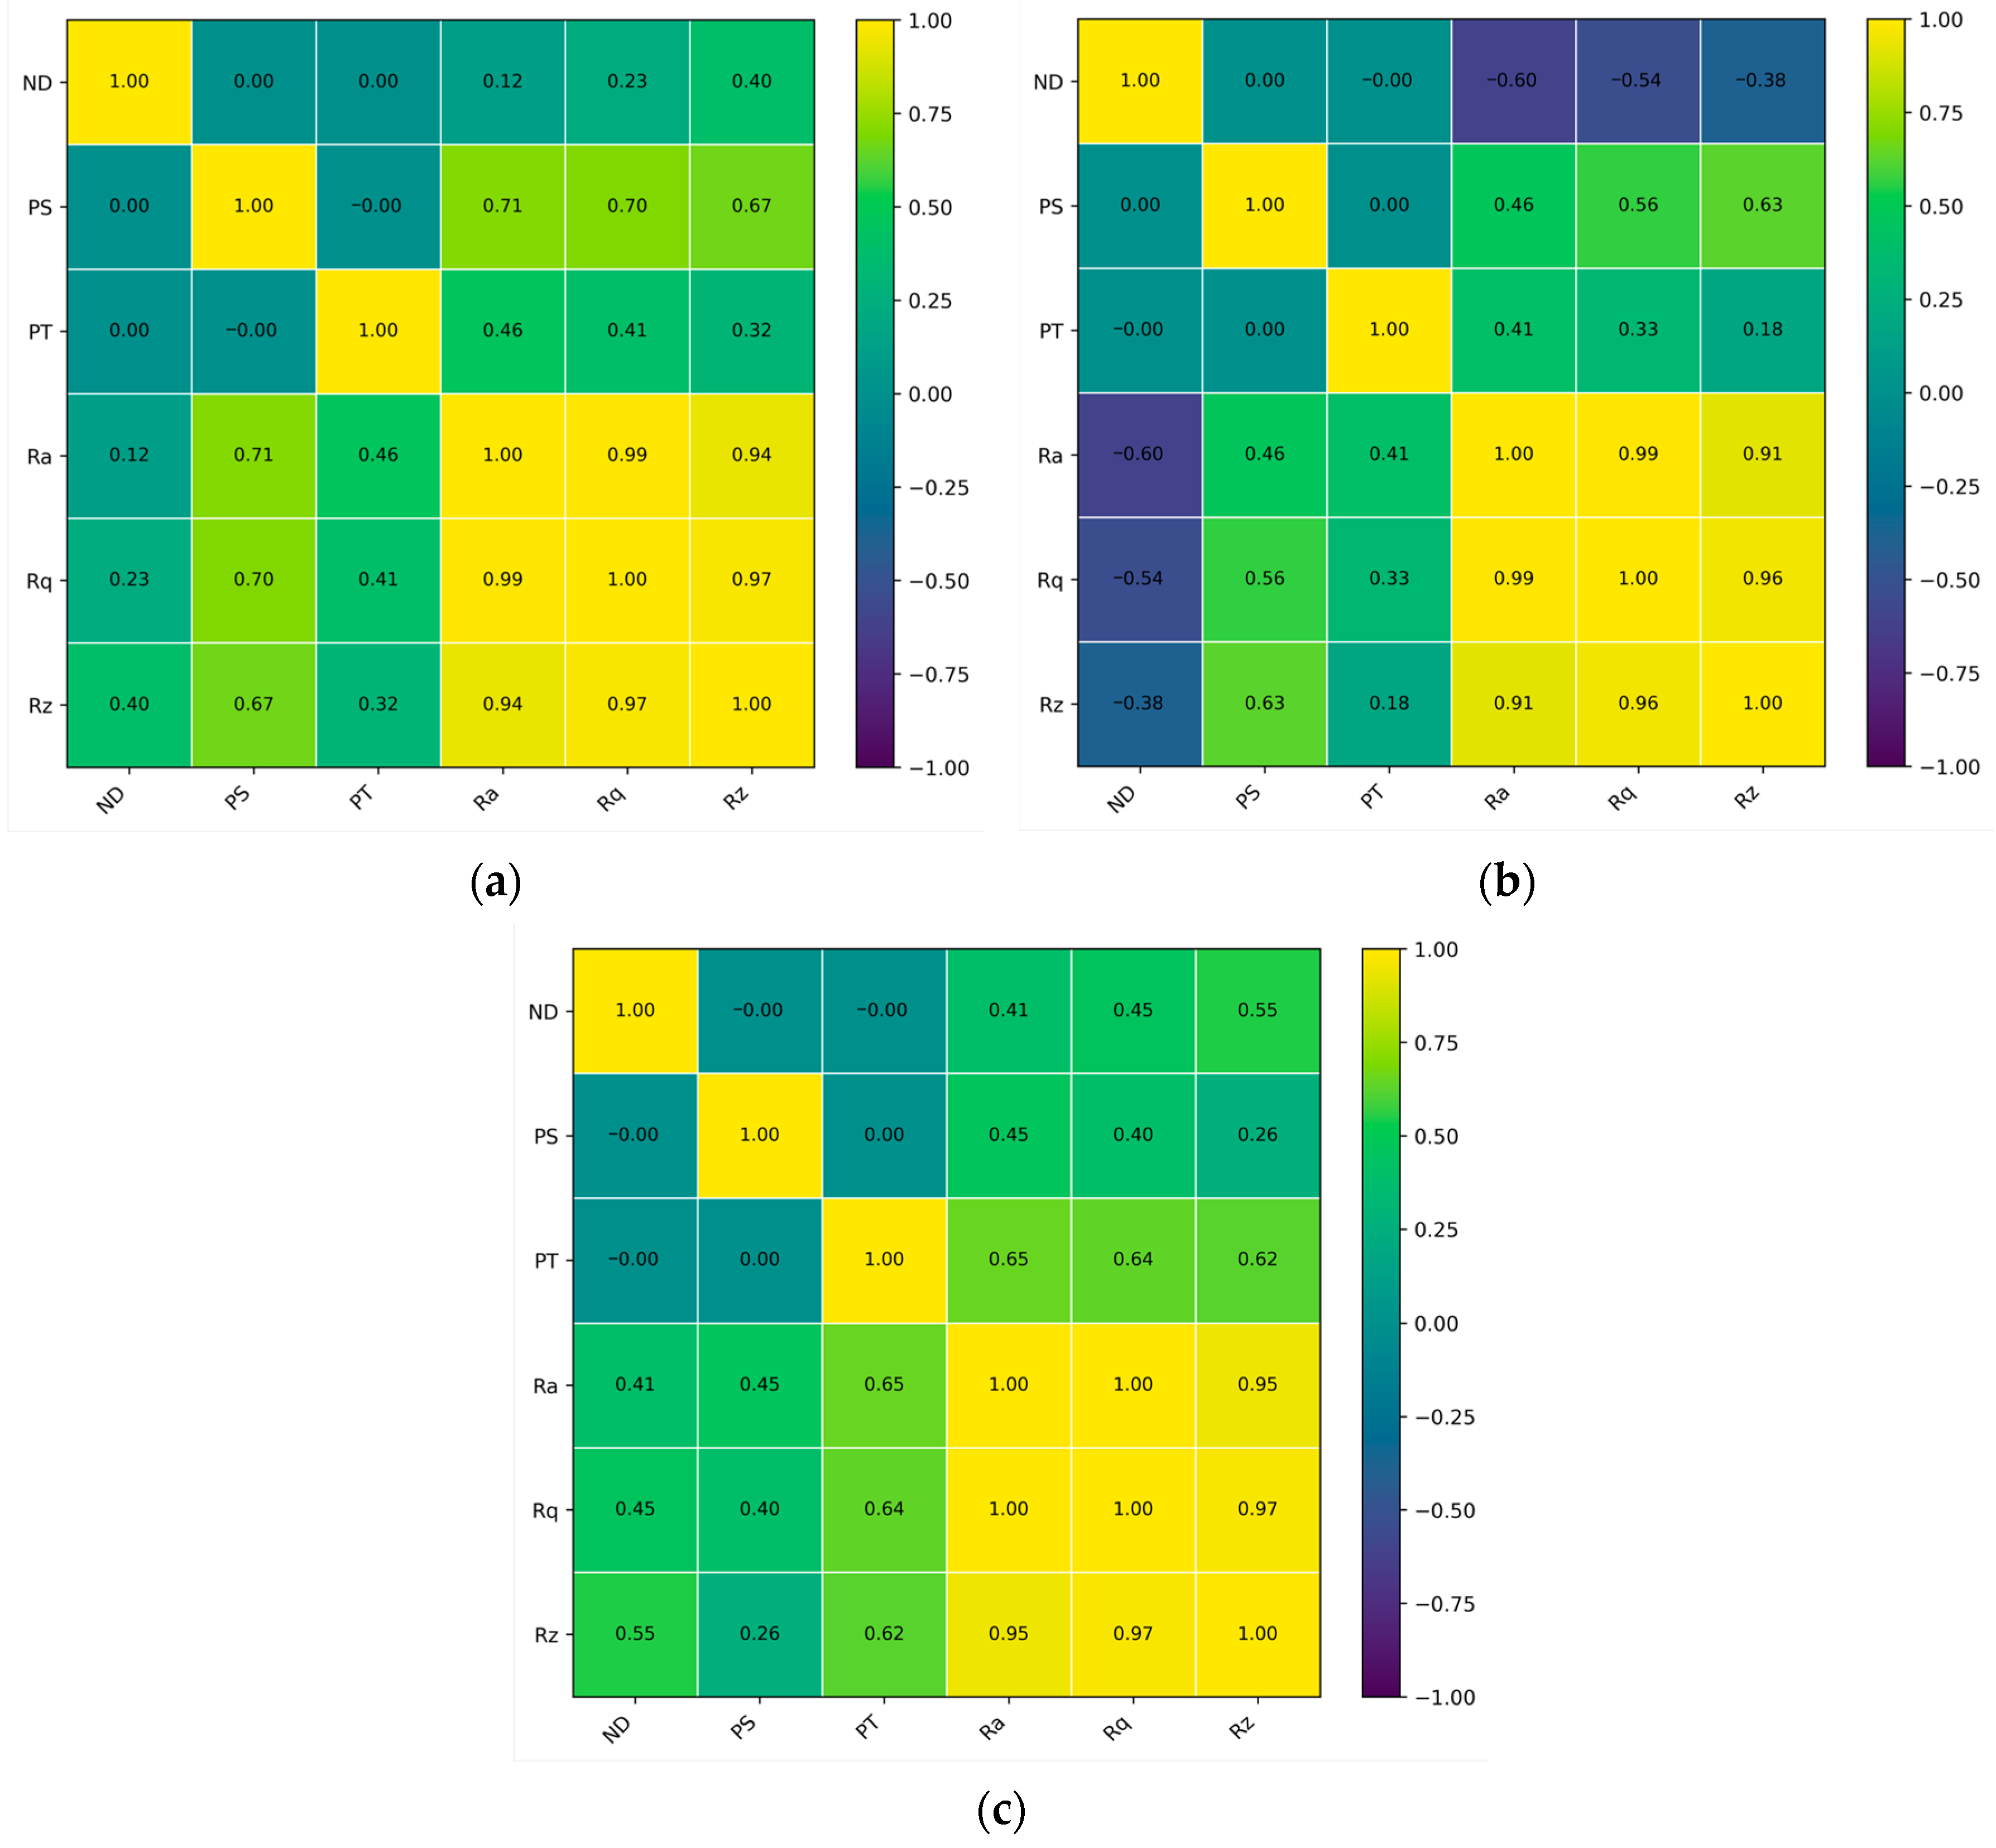
The similarity in parameter variations across Ra, Rz, and Rq validates that the selected optimization strategy is robust and not dependent on a single roughness parameter. The combined use of Ra, Rz, and Rq provides a more reliable assessment of surface quality, particularly for heterogeneous, sustainability-oriented filaments such as Wood–PLA and Re–PLA. To examine the linear relationships between printing parameters and surface roughness parameters (Ra, Rq, and Rz), correlation matrices were generated for products manufactured from different materials (Figure 6).
Figure 6.
Correlation matrices between printing parameters and surface roughness characteristics for (a) PLA, (b) Re–PLA, and (c) Wood–PLA.
The correlation analysis results provide insight into the general relationships between printing parameters and surface roughness characteristics. The correlation matrix indicates a moderate to strong positive correlation between printing speed and surface roughness parameters for PLA specimens. Although higher printing temperatures are generally associated with improved interlayer bonding, the correlation analysis indicates that temperature alone does not show a strong relationship with surface roughness. Printing speed exhibited the strongest positive correlation with surface roughness parameters among the investigated printing parameters for PLA specimens. An inverse relationship is observed between nozzle diameter and surface roughness for the Re–PLA specimens. This trend may be associated with the ability of larger nozzle diameters to better tolerate micro-irregularities and foreign particles introduced during the remelting process in Re–PLA. As with PLA, printing speed also increased roughness in Re–PLA. The relationship between surface roughness and printing parameters is weaker in Wood–PLA specimens than in other materials. This indicates that, in Wood–PLA, surface quality is more strongly influenced by the filament’s internal structure. The correlation matrices showed strong positive correlations between Ra and Rq under different printing conditions. This indicates that both parameters are largely dependent on similar surface properties. However, differences in correlation strength were observed, particularly in Re–PLA and Wood–PLA samples. These differences suggest that additional surface irregularities are affecting roughness measurements in samples produced with non-pure PLA filament.
3.5. Thermogravimetric Analysis Results
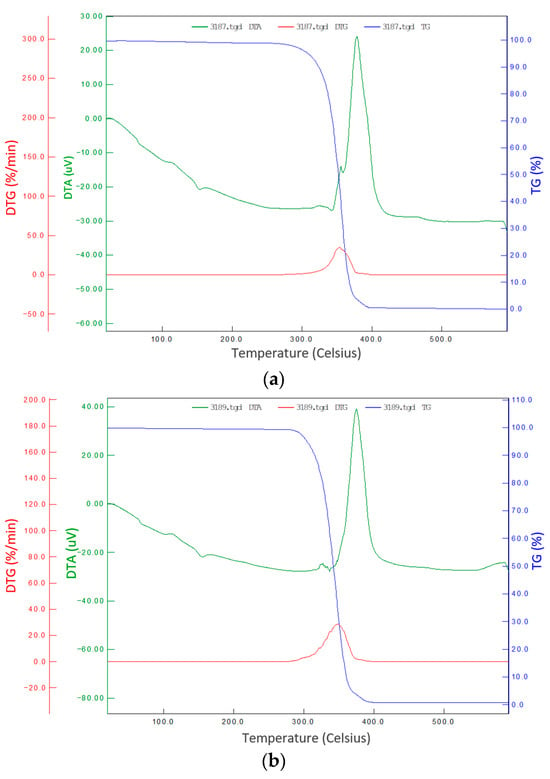
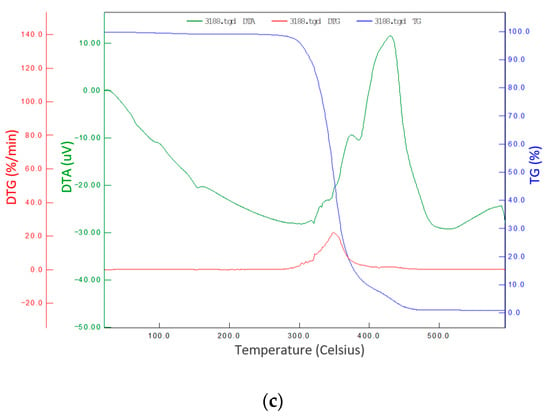
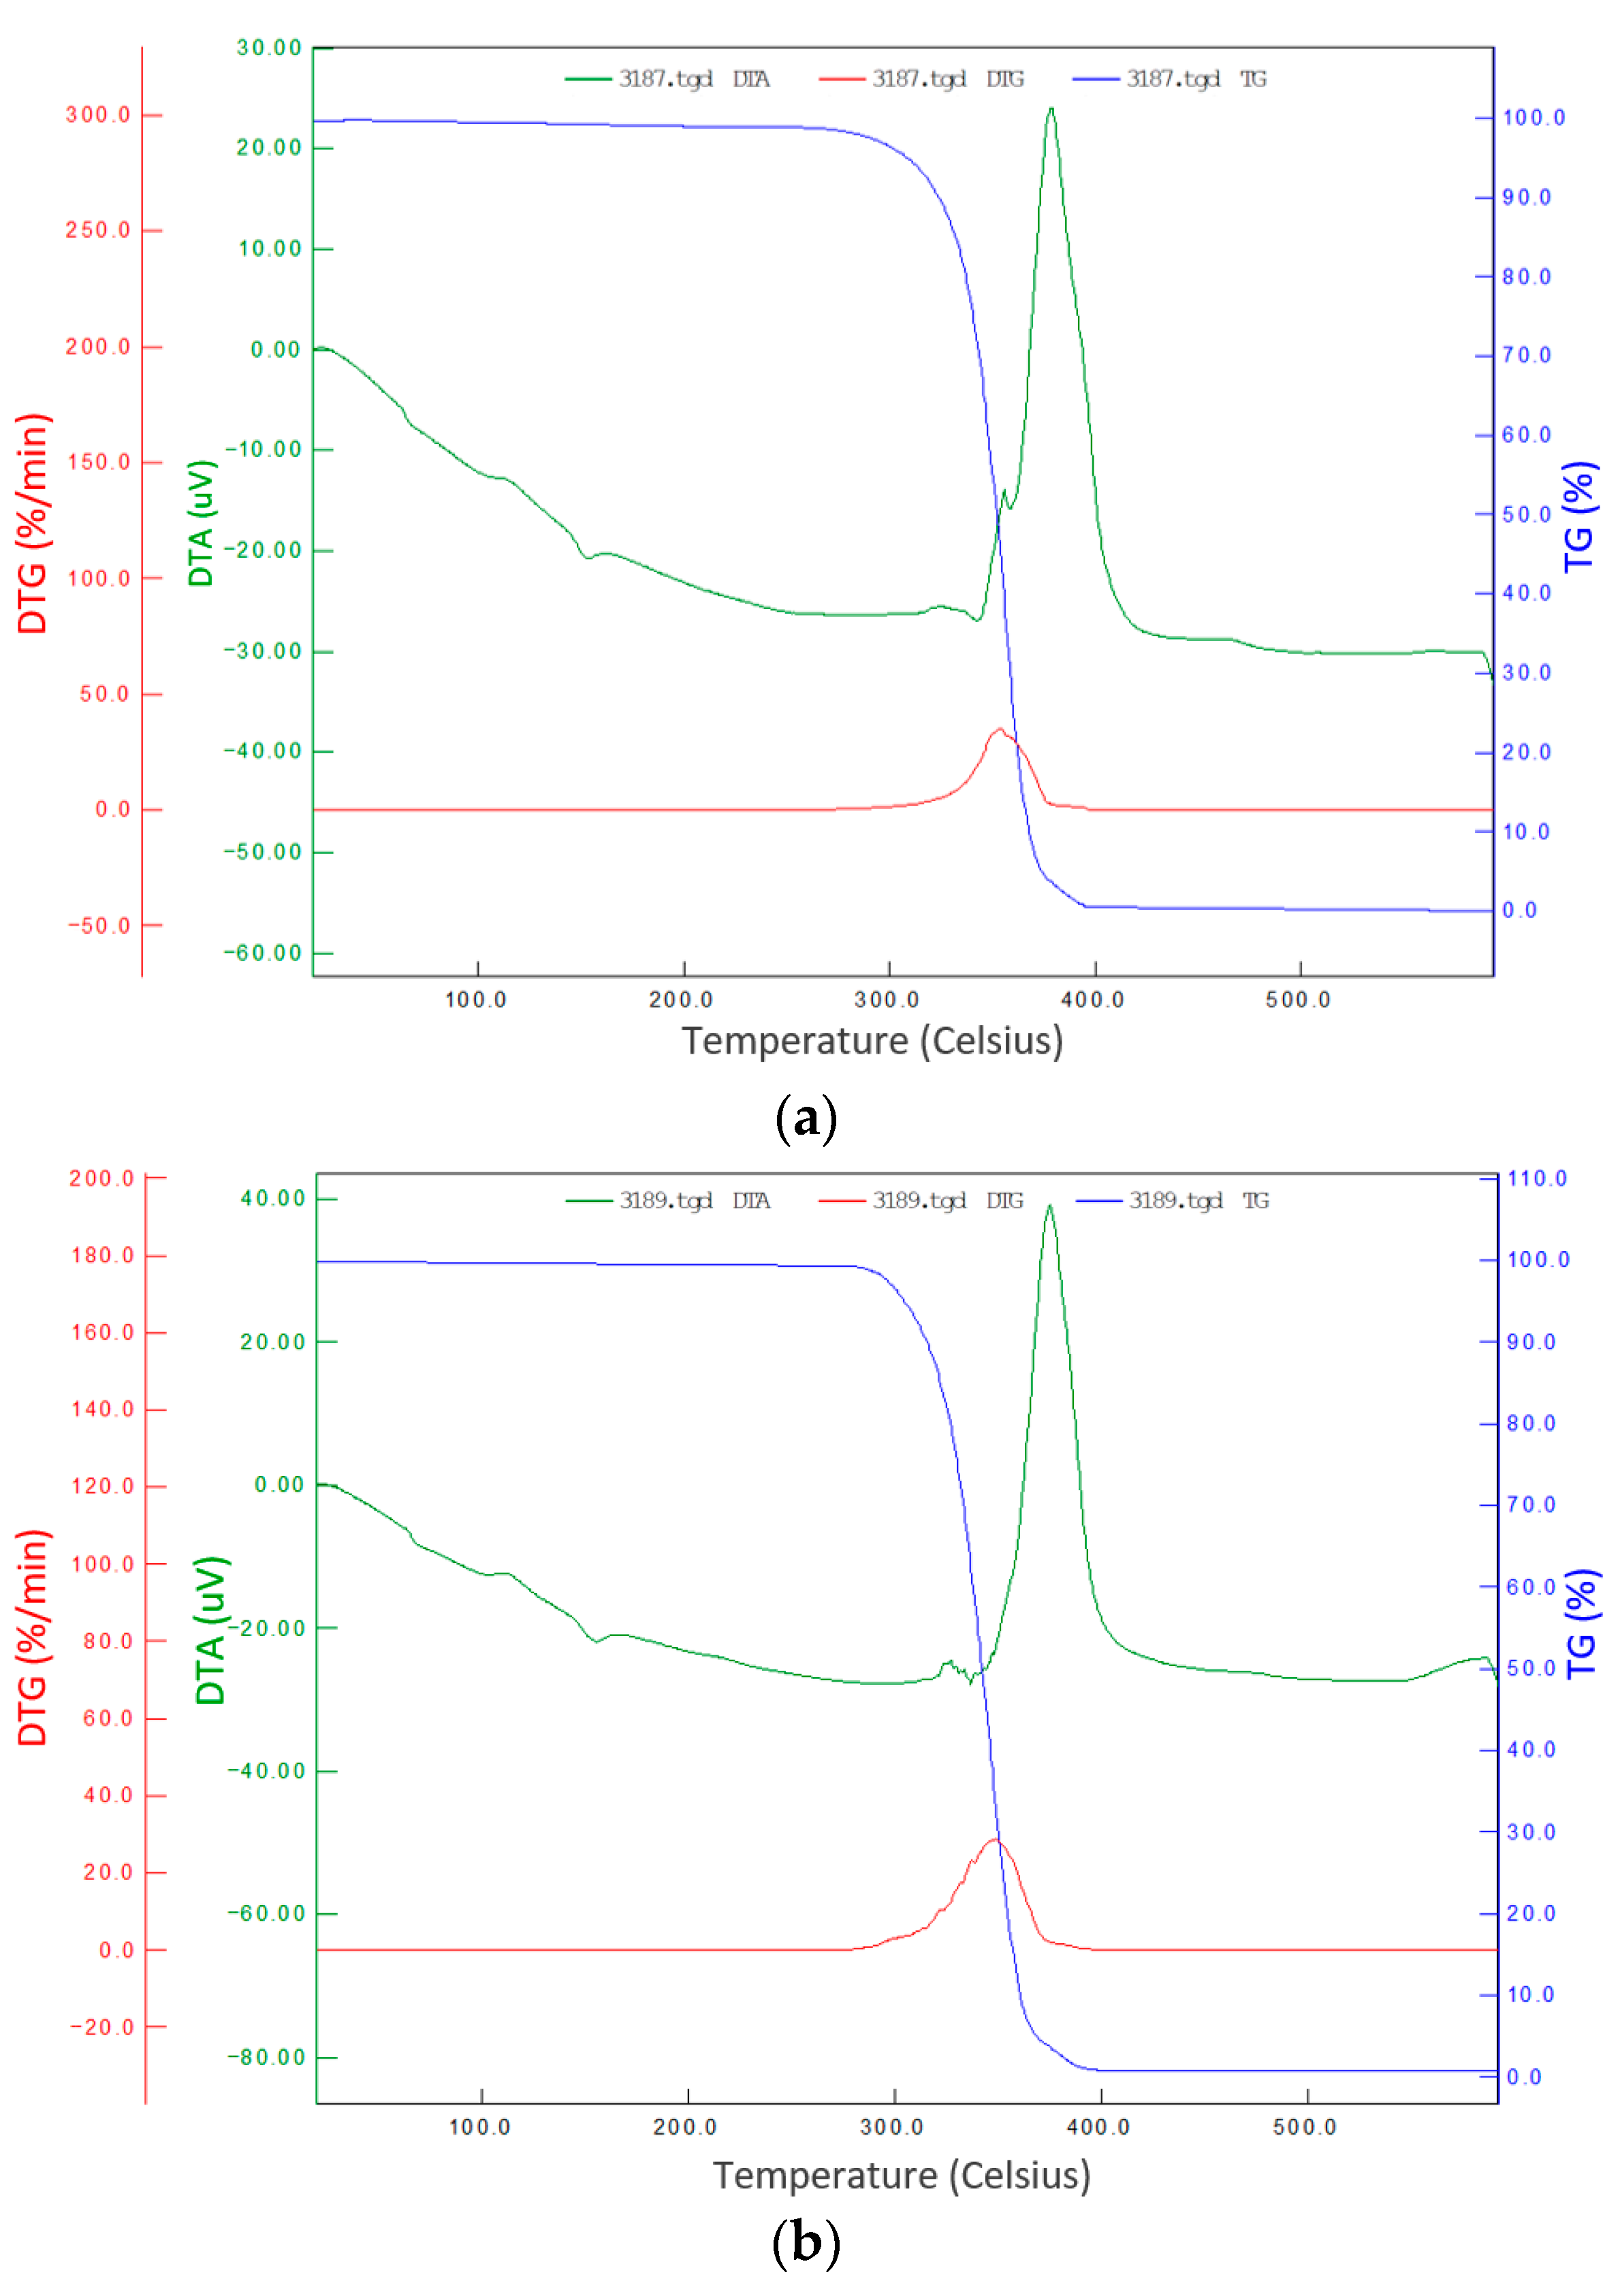
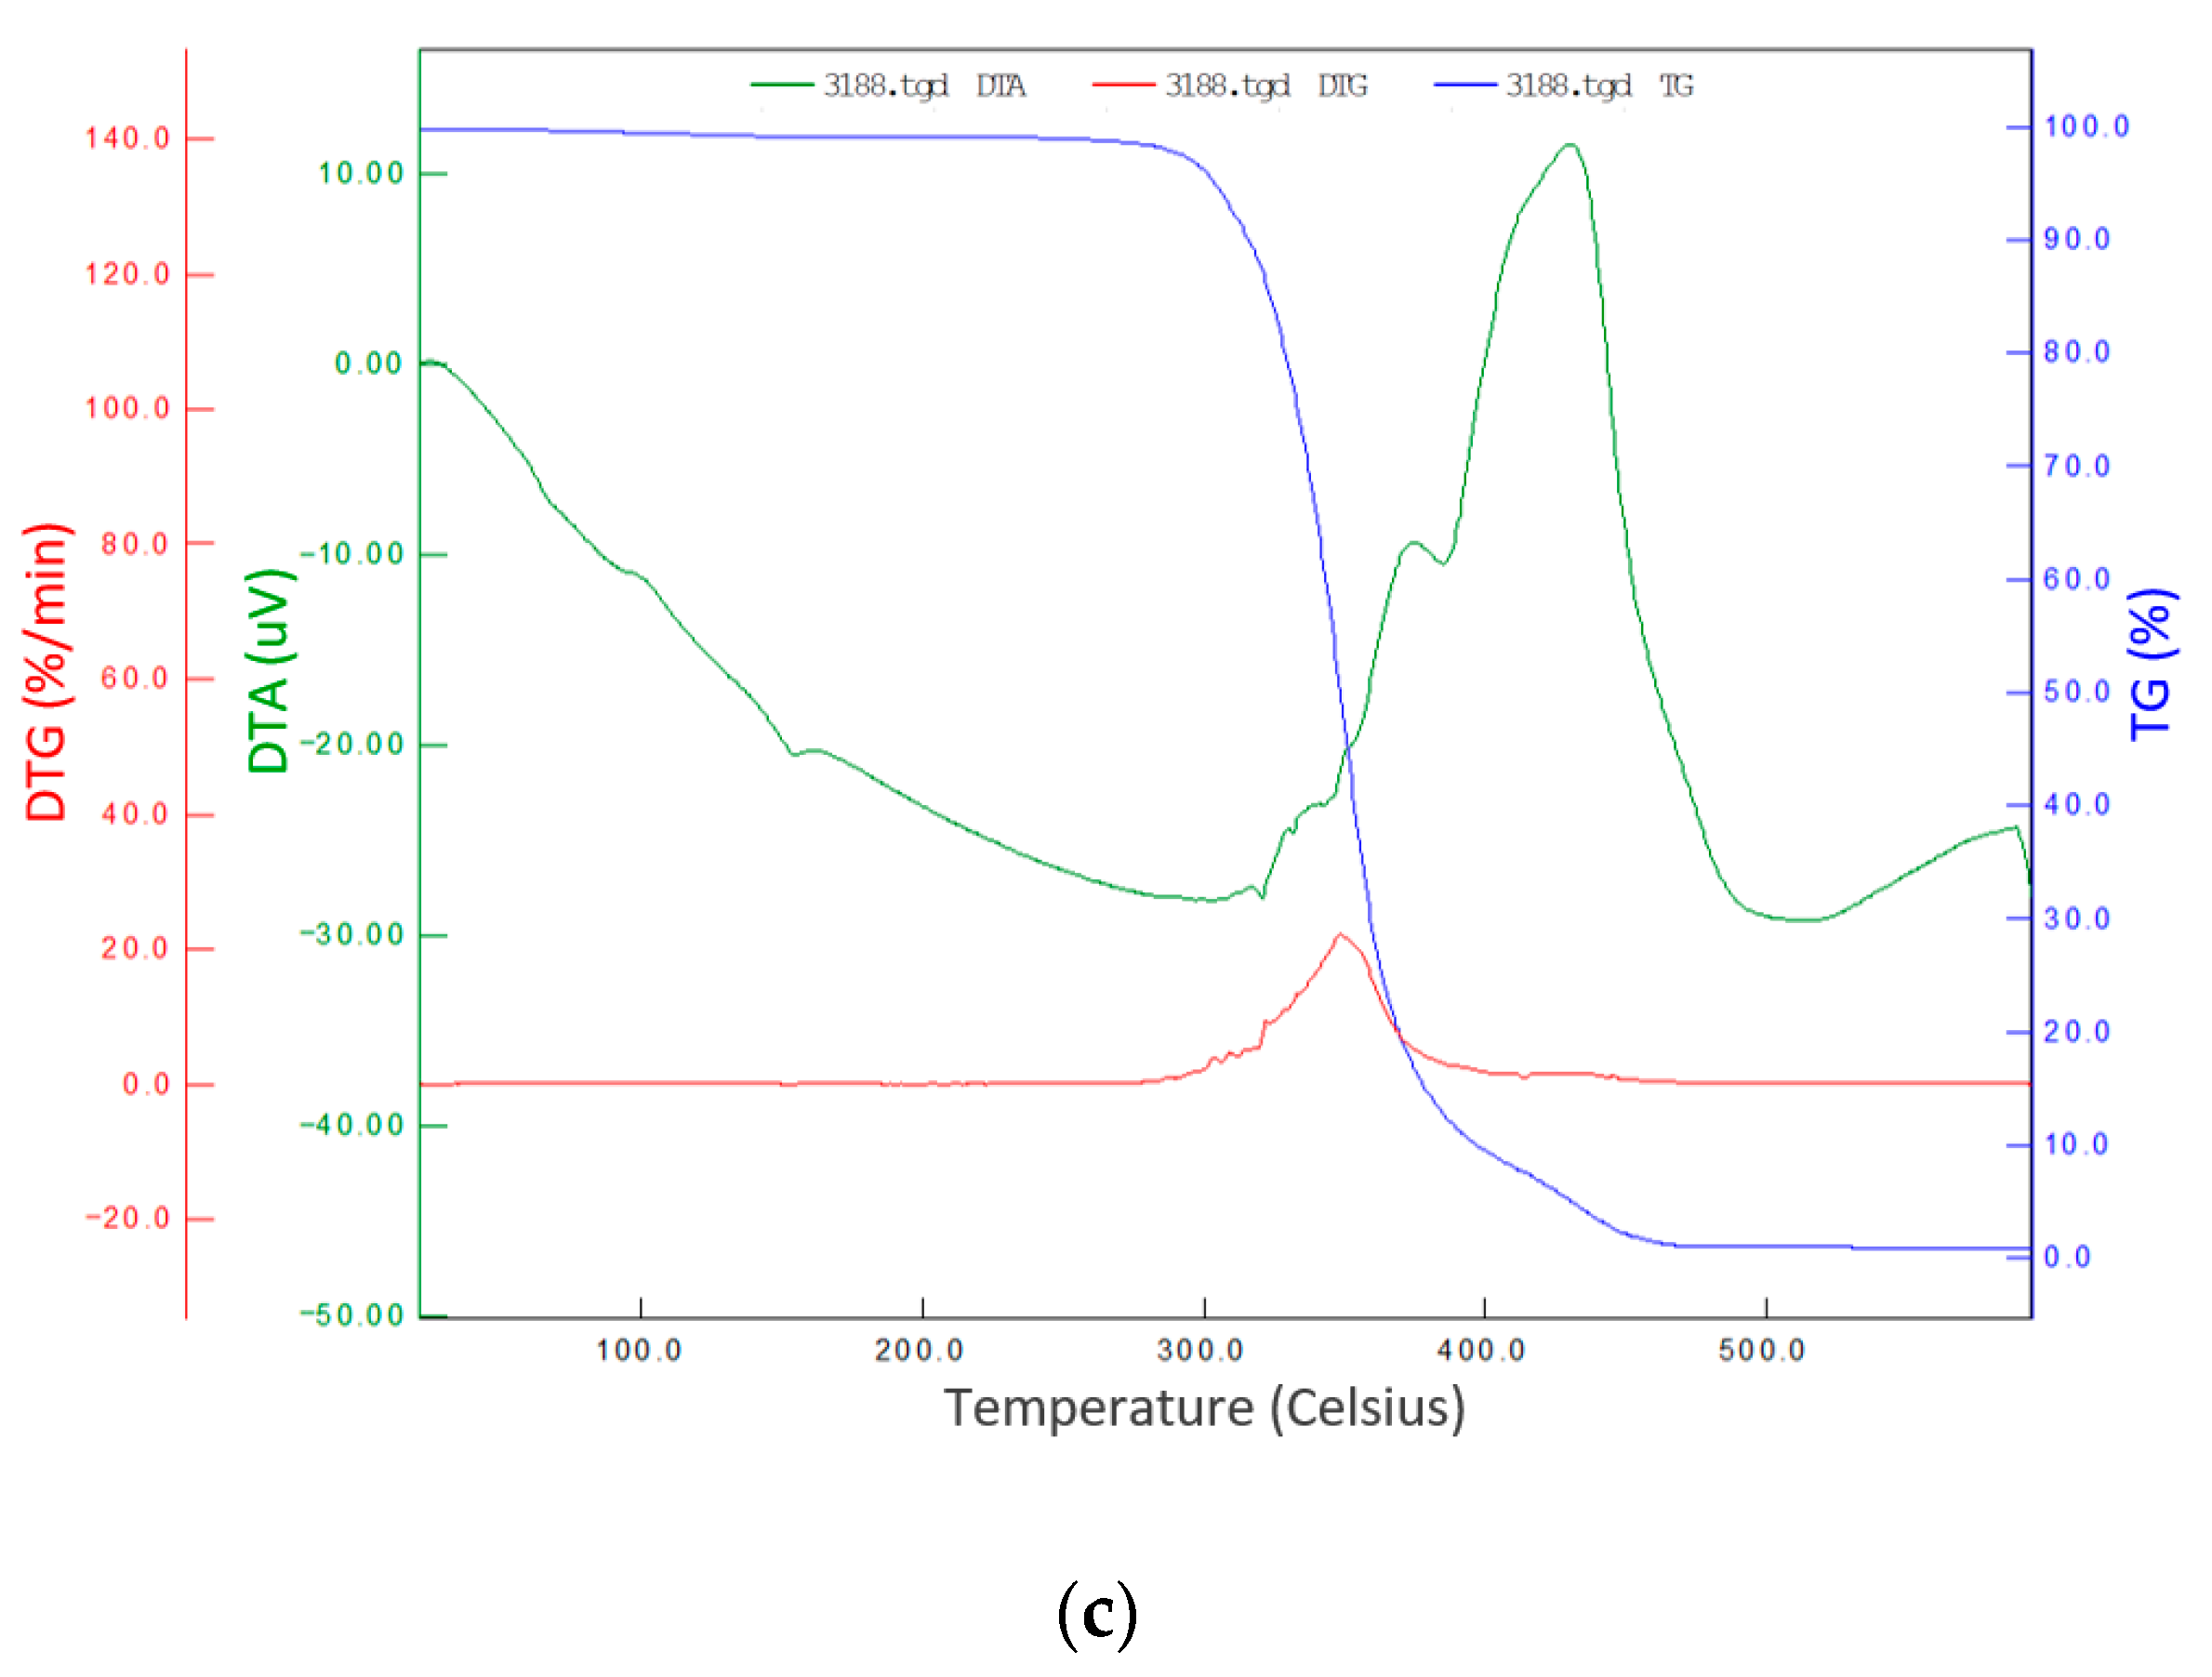
Thermogravimetric analysis was used to evaluate and compare the thermal stability and degradation behavior of the investigated filament materials. The onset degradation temperature (Tonset), the temperature corresponding to the maximum degradation rate (Tmax), and the residual mass at 600 °C were determined from the thermogravimetric (TG) and derivative thermogravimetric (DTG, %/min) curves, providing a systematic comparison of the thermal stability and degradation mechanisms of the filament types. Figure 7 illustrates the TG and DTG curves of PLA, Re–PLA, and Wood–PLA filaments obtained under identical heating conditions.
Figure 7.
DTG and TG curves of pure (a) PLA, (b) Re–PLA, and (c) Wood–PLA.
All filaments exhibit a single dominant thermal degradation stage characteristic of PLA-based materials, with negligible mass loss observed below approximately 250 °C. This confirms that the printing temperature range selected for the experimental design (200–230 °C) is well below the onset of thermal degradation for all investigated filaments, ensuring thermally stable processing conditions. Pure PLA filament exhibits the most uniform degradation behavior, with a sharp DTG peak and a narrow degradation range, indicating a relatively homogeneous polymer structure. This thermal stability is consistent with the lower surface roughness observed for PLA specimens, particularly on the top surfaces, where melt flow remains stable, and material degradation does not hinder layer formation. Re–PLA filament exhibited a degradation profile similar to that of pure PLA; however, the DTG peak was slightly broader, indicating increased structural heterogeneity resulting from the recycling process. Reprocessing PLA can lead to chain breakage and a reduction in molecular weight; this does not significantly alter overall thermal stability but may affect melt viscosity consistency during extrusion. This behavior is associated with the moderately increased Ra values measured for Re–PLA specimens, particularly on the flanks, where layer stacking effects amplify the impact of material irregularities. In contrast, Wood–PLA exhibits a distinctly different thermal behavior. An earlier onset of mass loss and a broader DTG peak are observed; this can be attributed to the presence of wood fibers and residual moisture within the filament. Lignocellulosic components degrade at lower temperatures than the PLA matrix, leading to multi-component degradation behavior. Although primary PLA degradation still occurs at higher temperatures, the early mass loss reflects the decreased thermal homogeneity during printing. This phenomenon is consistent with the significantly higher surface roughness values obtained for Wood–PLA, as the presence of solid fillers disrupts melt flow, promotes microvoid formation, and increases surface heterogeneity, particularly on raster-sensitive and flanking surfaces.
In general, the TGA results indicate that although all filaments are thermally suitable for the selected printing conditions, differences in degradation behavior and thermal homogeneity significantly influence surface quality. Pure PLA provides smoother surfaces due to its stable thermal degradation and homogeneous melting behavior. Re–PLA exhibited increased variability due to structural changes induced by recycling, while maintaining similar thermal stability. Despite its sustainability advantages, Wood–PLA, which experienced decreased thermal homogeneity due to wood fiber degradation, directly contributed to increased surface roughness. These findings confirm that the surface roughness variations observed in printed parts are closely related not only to process parameters but also to the thermal and compositional properties of the filament materials.
3.6. SEM Analysis of Filaments and Printed Specimens
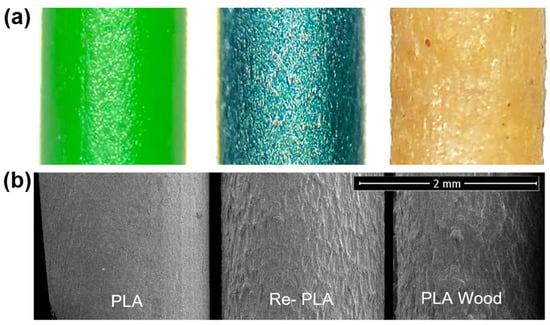
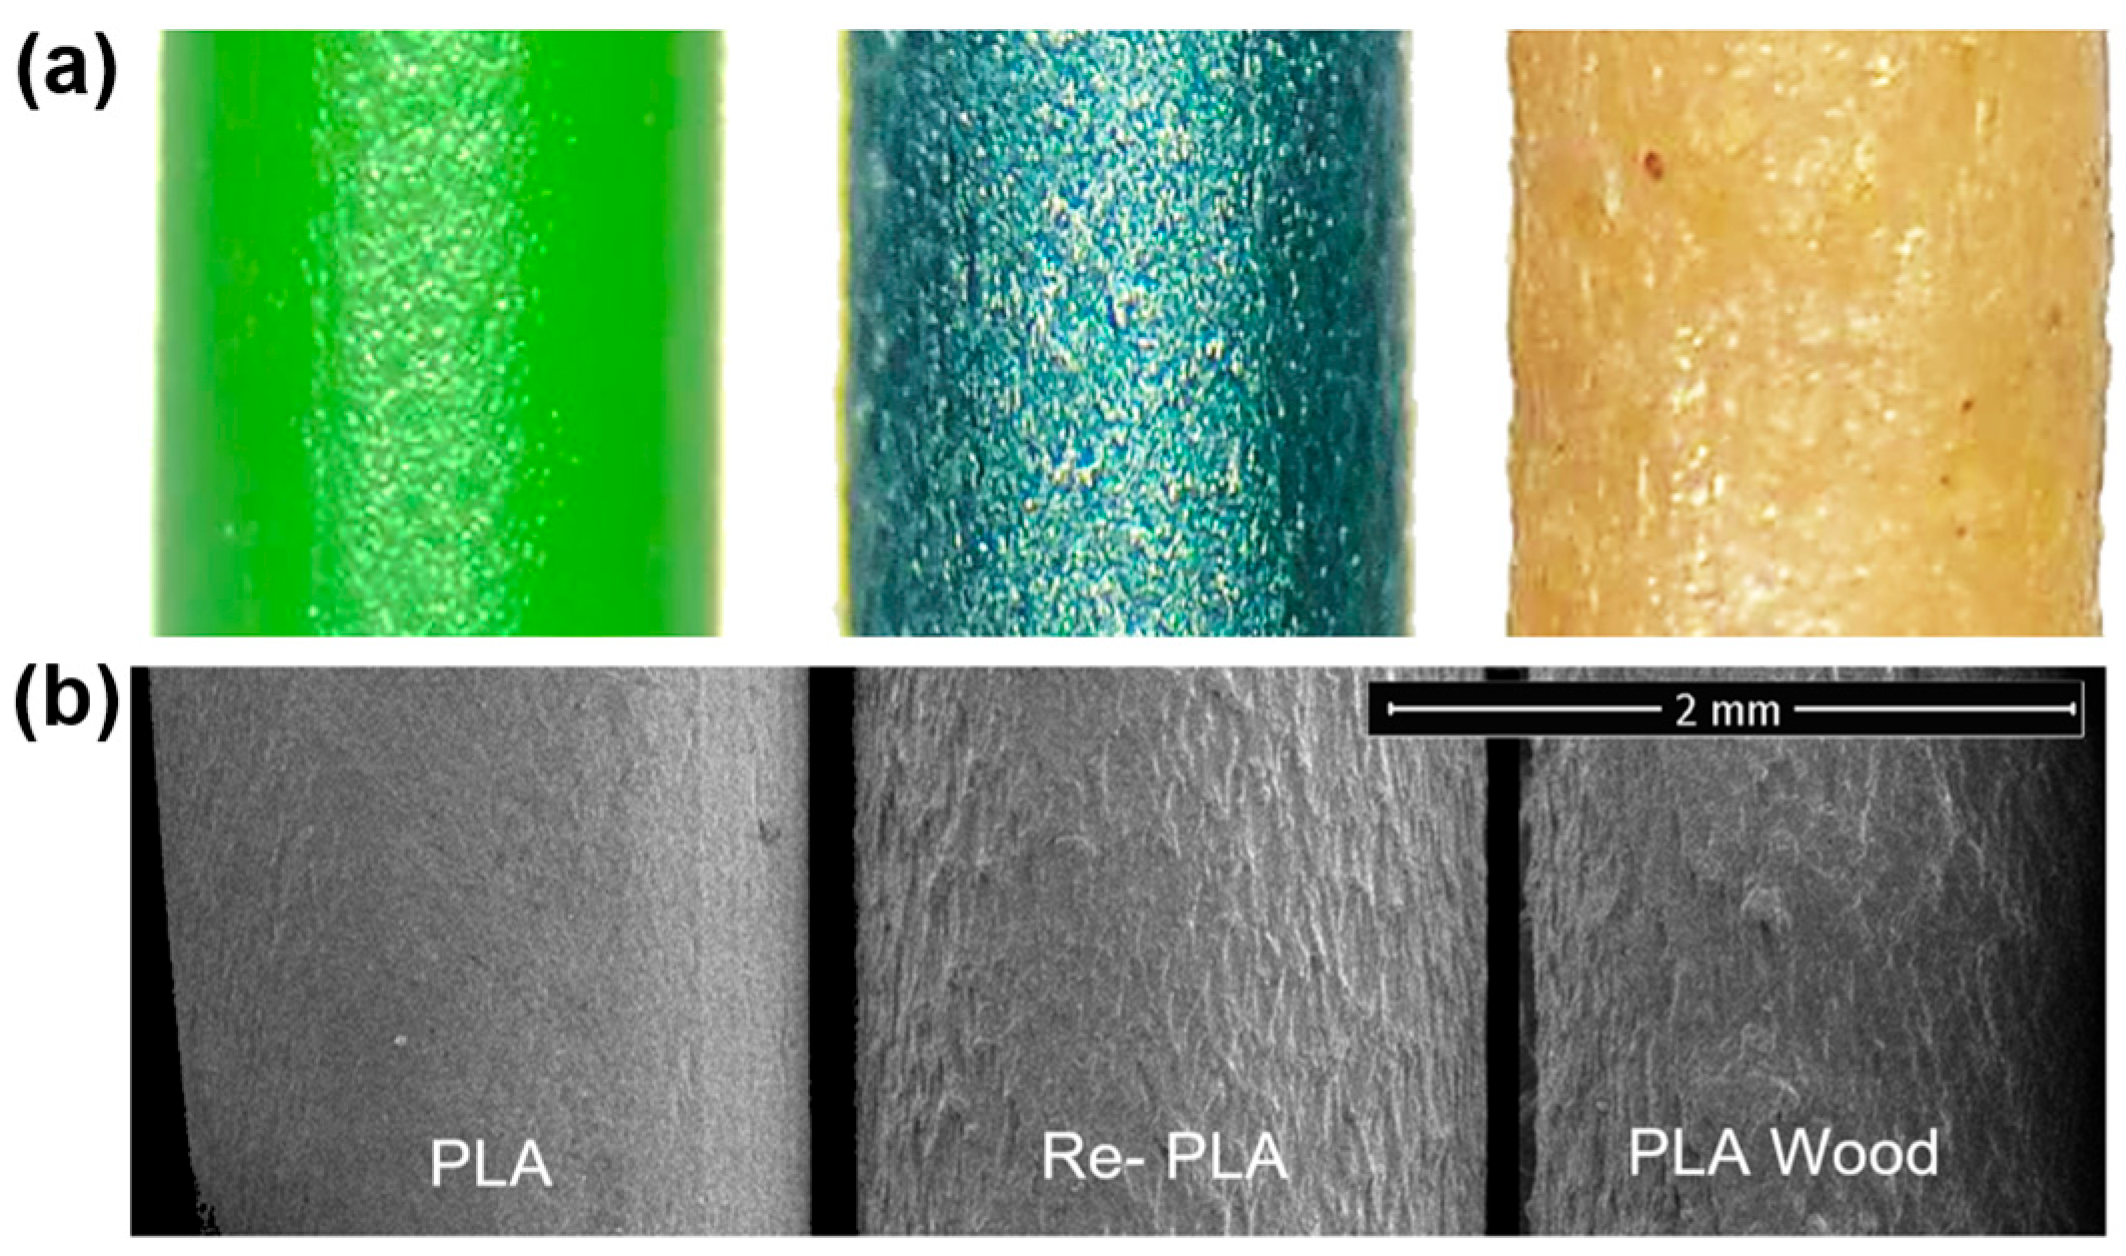
Scanning electron microscopy was employed to examine the microstructural characteristics of the raw filaments and the corresponding printed specimens. Microscopic images of the natural morphology of the raw filaments before printing, along with the SEM analysis image, are shown in Figure 8.
Figure 8.
(a) Optical microscopy and (b) SEM micrographs of the filaments.
Surface irregularities resulting from the recycling process in Re–PLA filaments were investigated. For Wood–PLA filament, the distribution of wood fibers embedded in the PLA matrix and surface morphology were monitored. Significant differences were found between the micrographs of pure PLA and wood-reinforced Wood–PLA filaments in terms of morphological structure, fracture behavior, and surface properties. While the fracture surfaces of pure PLA specimens generally exhibit a flat, smooth, and homogeneous structure, the filament surface becomes rough and coarse with the addition of wood fibers. In contrast to pure PLA, the filler materials dispersed within the matrix are clearly visible in the wood-reinforced polymers.
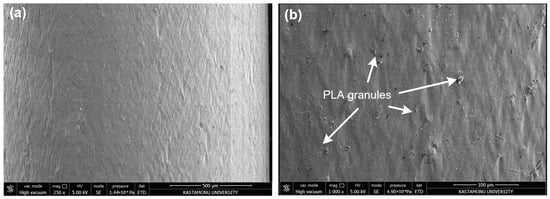
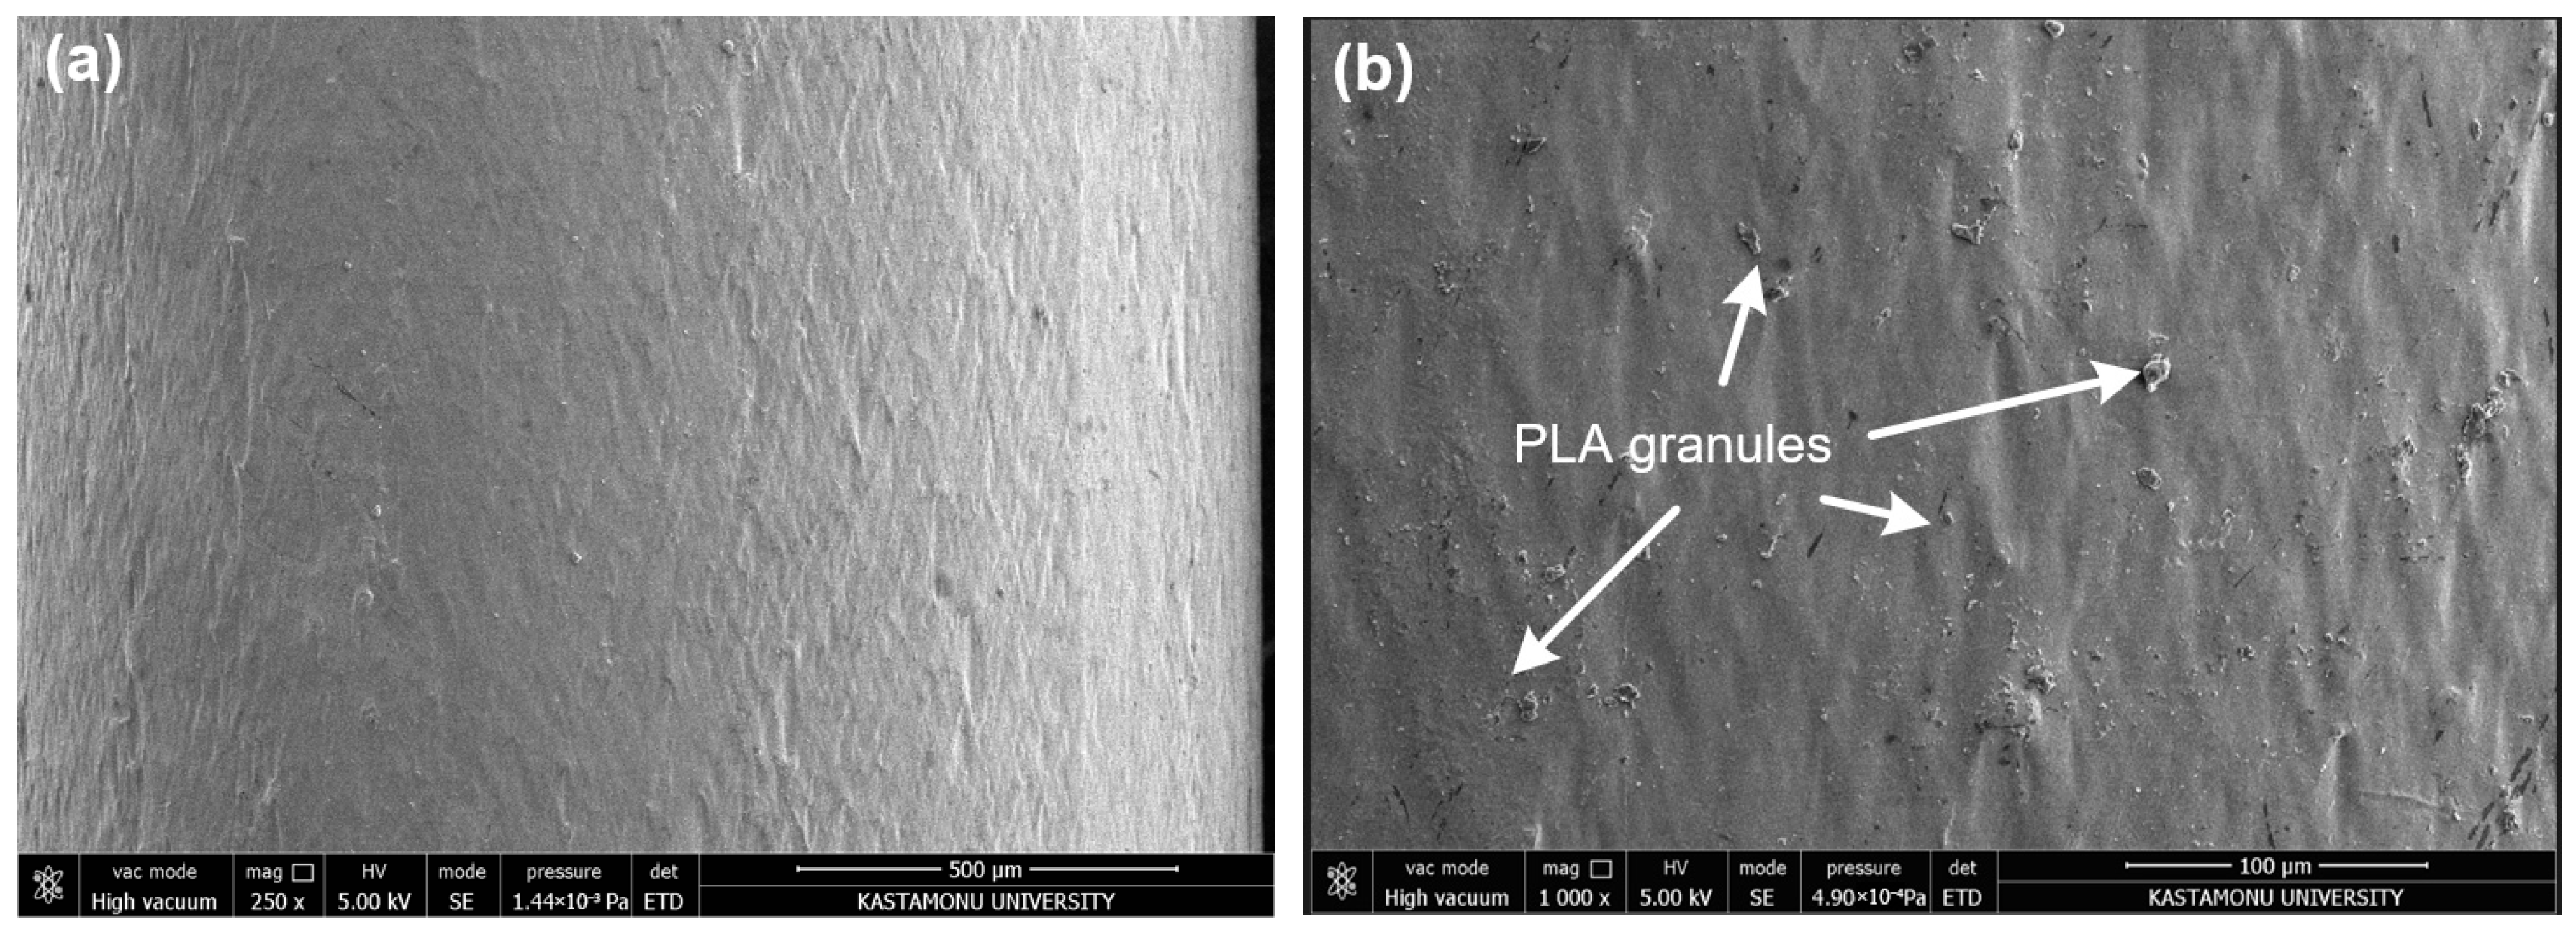
SEM micrographs of the PLA filament show slight, parallel flow-oriented traces resulting from the filament extrusion process (Figure 9a). The surfaces of pure PLA specimens generally exhibited a flat, smooth, and homogeneous structure. This smooth appearance indicates that the material exhibits brittle fracture behavior. Slight irregularities and dispersed microparticles were observed on the surface (Figure 9b). These irregularities are thought to originate from localized shrinkage during cooling, and the particles from PLA granules that have not fully melted. The continuous microstructure and the absence of pronounced voids or microcracks result from consistent melt flow and extrusion behavior. This behavior, as confirmed by TGA results, explains the good surface quality.
Figure 9.
SEM micrographs of pure PLA at (a) ×250 and (b) ×1000 magnifications.
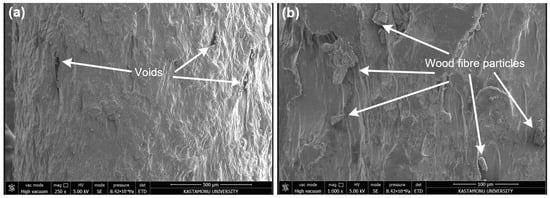
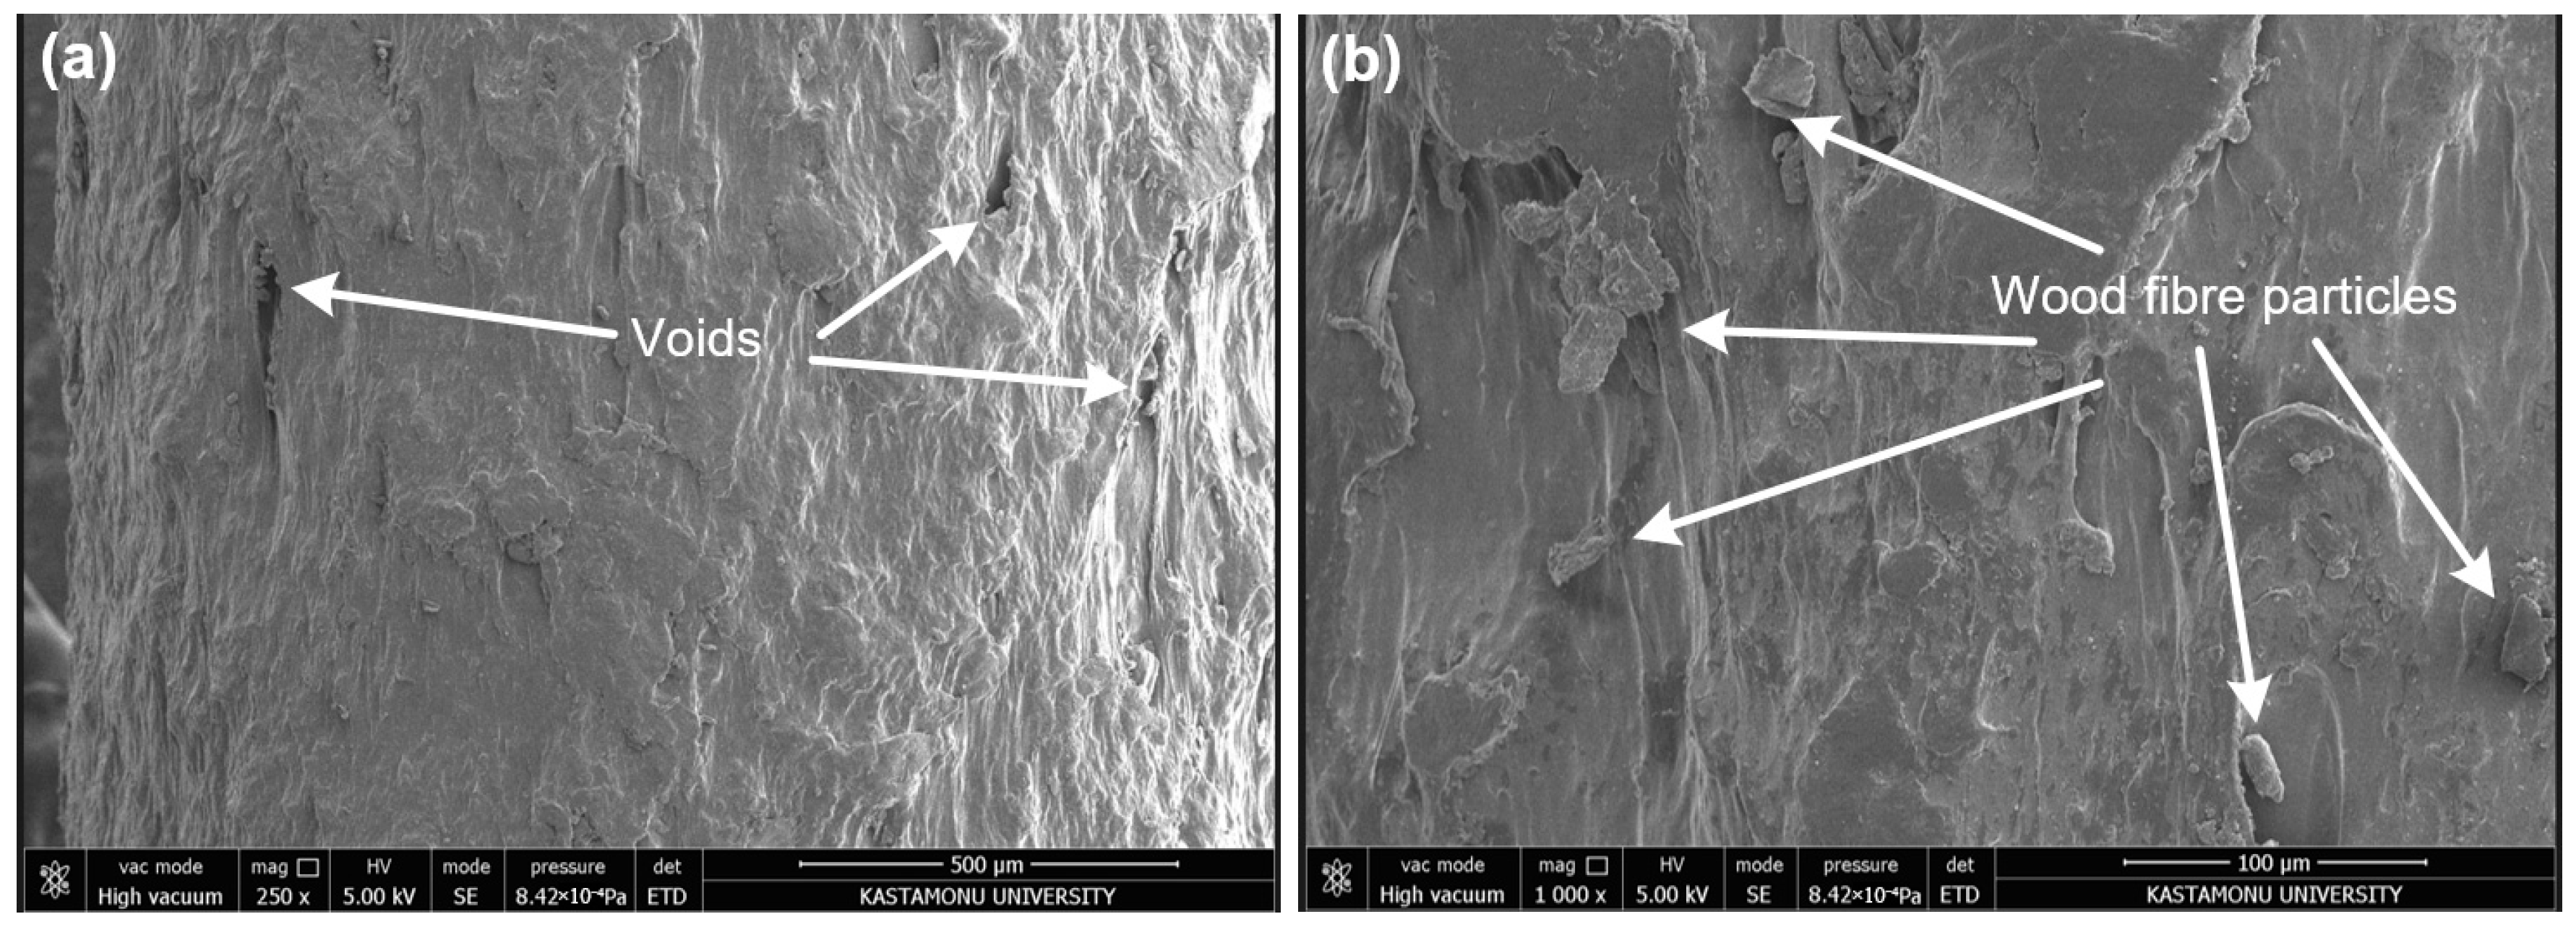
SEM micrograph of the Wood–PLA filament reveals a highly heterogeneous and discontinuous surface morphology resulting from the presence of lignocellulosic filler particles embedded in the PLA matrix (Figure 10a). Irregularly distributed wood fiber particles, clustered regions, and pronounced surface roughness are clearly visible, indicating a non-homogeneous filler distribution (Figure 10b). Localized voids, micro-voids, and fracture characteristics are observed at the interface between the wood particles and the PLA matrix. The hydrophilic nature of wood fibers allows them to absorb and retain moisture easily. Because the PLA matrix is hydrophobic, a chemical incompatibility occurs between the fiber and the matrix, weakening the interfacial bond [56]. Therefore, voids and micro-cracks may occur at the fiber–matrix interface. Such microstructural features are strongly correlated with the significantly higher Ra, Rz, and Rq values obtained for the Wood–PLA specimens. This highlights the dominant role of material composition in surface quality in FDM-printed parts.
Figure 10.
SEM micrographs of Wood–PLA at (a) ×250 and (b) ×1000 magnifications.
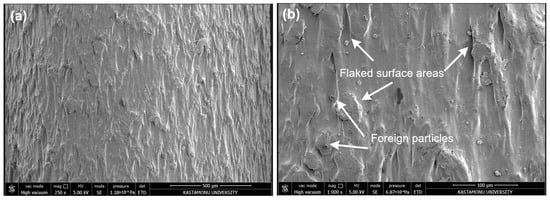
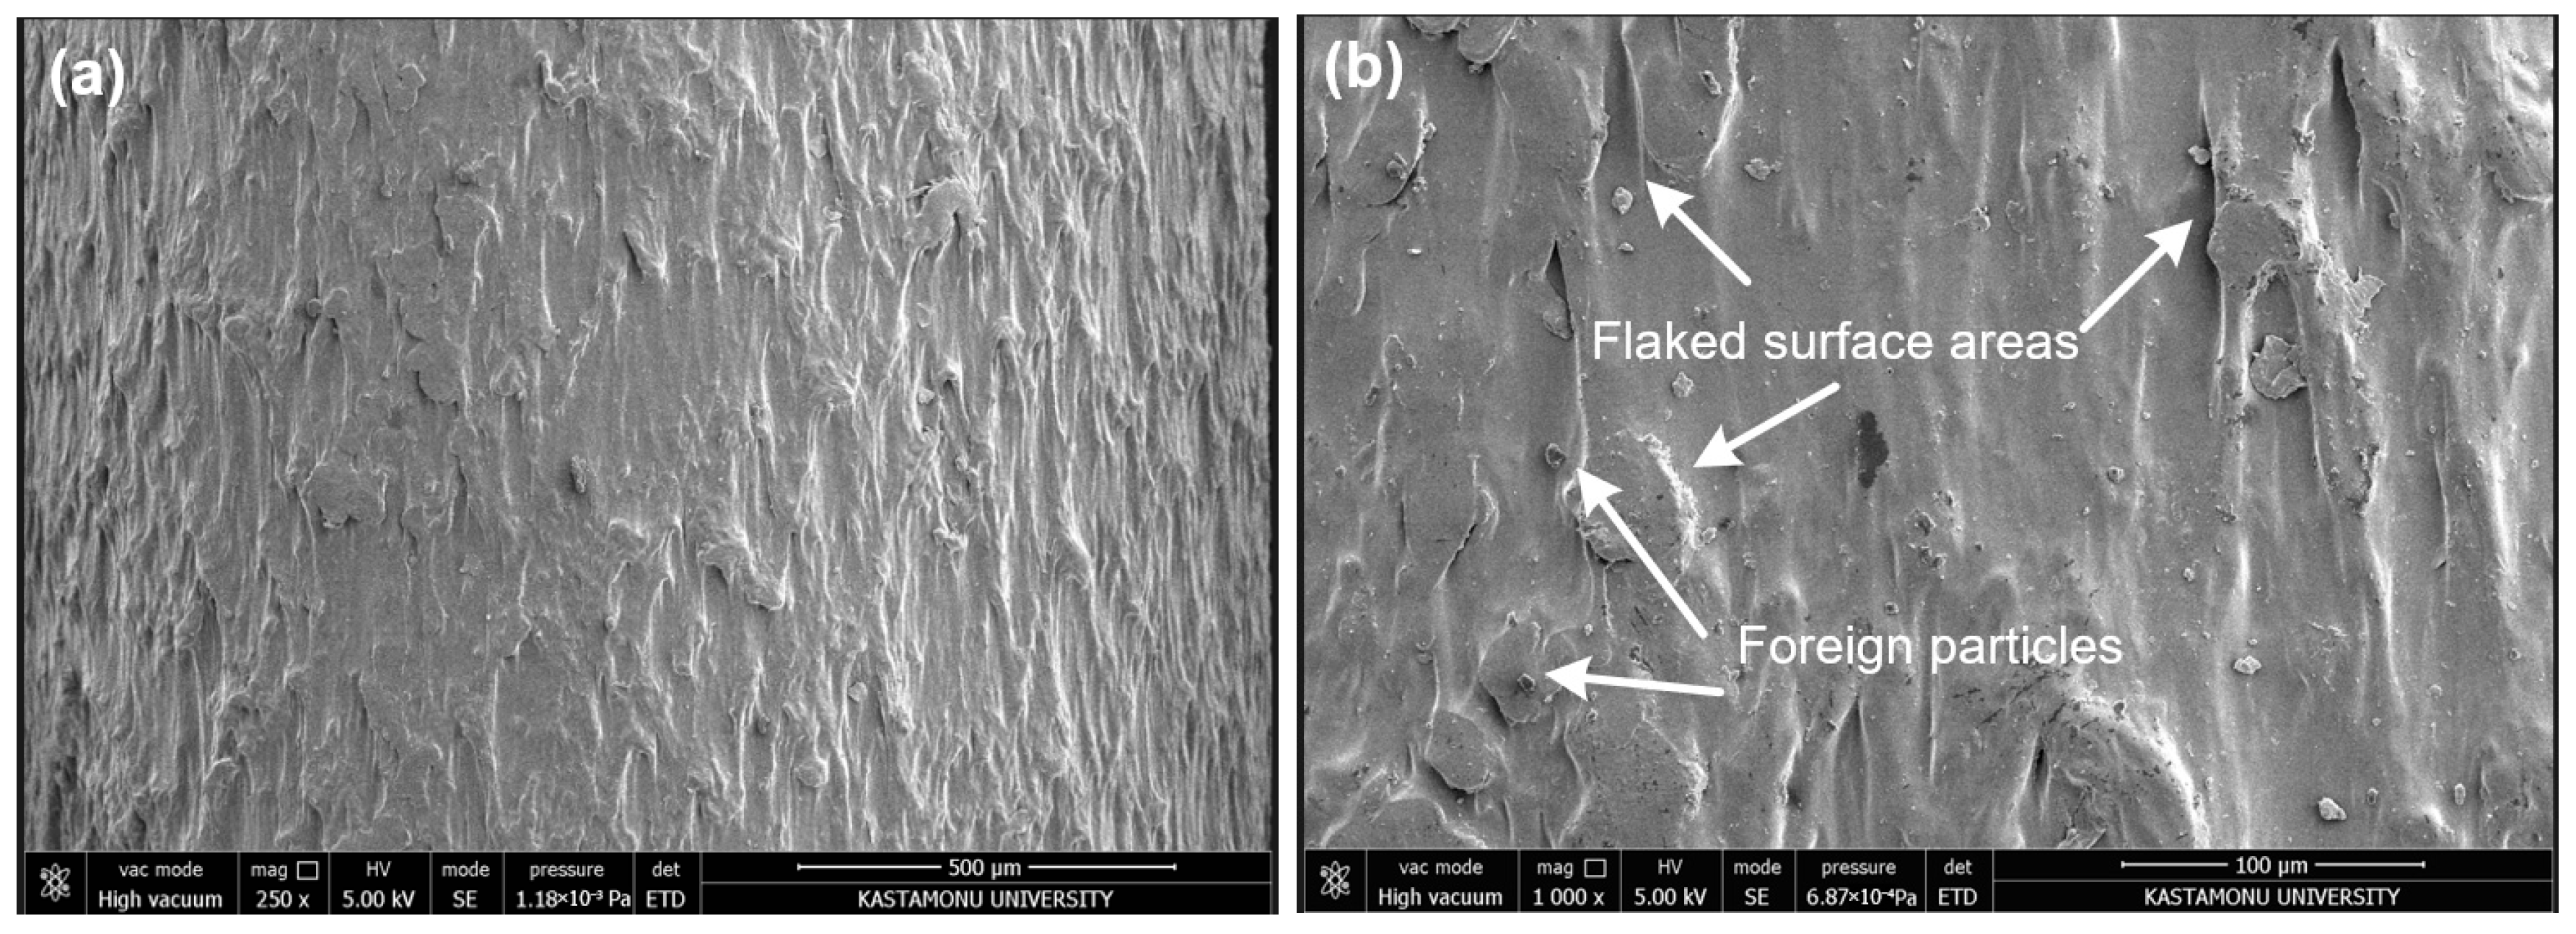
The SEM micrograph of the Re–PLA filament shows a significantly rougher, more heterogeneous surface morphology than that of pure PLA (Figure 11a). The presence of flake-like delaminated surface areas, irregular flow patterns, and micro-voids indicates changes in melting behavior resulting from degradation caused by repeated thermal processing (Figure 11b). These symptoms are thought to be related to polymer chain breakage and decreased melt strength. Decreased melt strength leads to more inconsistent melt flow and, therefore, increases surface roughness in FDM-printed parts [57]. The lower onset degradation temperature (Tonset) and earlier DTG peaks of Re–PLA are attributed to chain breaks occurring during recycling, which lead to these observed characteristics.
Figure 11.
SEM micrographs of Re–PLA at (a) ×250 and (b) ×1000 magnifications.
Although Re–PLA contains no fillers or reinforcing additives, SEM micrographs reveal a surface morphology as degraded and heterogeneous as that of Wood–PLA. This distinct surface degradation can be primarily explained by the cumulative effects of repeated thermal and mechanical reprocessing during recycling. Multiple melt-solidification cycles during the production process cause polymer chain breakage and reduce melt strength, leading to unstable flow behavior during filament extrusion and FDM deposition [58]. Additionally, residual moisture absorption and incomplete removal of contaminants during recycling create micro-voids, localized defects, and poor interface zones at the micro-scale [26]. These degradation-induced heterogeneities disrupt surface continuity, similar to particle-induced defects observed in Wood–PLA, despite the absence of solid particles.
Consequently, SEM observations have shown that molecular degradation caused by recycling alone is sufficient to create significant surface irregularities, highlighting that reprocessing history can be as influential as material composition in determining the microstructural quality of PLA-based filaments. Furthermore, SEM micrographs examined to confirm the statistical trends observed in Figure 6 indicate that Ra predominantly reflects large-scale surface undulations associated with raster-deposition tracks. In contrast, Rq and Rz exhibit greater sensitivity to localized microstructural irregularities arising from material heterogeneity. This microstructural distinction explains the reduced correlation strength observed in Re–PLA and Wood–PLA samples.
3.7. SEM Analysis of Specimens with Minimum and Maximum Ra Value
In this section, the surface morphologies of selected specimens with minimum and maximum Ra values were examined using SEM to support microstructural results from surface roughness analyses. SEM analysis allows direct observation of layer structure, raster traces, surface discontinuities, and potential micro-defects formed during the FDM process, thereby clarifying the relationship between quantitative surface roughness measurements and surface formation mechanisms. In this context, SEM micrographs were evaluated to reveal the effects of different filament types and printing conditions on surface topography and to visually verify the findings obtained from the Ra parameter. Based on the experimental test results, the specimens with the minimum and maximum Ra values are presented in Table 9.
Table 9.
Specimens with maximum and minimum Ra values.
Although recycled PLA filaments exhibit rougher filament surfaces due to material heterogeneity and thermal degradation, the lower melt viscosity of Re–PLA during the FDM process improved melt flow and interlayer flattening. This resulted in reduced macroscopic height deviations on the printed surface and lower Ra values despite the presence of micro-scale surface irregularities. Therefore, the discrepancy between the raw filament’s surface roughness and the manufactured part’s Ra values highlights Ra’s limitations in capturing microstructural heterogeneity and justifies the complementary use of Rq and Rz as surface roughness parameters.
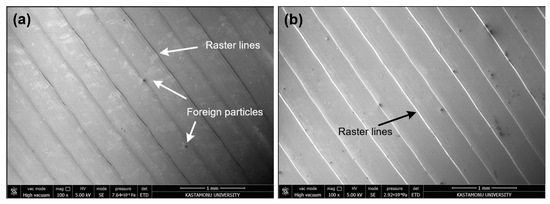
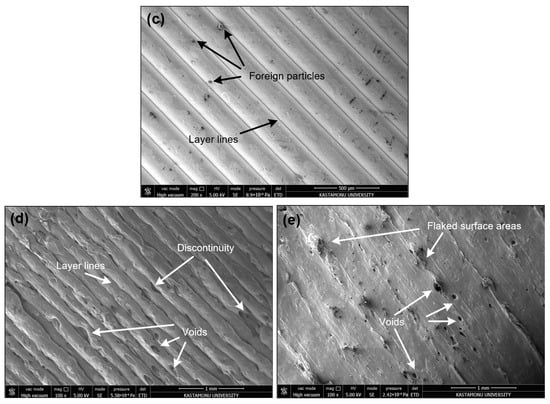
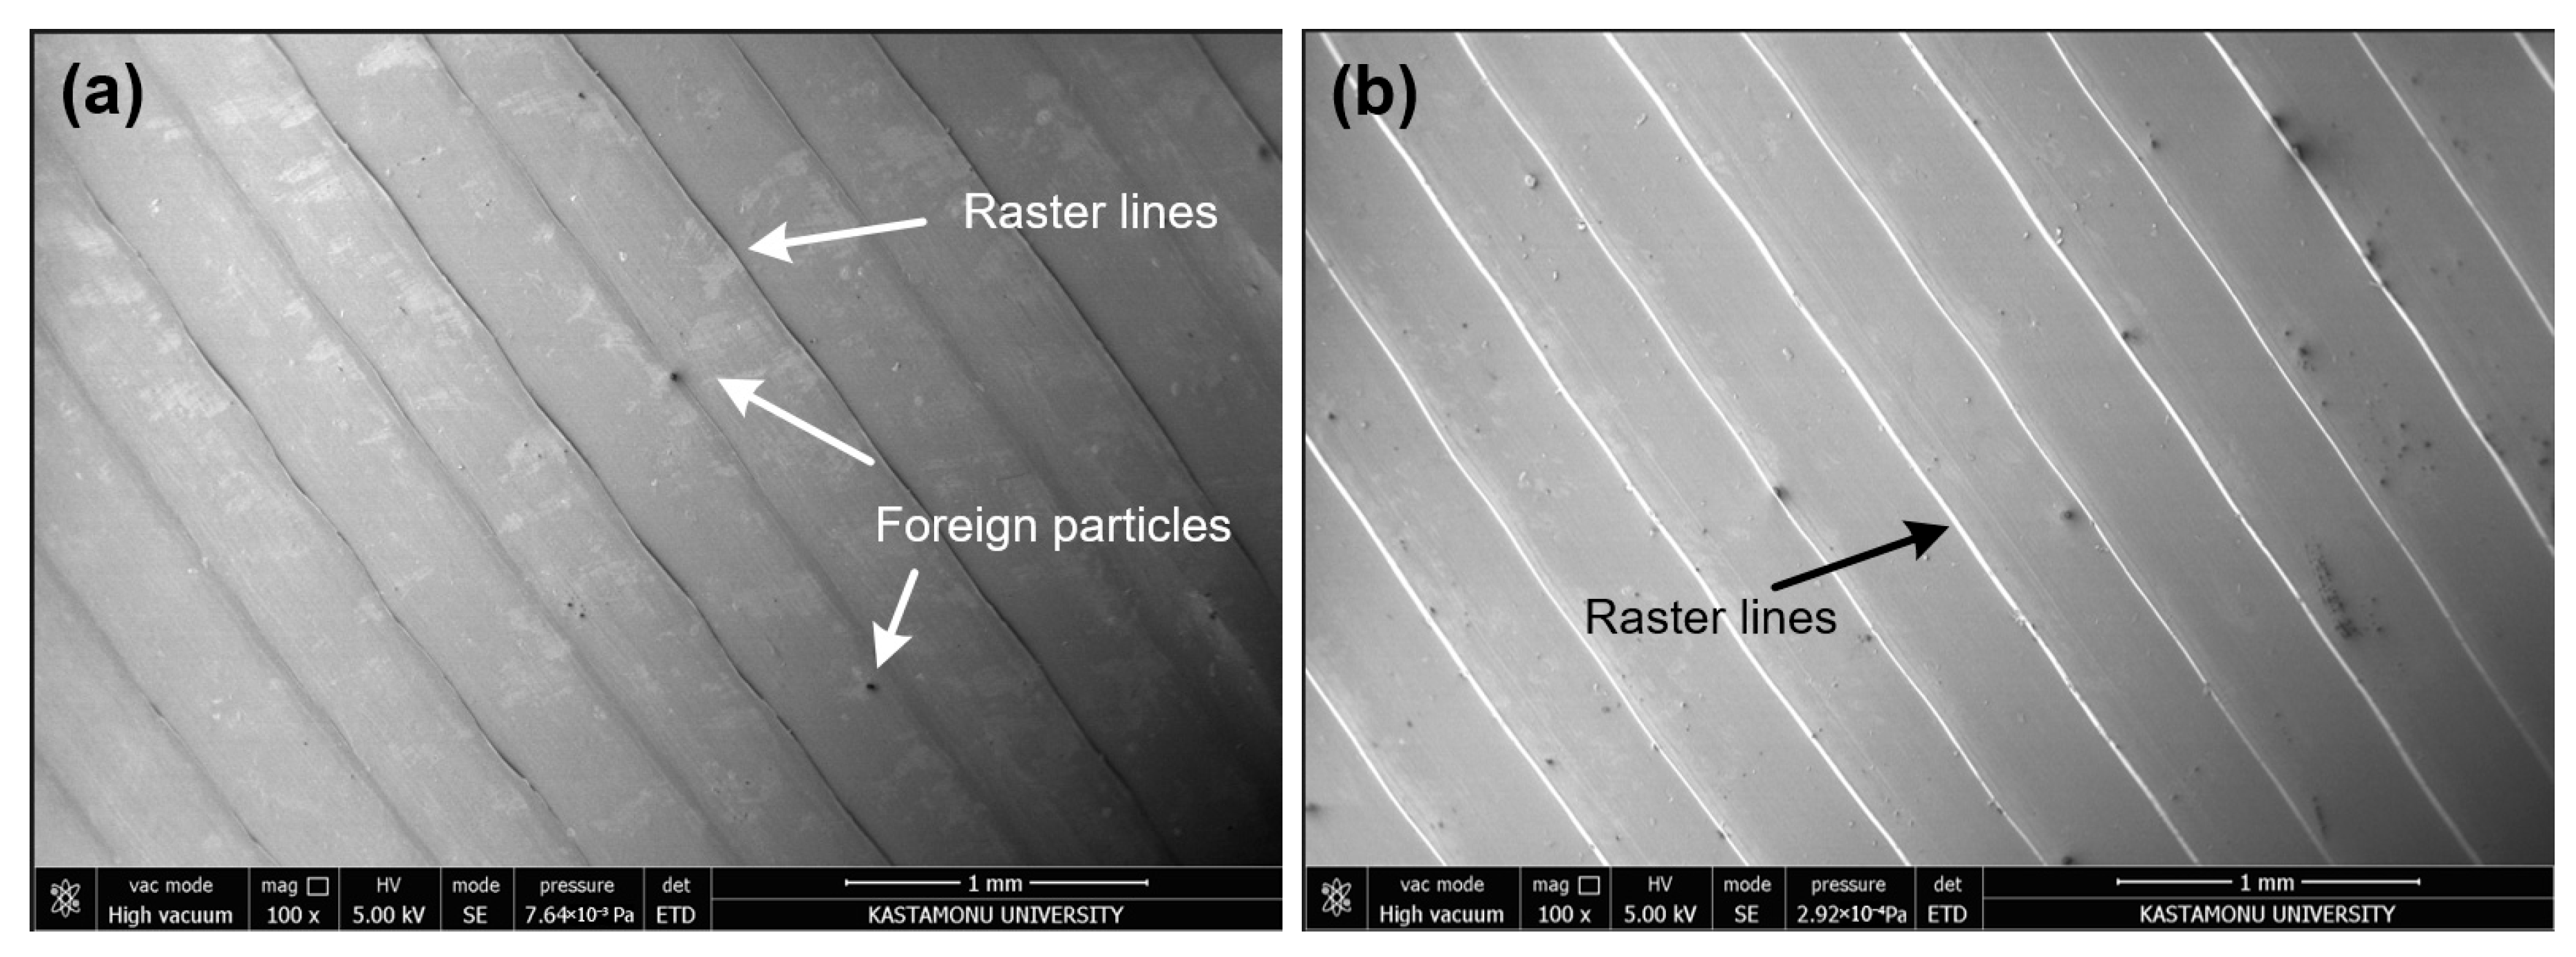
SEM observations of specimens with minimum and maximum Ra values reveal that surface roughness behavior is determined not only by the individual surface quality of the filament but also by melt flow characteristics and interlayer flattening, depending on the FDM process parameters. Despite micro-scale surface irregularities and local heterogeneities arising from recycled material phases, the specimens produced with Re–PLA and the lowest Ra values exhibited relatively uniform layer spreading and reduced macroscopic height deviations. Consequently, linear raster lines similar to those of the PLA specimens were observed in the specimens with the lowest surface roughness (Figure 12a,b). The similar behavior of Ra and Rq values across different printing conditions, and the high correlation between them, indicate that raster deposition tracks affect surface roughness. The lower melt viscosity of Re–PLA led to more uniform height profiles at the macro scale by providing better flow between adjacent raster lines and facilitating gap filling. In particular, linear layer traces were observed on the side surfaces of the Re–PLA specimens (Figure 12c). Although the surfaces of the specimens produced from both PLA and Re–PLA materials are smoother compared to the Wood–PLA specimens, foreign particles adhered to the surface are present.
Figure 12.
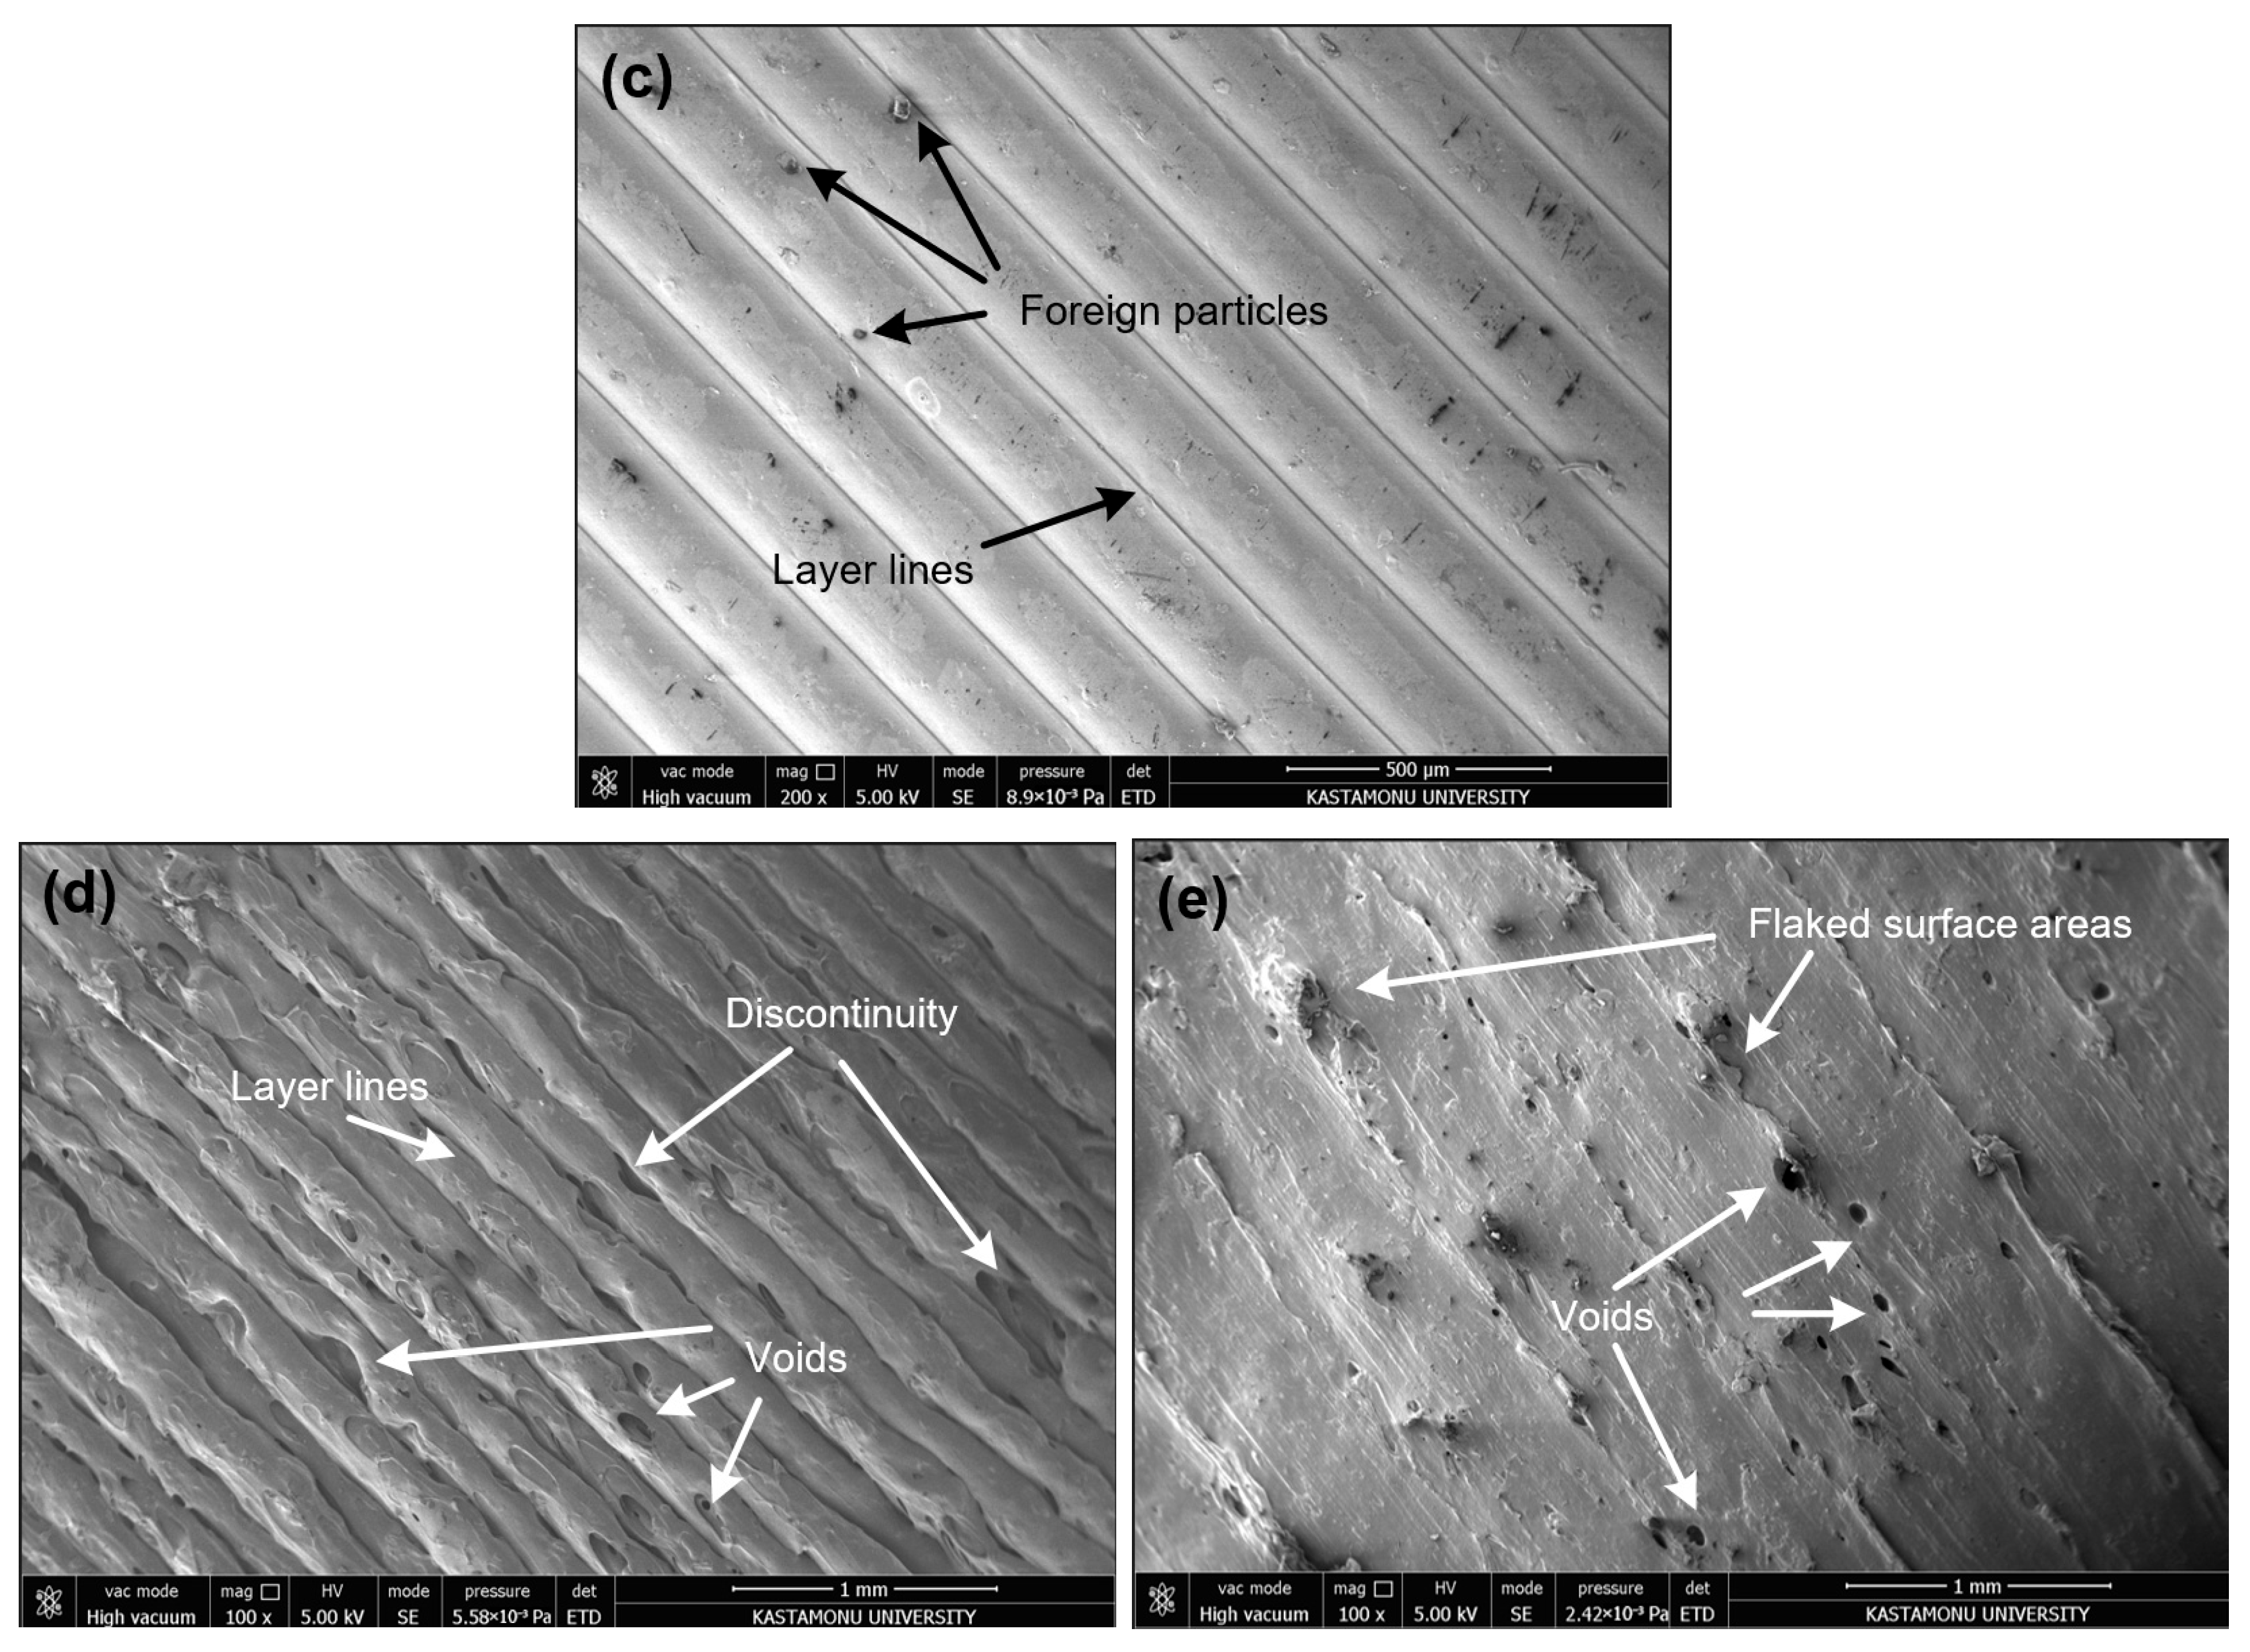
SEM micrographs of (a) L5, (b) L9, (c) L8, (d) L21 and (e) L22 specimens.
In contrast, the specimens produced with Wood–PLA, which exhibited the highest measured Ra values, show distinct surface protrusions, fiber-induced discontinuities, voids, and irregular layer boundaries in SEM micrographs. This condition caused increased height variations and sharper surface asperities, significantly elevating the Ra value. On the side surfaces, it led to discontinuities in the layer lines and the formation of micro-voids (Figure 12d). Wood particles, particularly when coated on the surface due to temperature, have disrupted the surface structure (Figure 12e). SEM findings confirm that Ra is primarily influenced by macro-scale surface topography, while microstructural irregularities are better represented by complementary roughness parameters such as Rq and Rz.
4. Conclusions
In this study, the surface roughness behavior of sustainable PLA-based filaments, pure PLA, recycled PLA (Re–PLA), and wood-filled PLA (Wood–PLA) under different FDM printing parameters was systematically investigated. The effects of nozzle diameter, printing speed, and printing temperature were evaluated using a full factorial experimental design, with arithmetic mean surface roughness (Ra) as the primary optimization criterion. The inclusion of secondary surface roughness parameters, Rq and Rz, in the analysis confirmed the statistical consistency of the Ra-based optimization results. It allowed for a more holistic characterization of the surface topography. ANOVA results clearly revealed that filament material is the most dominant factor on Ra. This finding indicates that differences in filament composition and microstructural homogeneity directly affect the mechanisms of surface formation in the FDM process.
- ANOVA results confirmed that surface roughness is significantly affected by material type and printing parameters depending on the measurement direction, with statistically significant effects identified at the 95% confidence level (p < 0.05).
- For the top surface measured in the 0° direction, filament material was the most influential factor, contributing 29.47% to the total variance, followed by printing temperature (18.72%) and printing speed (18.33%).
- For the top surface measured at 45°, the contribution of filament types increased substantially to 86.71%, while the other parameters decreased markedly, indicating strong material-driven surface behavior in this orientation.
- Side surface measurements showed that filament material remained dominant, explaining 66.48% of the total surface roughness variation, whereas the remaining parameters contributed comparatively little.
- The correlation analysis revealed material-dependent sensitivities in the parameters. For PLA, printing speed showed a strong positive correlation with Ra (r = 0.71); for Re–PLA, nozzle diameter exhibited a moderate negative correlation with Ra (r = –0.60); and for Wood–PLA, printing temperature demonstrated a relatively strong positive correlation with Ra (r = 0.65).
- TGA analyses revealed that Re–PLA and Wood–PLA filaments exhibit varying thermal degradation behaviors depending on the filament composition, which directly influences print quality and optimum processing temperature ranges.
- SEM analyses provided microstructural support for the surface roughness measurements by clearly revealing the differences in layer deposition, interlayer fusion, void formation, and filler-induced surface irregularities under minimum and maximum Ra conditions.
These results demonstrate that sustainability-focused filaments are critical not only for environmental considerations but also for process–surface quality interactions. The findings reveal that sustainable filaments require more specific printing parameters compared to pure PLA, and this requirement is directly related to surface formation mechanisms. Sustainable PLA-based filaments are often associated with limitations in surface quality stemming from additives or manufacturing processes, which can limit their industrial use. Current findings suggest that such surface irregularities can be mitigated through appropriate parameter selection and optimization. This study provides a practical guide to improving surface performance by accounting for material-type-dependent surface sensitivities and optimizing processing conditions. Furthermore, the applied experimental and statistical approach enables the identification of the most effective printing parameters affecting the surface quality of sustainable FDM filaments. This can facilitate the increased use of sustainable filaments in sectors where surface quality is a critical requirement, such as consumer products, functional components, and engineering applications.
Funding
This research received no external funding.
Institutional Review Board Statement
Not applicable.
Informed Consent Statement
Not applicable.
Data Availability Statement
The original contributions presented in this study are included in the article. Further inquiries can be directed to the corresponding author.
Conflicts of Interest
The author declares no conflict of interest.
References
- Baumers, M.; Beltrametti, L.; Gasparre, A.; Hague, R. Informing Additive Manufacturing Technology Adoption: Total Cost and the Impact of Capacity Utilisation. Int. J. Prod. Res. 2017, 55, 6957–6970. [Google Scholar] [CrossRef] [Scilit]
- Dey, A.; Yodo, N. A Systematic Survey of FDM Process Parameter Optimization and Their Influence on Part Characteristics. J. Manuf. Mater. Process. 2019, 3, 64. [Google Scholar] [CrossRef] [Scilit]
- Bharat, N.; Kumar, V.; Veeman, D.; Vellaisamy, M. Enhancing Mechanical Properties of 3D-Printed PLA/Wood Composites: A Metaheuristic and Statistical Perspective. Eur. J. Wood Wood Prod. 2025, 83, 99. [Google Scholar] [CrossRef] [Scilit]
- Hamidi, M.N.; Abdullah, J.; Mahmud, A.S.; Hassan, M.H.; Zainoddin, A.Y. Influence of Thermoplastic Polyurethane (TPU) and Printing Parameters on the Thermal and Mechanical Performance of Polylactic Acid (PLA)/Thermoplastic Polyurethane (TPU) Polymer. Polym. Test. 2025, 143, 108697. [Google Scholar] [CrossRef] [Scilit]
- Zurnacı, E.; Alıcıoğlu, F.C. Mechanical Strength of PLA Parts Manufactured by FDM Using RSM and Fuzzy Logic. Mater. Test. 2026, 68, 50–66. [Google Scholar] [CrossRef] [Scilit]
- Zurnacı, E.; Özdemir, H.K. Investigation of the Compressive Strength, Energy Absorption Properties and Deformation Modes of the Reinforced Core Cell Produced by the FDM Method. Gazi J. Eng. Sci. 2023, 9, 1–11. [Google Scholar] [CrossRef] [Scilit]
- Zurnacı, E. Parametric Optimization of Fracture Resistance of Multilayer 3D Printed Parts. In Proceedings of the International Conference on Advances and Innovations in Engineering, Elazığ, Turkey, 21–23 September 2023; pp. 60–61. [Google Scholar]
- Naser, A.Z.; Deiab, I.; Darras, B.M. Poly(Lactic Acid) (PLA) and Polyhydroxyalkanoates (PHAs), Green Alternatives to Petroleum-Based Plastics: A Review. RSC Adv. 2021, 11, 17151–17196. [Google Scholar] [CrossRef] [Scilit]
- Karamanlioglu, M.; Preziosi, R.; Robson, G.D. Abiotic and Biotic Environmental Degradation of the Bioplastic Polymer Poly(Lactic Acid): A Review. Polym. Degrad. Stab. 2017, 137, 122–130. [Google Scholar] [CrossRef] [Scilit]
- Shekhar, N.; Mondal, A. Synthesis, Properties, Environmental Degradation, Processing, and Applications of Polylactic Acid (PLA): An Overview. Polym. Bull. 2024, 81, 11421–11457. [Google Scholar] [CrossRef] [Scilit]
- Frunzaverde, D.; Cojocaru, V.; Ciubotariu, C.-R.; Miclosina, C.-O.; Ardeljan, D.D.; Ignat, E.F.; Marginean, G. The Influence of the Printing Temperature and the Filament Color on the Dimensional Accuracy, Tensile Strength, and Friction Performance of FFF-Printed PLA Specimens. Polymers 2022, 14, 1978. [Google Scholar] [CrossRef] [Scilit]
- Cicala, G.; Giordano, D.; Tosto, C.; Filippone, G.; Recca, A.; Blanco, I. Polylactide (PLA) Filaments a Biobased Solution for Additive Manufacturing: Correlating Rheology and Thermomechanical Properties with Printing Quality. Materials 2018, 11, 1191. [Google Scholar] [CrossRef] [Scilit]
- Valerga, A.P.; Batista, M.; Salguero, J.; Girot, F. Influence of PLA Filament Conditions on Characteristics of FDM Parts. Materials 2018, 11, 1322. [Google Scholar] [CrossRef] [Scilit]
- Liu, L.; Lin, M.; Xu, Z.; Lin, M. Polylactic Acid-Based Wood-Plastic 3D Printing Composite and Its Properties. BioResources 2019, 14, 8484–8498. [Google Scholar] [CrossRef] [Scilit]
- Zeid, M.A.; Awad, M.; Elsabbagh, A. 3D Printing of Natural Fiber-Reinforced Composites. In Encyclopedia of Green Materials; Springer Nature: Singapore, 2025; pp. 13–23. [Google Scholar]
- Saheb, D.N.; Jog, J.P. Natural Fiber Polymer Composites: A Review. Adv. Polym. Technol. 1999, 18, 351–363. [Google Scholar] [CrossRef]
- Shah, B.L.; Selke, S.E.; Walters, M.B.; Heiden, P.A. Effects of Wood Flour and Chitosan on Mechanical, Chemical, and Thermal Properties of Polylactide. Polym. Compos. 2008, 29, 655–663. [Google Scholar] [CrossRef] [Scilit]
- Elfaleh, I.; Abbassi, F.; Habibi, M.; Ahmad, F.; Guedri, M.; Nasri, M.; Garnier, C. A Comprehensive Review of Natural Fibers and Their Composites: An Eco-Friendly Alternative to Conventional Materials. Results Eng. 2023, 19, 101271. [Google Scholar] [CrossRef] [Scilit]
- Kazayawoko, M.; Balatinecz, J.J.; Matuana, L.M. Surface Modification and Adhesion Mechanisms in Woodfiber-Polypropylene Composites. J. Mater. Sci. 1999, 34, 6189–6199. [Google Scholar] [CrossRef] [Scilit]
- Petinakis, E.; Yu, L.; Edward, G.; Dean, K.; Liu, H.; Scully, A.D. Effect of Matrix–Particle Interfacial Adhesion on the Mechanical Properties of Poly(Lactic Acid)/Wood-Flour Micro-Composites. J. Polym. Environ. 2009, 17, 83–94. [Google Scholar] [CrossRef] [Scilit]
- Krapež Tomec, D.; Schwarzkopf, M.; Repič, R.; Žigon, J.; Gospodarič, B.; Kariž, M. Effect of Thermal Modification of Wood Particles for Wood–PLA Composites on Properties of Filaments, 3D-Printed Parts and Injection Moulded Parts. Eur. J. Wood Wood Prod. 2024, 82, 403–416. [Google Scholar] [CrossRef] [Scilit]
- Csizmadia, R.; Faludi, G.; Renner, K.; Móczó, J.; Pukánszky, B. PLA/Wood Biocomposites: Improving Composite Strength by Chemical Treatment of the Fibers. Compos. Part A Appl. Sci. Manuf. 2013, 53, 46–53. [Google Scholar] [CrossRef] [Scilit]
- Parandoush, P.; Lin, D. A Review on Additive Manufacturing of Polymer-Fiber Composites. Compos. Struct. 2017, 182, 36–53. [Google Scholar] [CrossRef] [Scilit]
- Krajangsawasdi, N.; Blok, L.G.; Hamerton, I.; Longana, M.L.; Woods, B.K.S.; Ivanov, D.S. Fused Deposition Modelling of Fibre Reinforced Polymer Composites: A Parametric Review. J. Compos. Sci. 2021, 5, 29. [Google Scholar] [CrossRef] [Scilit]
- Kreiger, M.A.; Mulder, M.L.; Glover, A.G.; Pearce, J.M. Life Cycle Analysis of Distributed Recycling of Post-Consumer High Density Polyethylene for 3-D Printing Filament. J. Clean. Prod. 2014, 70, 90–96. [Google Scholar] [CrossRef] [Scilit]
- Karayer, Y.; Altınsoy, Ş.; Koç, G.; Can, D.; Toğar, Y.E. Effects of Steam Sterilization and Recycling on the Mechanical and Surface Properties of 3D-Printed Biodegradable PLA and Re–PLA Materials. Polymers 2025, 17, 2590. [Google Scholar] [CrossRef] [Scilit]
- Ceretti, D.V.A.; Edeleva, M.; Cardon, L.; D’hooge, D.R. Molecular Pathways for Polymer Degradation during Conventional Processing, Additive Manufacturing, and Mechanical Recycling. Molecules 2023, 28, 2344. [Google Scholar] [CrossRef] [Scilit]
- Turner, B.N.; Strong, R.; Gold, S.A. A Review of Melt Extrusion Additive Manufacturing Processes: I. Process Design and Modeling. Rapid Prototyp. J. 2014, 20, 192–204. [Google Scholar] [CrossRef] [Scilit]
- Peng, T.; Yan, F. Dual-Objective Analysis for Desktop FDM Printers: Energy Consumption and Surface Roughness. Procedia CIRP 2018, 69, 106–111. [Google Scholar] [CrossRef] [Scilit]
- Burke, C.; Dalal, A.; Abukhalaf, A.; Noorani, R. Effects of Process Parameter Variation on the Surface Roughness of Polylactic Acid (PLA) Materials Using Design of Experiments (DOE). IOP Conf. Ser. Mater. Sci. Eng. 2020, 897, 012003. [Google Scholar] [CrossRef] [Scilit]
- Fountas, N.A.; Kitsakis, K.; Aslani, K.-E.; Kechagias, J.D.; Vaxevanidis, N.M. An Experimental Investigation of Surface Roughness in 3D-Printed PLA Items Using Design of Experiments. Proc. Inst. Mech. Eng. Part J J. Eng. Tribol. 2022, 236, 1979–1984. [Google Scholar] [CrossRef] [Scilit]
- Altan, M.; Eryildiz, M.; Gumus, B.; Kahraman, Y. Effects of Process Parameters on the Quality of PLA Products Fabricated by Fused Deposition Modeling (FDM): Surface Roughness and Tensile Strength. Mater. Test. 2018, 60, 471–477. [Google Scholar] [CrossRef] [Scilit]
- Missimer, M.; Robèrt, K.H.; Broman, G. A Strategic Approach to Social Sustainability—Part 2: A Principle-Based Definition. J. Clean. Prod. 2017, 140, 42–52. [Google Scholar] [CrossRef] [Scilit]
- Chaidas, D.; Kitsakis, K.; Kechagias, J.; Maropoulos, S. The Impact of Temperature Changing on Surface Roughness of FFF Process. IOP Conf. Ser. Mater. Sci. Eng. 2016, 161, 012033. [Google Scholar] [CrossRef] [Scilit]
- Nas, E. Experimental and Statistical Investigation of Electro-Erosion Machining Performance of Cryogenic Treated Hardened AISI H13 Hot Work Tool Steel. Tribol. Int. 2024, 193, 109453. [Google Scholar] [CrossRef] [Scilit]
- Bakhtiari, H.; Nikzad, M.; Tolouei-Rad, M. Influence of Three-Dimensional Printing Parameters on Compressive Properties and Surface Smoothness of Polylactic Acid Specimens. Polymers 2023, 15, 3827. [Google Scholar] [CrossRef] [Scilit] [PubMed]
- Ayrilmis, N. Effect of Layer Thickness on Surface Properties of 3D Printed Materials Produced from Wood Flour/PLA Filament. Polym. Test. 2018, 71, 163–166. [Google Scholar] [CrossRef] [Scilit]
- Altınsoy, Ş.; Demirel, M.; Beköz Üllen, N. Effect of the Build Orientations on Mechanical, Superficial and Bioactivity Properties of Additively Manufactured PLA and Recycled PLA Filaments. J. Polym. Res. 2025, 32, 394. [Google Scholar] [CrossRef] [Scilit]
- Letcher, T.; Waytashek, M. Material Property Testing of 3D-Printed Specimen in PLA on an Entry-Level 3D Printer. In Proceedings of the ASME 2014 International Mechanical Engineering Congress and Exposition, Volume 2A: Advanced Manufacturing, Montreal, QC, Canada, 14–20 November 2014. [Google Scholar]
- Buj-Corral, I.; Sánchez-Casas, X.; Luis-Pérez, C.J. Analysis of AM Parameters on Surface Roughness Obtained in PLA Parts Printed with FFF Technology. Polymers 2021, 13, 2384. [Google Scholar] [CrossRef] [Scilit]
- Kočiško, M.; Štafura, L.; Goryl, K.; Mitaľová, Z. Evaluation of the Effect of Post-Processing Methods on the Surface Parameters of Parts Produced by FFF/FDM Technology. Materials 2025, 18, 4672. [Google Scholar] [CrossRef] [Scilit]
- Cojocaru, V.; Frunzaverde, D.; Miclosina, C.-O.; Marginean, G. The Influence of the Process Parameters on the Mechanical Properties of PLA Specimens Produced by Fused Filament Fabrication—A Review. Polymers 2022, 14, 886. [Google Scholar] [CrossRef] [Scilit]
- Beltrán, F.R.; Lorenzo, V.; Acosta, J.; de la Orden, M.U.; Martínez Urreaga, J. Effect of Simulated Mechanical Recycling Processes on the Structure and Properties of Poly(Lactic Acid). J. Environ. Manag. 2018, 216, 25–31. [Google Scholar] [CrossRef] [Scilit] [PubMed]
- Finnerty, J.; Rowe, S.; Howard, T.; Connolly, S.; Doran, C.; Devine, D.M.; Gately, N.M.; Chyzna, V.; Portela, A.; Bezerra, G.S.N.; et al. Effect of Mechanical Recycling on the Mechanical Properties of PLA-Based Natural Fiber-Reinforced Composites. J. Compos. Sci. 2023, 7, 141. [Google Scholar] [CrossRef] [Scilit]
- Kechagias, J.D.; Zaoutsos, S.P. An Assessment of PLA/Wood with PLA Core Sandwich Multilayer Component Tensile Strength under Different 3D Printing Conditions. J. Manuf. Process. 2024, 131, 1240–1249. [Google Scholar] [CrossRef] [Scilit]
- Montgomery, D.C. Design and Analysis of Experiments; John Wiley & Sons, Inc.: Hoboken, NJ, USA, 2021; ISBN 1119816955. [Google Scholar]
- ISO 21920-2:2021; Geometrical Product Specifications (GPS)—Surface Texture: Profile—Part 2: Terms, Definitions and Surface Texture Parameters. International Organization for Standardization: Geneva, Switzerland, 2021.
- Stemp, W.J.; Childs, B.E.; Vionnet, S.; Brown, C.A. The Quantification of Microwear on Chipped Stone Tools: Assessing the Effectiveness of Root Mean Square Roughness (Rq). Lithic Technol. 2008, 33, 173–189. [Google Scholar] [CrossRef] [Scilit]
- Gadelmawla, E.S.; Koura, M.M.; Maksoud, T.M.A.; Elewa, I.M.; Soliman, H.H. Roughness Parameters. J. Mater. Process. Technol. 2002, 123, 133–145. [Google Scholar] [CrossRef] [Scilit]
- Nas, E.; Uzuner, S. Optimization of Laser Cutting Parameters for Enhanced Surface Quality and Reduced Kerf Width in AISI 304 Stainless Steel. Gazi J. Eng. Sci. 2024, 9, 654–662. [Google Scholar] [CrossRef] [Scilit]
- Uğur, A.; Nas, E.; Gökkaya, H. Investıgation of Electroerosion Machining Performance of Metal Matrix Composite Materials Produced Using Stir and Indirect Squeeze Method. Surf. Rev. Lett. 2024, 31, 2450051. [Google Scholar] [CrossRef] [Scilit]
- Box, G. Signal-to-Noise Ratios, Performance Criteria, and Transformations. Technometrics 1988, 30, 1–17. [Google Scholar] [CrossRef]
- Mathew, A.; Kishore, S.R.; Tomy, A.T.; Sugavaneswaran, M.; Scholz, S.G.; Elkaseer, A.; Wilson, V.H.; John Rajan, A. Vapour Polishing of Fused Deposition Modelling (FDM) Parts: A Critical Review of Different Techniques, and Subsequent Surface Finish and Mechanical Properties of the Post-Processed 3D-Printed Parts. Prog. Addit. Manuf. 2023, 8, 1161–1178. [Google Scholar] [CrossRef] [Scilit]
- Sarıkaya, M.; Güllü, A. Taguchi Design and Response Surface Methodology Based Analysis of Machining Parameters in CNC Turning under MQL. J. Clean. Prod. 2014, 65, 604–616. [Google Scholar] [CrossRef] [Scilit]
- Alsoufi, M.S.; Elsayed, A.E. Surface Roughness Quality and Dimensional Accuracy—A Comprehensive Analysis of 100% Infill Printed Parts Fabricated by a Personal/Desktop Cost-Effective FDM 3D Printer. Mater. Sci. Appl. 2018, 9, 11–40. [Google Scholar] [CrossRef]
- Olonisakin, K.; Fan, M.; Zhang, X.X.; Ran, L.; Lin, W.; Zhang, W.; Yang, W. Key Improvements in Interfacial Adhesion and Dispersion of Fibers/Fillers in Polymer Matrix Composites; Focus on PLA Matrix Composites. Compos. Interfaces 2022, 29, 1071–1120. [Google Scholar] [CrossRef] [Scilit]
- Garg, A.; Bhattacharya, A.; Batish, A. On Surface Finish and Dimensional Accuracy of FDM Parts after Cold Vapor Treatment. Mater. Manuf. Process. 2016, 31, 522–529. [Google Scholar] [CrossRef] [Scilit]
- Plavec, R.; Horváth, V.; Hlaváčiková, S.; Omaníková, L.; Repiská, M.; Medlenová, E.; Feranc, J.; Kruželák, J.; Přikryl, R.; Figalla, S.; et al. Influence of Multiple Thermomechanical Processing of 3D Filaments Based on Polylactic Acid and Polyhydroxybutyrate on Their Rheological and Utility Properties. Polymers 2022, 14, 1947. [Google Scholar] [CrossRef] [Scilit]

Disclaimer/Publisher’s Note: The statements, opinions and data contained in all publications are solely those of the individual author(s) and contributor(s) and not of MDPI and/or the editor(s). MDPI and/or the editor(s) disclaim responsibility for any injury to people or property resulting from any ideas, methods, instructions or products referred to in the content. |
© 2026 by the author. Licensee MDPI, Basel, Switzerland. This article is an open access article distributed under the terms and conditions of the Creative Commons Attribution (CC BY) license.