


Abstract
An optimized numerical model is proposed, accompanied by an in-depth investigation of the characteristics of rod and tube drawing processes and a critical review of previous studies on tube drawing from the perspectives of practicality and accuracy. An automatic simulation framework, specifically a dual-step simulation scheme incorporating a specialized remeshing function, is presented to enhance the applicability and accuracy of simulations for rod and tube drawing processes. The effectiveness of the proposed finite element (FE) analysis model is evaluated by comparing FE-predicted results with those reported in the literature. Using typical examples of various multi-pass drawing processes, including both unidirectional and alternately driven cases, the importance of the proposed FE model and its automatic analysis capability in improving engineering productivity is demonstrated.
1. Introduction
A bar, rod, or tube is the basic form of material for industrial products. Tubes and wires, produced in small or large quantities of various types, are widely used in general machinery, power generation, aerospace, medical care, the electronics industry, and semiconductor manufacturing. Drawn rods are widely used as materials for cold forging, particularly in automated, multistage processes. Since rods and tubes often play a direct role in supporting tensile loads, which can be highly detrimental to fracture, it is crucial to accurately understand the manufacturing process and the mechanical condition of the product. However, the application of finite element (FE) simulation technology in the drawing process is not as active as in other fields, including forging and sheet metal forming. The cause is mainly due to the characteristics of the drawing process, such as the material’s large aspect ratio and the need for artificial factors, such as the gripper, to apply the tensile load.
A variety of works on rod or tube drawing has been made, focusing on dimensional accuracy [1,2,3,4,5,6,7,8,9], strain uniformity [10,11,12,13], defect or failure [14,15,16,17,18,19,20,21,22], thickness uniformity or eccentricity [3,5,6,7], surface quality, wear, or lubrication [21,23,24,25], drawing load or stress [1,2,3,4,5,11,16,26,27,28,29,30,31,32,33], and residual stresses [3,34,35,36,37,38,39,40,41,42,43,44,45]. They are all key factors to consider when designing the drawing process. Many studies on the drawing process have used the finite element method (FEM), and the combined FEM and optimization technique has been used to address major engineering issues that are complicatedly coupled [17,21,44,46,47]. During multi-pass drawing [48], the material may experience severe plastic deformation, which can enhance the texture formation, microstructure, and dislocation density [6,13,46,47,48,49].
The drawing process is mechanically and metallurgically complicated, even though its geometry is simple. Non-homogeneous residual stresses incurred during tube drawing and in service [38,43,50] may deteriorate the structural strength and local metallurgical properties. They may induce buckling of cylindrical tubes [51] and increase the post-work cost to enhance the material’s formability and the fracture resistance of the drawn product.
Although a few experimental studies on residual stresses during drawing [39] have been conducted, they have distinct limitations. FE prediction of residual stresses during drawing is thus one of the primary targets of FE analysis of drawing processes. Roy et al. [1] attempted to optimize a multi-pass wire drawing process for total deformation energy using an adaptive micro-genetic algorithm. They also applied this scheme to other processes with different optimal process design criteria. Akiyama et al. (2002) [34] studied the effect of a plug during tube drawing on residual stress. He et al. (2003) [35] predicted residual stress during steel wire drawing using FEM, accounting for the material’s plastic anisotropy, and experimentally verified the results. Ruiz et al. (2003) [36] experimentally and numerically studied the residual stresses in drawn steel wires. Pirling et al. (2008) [50] measured the residual strain of a cold-drawn copper tube using neutron diffraction to resolve the interconnection between the geometrical changes in the tubes caused by deformation non-homogeneity and the resulting residual stresses. Kuboki et al. (2008) [37] experimentally and numerically showed the existence of a specific minimum bare thickness reduction beyond which the intensity of the residual stress is significantly reduced. Pirling et al. (2011) [38] numerically studied the effects of wall thickness, eccentricity, ovality, and residual stress in tube drawing on tube qualities. Foadian et al. (2016) [3] experimentally and numerically demonstrated that a tilted die improves product quality by reducing residual stresses. Dmitriy (2019) [41] predicted the residual stresses of drawn wires fabricated under various working conditions to reveal the relationships among the reduction in area, cone angle, and residual stresses.
Gattmah et al. (2020) [52] developed a technique for measuring residual stress in drawn tubes; a comparison of FE predictions and X-ray diffraction results validated the approach. Nishida et al. (2021) [43] demonstrated that the residual stress problem of drawn wire can be significantly mitigated after straightening. Baumann (2021) [42] studied the method of reducing residual stresses in wire by modifying the die geometry. Selbmann et al. (2024) [44] presented an approach for tailoring the residual stress distribution by adjusting the forming process, including die geometry, drawing velocity, and wire temperature, to mitigate the near-surface tensile residual stresses induced by the drawing process.
Few researchers have studied the drawing processes, focusing on deformation or strain uniformity. Moon et al. (2005) [10] presented an analytical model of a multi-pass tube drawing process for optimal process design based on the criterion of strain homogeneity. Sheu et al. (2014) [11] optimized the profiles of the drawing die orifice and the plug to minimize drawing force and strain non-homogeneity, using the Taguchi method with FEM. Ji et al. (2015) [12] determined the cross-sectional profile of intermediate dies to improve plastic strain homogeneity using the conventional electric-field analysis method.
A few researchers have contributed directly or indirectly to the development of drawing process simulation technology. Nevertheless, the application of this technology is less developed in drawing industries than in forging and sheet forming, particularly in multi-pass processes. Although some academic research [10,15,19,20,27,47] has been conducted on multi-pass processes, applied research in this field is insufficient, considering that most drawn products are manufactured using multi-pass processes. The cause is primarily due to the characteristics of the drawing process. To make professional research results valuable in these industries, it is essential to develop practical analytical models and application technologies that account for the characteristics of the drawing process.
The characteristics of the drawing process are summarized as follows: A tensile force is applied to the end of the material that has passed through the drawing die orifice using a grip, causing unidirectional deformation of the material and local, yet continuous, contact with a specific part or area of the drawing die. Additionally, it involves multiple passes, and due to the material’s length, significant frictional heat is generated in some areas of the drawing die during the drawing process, which negatively affects lubrication [21]. Because forming is achieved by applying a tensile force to the material’s tip, the soundness of the process and product quality are sensitive to the material’s flow behavior. Additionally, when the material’s cross-sectional area is small, satisfying the initial drawing conditions is also crucial. From a numerical analysis perspective, the characteristic of the drawing process is that a portion of the material exerts force on itself, causing plastic deformation.
The drawing process is geometrically simple. However, it belongs to the very extreme end of problems in terms of mechanics and metallurgy. From a numerical analysis perspective, it is also considered an extreme process, so the applicability of numerical approaches is significantly limited compared to other metal-forming processes. Although numerous numerical studies have been conducted, they have not yet overcome the barriers to applicability. In this study, we present an optimized analysis model that accounts for drawing process characteristics and numerical aspects, along with a dual-step simulation scheme with a specialized remeshing function to improve accuracy and automate simulation of unidirectional and alternating drawing processes. Their usefulness in terms of practicability and accuracy is demonstrated through typical application examples focusing on residual stresses and metal flow lines in the multi-pass drawing processes, unidirectional or alternate. The elastoplastic finite element analysis function of AFDEX V24R02, an APA (Siemens/Altair, Advanced Partner Alliance (APA)) software, was used.
2. Optimized FE Analysis Model for Multi-Pass Drawing Processes
2.1. Definition of a Process Focusing on the FE Mesh System
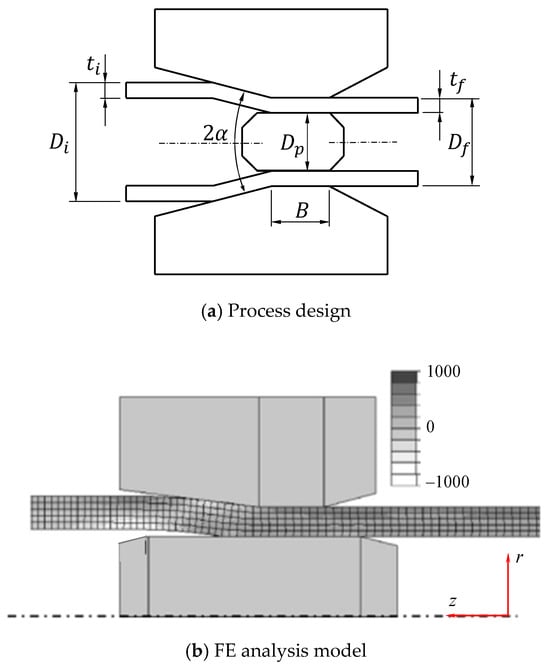
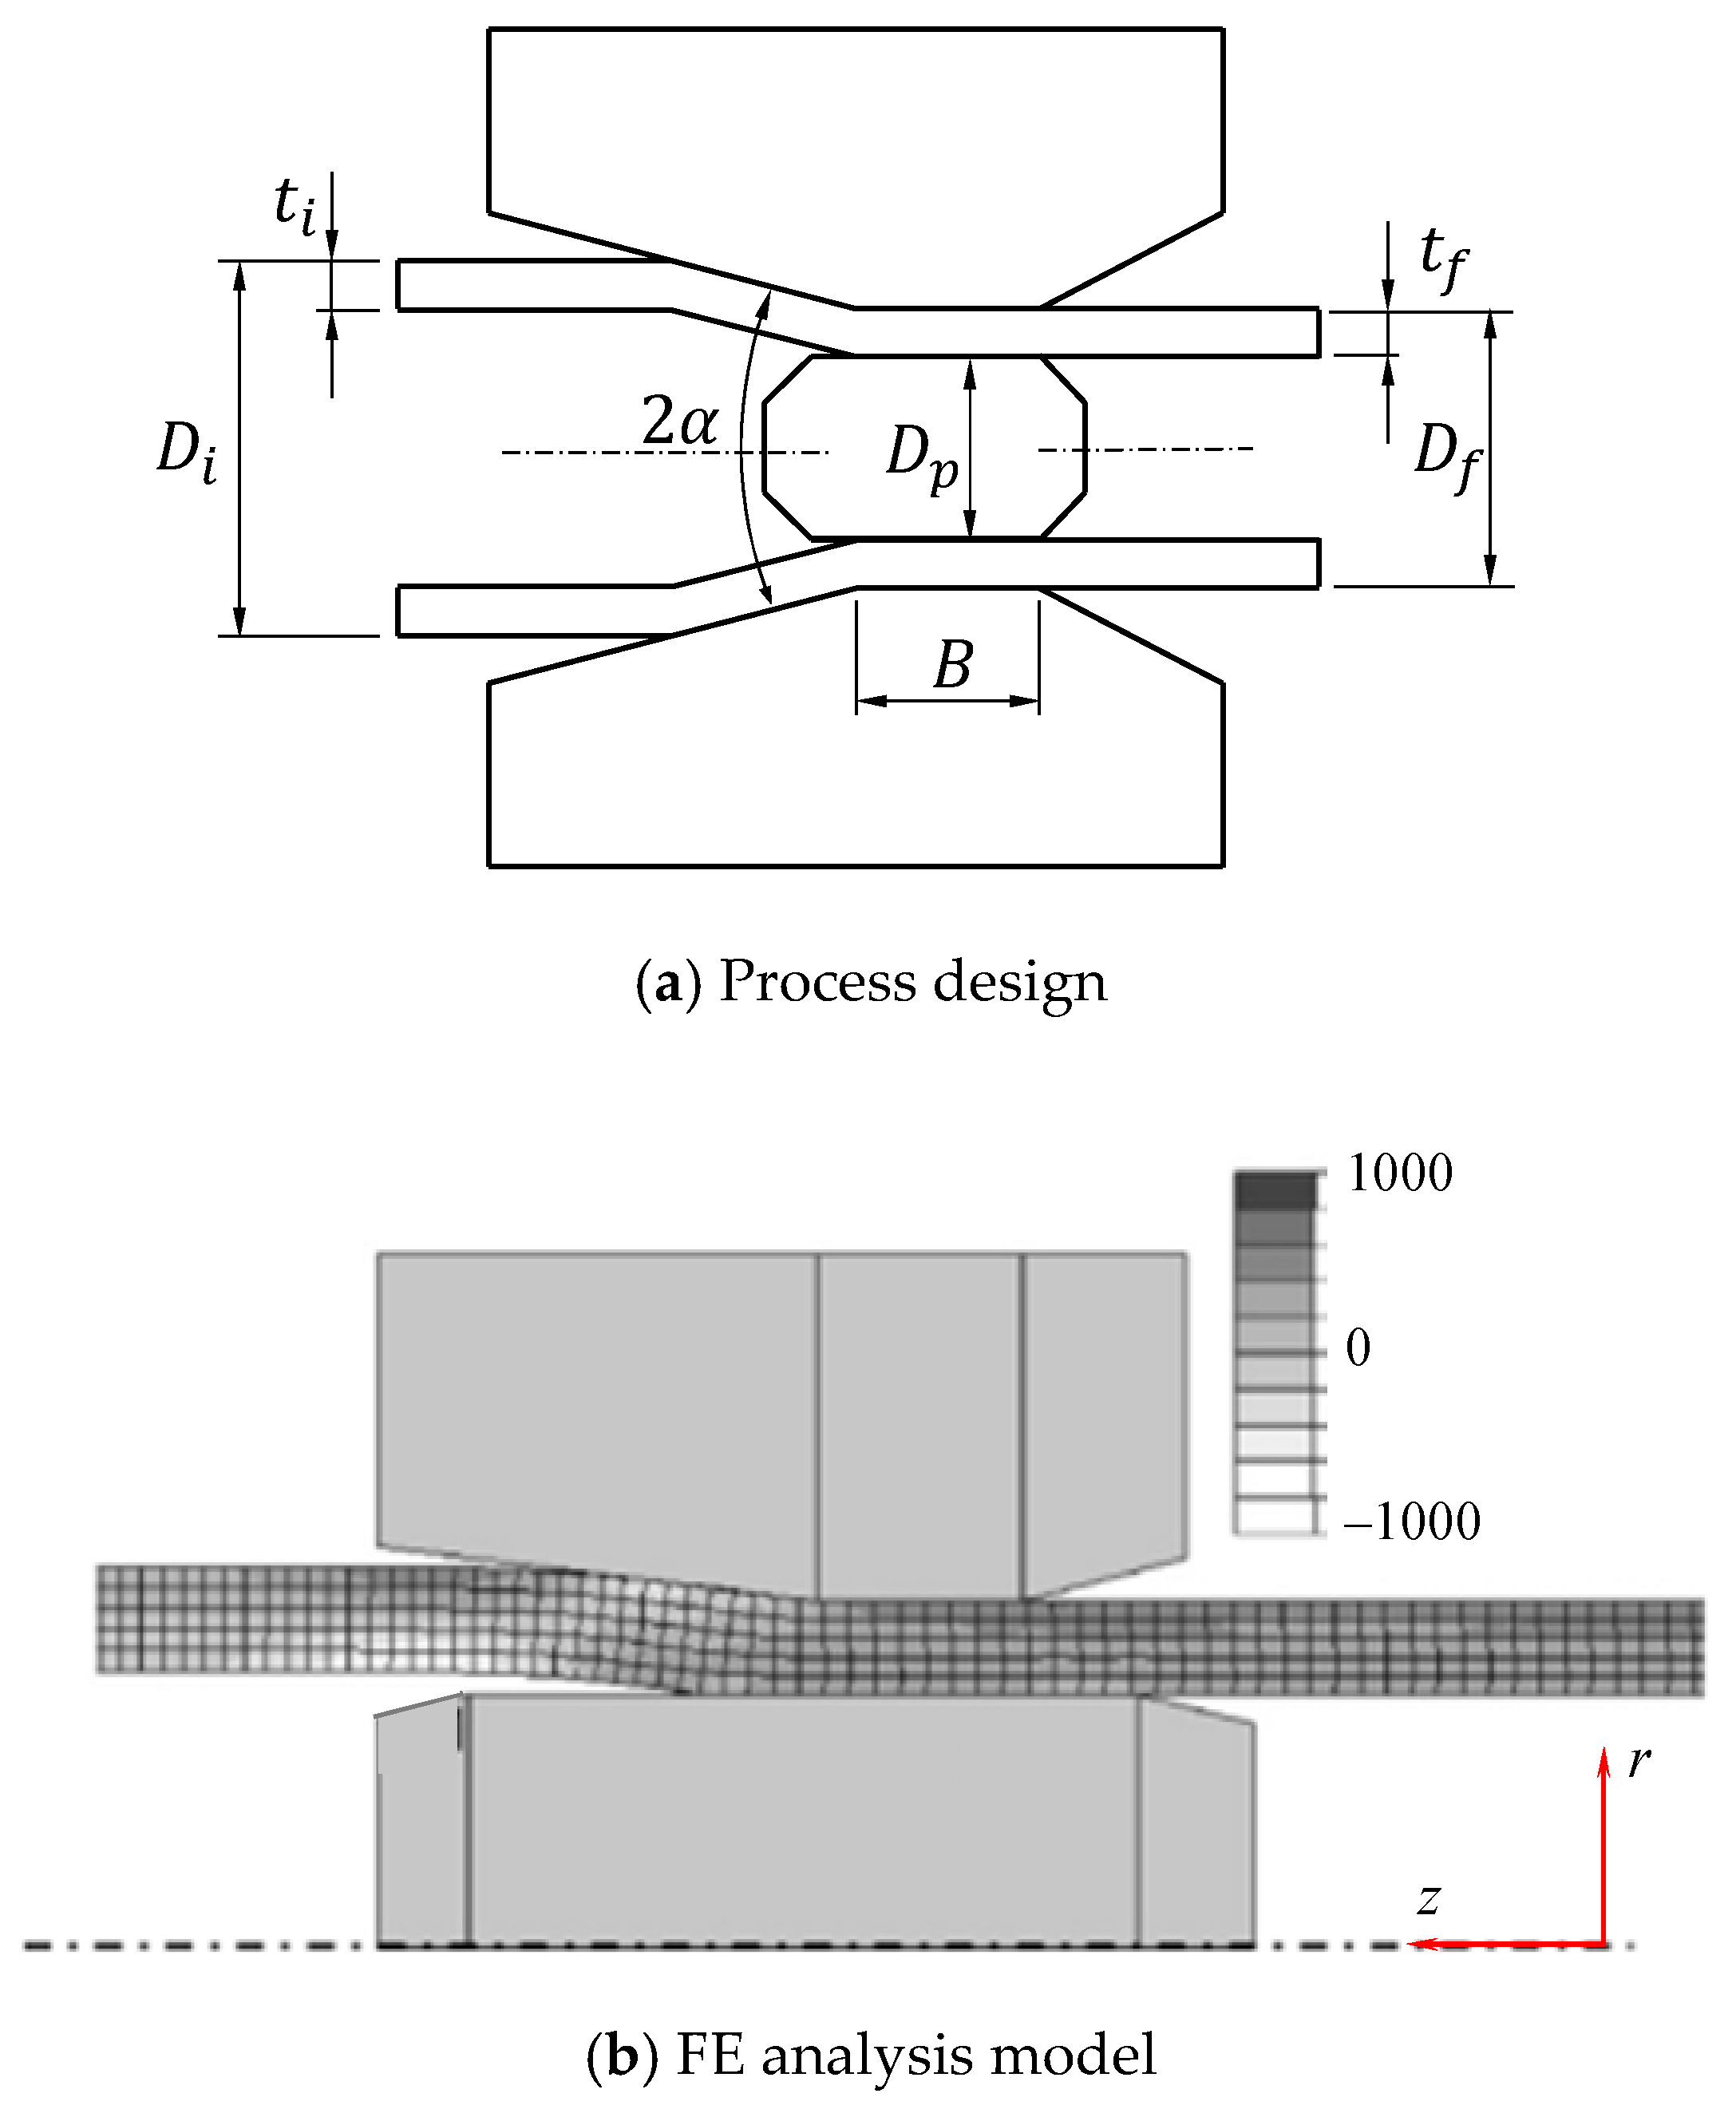
Kuboki et al. [37] conducted experimental and numerical investigations of a tube-drawing process, as illustrated in Figure 1, which shows the process parameters and the initial FE mesh. Table 1 summarizes the material properties and process parameters used for the elastoplastic FE analysis. The numerical analysis was performed under the assumption of axisymmetry. The initial mesh consists of nearly square elements; however, because the analyzed material was approximately 22 times the tube thickness, a significantly larger number of elements was required in the longitudinal direction. When the mesh density is increased uniformly in both the thickness and longitudinal directions, the total number of finite elements increases rapidly, leading to a high computational cost. This is one of the characteristic challenges encountered in drawing-process simulation.
Figure 1.
Definition and FE analysis model of the Kuboki et al.’s tube drawing process.
Table 1.
Process information about the Kuboki et al.’s tube drawing process.
In general, computational efficiency problems arise in FE analyses of tube drawing processes because the materials are often very long, and large-aspect-ratio meshes are typically avoided when elements are densely distributed in the radial direction. Consequently, previous FE analyses of axisymmetric drawing processes have commonly employed quadrilateral meshes with element aspect ratios close to unity, divided into an average of 8 equal radial intervals (up to 40).
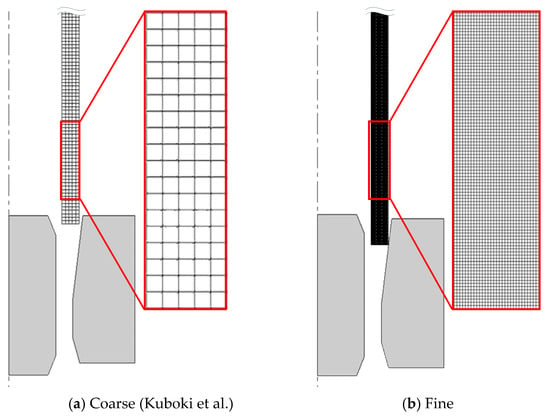
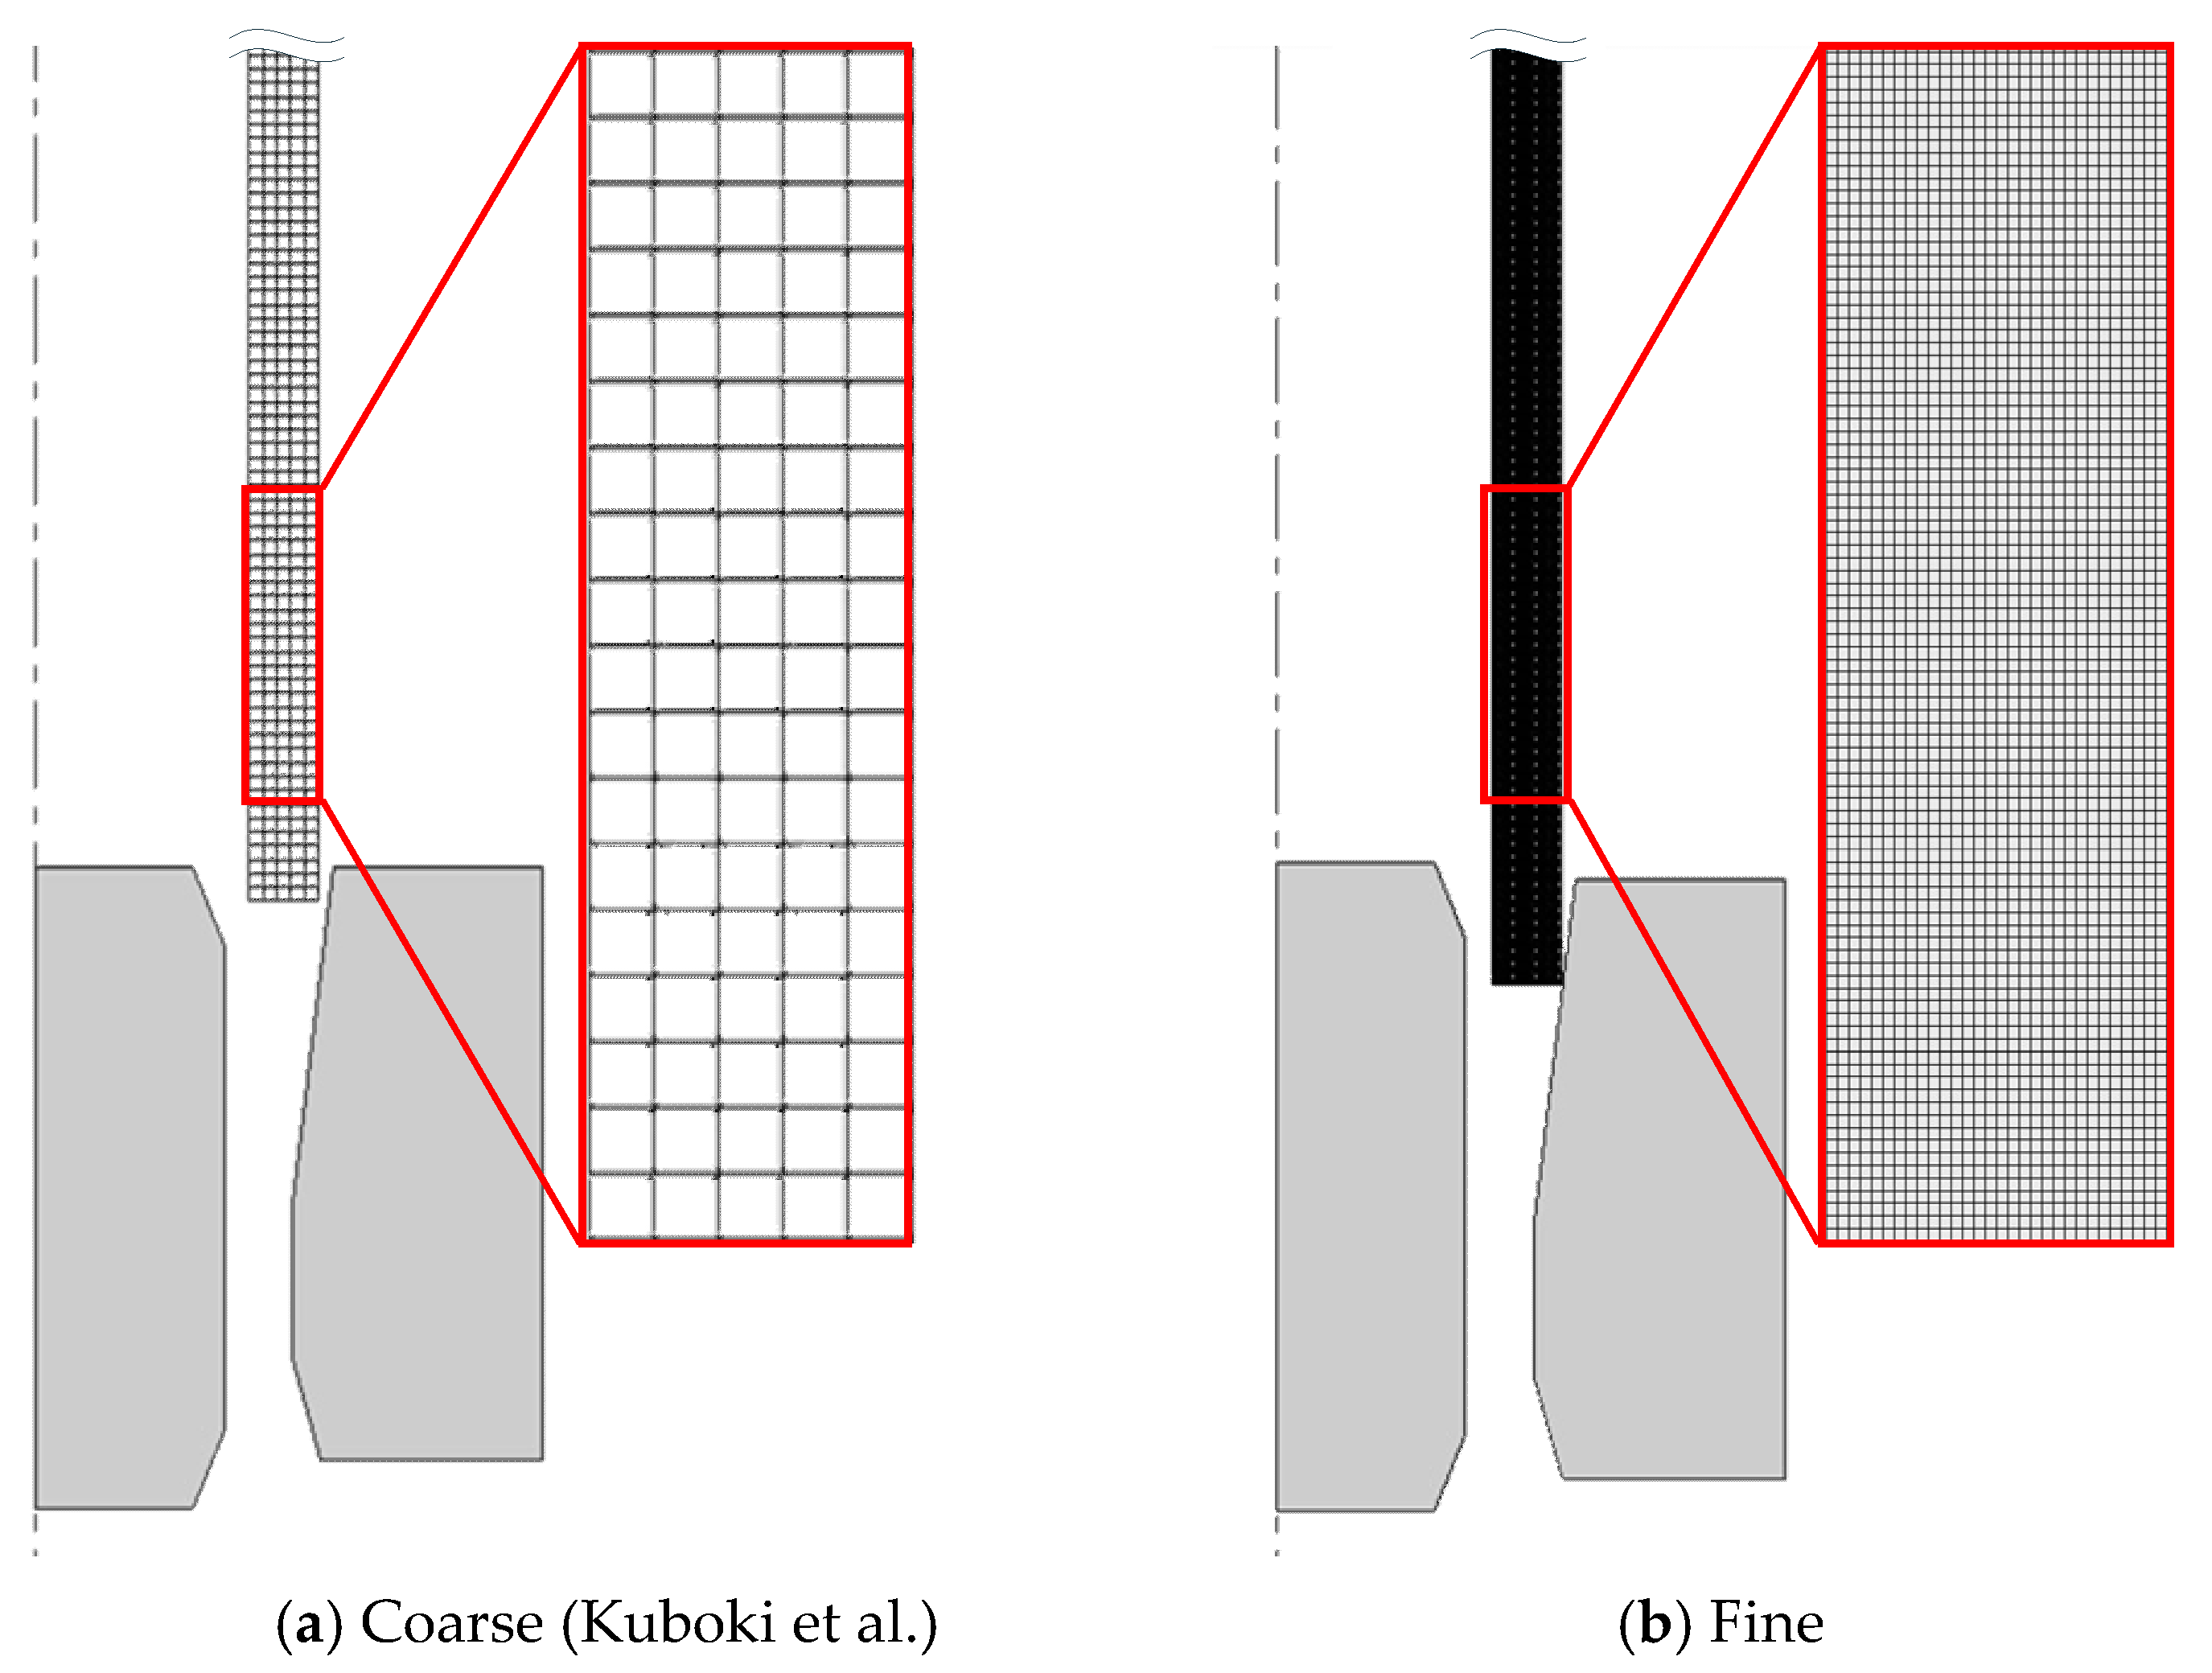
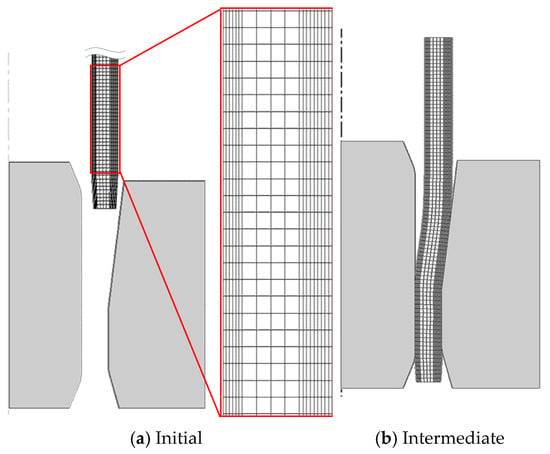
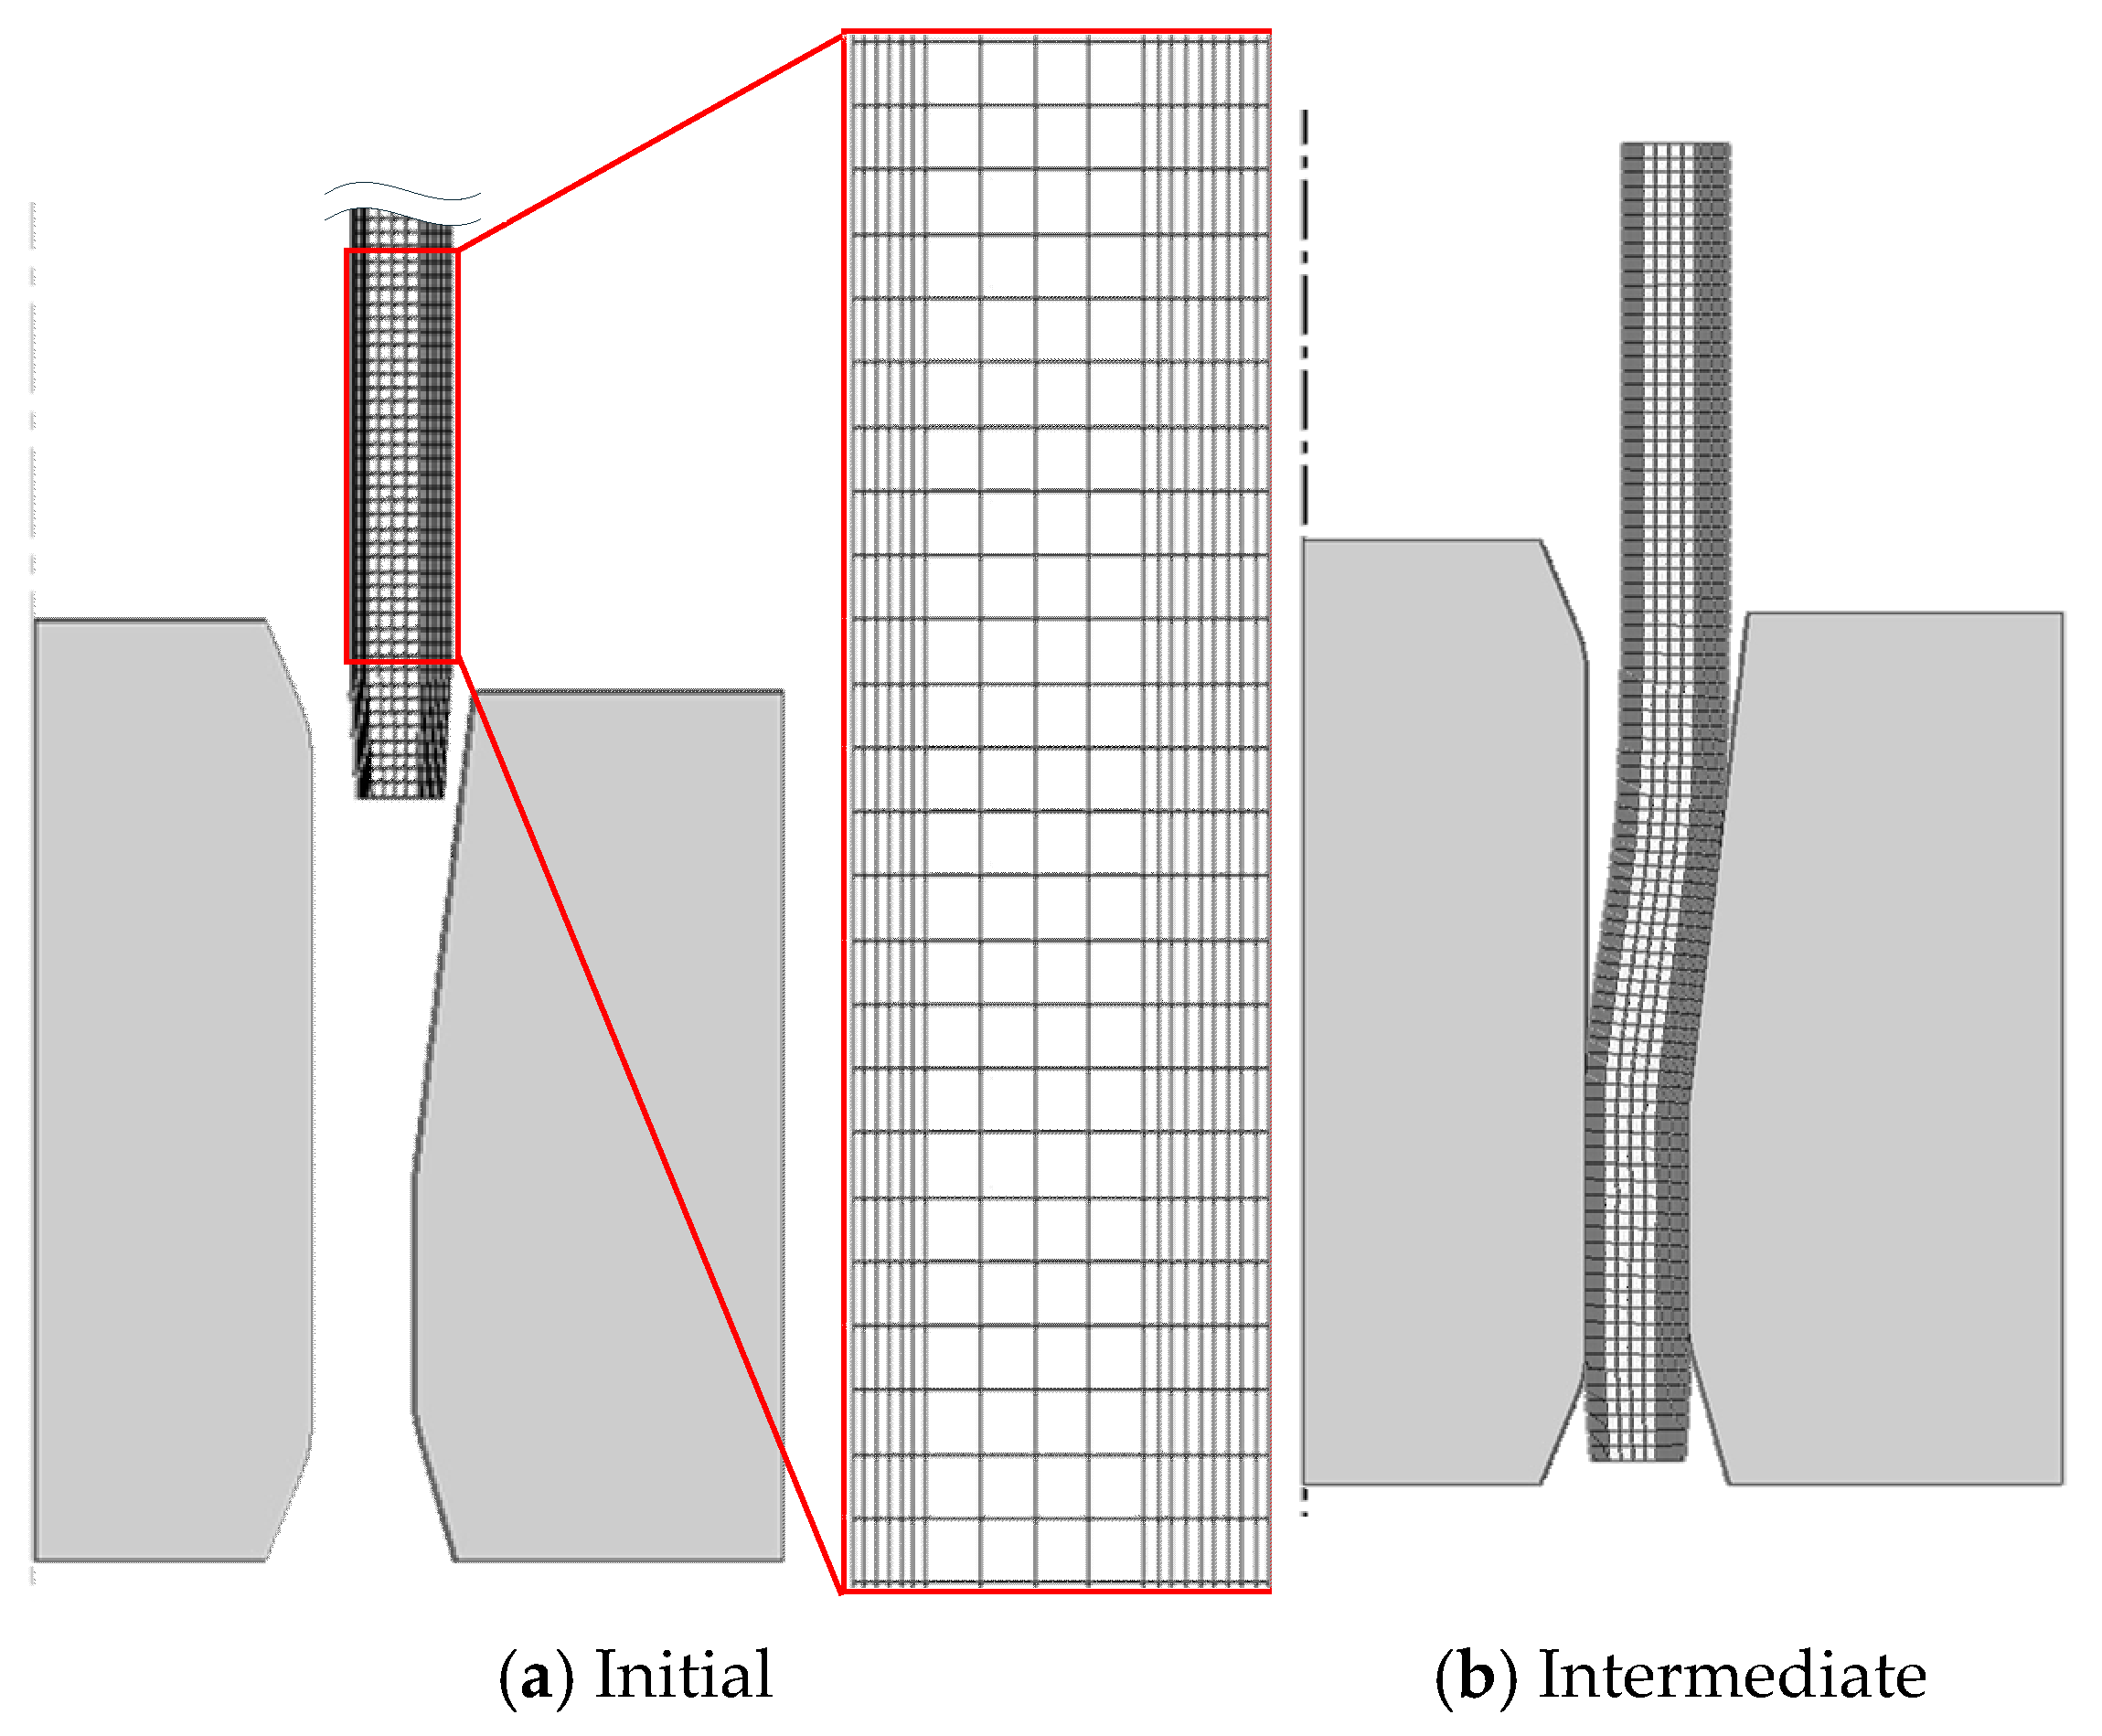
In the study by Kuboki et al., the material was divided into 5 equal radial intervals, resulting in an initial element aspect ratio of unity, and into 110 longitudinal intervals. In the present study, Kuboki et al.’s tube-drawing process was simulated using both the same FE mesh shown in Figure 2a and a denser quadrilateral mesh divided into 50 equal radial intervals and 400 longitudinal intervals, as shown in Figure 2b. The average forward step size of the material per solution step was set to 0.1 mm. Springback analysis was always performed as the material exited the die.
Figure 2.
FE mesh systems employed to compare the FE predictions by the coarse and fine FE meshes [37].
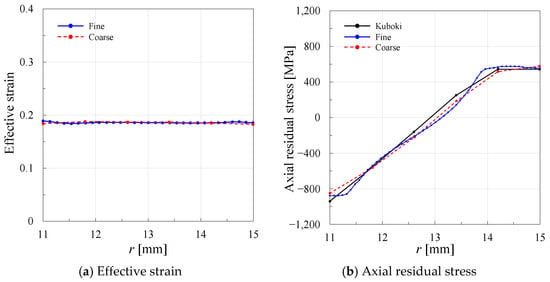
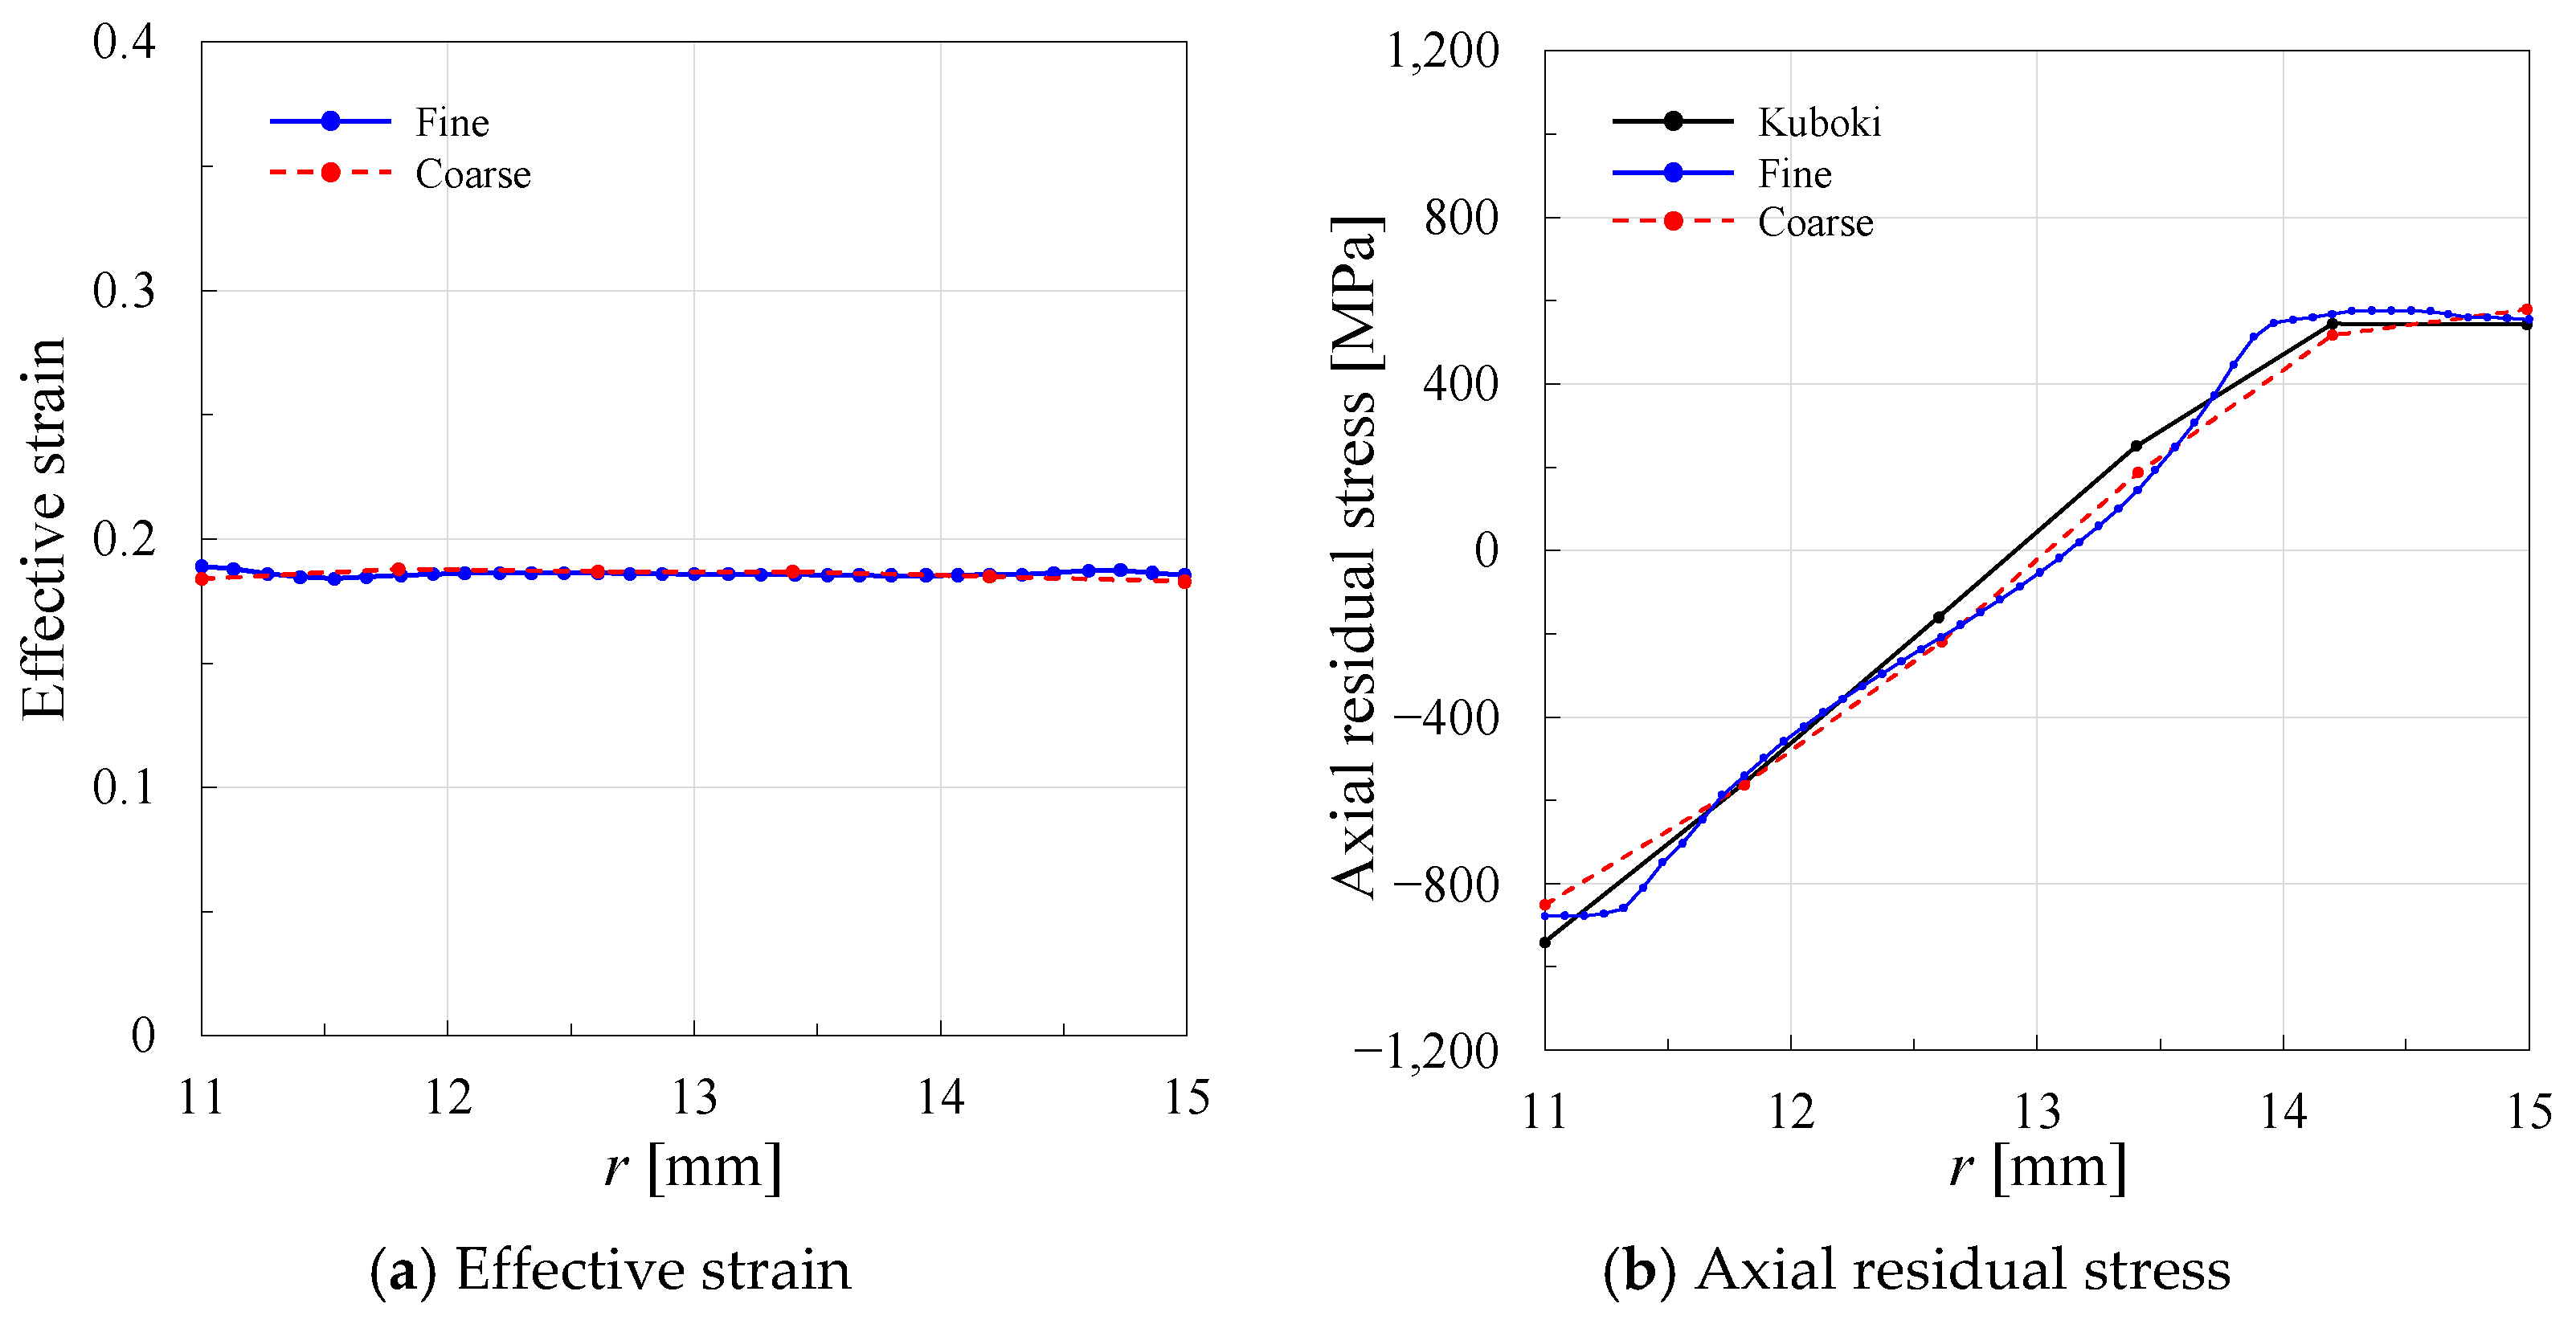
Figure 3a shows that the predicted effective strain, which varies smoothly along the radial coordinate, is not significantly affected by the FE mesh density. In contrast, the axial residual stress component is highly sensitive to the FE mesh system, as shown in Figure 3b. When the same coarse FE mesh used by Kuboki et al. is adopted, the present predictions are practically identical to theirs. However, the gradients of axial residual stress with respect to radius exhibit discontinuities near the surface, because the coarse mesh shown in Figure 2a cannot adequately capture the sharp stress variations concentrated in the skin region. This observation indicates that uniform and coarse FE models, including that of Kuboki et al., are not suitable for accurate residual stress analysis in tube drawing processes. Although this limitation can be mitigated by employing the dense mesh shown in Figure 2b, such an approach is generally not computationally economical. Therefore, optimized FE mesh strategies are essential for efficient analyses of multi-pass drawing processes, automatic process optimization, and three-dimensional drawing simulations.
Figure 3.
Comparison of FE-predicted effective strain and axial residual stress between coarse (Kuboki et al.) and fine (present) FE mesh systems.
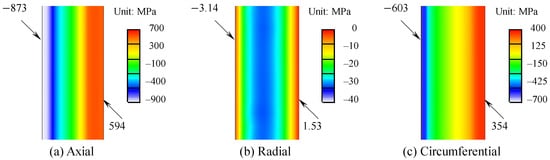
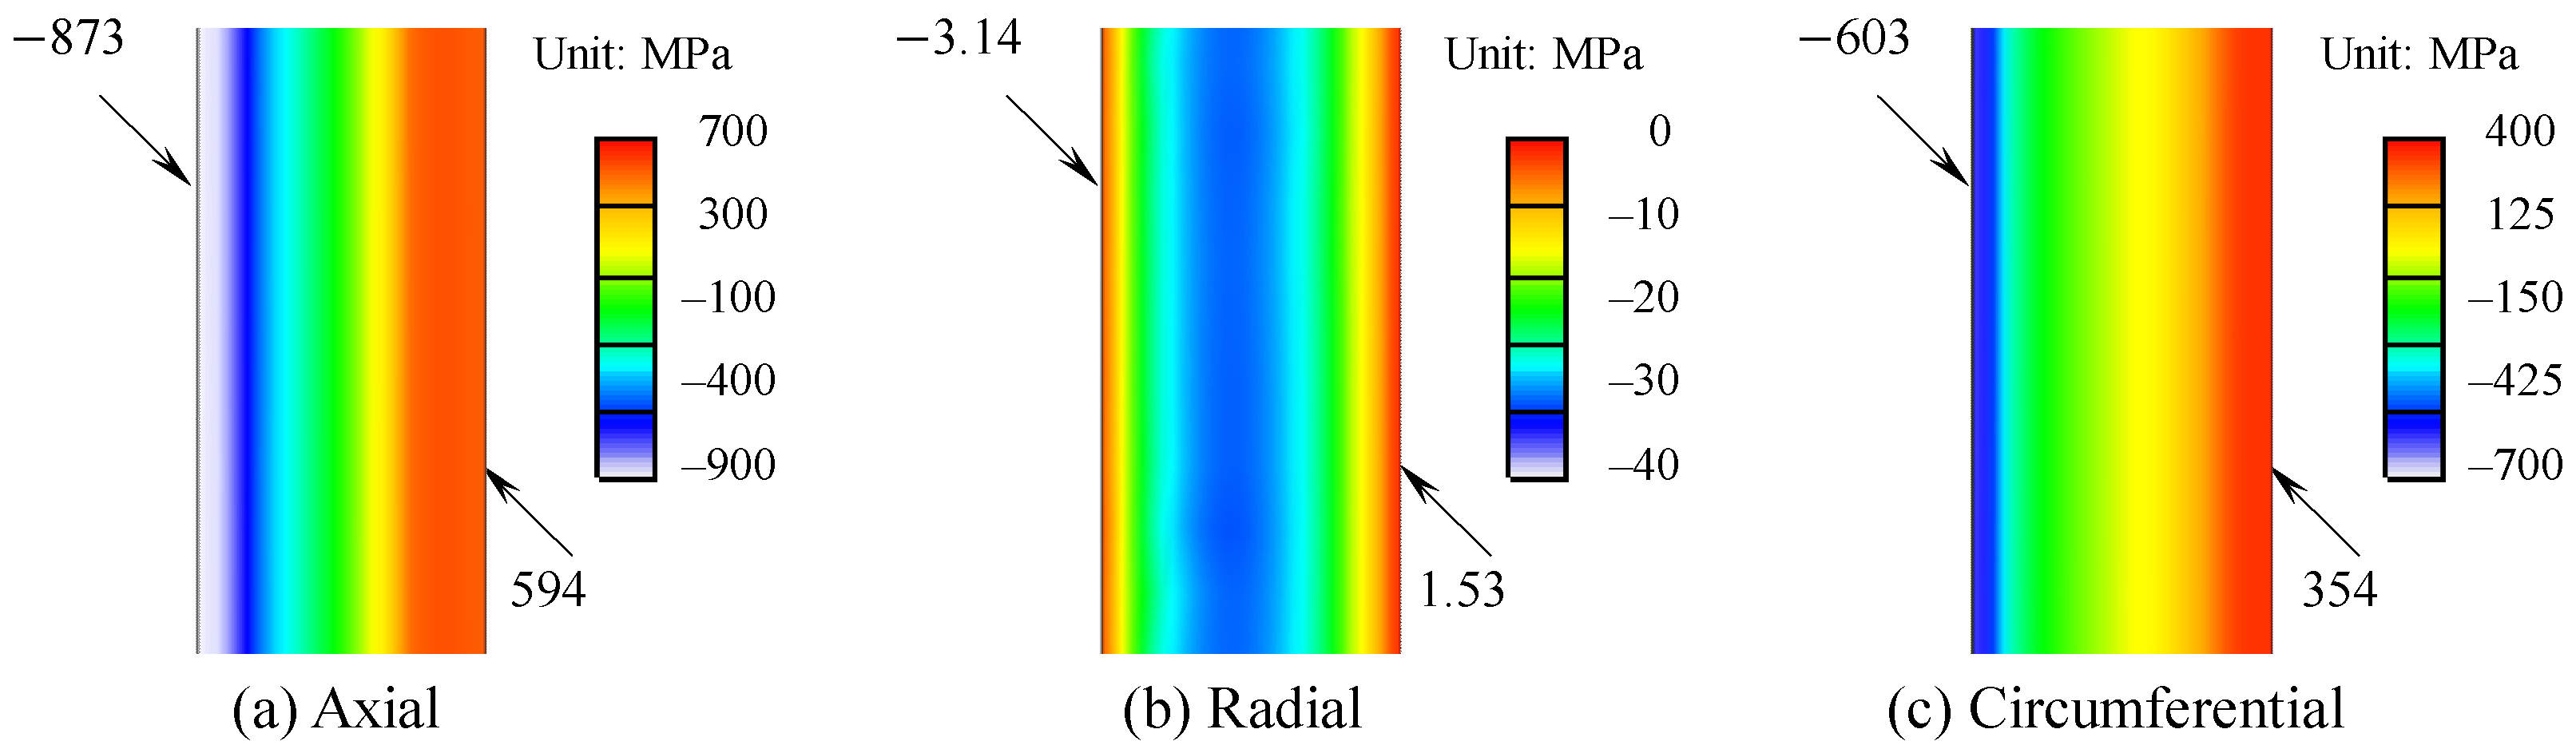
Meanwhile, as shown in the axial, radial, and circumferential residual stress components of the drawn material in Figure 4, obtained using the fine-mesh system in Figure 2a, their changes along the z-axis are not significant. The maximum and minimum axial residual stresses occurring at the inner and outer surfaces in the major deforming region were 888.5 and 872.7 MPa, and 594.1 and 555.2 MPa, respectively. The differences due to oscillations in state variables can be smoothed by taking their mean values, which is necessary because of the periodic and numerical changes in the area defined by the nodes at the two ends. The oscillation amplitude can thus be reduced by using a finer FE mesh system in the z-direction. Unless an analysis considers lubrication problems, coupled analysis, or elastic deformation of the die, an FE mesh that adequately captures contact conditions may not be problematic in the longitudinal direction from an engineering standpoint. This fact suggests that rectangular quadrilateral elements that are longer in the longitudinal direction are useful in two-dimensional cases.
Figure 4.
FE-predicted axial, radial, and circumferential residual stresses at the final stroke.
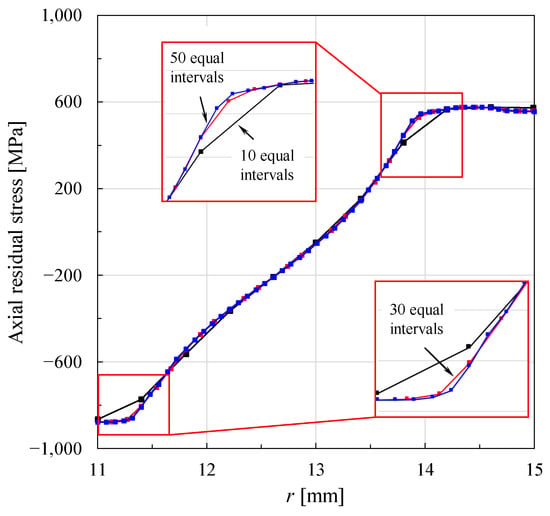
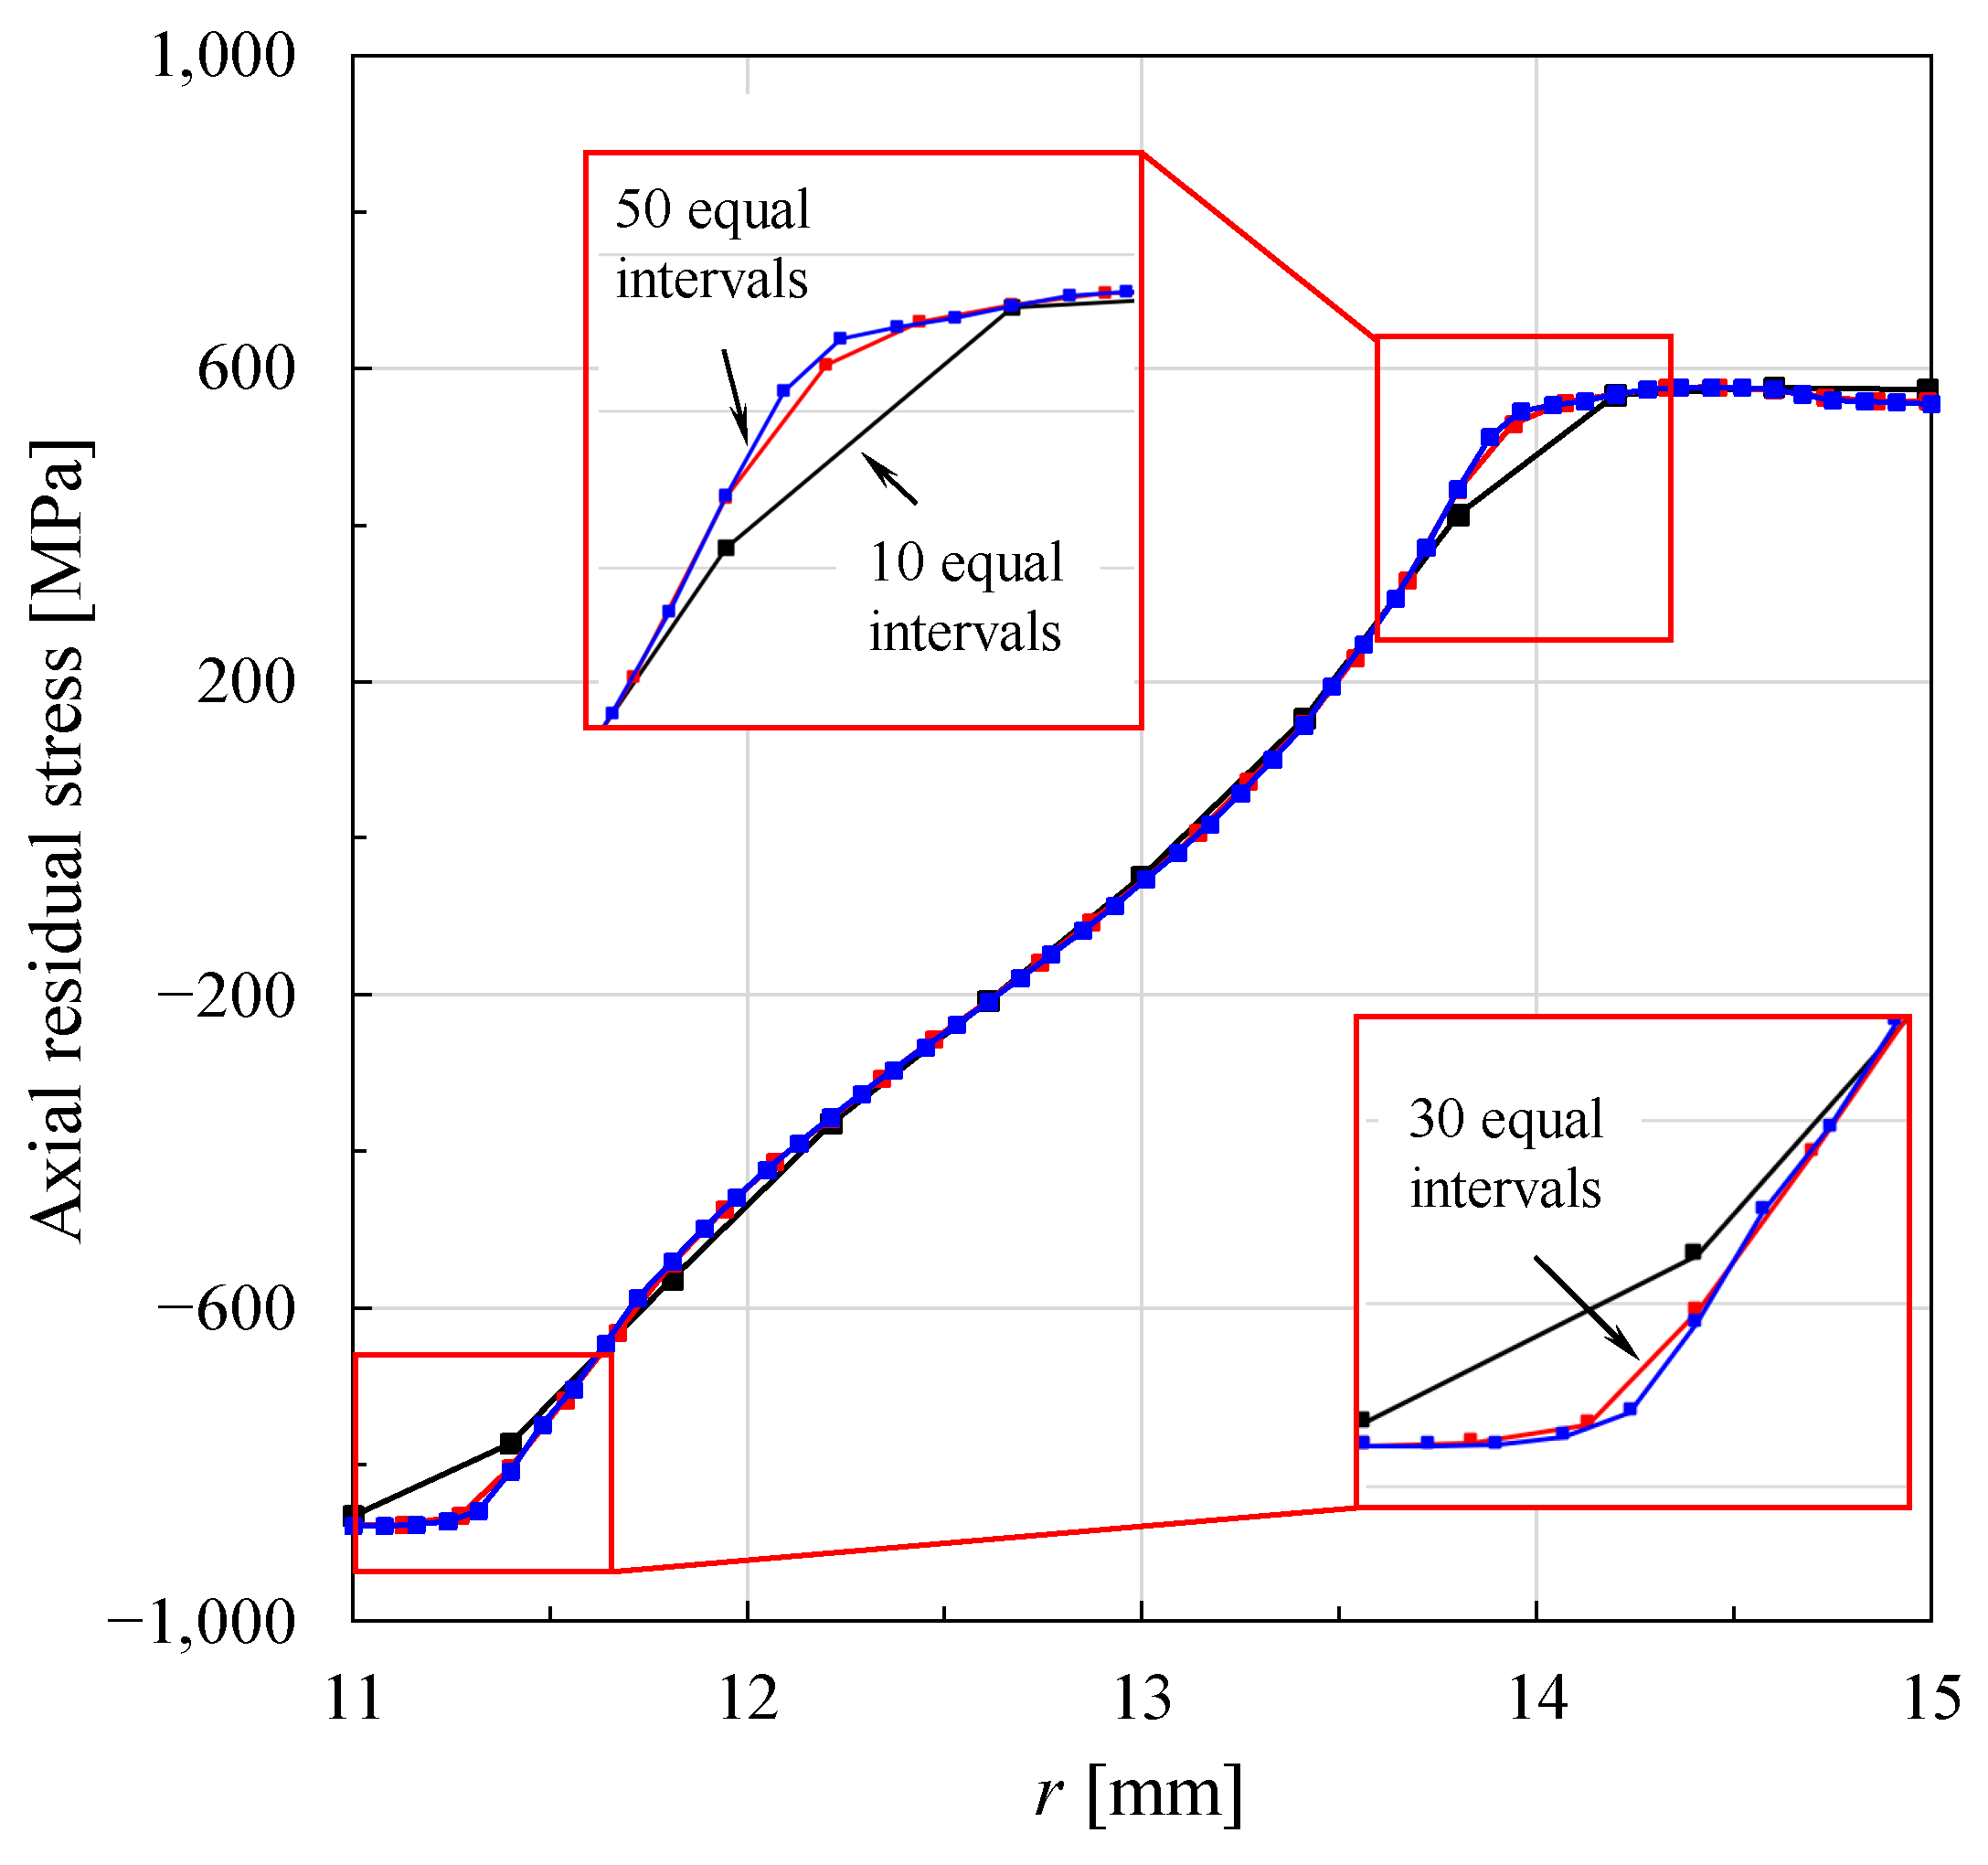
As shown in Figure 5, from the axial residual stress distribution, FE-predicted by a square FE mesh system equally divided in the radial direction into 10, 30, and 50 equal vertical intervals, it can be seen that the change in axial residual stresses FE-predicted occurs when the square FE mesh system has over 30 equal vertical intervals. It is not significant. However, given the very long drawing length and the three-dimensional drawing process, it is desirable to reduce the number of divisions in the radial direction as much as possible. For this purpose, in the case of tubes, a relatively coarse FE mesh is used near the thickness center where the effective strain and residual stress, which are the main FE predictions, change gently and almost linearly. However, a dense FE mesh is used near the contact surface of the material with a drawing die or plug. This fact emphasizes the need for an optimal non-uniform structural FE mesh system that accounts for the characteristics of the drawing process, which involves long material and rapidly changing FE predictions near the skin.
Figure 5.
Effect of mesh density on the axial residual stress.
Based on the FE predictions predicted by various FE meshes and the fact that reliable FE solutions were obtained by the FE mesh system with over 30 equal vertical intervals, as indicated in Figure 5, the method of densifying the elements near the skin in the r-direction (width = 0.5 mm) and coarsening the elements in the longitudinal direction, as shown in Figure 6, is effective in terms of both solution accuracy and computational efficiency.
Figure 6.
Optimized FE mesh system for the Kuboki et al.’s tube drawing process.
Since the longitudinal length of the quadrilateral element determines the number of contact nodes at the contact interface, as shown in Figure 6b, a rectangular quadrilateral FE mesh system with a constant length in the z-direction (19 unequal intervals in the r-direction and 100 equal intervals in the z-direction) was used to keep about 10 nodes at the contact interface.
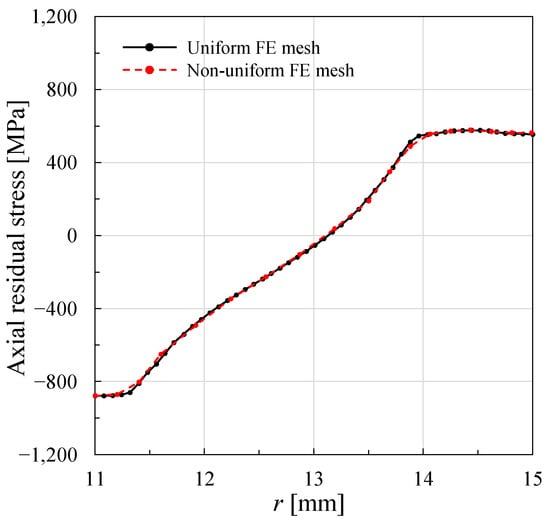
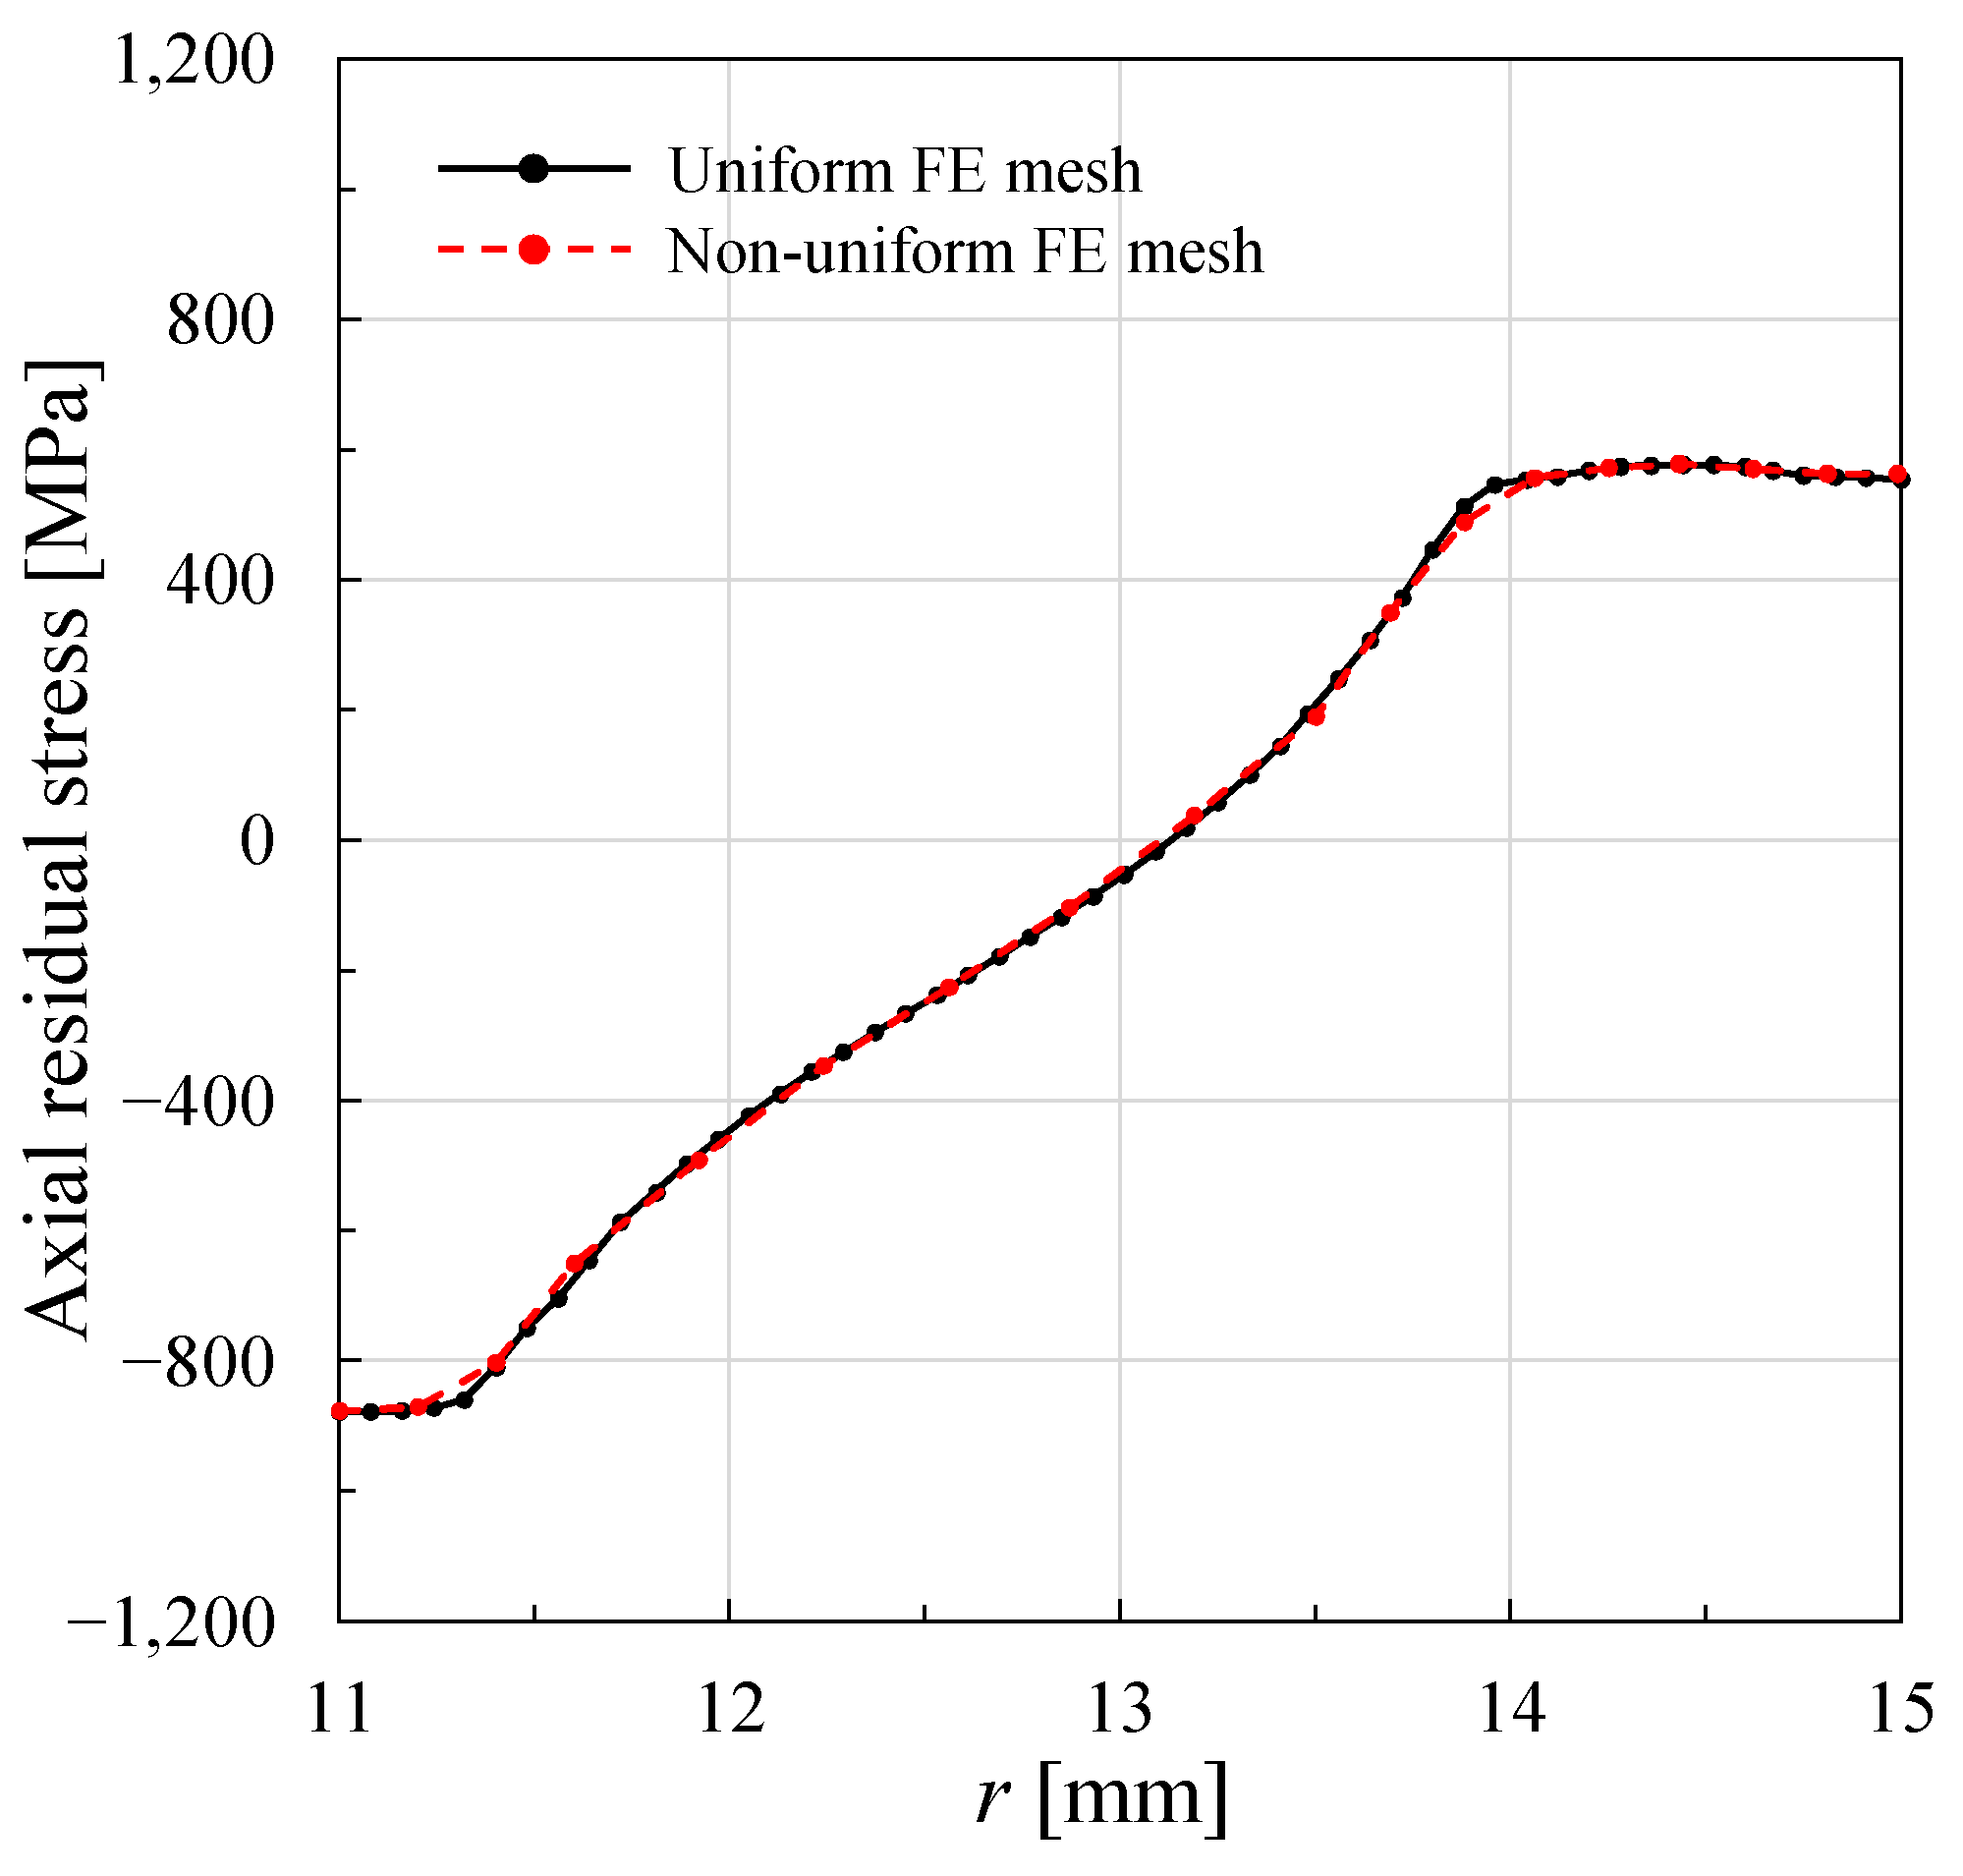
Figure 7 compares the FE predictions obtained using the FE mesh systems in Figure 2b and Figure 6. Although the number of FEs in the FE mesh system in Figure 6 is much less than half of that in Figure 2b, there is no significant difference in axial residual stress between the FE predictions obtained by the two FE mesh systems.
2.2. Special Remeshing Scheme for Accurate and Automatic Simulation of Drawing Processes
Drawing is based on a multi-pass process. During the analysis of a multi-pass drawing process, the material length increases as the area decreases. Although this increase in length during a pass does not significantly affect the analysis of the current pass, it has a detrimental effect on consecutive passes. The FE’s aspect ratio increases with an increase in the overall length of the drawn material. In addition, the contact length between the die and material is generally shortened due to the reduced drawing die size. The resulting FE mesh system for the drawn material may unacceptably represent the contact interface in the subsequent passes.
In simulating axisymmetric drawing processes using structural FE meshes, remeshing due to FE distortion is usually unnecessary throughout the simulation. This fact may also be true of most three-dimensional drawing cases. However, when the pass is changed, remeshing is fundamentally necessary to resolve the aforementioned problem and the computational efficiency problem resulting from the increased material length and shortened material-die contact length in subsequent passes. For this purpose, it is desirable to cut the material to maintain the length-to-radius ratio below a specified level, while accounting for computational efficiency and end effects. On the contrary, it is advisable to prefer the function [3] specialized for that purpose to the usage of the long material for analyzing temperature changes in materials and dies.
The key point in remeshing the axisymmetric material during the drawing process simulation is to maintain the structural FE mesh in optimal condition while accurately describing the outer geometry. This optimized FE mesh system should be maintained from beginning to end by keeping the material’s initial length-to-radius ratio constant, and the number of vertical and horizontal divisions, along with their ratios, constant at each pass. That is, at the beginning of each drawing pass, the two mechanically meaningless ends should be removed, the length of the initial material should be maintained at an appropriate ratio to the diameter, and the connectivity of the initial FE mesh system should be maintained.
Of course, using an optimal mapping method, the new FE mesh system must maintain the geometric and mechanical quantities of the previous FE mesh. The elemental values of state variables were first formulated by linearly interpolating their optimized nodal values, thereby minimizing the least-squares difference between them. From the continuous functions of state variables, new state variables at the necessary points are calculated. The nodes on the outline of the new FE mesh system are strictly located on the outline of the old FE mesh system. When the coordinates of the outermost node move, the related inner nodes also move by a corresponding amount based on an interpolation principle, thereby minimizing damage to the optimal FE mesh. The principle is to treat the internal nodes as points on the line segment connecting the two outermost points on the same z-coordinate line (the nodes with the maximum and minimum r-coordinates among those with the same z-coordinate). The given ratios of the related FE intervals in the r-direction determine the r-coordinates of the new internal points.
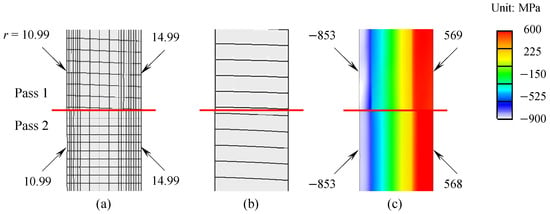
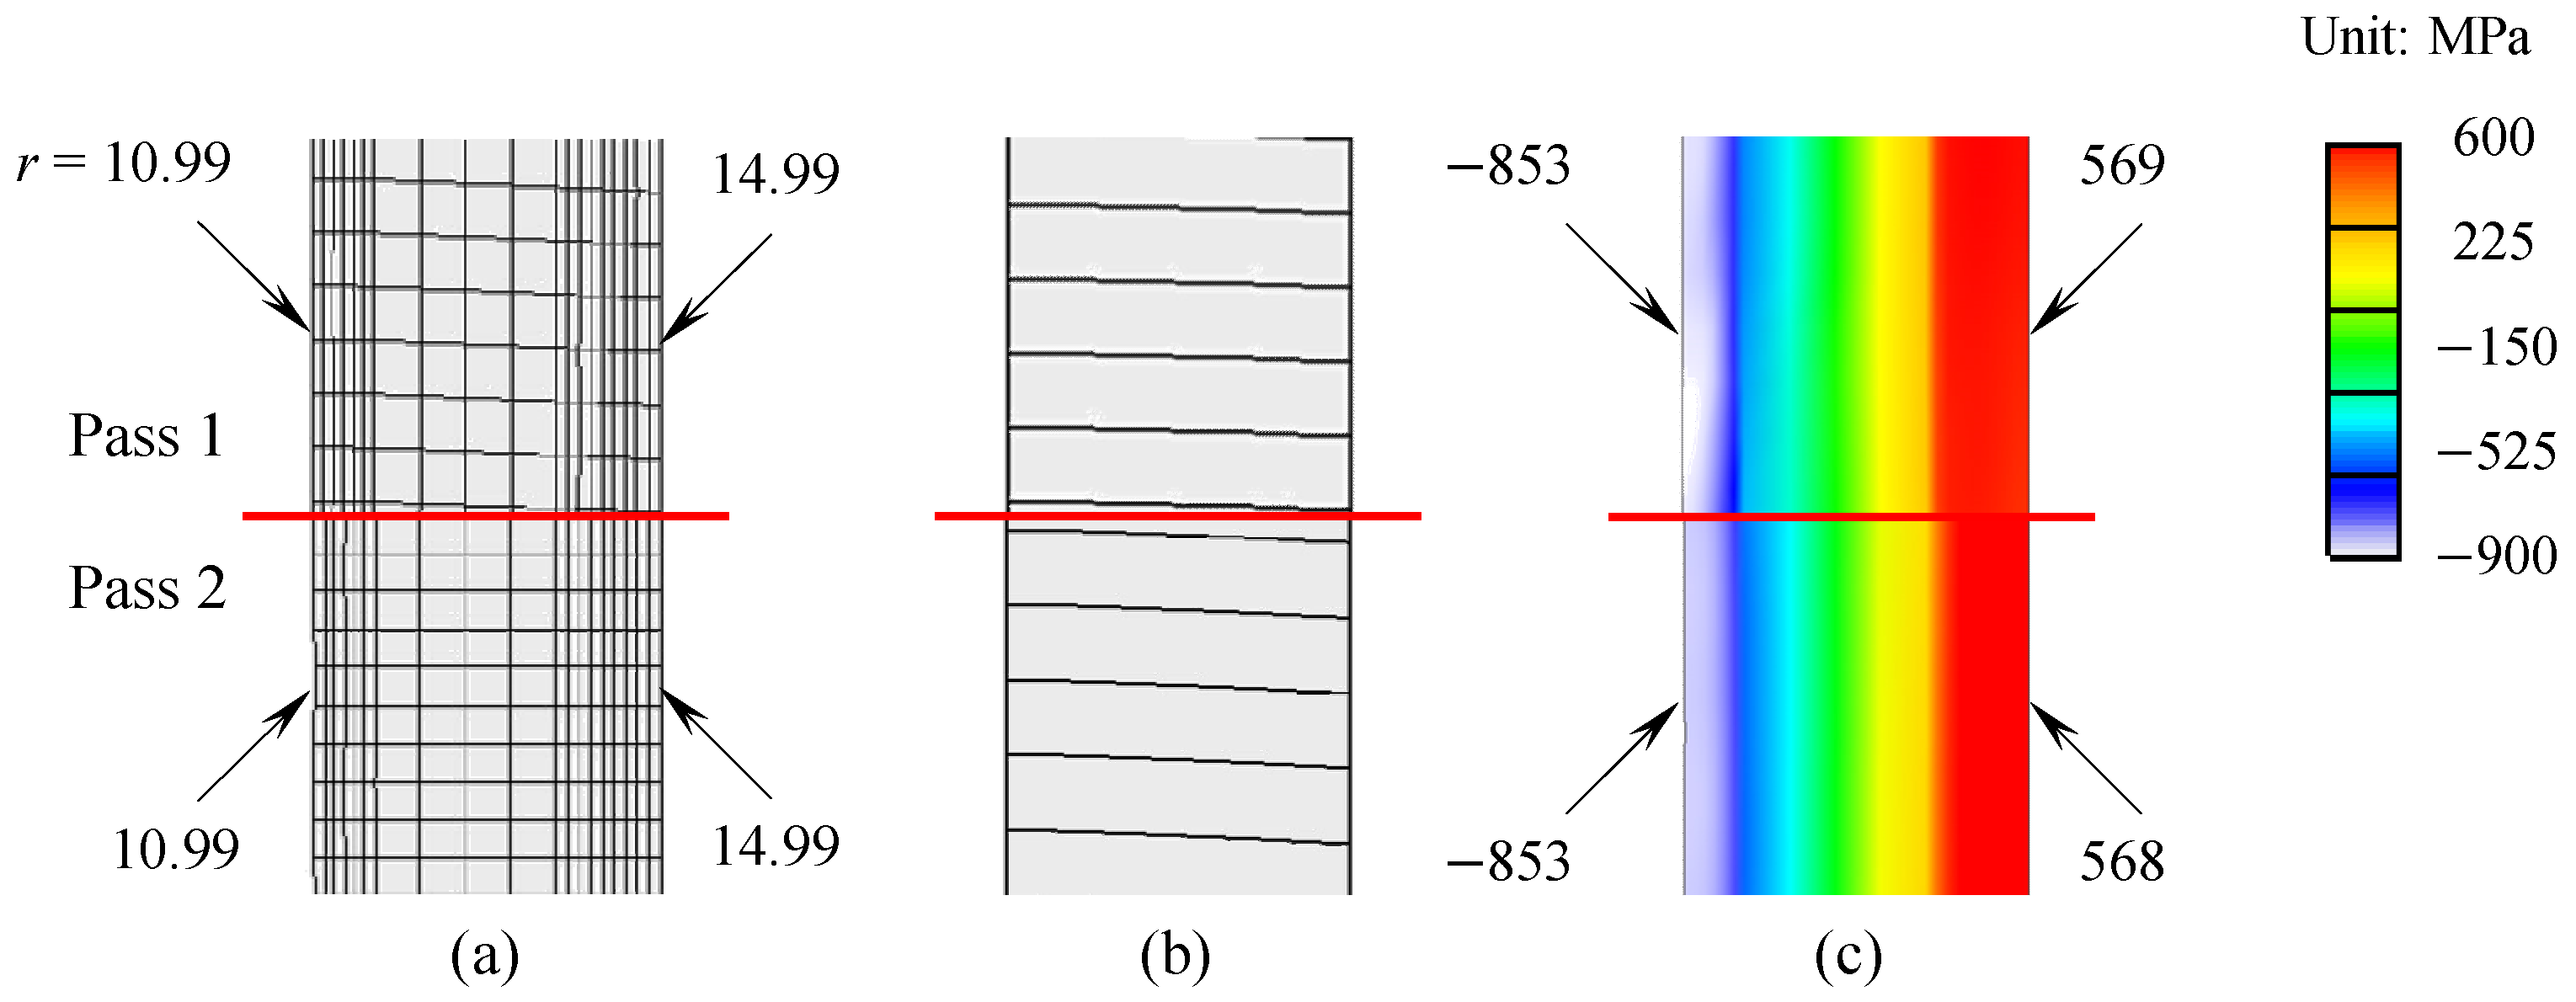
With the above-mentioned concept and method, immediately after completing the FE simulation of the drawing process in Figure 1, remeshing was performed using the method dedicated to the drawing process. Figure 8 shows the FE mesh, horizontal virtual metal flow lines (HVMFL, that is, the deformation history of the line segments initially perpendicular to the drawing direction), and residual stresses before and after remeshing. To check whether their peripheral coordinates changed due to remeshing, the minimum and maximum r-coordinates of the surface were compared, showing differences of 0.009% and 0.007%, respectively, relative to the previous FE mesh. In addition, the minimum and maximum residual stresses of the two FE mesh systems recorded differences of 0.026% and 0.215%, respectively. The difference in residual stress is very small compared to the general case when non-structural or non-optimized structural FE mesh systems are used. This is because the r-coordinates of the nodes constituting the FE mesh systems before and after remeshing are almost identical. Hence, the two FE mesh systems are compatible with respect to the mapping of state variables for remeshing.
Figure 8.
Comparison of FE mesh system, metal flow lines, and axial residual stress between before (upper) and after (lower) remeshings. (a) FE mesh system; (b) Metal flow lines; (c) Axial residual stress.
3. Dual-Step Simulation Scheme of Drawing Processes
As shown in Figure 6, the initial FE mesh for FE analysis of an axisymmetric or two-dimensional drawing process is optimized and composed of non-uniform rectangular initial FEs. In all passes of a continuous process, the number of FEs and the element connectivity information are the same. At the beginning of each pass, unless there is a special request, the initial FE mesh is generated or remeshed. During the FE mesh generation or remeshing, chamfering may be applied to the grip region of the material for better initiation of drawing or prevention of severe FE mesh distortion at the frontal edge, and the flow stress of the material near the grip may be artificially strengthened, considering the grip’s function.
When analyzing a multi-pass drawing process in automatic analysis mode, the position of the remeshed material is automatically determined at the end of the current pass, taking the drawing direction into account. Once preparation for analysis is completed, analysis for the next pass automatically continues without any user intervention.
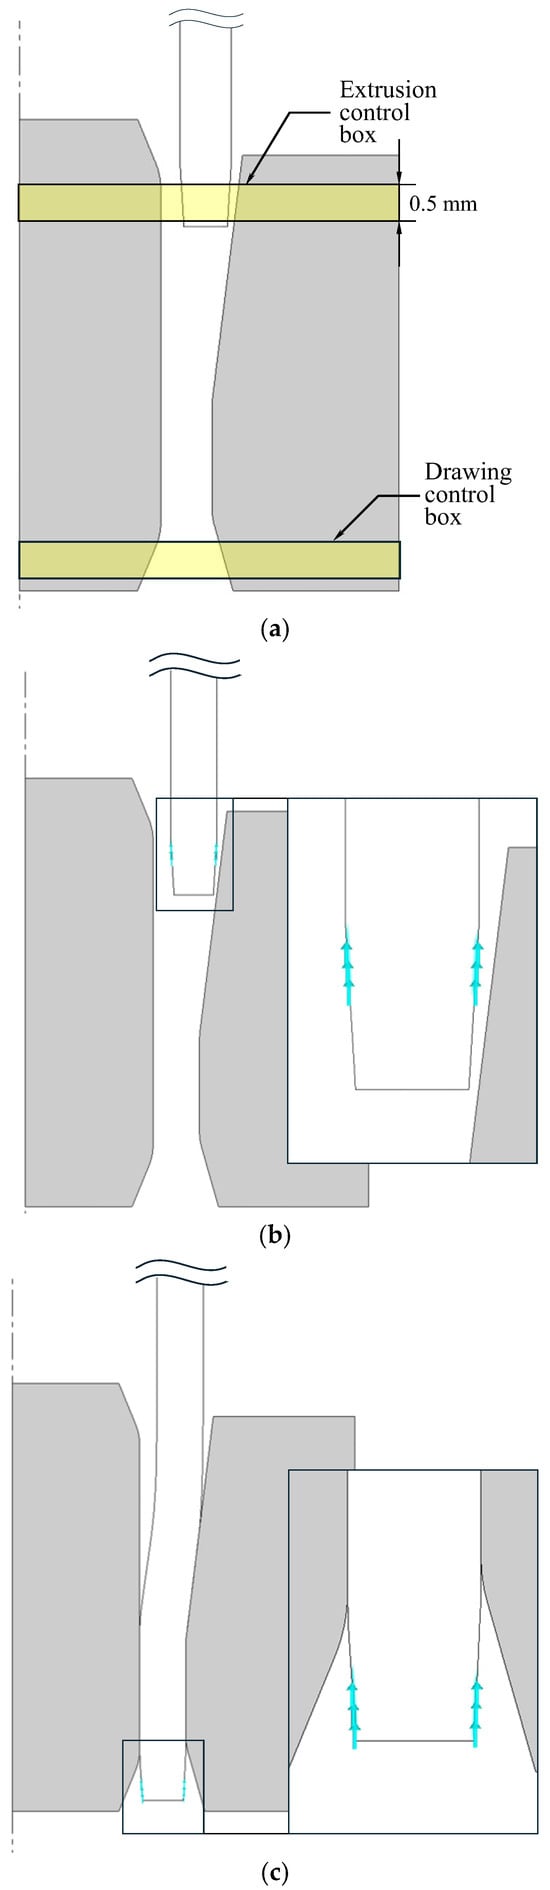
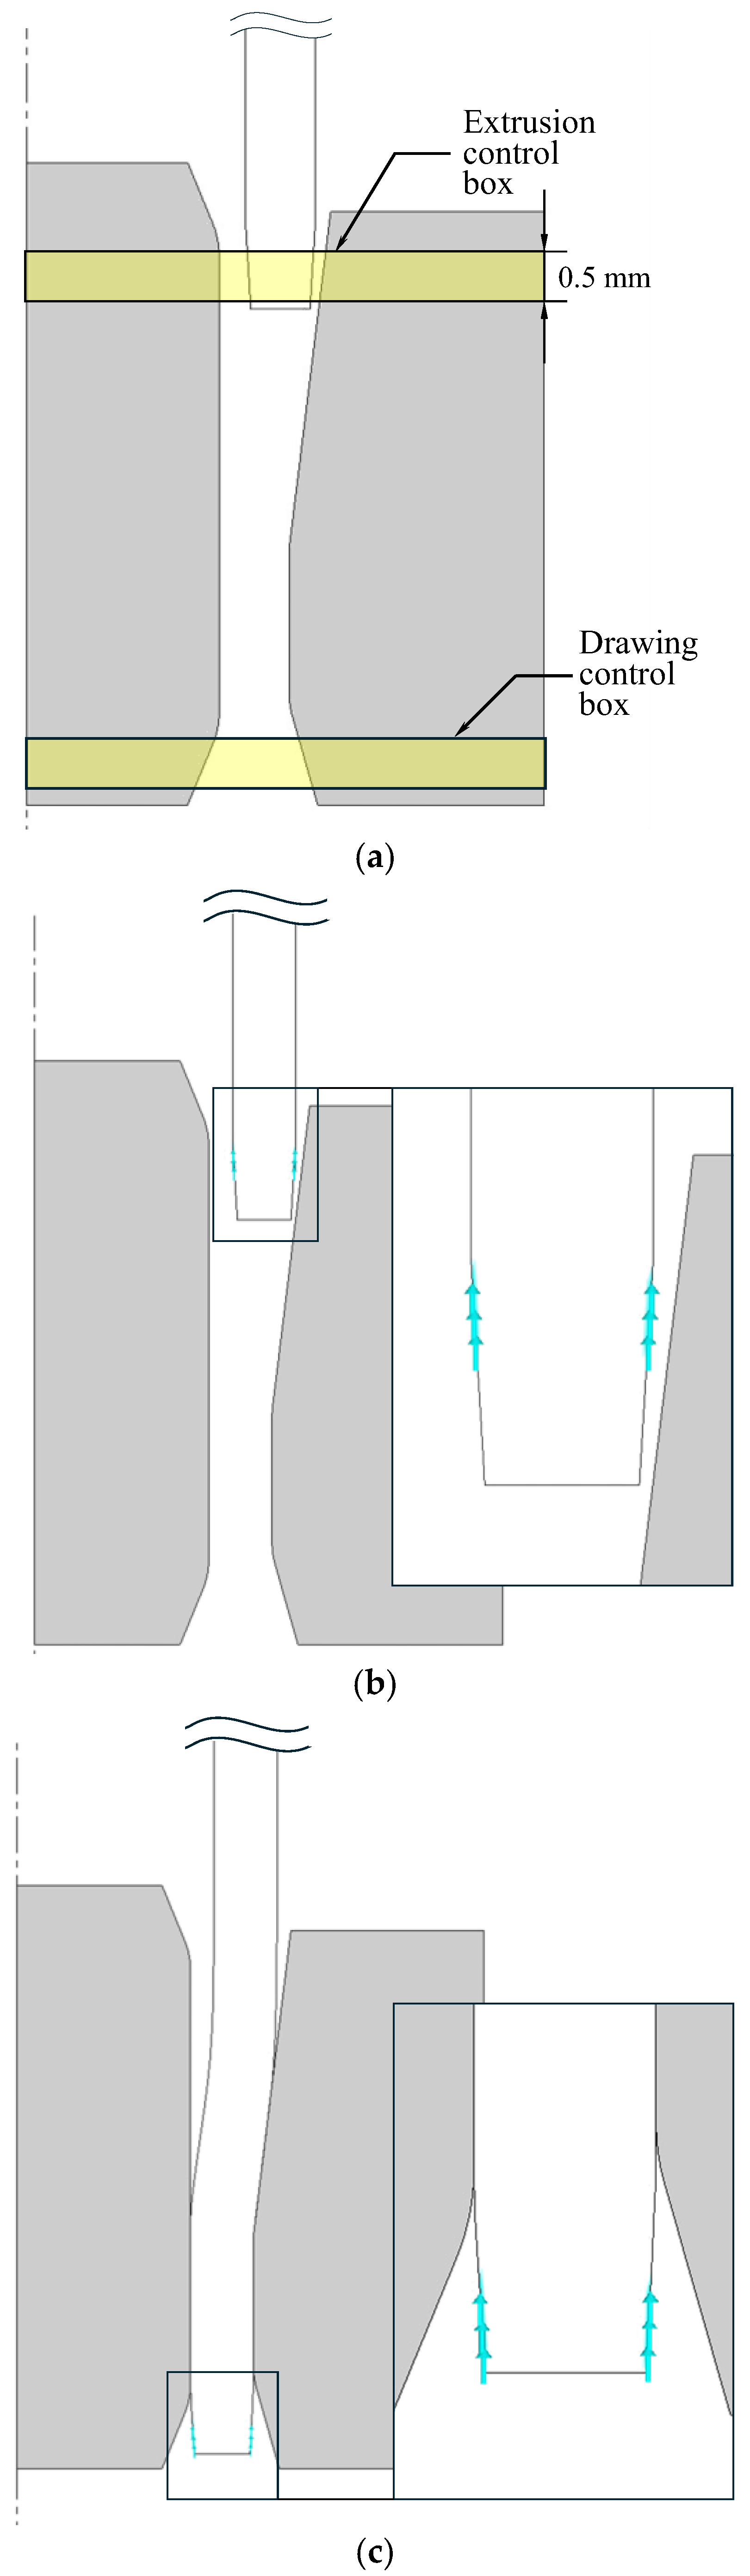
Figure 9a shows a dual-step strategy for simulating the tube drawing process after the virtual tube extrusion for grip creation, considering the drawing process simulation characteristics described above. The process analysis is structured so that the virtual extrusion process for grip forming precedes the drawing process. The dual-step simulation scheme is fundamentally based on a drawing die, plug, material, and two velocity boundary condition boxes.
Figure 9.
Dual-step simulation scheme. (Virtual extrusion velocity: 1 mm/s, Reduction in area per pass: 10%). Colored arrows were placed at the velocity-prescribed nodes (a) Process definition focusing on virtual extrusion and drawing control boxes. (b) Virtual extrusion to form the grip. (c) Actual drawing.
The material’s motion is primarily driven by the velocity imposed via two velocity boundary condition boxes. As shown in Figure 9b,c, the virtual extrusion velocity boundary condition box on the inlet side is first activated, and the drawing process simulation begins when the material activates the drawing velocity boundary condition box on the exit side. The arrow in Figure 9b,c means that the velocity boundary condition was imposed in the z-direction, and it is unrelated to the magnitude or sign of the imposed actual velocity.
4. Typical Examples
4.1. Subsection Definition of Unidirectional and Alternate Drawing Processes and Their FE Simulations
Two virtual 20-pass solid-rod drawing processes, one for unidirectional drawing and the other for alternate drawing, were analyzed using an automated drawing process analysis technique. Information about the two processes is summarized in Table 2.
Table 2.
Summary of the process parameters of the test examples.
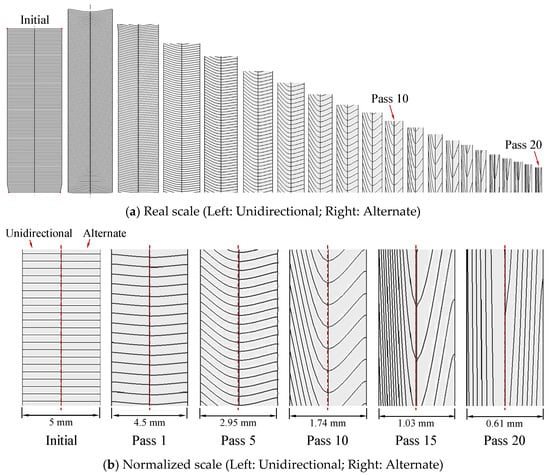
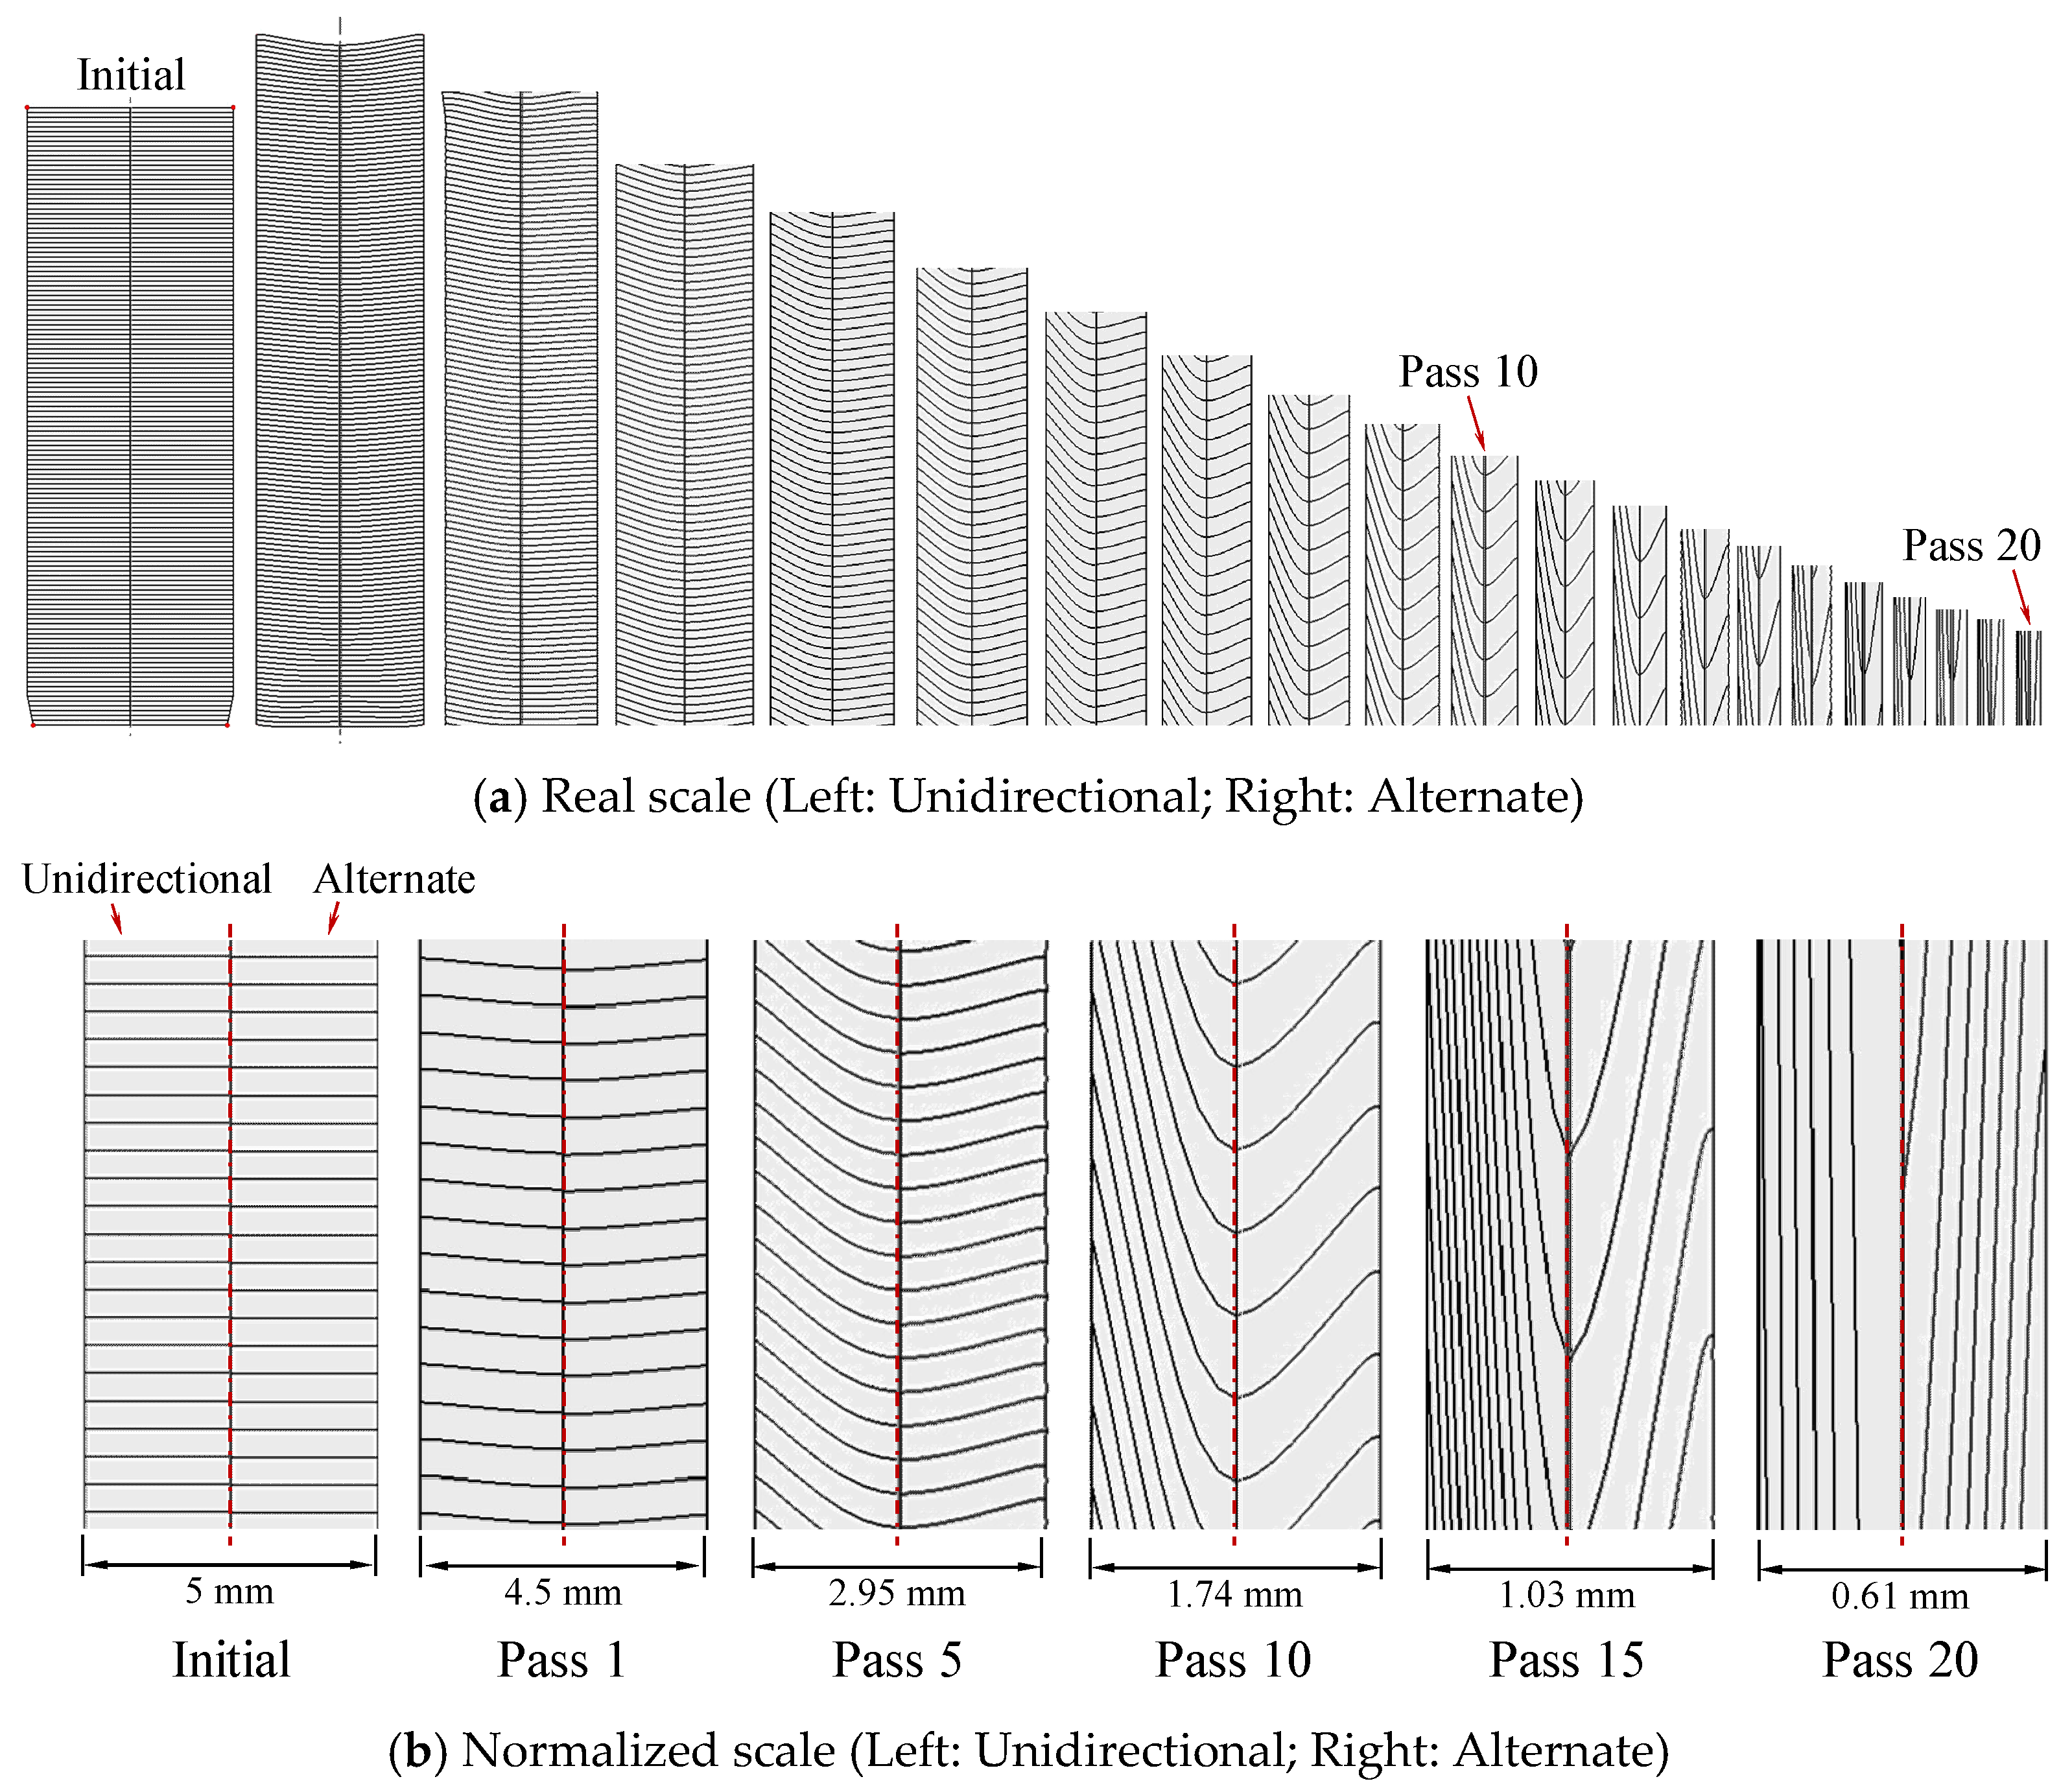
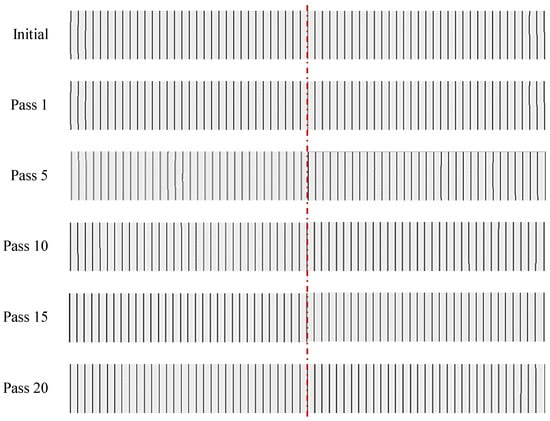
Figure 10 shows the initial shape, the deformed shape after each pass, and the HVMFLs. There is some difficulty in comparing the actual sizes in Figure 10a because of the significantly large total reduction in area. The material and HVMFLs were thus uniformly expanded so that the radii at the outermost nodes matched the radius of the initial material, and the change in normalized HVMFLs was visualized, as shown in Figure 10b.
Figure 10.
Comparison of HVMFLs between the unidirectional (Left) and alternate (Right) drawings.
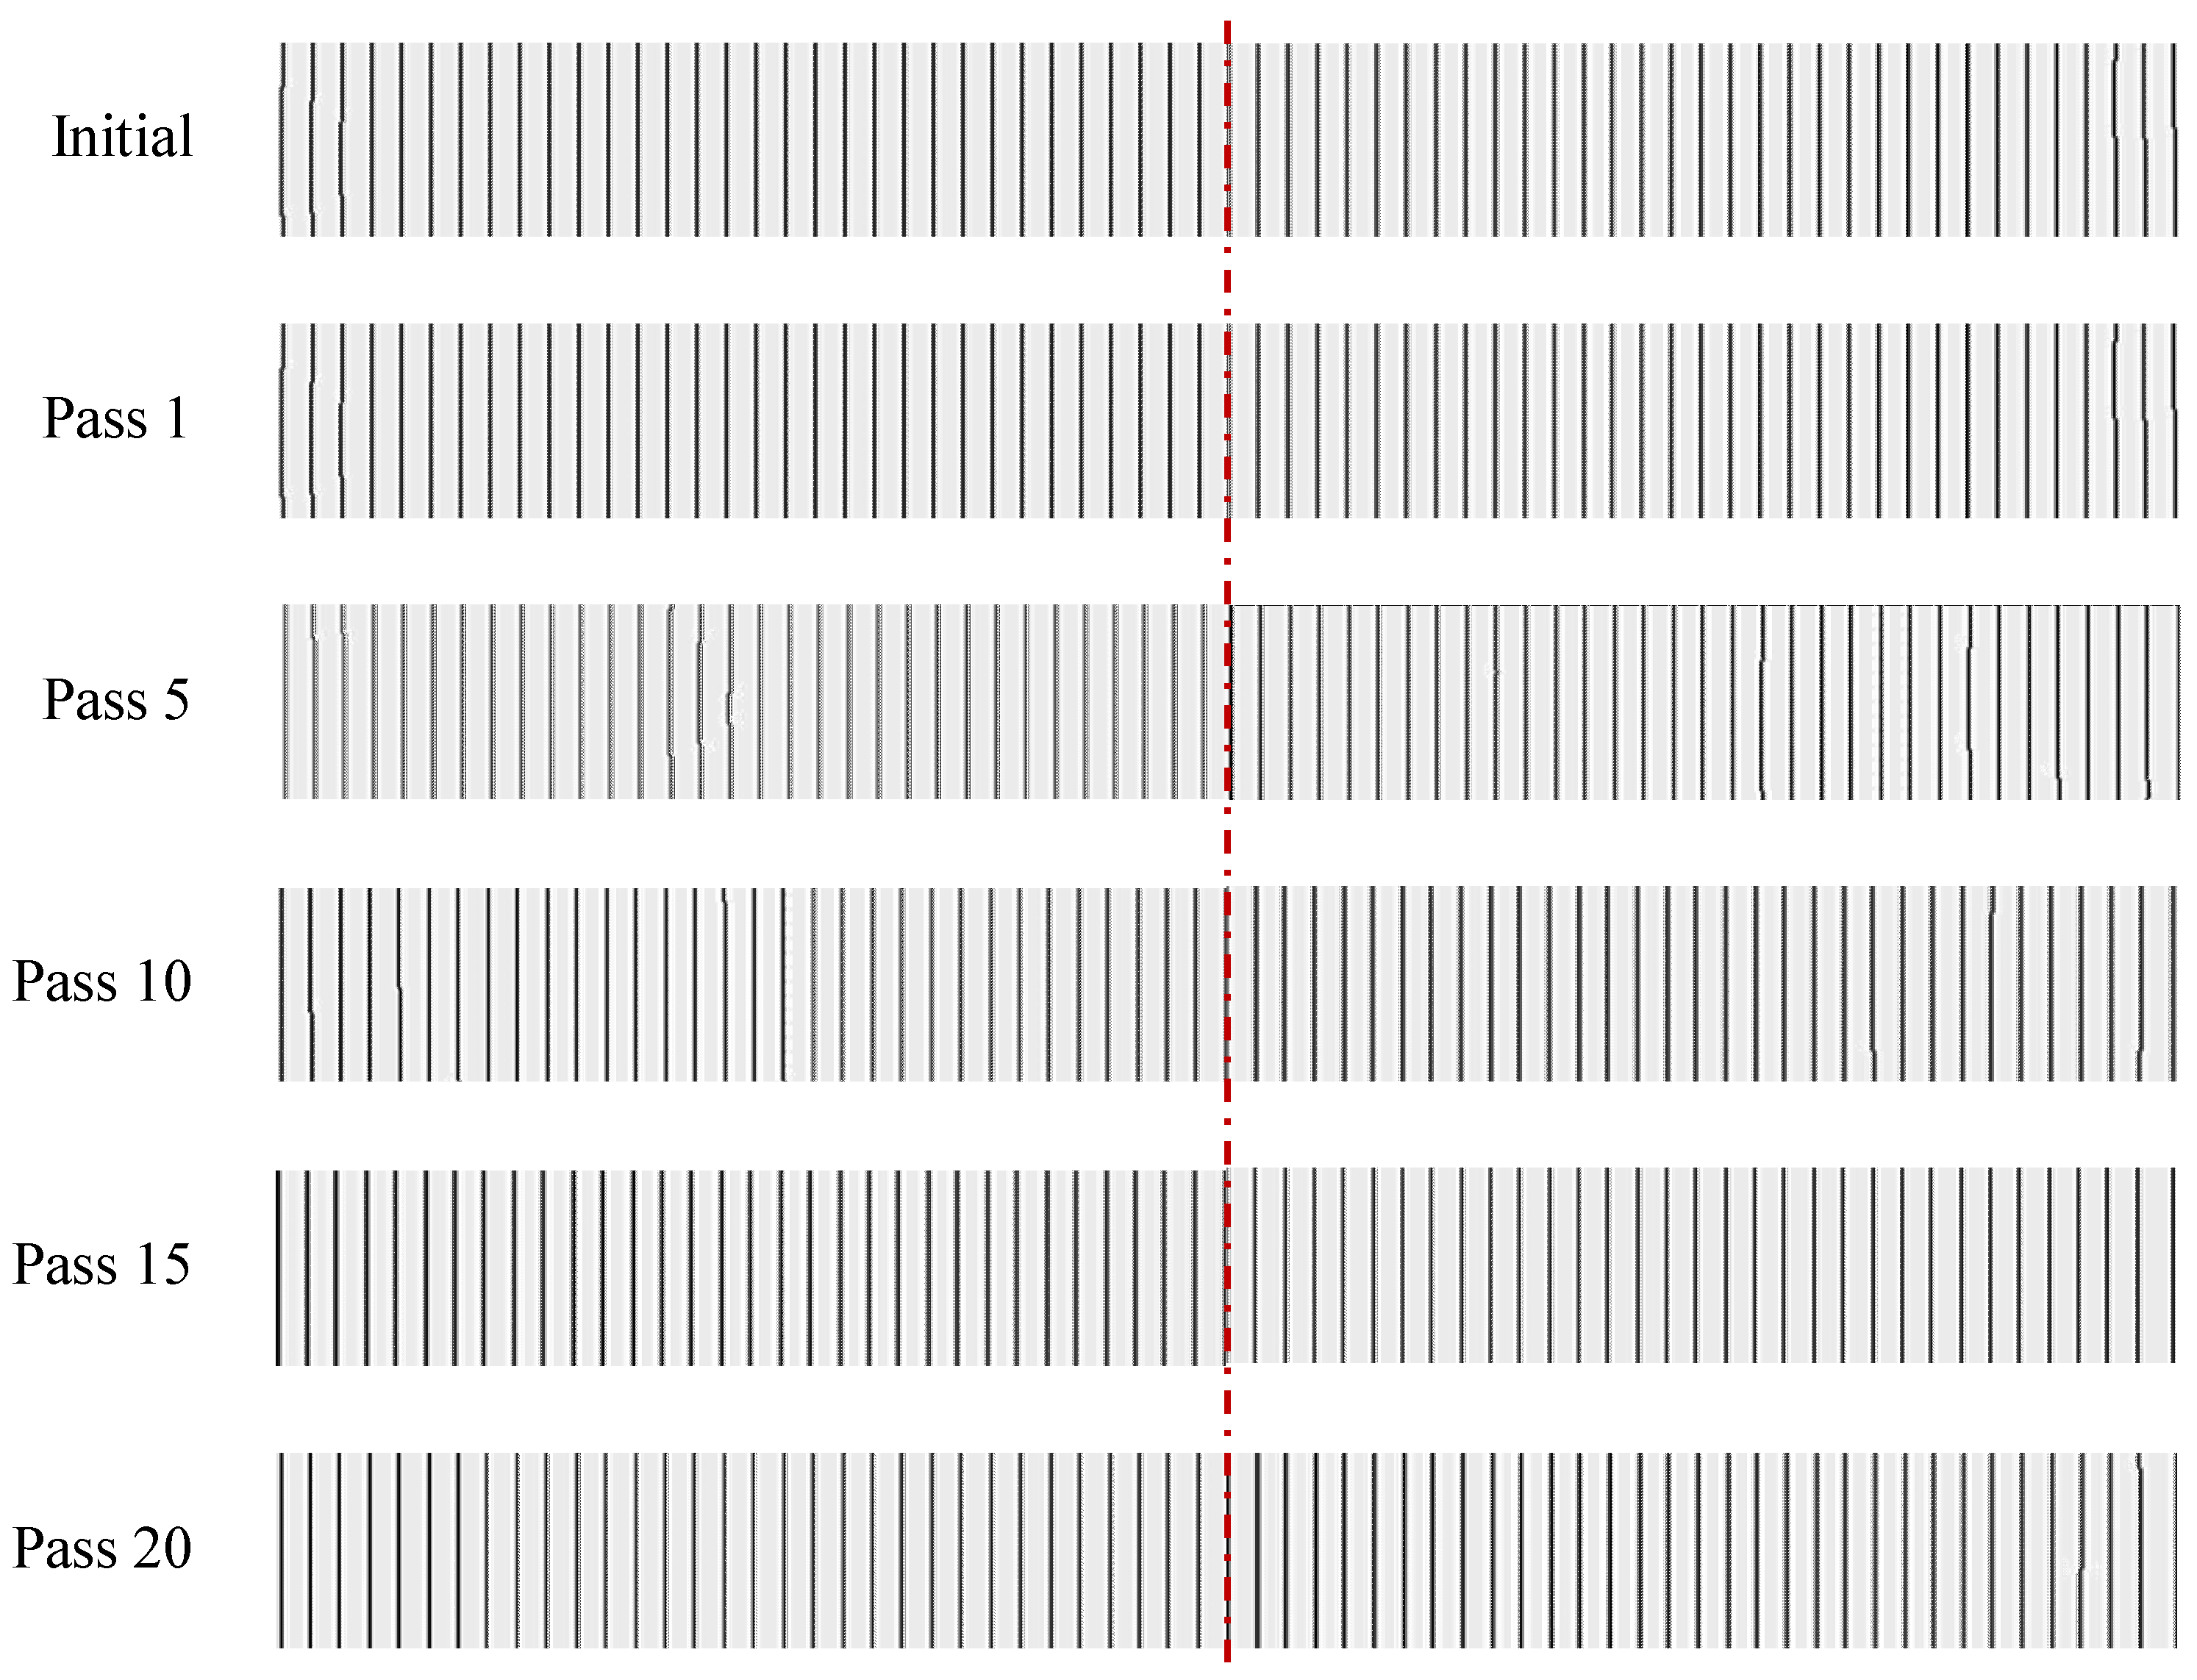
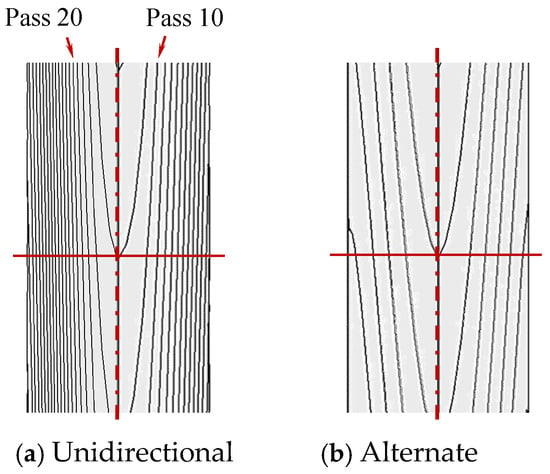
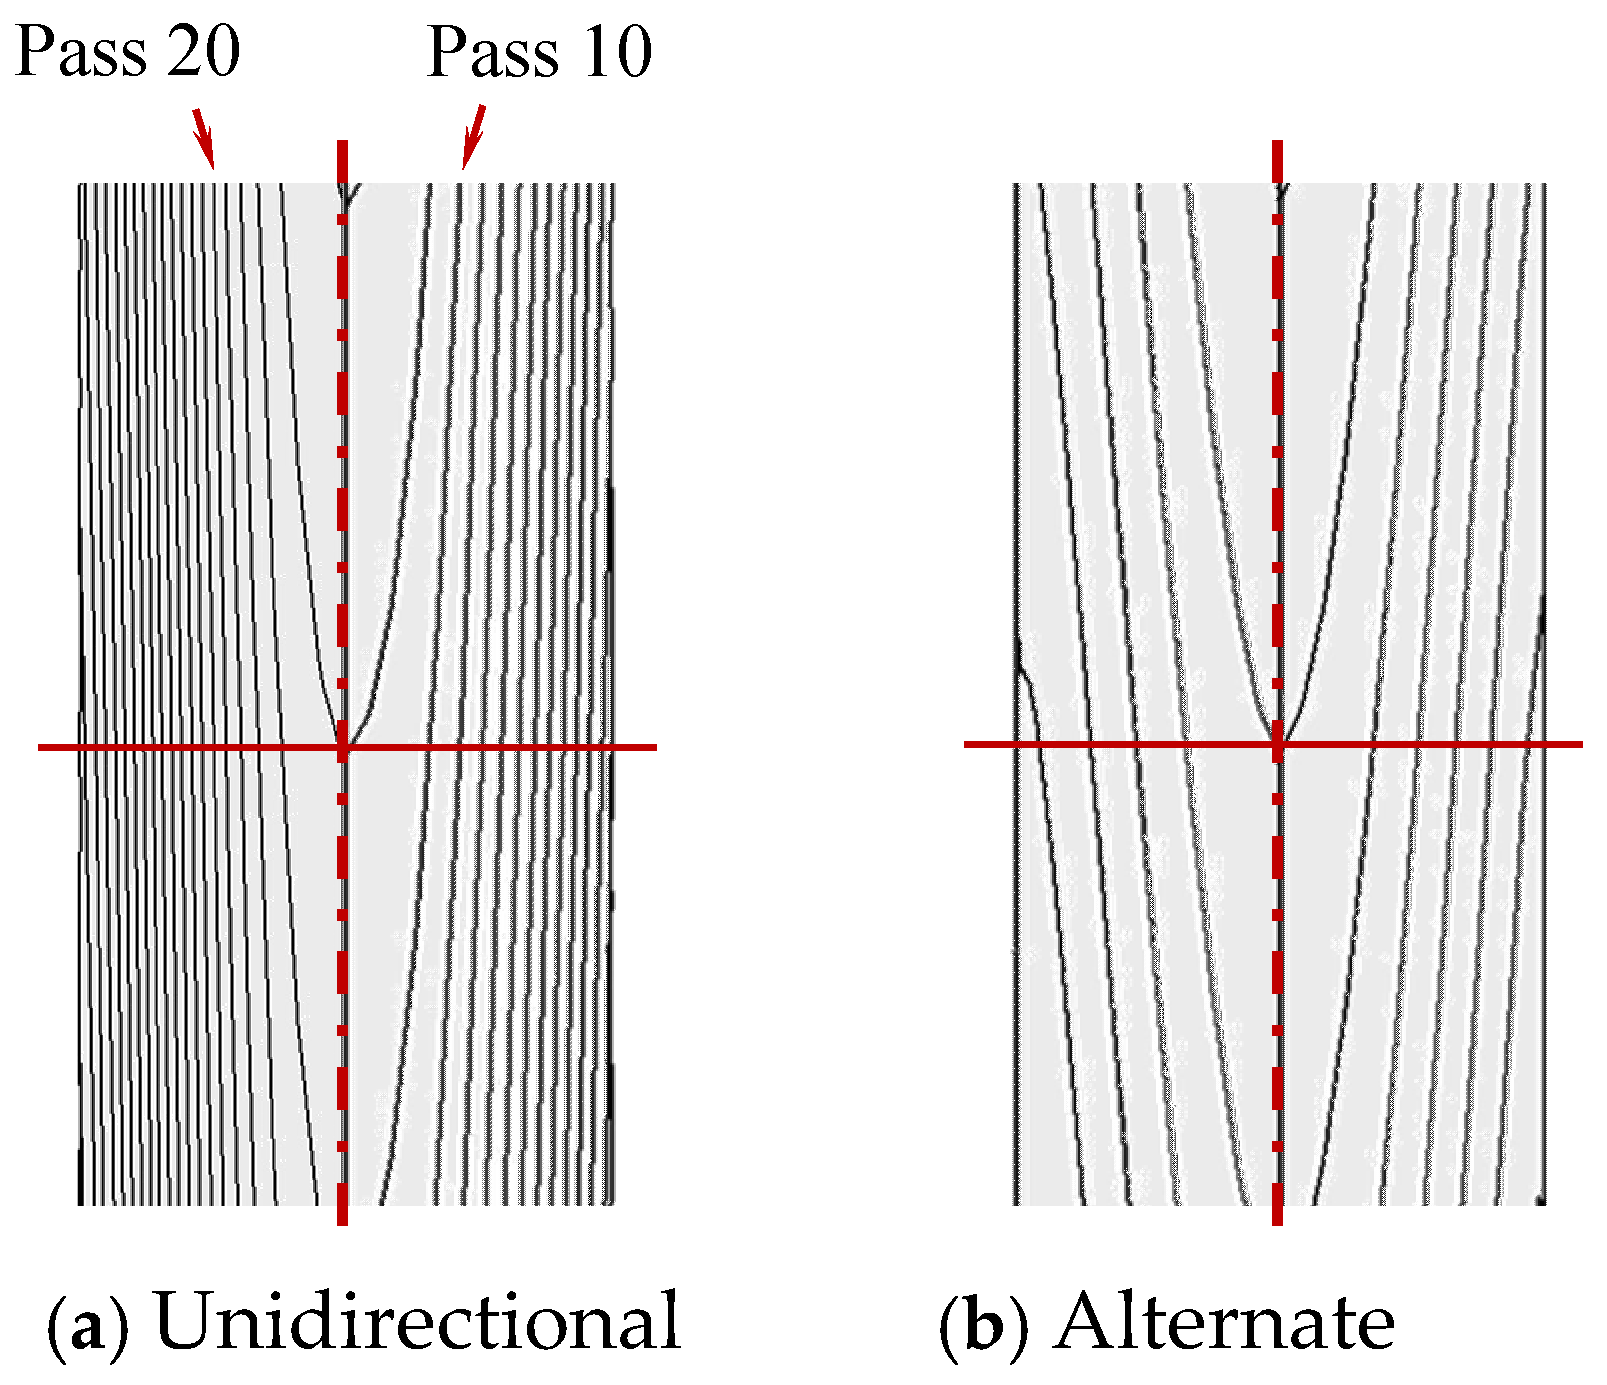
Figure 11 shows the change in the actual metal flow lines with the same initial r-coordinates. The actual metal flow lines formed during the manufacturing process can be visualized by etching the polished specimen. On the contrary, the horizontal metal flow lines in Figure 10 are virtual metal flow lines and do not exist. In other words, Figure 10 is HVMFL for confirming and comparing the FE predictions, and it cannot be visualized by etching. Of course, HVMFL may affect the quality of the drawn material and can be a process design target.
Figure 11.
Comparison of detailed vertical metal flow lines between the unidirectional (Left) and alternate (Right) drawings. The chain line indicates the line of symmetry.
As shown in Figure 10, the HVMFL shows a significant change, while the longitudinal metal flow lines in Figure 11 are the same as the result of uniform shrinkage. The change in HVMFL appears to accelerate as the strain increases because the strain is superimposed as the pass increases. Notably, the extreme deformation of HVMFL occurring during the drawing process can be imagined from the shape of the grown central fracture defect, as can be observed in the cross-section of a drawn copper wire in Ref. [53]. The HVMFLs may be important for product quality, including strength and lifespan.
In the case of unidirectional drawing, extreme deformation of the HVMFL occurs, as shown in Figure 10, whereas relatively mild deformation of the HVMFL occurs in the case of alternate drawing.
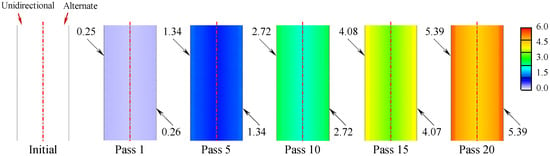
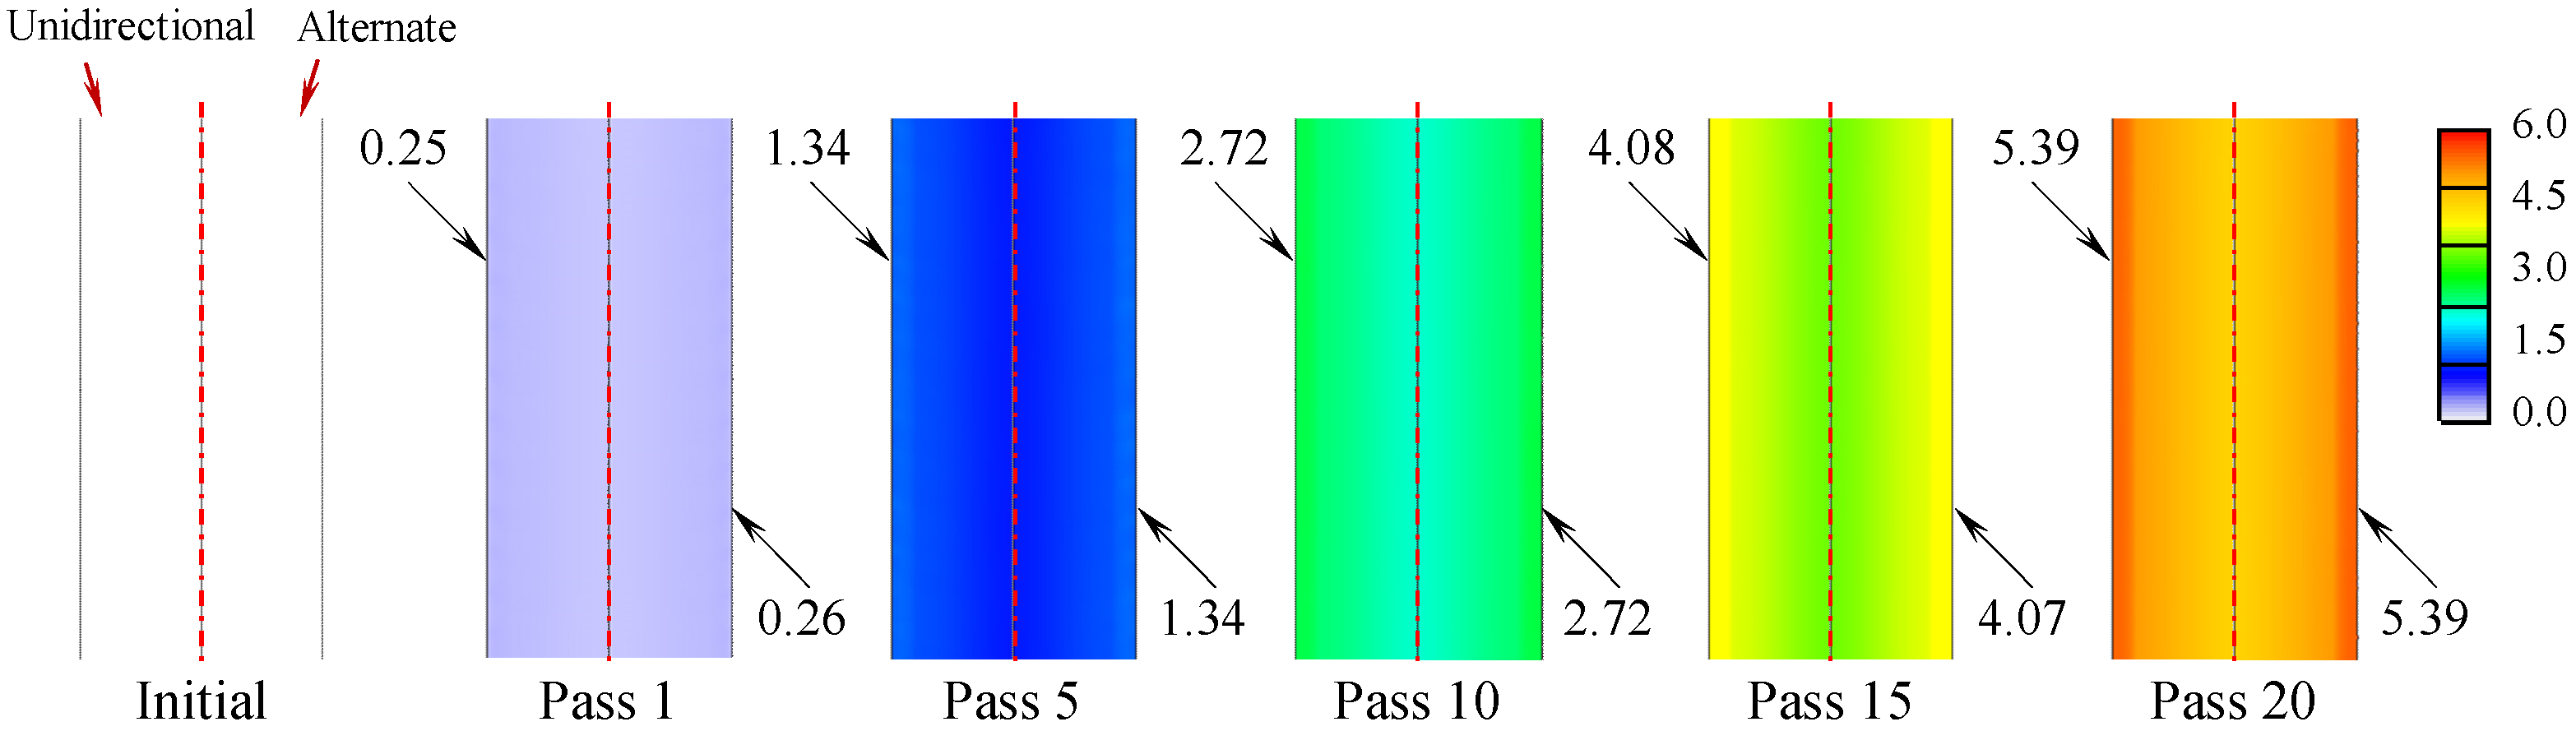
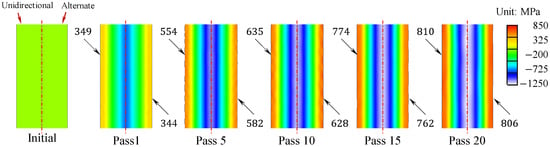
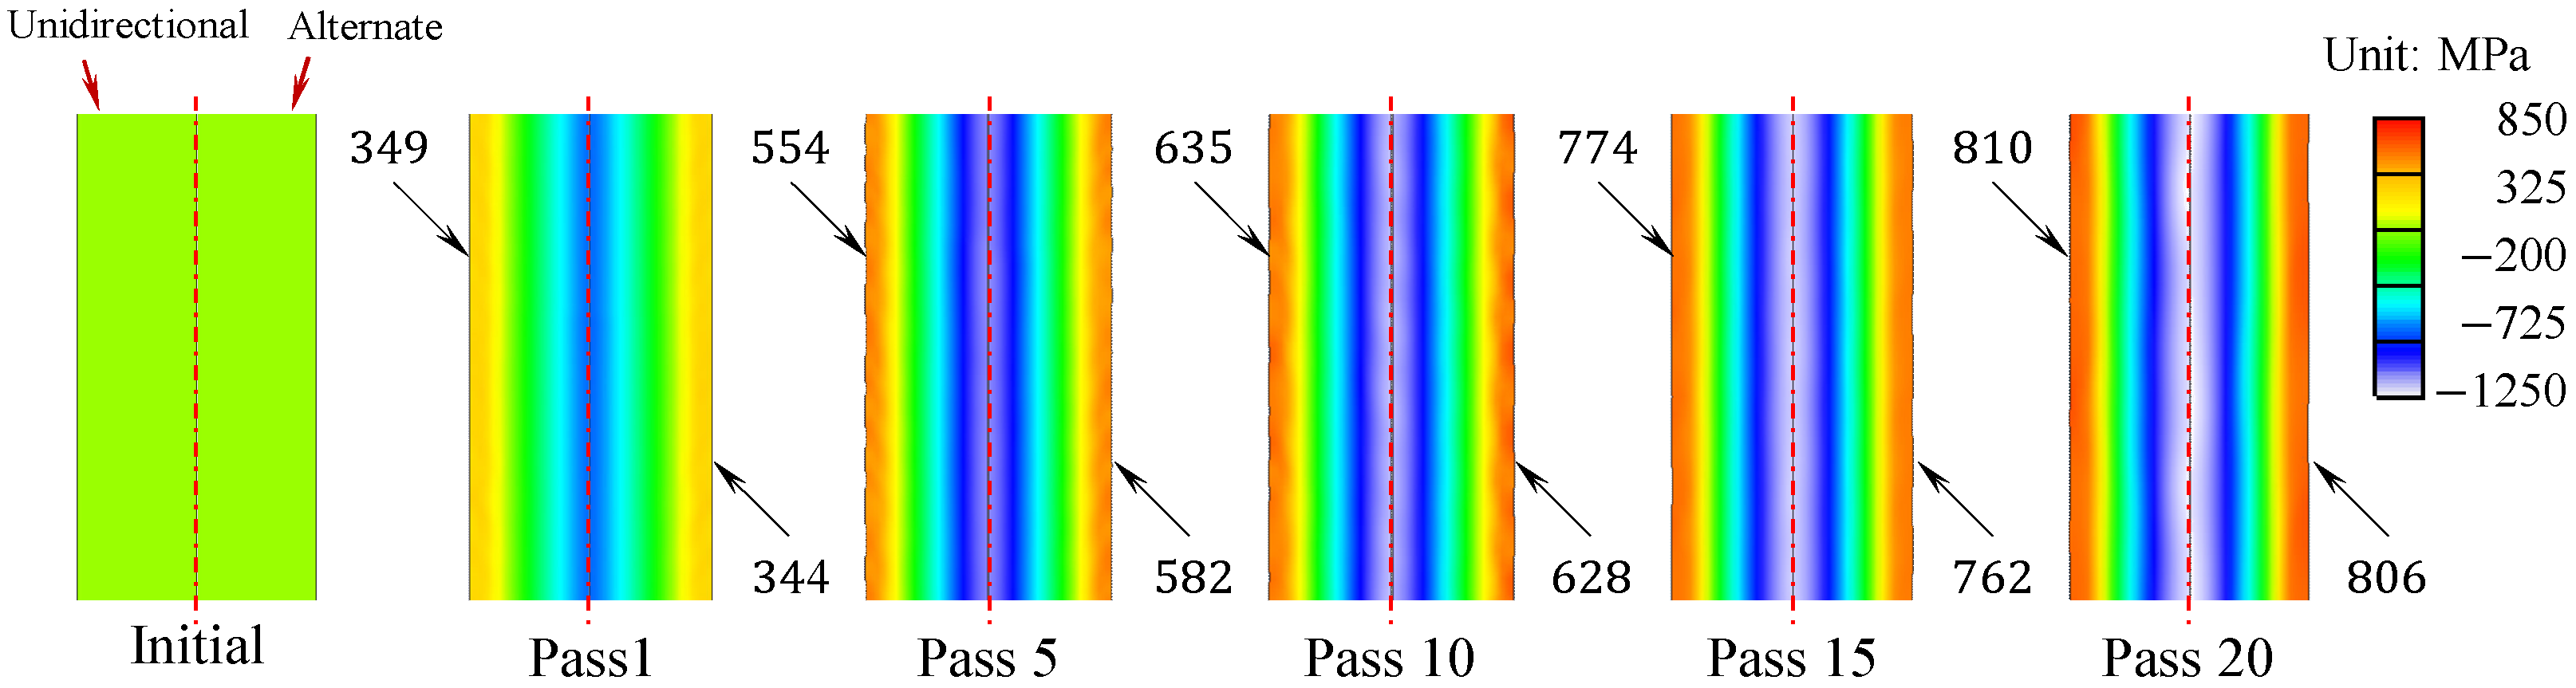
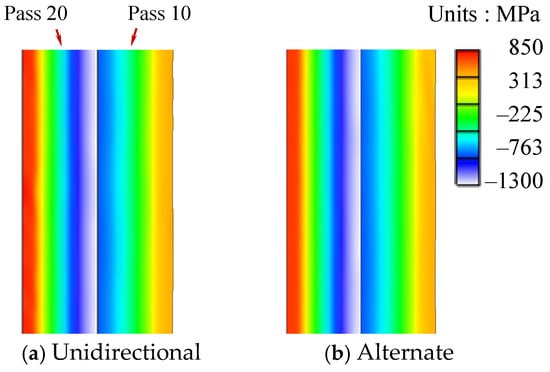
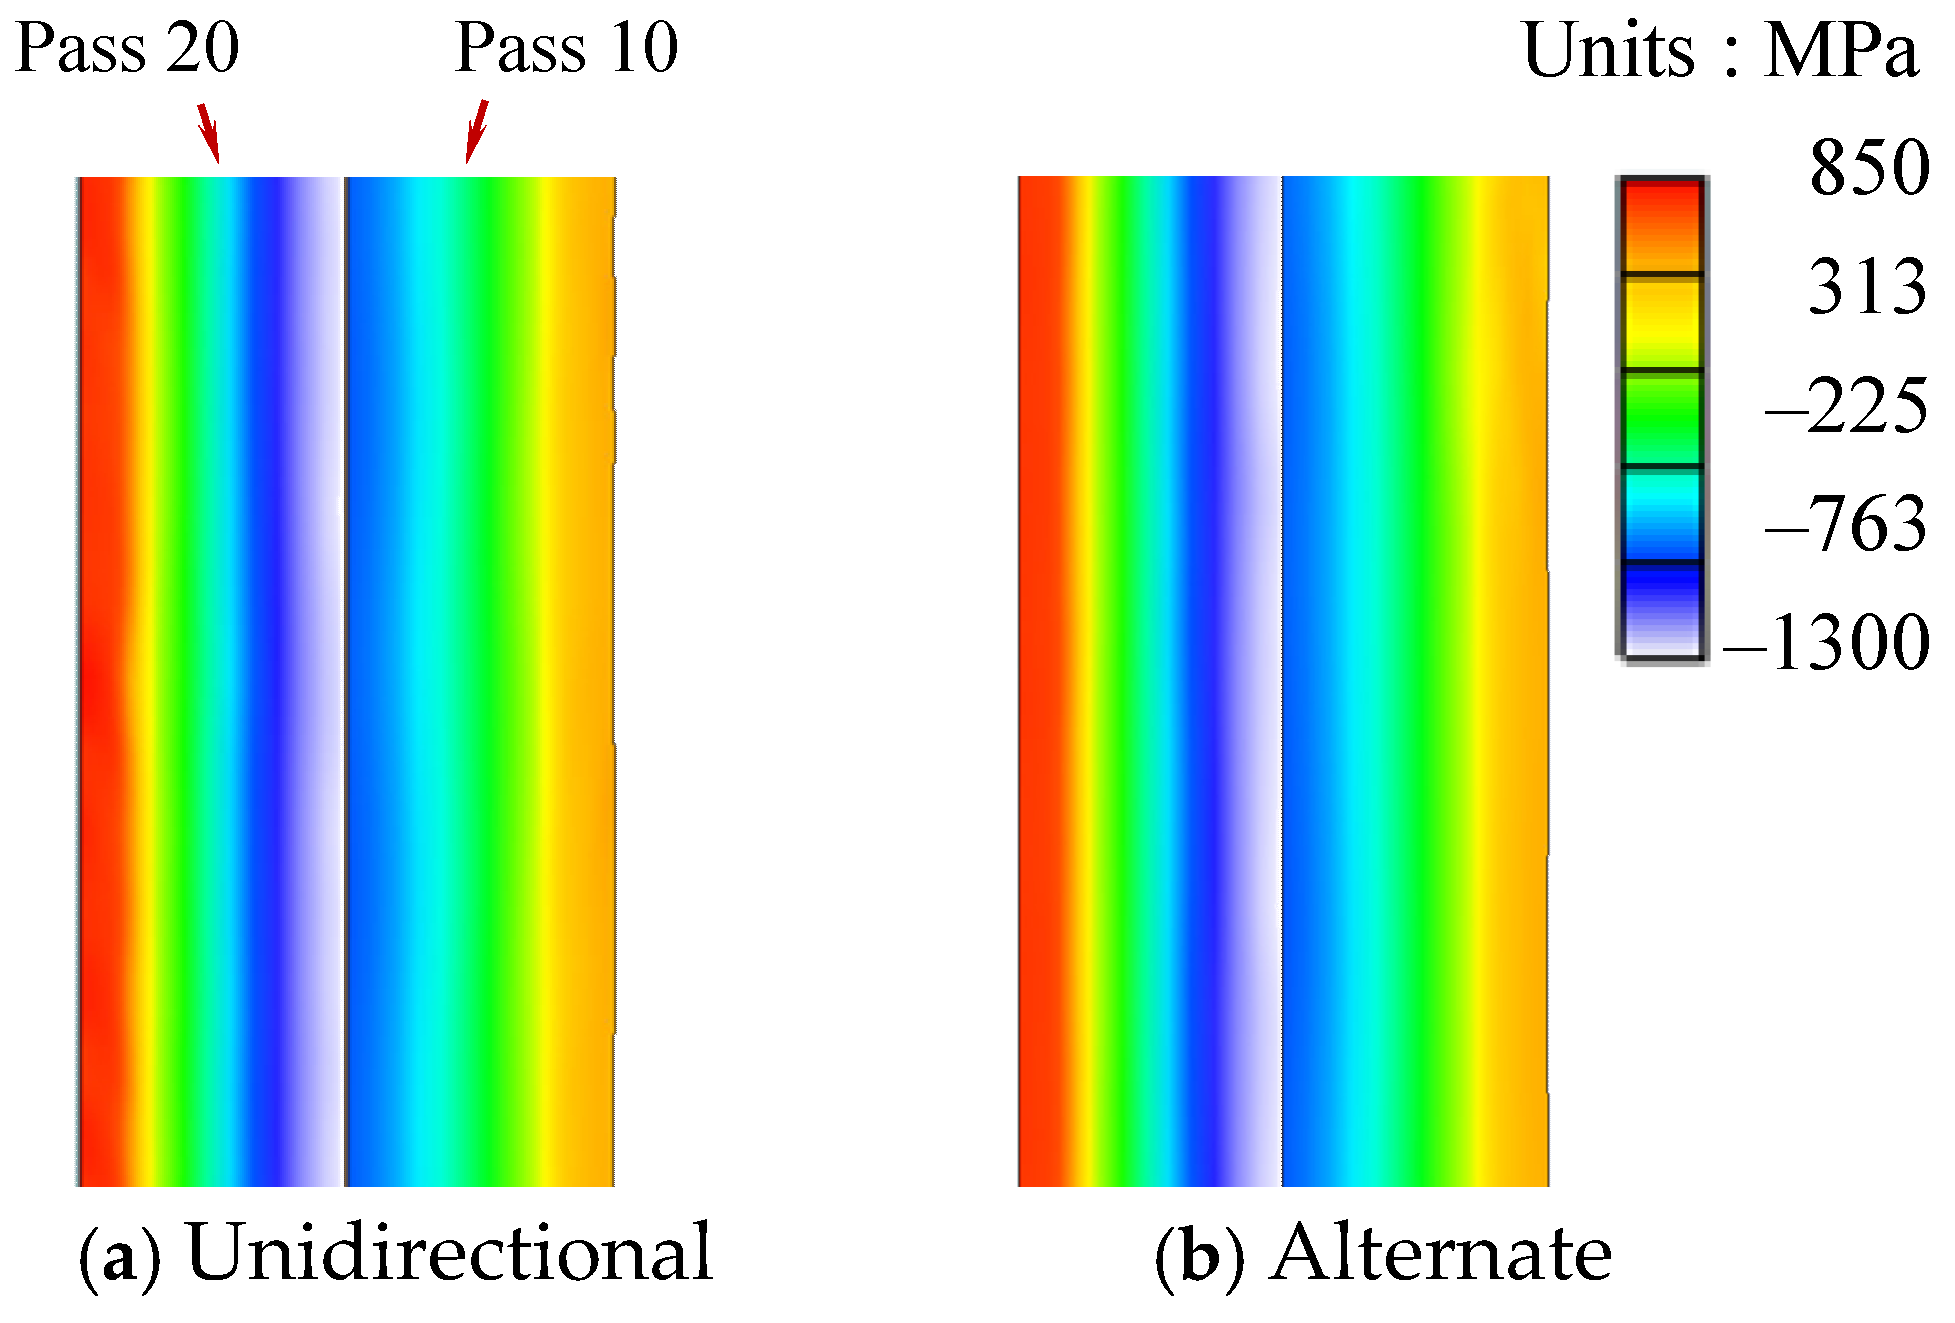
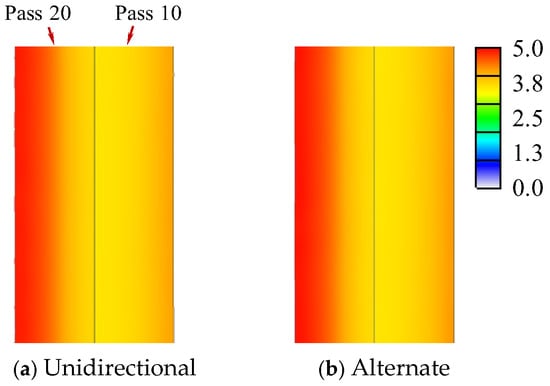
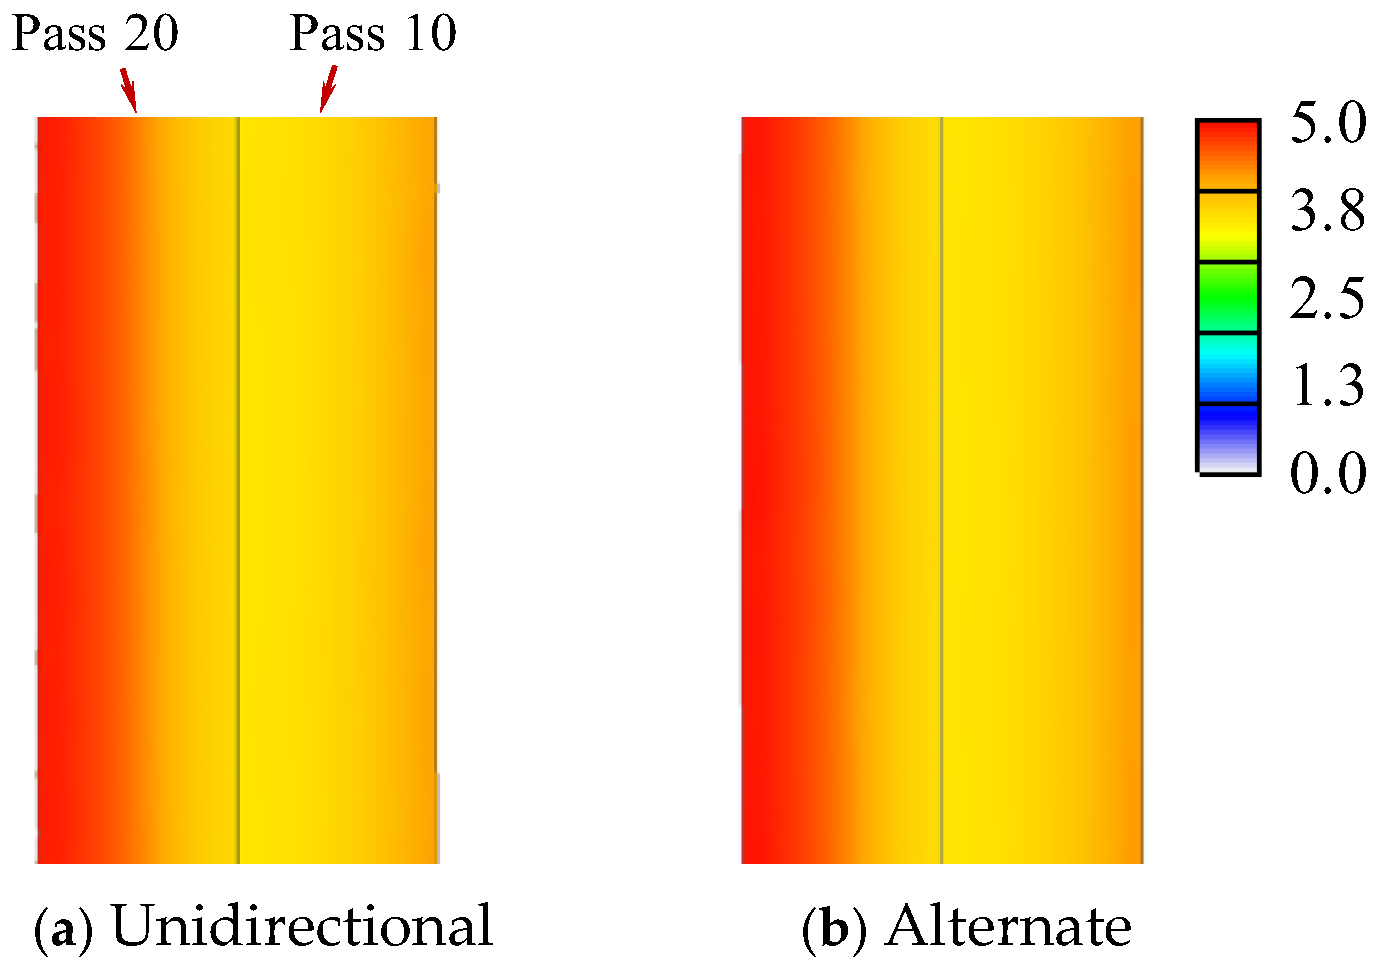
As shown in Figure 12 for the effective strain and in Figure 13 for the axial residual stress component, the influence of the history-dependent variable is not significant in either the unidirectional or the alternate drawing processes. In addition, the minimum and maximum effective strains of the final drawing product are 4.58 and 5.47, respectively, with a relatively small difference between them. On the other hand, the axial residual stress component has a minimum value at the inner diameter and a maximum value at the outer diameter of −1180 and 646 MPa, respectively, of which the absolute values certainly are very large. This excessive difference in residual stress can cause the drawn wire to bend, twist, or fracture even during post-processing, such as heat treatment, or during small disturbances in service. As mentioned above, multi-pass wire-drawing products exhibit distinct mechanical characteristics. This suggests that an optimal unidirectional and alternating combination process exists for wire stiffness, quality, and life.
Figure 12.
Comparison of effective strain between the unidirectional (Left) and alternate (Right) drawings.
Figure 13.
Comparison of axial residual stresses between the unidirectional (Left) and alternate (Right) drawings.
4.2. Effects of Major Parameters on HVMFL and Axial Residual Stress
4.2.1. Effect of Friction
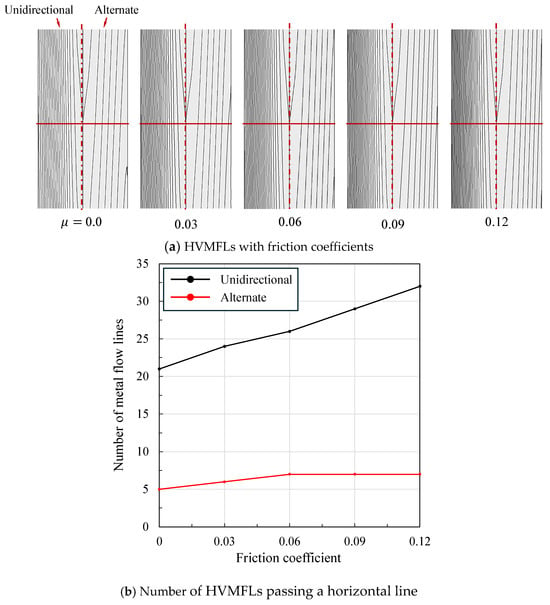
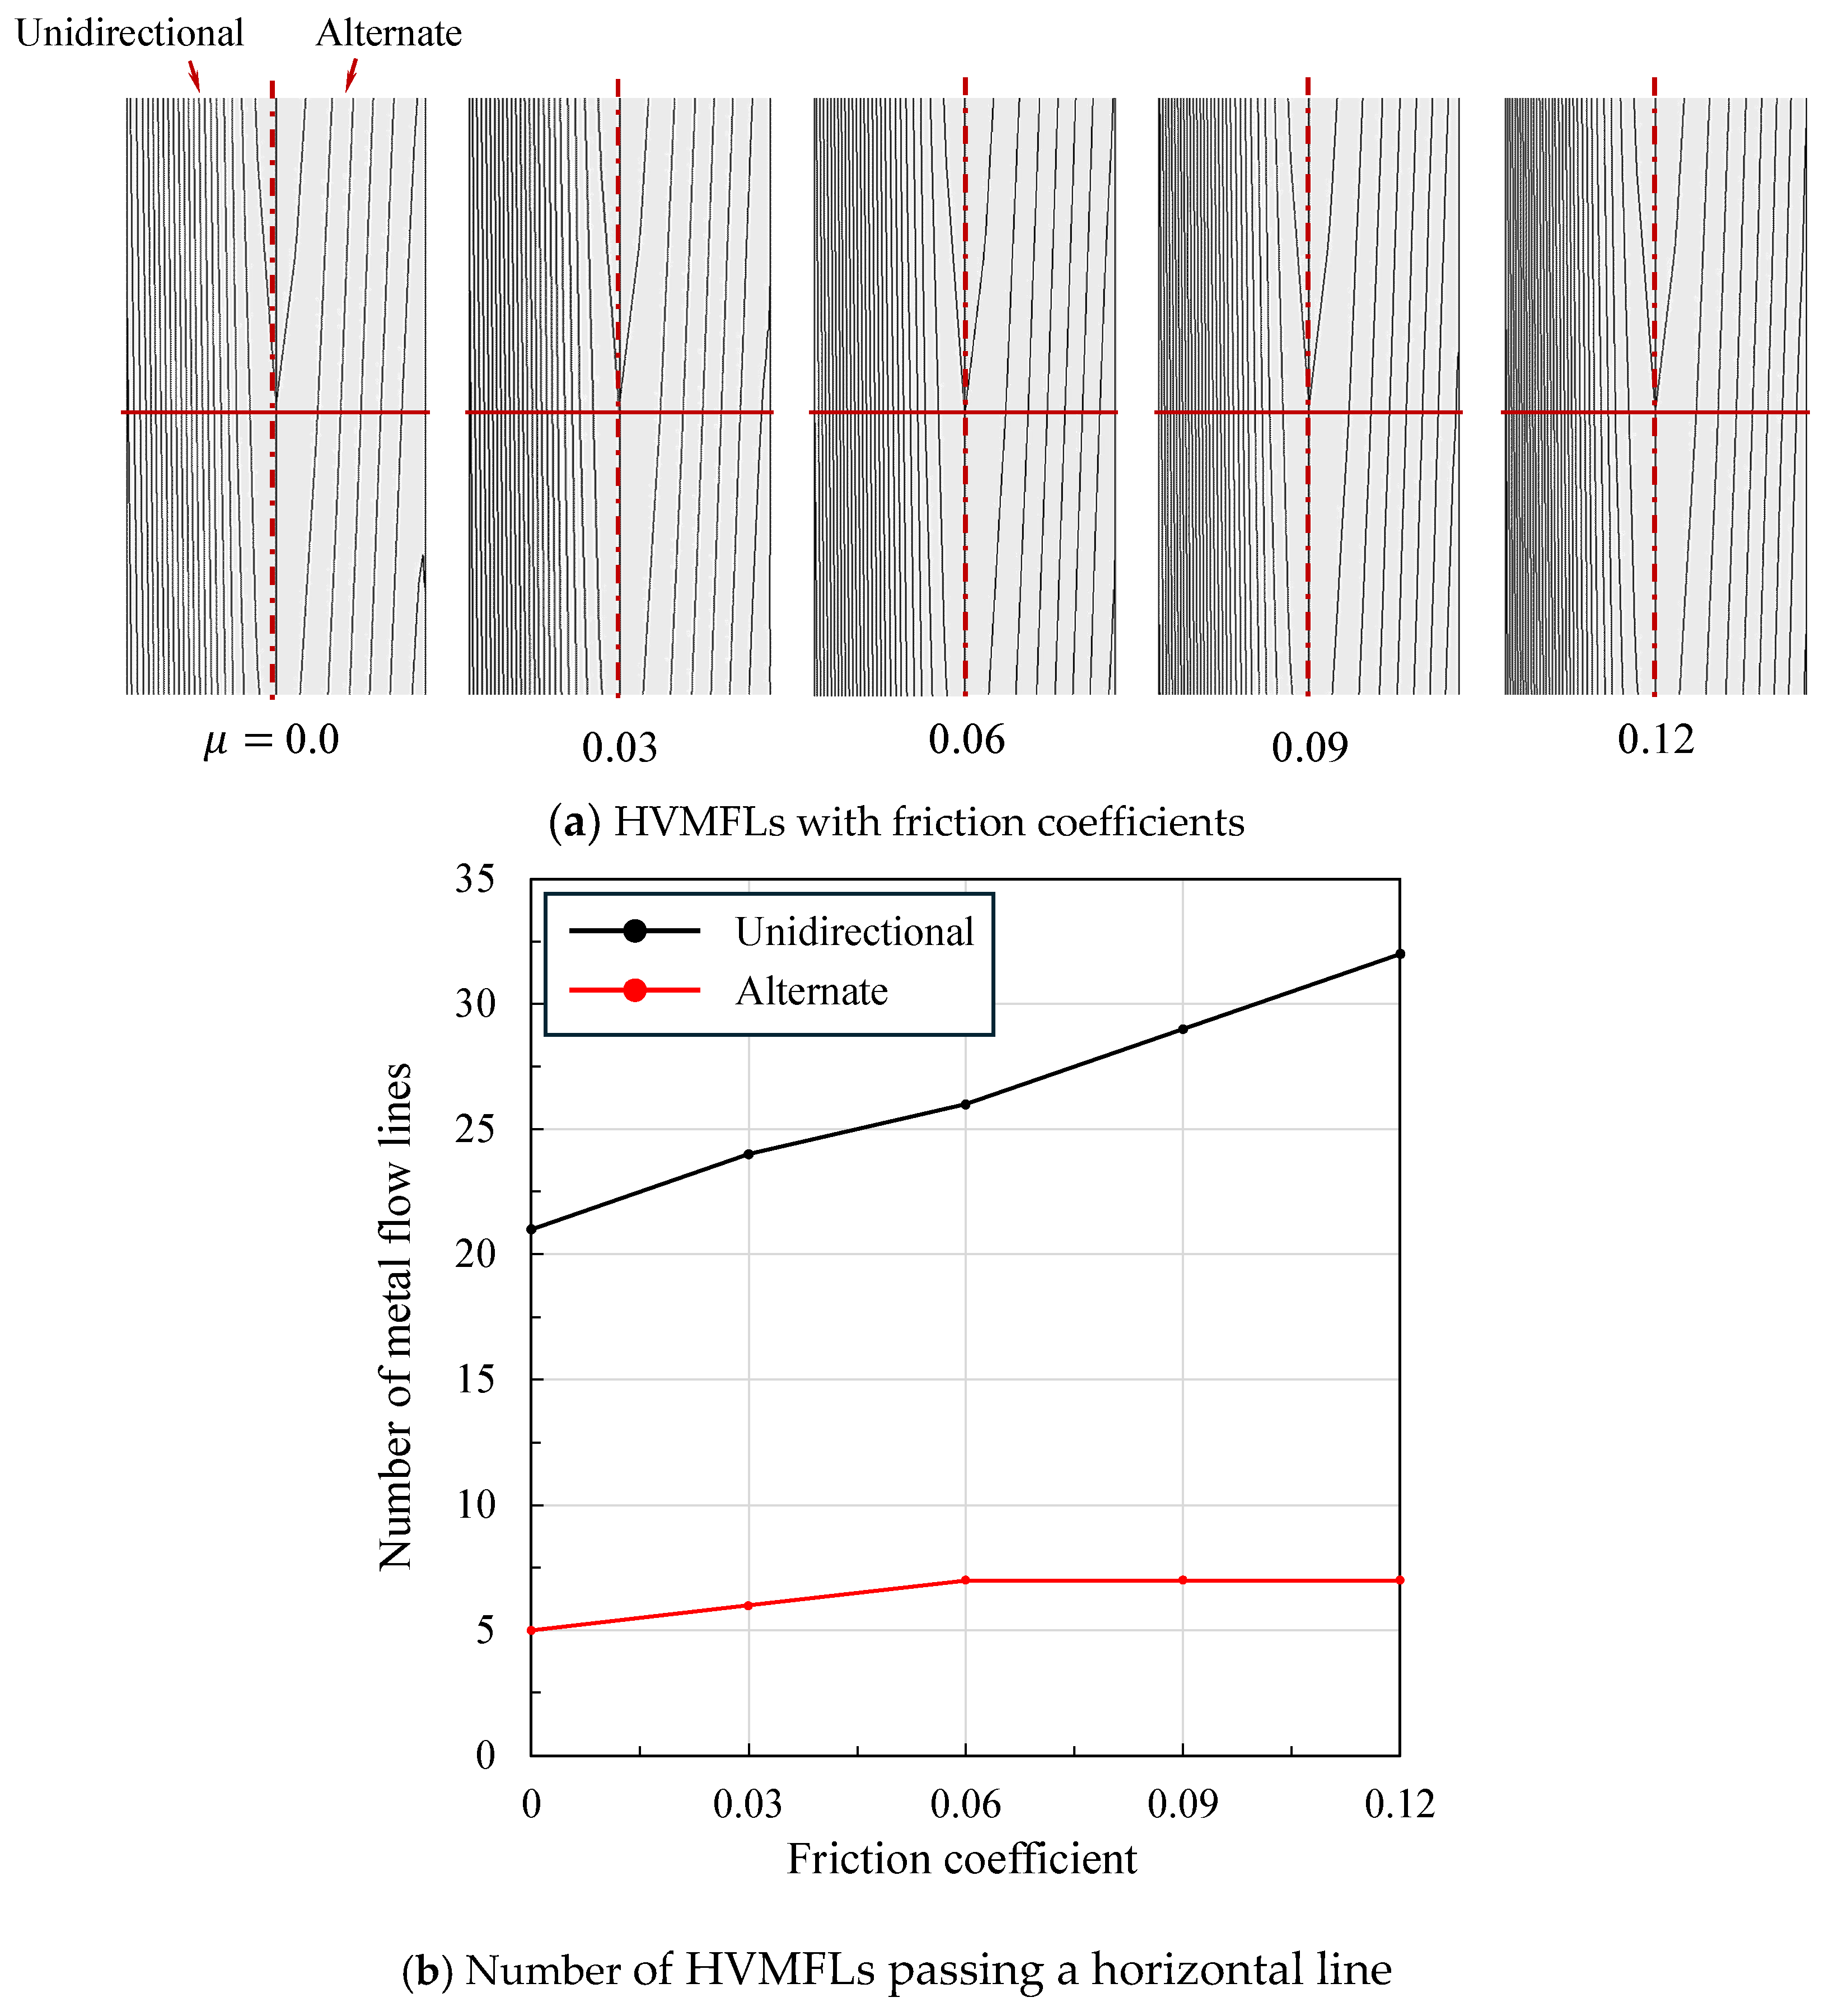
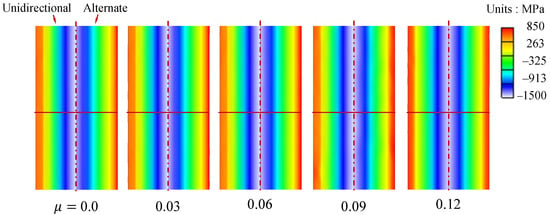
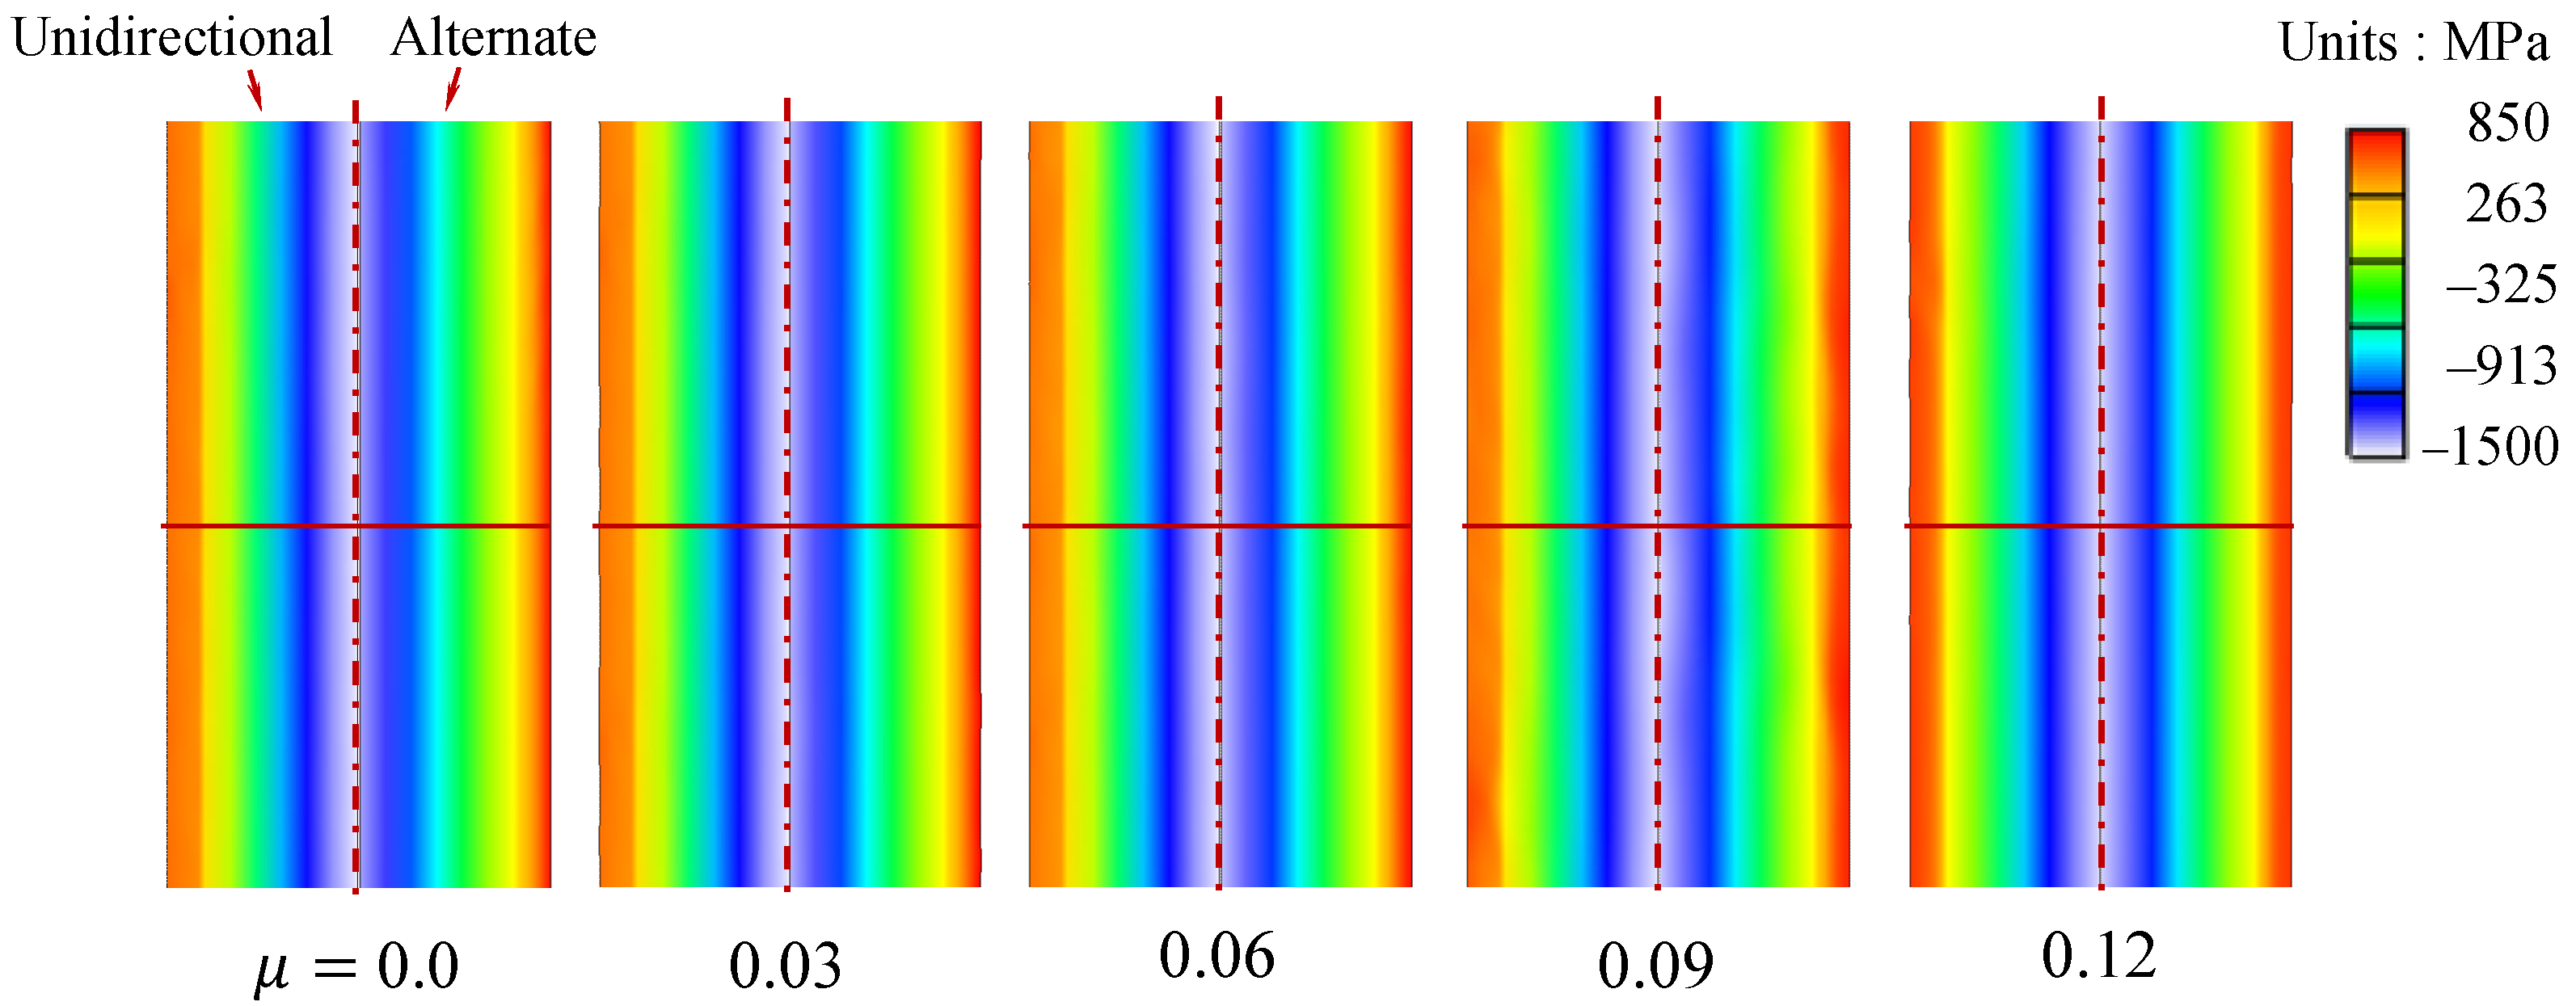
To investigate the effect of friction on the drawing process, FE analysis was performed with friction coefficients of 0.0, 0.03, 0.06, 0.09, and 0.12, while holding all other conditions constant. HVMFLs are compared in Figure 14a. It can be seen that the HVMFL of the unidirectional drawing process on the left is much denser than that of the alternate drawing process on the right. The number of HVMFLs that meet the same horizontal line according to the change in the friction coefficient for the two methods is compared in Figure 14b. This number increases continuously in the unidirectional case as the friction coefficient increases, whereas it changes little with the friction coefficient in the alternate drawing case. The change in axial residual stress due to friction is shown in Figure 15. As shown in this figure, in both unidirectional and alternating drawings, the greater the friction, the greater the increase in axial residual stress, but the quantitative effect remains minimal.
Figure 14.
Effect of friction on HVMFL.
Figure 15.
Effect of friction coefficient on axial residual stress.
4.2.2. Effect of Semi-Cone Angle
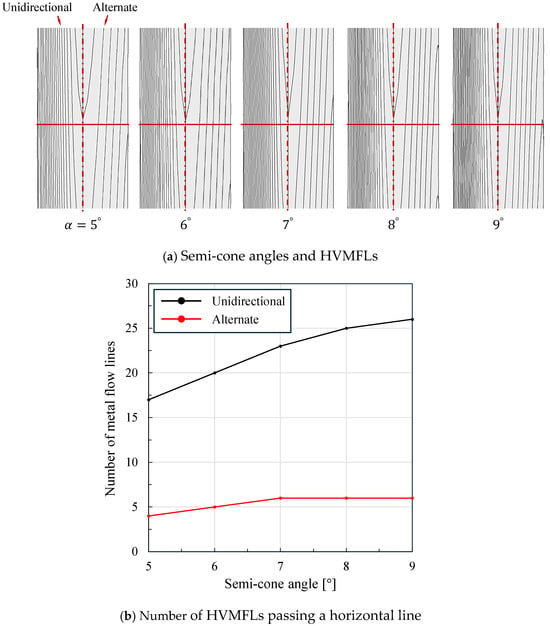
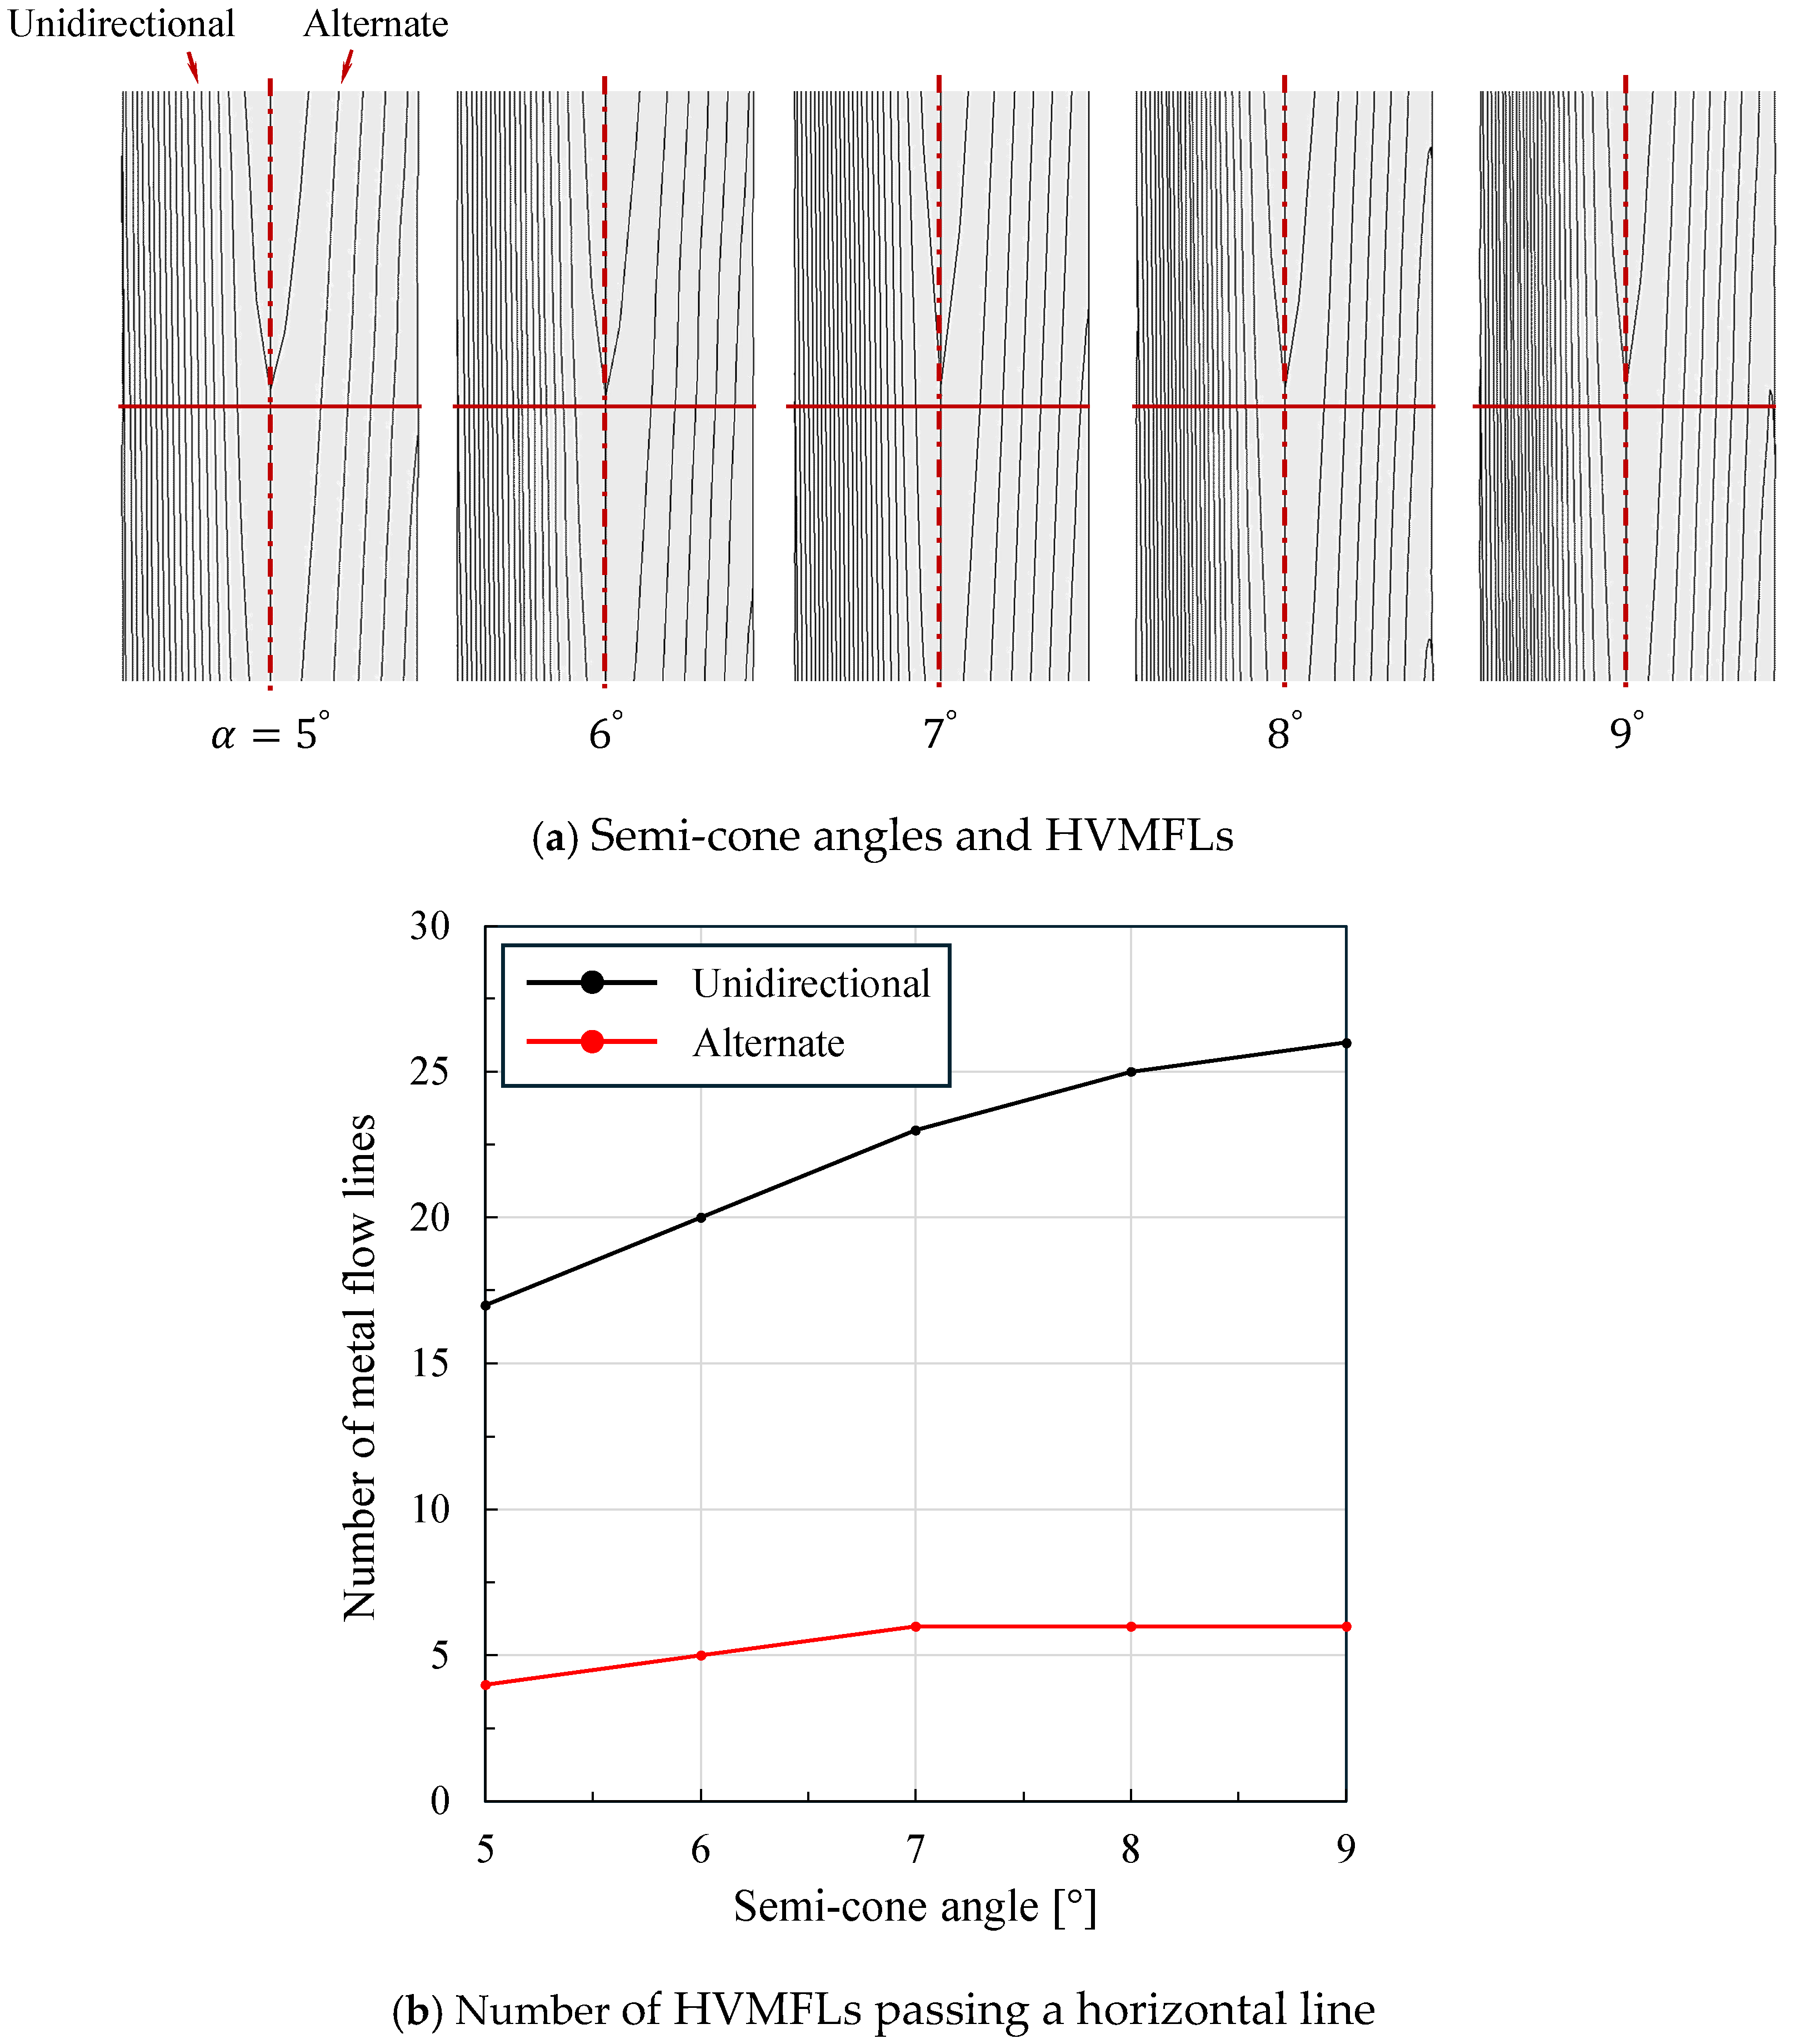
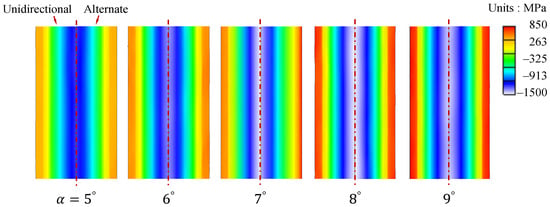
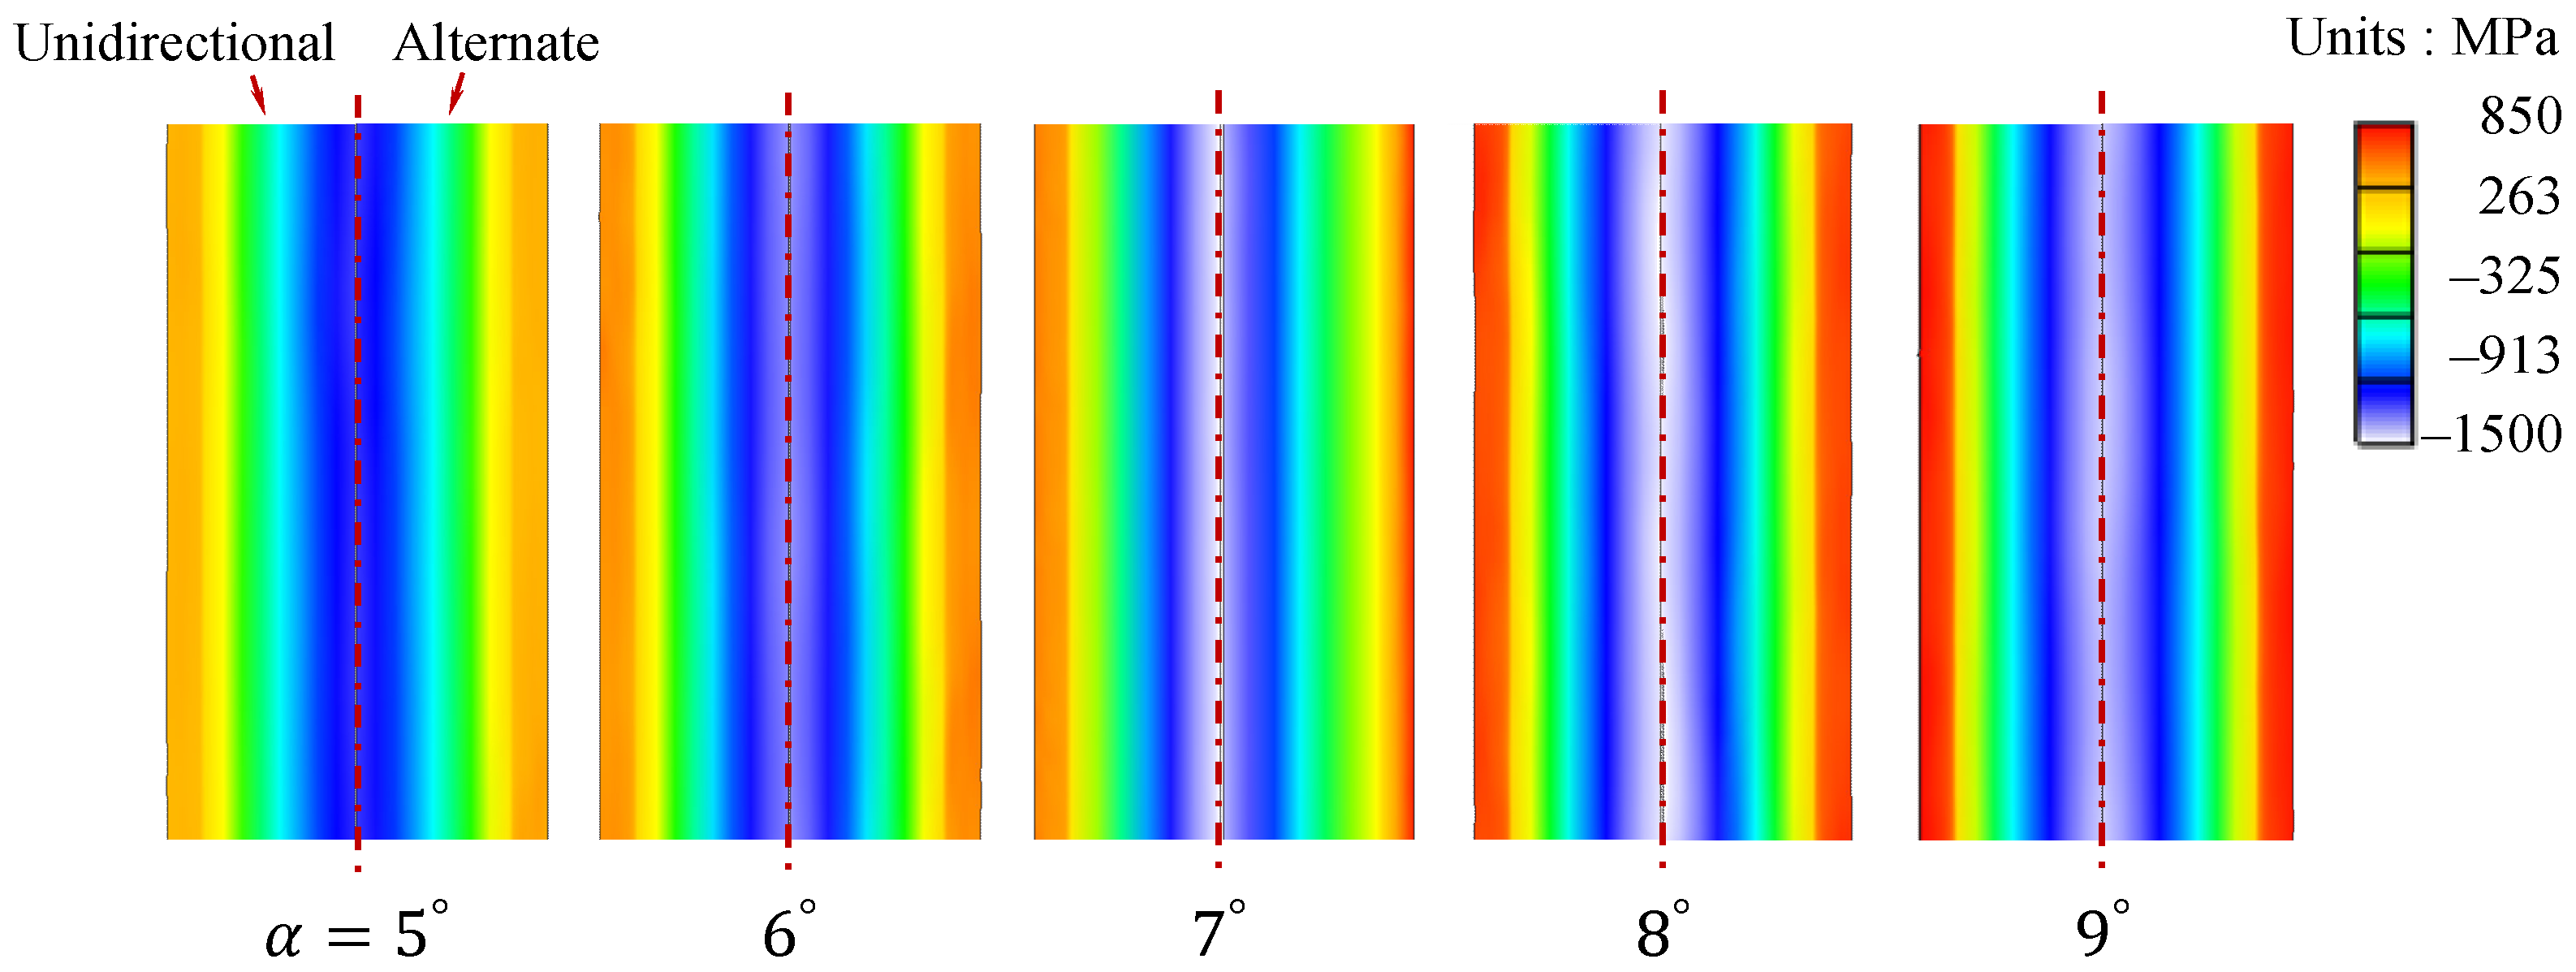
To analyze the effect of the semi-cone angle on the drawing process, FE analyses were conducted for semi-cone angles of 5°, 6°, 7°, 8°, and 9° under the same conditions, except for the semi-cone angle. Figure 16a compares the FE predictions of HVMFL according to the semi-cone angle. It can be seen that the HVMFL of the unidirectional drawing process on the left is much denser than that of the alternate drawing process on the right. The number of HVMFLs that meet the same horizontal line as a function of the semi-cone angle change for the two drawing methods is compared in Figure 16b. As the semi-cone angle increases, this number continuously increases in the unidirectional case. In contrast, the change in this number according to the semi-cone angle is relatively small in the alternate drawing case.
Figure 16.
Effect of semi-cone angle on HVMFL.
Unlike friction, the effect of the semi-cone angle on the axial residual stress is apparent, as shown in Figure 17. The smaller the semi-cone angle, the smaller the maximum value of the axial residual stress. This phenomenon occurs in both the unidirectional and the alternate drawings.
Figure 17.
Effect of semi-cone angle on axial residual stress.
4.2.3. Effect of Reduction in Area
To determine the effect of the reduction in area, FE analyses of 10-pass and 20-pass drawing processes were performed under the same initial material radius, final product radius (0.4 mm), and semi-cone angle. The reference process follows the pass design in Section 4.1, and the comparison process is a 10-pass process with a reduction in area of 16.7% per pass (8.8% for the 20-pass process). Other conditions are summarized in Table 1. Figure 18 compares FE predictions of HVMFL as a function of area reduction. In the case of the unidirectional drawing, the HVMFL of the 20-pass drawing process on the left is somewhat denser than that of the 10-pass drawing process on the right in Figure 18a. However, in the case of the alternate drawing in Figure 18b, the difference in deformation between the two HVMFLs is not significant. That is, as the number of passes decreased, the number of HVMFLs on the same horizontal line decreased from 18 to 11 in the unidirectional drawing process while increasing from 4 to 5 in the alternate drawing process.
Figure 18.
Comparison of HVMFLs according to the reduction in area.
As shown in Figure 19, the axial residual stress in both unidirectional and alternate drawings is sensitively affected by the decrease in the number of passes, i.e., the area reduction ratio. In the case of the unidirectional 20-pass drawing, the FE-predicted axial residual stresses at the surface and center were 771 and −1300 MPa, while they were 489 and −843 MPa in the case of the 10-pass drawing, respectively.
Figure 19.
Comparison of axial residual stress according to the reduction in area.
Figure 20 shows the distribution of effective strain as a function of reduction in area. It is shown that a decrease in the number of passes, that is, an increase in the reduction in area of each drawing pass, improves the strain homogeneity, which leads to a decrease in the axial residual stress in Figure 21.
Figure 20.
Comparison of effective strain according to the reduction in area.
Figure 21.
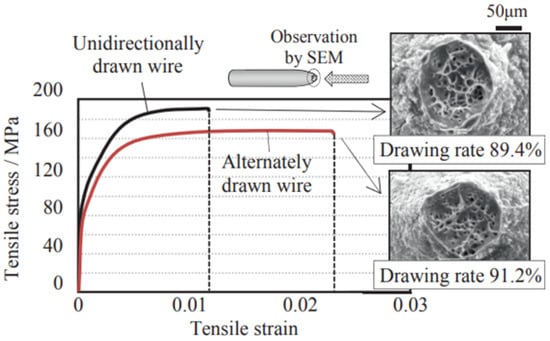
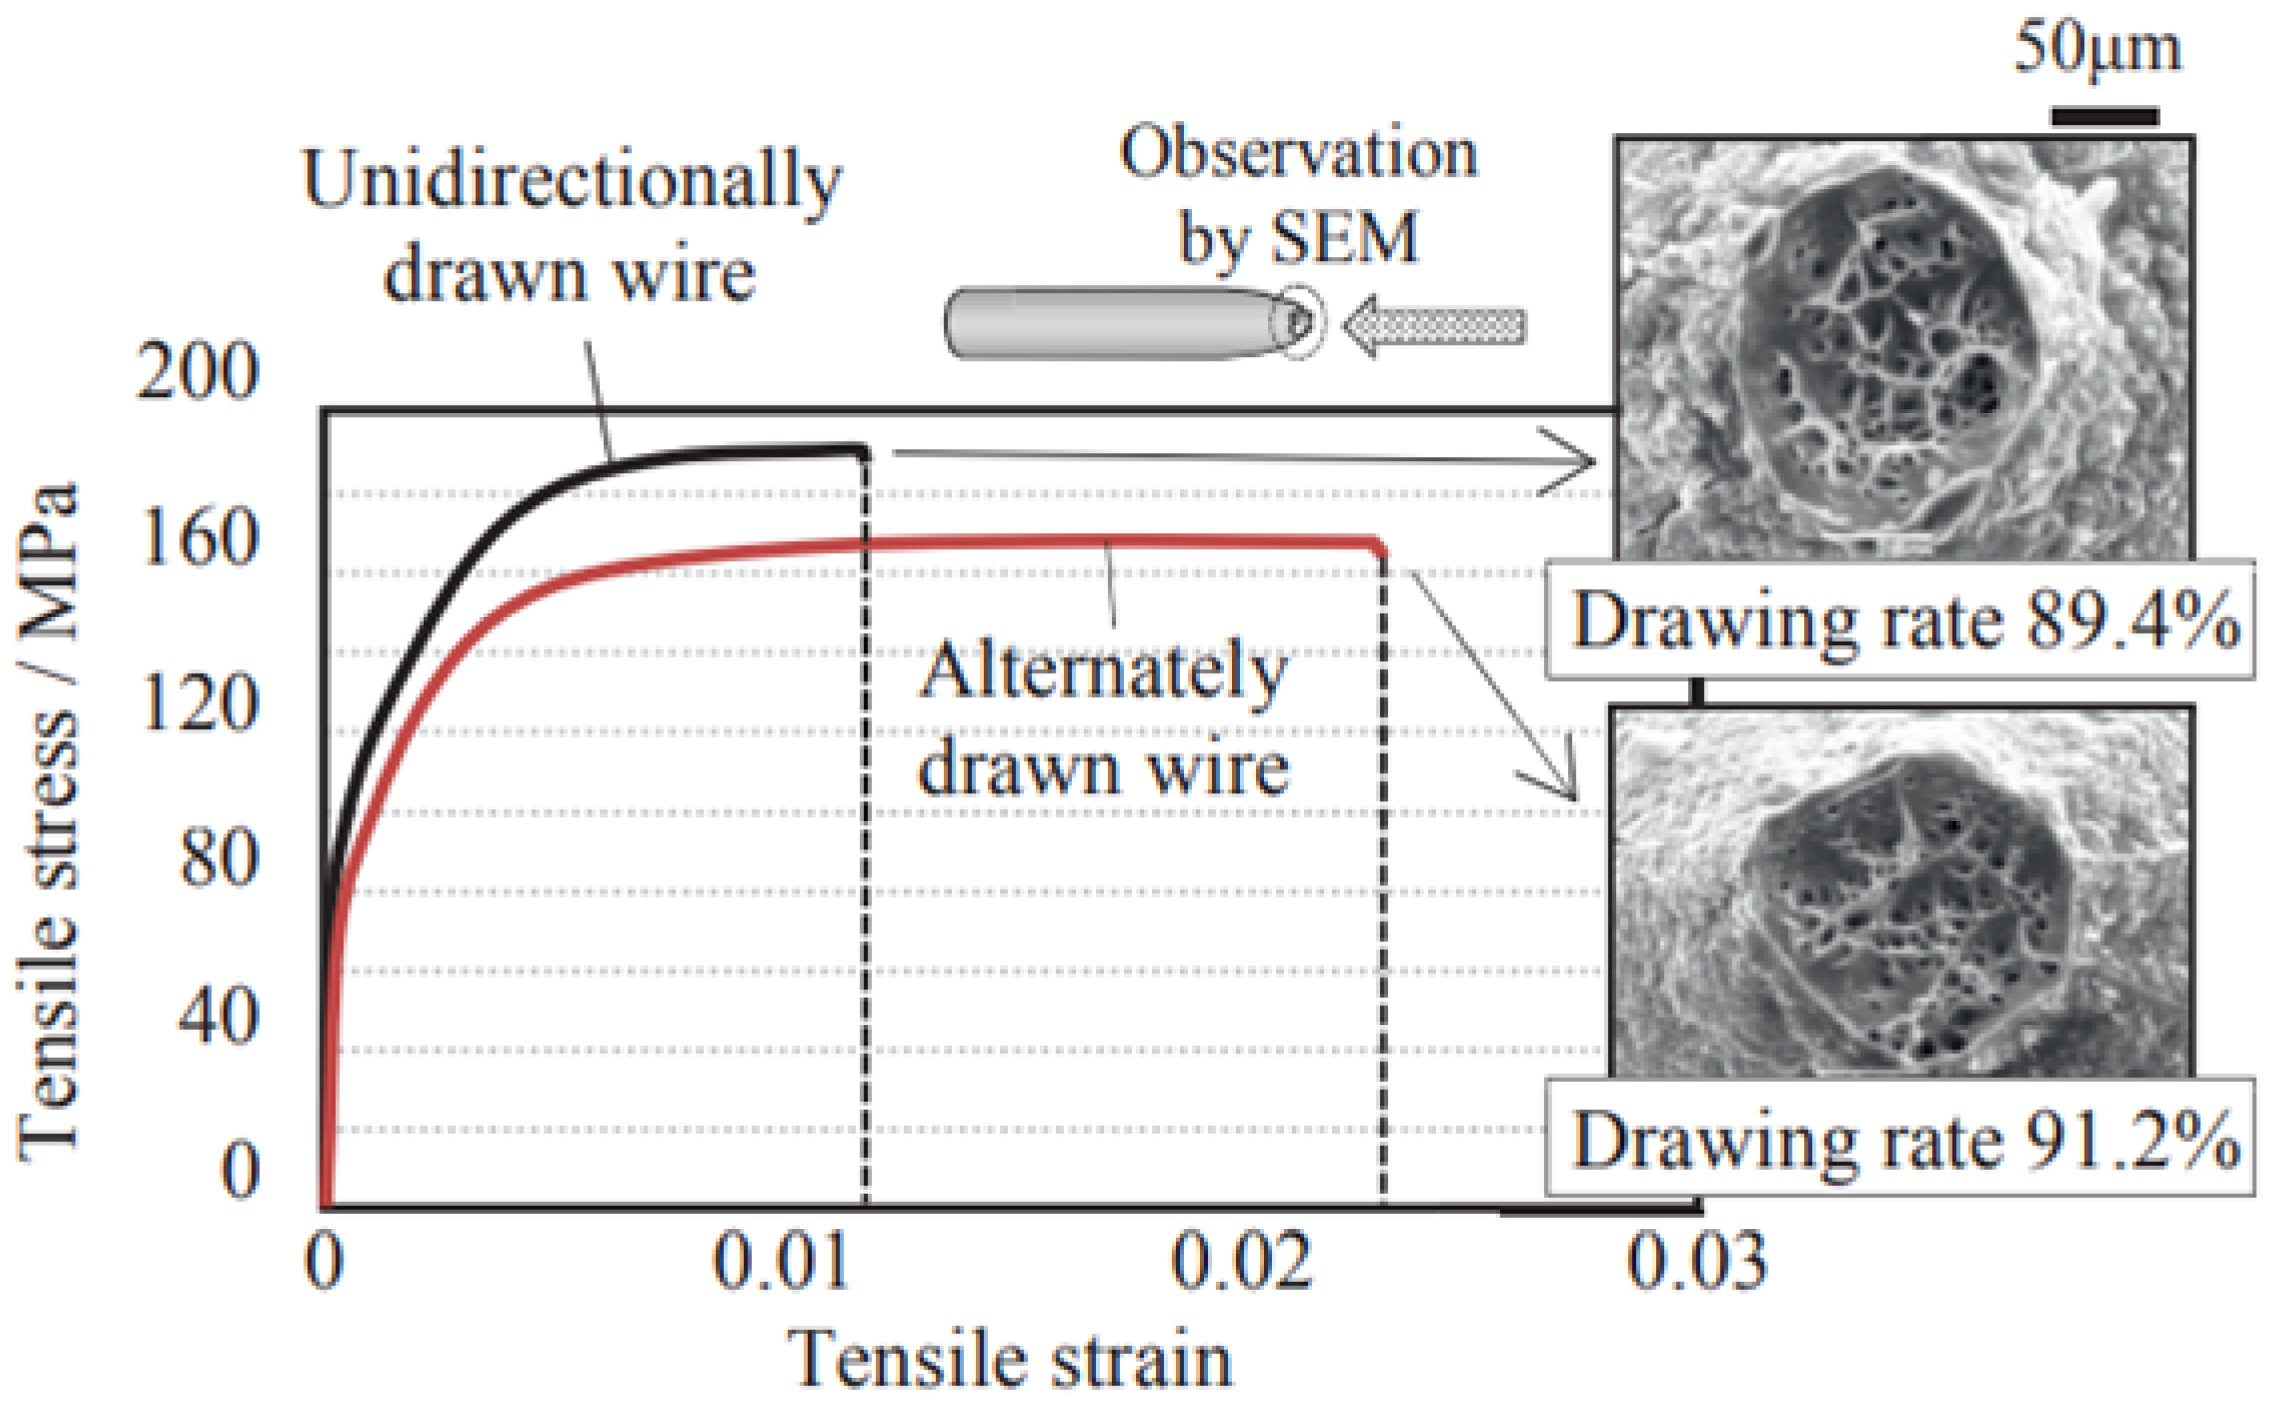
Stress–strain curves and SEM images of the fracture surface of each drawn wire ().
4.3. Discussions
In Figure 10, the metal flow lines predicted by the unidirectional (Left) and alternate (Right) drawings differ significantly. However, under the assumption of isotropic hardening, the comparison of strains and residual stresses in Figure 12 and Figure 13 shows little difference.
Meanwhile, according to the research by Yoshida and Doi [48], tensile tests on thinned wire after a 27-pass drawing process using unidirectional (Left) and alternate (Right) drawing methods show a clear difference between the two methods, as shown in Figure 14. Unidirectional drawing has a strength approximately 14% higher than alternate drawing, but its elongation is only half that of the latter. Therefore, the toughness of the former is about 57% of that of the latter. This clearly contrasts the two drawing methods.
During continuous drawing, steel undergoes repeated plastic deformation, leading to grain elongation along the drawing direction, the development of a distinct grain structure, and, consequently, anisotropy. Embury and Fisher [54] investigated pearlitic steel wire and reported that the lamellar structure aligned parallel to the drawing direction increased strength but significantly reduced ductility. This phenomenon was closely related to the increased dislocation density and grain fiberization during drawing. It was demonstrated [55] that continuously increasing the drawing strain in high-strength pearlitic wire increased the tensile strength in the drawing direction but significantly reduced the ductility in the transverse direction, promoting brittle fracture behavior. These studies consistently demonstrate that grain alignment and structural changes are the primary factors governing anisotropy in drawn steels. Considering this, it is expected that grain orientation will be less pronounced in alternate drawing compared to unidirectional drawing.
The FE analysis in this study used a phenomenological plasticity model that cannot account for crystal-structure evolution, limiting its ability to reflect the degree of anisotropy developed during the drawing process.
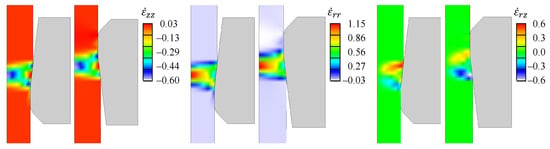
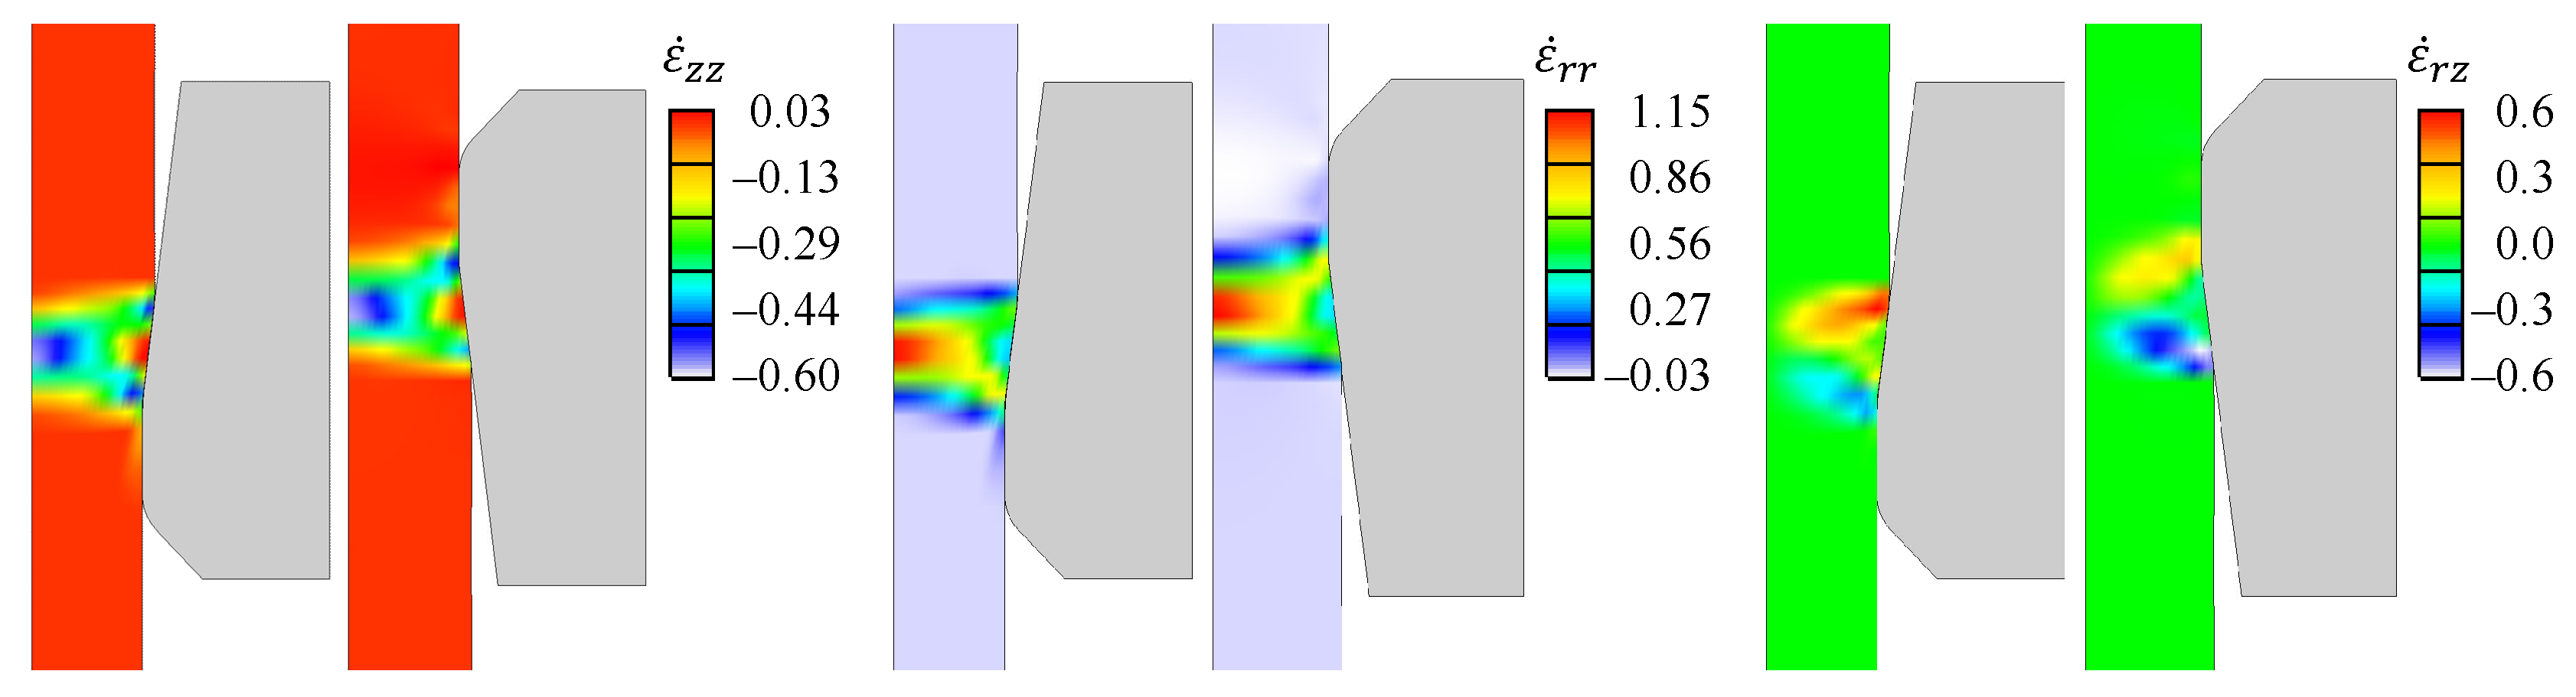
According to the research by Yoshida and Doi, the generation of additional shearing strain was suppressed during alternate drawing, as shown in Figure 10, and the ductility of the alternately drawn wire was improved. Based on their study and considering practical difficulties in challenging the practicability of reflecting these differences in analyses, this research assumes that in alternate drawing, the strain rates in the longitudinal and radial directions continuously maintain positive and negative signs, respectively. In contrast, the shear strain rate component alternates between positive and negative values. As seen in Figure 22, for and , the results are similar if inverted, but shows a different trend.
Figure 22.
Comparison of strain rate distribution in unidirectional (Left) and alternate (Right) drawings.
For these reasons, the effective strain rate was approximately obtained from the following equation:
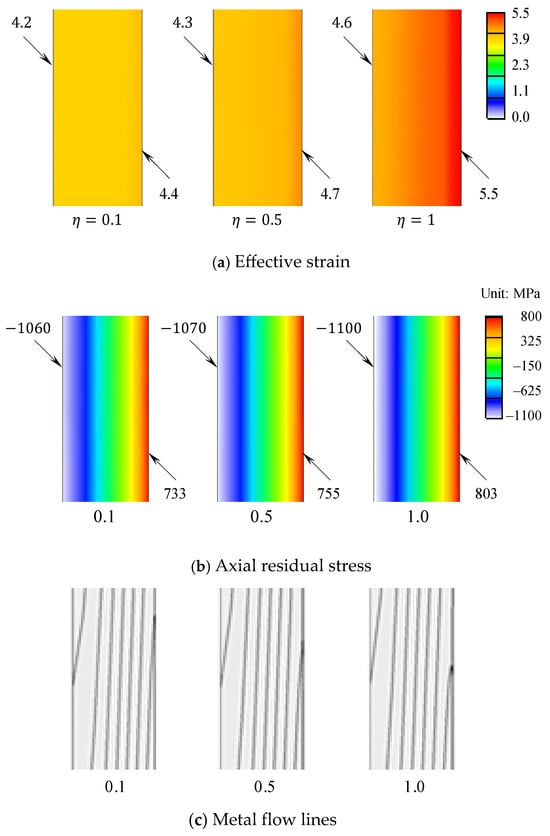
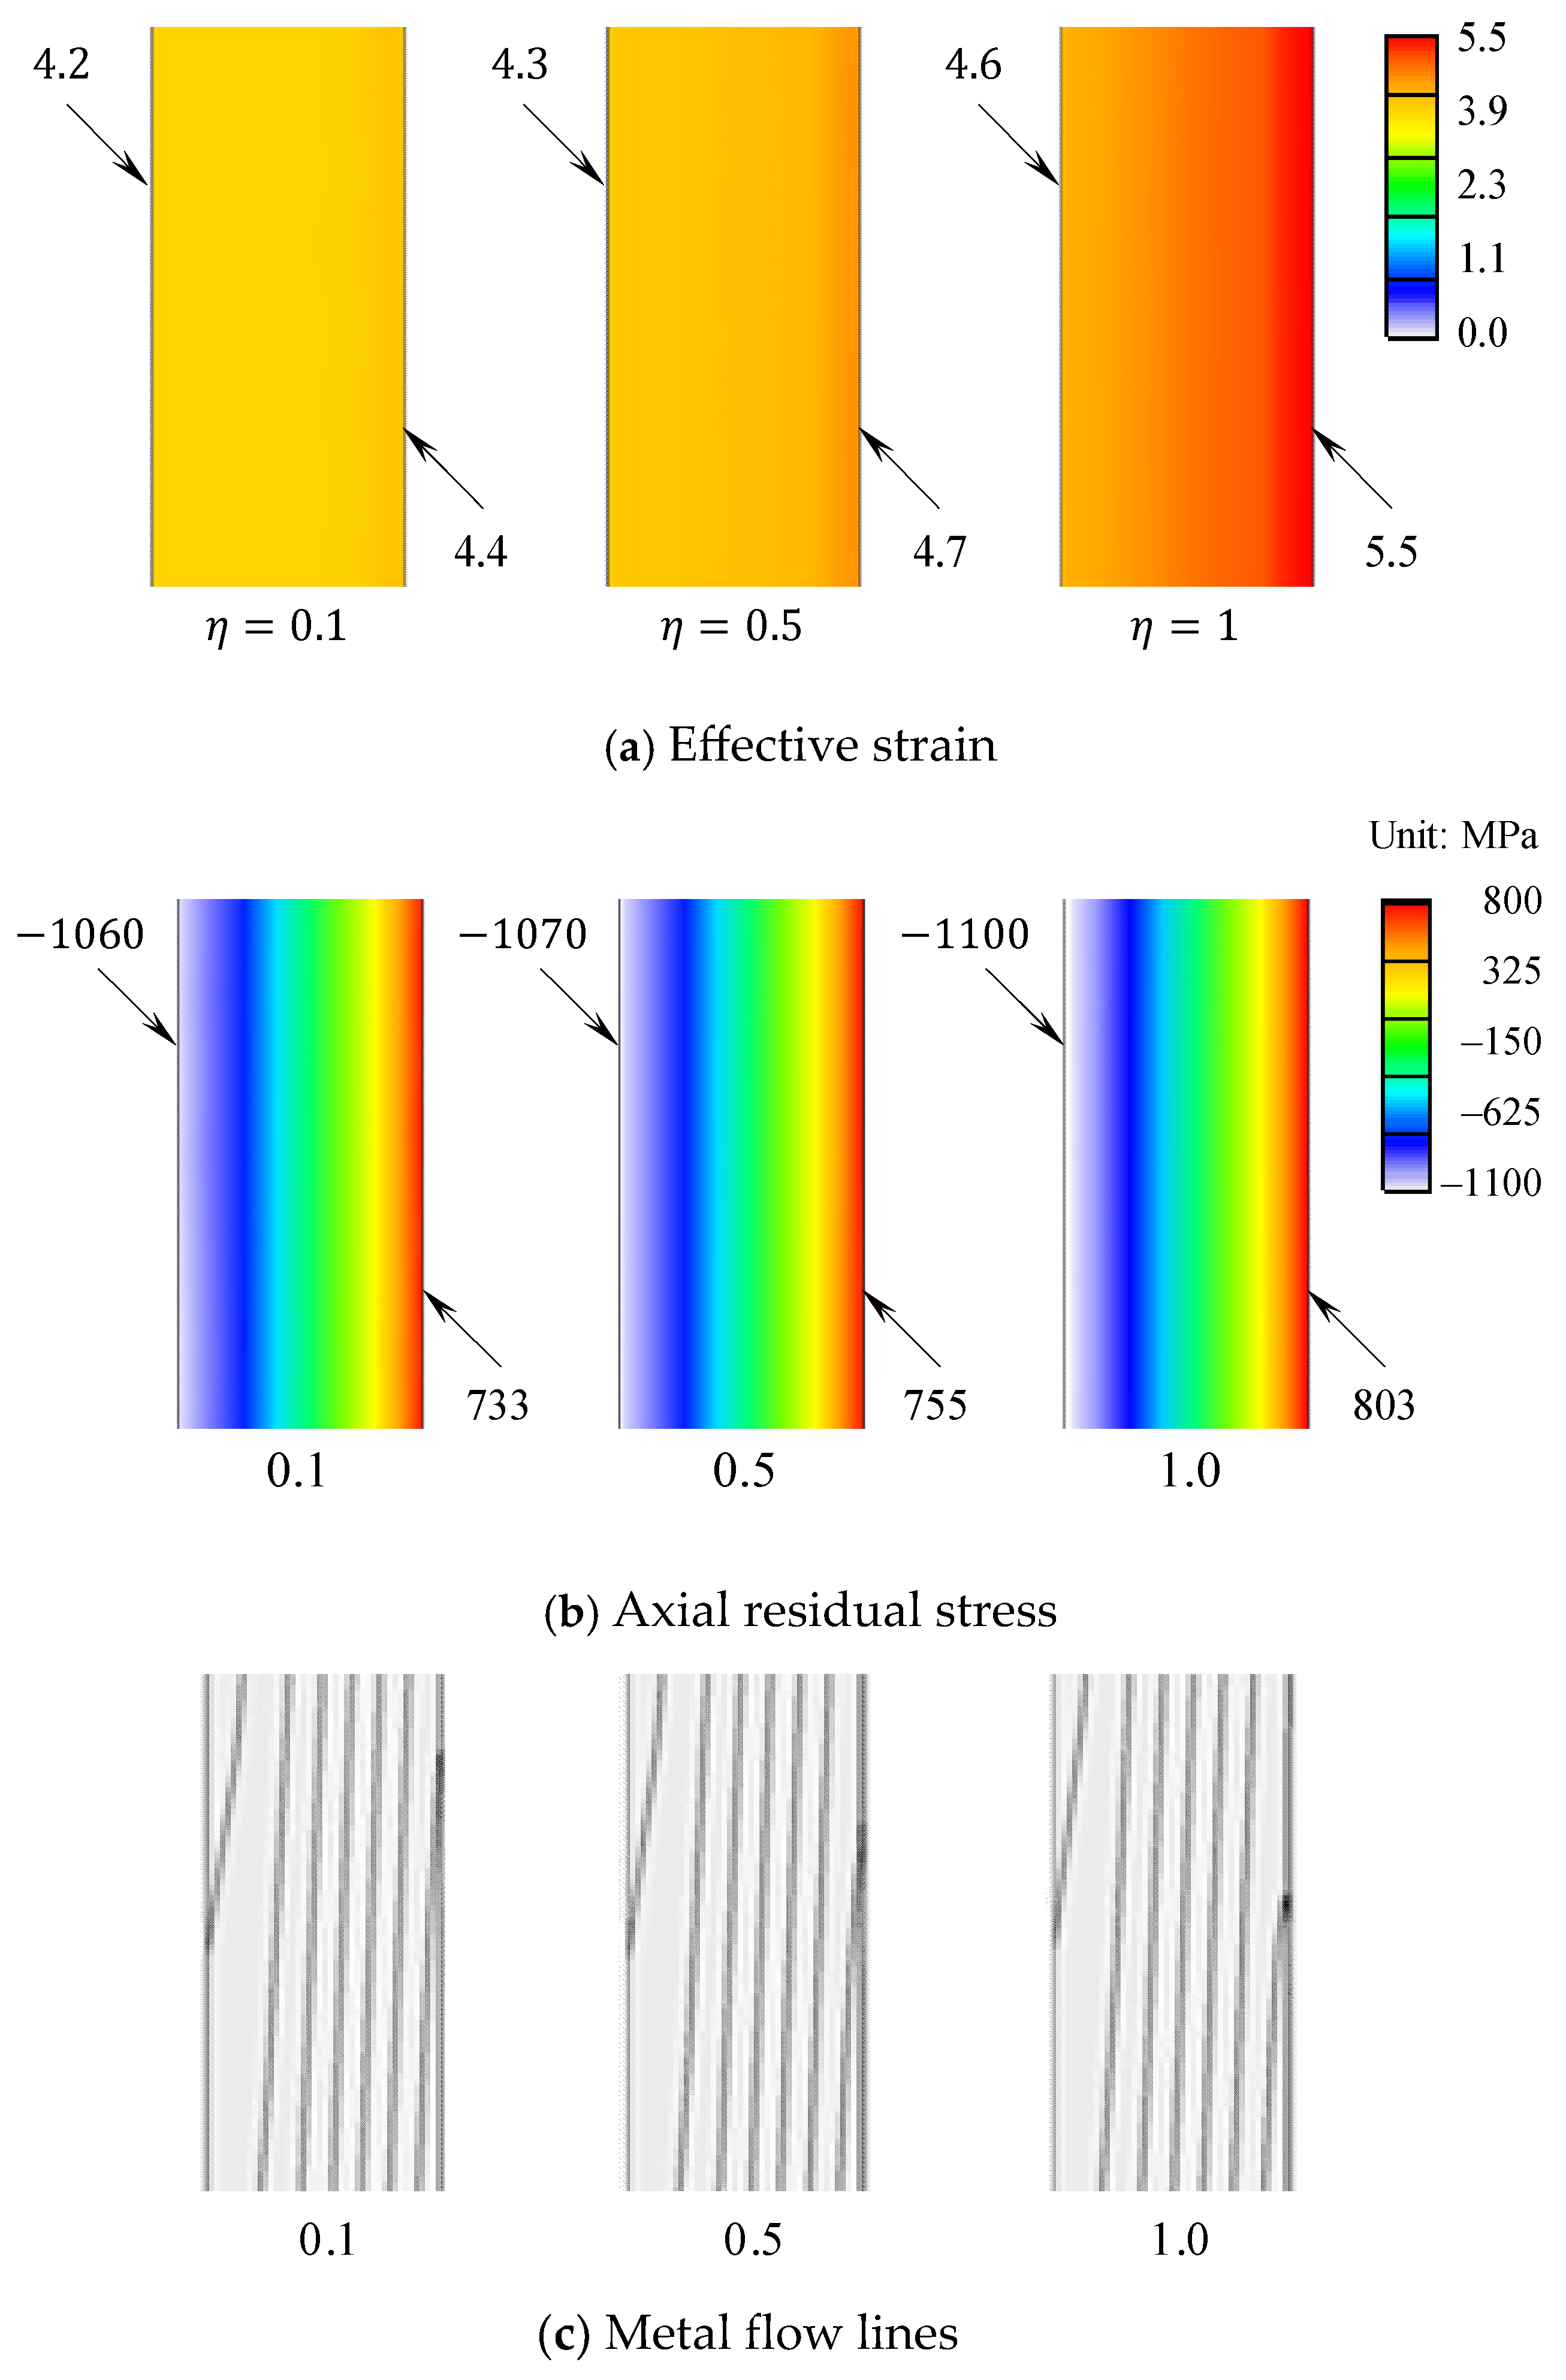
where is the proportion reflecting the shear strain rate, empirically determined, and its value ranges from 0.0 to 1.0. Note that the mathematical modelling of the actual effective strain rate is too complicated owing to the effect of the Bauschinger effect or the material’s anisotropy. Thus, Equation (1) gives a simple and practical method to alleviate strain hardening in alternate drawing by reflecting only a portion of the shear strain on the cumulative effective strain.
Figure 23 shows the distribution of effective strain, residual stress, and metal flow lines according to . The results of effective strain when X is 0.1 and 0.5 show a distinct difference from the results when is 1.0 at the surface of the wire. This can also be observed in the effective residual stress. Of course, the contrast in results is more noticeable when is 0.1. This can also be seen in the results of Yoshida and Doi. Although there are differences in the metal flow lines with , they are not significant.
Figure 23.
Comparison of major analysis results according to .
5. Concluding Remarks
The features of the drawing process were investigated from the perspective of accurate, practical simulation. They involve the presence of grips and their importance in analysis, the necessity of a structural FE mesh, the gradual increase in the length of the material in the multi-pass process, meshing and remeshing in harmony with the geometrical features of the process, the importance of automatic simulation, alternate drawing, and the radical change in the residual stress distribution. Based on this investigation, an optimal analysis model and an automatic simulation technique for the multi-pass drawing process were established based on a dual-step simulation scheme. The FE predictions of residual stresses were verified numerically. The excessive deformation of HVMFL observed during the multi-pass drawing process was qualitatively verified using cases reported in the literature.
The HVMFLs and residual stresses obtained from FE analyses of the virtual unidirectional and alternate multi-pass drawing processes, conducted under the same conditions, were compared. It was confirmed that the actual metal flow lines parallel to the longitudinal direction shrink uniformly in the radial direction. At the same time, the deformation of HVMFLs accelerates with increasing passes, especially during unidirectional drawing. Although this HVMFL can significantly reduce its deformation through alternate drawing, the deformation of the HVMFL cannot be extremely reduced when the same reduction in area is applied in alternate drawing. However, there was no significant difference between the unidirectional and alternate drawing processes in the magnitude of the FE-predicted residual stress. Meanwhile, reflecting the results of the pioneering work by Yoshida and Doi [48], which experimentally clarified the differences between unidirectional and alternate drawing, a practical scheme was proposed to account for the effects of changes in the direction of shear plastic deformation in alternate drawing. Based on these numerical study results, the optimal changes in HVMFL, residual stress, and strength can be achieved through an appropriate pass schedule design in an alternate drawing process that considers the quality of the drawn product.
Author Contributions
Y.S.: Modeling, finite element analysis. B.H.: Experiment, finite element analysis. S.C.: Test, modeling. W.C.: Discussion, evaluation. M.J.: Finite element modeling, supervision. All authors have read and agreed to the published version of the manuscript.
Funding
This work was partly supported by Korea Evaluation Institute of Industrial Technology (KEIT) (20003950, Development and application of die fatigue fracture prediction system for intelligent and smart precision cold forming) and Korea Institute of Energy Technology Evaluation and Planning (KETEP) (20214000000520, Human Resource Development Project in Circular Remanufacturing Industry) grant funded by the Korea government (MOTIE).
Data Availability Statement
The original contributions presented in this study are included in the article. Further inquiries can be directed to the corresponding author.
Conflicts of Interest
The authors declare no conflicts of interest.
References
- Roy, S.; Ghosh, S.; Shivpuri, R. A new approach to optimal process design of multi-stage metal forming processes with micro genetic algorithms. Int. J. Mach. Tool Manuf. 1997, 37, 29–44. [Google Scholar] [CrossRef] [Scilit]
- Hosseinzadeh, M.; Mouziraji, M.G. An analysis of tube drawing process used to produce squared sections from round tubes through FE simulation and response surface methodology. Int. J. Adv. Manuf. Technol. 2016, 87, 2179–2194. [Google Scholar] [CrossRef] [Scilit]
- Foadian, F.; Carradó, A.; Pirling, T.; Palkowski, H. Residual stresses evolution in Cu tubes, cold drawn with tilted dies—Neutron diffraction measurements and finite element simulation. Mater. Des. 2016, 107, 163–170. [Google Scholar] [CrossRef] [Scilit]
- Jafari, M.; Hosseinzadeh, M.; Elyasi, M. Optimization of tube drawing process through FE analysis, intelligent computation, and experimental verification. Proc. Inst. Mech. Eng. Part E J. Process Mech. Eng. 2018, 232, 94–107. [Google Scholar] [CrossRef] [Scilit]
- Karanjule, D.B.; Bhamare, S.S.; Rao, T.H. Process parameter optimization for minimizing springback in cold drawing process of seamless tubes using advanced optimization algorithms. J. Soft Comput. Civ. Eng. 2018, 2, 72–90. [Google Scholar] [CrossRef] [Scilit]
- Al-Hamdany, N.; Salih, M.Z.; Palkowski, H.; Carradò, A.; Gan, W.; Schell, N.; Brokmeier, H.G. Tube drawing with tilted die: Texture, dislocation density and mechanical properties. Metals 2021, 11, 638. [Google Scholar] [CrossRef] [Scilit]
- Razali, N.A.; Byun, J.B.; Joun, M.S. Novel finite element model of analyzing wall thickness during tube drawing considering raw tube’s thickness non-uniformity and die misalignment. Int. J. Mater. Form. 2024, 17, 19. [Google Scholar] [CrossRef] [Scilit]
- Yue, F.; Sha, Z.; Sun, H.; Chen, D.; Liu, J. Research on the optimization of TP2 copper tube drawing process parameters based on particle swarm algorithm and radial basis neural network. Appl. Sci. 2024, 14, 11203. [Google Scholar] [CrossRef] [Scilit]
- Wang, X.; Zhang, H.; Li, W.; Sun, C. Investigation of the multi-pass drawing process for steel thin-walled ribbed tube using Taguchi-grey relational analysis optimization. J. Mater. Res. Technol. 2025, 36, 4269–4283. [Google Scholar] [CrossRef] [Scilit]
- Moon, Y.H.; Lee, D.H.; Van-Tyne, C.J. Optimal distribution of drawing strains in the two-pass tube drawing process. Proc. Inst. Mech. Eng. Part B J. Eng. Manuf. 2005, 219, 595–602. [Google Scholar] [CrossRef] [Scilit]
- Sheu, J.J.; Lin, S.Y.; Yu, C.H. Optimum die design for single pass steel tube drawing with large strain deformation. Procedia Eng. 2014, 81, 688–693. [Google Scholar] [CrossRef] [Scilit]
- Ji, S.I.; Lee, K.H.; Hong, L.S.; Jung, J.Y.; Kim, J.S.; Kim, B.M. Process design of multi-pass shape drawing of wire with asymmetric trapezoid profiles. Trans. Mater. Process. 2015, 24, 187–193. [Google Scholar] [CrossRef] [Scilit]
- Cai, R.; Jia, C.; Zhao, Y.; Yang, Z.; Liu, T.; Chen, X.; Wang, P.; Li, D. Influence of back tension on wire deformation heterogeneity and texture intensity: A coupled macro-micro calculation study. J. Mater. Res. Technol. 2025, 36, 6240–6256. [Google Scholar] [CrossRef] [Scilit]
- Baek, H.M.; Jin, Y.G.; Hwang, S.K.; Im, Y.T.; Son, I.H.; Lee, D.L. Numerical study on the evolution of surface defects in wire drawing. J. Mater. Process. Technol. 2012, 212, 776–785. [Google Scholar] [CrossRef] [Scilit]
- Lee, S.W.; Kim, M.C.; Ryu, H.Y.; Joun, M.S. Effect of back tension in multi-pass drawing on central bursting defect. AIP Conf. Proc. 2013, 1532, 988–994. [Google Scholar] [CrossRef] [Scilit]
- Massé, T.; Fourment, L.; Montmitonnet, P.; Bobadilla, C.; Foissey, S. The optimal die semi-angle concept in wire drawing, examined using automatic optimization techniques. Int. J. Mater. Form. 2013, 6, 377–389. [Google Scholar] [CrossRef] [Scilit]
- Linardon, C.; Favier, D.; Chagnon, G.; Gruez, B. A conical mandrel tube drawing test designed to assess failure criteria. J. Mater. Process. Technol. 2014, 214, 347–357. [Google Scholar] [CrossRef] [Scilit]
- Moharana, B.; Kumar, B. Breakage analysis of aluminium wire rod in drawing operation. Int. J. Res. Eng. Technol. 2017, 4, 971–981. [Google Scholar]
- Ma, A.; Zhang, Y.; Dong, L.; Yan, H.; Fang, F.; Li, Z. Damage and fracture analyses of wire with off-center inclusion on multi-pass drawing under different back tensions. Eng. Fail. Anal. 2022, 139, 106512. [Google Scholar] [CrossRef] [Scilit]
- Lee, I.K.; Lee, S.K.; Lee, K.H. Finite element analysis of multi-pass dry wire drawing process of steel cord for tire reinforcement considering Al2O3 inclusion. J. Adv. Mar. Eng. Technol. 2023, 47, 202–207. [Google Scholar] [CrossRef] [Scilit]
- Heo, Y.; Kim, N.Y.; Nam, J.W.; Chung, I.G.; Joun, M.S. Friction heat ball in round-to-half circle drawing and its effect on the material’s skin shearing. Tribol. Int. 2024, 197, 109755. [Google Scholar] [CrossRef] [Scilit]
- Ma, A.; Fang, F.; Li, Z. Damage analyses and crack propagation of wire drawing with central inclusion under different compression ratios. Fatigue Fract. Eng. Mater. Struct. 2025, 48, 2743–2758. [Google Scholar] [CrossRef] [Scilit]
- Hortig, D.; Schmoeckel, D. Analysis of local loads on the draw die profile with regard to wear using the FEM and experimental investigations. J. Mater. Process. Technol. 2001, 115, 153–158. [Google Scholar] [CrossRef] [Scilit]
- Byon, S.M.; Lee, S.J.; Lee, D.W.; Lee, Y.H.; Lee, Y. Effect of coating material and lubricant on forming force and surface defects in wire drawing process. Trans. Nonferrous Met. Soc. China 2011, 21, s104–s110. [Google Scholar] [CrossRef] [Scilit]
- Hwang, J.K.; Chang, Y.C. Effects of contact conditions at wire–die interface on temperature distribution during wire drawing. Processes 2023, 11, 513. [Google Scholar] [CrossRef] [Scilit]
- Joun, M.S.; Hwang, S.M. Optimal process design in steady-state metal forming by finite element method-I. Theroetical considerations. Int. J. Mach. Tools Manuf. 1993, 33, 51–61. [Google Scholar] [CrossRef] [Scilit]
- Joun, M.S.; Hwang, S.M. Pass schedule optimal design in multi-pass extrusion and drawing by finite element method. Int. J. Mach. Tools Manuf. 1993, 33, 713–724. [Google Scholar] [CrossRef] [Scilit]
- Mihelič, A.; Štok, B. Optimization of single and multistep wire drawing with respect to minimization of the forming energy. Struct. Optim. 1996, 12, 120–126. [Google Scholar] [CrossRef] [Scilit]
- Joun, M.S.; Hwang, S.M. Die shape optimal process design in three-dimensional shape metal extrusion by the finite element method. Int. J. Numer. Methods Eng. 1998, 41, 311–335. [Google Scholar] [CrossRef]
- Karnezis, P.; Farrugia, D.C.J. Study of cold tube drawing by finite-element modelling. J. Mater. Process. Technol. 1998, 80, 690–694. [Google Scholar] [CrossRef] [Scilit]
- Béland, J.F.; Fafard, M.; Rahem, A.; D’Amours, G.; Côté, T. Optimization on the cold drawing process of 6063 aluminium tubes. Appl. Math. Model. 2011, 35, 5302–5313. [Google Scholar] [CrossRef] [Scilit]
- Sas-Boca, I.M.; Tintelecan, M.; Pop, M.; Ilutiu-Varvara, D.A.; Mihu, A.M. The wire drawing process simulation and the optimization of geometry dies. Procedia Eng. 2017, 181, 187–192. [Google Scholar] [CrossRef] [Scilit]
- Farahani, N.D.; Parvizi, A.; Barooni, A.; Naejini, S.A. Optimum curved die profile for tube drawing process with fixed conical plug. Int. J. Adv. Manuf. Technol. 2018, 97, 1–11. [Google Scholar] [CrossRef] [Scilit]
- Akiyama, M.; Kuboki, T. Optimisation of method for reducing residual stresses after cold bar drawing. Ironmak. Steelmak. 2002, 29, 101–106. [Google Scholar] [CrossRef] [Scilit]
- He, S.; Van Bael, A.; Li, S.Y.; Van Houtte, P.; Mei, F.; Sarban, A. Residual stress determination in cold drawn steel wire by FEM simulation and X-ray diffraction. Mater. Sci. Eng. 2003, 346, 101–107. [Google Scholar] [CrossRef] [Scilit]
- Ruiz, J.; Atienza, J.M.; Elices, M. Residual stresses in wires: Influence of wire length. J. Mater. Eng. Perform. 2003, 12, 480–489. [Google Scholar] [CrossRef] [Scilit]
- Kuboki, T.; Nishida, K.; Sakaki, T.; Murata, M. Effect of plug on levelling of residual stress in tube drawing. J. Mater. Process. Technol. 2008, 204, 162–168. [Google Scholar] [CrossRef] [Scilit]
- Pirling, T.; Carradò, A.; Palkowski, H. Residual stress distribution in seamless tubes determined experimentally and by FEM. Procedia Eng. 2011, 10, 3080–3085. [Google Scholar] [CrossRef] [Scilit]
- Rossini, N.S.; Dassisti, M.; Benyounis, K.Y.; Olabi, A.G. Methods of measuring residual stresses in components. Mater. Des. 2012, 35, 572–588. [Google Scholar] [CrossRef] [Scilit]
- Hirsch, T.K.; da Silva Rocha, A.; Menezes Nunes, R. Characterization of local residual stress inhomogeneities in combined wire drawing processes of AISI 1045 steel bars. Int. J. Adv. Manuf. Technol. 2014, 70, 661–668. [Google Scholar] [CrossRef] [Scilit]
- Dmitriy, D. Analysis of residual stress in circular cross-section wires after drawing process. Procedia Manuf. 2019, 37, 335–340. [Google Scholar] [CrossRef] [Scilit]
- Baumann, M.; Selbmann, R.; Milbrandt, M.; Kräusel, V.; Bergmann, M. Adjusting the residual stress state in wire drawing products via in-process modification of tool geometries. Materials 2021, 14, 2157. [Google Scholar] [CrossRef] [Scilit]
- Nishida, S.; Nishino, S.; Sekine, M.; Oka, Y.; Harjo, S.; Kawasaki, T.; Suzuki, H.; Morii, Y.; Ishii, Y. Analysis of residual stress in steel bar processed by cold drawing and straightening. Mater. Trans. 2021, 62, 667–674. [Google Scholar] [CrossRef] [Scilit]
- Selbmann, R.; Gibmeier, J.; Simon, N.; Kräusel, V.; Bergmann, M. Residual stress engineering for wire drawing of austenitic stainless steel X5CrNi18-10 by variation in die geometries-effect of drawing speed and process Temperature. Materials 2024, 17, 1174. [Google Scholar] [CrossRef] [Scilit] [PubMed]
- Kang, T.; Li, S.; Zhang, M.; Qin, W.; Zhang, W. Research on analyzing and valuing residual stress for micro wire busbar. Eng. Fail. Anal. 2024, 157, 107901. [Google Scholar] [CrossRef] [Scilit]
- Hwang, J.K. Effect of drawing speed on microstructure distribution and drawability in twinning-induced plasticity steel during wire drawing. J. Iron Steel Res. Int. 2020, 27, 577–587. [Google Scholar] [CrossRef] [Scilit]
- Wu, H.; Huang, T.; Song, K.; Li, S.; Zhou, Y.; Zhang, Y. Effect of drawing speed on the deformation characteristics, microstructure and properties of copper wire rod. Mater. Sci. Eng. A 2024, 892, 146025. [Google Scholar] [CrossRef] [Scilit]
- Yoshida, K.; Doi, K. Improvement of ductility of aluminum wire for automotive wiring harness by alternate drawing. Procedia Eng. 2014, 81, 706–711. [Google Scholar] [CrossRef] [Scilit]
- Zhu, Y.K.; Chen, Q.Y.; Wang, Q. Effect of stress profile on microstructure evolution of cold-drawn commercially pure aluminum wire analyzed by finite element simulation. J. Mater. Sci. Technol. 2018, 34, 1214–1221. [Google Scholar] [CrossRef] [Scilit]
- Pirling, T.; Carradò, A.; Brück, S.; Palkowski, H. Neutron stress imaging of drawn copper tube: Comparison with finite-element model. Metall. Mater. Trans. A 2008, 39, 3149–3154. [Google Scholar] [CrossRef] [Scilit]
- Grognec, P.l.e.; Casari, P.; Choqueuse, D. Influence of residual stresses and geometric imperfections on the elastoplastic collapse of cylindrical tubes under external pressure. Mar. Struct. 2009, 22, 836–854. [Google Scholar] [CrossRef] [Scilit]
- Gattmah, J.; Ozturk, F.; Orhan, S. A new development of measurement technique for residual stresses generated by the cold tube drawing process with a fixed mandrel. Int. J. Adv. Manuf. Technol. 2020, 108, 3675–3687. [Google Scholar] [CrossRef] [Scilit]
- Norasethasopon, S. Chevron crack initiation in mullti-pass drawing of inclusion copper shaped-wire. J. Met. Mater. Miner. 2011, 21, 1–8. [Google Scholar]
- Embury, J.D.; Fisher, R.M. Structure and properties of drawn pearlite. Acta Metall. 1966, 14, 147–159. [Google Scholar] [CrossRef] [Scilit]
- Borchers, C.; Kirchheim, R. Cold-drawn pearlitic steel wires. Prog. Mater. Sci. 2016, 82, 405–444. [Google Scholar] [CrossRef] [Scilit]

Disclaimer/Publisher’s Note: The statements, opinions and data contained in all publications are solely those of the individual author(s) and contributor(s) and not of MDPI and/or the editor(s). MDPI and/or the editor(s) disclaim responsibility for any injury to people or property resulting from any ideas, methods, instructions or products referred to in the content. |
© 2026 by the authors. Licensee MDPI, Basel, Switzerland. This article is an open access article distributed under the terms and conditions of the Creative Commons Attribution (CC BY) license.