


Abstract
Decarbonization has emerged as a crucial objective in the optimization of port collection and distribution networks. To investigate the synergistic effects of carbon trading mechanisms and the implementation of electric autonomous container trucks (EACTs), this study develops a multi-objective bi-level programming model that simultaneously minimizes transportation cost, carbon trading cost, and transportation time. The model is solved using the Non-dominated Sorting Genetic Algorithm II (NSGA-II), generating a Pareto-optimal solution set, from which the optimal solution is selected using a normalized ideal point method. Simulation-based case studies validate the feasibility and practical applicability of the proposed model. The results show that the optimized network significantly outperforms the traditional road-dominant mode. Under the baseline carbon price of 70 CNY/ton, the optimal deployment rate of EACTs reaches 25.03% and 33.87%. Sensitivity analysis reveals a distinct non-linear threshold effect: increasing the carbon price to 90 CNY/ton drives the EACT adoption rate to 32.76% and 45.38%, resulting in a 6.98% reduction in carbon emissions and a 12.75% decrease in total operational costs compared to the baseline scenario. Additionally, strict carbon quotas (e.g., 3000 tons) are found to further compel a modal shift, peaking EACT usage at 35.08% and 46.71%. These quantitative findings offer actionable insights for optimizing multimodal transport structures and refining carbon trading policies.
1. Introduction
Ports are increasingly becoming pivotal nodes in decarbonized logistics chains, making the optimization of collection-distribution networks essential for achieving climate goals and improving operational efficiency. As global concerns about climate change intensify, port authorities and logistics operators are under pressure to reduce the carbon footprint of port-related activities. Optimizing port collection-distribution networks has therefore emerged as a strategic priority to facilitate the low-carbon transition in maritime logistics.
In the context of China’s “dual carbon” goals, both regulatory bodies and transportation enterprises are prioritizing the low-carbon transformation of port networks. As a leading global maritime hub, Shanghai’s Yangshan Port handled over 26 million TEUs in 2024, reflecting a 4.2% year-on-year increase. However, the port’s reliance on roadway transport, which accounts for 55% of the modal share [1], exacerbates the tension between operational efficiency and carbon reduction objectives. Thus, developing a multi-objective optimization mechanism that simultaneously reduces carbon emissions and enhances network efficiency has become a critical challenge for Yangshan Port’s sustainable development.
From a client perspective, route selection within the port’s collection-distribution network is primarily driven by cost and transit time [2]. However, regulators and enterprises must also consider environmental externalities, such as carbon emissions. In Yangshan’s network, road transport provides high efficiency but incurs elevated costs and significant carbon emissions. Conversely, railway and waterway modes offer lower costs and reduced emissions but lack the flexibility and speed of road transport [3]. The modal split between these modes directly influences the overall operational costs, efficiency, and carbon footprint of the network [4].
To balance these trade-offs, multimodal transportation provides a promising solution by integrating the strengths of different modes. While rail and waterways are dominant in long-haul logistics [5,6,7,8], road transport remains indispensable for “last-mile” connectivity due to the spatial rigidity of rail and water networks.
Given that road transport constitutes a significant portion of the network, replacing diesel trucks with EACTs is a viable strategy. Equipped with 5G connectivity, autonomous driving systems, and electric propulsion, EACTs can reduce labor costs and carbon emissions while enhancing off-peak transport capacity. For instance, platooning systems, which enable EACTs to travel with minimal time headways, have been piloted to facilitate autonomous transport between the Luchaogang hub and Yangshan Port. Despite challenges such as technological maturity [9] and high upfront investment, the integration of EACTs into the port ecosystem offers significant potential.
Current strategies to reduce greenhouse gas emissions in port logistics include modal shifts, energy-efficient routing, and clean vehicle adoption. Among these, carbon trading mechanisms and EACT deployment are particularly notable. Carbon trading provides market-based incentives for emission reduction by internalizing the environmental costs of transport activities. Concurrently, EACTs represent a transformative approach to reducing both labor dependency and carbon emissions. However, the synergistic impacts of combining carbon trading policies with EACT fleet configuration in multimodal collection-distribution networks remain insufficiently explored.
Carbon policy implementation requires careful consideration of different regulatory frameworks. While carbon taxes offer administrative simplicity and price certainty, China’s regional economic disparities complicate uniform implementation [10]. In contrast, the Carbon Emissions Trading System (CETS) provides greater flexibility and precise emission control through quantity-based regulation [11,12]. Shanghai’s carbon market, with prices projected to reach 70 CNY/ton CO2 by 2025, offers a practical testing ground for examining how carbon pricing influences transportation mode selection and operational decisions. Existing research indicates that higher carbon prices generally drive greater emission reductions in transportation networks [13,14,15], though the specific impacts on port collection-distribution networks require further investigation.
Existing research on multi-objective optimization in port logistics typically follows two approaches: (1) constructing Pareto-optimal models to balance competing objectives [16], or (2) scalarizing multi-objective problems using weighting functions [17]. The latter often suffers from subjectivity in weight assignment and dependence on empirical data. In contrast, Pareto-optimal solutions offer a diverse set of trade-offs, facilitating more informed decision-making.
The remainder of this paper is organized as follows: Section 2 provides a comprehensive literature review on multimodal transport network optimization, bi-level programming frameworks, and low-carbon policies, identifying current research gaps. Section 3 details the development of the multi-objective bi-level programming model, defining the network construction, model assumptions, and the mathematical formulations for both upper-level (port operator) and lower-level (shipper) decision-making. Section 4 describes the solution methodology, specifically the implementation of the Non-dominated Sorting Genetic Algorithm II (NSGA-II) and the evaluation method using the normalized ideal point method. Section 5 presents a case study of Yangshan Port, including the simulation results, sensitivity analyses of carbon price and quotas, and a detailed discussion of the findings. Finally, Section 6 summarizes the key conclusions of the study and offers targeted policy recommendations for future research.
2. Literature Review
The primary objective of this section is to establish the theoretical and empirical foundation for optimizing multimodal collection and distribution networks. By synthesizing existing studies, this section identifies the evolution of modeling techniques and policy influences in the field. Therefore, the literature review is composed of four parts: research on multimodal transport network optimization, analysis of bi-level programming frameworks and evolutionary algorithms, an overview of low-carbon policies, and the identification of research gaps this study aims to address.
2.1. Multimodal Transport Network Optimization
Multimodal transportation has become a significant focus in recent research due to its efficiency and reduced carbon emissions compared to single-mode systems. As a result, optimizing multimodal transport routes is central to the study of collection and distribution networks [18,19,20]. Key to this is the seamless integration of various transport modes and the effective management of operational uncertainties to build resilient logistics systems. Synchromodality, which allows dynamic switching between road, rail, and waterborne transport based on real-time data, plays a crucial role in achieving this flexibility [21]. Shipper decisions, driven by factors such as cost, time, and service preferences, vary significantly across regions and markets [22], with road transport being essential for short-haul and rail/sea dominating long-distance segments [23]. However, current models often fail to account for dynamic, real-time constraints, limiting their practical application.
In response to the growing complexity of these networks, operational research has contributed key algorithmic advancements. Notably, algorithms for vehicle routing problems with time windows provide a mathematical basis for last-mile delivery in multimodal chains [24]. Earlier models mainly prioritized cost minimization, focusing on transport time or distance as constraints [25,26,27]. However, recent advancements have moved from static to dynamic formulations, specifically addressing multimodal network design under uncertain demand [28,29,30]. Additionally, researchers have incorporated fuzzy time windows [31] and chance-constrained optimization models to design multimodal services that meet variable demand with a certain confidence level [32]. These advancements enable more realistic models that consider uncertainty and risk, including in specialized logistics like hazardous materials transport, where bi-level multi-objective models aim to balance economic costs and social risks across road–rail interfaces [33]. Monte Carlo simulations are increasingly used to assess the environmental impacts and carbon footprint variability of multimodal transport systems [34].
Despite these advancements, several gaps remain, particularly in the integration of real-time data inputs and the dynamic interplay of various transport modes. Future research should focus on developing more robust models that incorporate advanced machine learning techniques to optimize multimodal routes in unpredictable operational conditions, further enhancing transport efficiency and sustainability.
2.2. Bi-Level Programming Frameworks and Evolutionary Algorithms
Given the conflicting objectives among various stakeholders, such as governments, shippers, and transport operators, bi-level programming has become a widely adopted methodological framework for modeling collection and distribution networks [35,36,37]. In this hierarchical structure, the upper level typically represents the strategic decisions made by port authorities or enterprises (often modeled using 0–1 integer programming), while the lower-level captures shipper reactions through probabilistic choice models, reflecting the Stackelberg game relationship inherent in transport markets.
As network complexity and the dimensionality of decision variables increase, traditional single-objective optimization methods often fall short. Multi-objective optimization techniques have thus gained traction, transforming multi-objective problems into single-objective ones via value functions or weighted sums. For example, transport time and carbon emissions can be monetized using value-of-time functions [38] and carbon pricing [39], respectively. However, this approach is often criticized for the subjectivity inherent in weight assignment and its heavy reliance on empirical assumptions.
The second category involves multi-objective optimization algorithms (MOEAs), such as Ant Colony Optimization, Particle Swarm Optimization, and multi-objective Genetic Algorithms [40,41,42,43]. Among these, the Non-dominated Sorting Genetic Algorithm II (NSGA-II) is particularly prevalent. NSGA-II generates a Pareto-optimal solution set, offering decision-makers a diverse range of trade-offs rather than a single solution. These solutions can be further refined using simulation [44] or methods like the ideal point method or empirical weighting. Compared to traditional solvers, NSGA-II demonstrates superior solution quality and computational efficiency [45]. It is worth noting that in large-scale, cross-regional networks with high-dimensional decision spaces, the performance of some solvers can degrade [46]. To address this, algorithms like NSGA-III have been developed to use reference points for maintaining diversity in many-objective spaces [47]. However, for problems with a moderate number of objectives (as in this study), NSGA-II remains a robust and widely validated tool [48].
2.3. Low-Carbon Policy
Recently, decarbonization has become a crucial objective in transport networks [49]. Globally, efforts to green the logistics sector rely on two pillars: policy instruments and technological innovation. On the policy front, carbon taxes [50] and Carbon Emissions Trading Systems (CETSs) [51] are widely utilized. While carbon taxes offer transparency and simplicity, CETSs establish a cap on overall emissions, allocating tradeable allowances to enterprises. In China, the integration of CETS into multimodal network models is increasing [52]. Rising carbon prices incentivize a modal shift from road to lower-emission rail and water transport, thereby elevating the strategic importance of intermodal terminals [53].
2.4. Research Gap
In summary, research on collection and distribution network optimization has increasingly focused on balancing efficiency, cost, and environmental objectives. Multi-objective intelligent algorithms have proven effective in handling the increasing the complexity of logistics systems. However, existing models often neglect shipper choice behavior and the synergistic effects of low-carbon vehicle deployment and carbon pricing policies. To address these gaps, this study proposes a bi-level programming model that incorporates both shipper preferences and the configuration of EACTs.
3. Bi-Level Programming Model
The bi-level programming framework proposed in this study is built upon a hierarchical decision-making logic. To provide a clear derivation of this model, we first outline the network construction and the underlying assumptions that simplify the real-world logistics environment. This is followed by a detailed presentation of the mathematical notations, leading into the formal objective functions and constraints for both the upper and lower levels of the system.
3.1. Network Construction and Problem Description
Figure 1 shows the simplified collection-distribution network of Yangshan Port. This network includes four inland cities, namely Nanjing, Wuhan, Chongqing, and Chengdu, as cargo sources. Cargo from these origins is transported to Shanghai via railway or roadway. Additionally, Nanjing, Wuhan, and Chongqing, situated along the Yangtze River, utilize waterway transport, a mode unavailable to Chengdu due to geographical constraints. Within Shanghai, three transshipment hubs are designated: (1) Luchao Port, serving as the railway transit center for rail-to-road or rail-to-EACT transfers; (2) Lingang Distribution Center, serving as the roadway transit hub where cargo can be temporarily stored or transferred to EACTs; and (3) a Waterway Transshipment Hub, a conceptual node used to simulate water-to-water transshipment processes.
Figure 1.
Yangshan Port’s collection-distribution network with inland cargo sources and Shanghai transshipment hubs.
The optimization problem focuses on the cargo collection process within a network connecting the four hinterland cities and Shanghai, including the three transshipment centers and Yangshan Port. Depending on the chosen mode, cargo arrives at a specific transshipment center before final delivery to the port.
The network is mathematically represented as a directed graph G = {I, J, p, M, L}. Here, I = {i/i = 1, 2, 3, 4} denotes the set of hinterland cities; J = {j/j = 1, 2, 3} represents the set of transshipment centers; and p denotes the destination (Yangshan Port). The set of transportation modes is defined as M = {m/m = 1, 2, 3, 4}, corresponding to rail transport, road transport, water transport, and EACT transport, respectively. The set of transportation segments is defined as L = {(i, j, m), (j, p, n)/i ∈ I, j ∈ J, m ∈ M, n ∈ M}. A continuous path from city i to port p comprises a sequence of valid transportation segments.
The bi-level model aims to minimize transportation costs, time, and carbon emissions, integrating both governmental regulations and market-driven decisions. At the upper level, decision-makers such as government authorities or port operators set policies, regulate transportation modes, and manage carbon emission allowances under carbon trading mechanisms. The lower level simulates customer path preferences and calculates the probability of shippers selecting particular transportation modes, with decision-makers like shippers or freight companies choosing the most cost-effective and efficient mode based on the upper-level policies. In this network, shippers aim to minimize their generalized cost (a combination of price and time) when selecting the optimal route, while port operators, as upper-level decision-makers, determine the optimal fleet configuration of Electric Autonomous Container Trucks (EACTs) based on freight volumes and oversee carbon emissions.
3.2. Model Assumptions
To formulate the bi-level programming model for the port collection-distribution network and EACT configuration, the following assumptions are posited to simplify the problem complexity while maintaining practical relevance:
- 1.
- All cargo units are standardized as 20-foot Equivalent Units (TEUs).
- 2.
- There are n batches of cargo originating from the four hinterland cities destined for Shanghai. The volume of each batch, denoted as Qs, follows a normal distribution. Each batch utilizes a single transport mode for the primary leg. Specifically, Nanjing, Wuhan, and Chongqing have access to railway, roadway, and waterway modes, whereas Chengdu is restricted to railway and roadway transport due to geographical constraints.
- 3.
- The travel speed for each transport mode on a given segment is assumed to be constant, represented by the average velocity.
- 4.
- EACTs are deployed exclusively on the segment connecting Luchao Port/Lingang Distribution Center to Yangshan Port. The configuration cost is calculated based on the amortization of the asset over its service life, rather than a one-time total purchase cost.
- 5.
- External stochastic factors, such as cargo loss, severe weather conditions or unexpected vehicle breakdowns, are not considered in this study.
3.3. Notations and Parameters
The sets, parameters, and decision variables used throughout the mathematical formulation are summarized in Table 1 and Table 2, and Table 3, respectively.
Table 1.
Definition of notations.
Table 2.
Parameters.
Table 3.
Decision variables.
3.4. The Upper-Level Model
The upper-level model acts as the leader in the bi-level framework, representing the decision-making process of the port operator. The primary goal is to determine the optimal transportation network structure and EACT fleet configuration by minimizing a composite objective function consisting of carbon trading costs, total transportation time, and network operation costs.
- (1)
- Minimize carbon trading costs
The first objective is the minimization of carbon trading costs, denoted as , under a “Cap-and-Trade” mechanism. Carbon emissions are generated throughout the logistics process, including emissions from transportation segments and transshipment nodes. The carbon trading cost is determined by the discrepancy between the total actual emissions and the carbon quota allocated to the operator.
The total emissions encompass those generated during transit across various modes (rail, road, waterway, and EACTs) and those incurred during handling operations at transshipment nodes. The in-transit emissions are calculated based on freight volume , transportation distances and , and the carbon emissions factors for each mode. Similarly, transshipment emissions are derived from the freight volume and the unit emission factor at transfer nodes .
The carbon trading cost function is formulated as shown in Equation (1). If the total emissions exceed the quota, the operator incurs a cost by purchasing additional allowances at the market price . Conversely, if emissions are below the quota, the operator generates profit (represented as a negative cost) by selling surplus allowances.
The constituent emission components are calculated as follows:
- (2)
- Minimize the total transportation time T
The second objective, T, is to minimize the total delivery time, which consists of in-transit time and the node transit time . The transit time for a road segment depends on the long-distance transportation distance , the short-haul transportation distance , and the average speed for the corresponding transportation mode. The node transit time depends on the freight volume and the unit container transit time .
- (3)
- Minimize the total network operation cost
The third objective, , minimizes the comprehensive network operation costs, encompassing direct transportation costs and EACT configuration cost , as shown in Equation (8).
The transportation cost consists of the in-transit transportation cost for different transportation modes and the node transit cost. The in-transit transportation cost depends on the freight volume , transportation distances and , and unit container transportation base prices for each mode. Railway and road transport adopt dual base pricing, with and as base container fees, independent of transportation distance, and and as costs per unit distance. Waterway transportation uses route pricing, where represents the cost of transporting a unit container from the hinterland city i to Shanghai.
The cost of node transit is determined by the unit container transit cost and freight volume . For railway transportation, all goods undergo transit; for road transport, only a certain proportion of goods are converted to EACTs. For waterway transportation, it is assumed that all goods are transshipped at a waterway hub.
Therefore, the total transportation cost is shown in Equation (9), and Equations (10)–(12) represent the total transportation costs of railway, roadway, and waterway, respectively.
The cost of deploying EACTs is calculated based on asset amortization rather than a one-time capital expenditure. The number of required EACTs is strictly coupled with freight volume via a capacity coefficient . The total cost is distributed over the vehicle’s service life and annual working frequency , combined with the operational cost per km .
- (4)
- Multi-objective optimization function
The global objective function seeks to simultaneously minimize the three dimensions defined above:
Subject to:
Equation (15) enforces the geographical constraint that Chengdu cannot utilize waterway transport. Equation (16) ensures the uniqueness of mode selection, requiring that each cargo batch utilizes exactly one primary transport mode. Equation (17) defines the binary and continuous domains for the decision variables.
3.5. Lower-Level Model
The lower-level model captures the routing behavior of shippers, who act as followers in the Stackelberg game by reacting to the network configuration determined by the upper-level operator. Shippers are modeled as rational agents seeking to maximize their utility by selecting the most advantageous transportation path.
- (1)
- Utility Function Construction
Based on the network topology established in the upper level, let A denote the set of all feasible paths for a specific cargo batch s from origin city i to port p. For any given path , the utility is derived from two primary attributes: total transportation time and total transportation cost . Adopting a log-linear utility function, the utility of path is expressed as follows:
- (2)
- Path Choice Probability (Logit Model)
Due to information asymmetry and unobserved heterogeneity, shipper behavior is probabilistic. A Multinomial Logit (MNL) model is employed to determine the probability that a shipper selects path a:
Given the demand of cargo batch , the flow on path is calculated as:
where represents the flow of cargo batch on path , denotes the demand of cargo batch , is the selection probability of path , and refers to the set of paths available for cargo batch .
Subject to:
Equation (21) shows that the sum of the flow of each path is equal to the total cargo volume. Equation (22) provides the constraint that the flow must be non-negative.
4. Solution Algorithm
The proposed bi-level model constitutes a Mixed-Integer Non-Linear Programming (MINLP) problem characterized by high dimensionality and specific constraints. The simultaneous presence of binary discrete variables and continuous variables (EACT configuration proportion ) renders the solution space complex and non-convex. Consequently, traditional exact solvers are computationally infeasible for large-scale instances due to the NP-hard nature of the problem.
While the weighted sum method is a prevalent approach for multi-objective problems, it transforms the vector optimization problem into a scalar one based on subjective weight assignments, which may introduce bias and fail to capture the true non-convex Pareto front. To overcome these limitations, this study employs the Non-dominated Sorting Genetic Algorithm II (NSGA-II). As a widely established multi-objective evolutionary algorithm (MOEA), NSGA-II integrates a fast non-dominated sorting mechanism with an elitist preservation strategy, enabling the efficient approximation of a diverse and well-converged Pareto-optimal solution set.
4.1. Evaluation Methodology
Multi-objective optimization typically yields a set of non-dominated solutions (Pareto front) rather than a single global optimum. To select the final compromise solution that best aligns with operational requirements, this study utilizes the Normalized Ideal Point Method. This method identifies the solution with the minimum Euclidean distance to a hypothetical “ideal point” in the objective space.
Given the disparate magnitudes of the three objectives—Total Cost , Carbon Trading Cost , and Time T—normalization is essential to eliminate scale bias. The evaluation function is formulated as follows:
4.2. Model Implementation via NSGA-II
The NSGA-II algorithm improves computational efficiency from O() to O() through its fast non-dominated sorting procedure. A crowding distance metric is employed to maintain population diversity without requiring external parameters. The specific implementation steps are outlined below and illustrated in Figure 2.
Figure 2.
NSGA-II algorithm flowchart (C*, E* and T* are the optimal values for cost, carbon emissions, and transportation time).
Step 1: Hybrid Encoding and Initialization: a hybrid chromosome coding scheme is designed to handle the mixed-variable nature of the problem.
- Binary Section: A matrix of size 3 ∗ n (where n is the number of cargo batches) encodes the transportation path. Each gene corresponds to a specific node-mode combination.
- Real-valued Section: A single continuous gene encodes the proportion variable for EACT deployment. A population of size N is initialized randomly, ensuring all constraints (e.g., flow conservation and mode exclusivity) are satisfied.
Step 2: Non-dominated Sorting and Selection: the population is stratified into varying non-domination levels (fronts) based on objective function values.
- Selection: A roulette wheel selection strategy is adopted to choose parent solutions for reproduction, prioritizing individuals with lower rank (better convergence) and larger crowding distance (better diversity).
Step 3: Evolutionary Operators: distinct genetic operators are applied to the different chromosome sections to maintain structural integrity:
- Crossover: uniform crossover is applied to the binary decision variables to exchange routing information between parents.
- Mutation: for binary variables: bit-flip mutation is performed with a low probability to introduce random variations in path selection.
- For the continuous variable : a random perturbation method (Gaussian mutation) is applied to explore the continuous search space of EACT proportions.
Step 4: Elitist Strategy and Iteration: An elitist strategy combines the parent and offspring populations. The combined population is sorted, and the top N individuals are selected to form the next generation. This ensures that the best solutions found so far are never lost. The process repeats until the maximum generation is reached.
Step 5: Final Decision-Making: Upon termination, the algorithm outputs the final Pareto front. The evaluation function defined in Equation (23) is applied to all non-dominated solutions. The solution minimizing is selected as the optimal transportation and configuration scheme.
In this study, the NSGA-II algorithm is tailored to solve the multi-objective bi-level programming model with a population size of 30 and a maximum of 20 generations. To address the scale disparity between the three objectives (cost, time, and emissions), a relative normalization method is implemented, defined as , which effectively stabilizes the non-dominated sorting process. The selection strategy integrates an elitist mechanism through environmental selection, ensuring the preservation of high-quality solutions across generations. Specifically, the optimal solution is determined from the final Pareto front using the ideal point method, which calculates the Euclidean distance between each normalized candidate and a theoretical ideal point (0, 0, 0). This approach ensures a balanced trade-off between economic and environmental objectives. The decision variables are managed through a hybrid structure, where routing decisions are reshaped into matrix forms and the EACT configuration ratio is optimized as a continuous variable, maintaining consistency between the bi-level decision-makers.
5. Numerical Analysis
This section assesses the practical applicability and computational efficiency of the proposed bi-level model through a series of numerical experiments. By applying the mathematical framework to a specific case study, the goal is to bridge the gap between theoretical modeling and real-world logistics decision-making. The subsequent sections provide a detailed description of the computational environment, parameter configurations, and a comprehensive multi-dimensional analysis of the experimental results.
5.1. Computational Environment
To ensure reproducibility and computational efficiency, all numerical experiments were conducted using MATLAB R2021b on a high-performance workstation. The experiments were conducted on a workstation equipped with an AMD Ryzen 7 PRO 7840HS processor (8-core/16-thread, 3.80 GHz), integrated AMD Radeon 780M graphics, and 16.0 GB DDR5 RAM. The operating system environment was Windows 11 Home (Version 23H2, 64-bit architecture).
5.2. Data and Parameter Settings
- (1)
- Cargo volume and distribution
Yangshan Port’s annual throughput reached approximately 25 million TEUs in 2023. Based on data from statistical yearbooks of the four hinterland cities (Nanjing, Wuhan, Chongqing, Chengdu) and eight relevant provinces, the specific cargo demand used in this study was derived. The demand is modeled as 40 discrete cargo batches following a normal distribution with a mean of 463 TEUs and a standard deviation () of 21.6. The spatial distribution of these batches corresponds to the hinterland economic structure: six batches from Nanjing, 10 from Wuhan, 19 from Chongqing, and five from Chengdu.
- (2)
- Network Parameters
The multimodal network topology is defined by specific transport distances and cost structures. Railway distances are based on official mileage charts from China Railway. Road distances were extracted via digital mapping services (Baidu Maps) connecting logistics centers to the Lingang Distribution Center. Waterway distances along the Yangtze River (from Longtan, Yangluo, and Guoyuan Ports to Wusongkou) were obtained from the Yangtze River Shipping Administration. Table 4 summarizes these distances.
Table 4.
Freight transportation distance (km).
- (3)
- Transportation and transshipment parameters
Table 5 details the transportation cost, speed, and carbon emissions by mode. Waterway transport base costs are differentiated by origin city. Therefore, the unit freight rates for transportation from three different departure cities, namely Nanjing, Wuhan, and Chongqing, to Shanghai are listed respectively. EACTs only incur marginal cost per kilometer. Among them, the price of railway transportation comes from the official railway bureau. The price of waterway container transportation comes from the Yangtze River Navigation Administration. The price of road transportation is calculated based on comprehensive fuel costs, tolls, driver salaries, and other factors. The price of EACT transportation is calculated based on the electricity price in Shanghai, electricity consumption per kilometer, maintenance, and other factors.
Table 5.
Freight transportation parameters.
The speed, unit carbon emissions of the transportation process, and the unit time, cost, and carbon emissions of the transit process in Table 6 are from reference [46]. Specific adjustments were made to account for the regional characteristics of the Yangtze River Delta.
Table 6.
Freight transshipment parameters.
- (4)
- Other parameters
Table 7 presents the values of the relevant parameters for EACTs. The operational parameters for Electric Autonomous Container Trucks (EACTs) are synthesized from manufacturer specifications and logistical demand modeling. Specifically, the unit acquisition cost and the depreciation period are directly sourced from the official technical brochures of leading EACT manufacturers in Shanghai. In contrast, the configuration coefficient and the maximum fleet capacity are derived through an inverse calculation based on the network’s service requirements. By incorporating empirical variables such as average vehicle speed, transport distances within the Yangshan hinterland, charging duration, and energy consumption rates, we determined the minimum fleet size necessary to sustain the forecasted container throughput under peak-period time constraints. In the logit model, the shipper’s preference parameters for cost and time are −0.663 and −0.275 [54].
Table 7.
Related parameters of EACTs.
5.3. Experimental Results
The analysis is organized to first verify the convergence of the algorithm, followed by an evaluation of the Pareto-optimal distribution plans. Additionally, the impact of variations in internal sensitivities and external shocks—such as policy changes or market disruptions—on the reconfiguration of the optimal network equilibrium and the resulting carbon footprint is investigated.
5.3.1. Algorithm Performance Verification
To verify the performance (including average solving time, convergence speed, objective function values) of the proposed NSGA-II algorithm, it was compared with a GA algorithm (using the ideal point method as the fitness function) and the LINGO solver, with each algorithm executed 20 times.
Experimental results in Table 8 demonstrate that NSGA-II significantly outperforms both GA and LINGO in terms of computational efficiency and convergence kinetics. Specifically, NSGA-II achieved an average solving time of 556.30 s, outpacing the GA (722.87 s) and LINGO (598.56 s) benchmarks. Furthermore, NSGA-II reached convergence in 1223.45 generations, effectively reducing the required iterations by 19.97% compared to GA and 8.36% relative to LINGO, which highlights its superior ability to navigate complex solution spaces with minimal computational overhead.
Table 8.
Comparison of algorithm performance.
In terms of optimization quality, NSGA-II delivered substantial refinements across all metrics, achieving reductions of 3.17% in transportation cost, 1.34% in carbon emissions, and 2.04% in transportation time compared to GA. It consistently surpassed LINGO across all indicators, underscoring its robust global search capabilities and its effectiveness in avoiding local optima. Crucially, NSGA-II exhibited the lowest standard deviations for all objective functions; this high level of consistency not only validates its algorithmic stability but also ensures reliable, reproducible results across diverse operational scenarios.
In summary, the designed NSGA-II algorithm outperforms both GA and LINGO across three critical dimensions: solving speed (including convergence efficiency), objective optimization quality, and computational stability. Consequently, the NSGA-II algorithm exhibits superior comprehensive performance in addressing multi-objective low-carbon transportation scheduling problems.
5.3.2. Optimization Result
The numerical experiment was initialized with a baseline carbon price of 70 CNY/ton , reflecting the prevailing market conditions in the Shanghai carbon trading market in 2024. The NSGA-II algorithm was executed with a population size of 500 for 2000 iterations. As illustrated in Figure 3, the objective function values for Total Cost, Carbon Emissions, and Transportation Time exhibit a stable downward trend and plateau after approximately 1200 iterations, indicating that the algorithm has achieved robust convergence.
Figure 3.
Convergence curve of the algorithm.
Figure 4 presents the resulting Pareto-optimal solution set. The distribution of the non-dominated solutions (blue data points) reveals the inherent conflict between economic efficiency and environmental performance. To select a scientifically viable operational plan from this set, the Normalized Ideal Point Method was employed. By normalizing the objective values to eliminate scale discrepancies, the solution with the minimum Euclidean distance to the theoretical ideal point (marked in red) was identified as the optimal compromise solution.
Figure 4.
Pareto solution.
The performance metrics for this optimal configuration are detailed as follows:
Economic Performance: the total network operation cost () is minimized to 82,050,267.53 CNY.
Operational Efficiency: the total transportation time () stands at 1,039,898.3 h, translating to an average transit time of 56.15 h per TEU.
Environmental Impact: the total carbon trading cost () is 480,614.4 CNY, corresponding to a total physical emission volume of 10,465.92 tons.
The spatial distribution and specific routing of cargo flow under this optimal scheme are visualized in Figure 5 and Figure 6. Figure 5 illustrates the overall transportation plan, while Figure 6 (Sankey Diagram) visually delineates the optimized multimodal freight allocation from the four hinterland cities to Yangshan Port. The width of the connecting bands corresponds to the cargo volume, while the colors—pink, yellow, and blue—represent railway, roadway, and waterway flows, respectively. As illustrated, the diagram reveals a distinct spatial heterogeneity in mode selection driven by the optimization model. For cities situated along the middle and upper reaches of the Yangtze River, particularly Chongqing and Wuhan, the blue bands flowing into the Waterway Transfer Center constitute the dominant modal share, reflecting the model’s preference for low-cost, low-carbon water transport for long-haul logistics. Conversely, Chengdu, restricted by geographical conditions, relies on a strategic combination of railway and roadway corridors. Notably, the diagram demonstrates a significant structural optimization: while roadway transport (indicated by yellow bands) remains essential for specific time-sensitive batches, its overall proportion is visibly compressed, with a substantial volume of freight diverted towards the Railway and Waterway Transfer Centers. Specifically, the proportion of goods transported by railway using EACTs for transportation is 33.87%, while the proportion of goods transported by road using EACTs for transportation is 25.03%.
Figure 5.
Freight transportation plan.
Figure 6.
Sankey diagram illustrating the mode and volume of freight flow across hinterland cities and transshipment nodes.
Figure 5 and Figure 6 present the spatial freight flow distribution and the specific routing selection of the optimized network. The results indicate a strategic integration of inland waterways and the strategic deployment of EACTs. Specifically, for long-distance hinterland cities such as Chongqing and Wuhan, the model yields a high concentration of waterway transport (exceeding 70% in Figure 6), which effectively leverages the low-carbon advantage of the Yangtze River’s “golden waterway” to mitigate carbon trading costs. In the critical “last-mile” segments—linking Luchaogang and Lingang nodes to Yangshan Port—the optimization replaces traditional heavy-duty trucks with EACTs. Figure 6 reveals that 33.87% of rail-to-road transshipment and 25.03% of road-to-road transshipment flows are now handled by EACTs. This targeted configuration demonstrates that EACTs are most economically viable in high-frequency, short-distance shuttle scenarios, providing a synergy between operational efficiency and emission reduction.
Baseline Scenario (Status Quo): The existing network is heavily reliant on road transport, which accounts for 58.0% of the freight volume, while railway and waterway transport account for only 12.5% and 29.5%, respectively. The proposed model drives a significant modal shift. The optimization results show a marked reduction in road transport dependency, balanced by a substantial increase in rail and water-based intermodal flows. This comparison confirms that the bi-level programming model effectively guides the network toward a more sustainable structure by leveraging the synergy between carbon trading mechanisms and EACT deployment, significantly outperforming the traditional, road-dominant logistics pattern.
Figure 7, Figure 8 and Figure 9 provide a comparative assessment of the network’s performance against the baseline. Figure 7 highlights a decisive “modal shift” away from road dependency; the traditional road transport share, which stood at 58.0% in the baseline scenario, is substantially redistributed to rail and water-based intermodal chains. Figure 8 further breaks down this shift at the city level, showing that even for inland hubs like Chengdu, the optimized mix of rail and road transport significantly lowers the carbon intensity per TEU. Collectively, as shown in Figure 9, this structural optimization leads to a net reduction of 10,465.92 tons in carbon emissions compared to the traditional road-dominant logistics pattern. This confirms that the bi-level model does not merely seek the shortest path, but dynamically balances transportation time and environmental costs through the carbon trading mechanism, guiding the entire collection-distribution network toward a sustainable equilibrium.
Figure 7.
Overall transportation structure.
Figure 8.
Transportation modal share by city.
Figure 9.
Optimized transport mode distribution by city.
5.3.3. Sensitivity Analysis
To rigorously evaluate the robustness of the proposed model and understand the mechanism of policy instruments, two sensitivity scenarios were analyzed. The focus was placed on the carbon trading price () and the carbon quota (), as these are the primary regulatory levers determining the efficacy of the “Cap-and-Trade” mechanism in logistics networks.
- (1)
- Impact of Carbon Trading Price
The carbon trading price serves as a market signal that internalizes environmental externalities into operational costs. In this analysis, the carbon quota was fixed at 3600 tons, while was varied between 50, 70, and 90 CNY/ton .
As illustrated in Table 9 and Figure 10, the results reveal a distinct trade-off between economic-environmental performance and time efficiency: In the low-price scenario (50 CNY/ton ), the financial penalty for emissions is insufficient to drive significant structural change. The system prioritizes faster, carbon-intensive road transport, resulting in an 8.73% reduction in delivery time. However, this comes at the cost of higher emissions (+4.78%) and increased total logistic costs (+11.24%). The adoption of EACTs in Luchao Port and Lingang Distribution Center have decreased to 23.46% and 33.87%, respectively, indicating that low carbon prices fail to cover the marginal abatement cost of green technology. In the high-price scenario (90 CNY/ton ), the cost of emissions becomes a dominant factor. The model forces a modal shift towards lower-emission but slower modes (rail and waterway). Consequently, transportation costs decrease by 12.75% (due to the lower base tariffs of rail/water), and emissions drop by 6.98%. However, the average transportation time increases significantly by 9.81%. Notably, the adoption of EACTs in Luchao Port and Lingang Distribution Center has decreased to 30.88% and 33.98%, demonstrating a non-linear threshold effect: once the carbon price exceeds a critical value, the operational savings from emission reductions outweigh the capital costs of EACTs.
Table 9.
Summarizes the variations in key performance metrics.
Figure 10.
Transport structure under different carbon quota.
These findings suggest that the carbon price acts as a filter for transport modes. A higher price effectively “prices out” long-haul road transport, relegating it to a “last-mile” feeder role. This structural reconfiguration highlights the urgency of expanding railway and waterway infrastructure capacity. Furthermore, the non-linear increase in the proportion of EACT transportation between Luchao Port and Lingang Distribution Center to Yangshan Port proves that EACTs are economically viable substitutes for diesel trucks only under robust carbon pricing regimes. Port authorities must therefore align their fleet electrification strategies with market price forecasts to maximize ROI.
- (2)
- Impact of Carbon Quota
The carbon quota acts as a hard constraint on the total allowable emissions. Assuming a baseline price of 70 CNY/ton , the quota was adjusted in increments of 600 tons relative to the baseline (3600 tons). The results are presented in Table 10.
Table 10.
Analysis of carbon quota.
As illustrated in Table 10 and Figure 11, tightening the carbon quota to 3000 tons leads to lower costs (−8.02%) and emissions (−4.23%), albeit at the expense of a 6.27% increase in transport time. Crucially, the EACT proportion in Luchao Port and Lingang Distribution Center ( and ) peaks at 35.08% and 46.71%. Under strict constraints, the operator is compelled to maximize the use of zero-emission vehicles to stay within the cap and avoid punitive purchase costs. Conversely, loosening the quota to 4200 tons results in higher emissions and costs but reduces time by 7.12%. The proportion of EACTs in Luchao Port and Lingang Distribution Center ( and ) also shifts significantly, increasing under stricter quotas and decreasing under looser ones.
Figure 11.
Transport structure under different carbon trading prices.
Notably, road transport declines by 5.7% and 7.2% as the quota decreases from 4200 to 3600 and then to 3000, respectively, while waterway usage increases by 5.4% and 6.8%. Although railway transport is constrained by capacity, it still shows a marginal increase.
The analysis of modal shares (road transport declining by ~7% under stricter quotas) confirms that the carbon quota is a decisive tool for controlling the aggregate “greenness” of the network. Unlike the price mechanism, which influences decisions through cost incentives, the quota sets a physical boundary. The results imply that stricter quotas are more effective than moderate price increases in driving the immediate adoption of EACTs and promoting multimodal transport, albeit at the expense of supply chain velocity. This suggests that during the early stages of decarbonization, policymakers should prioritize quota management to ensure structural transformation.
5.3.4. Discussion of Results
The numerical analysis results of this study not only validate the feasibility of the multi-objective bi-level programming model but also provide valuable insights into the complex trade-offs involved in optimizing the transportation and distribution network at Yangshan Port, as well as the configuration of Electric Autonomous Container Trucks (EACTs) under carbon emission constraints. A key contribution of this research lies in the generation of a Pareto-optimal solution set that incorporates costs, time, and carbon trading costs, clearly illustrating the inherent conflicts and non-linear relationships among these objectives. In particular, the trade-off between cost and carbon emissions is evident: as the intensity of carbon trading increases, the transportation structure shifts toward lower-carbon modes such as water and rail transport. While this transition effectively reduces overall carbon emissions, it typically results in an increase in total transportation time. This illustrates a clear tension between environmental goals and operational efficiency.
Furthermore, the study demonstrates the strategic value of the compromise solution selected using the normalized ideal point method, which helps identify an acceptable balance. This approach ensures that the low-carbon transition does not impose excessive negative impacts on transportation costs and time, providing a practical means of addressing conflicting objectives in decision-making. Sensitivity analysis reveals a more nuanced relationship between the configuration ratio of EACTs ( and ) and the strength of carbon policies. In scenarios with low carbon prices, the substantial initial investment and operating costs of EACTs tend to outweigh the carbon reduction benefits. However, once carbon prices reach a certain critical threshold, the cumulative savings from carbon trading, combined with the efficiency gains from automation, become sufficient to offset the high initial capital expenditures, thereby triggering a rapid increase in the optimal EACT configuration ratio.
This finding carries an important policy implication: for the widespread adoption of high-investment, low-carbon technologies like EACTs to be feasible, carbon regulations must reach a level of intensity that effectively drives this transition. The analysis suggests that carbon pricing alone may not suffice without substantial regulatory support to incentivize large-scale technological adoption. The comparative analysis of different policy instruments highlights the complementary roles of carbon quotas and carbon pricing. Carbon quotas, as a regulatory tool, exert stronger coercive pressure for structural changes, while carbon pricing offers market flexibility, fostering continuous efficiency improvements. Therefore, an effective decarbonization strategy may involve a combined approach, leveraging the coercive power of quotas to enforce necessary structural transformations, while utilizing carbon pricing to provide flexibility and sustained incentives for ongoing progress.
However, the transition toward a highly automated, low-carbon logistics paradigm at Yangshan Port is not merely a techno-economic challenge but a socio-technical shift with profound distributional implications. From an equity perspective, the systemic substitution of traditional labor with EACTs risks creating “structural friction” in the employment market; the potential displacement of long-haul drivers could exacerbate socio-economic vulnerability unless accompanied by sophisticated labor-transition frameworks that bridge the gap between manual skills and high-tier autonomous system management. Additionally, there is a latent risk of “infrastructure polarization”. If the deployment of high-capacity charging networks and autonomous-ready corridors is spatially concentrated around the core port area, it may inadvertently widen regional disparities, leaving peripheral hinterland hubs in a state of technological lock-in and competitive disadvantage.
Crucially, the high capital barriers to EACT adoption may induce a market-clearing effect, where small and medium enterprises with asymmetric adaptive capacities are marginalized by large-scale operators. Without targeted redistributive policies or shared-infrastructure mandates, the costs of the low-carbon transition may ultimately be passed down to vulnerable end-users, compromising the affordability of essential transportation services. Achieving a “Just Transition” therefore requires that the optimization of efficiency and carbon reduction be balanced against the imperative of inclusive growth and social resilience.
5.3.5. Impact of External Shocks
Although the current model is primarily optimized based on steady-state conditions, external shocks such as economic crises and financial recessions, global pandemics and public health crises, natural disasters and extreme weather events, and policy and regulatory changes can have a significant impact on the operation of logistics networks.
Economic crises and financial recessions lead to a sharp decline in transportation demand, causing financial pressure on companies, which in turn reduces transportation and logistics expenditures and causes supply chain disruptions, particularly affecting the demand for high-carbon traditional modes. Global pandemics and public health crises cause disruptions in logistics chains, with transportation companies facing operational restrictions, resulting in increased demand fluctuations, transportation cost and time volatility, and a rise in demand for automation and contactless transportation modes. Natural disasters and extreme weather events can damage transportation infrastructure, interrupt transport routes, disrupt cargo flow, and reduce transportation efficiency, especially impacting less flexible transportation modes. Changes in policies and regulations, particularly environmental policies and carbon emission regulations, directly affect transportation costs and mode selection, while changes in trade barriers and tariff policies can alter the overall structure of transportation networks.
Overall, these external factors mainly affect the following aspects of the collection and distribution network: (1) transportation demand, (2) transportation costs, (3) transportation efficiency and time, (4) supply chain stability, (5) mode selection, and (6) carbon emission policies. To address this, the model can estimate the impact of external shocks on model parameters and adjust them accordingly, enabling the model to adapt under different external influences. For example, constraints can be modified to simulate scenarios where certain routes or nodes are non-operational or have reduced efficiency due to natural disasters. Parameter matrices can also be adjusted to simulate changes in freight demand, unit costs, and transportation efficiency. The impact of policies and regulations can be reflected by adjusting parameters or adding new ones, as discussed in Section 5.3.3 regarding changes in carbon pricing and quotas.
To enhance the model’s adaptability and reliability, future research could conduct more detailed sensitivity analyses to simulate network responses under external shock scenarios, assessing the robustness of the transportation system under these conditions. This would not only help reveal how the model performs in extreme situations but also provide practical recommendations for policymakers and logistics operators on how to make flexible adjustments during crises.
6. Conclusions
To provide a comprehensive wrap up of the study, this section synthesizes the key results and discusses their practical value in real-world logistics scenarios. It moves beyond basic data summary to interpret how these findings influence sustainable development goals. The discussion is divided into three sequential parts, starting with actionable policy guidance, moving to an honest reflection on the study boundaries, and concluding with suggested directions for subsequent academic inquiry.
6.1. Policy Recommendations
This study establishes a multi-objective bi-level programming framework to optimize the collection-distribution network of Yangshan Port, focusing on the integration of EACTs and carbon trading mechanisms. A notable finding from our analysis is the non-linear relationship between carbon pricing and the adoption of different transportation modes, which presents a somewhat counterintuitive result. Specifically, while increasing carbon prices initially lead to a strong shift from road transport to rail, the transition plateaus at higher carbon price thresholds. This plateau occurs due to infrastructure limitations at inland ports, a structural bottleneck that restricts further modal shifts. This insight suggests that carbon pricing alone is insufficient for achieving complete decarbonization in port logistics systems. Instead, the deployment of EACTs, particularly on “last-mile” segments such as the Luchao–Lingang–Yangshan corridor, plays a critical role in bridging the emission reduction gap once the modal shift reaches its limit.
The results also highlight a significant trade-off between transportation time and environmental costs. Under certain conditions, the model favors longer rail–water transport routes over direct road transport, indicating that, in a mature carbon market, “logistics efficiency” must extend beyond time-based metrics to include environmental costs. This redefines the concept of efficiency, incorporating both environmental sustainability and operational effectiveness into the decision-making process.
Building on the findings and sensitivity analyses, the following targeted recommendations are offered to inform policy and operational strategies:
- (1)
- The simulation results underscore the “Luchao–Lingang–Yangshan” corridor as the most optimal region for deploying EACTs, with 33.87% and 25.03% of rail and road transshipment, respectively. This suggests that specific geographic areas should be prioritized for EACT deployment. Unlike generalized electrification strategies, we propose a phased “Dedicated Lane” approach for the Donghai Bridge to optimize EACT throughput and mitigate the safety risks of mixed-flow traffic. Investment in infrastructure, particularly in 5G-enabled V2X systems, should be prioritized at key nodes, such as the Lingang hub, ensuring these systems are timed to align with projected cargo peaks, as identified in our experiments.
- (2)
- Sensitivity analysis reveals that rigid carbon quotas lead to severe cost penalties during peak demand periods. To address this, a “Flexible Quota Reserve” should be established, allowing for temporary quota borrowing during high-demand seasons. Additionally, to ensure the economic viability of EACTs, we recommend the implementation of a Price-Floor policy in the local carbon market. This policy would ensure that carbon prices remain sufficiently high to maintain the competitiveness of electric fleets against diesel alternatives, fostering continued investment in sustainable technologies.
- (3)
- Given the limitations of current rail and water transport schedules, policies should incentivize the development of Synchromodal Logistics Platforms. These platforms would leverage real-time data to dynamically re-route cargo, optimizing transport based on fluctuations in carbon pricing and market conditions. Additionally, a “Revenue Recycling” mechanism should be established, where proceeds from carbon taxes or penalties are earmarked to support EACT fleet investments, creating a self-sustaining financial loop that funds ongoing green initiatives at the port.
- (4)
- Mitigating the employment market disruptions caused by the adoption of Electric Autonomous Container Trucks, it is necessary to establish a transition fund specifically targeting the logistics workforce. This policy should go beyond simple financial compensation and include subsidies for comprehensive vocational retraining programs to help workers transition from manual driving to autonomous system management. By fostering partnerships between port operators, technology providers, and vocational institutions, the government can facilitate the integration of displaced drivers into emerging, higher-level roles, such as remote fleet monitoring and maintenance specialists for Electric Autonomous Container Trucks. This framework would ensure that technological advancements do not exacerbate socio-economic inequalities but instead promote the development of a resilient and future-ready workforce.
- (5)
- To prevent regional disparities in infrastructure development and the marginalization of small and medium-sized enterprises, the transportation sector should implement an Inclusive Green Infrastructure Initiative. This initiative would involve expanding high-capacity charging networks and autonomous corridors from central areas to peripheral hubs, thus avoiding the risk of regional technological exclusion. Furthermore, to address the significant capital investment barriers to the adoption of Electric Autonomous Container Trucks, targeted financial incentives should be provided, such as low-interest Green Transition Loans and Infrastructure-as-a-Service models specifically designed for small and medium-sized enterprises.
The aforementioned recommendations enable the tripartite sustainable evolution of Yangshan Port’s collection-distribution network—integrating technological advancement, economic feasibility, and social equity. This fosters the construction of a globally competitive, low-carbon, and intelligent port system, while simultaneously establishing a paradigm for ‘Just Transition’ that upholds social resilience.
6.2. Research Limitations
While this study provides instrumental insights into the strategic configuration of Electric Autonomous Container Trucks (EACTs) within the Yangshan Port intermodal network, several inherent limitations warrant acknowledgment.
The empirical foundation of this research is primarily anchored in the Phase IV pilot project of Yangshan Port. Given that the global deployment of large-scale EACT technology remains in its nascent stages, the model’s parameters were meticulously calibrated to this specific operational environment. This geographical specificity implies that the findings may exhibit sensitivity to local conditions and might not be seamlessly generalizable to other maritime hubs characterized by divergent hinterland topographies or disparate levels of digital infrastructure. The current lack of cross-port longitudinal data further underscores the need for cautious interpretation regarding the universal validation of the proposed framework.
Beyond the constraints of geographic scope, a notable simplification exists regarding the representation of cargo damage costs within the multimodal chain. Despite being a critical component of total logistics expenditures, cargo damage was treated with an attenuated estimation approach, owing to the paucity of empirical industry benchmarks and standardized performance metrics for autonomous freight modes. Consequently, the assumption of minimal cargo damage costs may potentially obscure the latent economic risks associated with high-value or fragile commodities in a complex, multi-layered transport ecosystem.
The static nature of the analytical framework also presents certain limitations, as it relies heavily on deterministic demand projections. In practical application, port collection and distribution networks are inherently stochastic, shaped by dynamic variables such as transient traffic congestion, the randomness of vehicle charging cycles, and volatile market demand shifts. By failing to fully internalize these uncertainties, the current model may not completely capture the operational volatility fundamental to the transition toward intelligent port systems.
Lastly, the evaluation of environmental dividends could be further refined by broadening the scope of the carbon footprint analysis. The present study omits a comprehensive Life Cycle Assessment (LCA) of battery production and disposal, as well as the temporal fluctuations in the carbon intensity of the regional power grid. Integrating these broader environmental dimensions would be essential to yield a more holistic evaluation of the genuine ecological impact exerted by EACT fleets in a sustainable logistics context.
6.3. Future Research
This study provides an initial exploration of the Yangshan Port collection and distribution network, as well as the configuration of Electric Autonomous Container Trucks (EACTs). However, this study is not without limitations, and future research can build upon the following directions:
- (1)
- Due to the early-stage application of EACT technology, with only a few ports globally (such as Phase IV of Yangshan Port) having implemented large-scale pilots, obtaining multi-port comparative data remains challenging. As EACT technology continues to be deployed across more ports in the future, subsequent studies can expand the model to cover multiple ports with varying scales and operational modes. By conducting cross-case analyses, port-specific parameters and common parameters can be identified, thus validating and improving the generalizability and versatility of the model.
- (2)
- Cargo damage costs are an important component of the broader transportation cost in multimodal transport systems. Although this study found that the impact of cargo damage on total costs is minor and empirical coefficients are scarce, future research should focus on establishing a more scientific and accurate cargo damage rate evaluation system for different modes of transportation (road, rail, and waterway) through extensive field surveys and industry data collection. By incorporating high-confidence cargo damage models into the optimization framework, a more realistic simulation of the complex and dynamic transportation environment can be achieved.
- (3)
- This study primarily relied on deterministic demand forecasting and static parameters for network configuration. Future research should further consider dynamic uncertainties, such as traffic congestion, vehicle charging randomness, and fluctuations in cargo demand. By introducing real-time scheduling algorithms or digital twin technology, research on the collaborative optimization of EACTs in dynamic network environments can not only improve fleet utilization efficiency but also further explore carbon emission reduction potentials. This would provide more practical decision-making support for the low-carbon transformation of smart ports.
Author Contributions
Conceptualization, Y.K. and L.X.; Methodology, Y.K., L.X., Q.W. and Z.Y.; Investigation, L.X., Q.W. and Z.Y.; Data Curation and Formal Analysis, Z.Y.; Writing—Original Draft Preparation, Y.K. and L.X.; Writing—Review and Editing, Y.K., L.X. and Z.Y.; Validation, Q.W.; Funding Acquisition and Project Administration, Y.K. and Q.W. All authors have read and agreed to the published version of the manuscript.
Funding
This research was funded by the Shanghai Sailing Program (No. 23YF1416300) and the Shanghai Philosophy and Social Science Planning Project (Youth Project) (No. 2025EZH004).
Data Availability Statement
The original contributions presented in this study are included in the article material. Further inquiries can be directed to the corresponding author.
Conflicts of Interest
Author Qile Wu is employed by company Zhejiang Huawei Telecommunication Technologies Co., Ltd. The remaining authors declare that the research was conducted in the absence of any commercial or financial relationships that could be construed as a potential conflict of interest.
Abbreviations
The following abbreviations are used in this manuscript:
| NSGA-II | Non-dominated Sorting Genetic Algorithm II |
| EACT | Electric automatic container truck |
References
- He, Q. Analysis on the Present Situation Problems and Countermeasures of Shanghai Port Collection and Distribution System. Int. Core J. Eng. 2021, 7, 217–223. [Google Scholar]
- Feo, M.; Espino, R.; Garcia, L. An stated preference analysis of Spanish freight forwarders modal choice on the south-west Europe Motorway of the Sea. Transp. Policy 2011, 18, 60–67. [Google Scholar] [CrossRef] [Scilit]
- Fulzele, V.; Shankar, R.; Choudhary, D. A model for the selection of transportation modes in the context of sustainable freight transportation. Ind. Manag. Data Syst. 2019, 119, 1764–1784. [Google Scholar] [CrossRef] [Scilit]
- Guo, X.; He, J.; Lan, M.; Yu, H.; Yan, W. Modeling carbon emission estimation for hinterland-based container intermodal network. J. Clean. Prod. 2022, 378, 134593. [Google Scholar] [CrossRef] [Scilit]
- Zhang, H.; Li, Y.; Zhang, Q.; Chen, D. Route selection of multimodal transport based on China railway transportation. J. Adv. Transp. 2021, 2021, 9984659. [Google Scholar] [CrossRef] [Scilit]
- Crainic, T.G.; Perboli, G.; Rosano, M. Simulation of intermodal freight transportation systems: A taxonomy. Eur. J. Oper. Res. 2018, 270, 401–418. [Google Scholar] [CrossRef] [Scilit]
- Banomyong, R.; Beresford, A.K. Multimodal transport: The case of Laotian garment exporters. Int. J. Phys. Distrib. Logist. Manag. 2001, 31, 663–685. [Google Scholar] [CrossRef] [Scilit]
- Brooks, M.R.; Puckett, S.M.; Hensher, D.A.; Sammons, A. Understanding mode choice decisions: A study of Australian freight shippers. Marit. Econ. Logist. 2012, 14, 274–299. [Google Scholar] [CrossRef] [Scilit]
- You, K.; Yu, M.; Yu, Q. Research and Application on Design of Underground Container Logistics System Based on Autonomous Container Truck. In Proceedings of the IOP Conference Series: Earth and Environmental Science, BSD City, Indonesia, 23–24 October 2019; Volume 330, p. 022054. [Google Scholar]
- Zhou, Y.; Fang, W.; Li, M.; Liu, W. Exploring the impacts of a low-carbon policy instrument: A case of carbon tax on transportation in China. Resour. Conserv. Recycl. 2018, 139, 307–314. [Google Scholar] [CrossRef] [Scilit]
- Jia, Z.; Lin, B. Rethinking the choice of carbon tax and carbon trading in China. Technol. Forecast. Soc. Change 2020, 159, 120187. [Google Scholar] [CrossRef] [Scilit]
- Li, J.; Du, Q.; Lu, C.; Huang, Y.; Wang, X. Simulations for double dividend of carbon tax and improved energy efficiency in the transportation industry. Environ. Sci. Pollut. Res. 2023, 30, 19083–19096. [Google Scholar] [CrossRef] [Scilit] [PubMed]
- Li, Y.; Lim, M.K.; Hu, J.; Tseng, M.L. Investigating the Effect of Carbon Tax and Carbon Quota Policy to Achieve Low Carbon Logistics Operations. Resour. Conserv. Recycl. 2020, 154, 104535. [Google Scholar] [CrossRef] [Scilit]
- Dai, Q.; Yang, J.; Li, D. Modeling a three-mode hybrid port-hinterland freight intermodal distribution network with environmental consideration: The case of the Yangtze river economic belt in China. Sustainability 2018, 10, 3081. [Google Scholar] [CrossRef] [Scilit]
- Zhang, M.; Janic, M.; Tavasszy, L.A. A freight transport optimization model for integrated network, service, and policy design. Transp. Res. Part E Logist. Transp. Rev. 2015, 77, 61–76. [Google Scholar] [CrossRef] [Scilit]
- Hao, C.; Yue, Y. Optimization on combination of transport routes and modes on dynamic programming for a container multimodal transport system. Procedia Eng. 2016, 137, 382–390. [Google Scholar] [CrossRef] [Scilit]
- Zhao, C.; Tang, J.; Gao, W.; Zeng, Y.; Li, Z. Many-objective optimization of multi-mode public transportation under carbon emission reduction. Energy 2024, 286, 129627. [Google Scholar] [CrossRef] [Scilit]
- Wang, X.; Meng, Q. Discrete intermodal freight transportation network design with route choice behavior of intermodal operators. Transp. Res. Part B 2017, 95, 76–104. [Google Scholar] [CrossRef] [Scilit]
- Wang, Q.; Chen, J.; Tseng, M.L.; Luan, H.M.; Ali, M.H. Modelling green multimodal transport route performance with witness simulation software. J. Clean. Prod. 2020, 248, 119245. [Google Scholar] [CrossRef] [Scilit]
- Heinold, A.; Meisel, F. Emission limits and emission allocation schemes in intermodal freight transportation. Transp. Res. Part E Logist. Transp. Rev. 2020, 141, 101963. [Google Scholar] [CrossRef] [Scilit]
- Pfoser, S.; Kotzab, H.; Bäumler, I. Antecedents, mechanisms and effects of synchromodal freight transport: A conceptual framework from a systematic literature review. Int. J. Logist. Manag. 2022, 33, 190–213. [Google Scholar] [CrossRef] [Scilit]
- Arencibia, A.I.; Feo-Valero, M.; García-Menéndez, L.; Román, C. Modelling mode choice for freight transport using advanced choice experiments. Transp. Res. Part A Policy Pract. 2015, 75, 252–267. [Google Scholar] [CrossRef] [Scilit]
- Yang, X.; Low, J.M.; Tang, L.C. Analysis of intermodal freight from China to Indian Ocean: A goal programming approach. J. Transp. Geogr. 2011, 19, 515–527. [Google Scholar] [CrossRef] [Scilit]
- Bräysy, O.; Dullaert, W.; Gendreau, M. Evolutionary algorithms for the vehicle routing problem with time windows. J. Heuristics 2004, 10, 587–611. [Google Scholar] [CrossRef] [Scilit]
- Ramanathan, R. A holistic approach to compare energy efficiencies of different transport modes. Energy Policy 2000, 28, 743–747. [Google Scholar] [CrossRef] [Scilit]
- Ziliaskopoulos, A.; Wardell, W. An intermodal optimum path algorithm for multimodal networks with dynamic arc travel times and switching delays. Eur. J. Oper. Res. 2000, 125, 486–502. [Google Scholar] [CrossRef] [Scilit]
- Lozano, A.; Storchi, G. Shortest viable path algorithm in multimodal networks. Transp. Res. Part A 2001, 35, 225–241. [Google Scholar] [CrossRef] [Scilit]
- Krajewska, M.A.; Kopfer, H. Transportation planning in freight forwarding companies: Tabu search algorithm for the integrated operational transportation planning problem. Eur. J. Oper. Res. 2009, 197, 741–751. [Google Scholar] [CrossRef] [Scilit]
- Bei, H.; Lin, H.; Yang, F.; Li, X.; Murcio, R.; Yang, T. Optimization on multimodal network considering time window under uncertain demand. IEEE Trans. Intell. Transp. Syst. 2025, in press. [Google Scholar] [CrossRef] [Scilit]
- Cui, T.; Shi, Y.; Wang, J.; Ding, R.; Li, J.; Li, K. Practice of an improved many-objective route optimization algorithm in a multimodal transportation case under uncertain demand. Complex Intell. Syst. 2025, 11, 136. [Google Scholar] [CrossRef] [Scilit]
- Peng, Y.; Luo, Y.J.; Jiang, P.; Yong, P.C. The route problem of multimodal transportation with timetable: Stochastic multi-objective optimization model and data-driven simheuristic approach. Eng. Comput. 2022, 39, 587–608. [Google Scholar] [CrossRef] [Scilit]
- Zhao, Y.; Xue, Q.; Cao, Z.; Zhang, X. A Two-Stage Chance Constrained Approach with Application to Stochastic Intermodal Service Network Design Problems. J. Adv. Transp. 2018, 2018, 6051029. [Google Scholar] [CrossRef] [Scilit]
- Xie, Y.; Lu, W.; Wang, W.; Quadrifoglio, L. A multimodal location and routing model for hazardous materials transportation. J. Hazard. Mater. 2012, 227–228, 135–141. [Google Scholar] [CrossRef] [Scilit] [PubMed]
- Pizzol, M. Deterministic and stochastic carbon footprint of intermodal ferry and truck freight transport across Scandinavian routes. J. Clean. Prod. 2019, 224, 626–636. [Google Scholar] [CrossRef] [Scilit]
- Larranaga, A.M.; Arellana, J.; Senna, L.A. Encouraging intermodality: A stated preference analysis of freight mode choice in Rio Grande do Sul. Transp. Res. Part A 2016, 102, 202–211. [Google Scholar] [CrossRef] [Scilit]
- Sun, H.; Gao, Z.; Wu, J. A bi-level programming model and solution algorithm for the location of logistics distribution centers. Appl. Math. Model. 2008, 32, 610–616. [Google Scholar] [CrossRef] [Scilit]
- Assadipour, G.; Ke, G.Y.; Verma, M. A toll-based bi-level programming approach to managing hazardous materials shipments over an intermodal transportation network. Transp. Res. Part D Transp. Environ. 2016, 47, 208–221. [Google Scholar] [CrossRef] [Scilit]
- Binsuwadan, J.; De Jong, G.; Batley, R.; Wheat, P. The value of travel time savings in freight transport: A meta-analysis. Transportation 2022, 49, 1183–1209. [Google Scholar] [CrossRef] [Scilit]
- Sun, Y.; Zhang, C.; Chen, A.; Sun, G. Modeling a Green and Reliable Intermodal Routing Problem for Food Grain Transportation Under Carbon Tax and Trading Regulations and Multi-Source Uncertainty. Systems 2024, 12, 547. [Google Scholar] [CrossRef] [Scilit]
- Zhang, Y.; Guo, Y.; Huang, Y.; Ge, S. A low-carbon scheduling method based on improved ant colony algorithm for underground electric transportation vehicles. Complex Intell. Syst. 2025, 11, 166. [Google Scholar] [CrossRef] [Scilit]
- Qiao, Q.; Tao, F.; Wu, H.; Yu, X.; Zhang, M. Optimization of a Capacitated Vehicle Routing Problem for Sustainable Municipal Solid Waste Collection Management Using the PSO-TS Algorithm. Int. J. Environ. Res. Public Health 2020, 6, 2163. [Google Scholar] [CrossRef] [Scilit] [PubMed]
- Jarumaneeroj, P.; Krairiksh, S.; Dusadeerungsikul, P.O.; Li, D.; Iris, Ç. Eco-friendly long-haul perishable product transportation with multi-compartment vehicles. Comput. Ind. Eng. 2025, 202, 110934. [Google Scholar] [CrossRef] [Scilit]
- Oliveira, J.L.A.; Aquino, A.L.L.; Pinheiro, R.G.S.; Nogueira, B. Optimizing public transport system using biased random-key genetic algorithm. Appl. Soft Comput. 2024, 158, 111578. [Google Scholar] [CrossRef] [Scilit]
- Guo, Q.; Yin, C.; Zheng, S. An intermodal transport network planning scheme considering carbon emissions. Energy 2025, 322, 135564. [Google Scholar] [CrossRef] [Scilit]
- Deb, K.; Agrawal, S.; Pratap, A.; Meyarivan, T. A Fast and Elitist Multiobjective Genetic Algorithm: NSGA-II. IEEE Trans. Evol. Comput. 2002, 6, 182–197. [Google Scholar] [CrossRef] [Scilit]
- Yin, C.; Zhang, Z.A.; Fu, X.; Ge, Y.E. A low-carbon transportation network: Collaborative effects of a rail freight subsidy and carbon trading mechanism. Transp. Res. Part A 2024, 184, 104066. [Google Scholar] [CrossRef] [Scilit]
- Li, S.; Zhang, M.; Wang, N.; Cao, R.; Zhang, Z.; Ji, Y.; Li, H.; Wang, H. Intelligent scheduling method for multi-machine cooperative operation based on NSGA-III and improved ant colony algorithm. Comput. Electron. Agric. 2023, 204, 107532. [Google Scholar] [CrossRef] [Scilit]
- Ciro, G.C.; Dugardin, F.; Yalaoui, F.; Kelly, R. A NSGA-II and NSGA-III Comparison for Solving an Open Shop Scheduling Problem with Resource Constraints. IFAC-PapersOnLine 2016, 49, 1272–1277. [Google Scholar] [CrossRef] [Scilit]
- Yang, Z.; Xin, X.; Chen, K.; Yang, A. Coastal container multimodal transportation system shipping network design—Toll policy joint optimization model. J. Clean. Prod. 2021, 279, 123340. [Google Scholar] [CrossRef] [Scilit]
- Chen, X.; Hu, X.; Liu, H. Low-carbon route optimization model for multimodal freight transport considering value and time attributes. Socio-Econ. Plan. Sci. 2024, 96, 102108. [Google Scholar] [CrossRef] [Scilit]
- Li, M.; Sun, X. Path optimization of low-carbon container multimodal transport under uncertain conditions. Sustainability 2022, 14, 14098. [Google Scholar] [CrossRef] [Scilit]
- Yin, C.; Zeng, L.; Fu, X.; Zhong, M. Transition of multimodal transport network under different carbon price scenarios. Transp. Policy 2025, 164, 1–26. [Google Scholar] [CrossRef] [Scilit]
- Hasiri, A.; Kermanshah, A. Exploring the Role of Autonomous Trucks in Addressing Challenges within the Trucking Industry: A Comprehensive Review. Systems 2024, 12, 320. [Google Scholar] [CrossRef] [Scilit]
- Rich, J.; Holmblad, P.M.; Hansen, C.O. A Weighted Logit Freight Mode-Choice Model. Transp. Res. Part E Logist. Transp. Rev. 2009, 45, 1006–1019. [Google Scholar] [CrossRef] [Scilit]
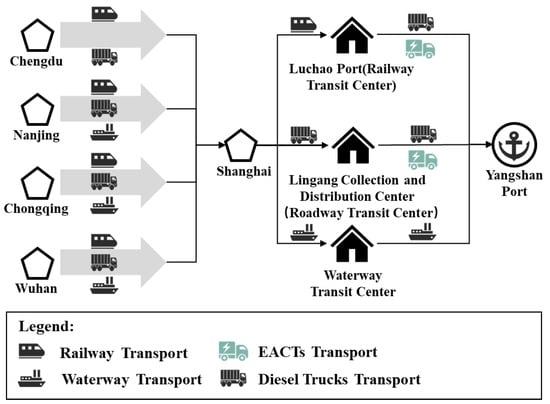
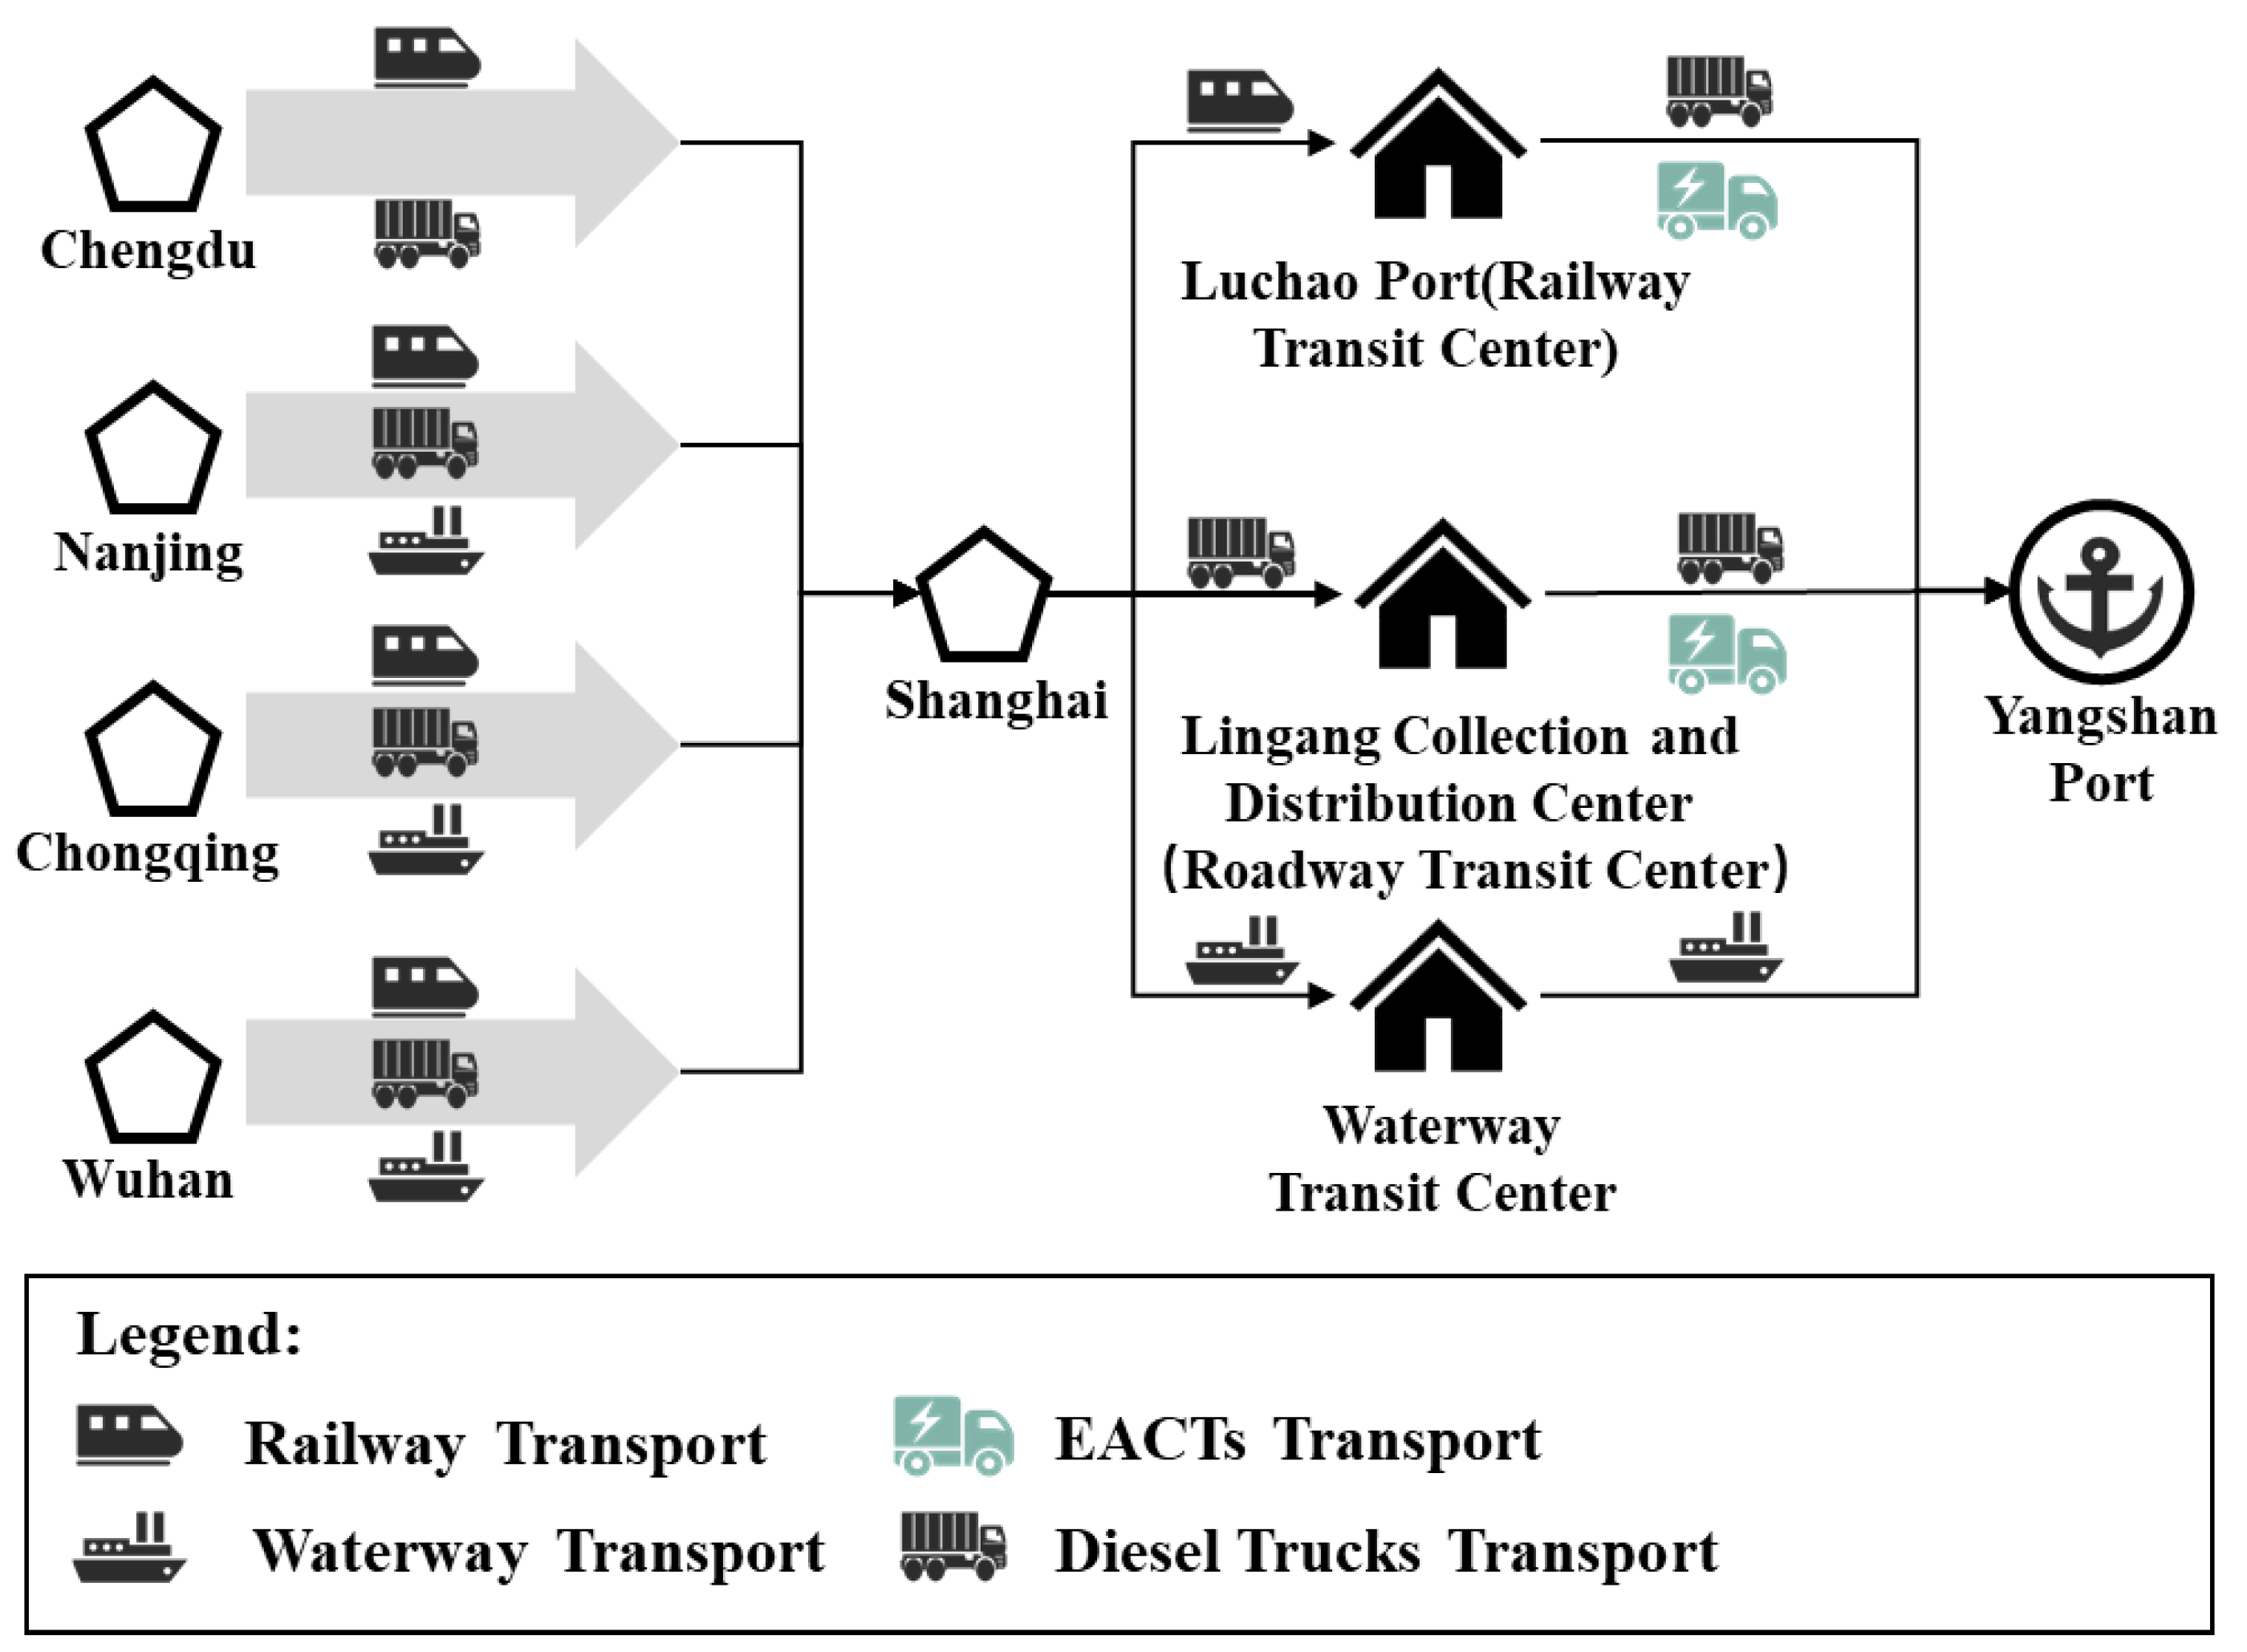
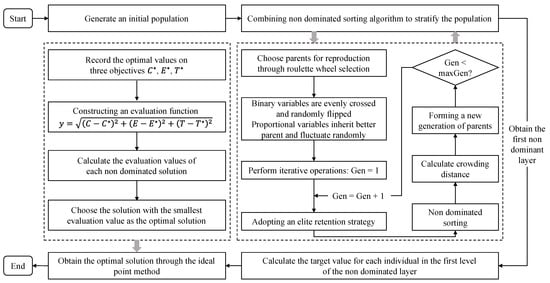
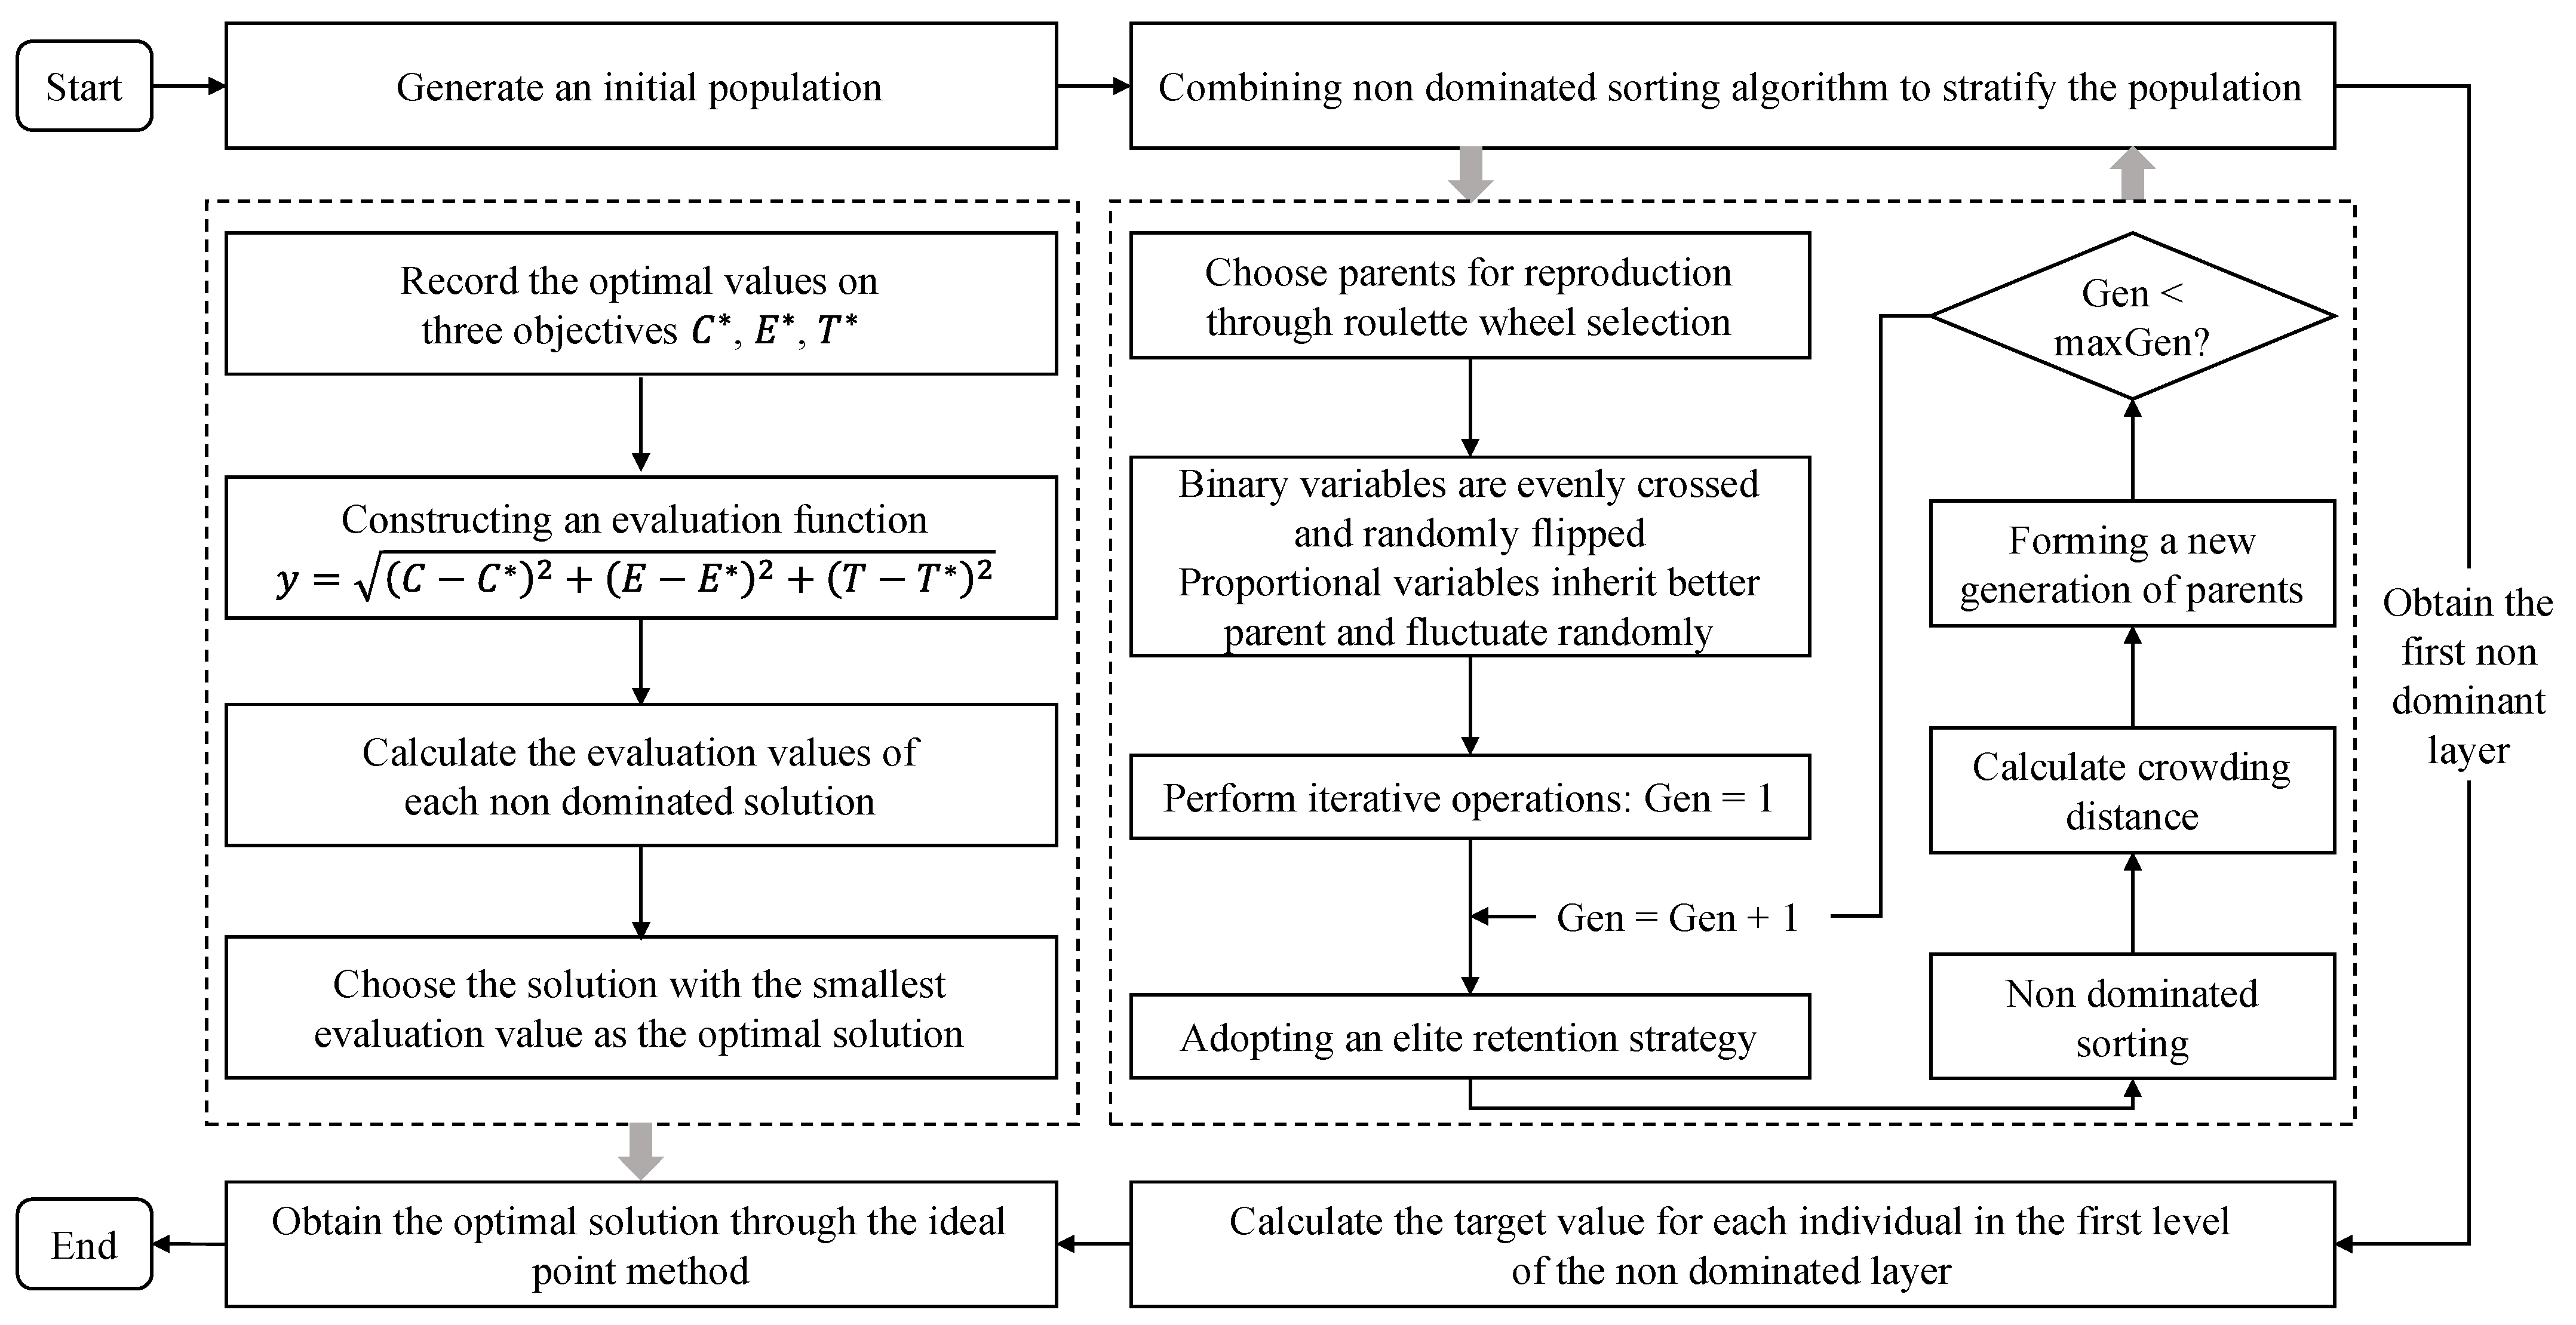
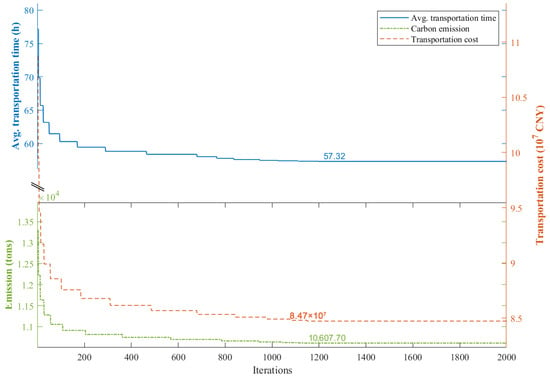
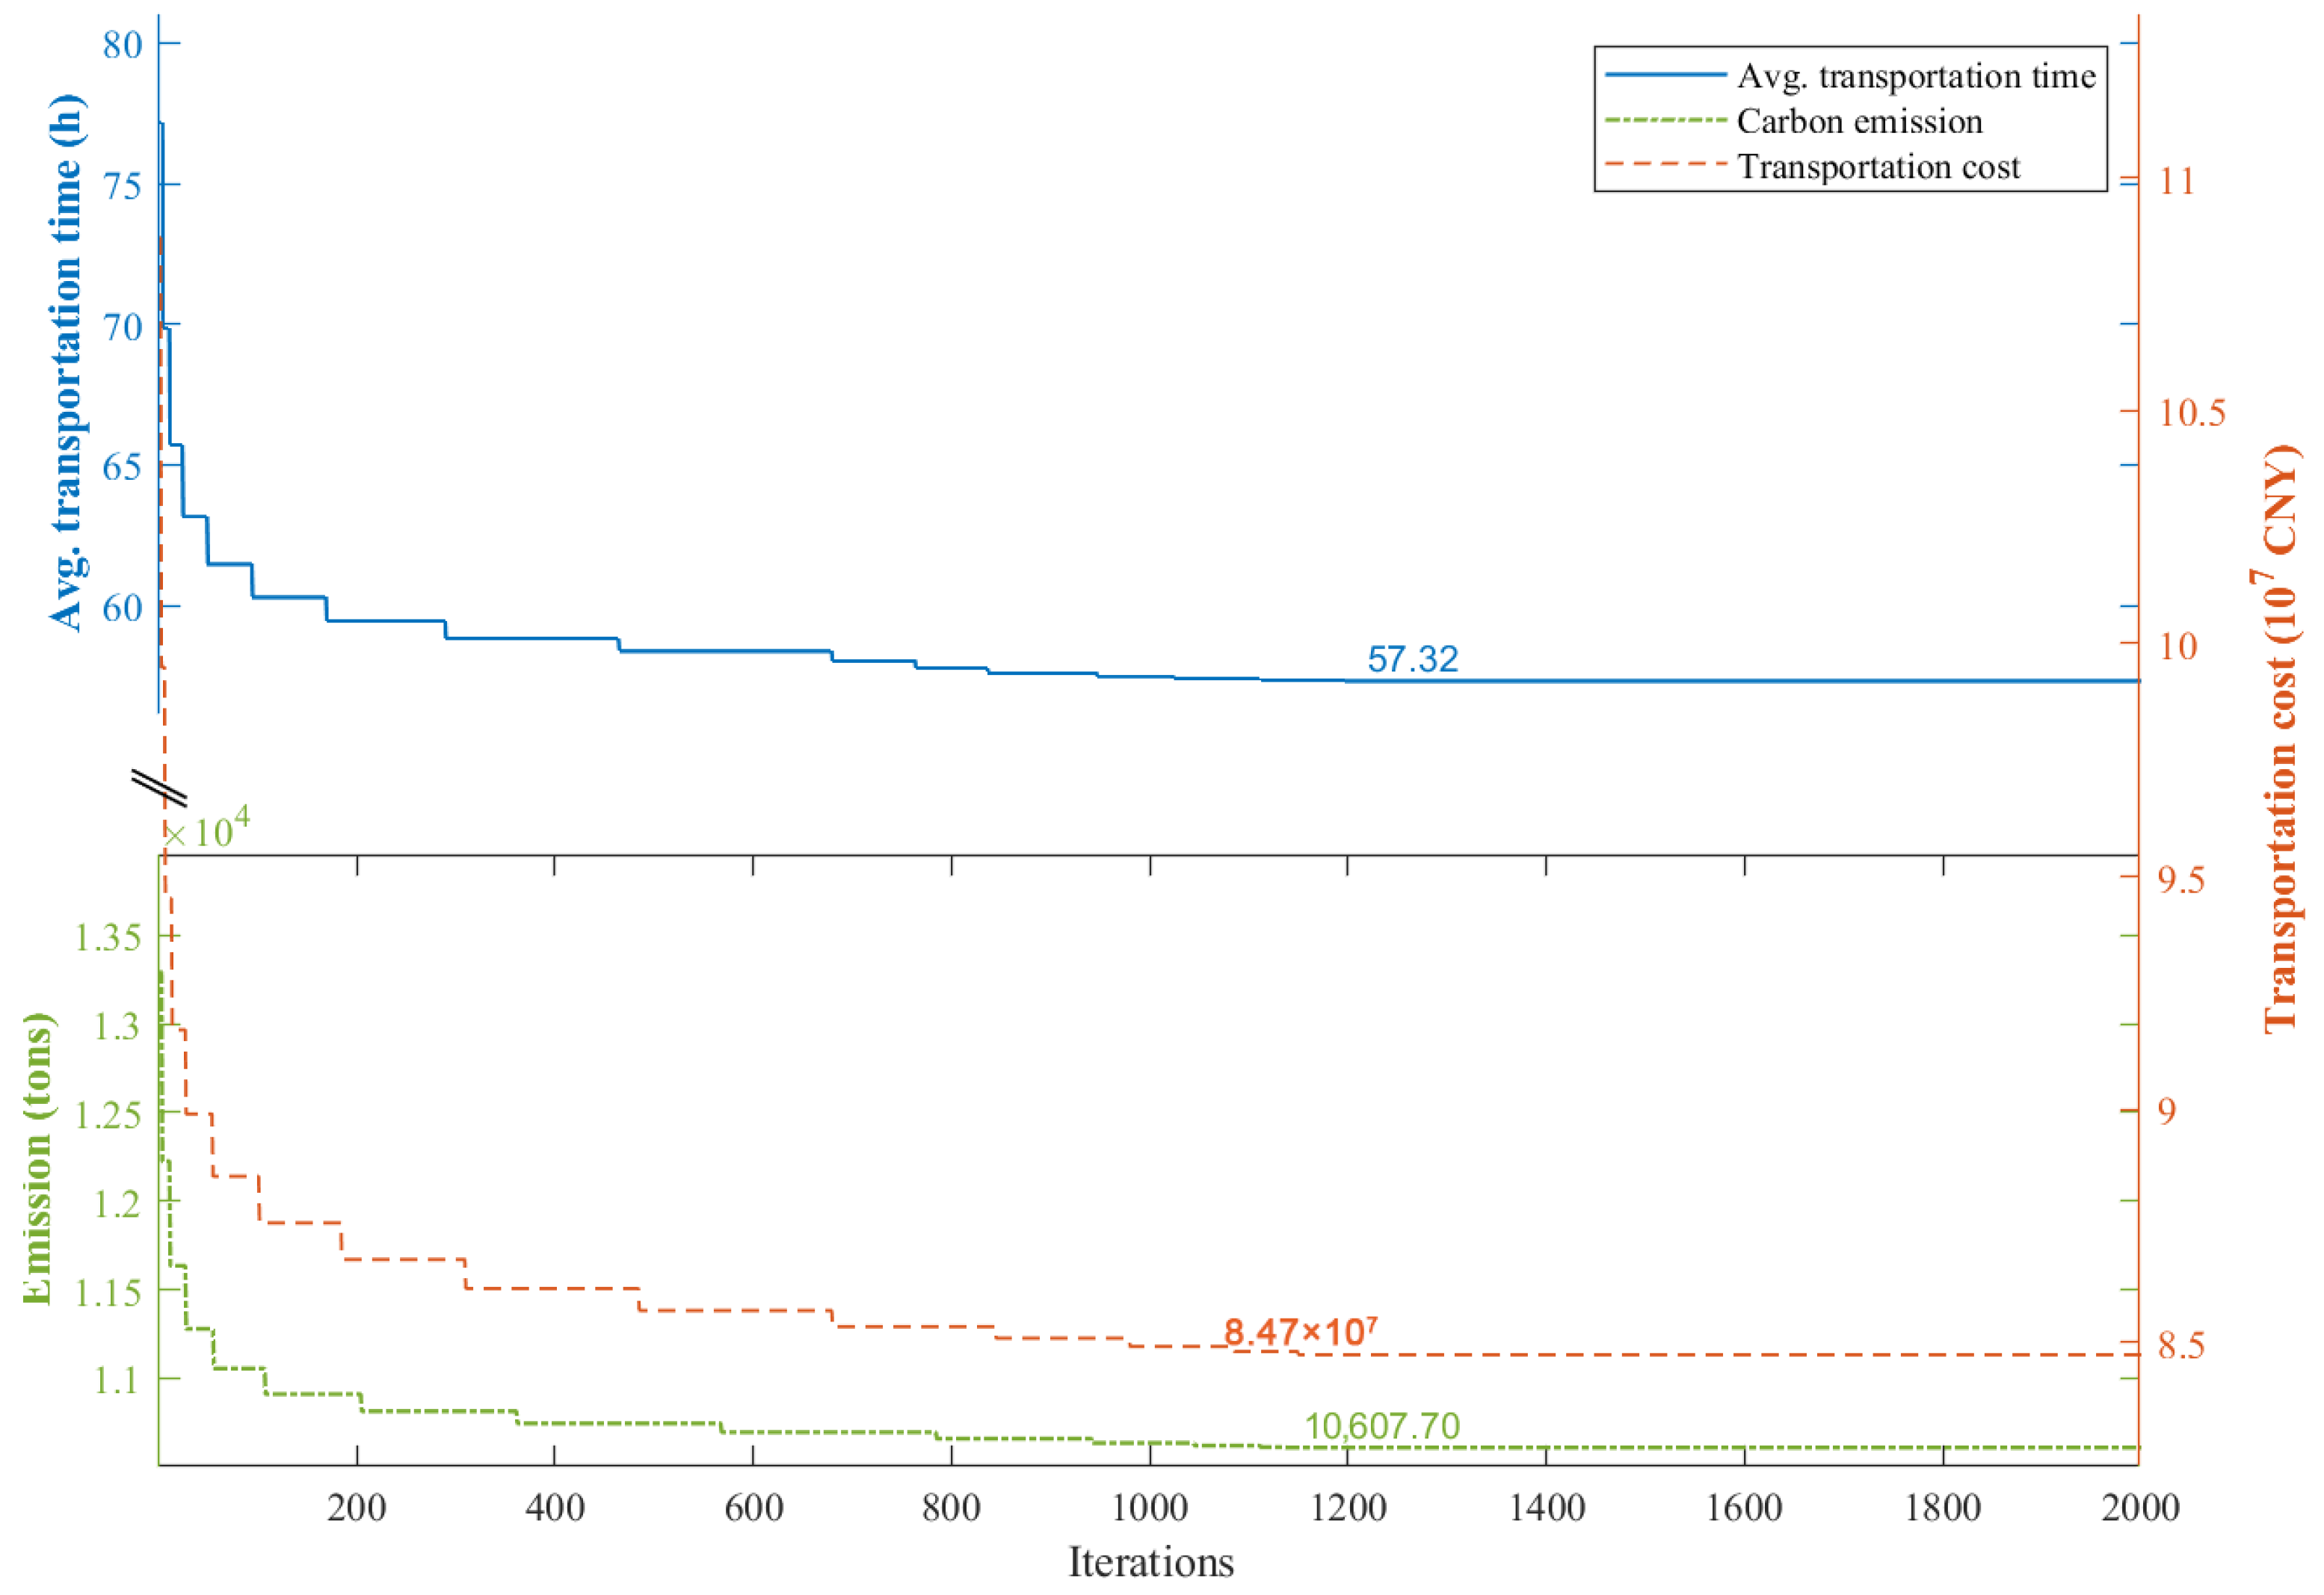
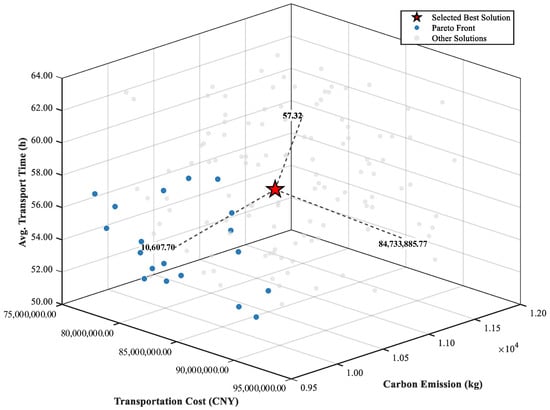
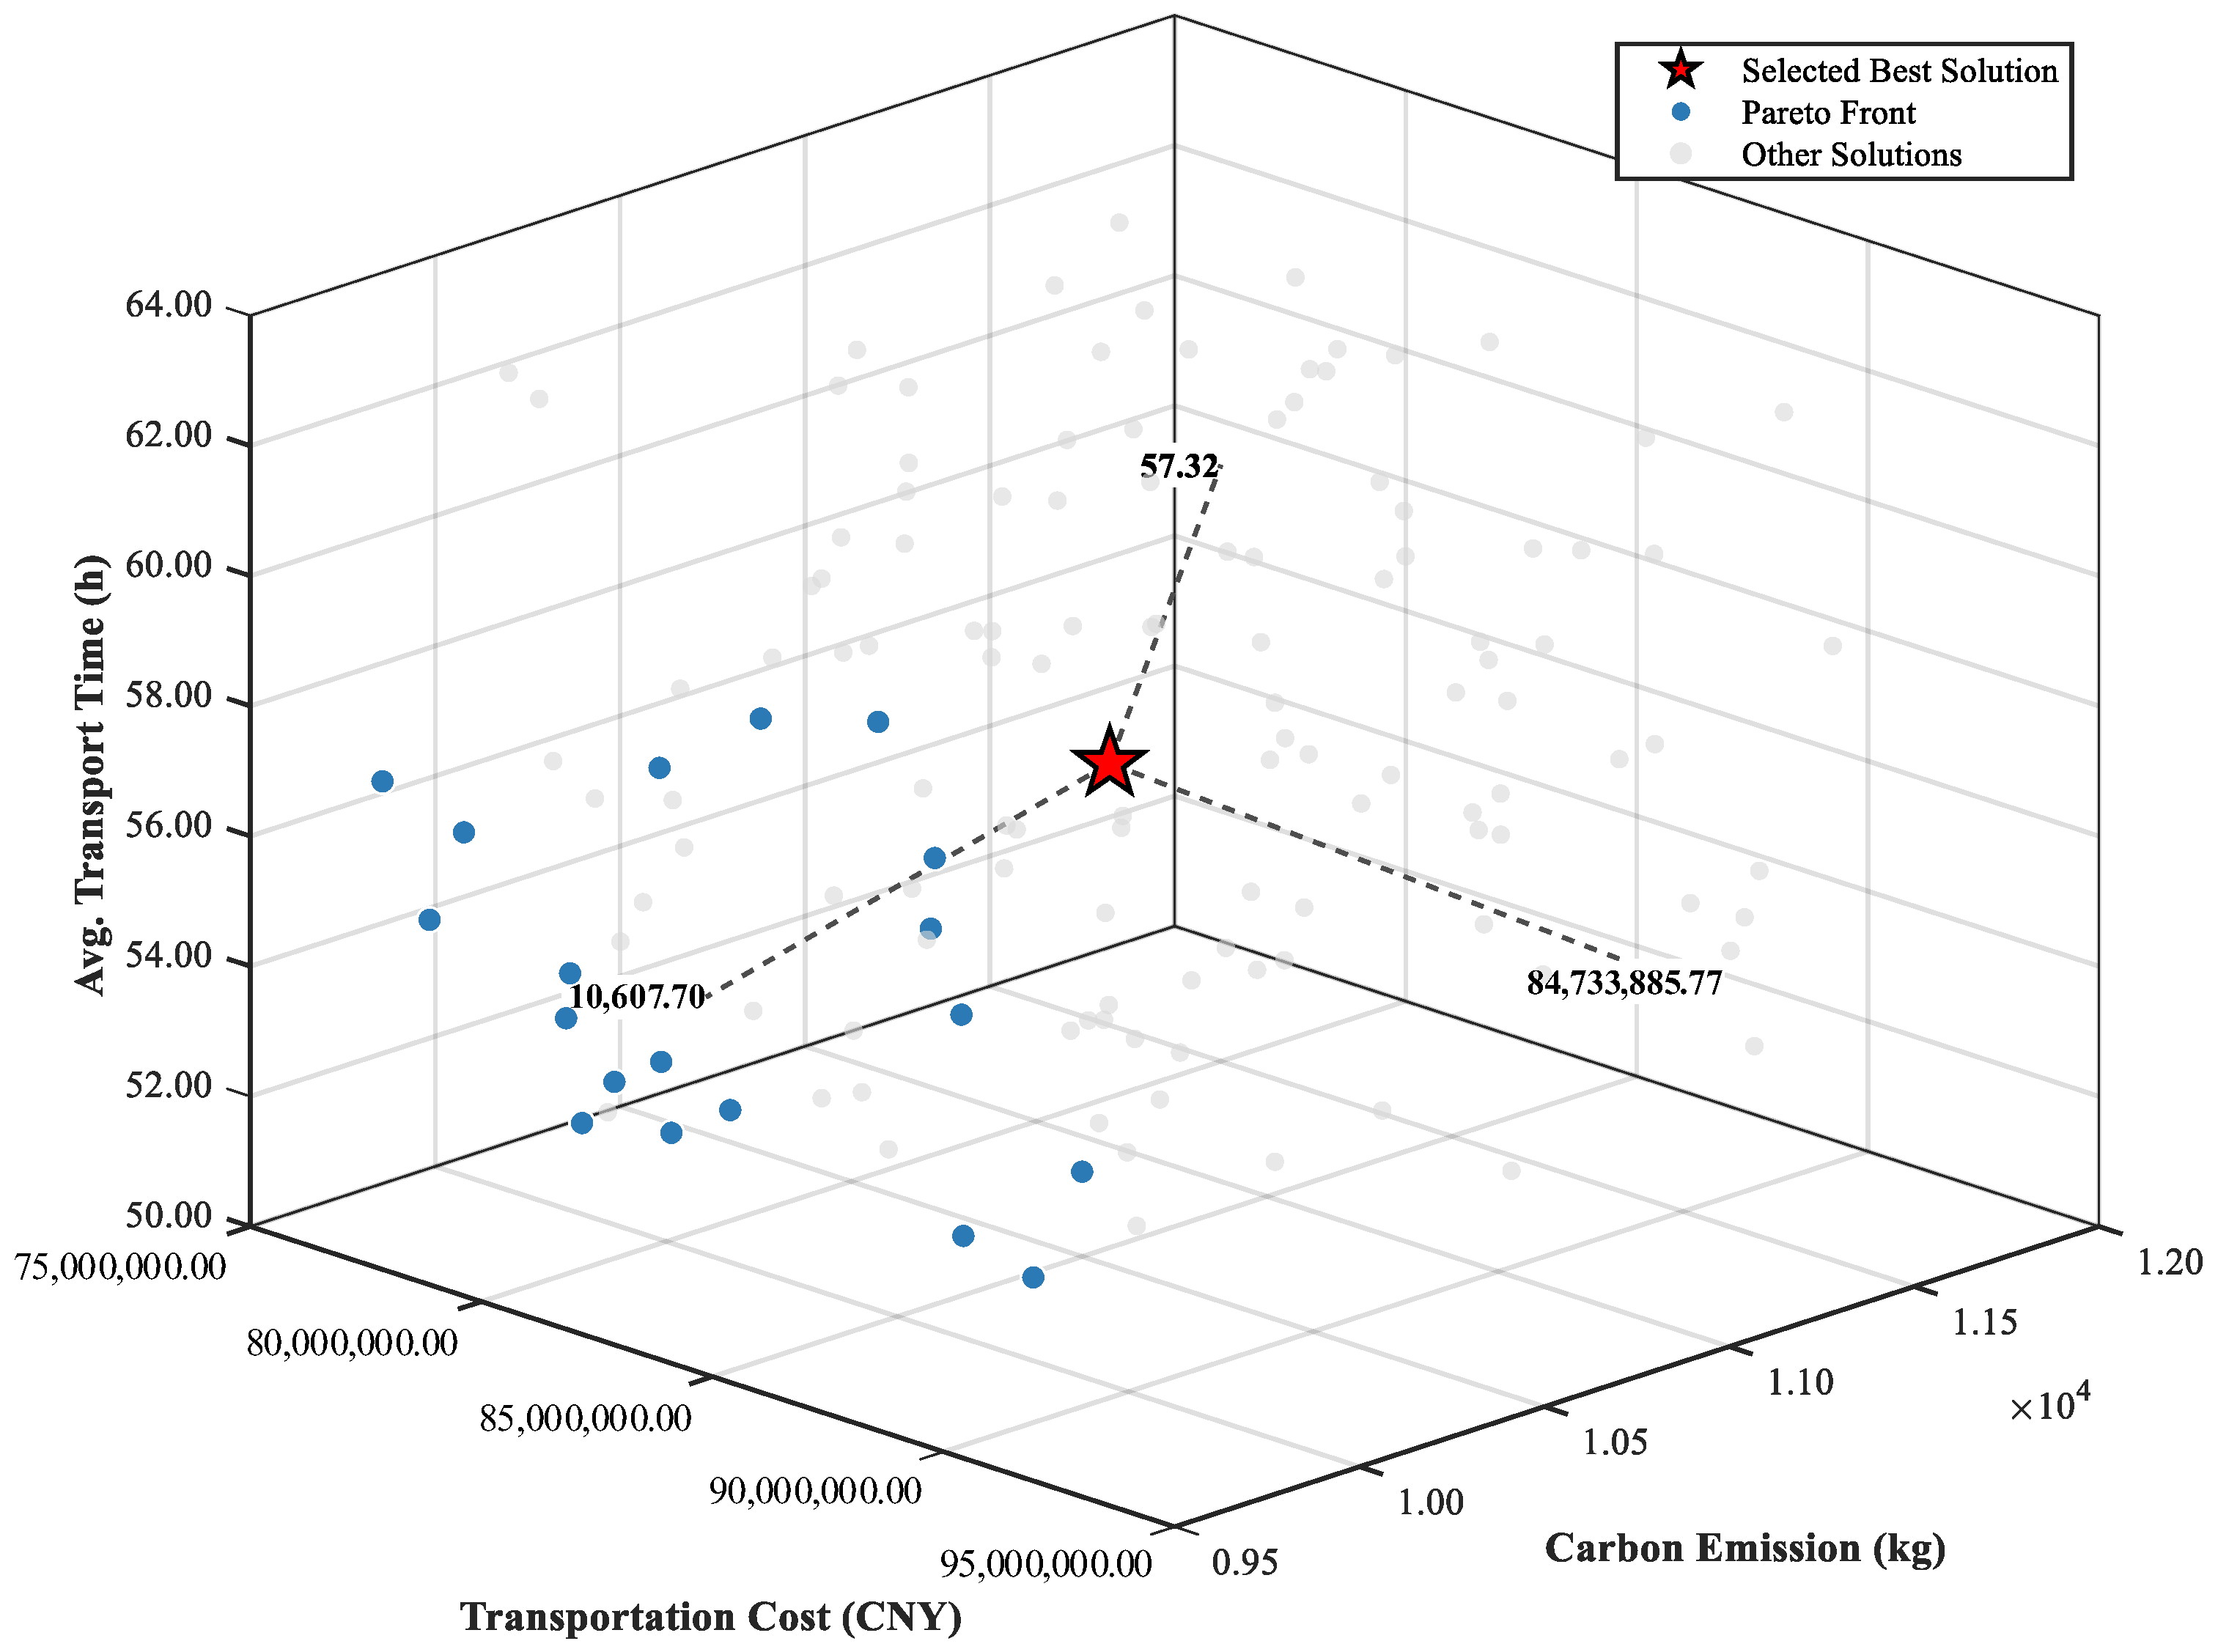


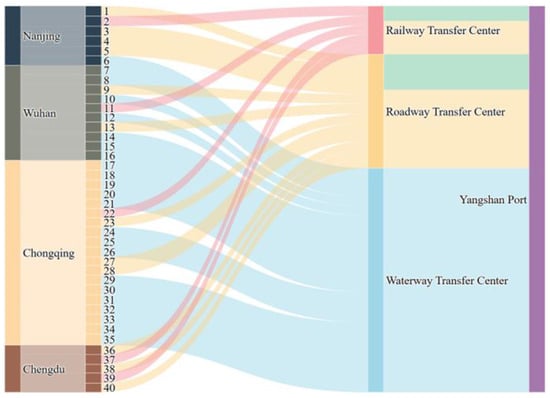
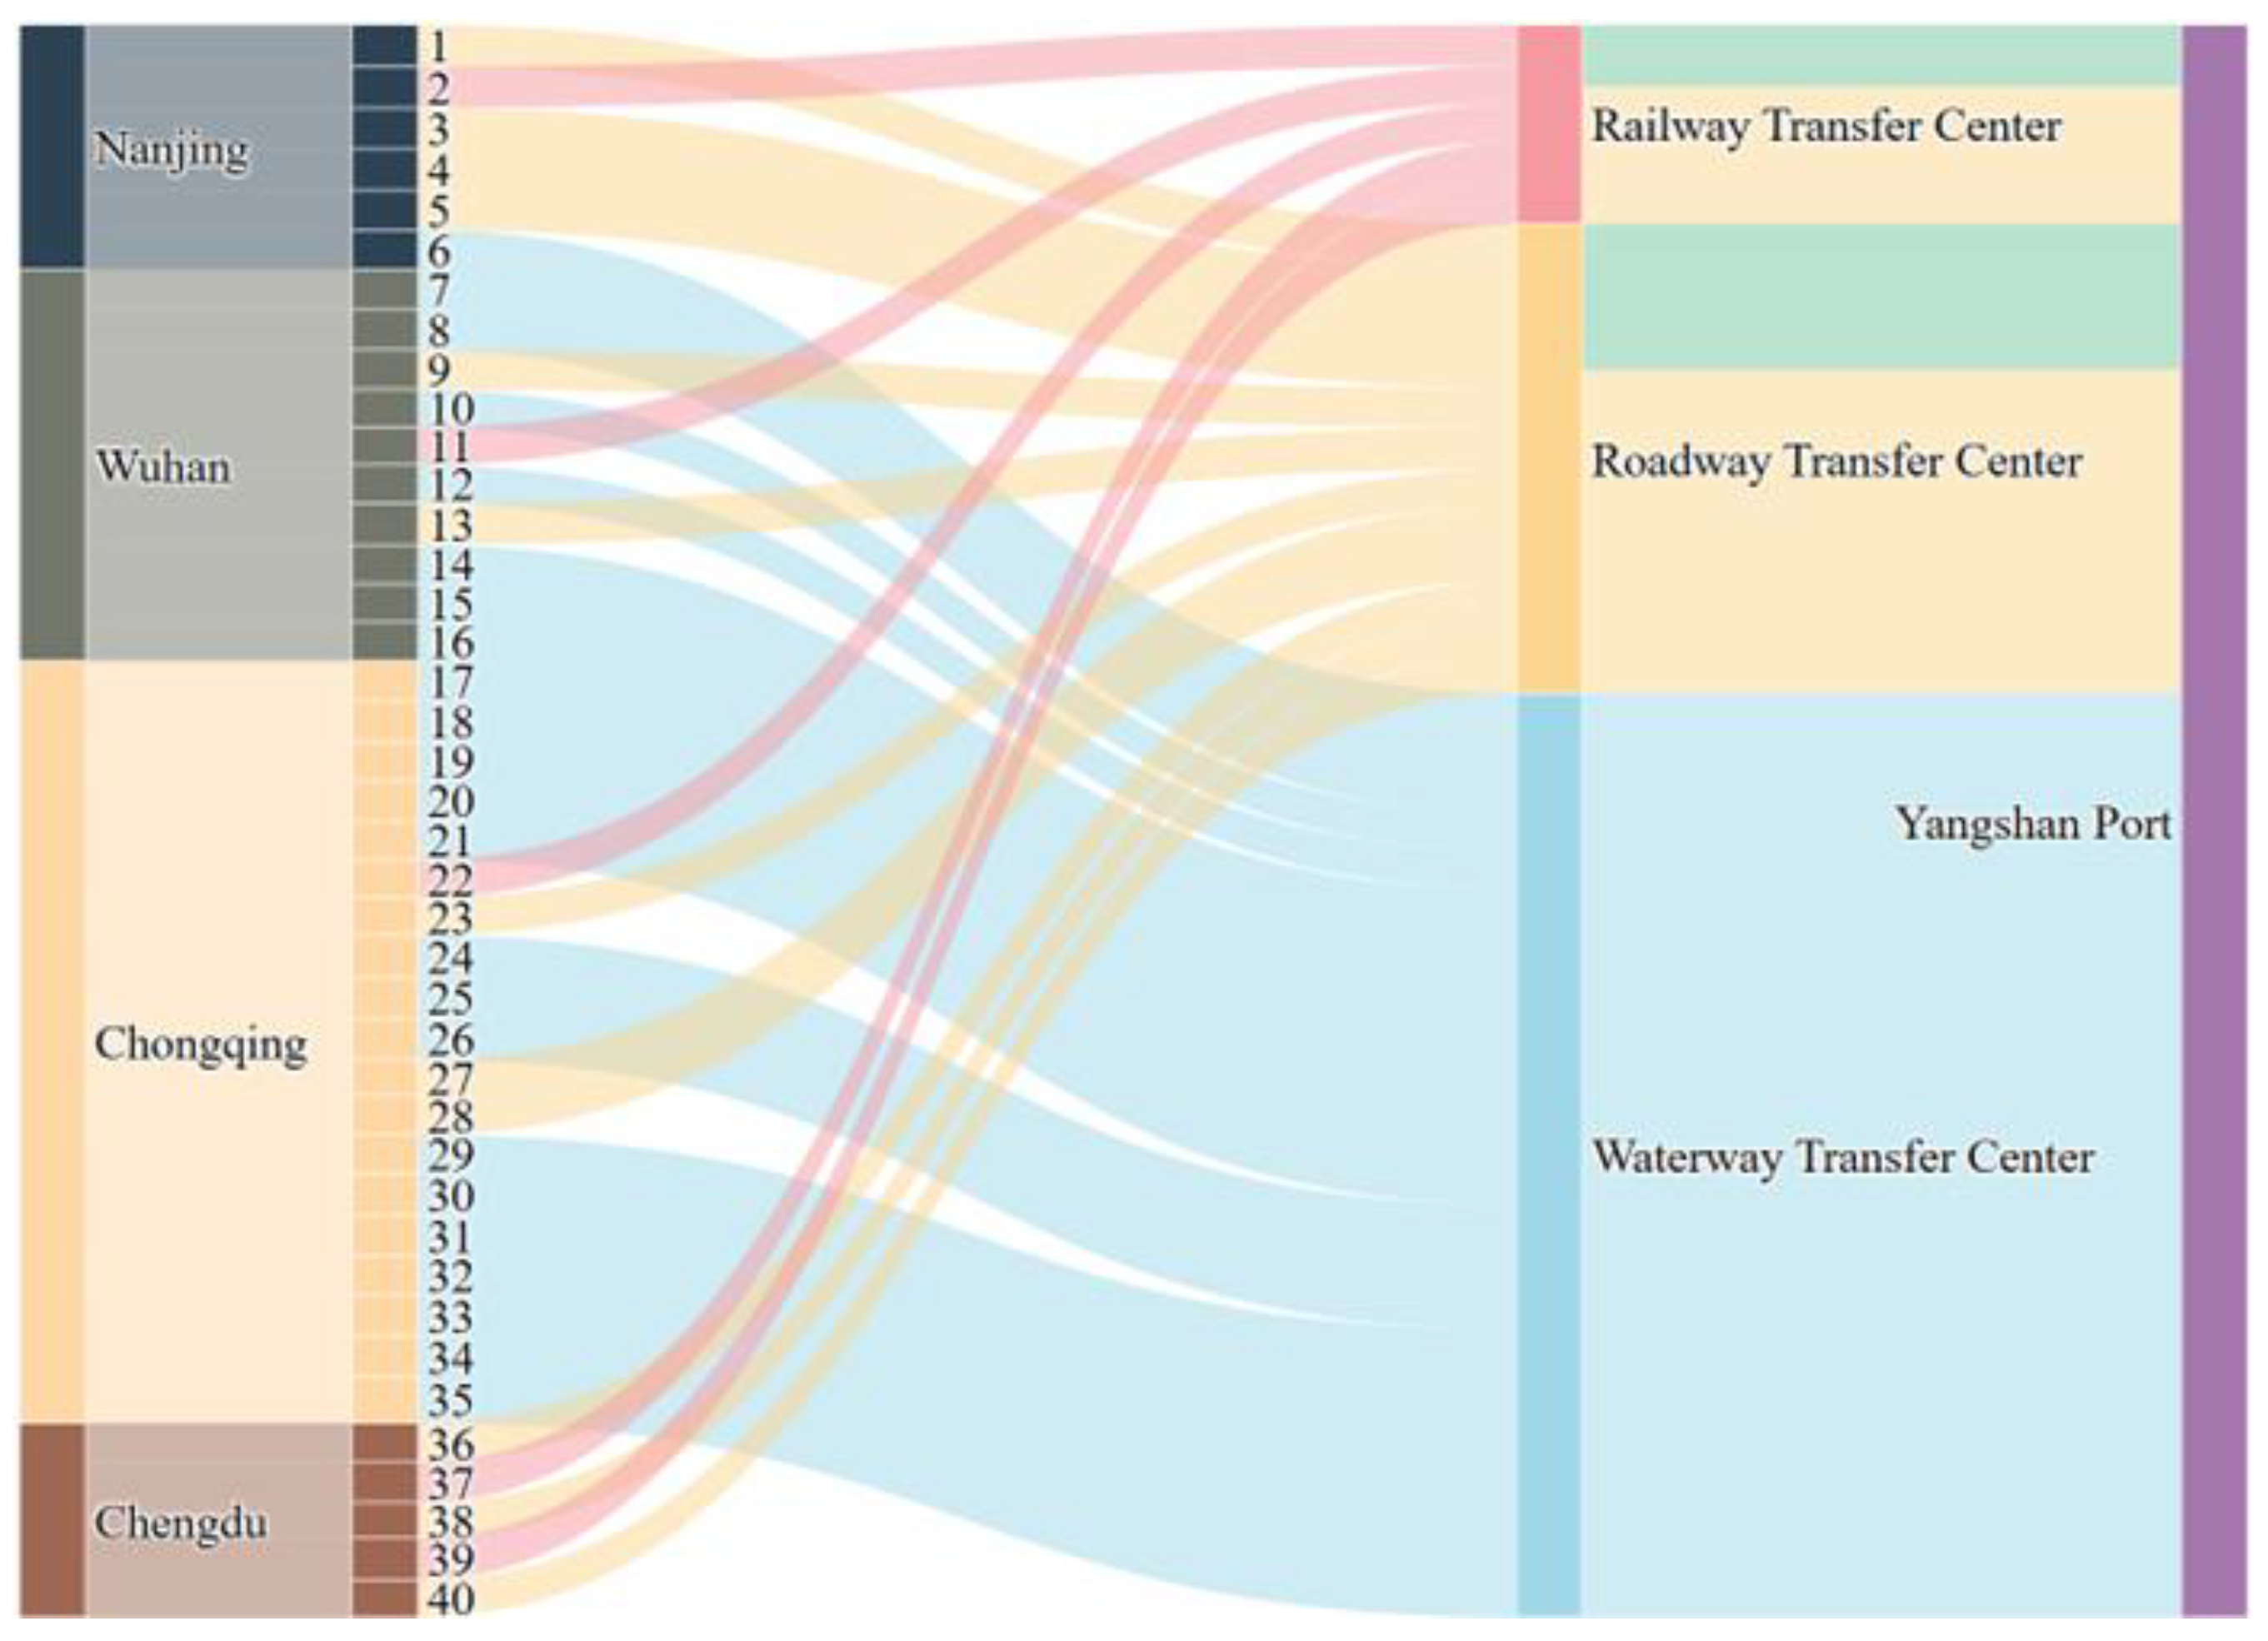
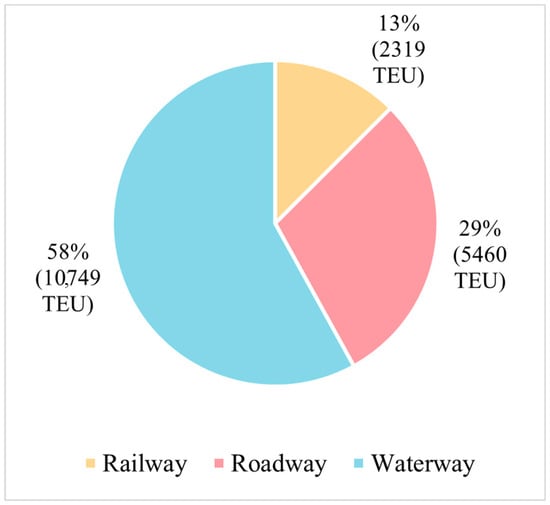
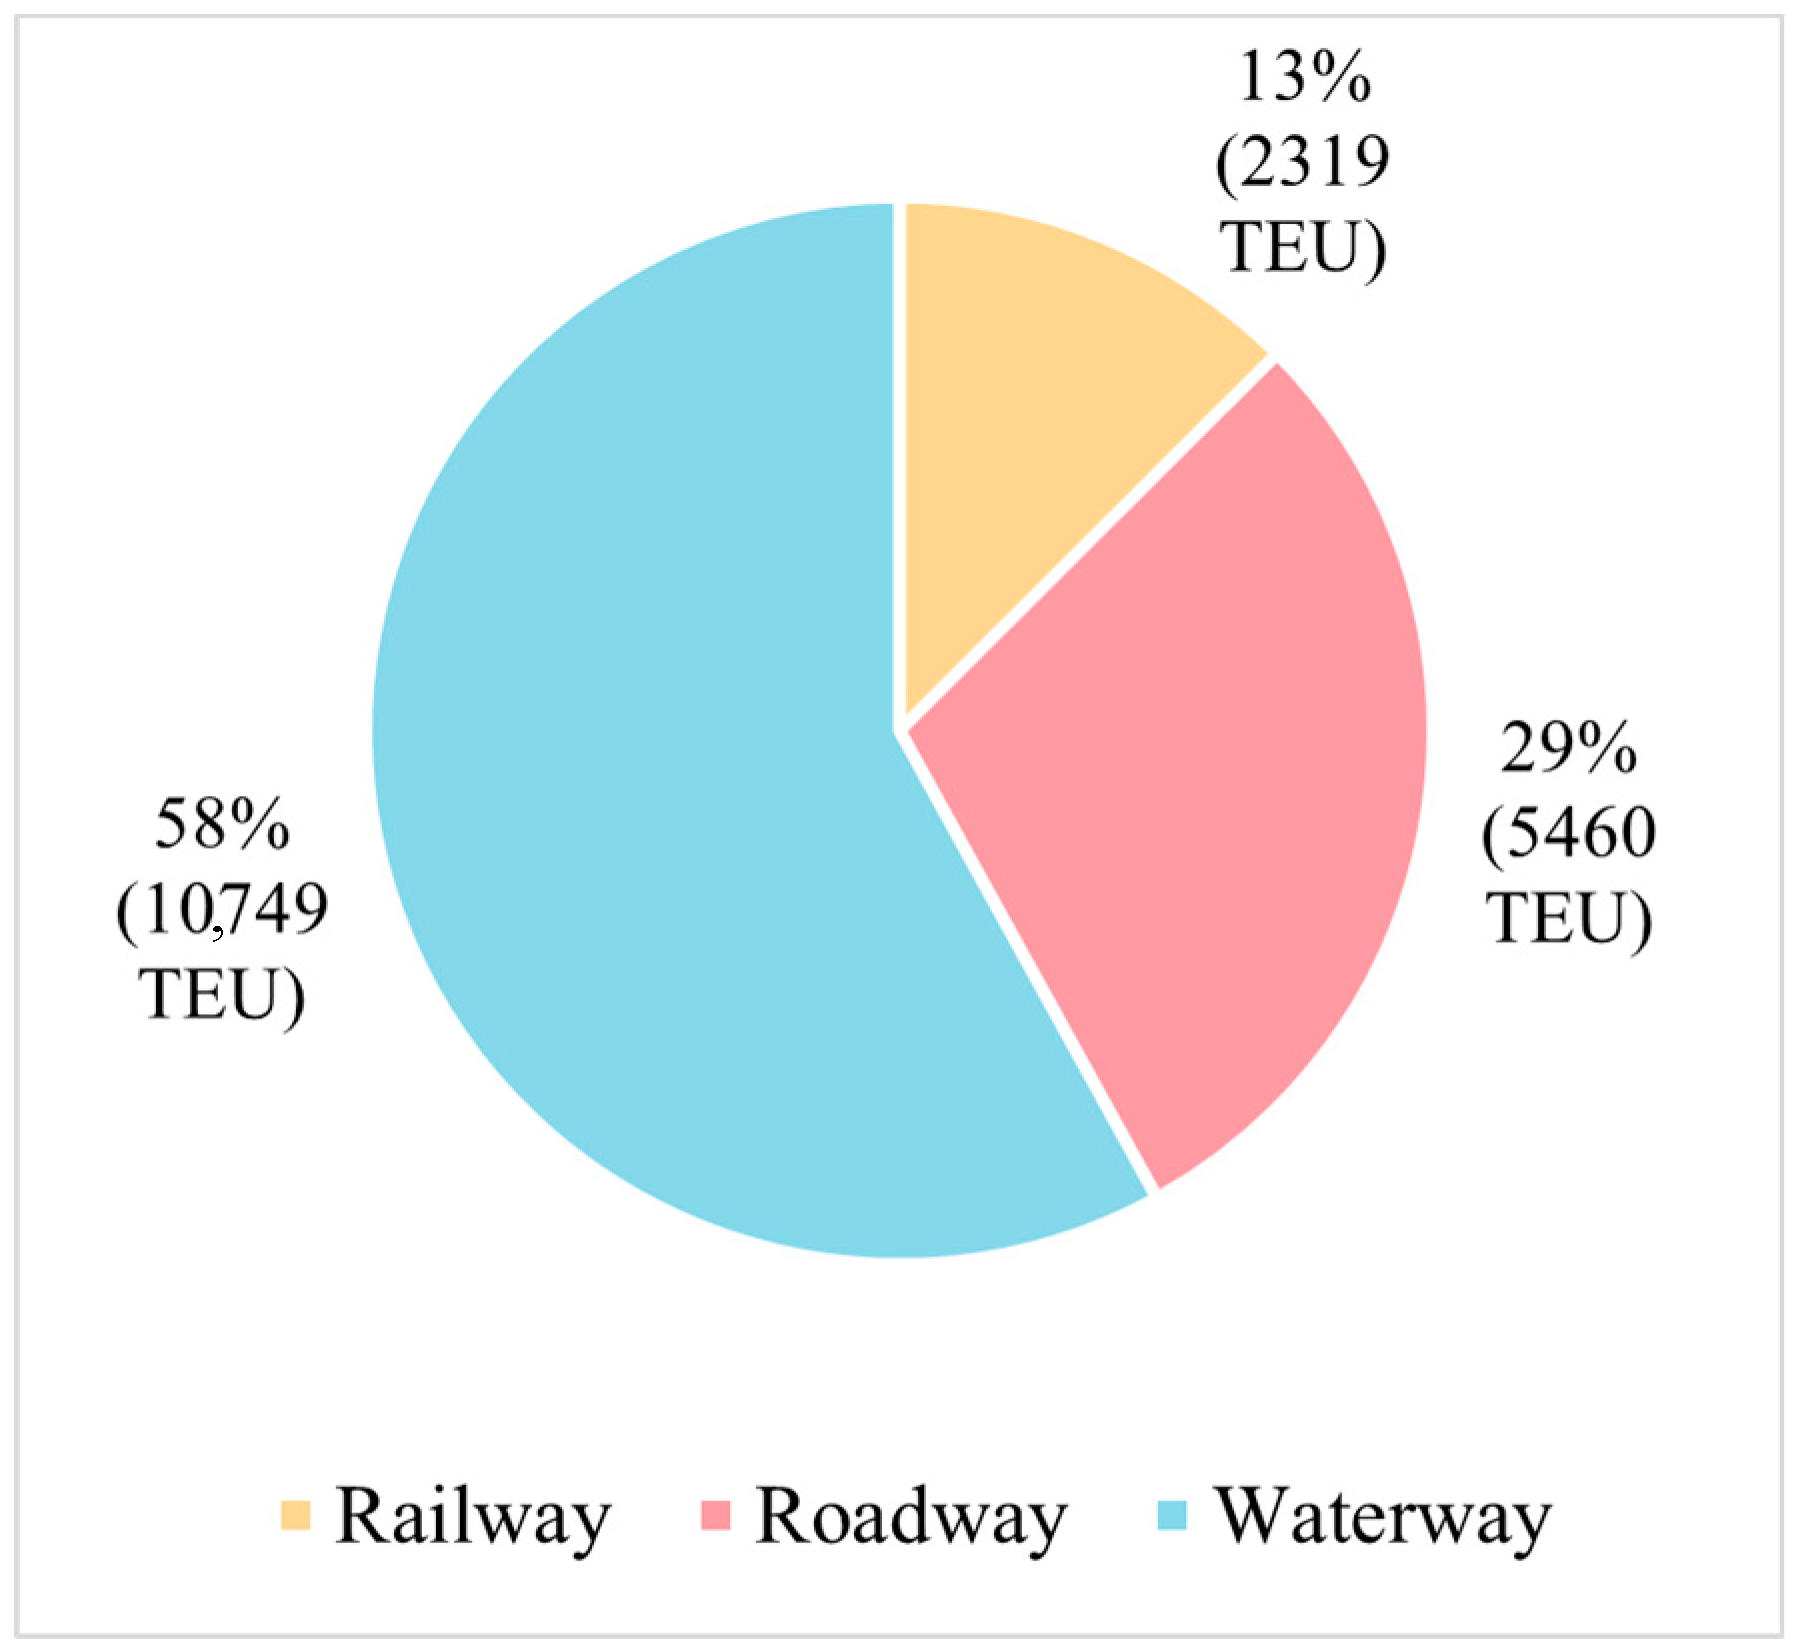
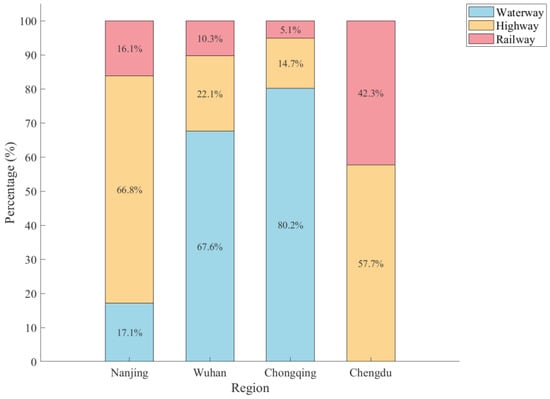
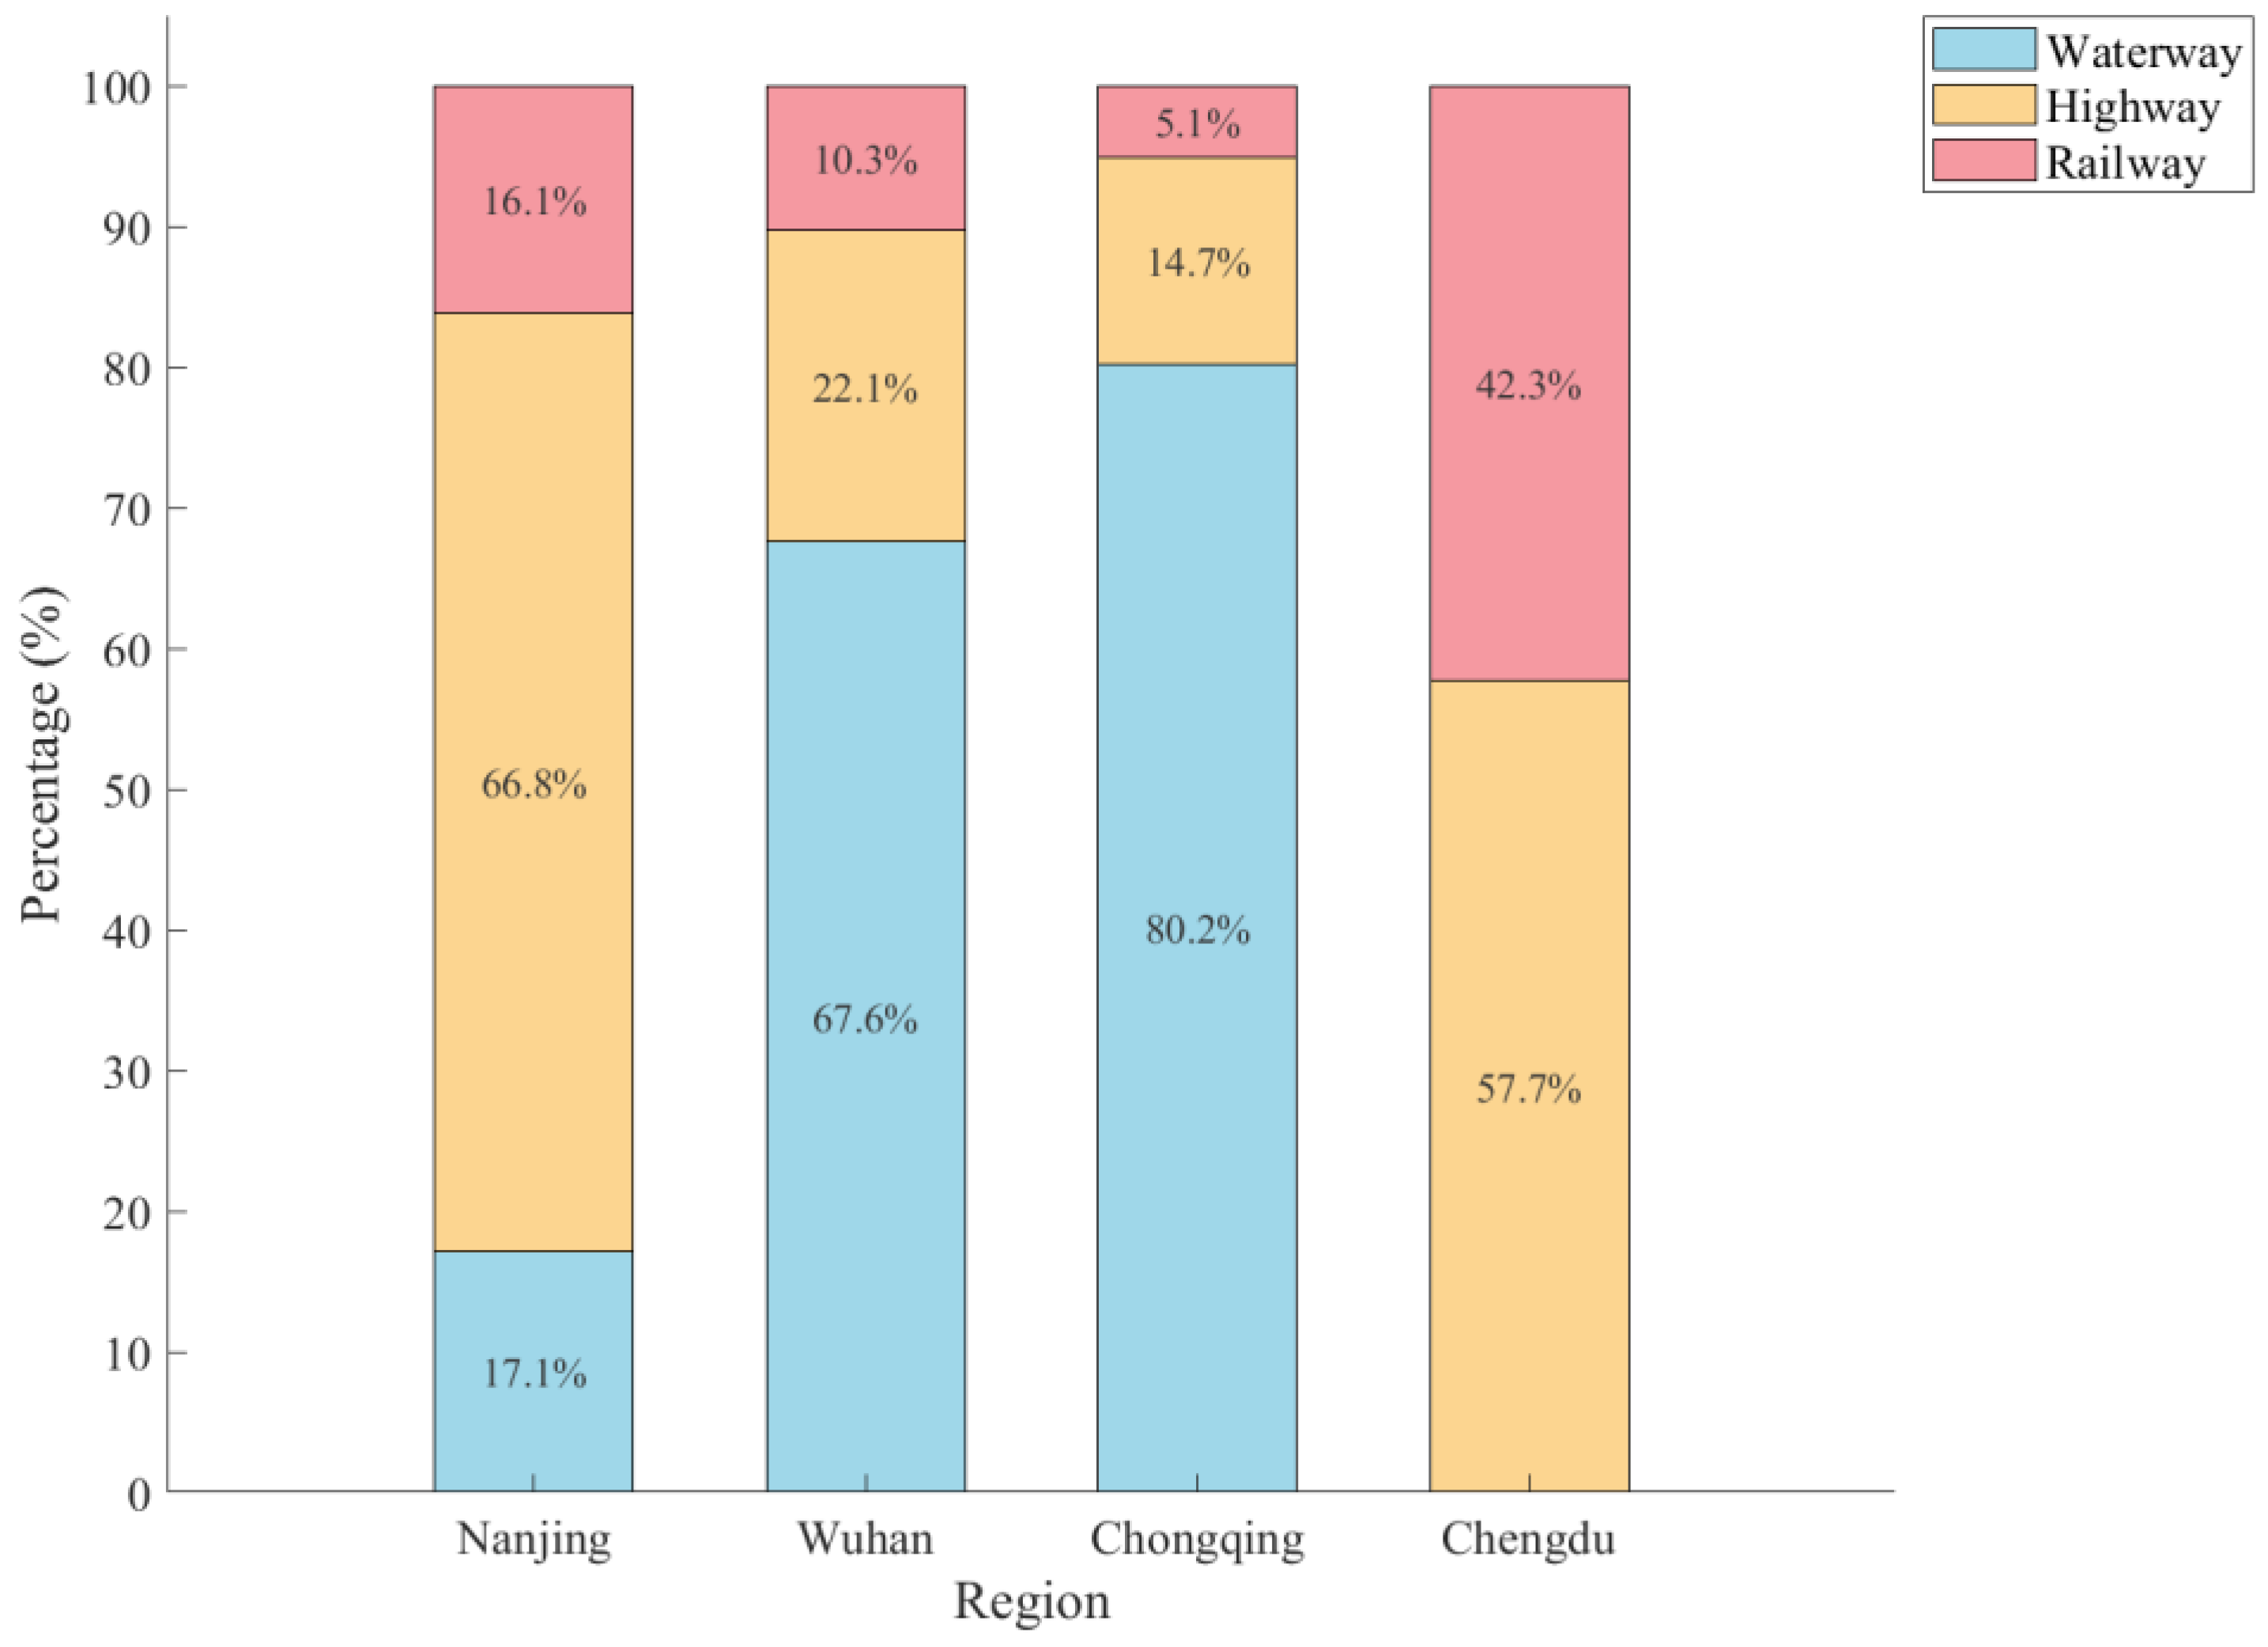
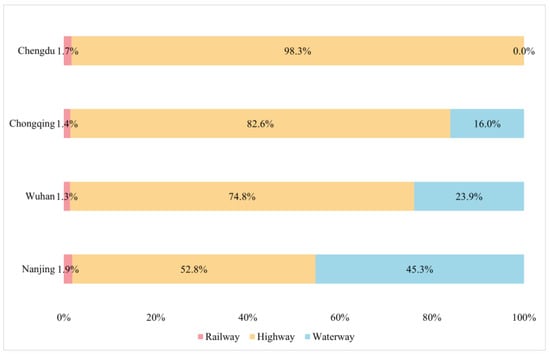
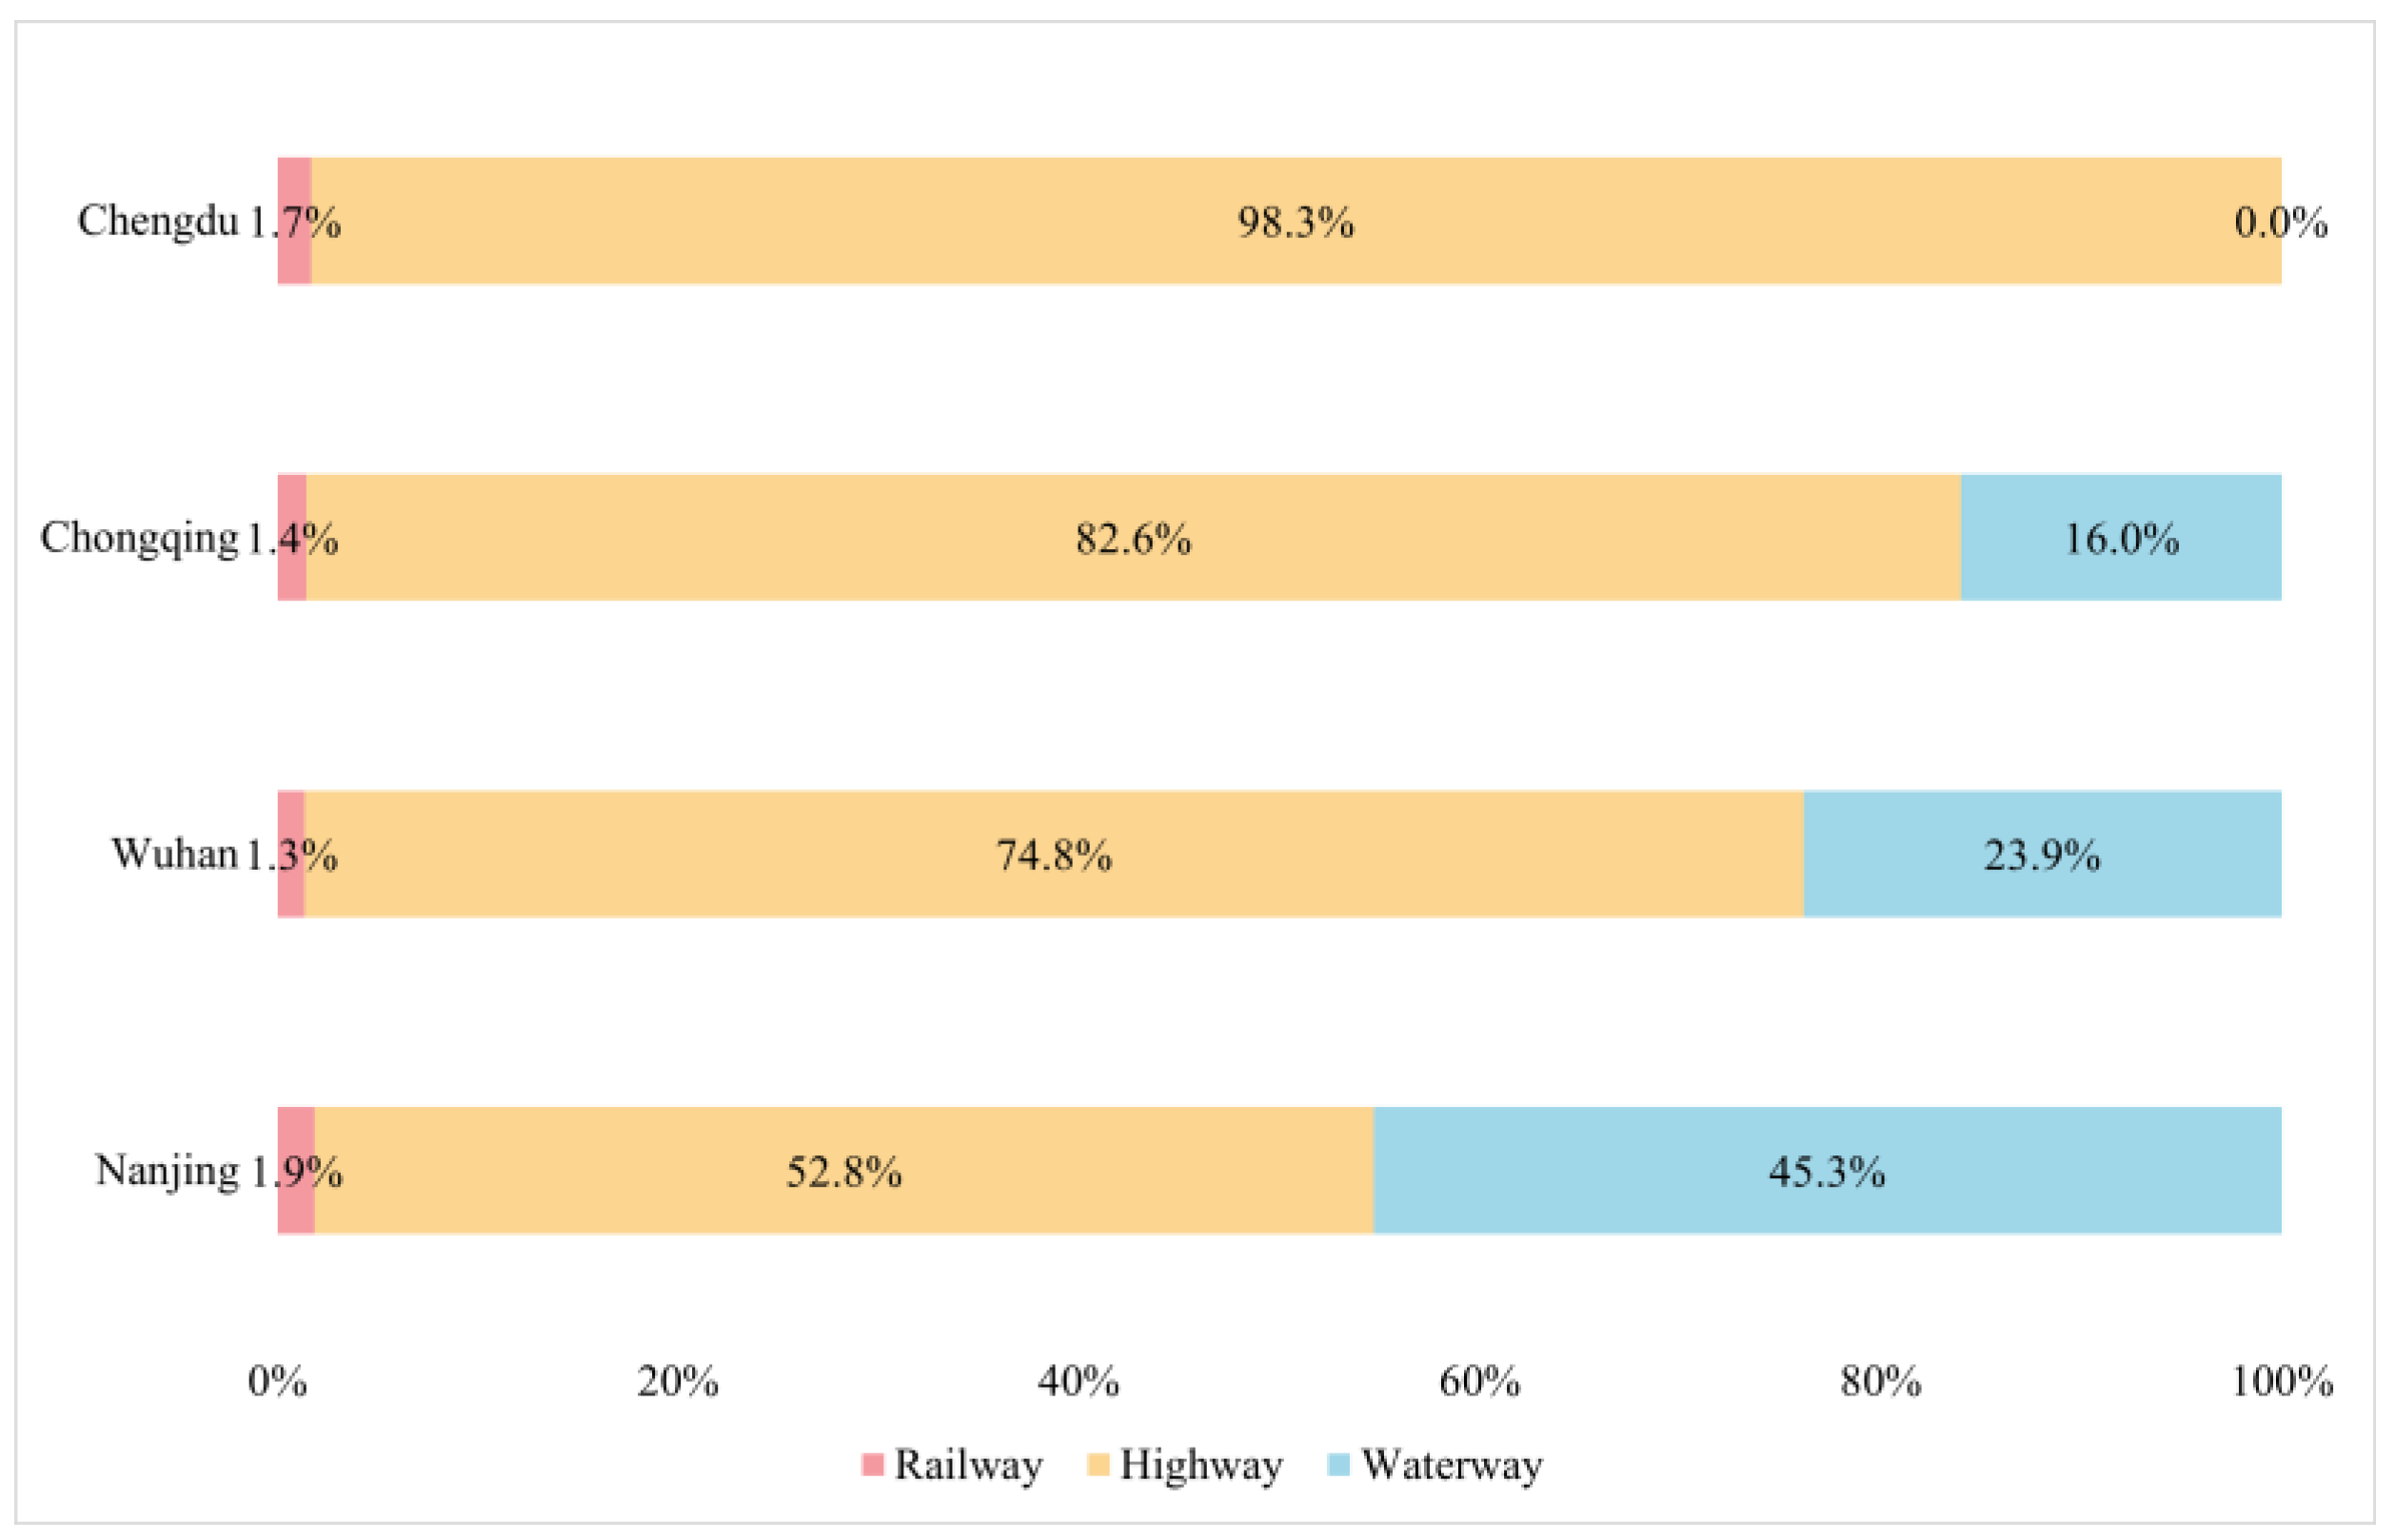
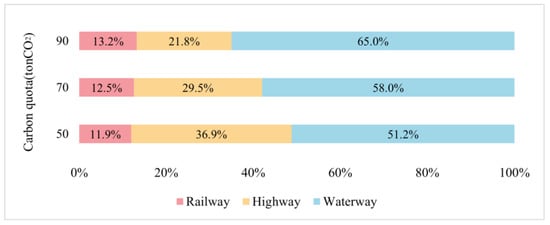
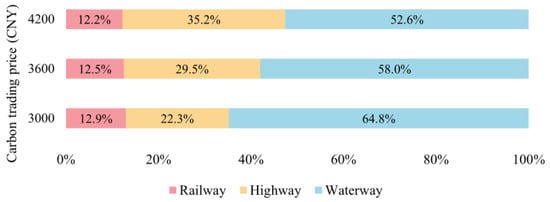

Disclaimer/Publisher’s Note: The statements, opinions and data contained in all publications are solely those of the individual author(s) and contributor(s) and not of MDPI and/or the editor(s). MDPI and/or the editor(s) disclaim responsibility for any injury to people or property resulting from any ideas, methods, instructions or products referred to in the content. |
© 2026 by the authors. Licensee MDPI, Basel, Switzerland. This article is an open access article distributed under the terms and conditions of the Creative Commons Attribution (CC BY) license.