


Abstract
This study includes a comparative analysis of four graphene-based electrochemical sensors used for the detection of melatonin, an endogenous hormone involved in circadian rhythm regulation and associated with various neurological pathologies. The sensors were based on screen-printed electrodes (SPE) modified with graphene (G), graphene modified with gold nanoparticles (AuNPs/G), graphene oxide (GO), and reduced graphene oxide (rGO). Melatonin was extracted from commercially available pharmaceutical products, purified, and characterized using UV-Vis spectroscopy, FTIR spectrometry, and HPLC. The performance of the electrodes was evaluated via cyclic voltammetry, using potassium ferrocyanide and standard melatonin solutions to determine the kinetic characteristics, while square-wave voltammetry was employed to determine the detection and quantification limits. G/SPE showed the best performance, with a detection limit of 0.3424 μM, followed by AuNPs/G/SPE with an LOD of 1.2768 μM. GO/SPE had the poorest performance (LOD 23.1056 μM), and rGO/SPE had an LOD of 5.8503 μM. Testing of sensors on pharmaceuticals showed accurate quantification of melatonin in a complex environment. The results highlight the potential of G/SPE and AuNPs/G/SPE sensors for use in the rapid and accurate detection of melatonin in pharmaceutical and biomedical applications.
1. Introduction
In recent decades, electroanalytical technologies based on electrochemical sensors and biosensors have become very popular due to their high sensitivity and ability to achieve accurate and real-time detection of biologically active compounds. These (bio)sensors allow monitoring of various bioactive molecules, such as proteins, enzymes, DNA, and hormones, directly in complex environments and at very low concentrations [1,2].
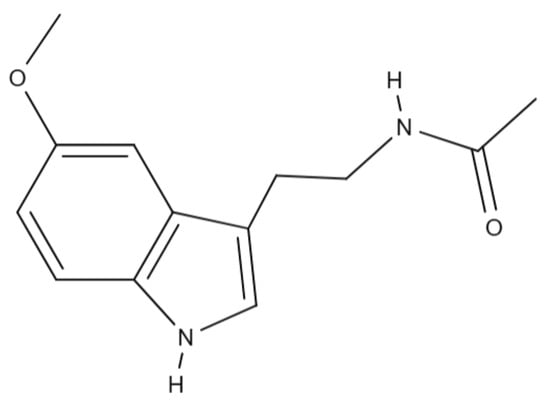
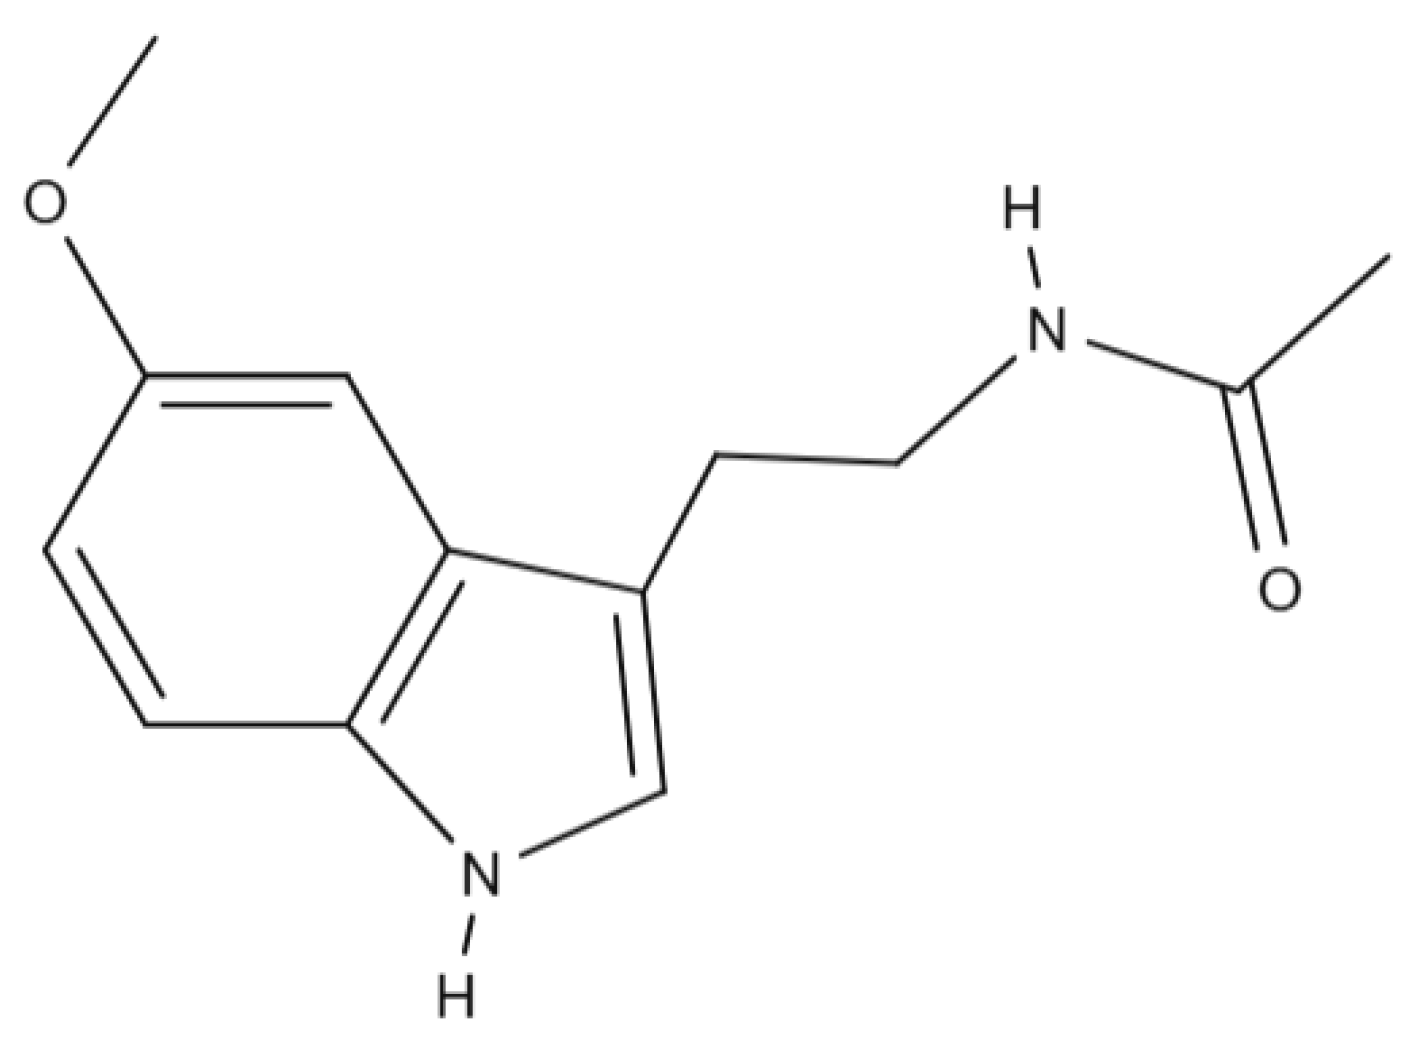
Melatonin (MLT), N-acetyl-5-methoxytryptamine (C13H16N2O2), is an endogenous hormone produced by the pineal gland, playing a crucial role in regulating the sleep–wake cycle [3] and synchronizing physiological processes with day–night alternation as the body’s “internal clock” [4]. Beyond this fundamental role, MLT is involved in the pathology of neuronal disorders and shows promising therapeutic potential in infectious diseases [4], exhibiting numerous beneficial effects, including anti-tumor, immunoregulatory, anti-inflammatory, and antioxidant properties [5], with potent action in detoxifying the body with respect to free radicals and regulating redox-active enzymes [6]. Consequently, the accurate identification of melatonin in various samples provides valuable information regarding an individual’s sleep–wake patterns, aiding in the diagnosis of sleep disorders, guiding treatment decisions, and advancing the scientific understanding of sleep-related phenomena [7]. Figure 1 shows the chemical structure of melatonin.
Figure 1.
Chemical structure of melatonin.
The conventional methods for detecting and quantifying melatonin include high-performance liquid chromatography (HPLC), with fluorometric or electrochemical detection, and immunoassays, such as enzyme-linked immunosorbent assays (ELISAs). These techniques offer high sensitivity and specificity but also come with certain disadvantages. For example, HPLC requires expensive equipment, specialized personnel, and complex sample processing, while immunoassays can suffer from batch-to-batch variability and require long analysis times [8].
In recent years, interest in developing efficient electrochemical methods for detecting melatonin has grown significantly. Electrochemical sensors are a promising alternative due to characteristics such as their high sensitivity, short response time, and potential to be miniaturized. Among the materials frequently used in the construction of these sensors are carbon nanomaterials, conductive polymers, and hybrid structures with catalytic or molecular recognition properties. Among these, graphene derivatives have attracted particular attention due to their excellent conductivity, large specific surface areas, and ability to be easily chemically modified to suit different applications [9,10].
Electroanalytical techniques applied in melatonin detection allow rapid and accurate analysis even in complex environments, but challenges remain in terms of selectivity, detection limits, and stability [11]. In this context, this study proposes a comparative investigation of four types of graphene-based sensors: a graphene sensor (G/SPE), a graphene sensor modified with gold nanoparticles (AuNPs/G/SPE), a graphene oxide sensor (GO/SPE), and a graphene oxide sensor with reduced graphene oxide (rGO/SPE). All of these sensors were tested for their ability to detect and quantify melatonin, achieving detection limits in the micromolar range. The results obtained provide valuable insight into the performance of these platforms and contribute to the identification of the most effective solutions for melatonin monitoring in medical and analytical applications.
2. Materials and Methods
2.1. Equipment
2.1.1. Reagents
For the extraction and purification of MLT from pharmaceutical products, acetone was used (Sigma-Aldrich, St. Louis, MO, USA). Formic acid (98–100%, for LC-MS LiChropur) and methanol (≥99.9%, suitable for HPLC) were purchased from Sigma-Aldrich, St. Louis, MO, USA. The solutions were prepared with 10−1 M phosphate buffer (PBS), pH 7.0, composed of Na2HPO4 and NaH2PO4 (Sigma-Aldrich, St. Louis, MO, USA), and the pH was adjusted with H3PO4 or NaOH solutions using a pH meter. The ultrapure water required for the preparation of PBS was obtained using the Millipore Milli-Q System (KgaA, Darmstadt, Germany). For the electrochemical characterization of the sensors, the cyclic voltammetry technique was used, which allows the evaluation of the redox behavior and required the preparation of a solution of 1 × 10⁻³ mol/L of potassium ferrocyanide (K4[Fe(CN)6]) prepared in 0.1 mol/L of potassium chloride (KCl) (Sigma-Aldrich, St. Louis, MO, USA).
2.1.2. Apparatus
The Partner AS 220/C/2 analytical balance was used for weighing, and the Elmasonic S10H ultrasonic bath (Carl Roth GmbH, Karlsruhe, Germany) was used for solubilizing and homogenizing the compounds in solution. The pH adjustment of the phosphate buffer was monitored with a WTW pH meter (Weilheim, Germany). MLT verification via UV and IR spectroscopy was performed using a Rayleigh UV2601 UV/Vis Double-Beam spectrophotometer (Beijing Beifen-Ruili Analytical Instrument, Beijing, China) and a Bruker ALPHA FT-IR spectrometer (BrukerOptik GmbH, Ettlingen, Germany), using OPUS software version 9.3 towards this end (BrukerOptik GmbH, Ettlingen, Germany). The electrochemical experiments were performed using a Biologic Instruments SP-150 potentiostat/galvanostat (Bio-Logic Science Instruments SAS, Claix, France) controlled using EC-LAB EXPRESS software (Bio-Logic Science Instruments SAS, Claix, France). These experiments were carried out in an electrochemical cell (Princeton Applied Research, Oak Ridge, TN, USA) with a volume of 50 mL, equipped with a three-electrode system: an Ag/AgCl reference electrode, a platinum counter electrode, and a working electrode. The working electrodes were G/SPE (graphene SPE), GO/SPE (graphene oxide SPE), AuNPs/G/SPE (G/SPE modified with gold nanoparticles), and rGO/SPE (reduced graphene oxide SPE), purchased from Metrohm DropSens (Metrohm DropSens S.L.U, Llanera, Spain).
2.2. Purification and Identification of Melatonin via UV-Vis, IR Spectroscopy, and HPLC
The MLT used in this research was extracted from commercially available pharmaceutical products. It was extracted using acetone [12] due to its high solubility in this solvent [13]. After dissolution, the solution underwent decantation, filtration, and centrifugation to remove any solid particles that could have contaminated the melatonin solution. The acetone was evaporated, yielding a white crystalline powder of pure melatonin. The identity and purity were confirmed by UV-Vis spectroscopy (with the key aspect being the presence of two characteristic absorption maxima at 220 and 270 nm) [14,15] and FTIR spectrometry (with the target being presence of characteristic vibration bands of the functional groups N-H, C=O, C-N, and C-O-C) [16,17].
The confirmation of the purity of the MLT extracted from pharmaceutical products was accomplished using UHPLC-MS/MS with ESI ionization. For this purpose, a high-resolution mass spectrometer, namely, a Q Exactive™ Focus Hybrid Quadrupole-OrbiTrap (ThermoFisher Scientific, Waltham, MA, USA), including HE-SI, attached to an UltiMate 3000 UHPLC (ThermoFisher Scientific), was used. Chromatographic separation was carried out on a Kinetex® C18 column (Phenomenex, CA, USA) at 40 °C. The mobile phase involved solutions A (0.1% formic acid solution) and B (methanol). The gradient elution program was 0–1 min with 10% B-phase, 2–3.5 min with 60% B-phase, and 3.6–5 min with 10% B-phase. The mobile phase was carried out at a flow rate of 0.3–0.4 mL/min. MS/MS spectra were acquired in positive mode. Nitrogen (99.9999% purity) was used as a collision and auxiliary gas. The applied voltage was 2.0 kV, and the capillary temperature was 300 °C. Precursor ion (m/z) of MLT was 233.1, and production ions (m/z) were 174.2 and 159.1. The collision energy ranged from 40 eV to 60 eV. The data were collected and analyzed using Xcalibur software (Version 4.1) [18,19].
2.3. Kinetics Studies
To evaluate the performance of the electrochemical sensors, electrochemical measurements were performed using a 1 × 10⁻³ mol/L potassium ferrocyanide (K4[Fe(CN)6]) solution prepared in 0.1 mol/L of potassium chloride (KCl), which was used as the supporting electrolyte in all electrochemical measurements.
Each sensor was immersed in 1 mM K4[Fe(CN)6]—0.1 M KCl solution, and cyclic voltammograms were recorded for each type of sensor at different scan rates (between 0.05 and 0.5 V/s). The voltammograms obtained were used to evaluate the kinetic and electrochemical characteristics of each sensor.
The anodic and cathodic currents obtained at each scan rate were correlated with the scan rate, allowing the calculation of the electrochemical area for each sensor using the Randles–Sevcik Equation (1). The electrochemical area values were compared with the geometric area values to highlight the presence of nanomaterials on the sensitive surfaces of the sensors.
where
Ip = (2.69 × 10⁵) n3/2ACD1/2υ1/2
- Ip denotes the peak intensity of the voltammogram, in A (Amperes);
- n denotes the number of electrons transferred in the redox reaction;
- A denotes the electrochemical area of the electrode, in cm2;
- C denotes the concentration of redox species in solution, in mol/cm3;
- D denotes the diffusion coefficient of redox species, 7.6 × 10⁻⁶ cm2/s for K4[Fe(CN)6]; [18]
- υ denotes the scanning rate of the applied potential, in V/s.
2.4. Study of the Kinetic Behavior of MLT
The kinetics of MLT have been studied using a solution of 1 × 10⁻⁴ M MLT, in PBS (pH 7.0), a medium with a pH that offers the best results due to the high chemical stability of the molecule and the fact that the conditions are close to the physiological ones [4]. Each of the four electrodes was immersed in the MLT solution, and cyclic voltammograms were recorded, at different scanning rates (between 0.05 and 0.5 V/s), in the potential range between −0.4 and 1.3 V.
The surface coverage (Γ) of melatonin was calculated according to the Laviron Equation (2).
where
Ip = (n2F2υAΓ)/4RT
- Ip denotes the intensity of the peak of the voltametric curve, in A (Amperes);
- n denotes the number of electrons transferred in the electrochemical reaction;
- F denotes Faraday’s constant, 96,485 C/mol;
- υ denotes the scanning rate for the applied potential, in V/s;
- A denotes the area of the electrode surface, in cm2;
- Γ denotes the concentration of electroactive species on the active surface of the electrode, in mol/cm2;
- R denotes the universal gas constant, 8.314 J/(mol·K);
- T denotes the absolute temperature, in K (Kelvin).
2.5. Preparation of MLT Solution
For the electrochemical detection of MLT, it was necessary to prepare a standard MLT solution. The purified MLT powder was dissolved in 0.1 M PBS (pH 7.0) to obtain a concentration of 2 × 10⁻³ M MLT. This served as a standard solution for the preparation of MLT solutions of different concentrations, ranging from 0.19998 to 333.333 μM. These solutions were used to determine the detection and quantification limits of each sensor.
2.6. Determination of Detection and Quantification Limits
For each type of sensor, the detection (LOD) (3) and quantification (LOQ) (4) limits were determined. Using the addition method, different volumes of 2 × 10⁻³ M MLT solution were added into a blank solution consisting of PBS solution (pH 7.0). Square-wave voltammograms were recorded for each MLT concentration within a potential range of −0.4 to 1.3 V. The SWV parameters were set as follows: rest time of 5 s, pulse height of 90 mV, pulse width of 50 ms, and step heights of 50 and 100 mV. The anodic peak current obtained from each voltammogram was used to construct the calibration curves. The limits of detection and quantification were determined based on the standard deviation of the current response and the slope of the calibration curve.
where
LOD = 3 × σ/slope
LOQ = 10 × σ/slope
- LOD = detection limit;
- LOQ = quantification limit;
- σ = standard deviation.
3. Results and Discussion
3.1. Characterization of Purified MLT
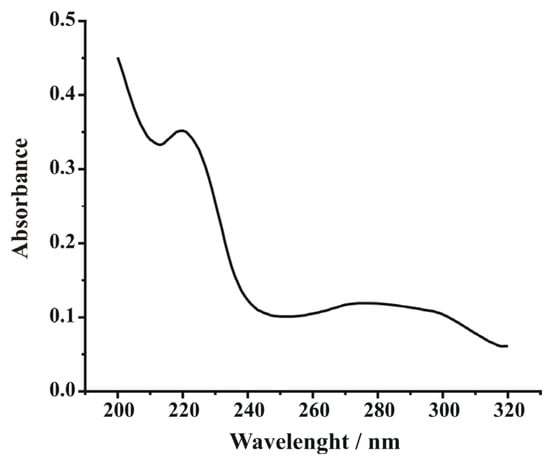
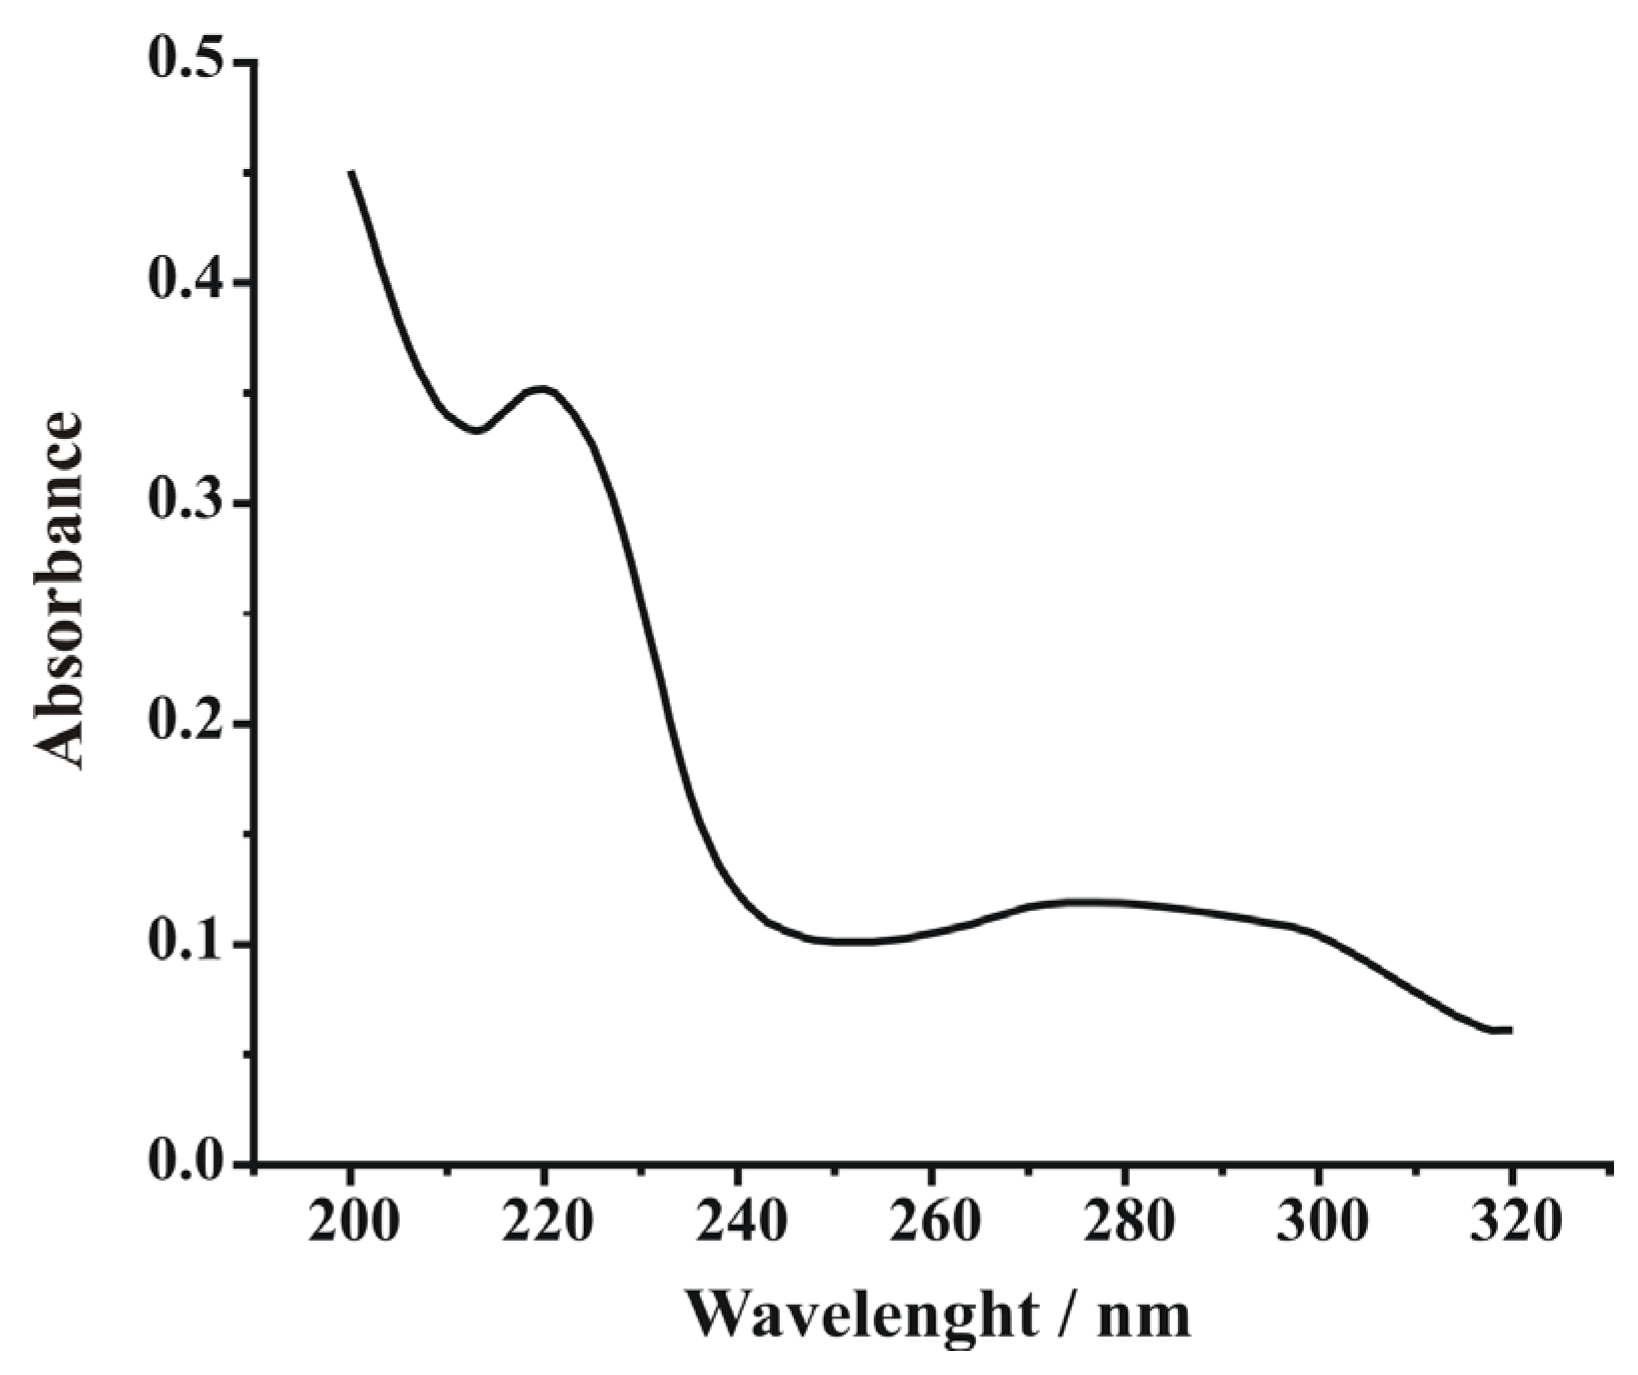
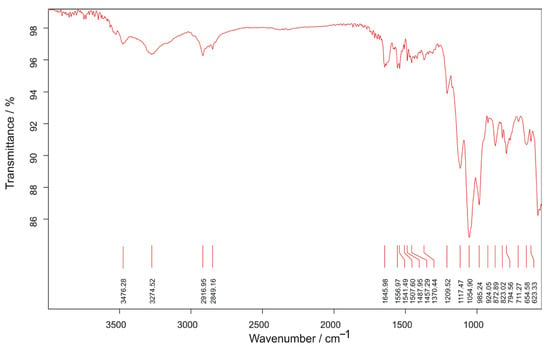
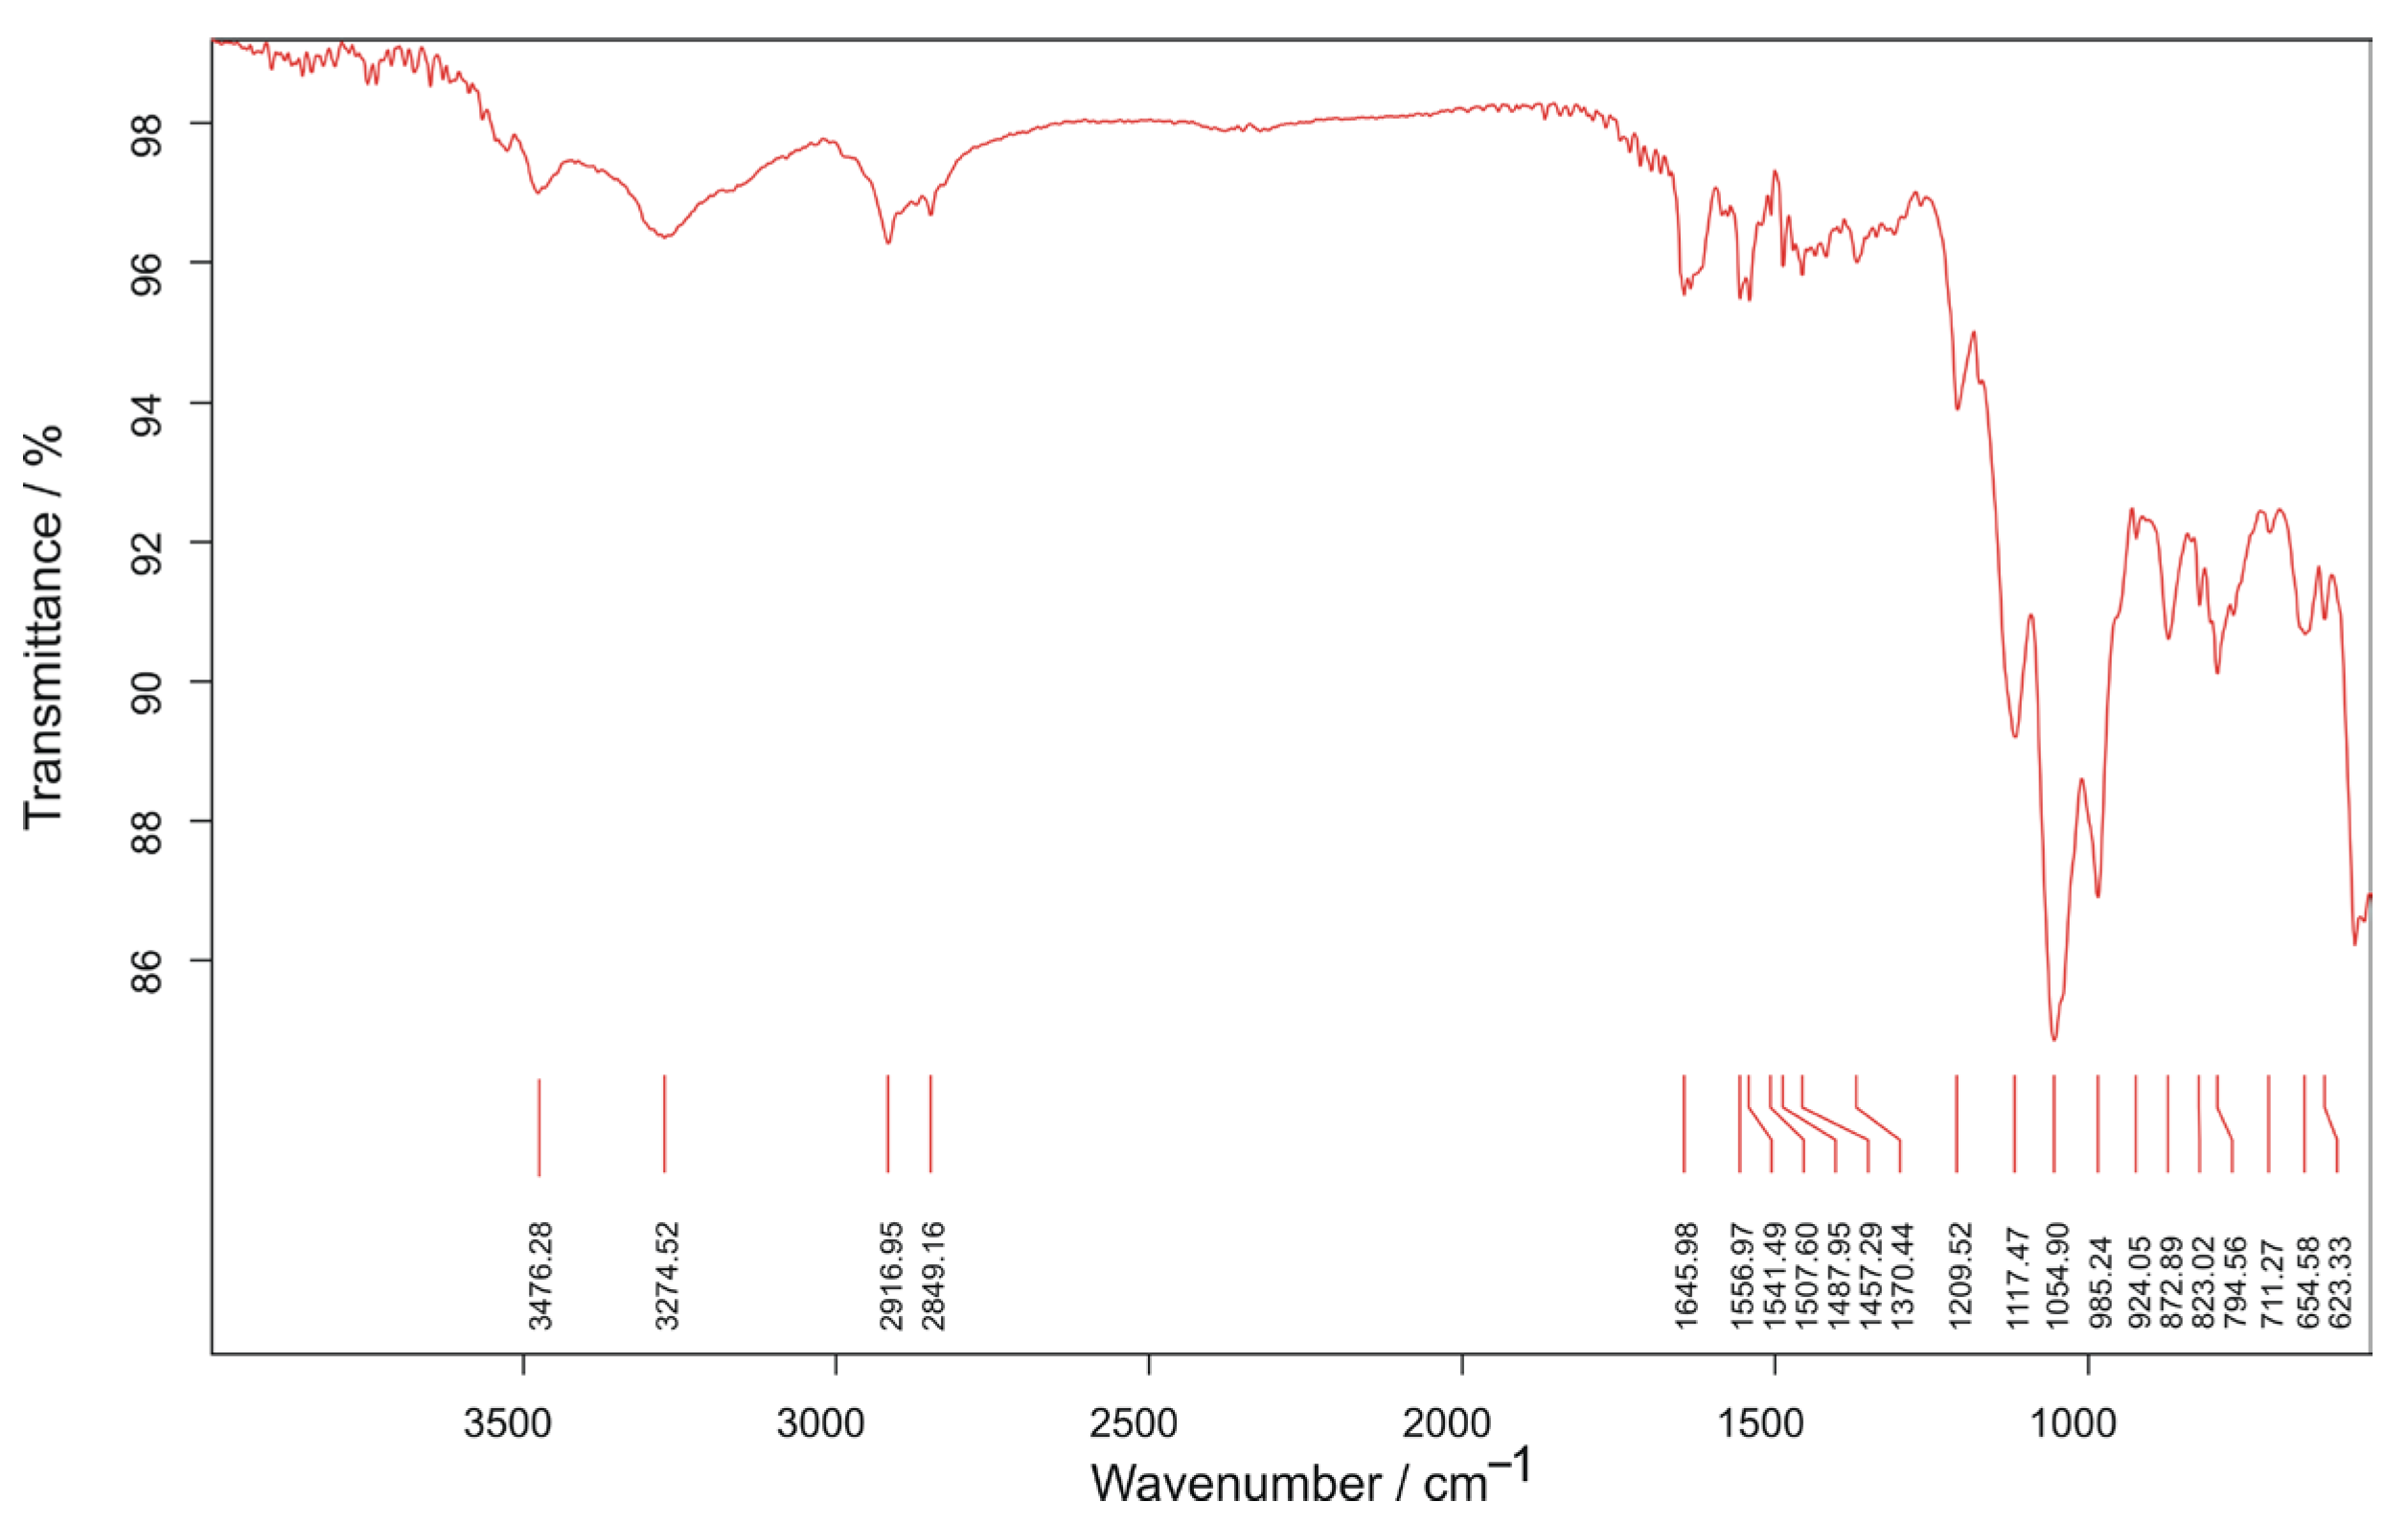
The characterization of MLT was performed using UV-Vis and IR spectroscopy and Ultra-High-Performance Liquid Chromatography (UHPLC). The UV-Vis spectrum (Figure 2) indicated the presence of characteristic peaks at wavelengths of 220 nm and 270 nm, corresponding to the structure of MLT and thus confirming its presence [14,15]. As regards FTIR spectroscopy, characteristic bands corresponding to the vibrations of the functional groups in the structure of MLT were obtained (Figure 3), contributing to the confirmation of the identity of the extracted compound.
Figure 2.
UV-Vis spectrum of MLT solution.
Figure 3.
FTIR spectrum of the MLT sample.
The FTIR spectrum, recorded in the 4000–500 cm−1 range for pure solid MLT, shows the characteristic peaks of the molecule’s functional groups: 3274–3747 cm−1, corresponding to the N-H bond (a secondary amide and an indole nucleus); 2800–2920 cm−1, corresponding to the C-H bonds in the methoxy (-OCH3) group and in the aromatic nucleus; 1646 cm−1, corresponding to the carbonyl C=O bond in the amide; between 1560 and 1450 cm−1, the characteristic bands of the indole nucleus and the aromatic cycle; 1372–1110 cm−1, corresponding to the C-N bonds in the secondary amide and indole; 1155–985 cm−1, corresponding to the C-O-C bonds; and 925–794 cm−1, specific to the deformations of the aromatic nucleus [16,17].
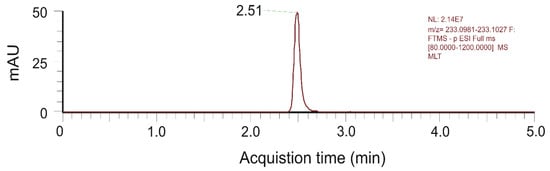
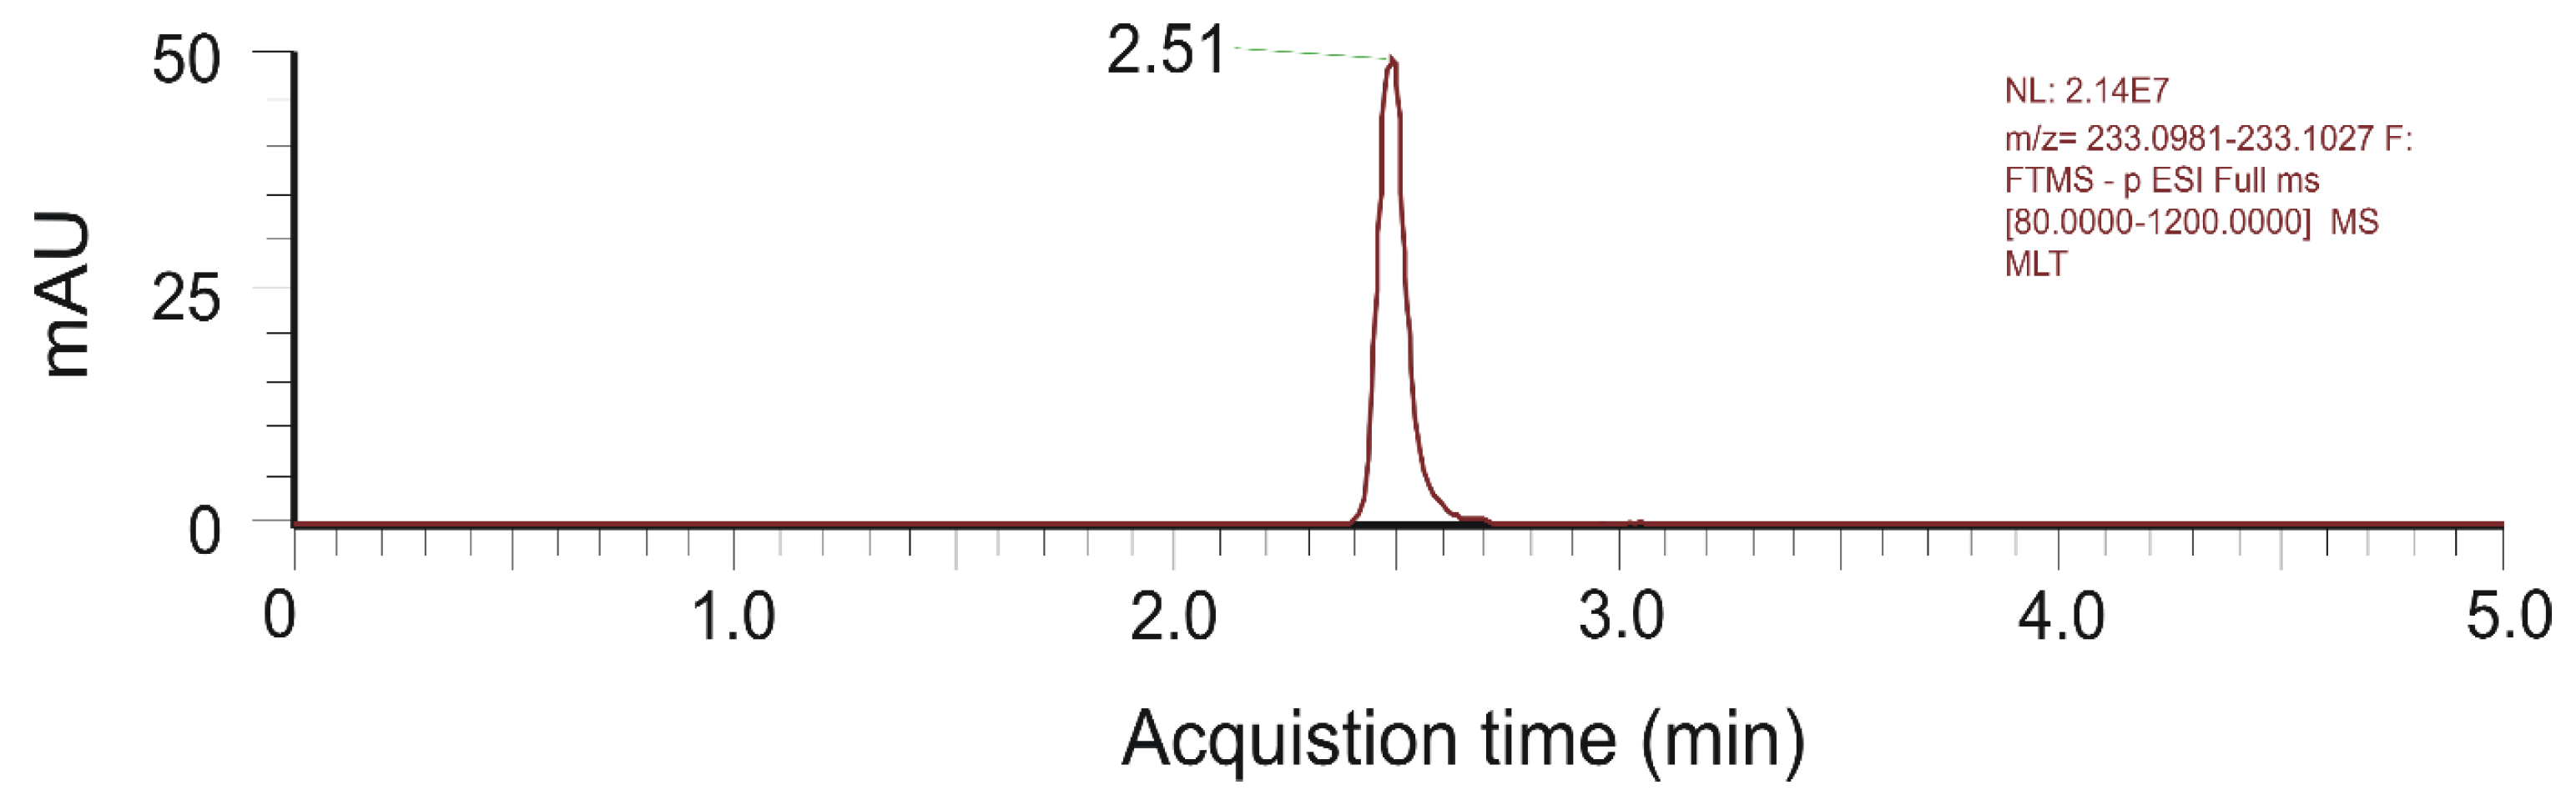
The chromatogram obtained for the purified MLT purified from pharmaceutical products is presented in Figure 4.
Figure 4.
Chromatogram of MLT obtained via UHPLC–MS/MS, using positive ionization.
Only one peak of MLT was obtained at 2.51 min, which corresponds to the molecular ion of MLT, m/z = 233.1 [M + H]+. This result is in agreement with results reported in the literature [19,20]. The UHPLC–MS/MS data confirmed the purity of the MLT to be used in the voltametric determinations with nanomaterial-modified screen-printed electrodes.
3.2. Analysis of the Kinetics of Redox Reactions Using Potassium Ferrocyanide
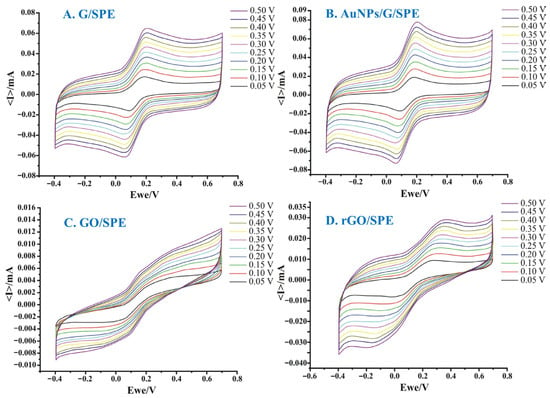
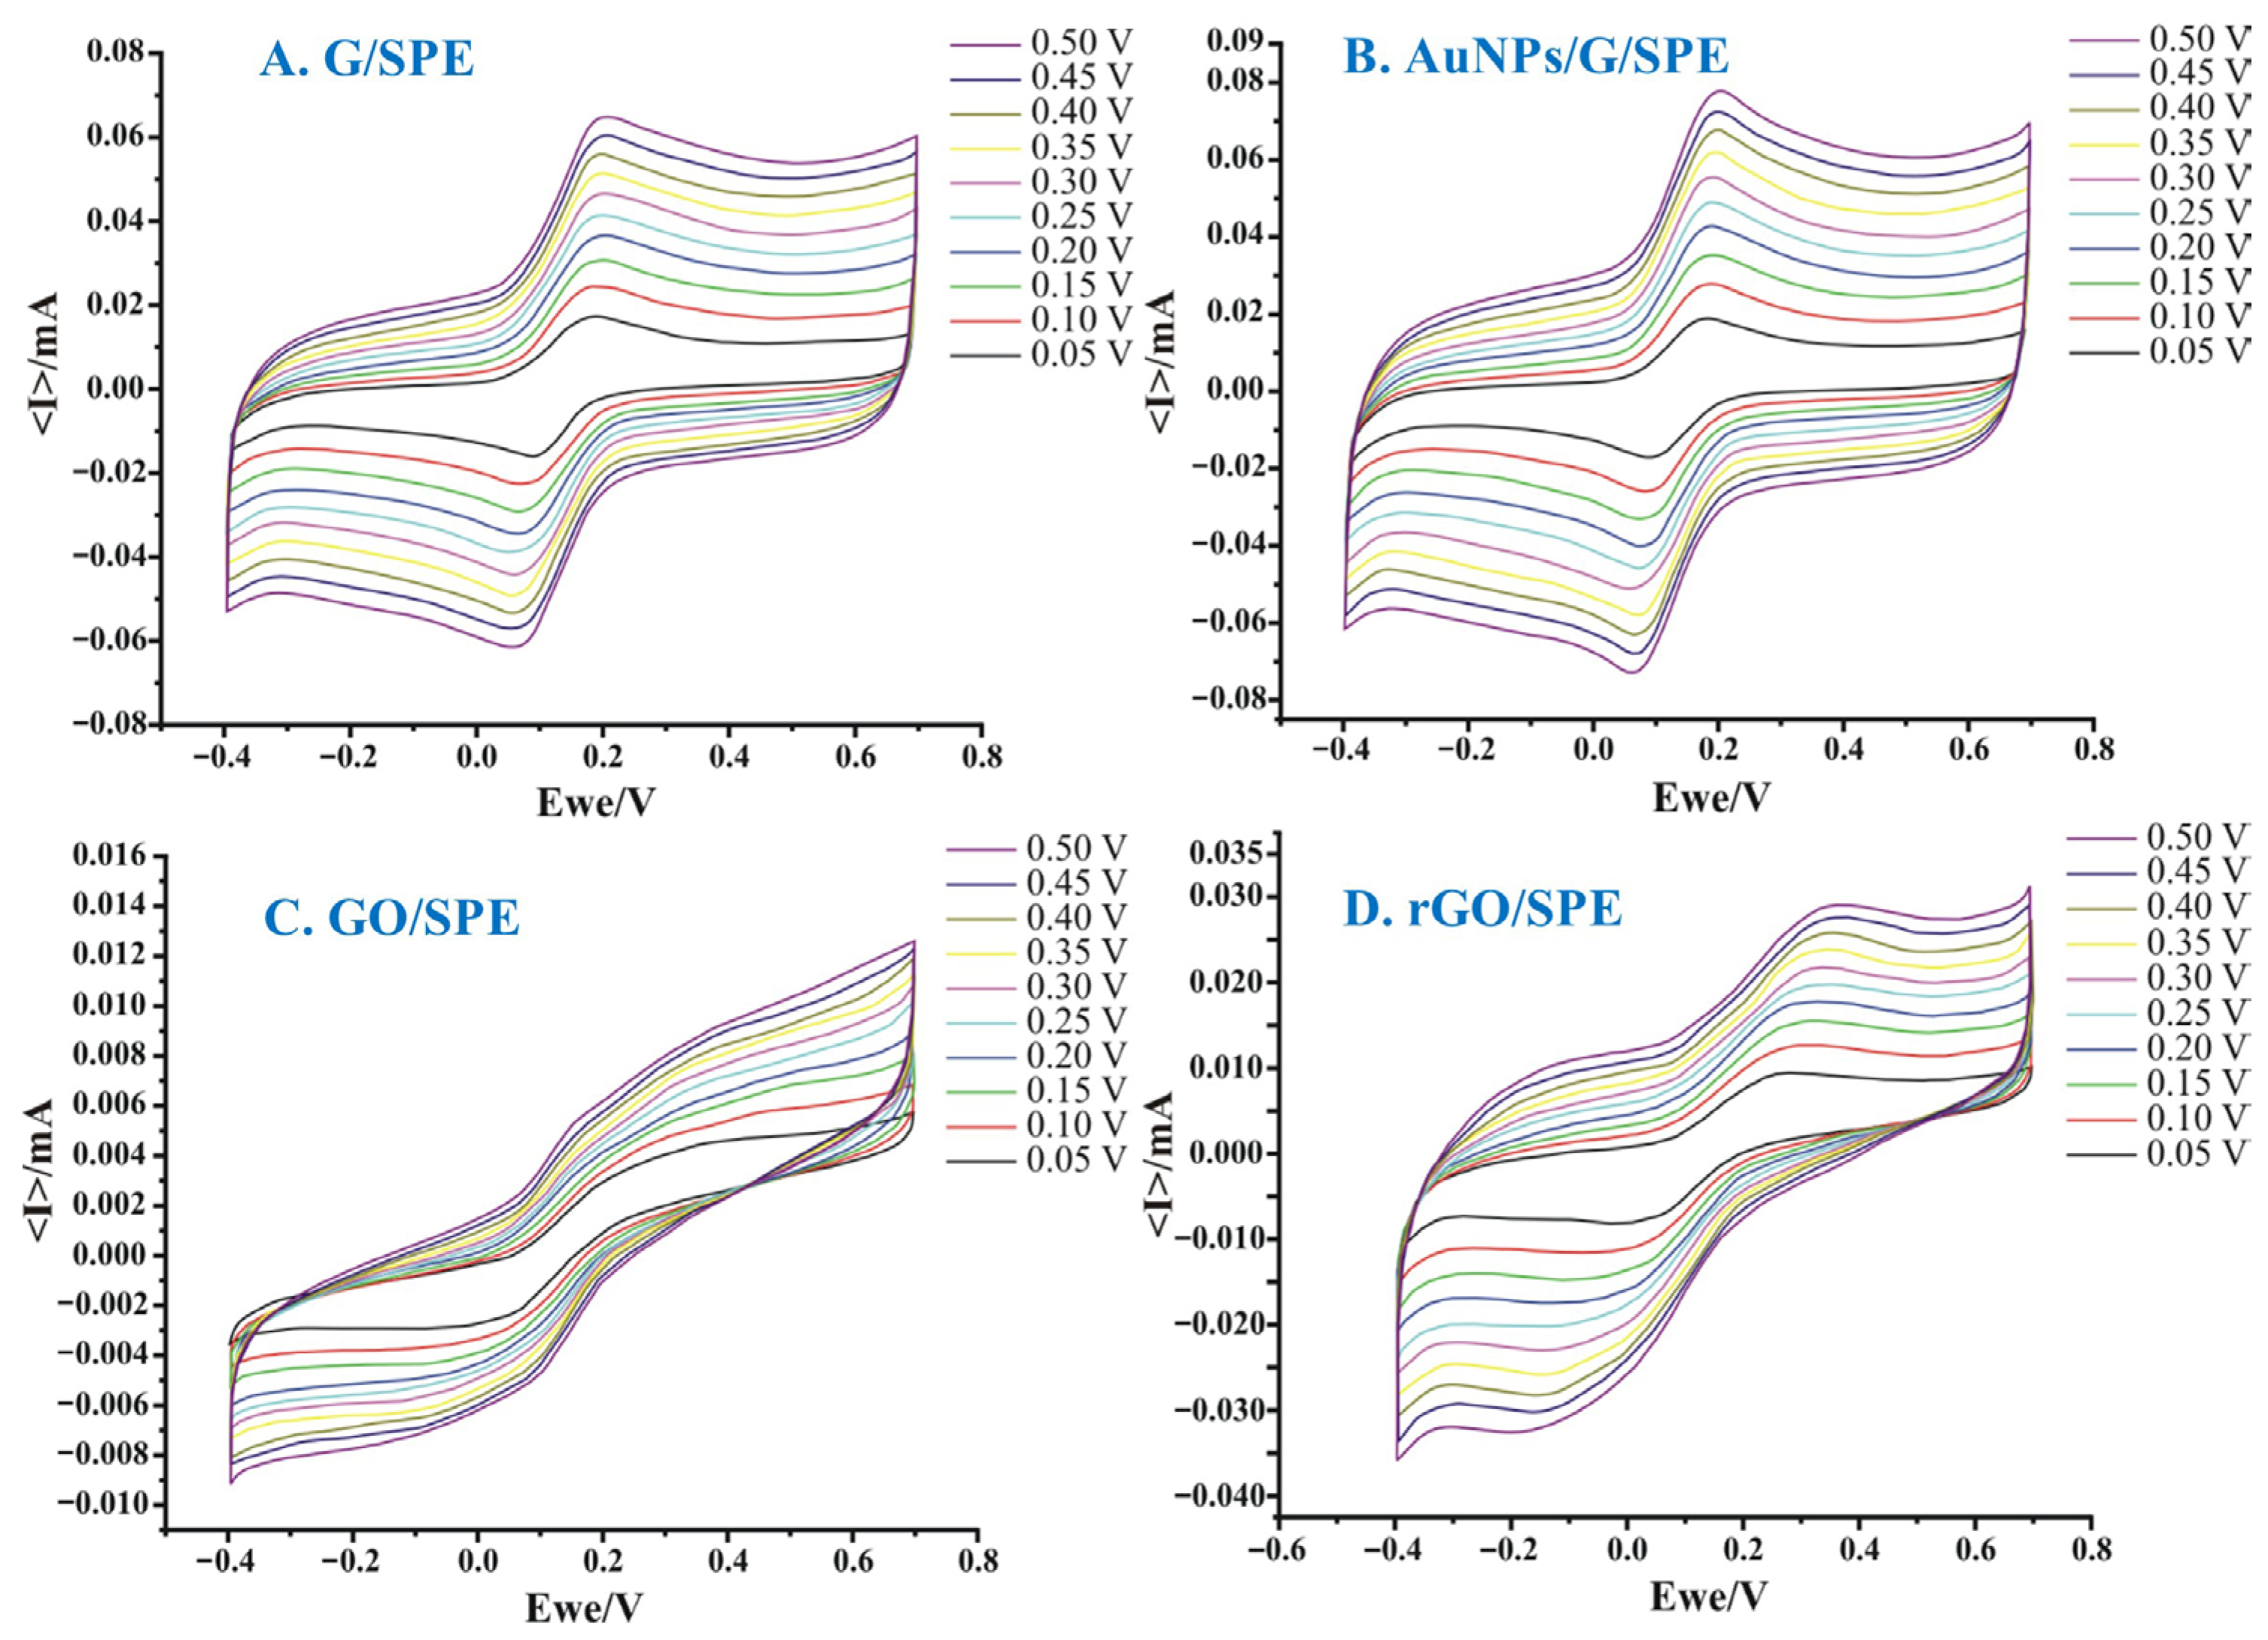
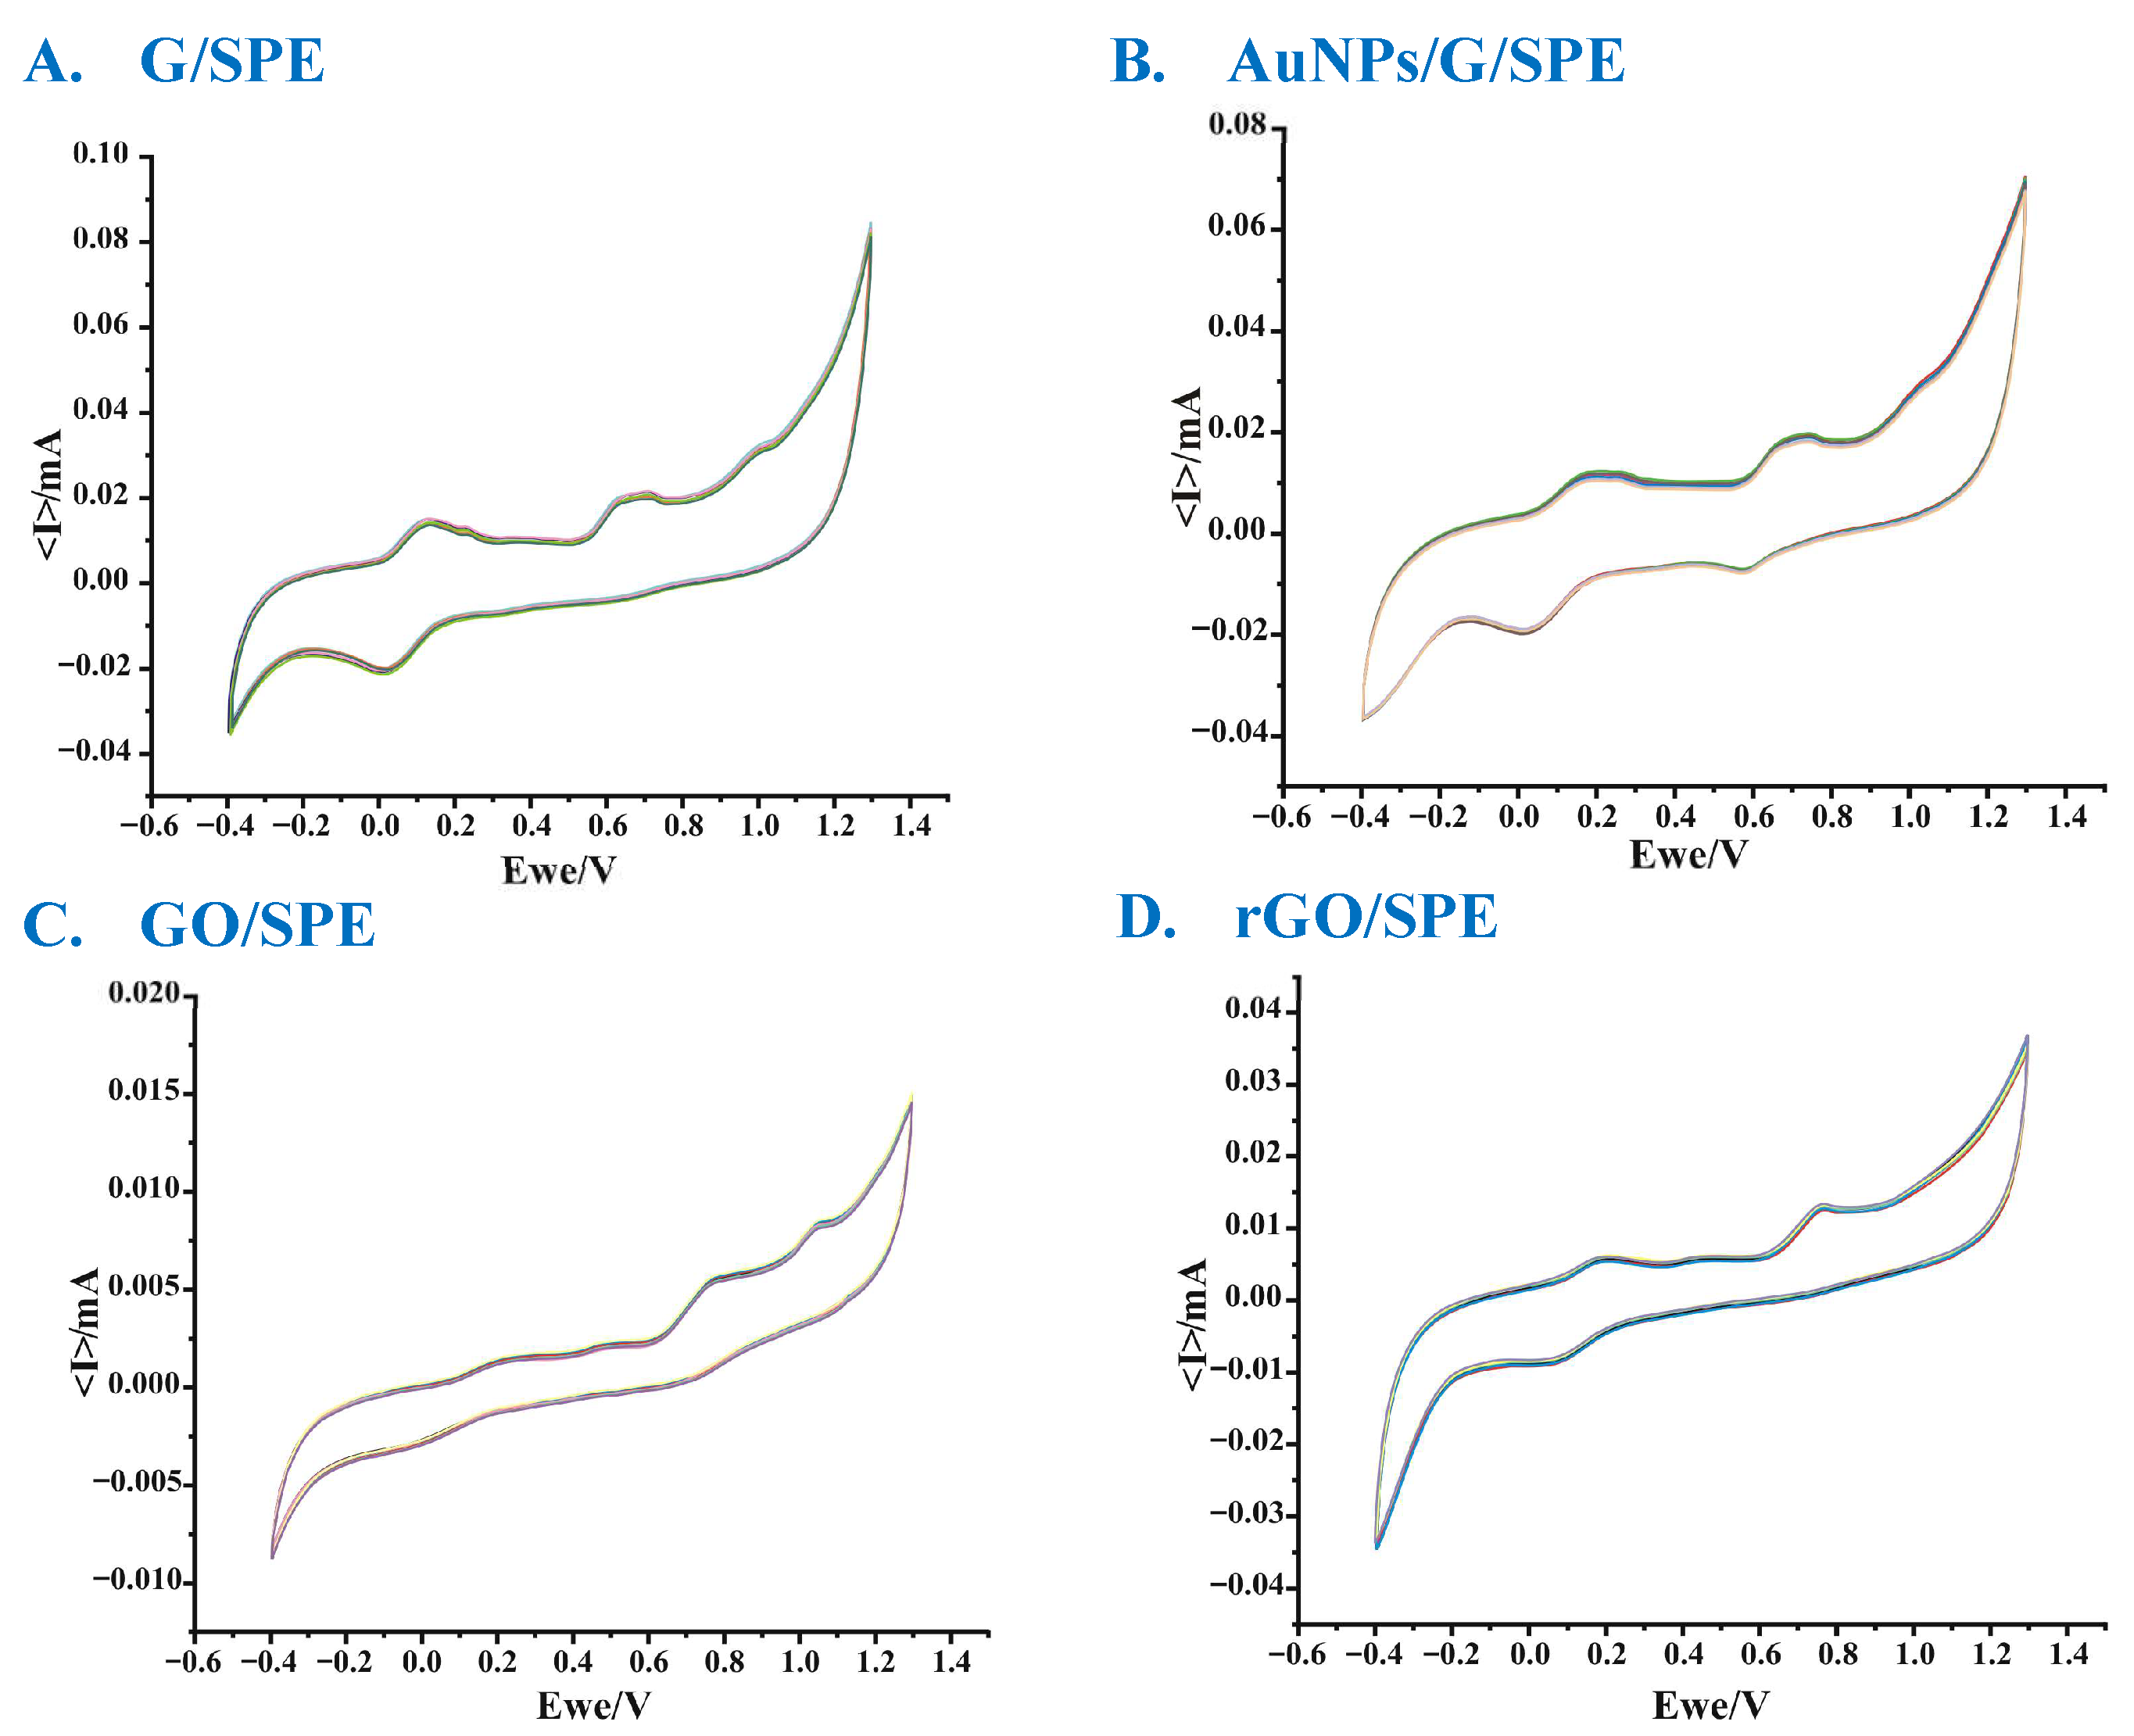
The voltametric behavior of each working electrode was analyzed (Figure 5) to characterize the electroactive surface (Table 1).
Figure 5.
Cyclic voltammograms of the sensors: (A)—G/SPE; (B)—AuNPs/G/SPE; (C)—GO/SPE; and (D)—rGO/SPE) immersed in a 1 mM K4[Fe(CN)6]—0.1 M KCl solution, recorded at different scan rates (from 0.05 V/s to 0.5 V/s).
Table 1.
Voltametric performance of the electrodes.
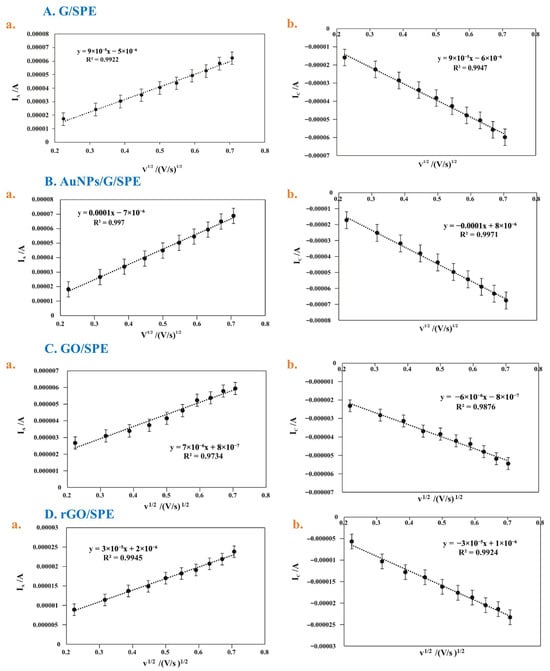
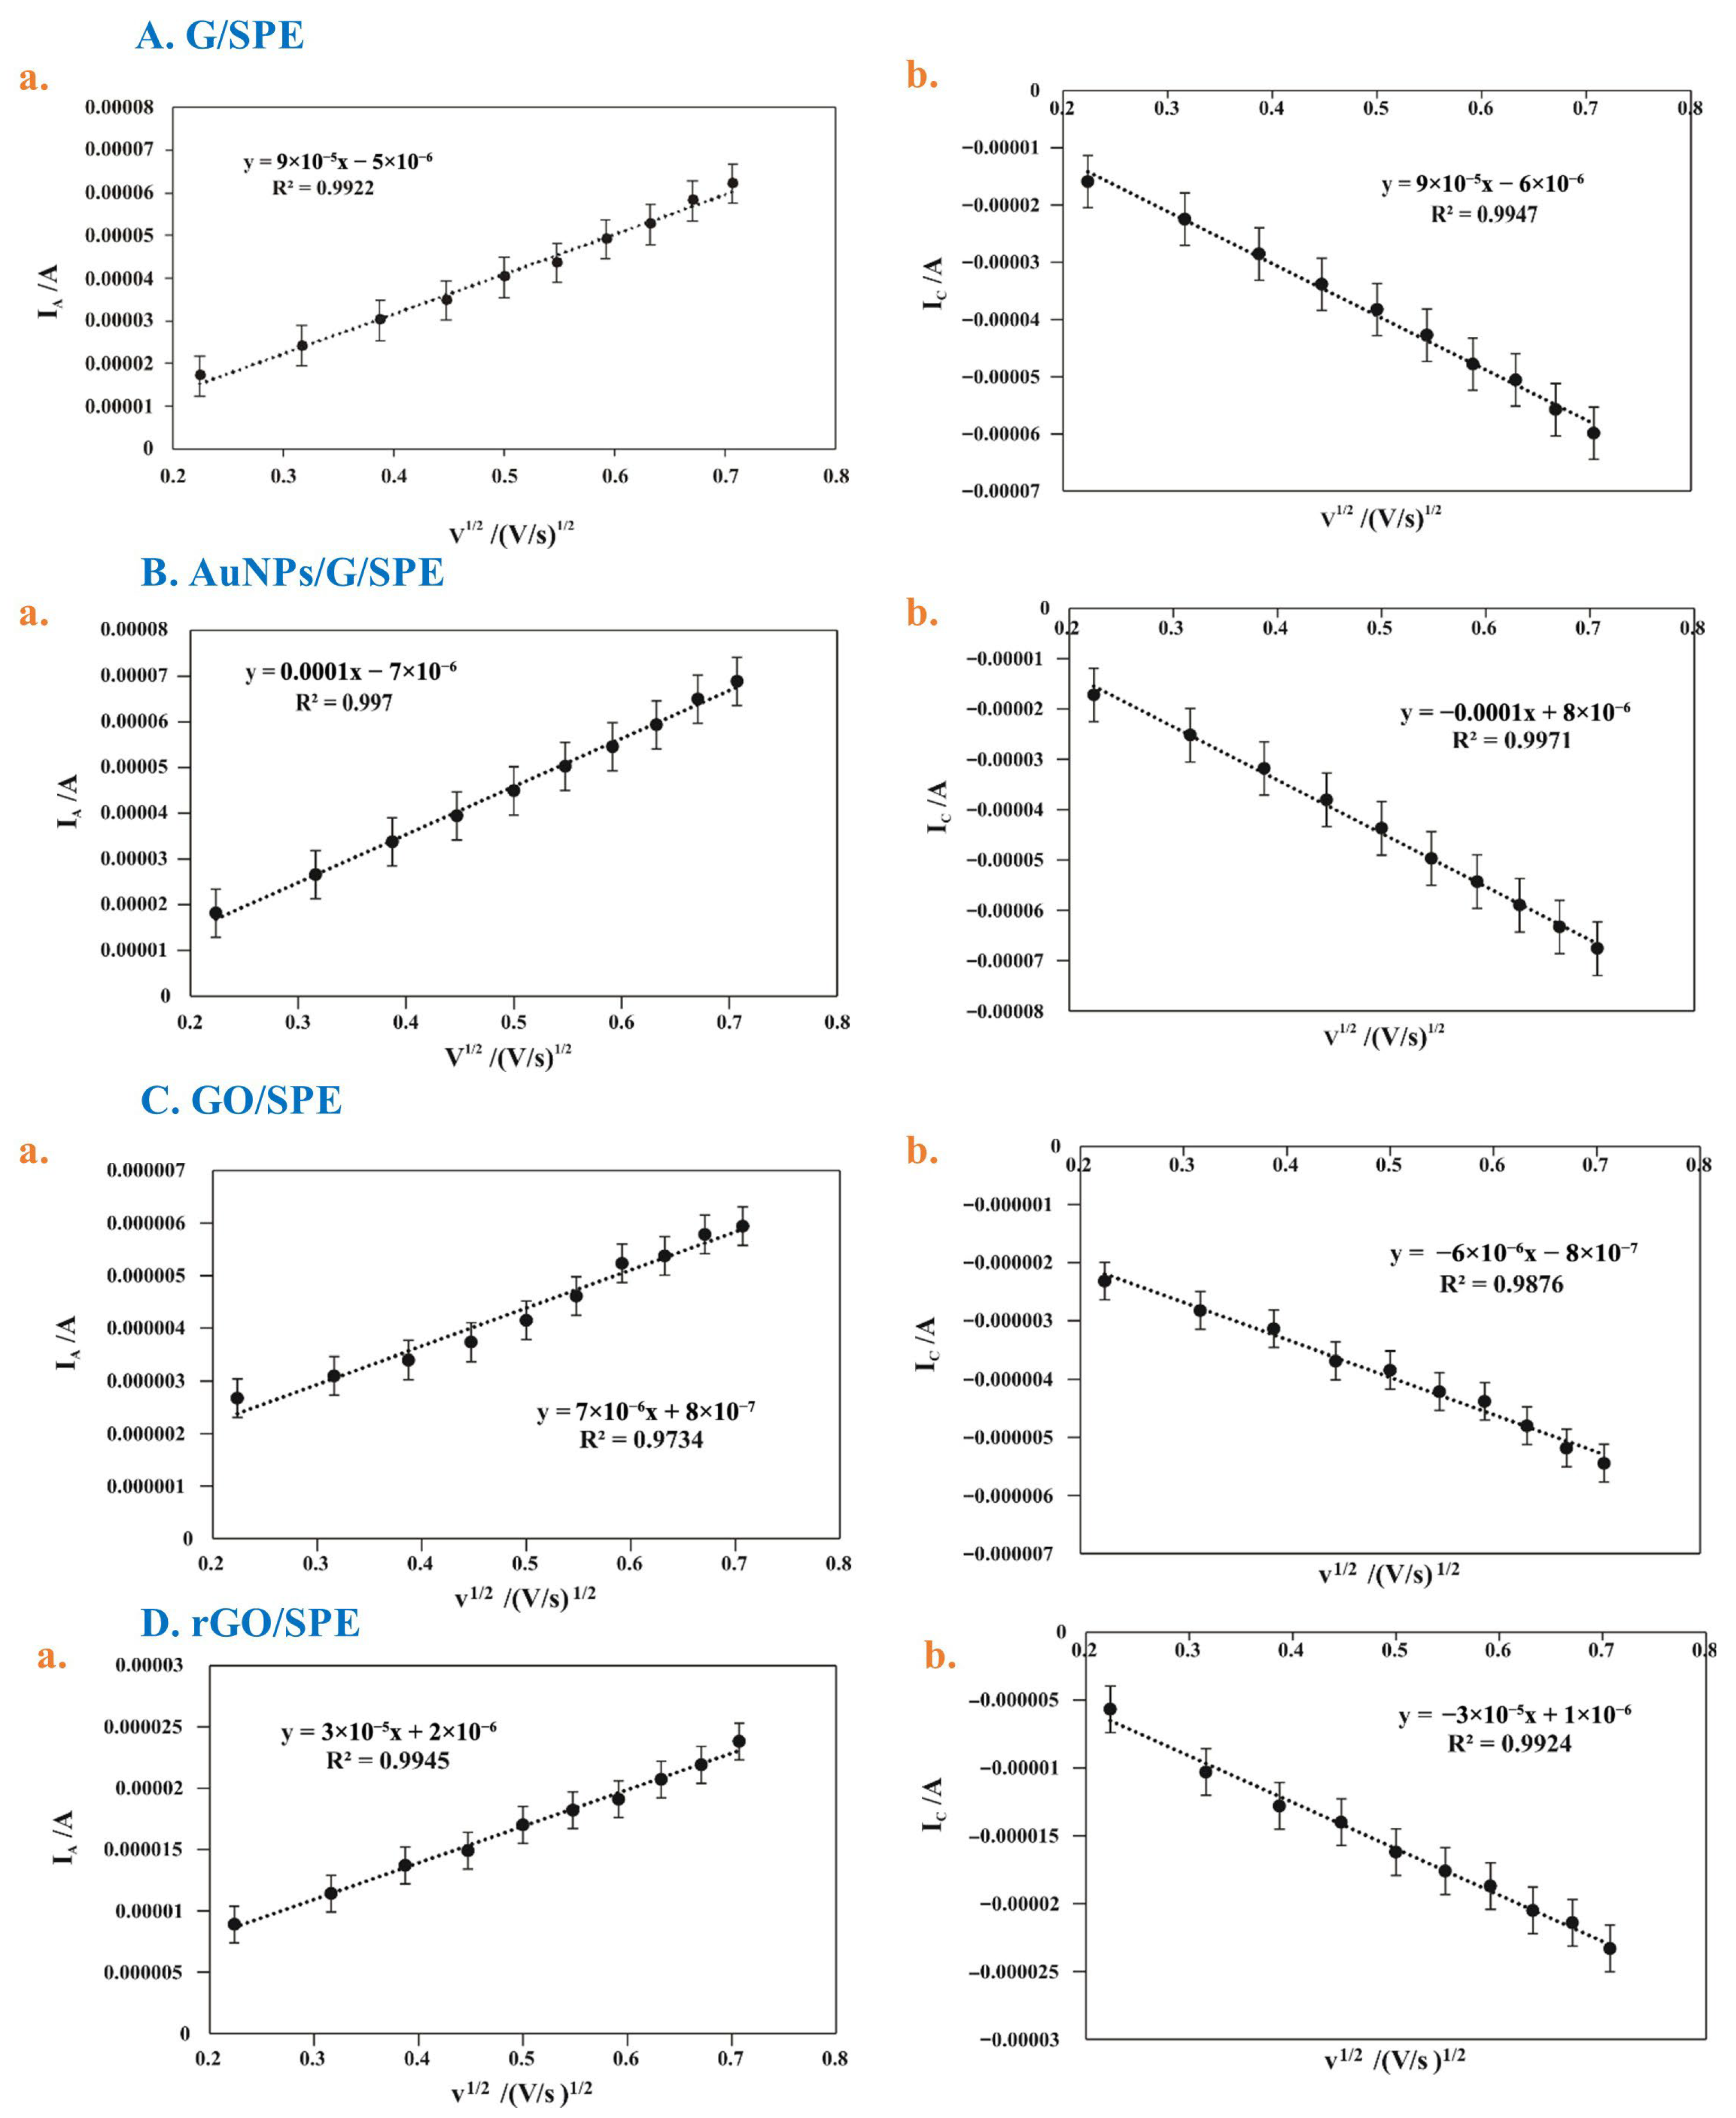
In all cases, an increase in the intensity of the anodic and cathodic peaks was observed with the increase in the scanning rate (Figure 6). The intensity of the anodic peak is directly proportional to the square root of the scan rate, demonstrating that the oxidation of MLT on the surfaces of the sensors is diffusion-controlled [21].
Figure 6.
Linear dependence between the anodic peak (a) and the cathodic peak (b) and the scan rates for G/SPE (A), AuNPs/G/SPE (B), GO/SPE (C), and rGO/SPE (D).
Pure graphene provides an extended surface area for electrochemical interactions, facilitating rapid electron transfer and ensuring high sensitivity in the electrochemical detection of the analyzed species. The redox process is reversible, which indicates fast electron transfer and very good electrochemical behavior.
The redox process is also reversible in the case of AuNPs/G/SPE, also indicating rapid electron transfer and superior electrochemical behavior. AuNPs are well known for their catalytic role in electrochemical reactions, which is due to their large surface areas and high catalytic activity. They can accelerate oxidation and reduction processes, which contributes to achieving an almost-ideal current ratio [22].
The ratio of the cathodic to anodic peak currents (Ic/Ia) in the case of GO/SPE is 0.8664, which means that the redox process is quasi-reversible due to a moderate rate of electron transfer. GO/SPE can introduce defects and oxygenated functional groupings that affect electron transfer, and in its pure state, it is not considered a preferred material due to its insulating nature [23].
GO/SPE has lower conductivity and a smaller electrochemical surface area, which may limit its applicability in detection tasks that require high sensitivity.
The GO reduction partially restores the conductivity of graphene, but it retains some of the functional groups, which can provide additional active sites for electrochemical reactions.
Pure GO can be converted into rGO through chemical, electrochemical, thermal, microwave-assisted, or laser-induced reduction processes to improve electrical conductivity performance. However, due to the decrease in the number of functional groups during the reduction process, there may be problems between electrical conductivity and sensitivity [24].
G/SPE and AuNPs/G/SPE sensors have the largest electrochemical surface areas, making them ideal for high-sensitivity and fast-response applications such as the detection of biomolecules or other chemical species.
The GO/SPE sensor has a much smaller electrochemical surface area, making it suitable for detection tasks where specific chemical reactivity is important, but its overall sensitivity is lower.
The rGO/SPE sensor shows a balance between sensitivity and reactivity, with an electrochemical surface area larger than that of oxidized graphene but smaller than that of pure G/SPE or AuNPs/G/SPE.
3.3. Study of the Sensor Kinetics in MLT Solution
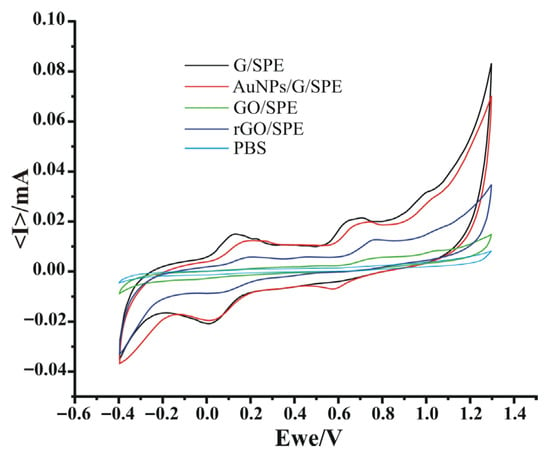
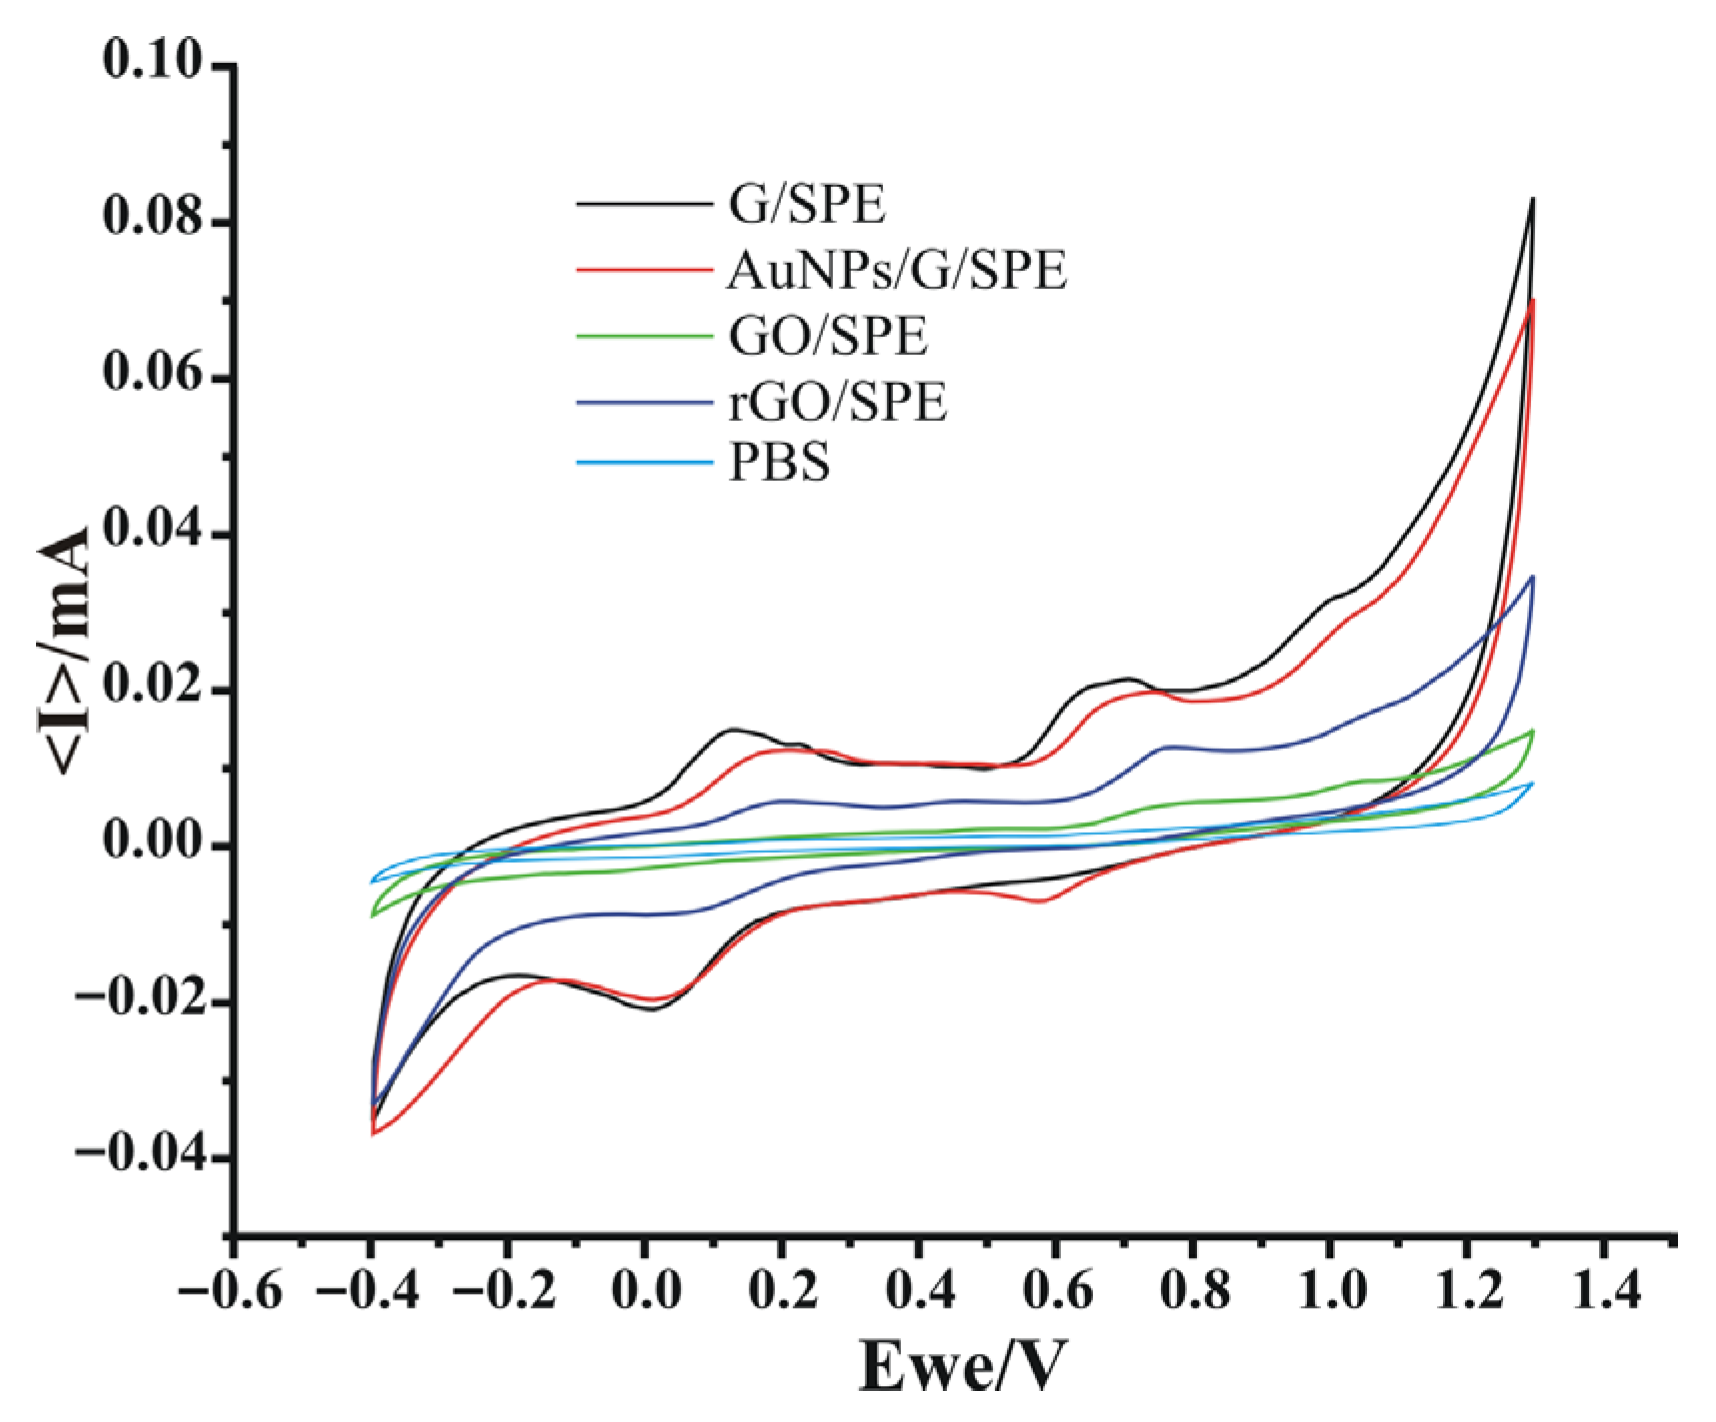
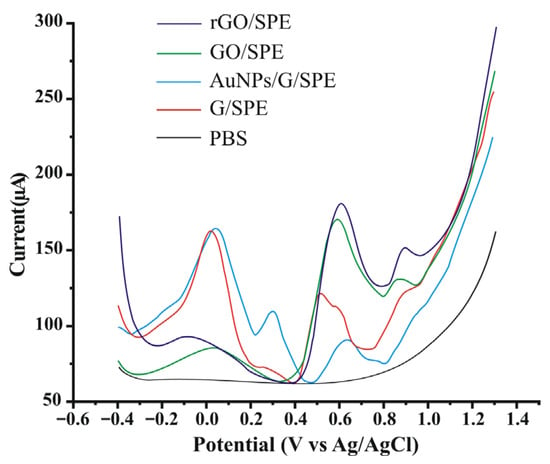
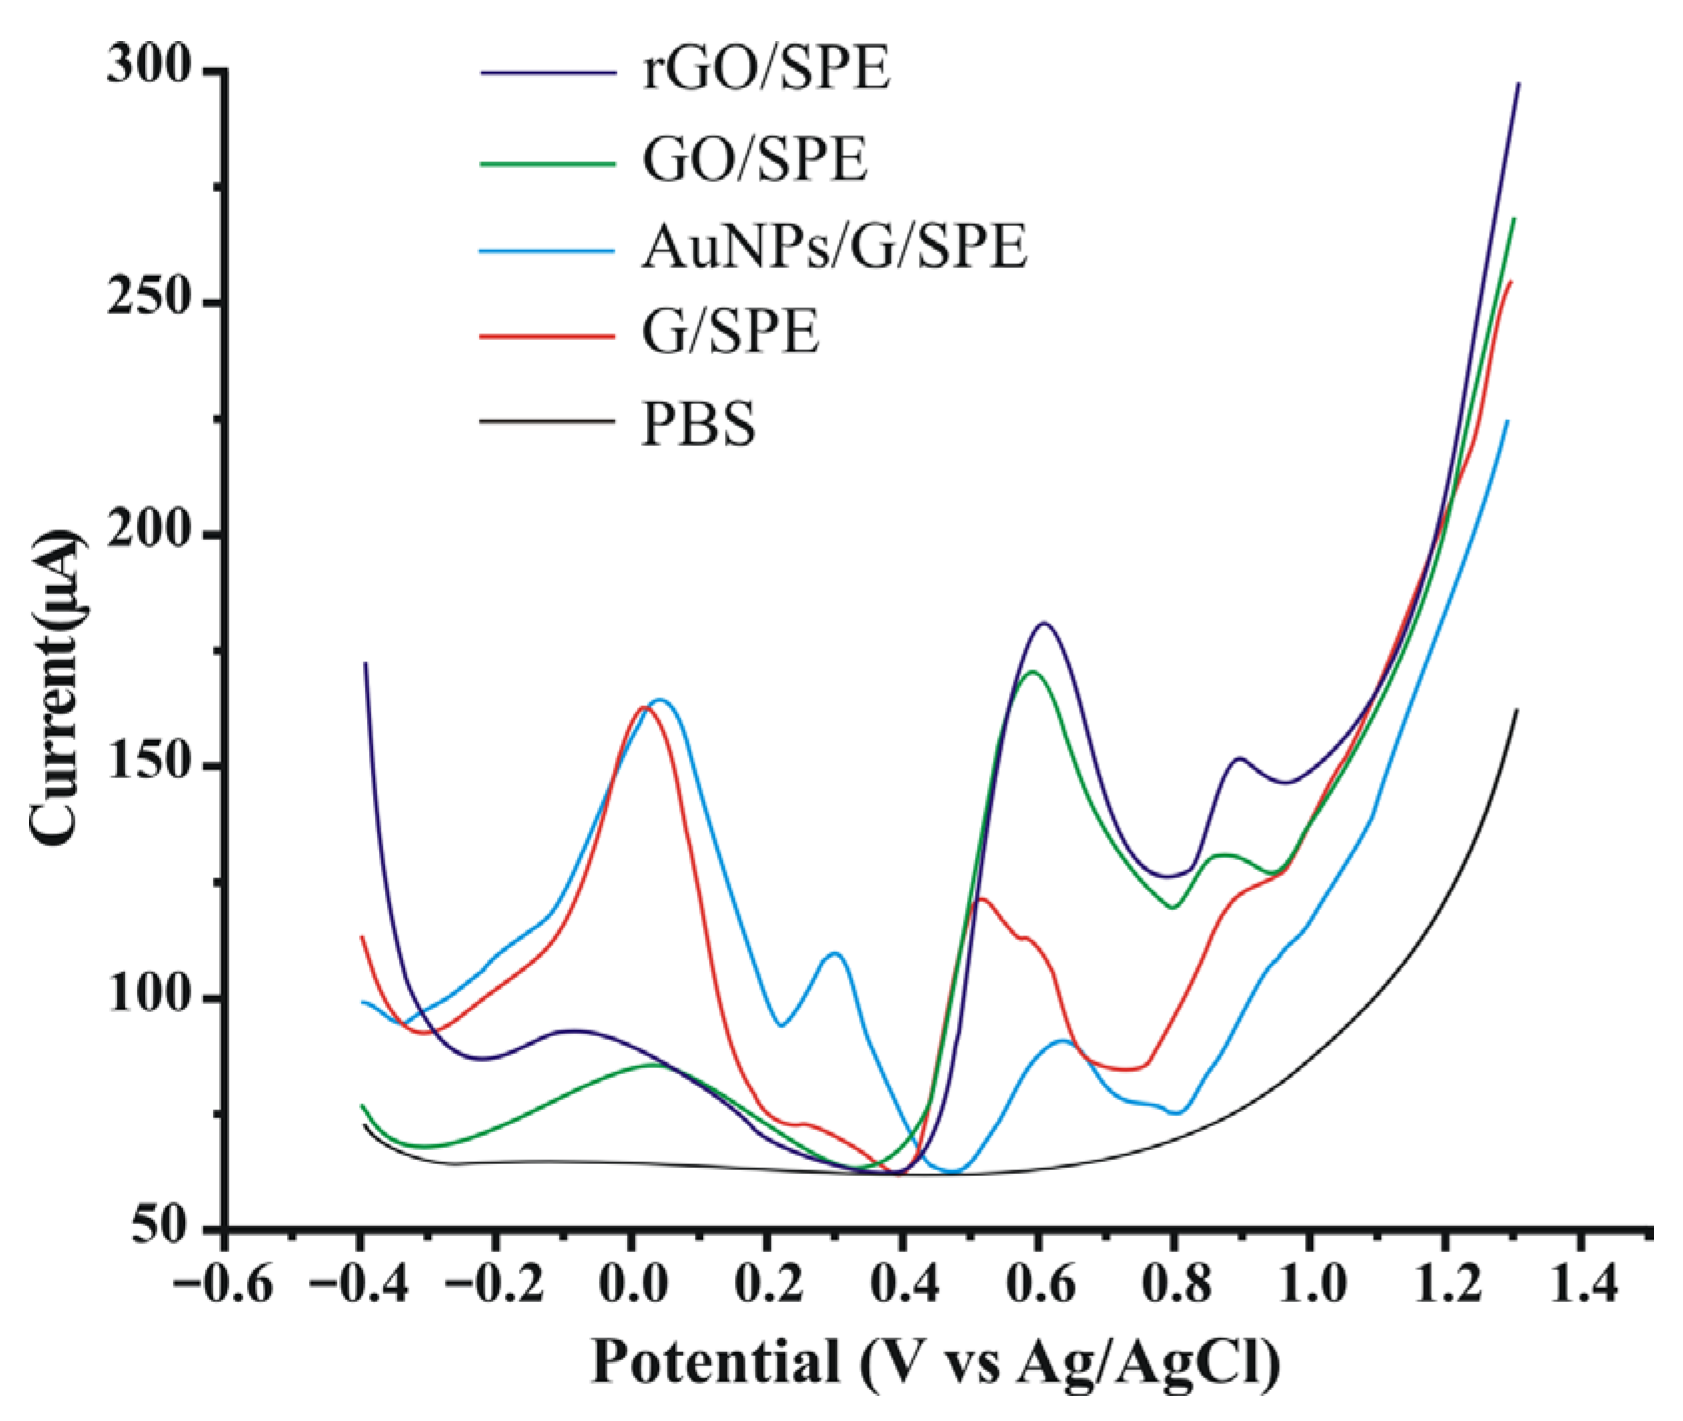
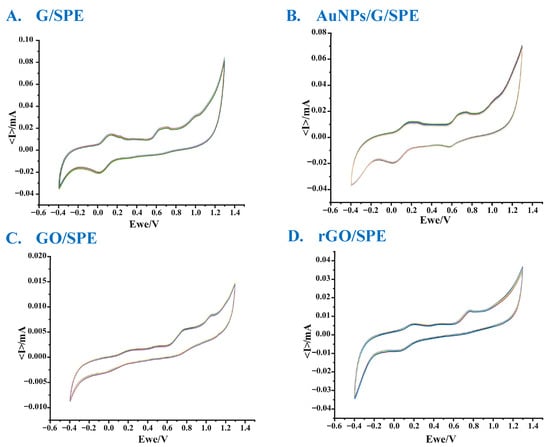
The MLT solution was prepared at an initial concentration of 1 × 10⁻⁴ M in 50 mL of PBS (pH 7.0). The detection of MLT was achieved via cyclic voltammetry, using modified working electrodes. The voltammograms show two oxidation peaks and two reduction peaks, confirming MLT undergoes a two-electron redox process that takes place in two stages (Figure 7 and Figure 8) [4].
Figure 7.
Overlaid cyclic voltammograms of all sensors immersed in 1 × 10⁻⁴ M MLT solution and PBS, respectively.
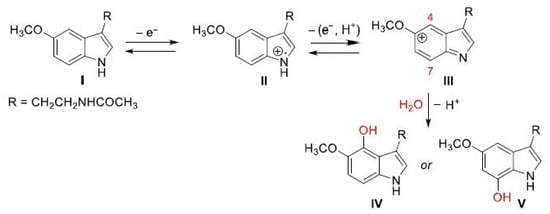
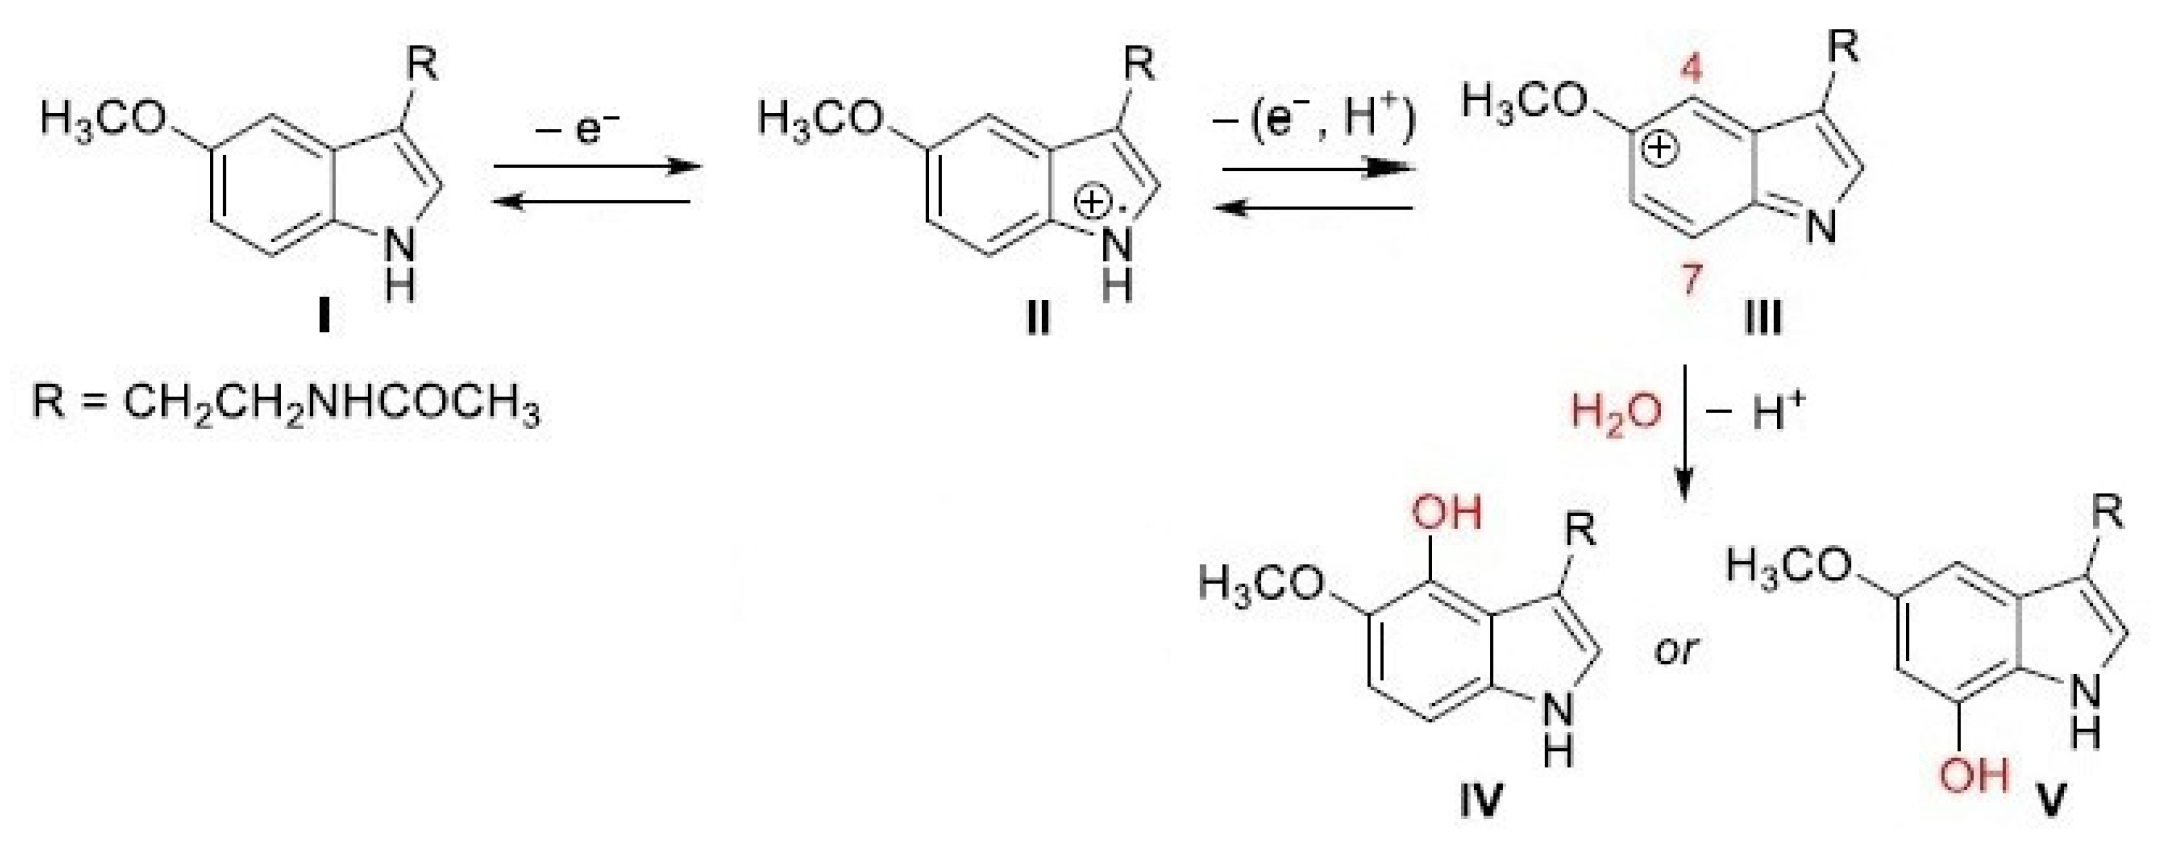
Figure 8.
The proposed reaction mechanism for the electrochemical detection of MLT.
Figure 8 shows the proposed reaction mechanism for the electrochemical process melatonin undergoes on the sensors’ active surfaces. Initially, melatonin (I) undergoes oxidation, losing an electron to form a cation-radical intermediate (II). This cation radical then undergoes a second oxidation process, losing an additional electron and a proton to produce the indol-5-ylium ion (III). The indol-5-ylium ion (III) is particularly electrophilic at positions 4 and 7. Therefore, the nucleophilic attack by water leads to the loss of the second proton, resulting in compound IV or V [4].
The electron transfer processes are quasi-reversible, as can be seen in Figure 7, where two peak pairs well-defined for all the sensors can be observed. The differences between the sensors’ responses are related to the nature of the nanomaterials from the sensitive layers.
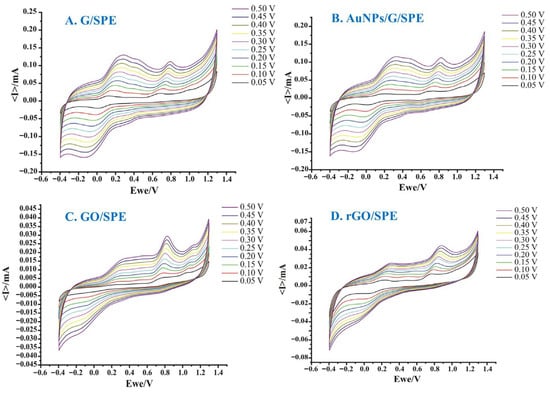
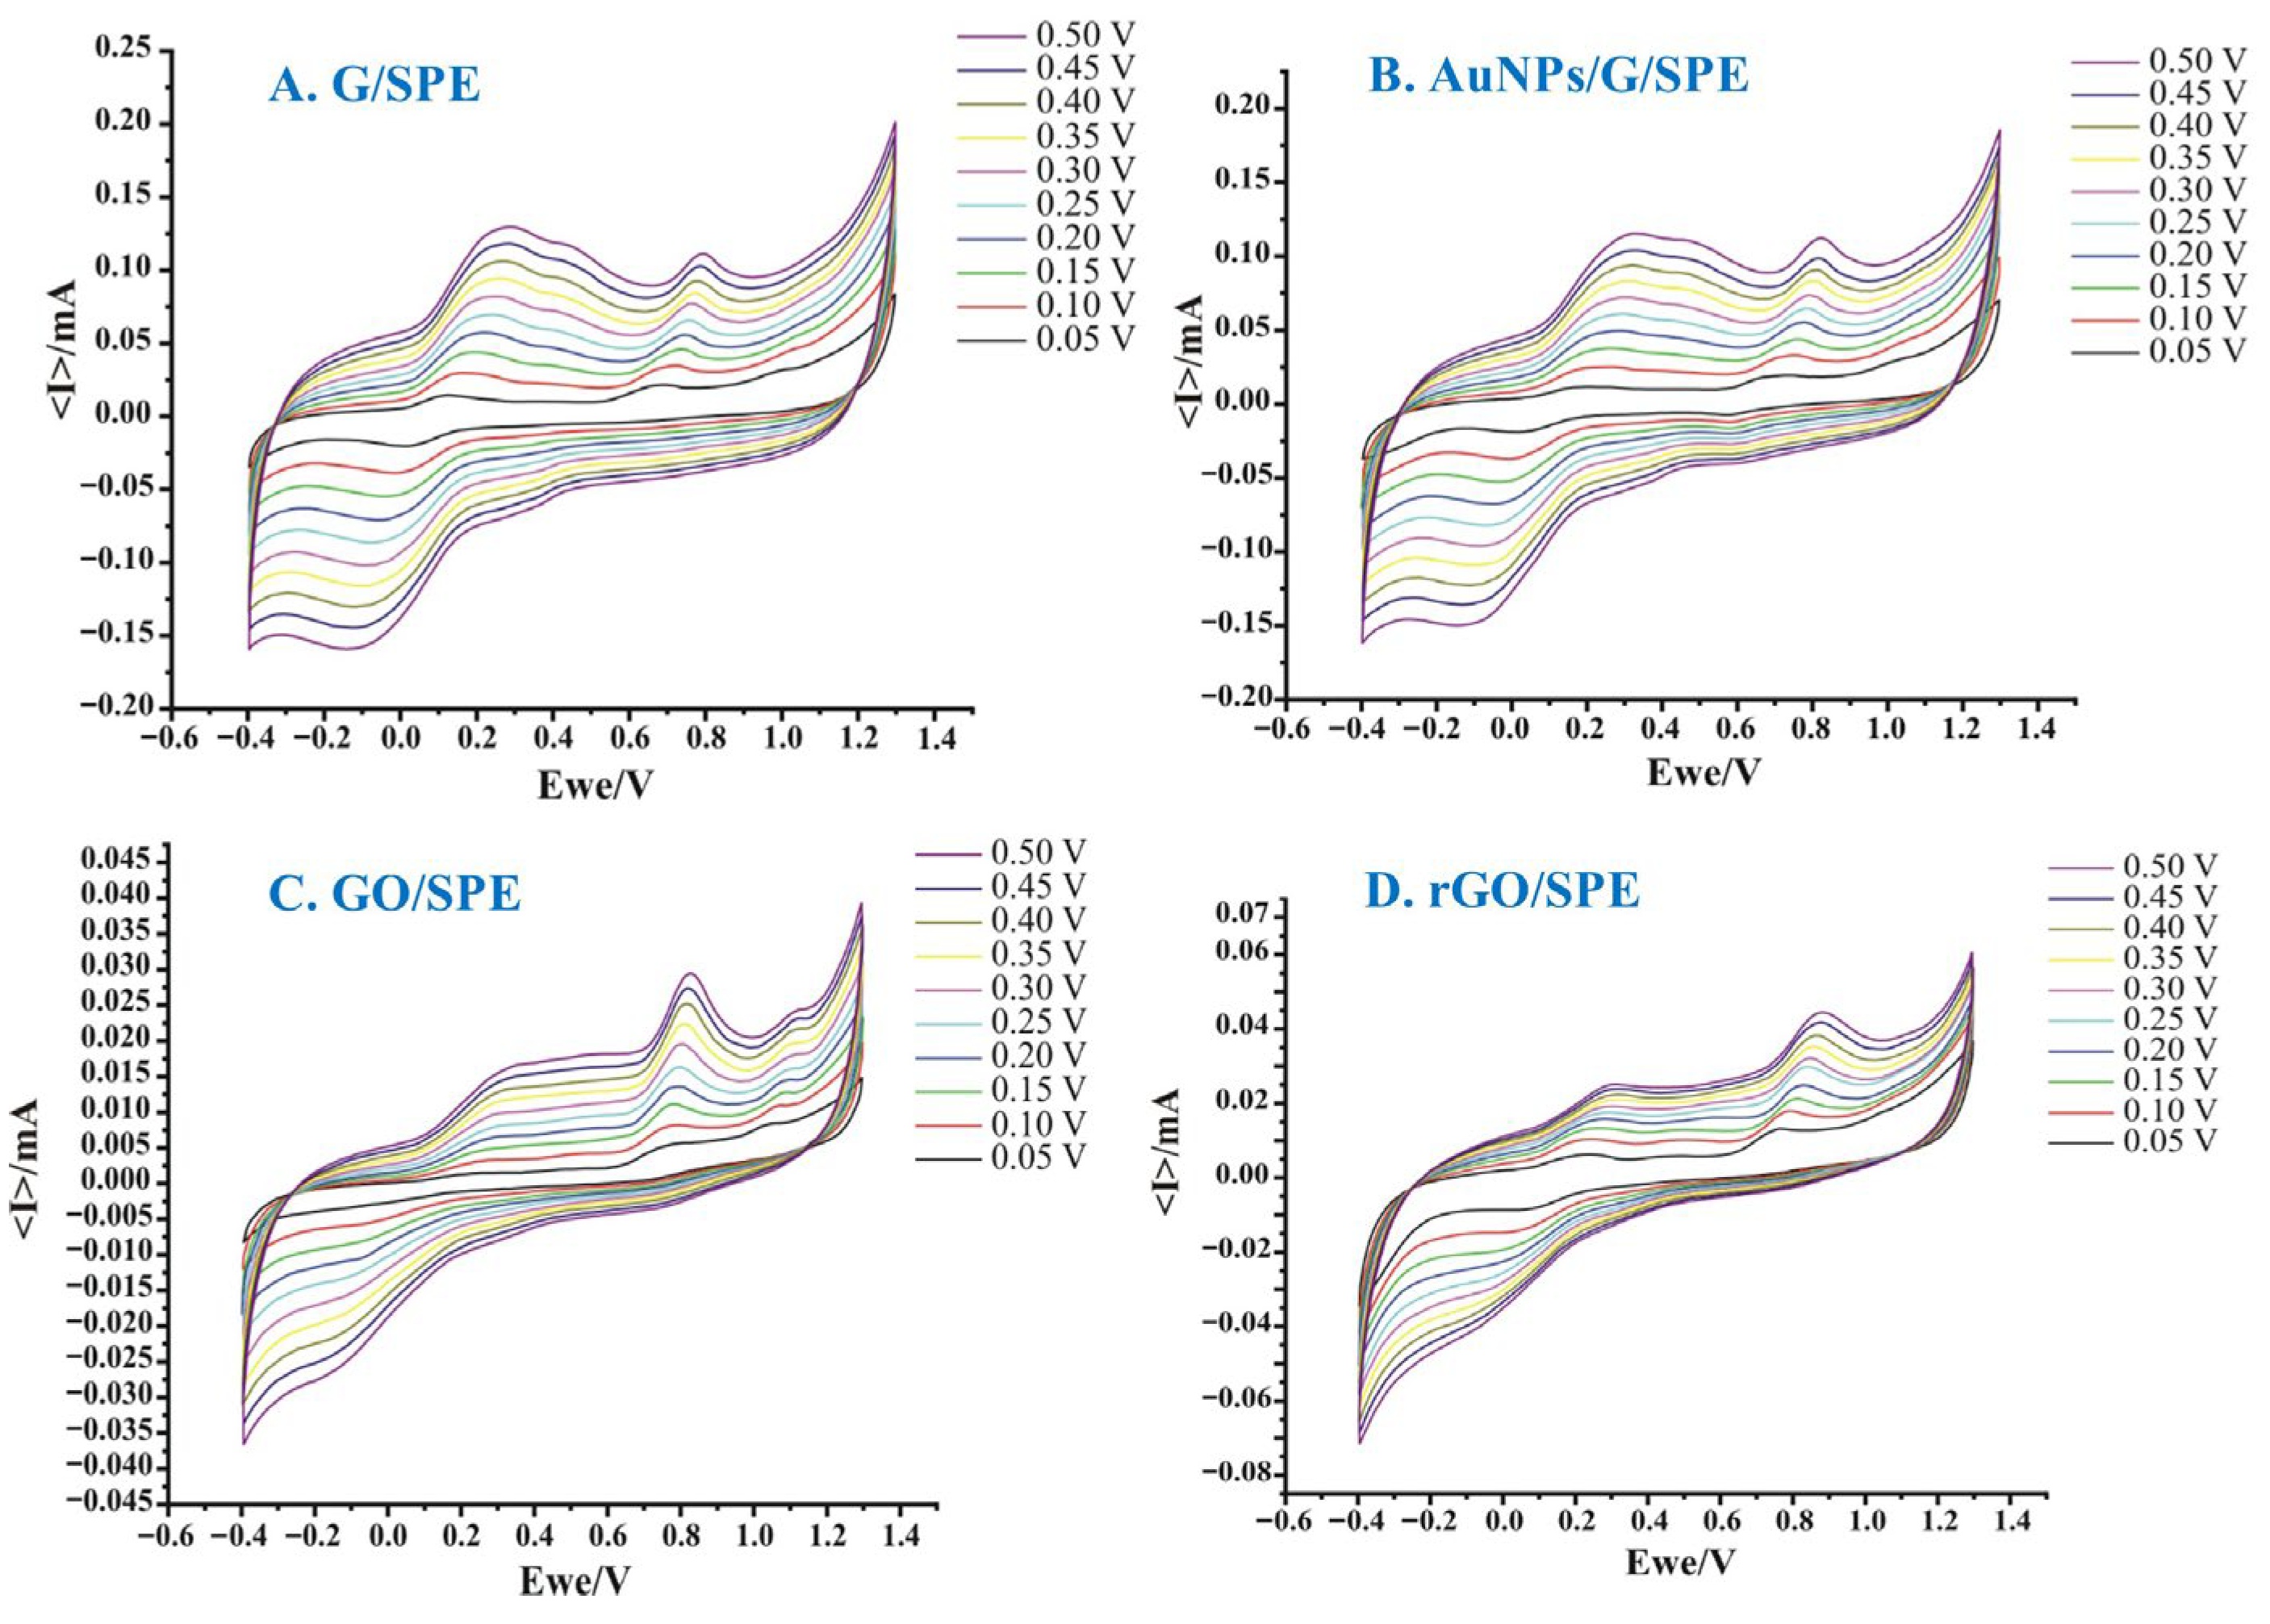
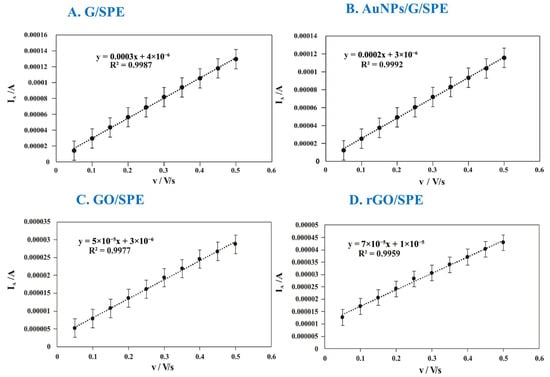
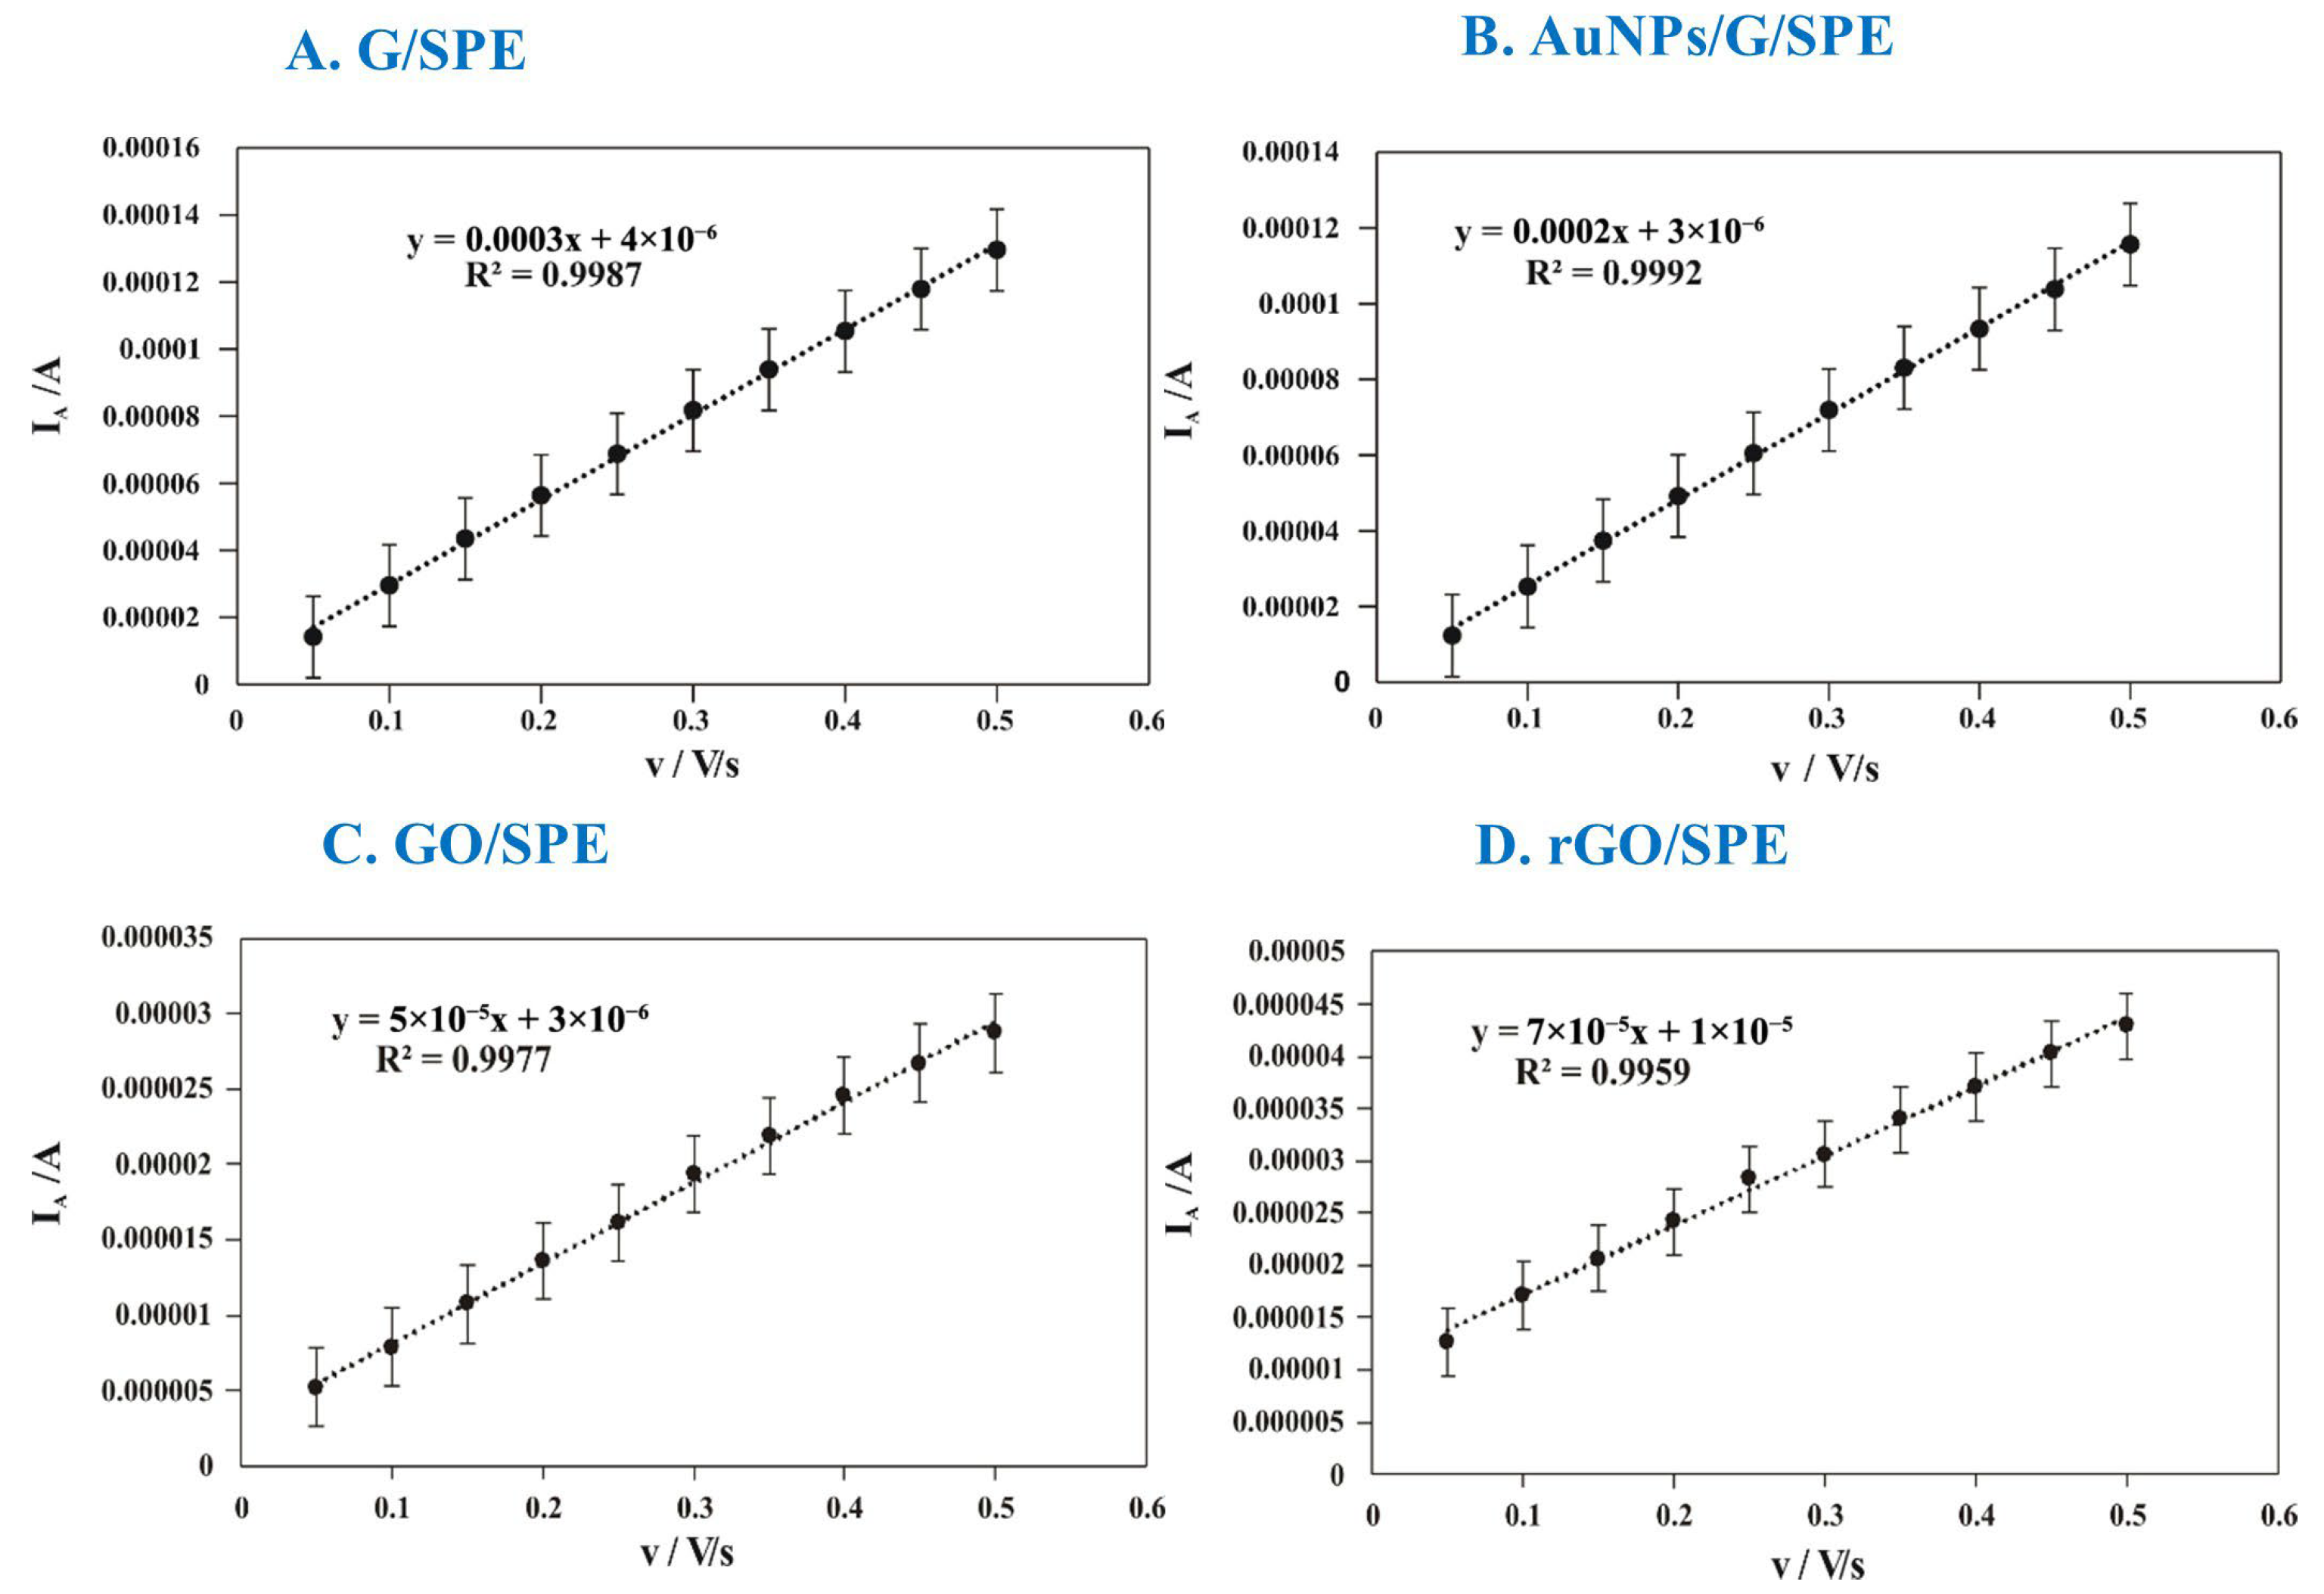
In the kinetics studies, a linear increase in anodic current intensity was observed in conjunction with an increasing scan rate (Figure 9 and Figure 10), indicating a pronounced electrochemical response and a surface-controlled (adsorption-controlled) electrochemical process.
Figure 9.
Cyclic voltammograms of G/SPE (A), AuNPs/G/SPE (B), GO/SPE (C), and rGO/SPE (D) immersed in 1 × 10⁻⁴ M MLT solution, recorded at different scan rates (from 0.05 V/s to 0.5 V/s).
Figure 10.
Variation in the anodic current for G/SPE (A), AuNPs/G/SPE (B), GO/SPE (C), and rGO/SPE (D) as a function of scan rate.
The relatively high surface coverage achieved with G/SPE indicates an efficient accumulation of MLT molecules on the graphene-modified surface (Table 2). It reflects an efficient interaction between the graphene surface and the MLT molecules, which indicates an active electrochemical surface.
Table 2.
Surface coverage (Γ) of MLT on modified SPE sensors.
The lower Γ of the AuNPs/G/SPE potentially indicates increased adsorption of MLT on these materials’ surfaces. This result suggests that the presence of AuNPs could lead to more localized adsorption sites or a different molecular orientation of MLT, limiting overall surface coverage while potentially enhancing electron transfer efficiency [25].
GO/SPE exhibited the least surface coverage, indicating reduced adsorption of MLT on this electrode. This behavior can be attributed to the high density of oxygen-containing functional groups on GO, a feature that may restrict favorable adsorption or the molecular orientation of MLT at the electrode surface due to stronger interactions with the surrounding environment.
GO acted as an electrical insulator due to the disruption of the sp2 carbon network by oxygen-containing functional groups such as epoxy, hydroxyl, and carboxyl, which significantly reduce its electrical conductivity [26].
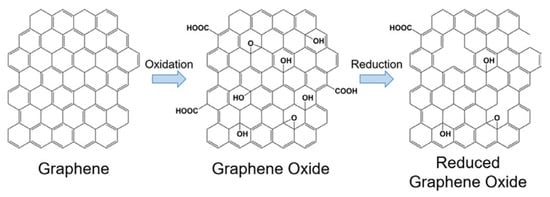
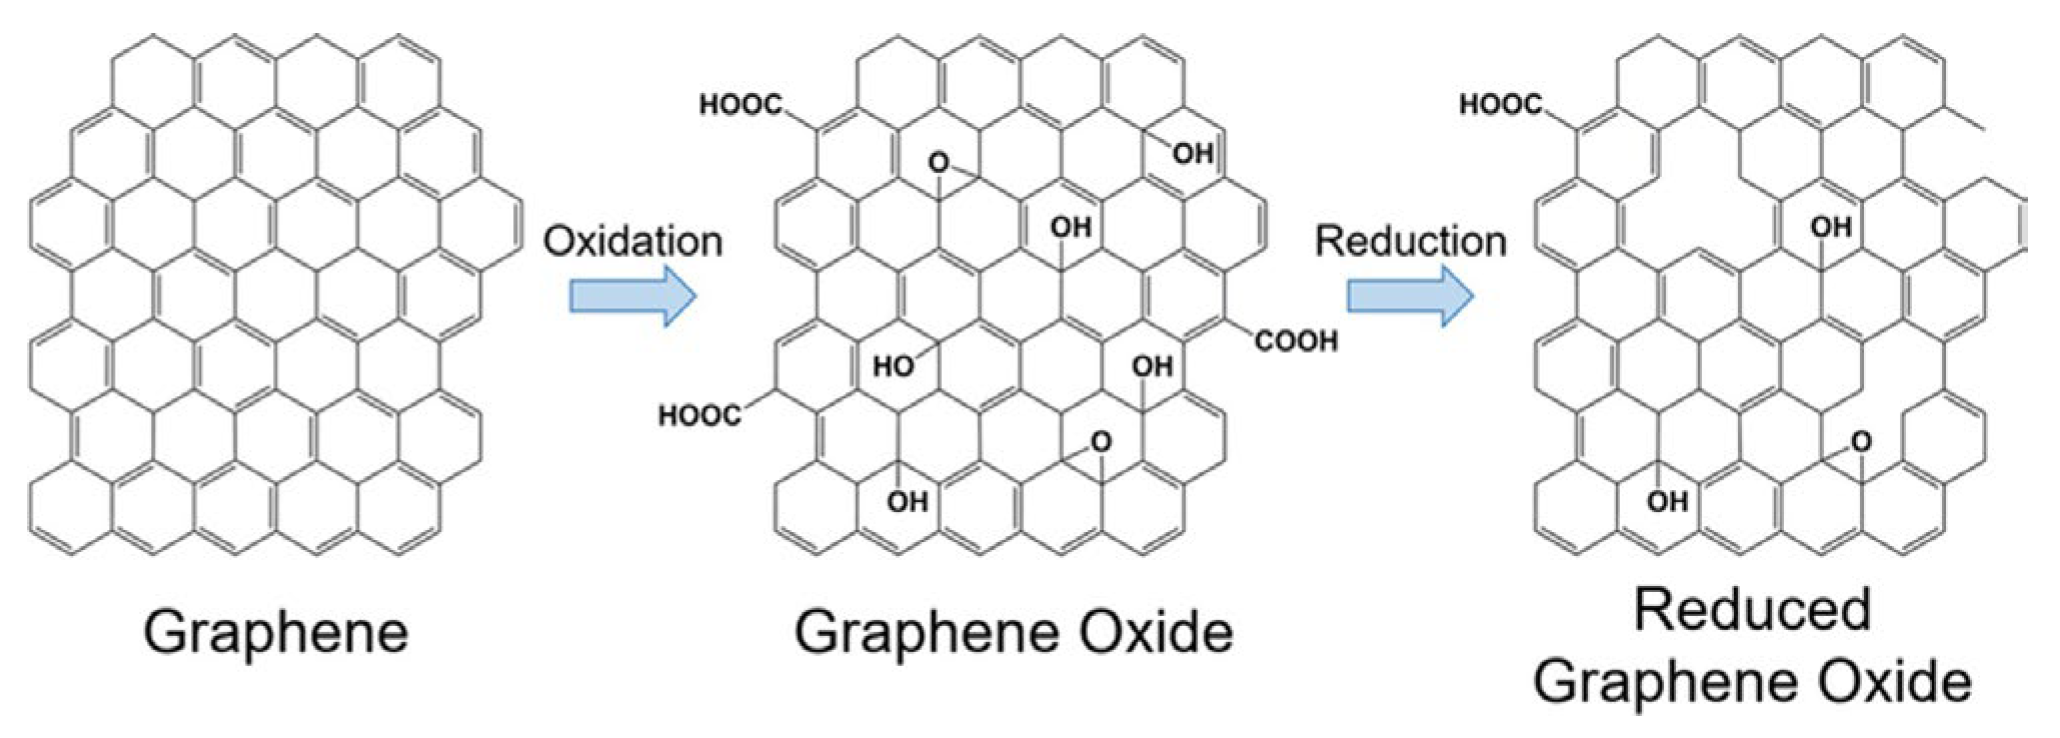
rGO/SPE exhibited an intermediate Γ value, which suggests a balance between the improved electrical conductivity of the reduced graphene oxide (Figure 11) and the lower density of functional groups compared to GO. This balance allows moderate adsorption of MLT and results in a more uniform electrochemical response [26].
Figure 11.
Partial GO reduction mechanism.
Analysis of cyclic voltammograms indicates that the sensor response is predominantly adsorption-controlled. G/SPE displayed high Γ, reflecting efficient MLT accumulation, while the AuNPs/G/SPE showed slightly lower Γ, suggesting localized adsorption and enhanced electron transfer. GO/SPE had the lowest Γ, due to abundant oxygen-containing groups and poor conductivity, limiting adsorption, whereas rGO/SPE showed intermediate Γ, balancing conductivity and functional group density, resulting in moderate adsorption and a uniform response.
3.4. Determination of Detection and Quantification Limits (Influence of MLT Concentration on Sensor Response)
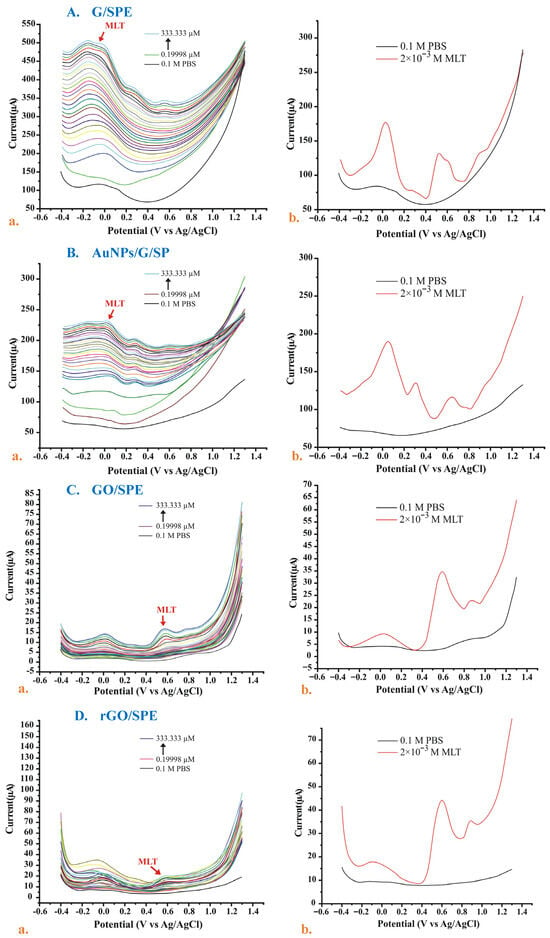
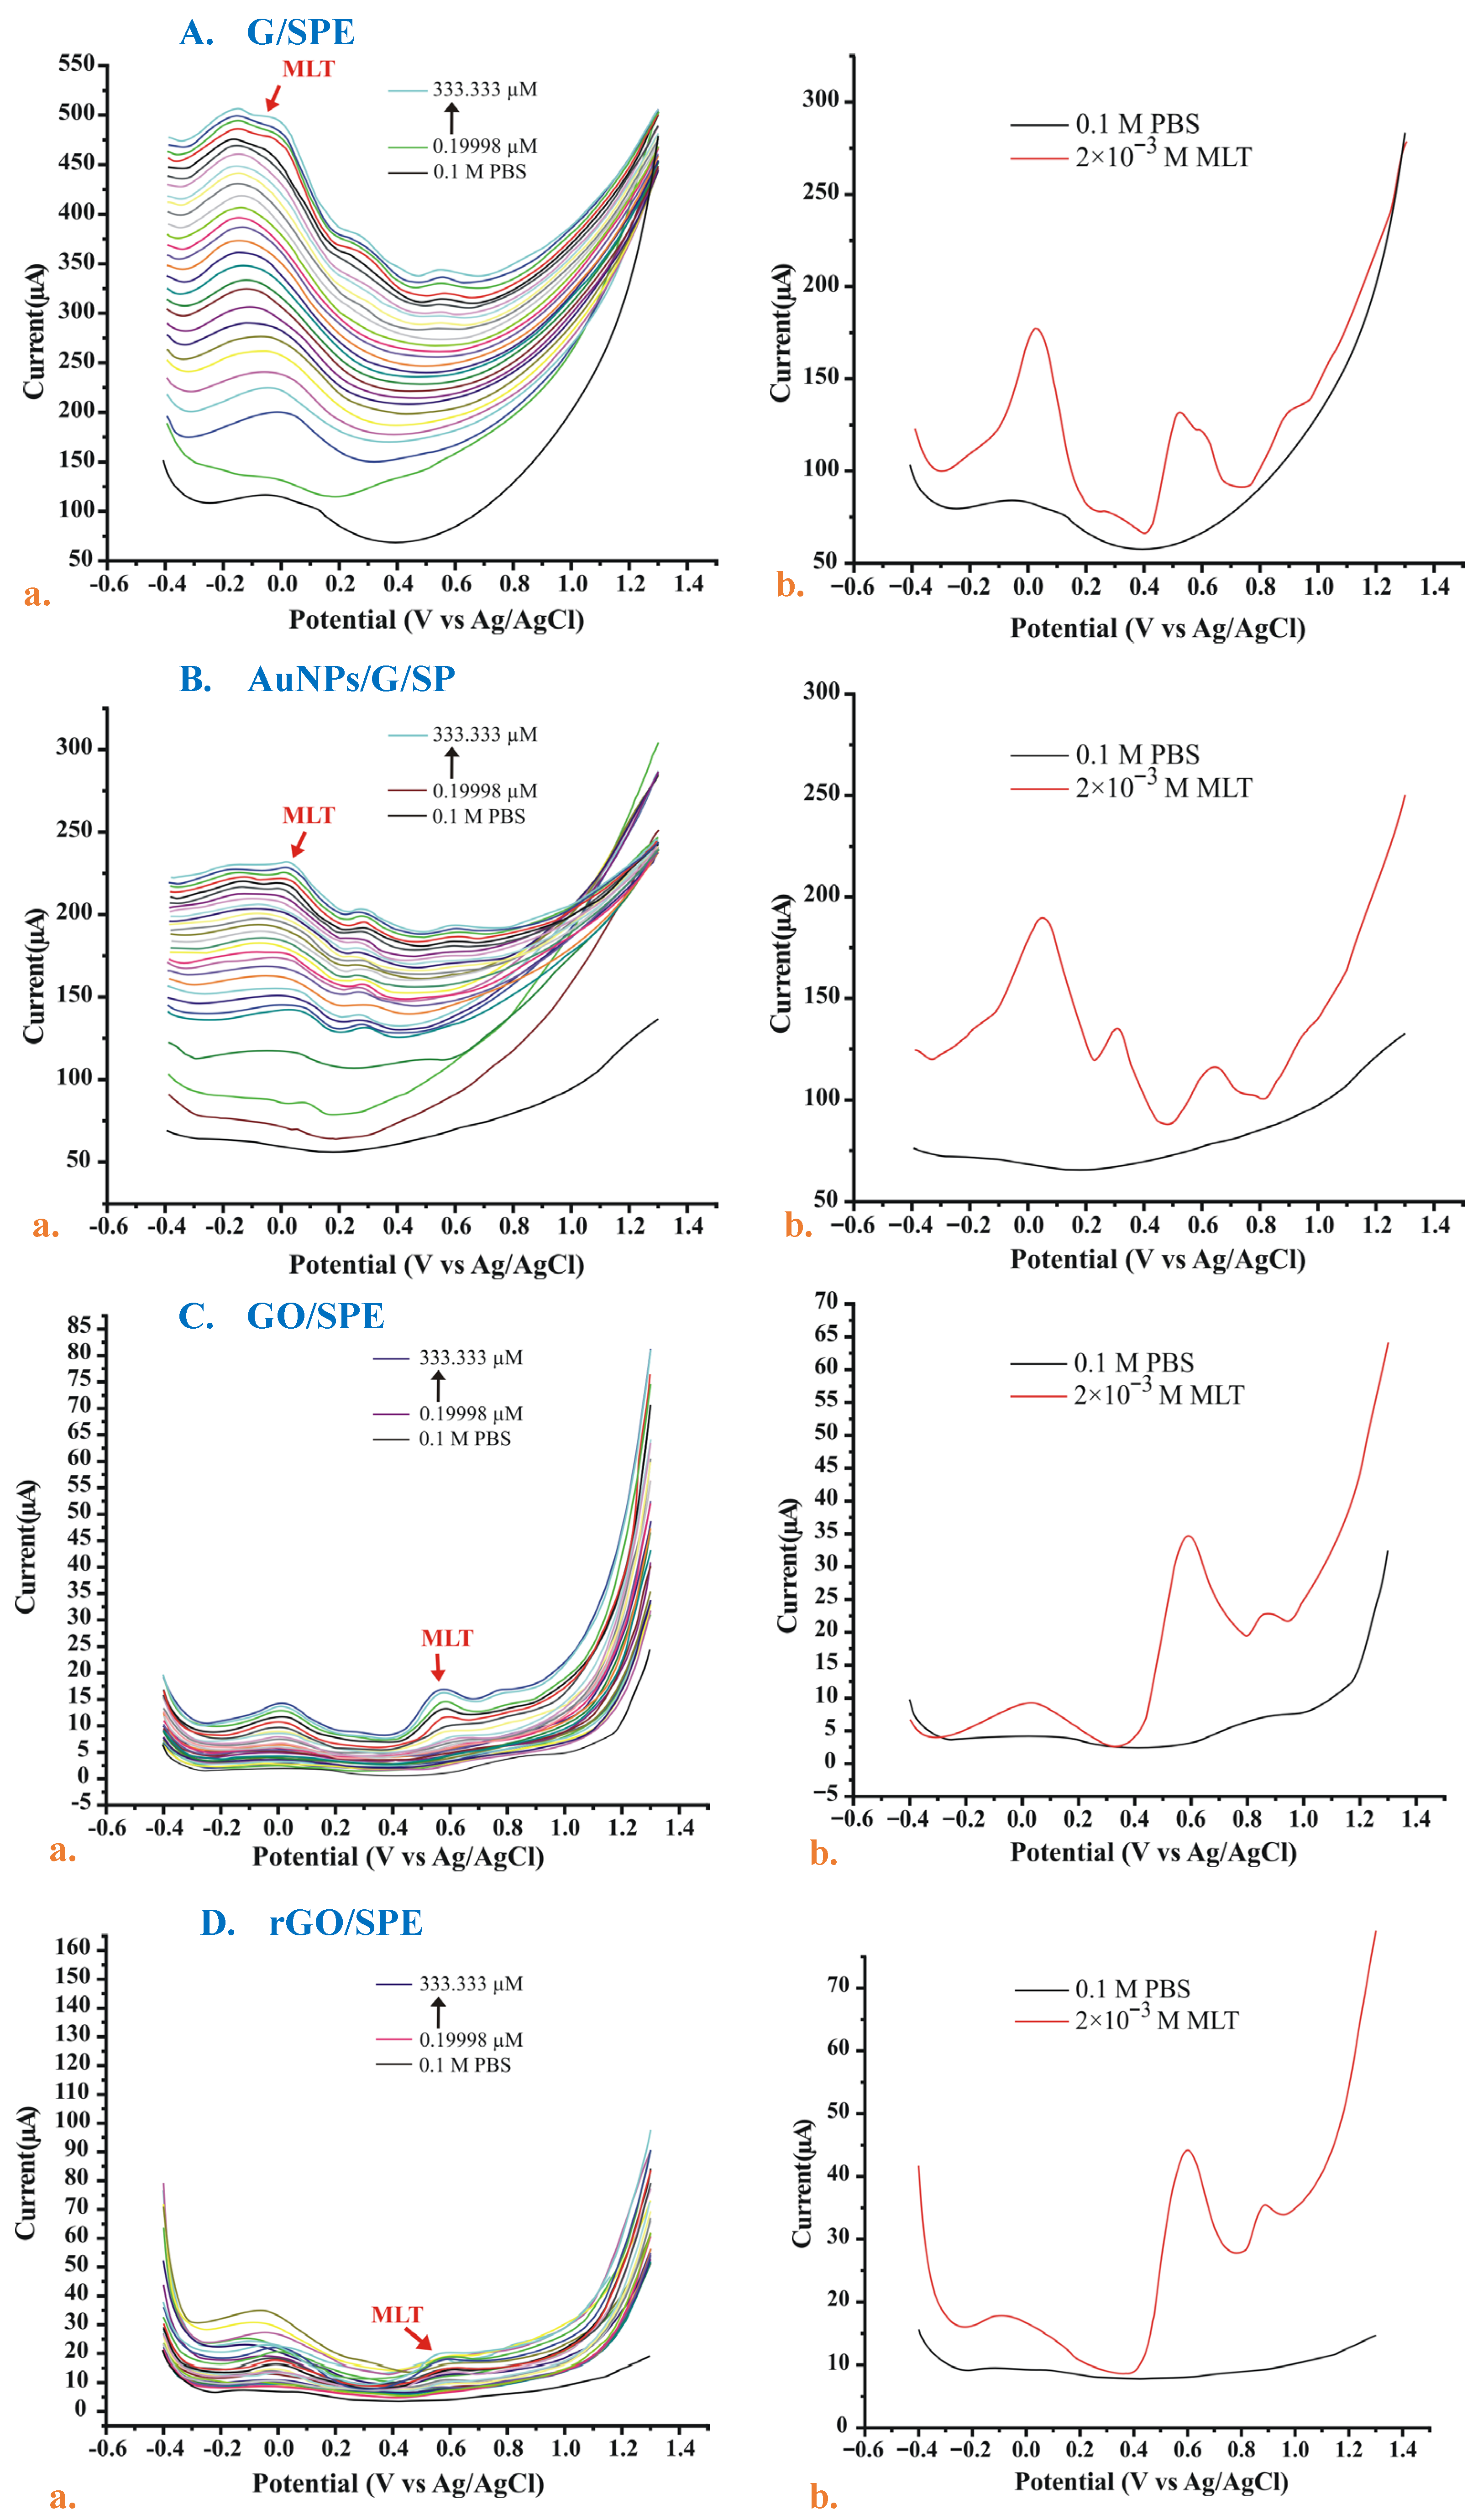
For each sensor, the LOD and LOQ were determined (Table 3) using the standard addition method. MLT concentrations ranged from 0.19998 to 333.333 μM (Figure 12 and Figure 13), and the anodic current was recorded for each concentration, showing a linear increase in current with an increasing concentration. To establish the calibration curves, the oxidation peak currents (Ia) were recorded at the specific potentials identified for each electrode: −0.029 V for G/SPE, 0.0207 V for AuNPs/G/SPE, 0.57 V for GO/SPE, and 0.58 V for rGO/SPE.
Table 3.
Sensor detection and quantification limits.
Figure 12.
Overlaid square-wave voltammograms of all sensors in MLT solutions with different concentrations (a) and overlaid square-wave voltammograms recorded in PBS and stock MLT solution (b) for G/SPE (A), AuNPs/G/SPE (B), GO/SPE (C), and rGO/SPE (D).
Figure 13.
Overlaid square-wave voltammograms of the highest MLT concentration for all sensors.
G/SPE achieved the lowest limit of detection (0.3424 μM) and limit of quantification (1.1415 μM), demonstrating the highest sensitivity toward MLT detection. This can be explained by the inherent properties of sp2-hybridized carbon, whose extended π-conjugated network facilitates rapid electron transfer at the electrode–solution interface [9].
AuNPs/G/SPE showed a higher LOD (1.2768 μM) than G/SPE, indicating a decrease in sensitivity despite the presence of gold nanoparticles, which are generally expected to enhance electrocatalytic activity. This may be due to the size and distribution of the nanoparticles on the electrode surface, which can affect their ability to improve electron transfer [27].
GO/SPE exhibited the worst performance among the four studied sensors, with an LOD of 23.1056 μM and an LOQ of 77.0185 μM. These results reflect a restricted capacity for detecting MLT at low concentration levels. This performance can be explained by the high content of oxygen-containing functional groups that interrupt the sp2 network and introduce sp3 carbon sites. This disruption breaks up the extended π-conjugated structure that normally facilitates efficient electron transfer, making GO much less conductive and slowing down electron exchange at the electrode interface [28]. In contrast, the improvement seen in the case of rGO/SPE (LOD = 5.8503 μM) validates the successful restoration of the carbon network through reduction, which partially recovers the conductivity and affinity for MLT.
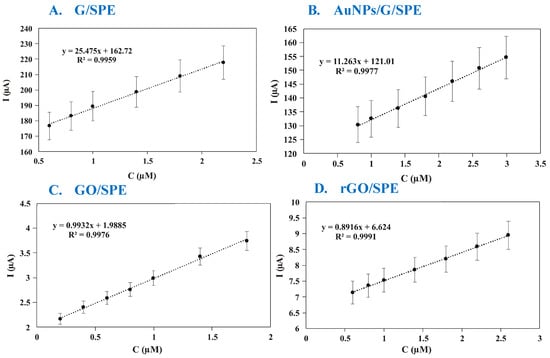
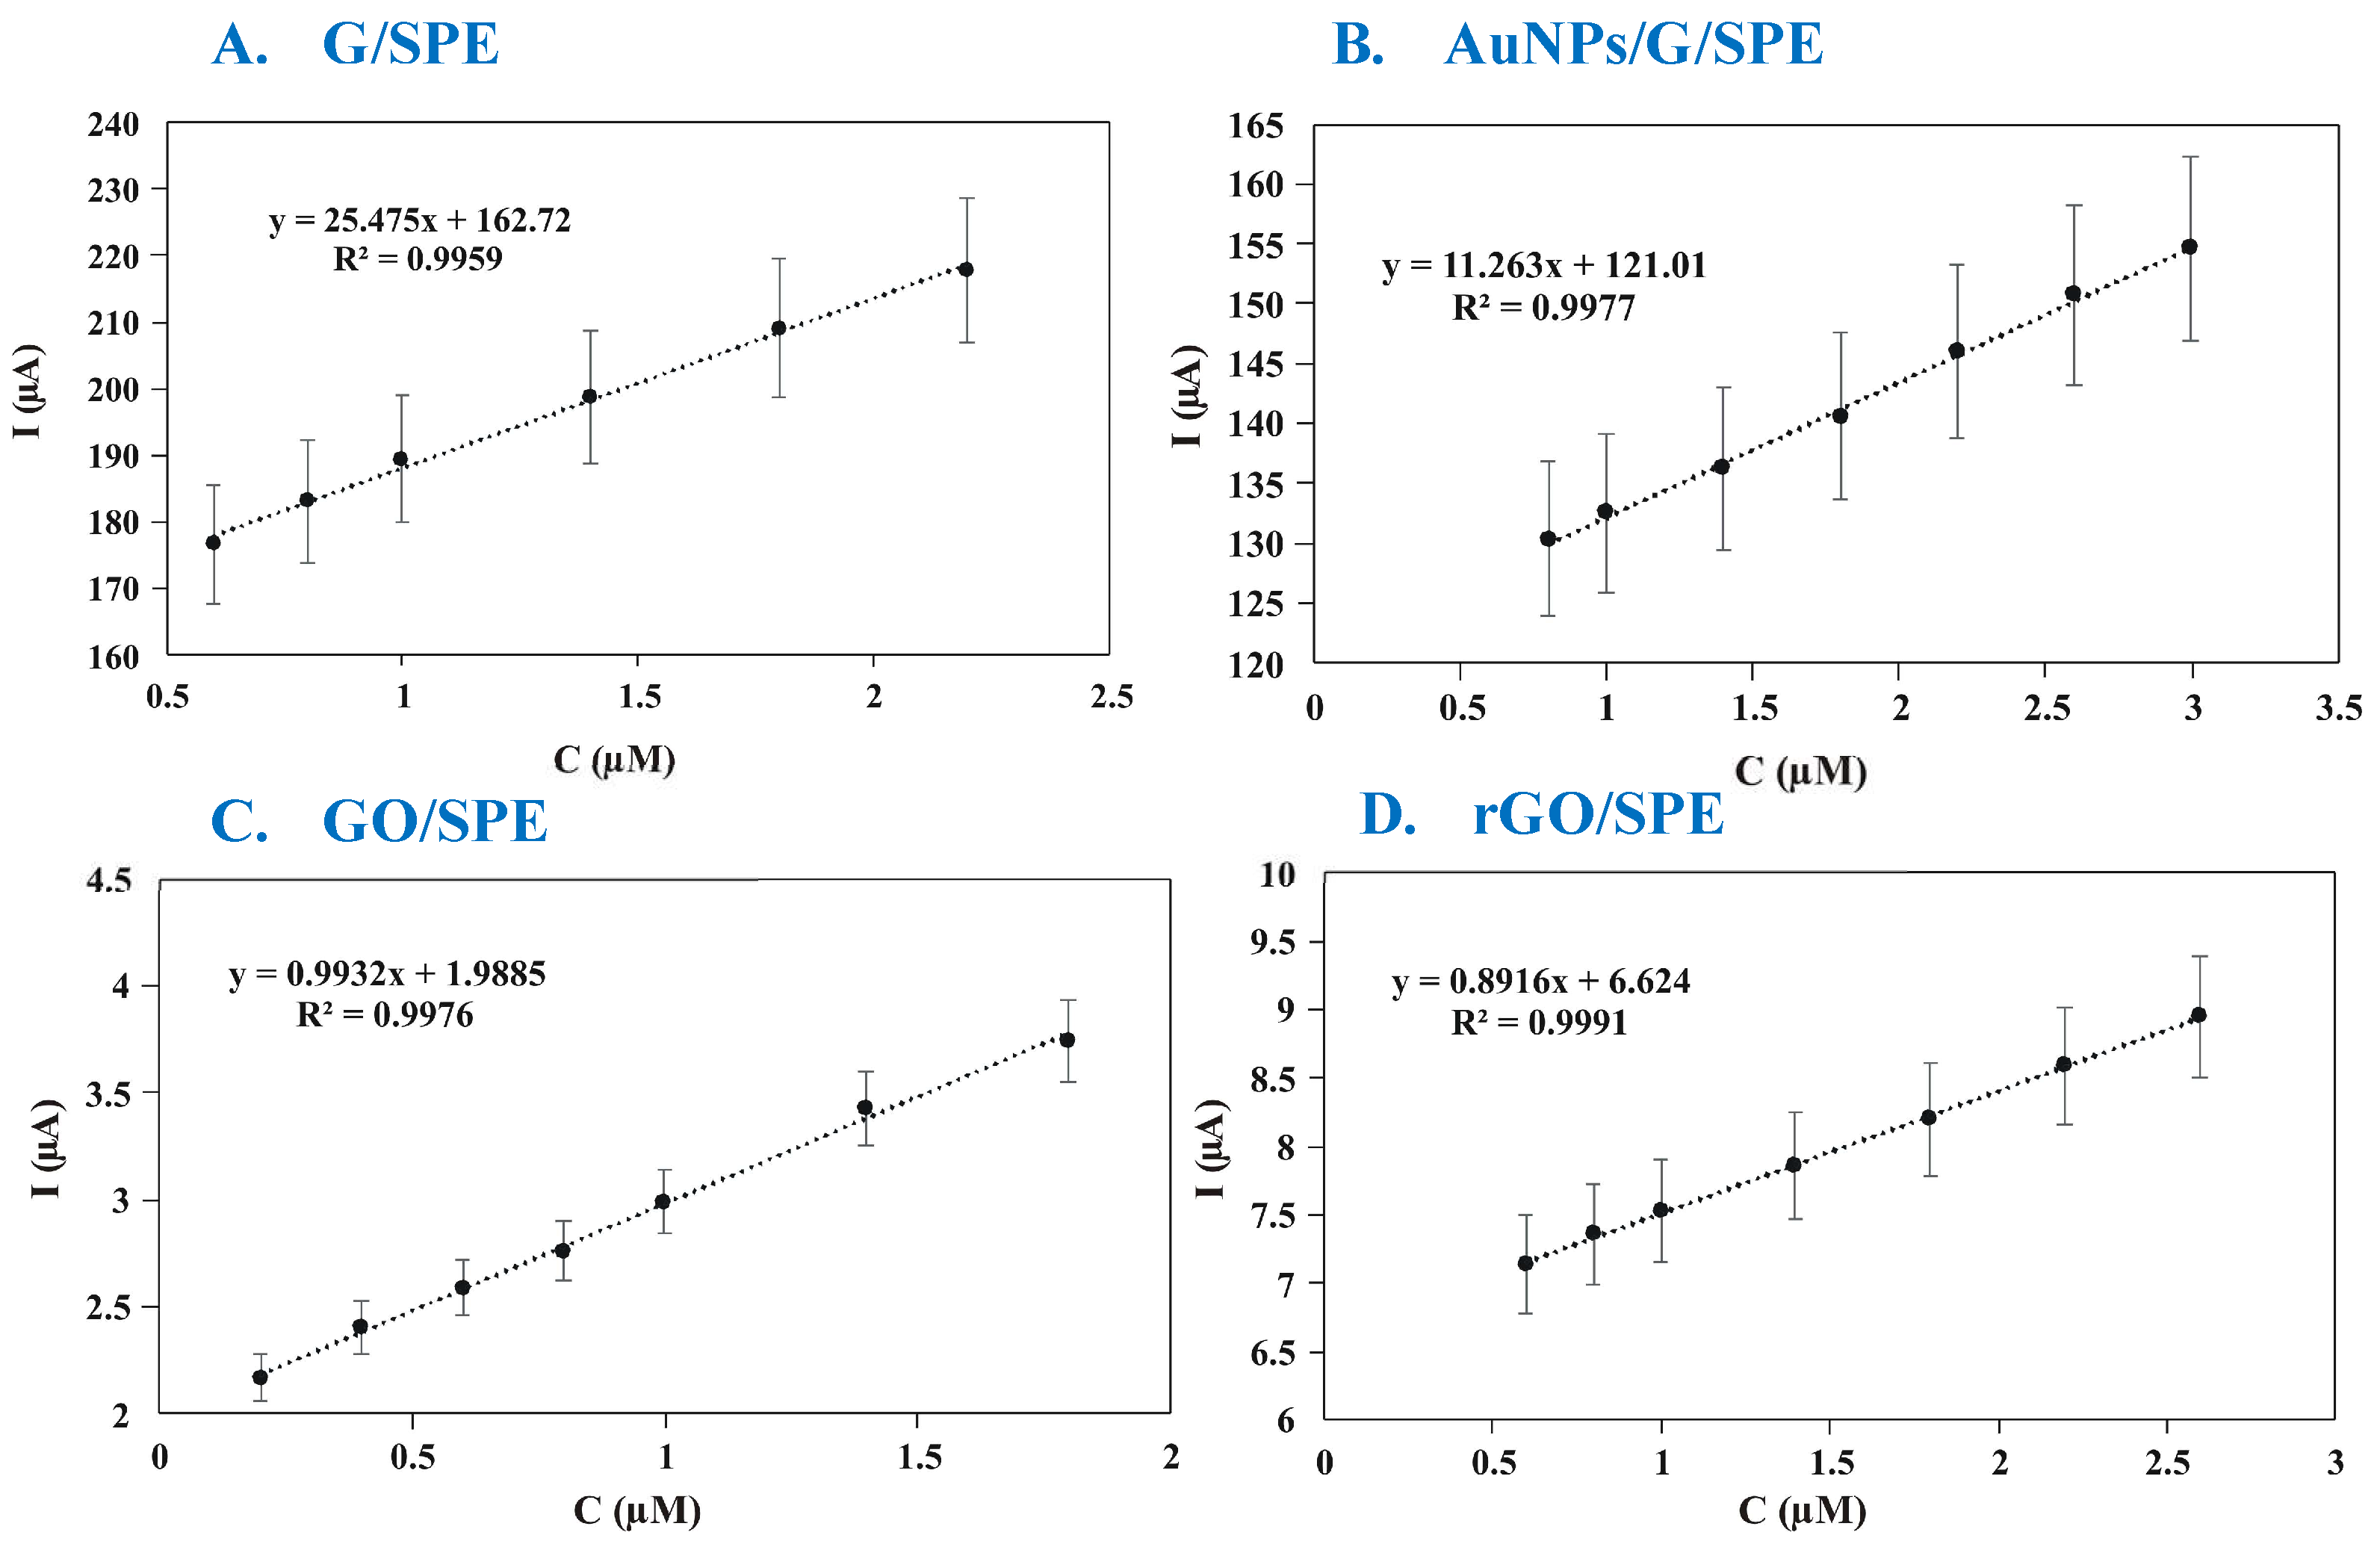
The calibration curves obtained for each sensor (Figure 14) demonstrate a linear relationship between anodic current and MLT concentration, thus allowing accurate calculation of the LOD and LOQ (Table 3).
Figure 14.
MLT calibration curve for G/SPE (A), AuNPs/G/SPE (B), GO/SPE (C), and rGO/SPE (D).
In recent years, the development of electrochemical sensors for the detection of melatonin has seen a significant increase due to the importance of this hormone in regulating the circadian rhythm and its involvement in various neurological conditions. Table 4 presents a selection of electrochemical sensors from the literature, highlighting the detection methods, the materials used to modify the electrodes, the detection limits, the support electrolytes, and the real samples analyzed.
Table 4.
Examples of electrochemical sensors for MLT detection.
3.5. Validation of Sensors Using Pharmaceutical Products
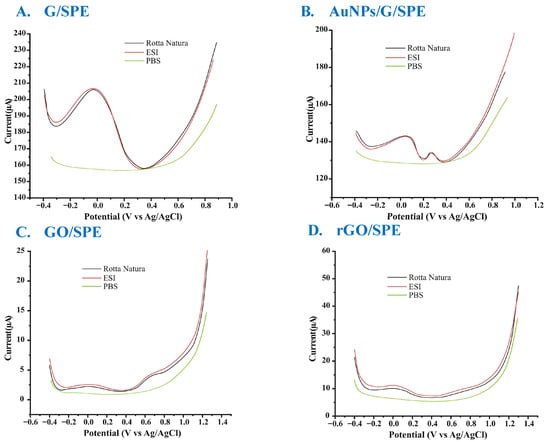
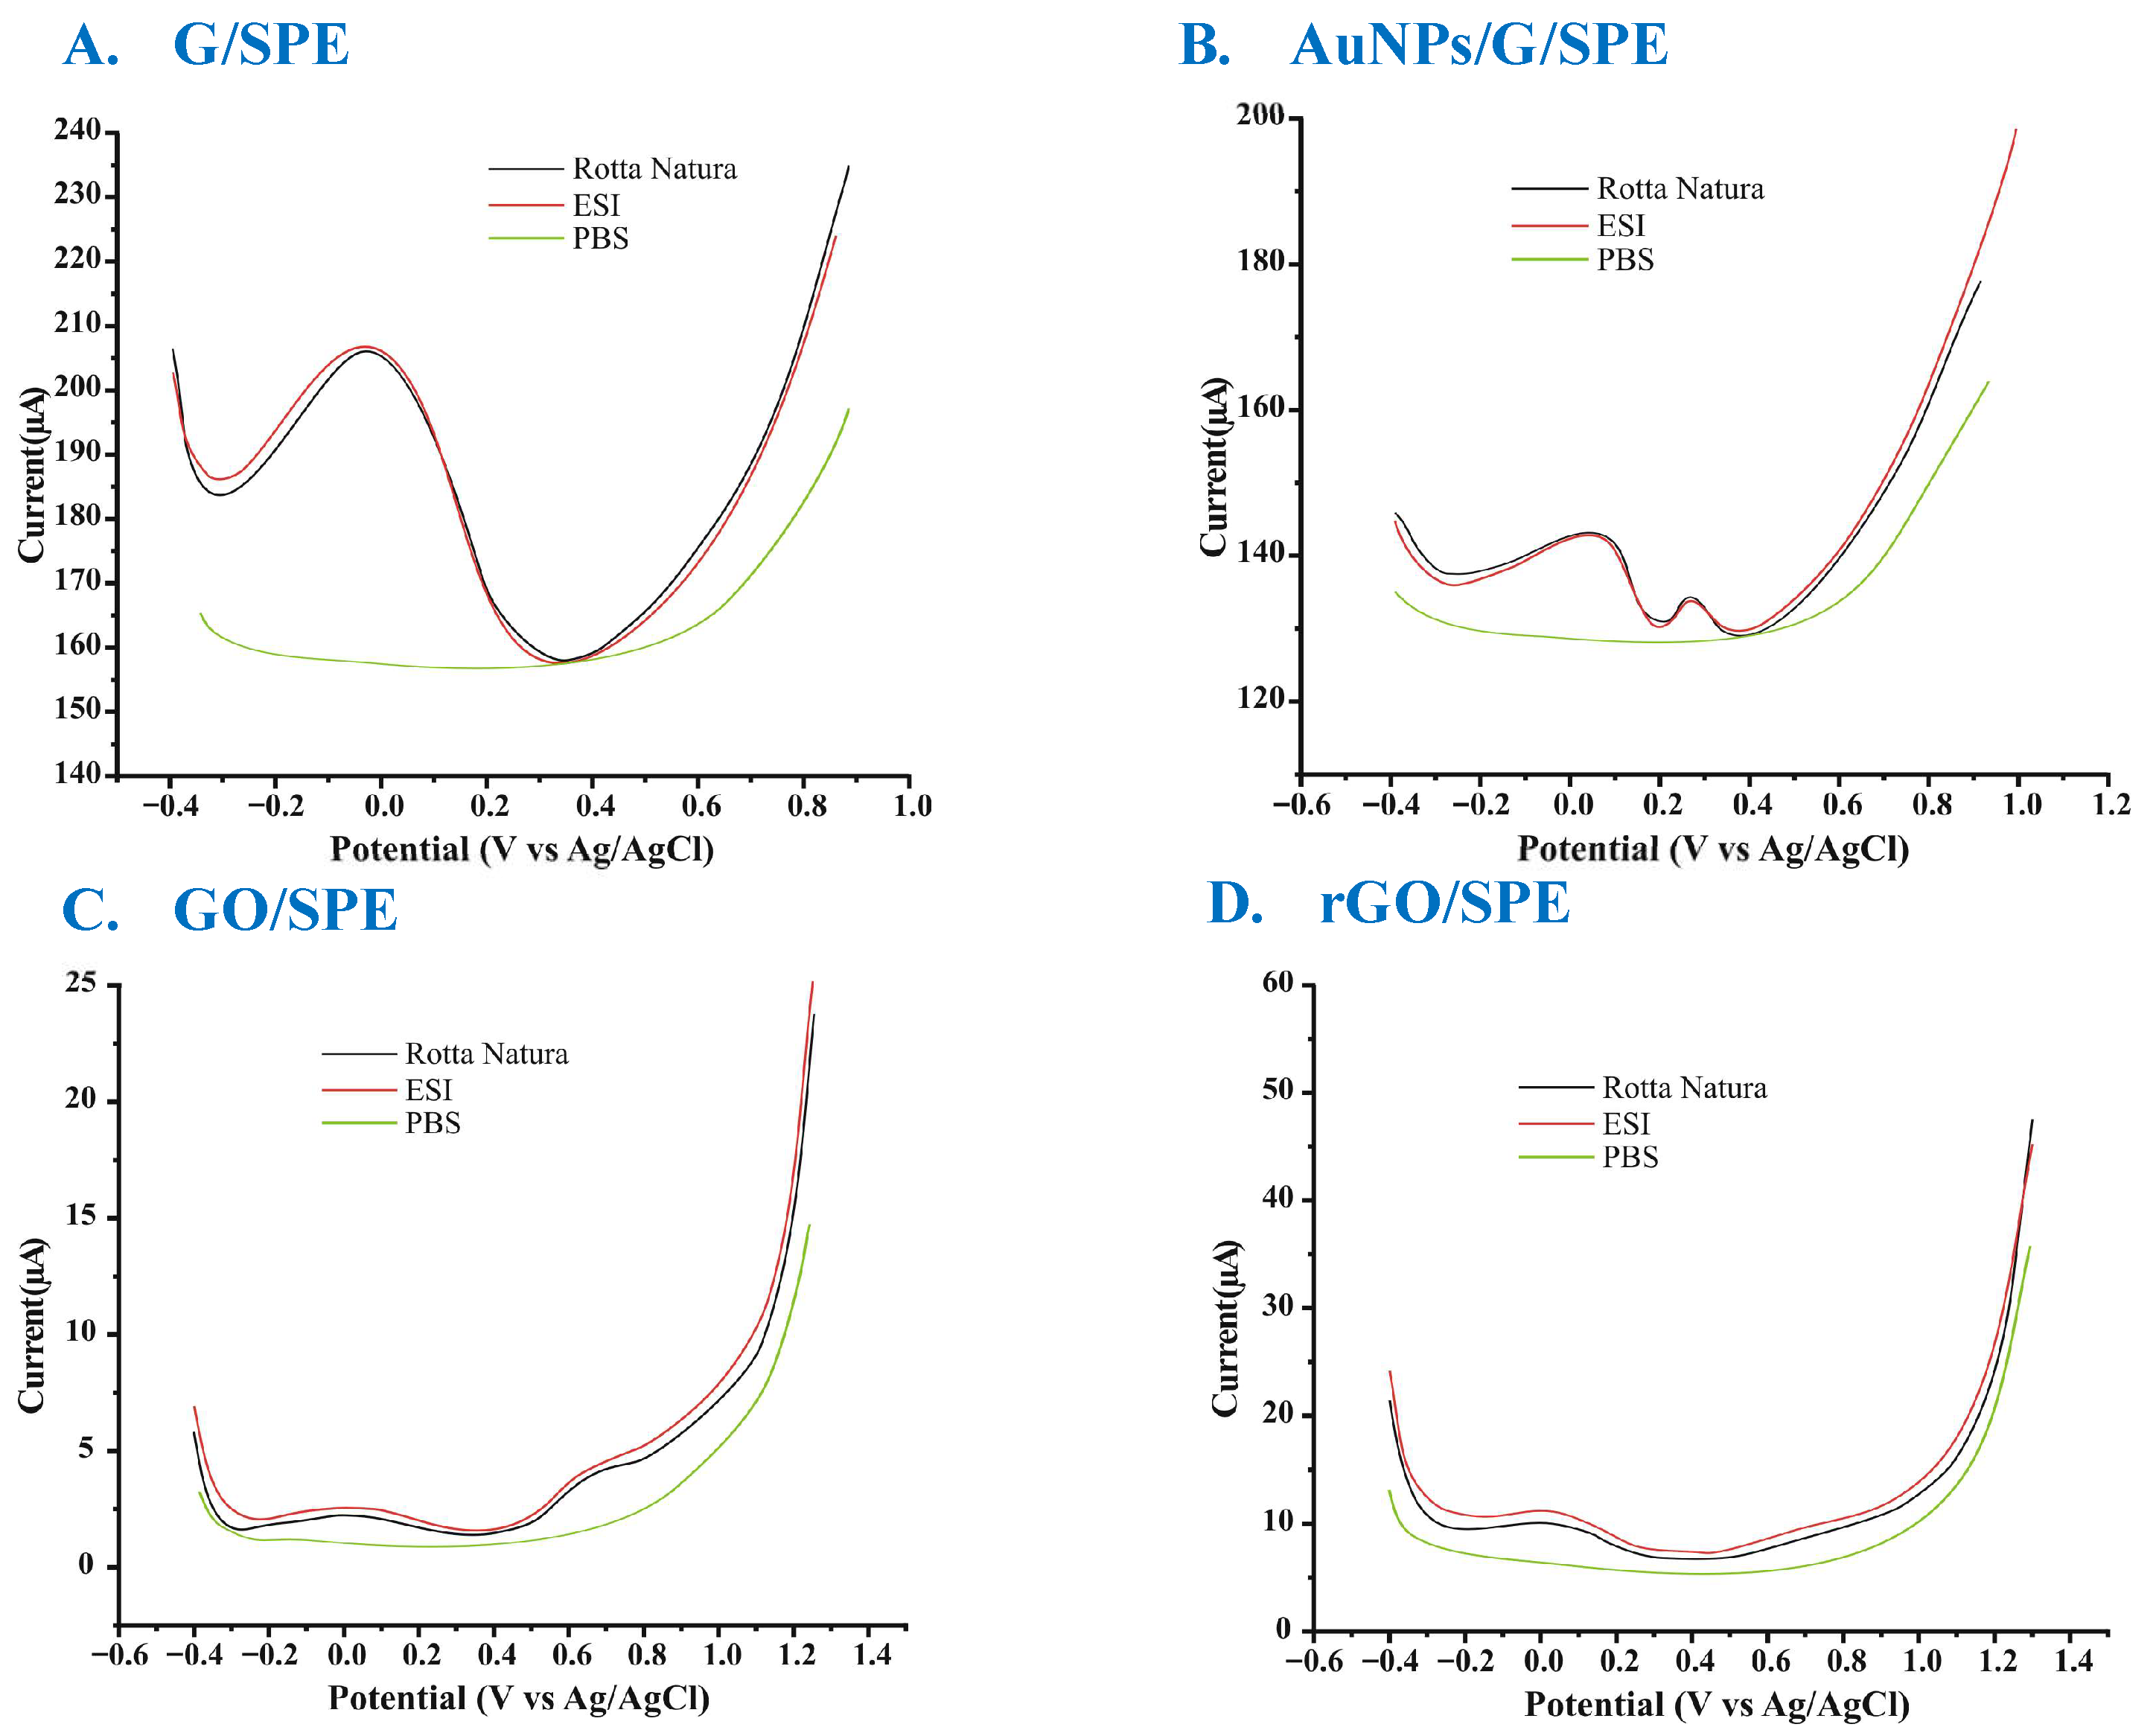
All the sensors were used for the quantification of MLT in two pharmaceutical products (Melatonina Retard (5 mg) from Rotta Natura and Melatonin Pura (5 mg) from ESI). Square-wave voltammograms recorded (Figure 15) with these sensors in the solutions prepared from the analyzed products revealed signals characteristic of the presence of MLT, similar to those obtained in standard MLT solutions.
Figure 15.
Square-wave voltammograms for pharmaceutical samples (G/SPE (A), AuNPs/G/SPE (B), GO/SPE (C), and rGO/SPE (D)).
The amounts of MLT in the two products were calculated based on the calibration equations for each sensor. In calculating the values reported in Table 5, we took into account the dilutions achieved and the quantity of pharmaceutical product used in the analysis.
Table 5.
Practical MLT concentrations obtained with the sensors.
The square-wave voltammograms of the pharmaceutical samples exhibit current responses at the same potential as that characteristic of melatonin oxidation. The measured current values are comparable to those obtained for standard solutions situated within the linear calibration range, indicating the good accuracy of the voltametric method.
3.6. Stability over Time and Repeatability of Sensor Responses
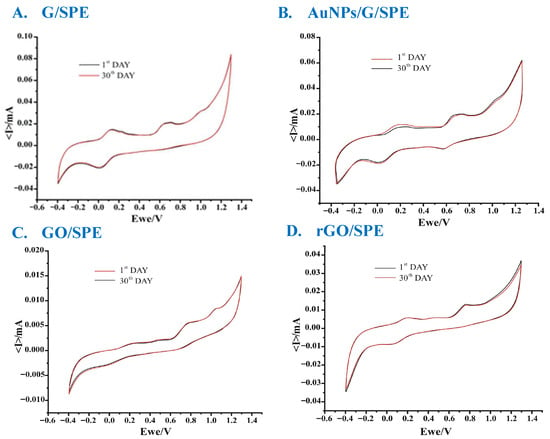
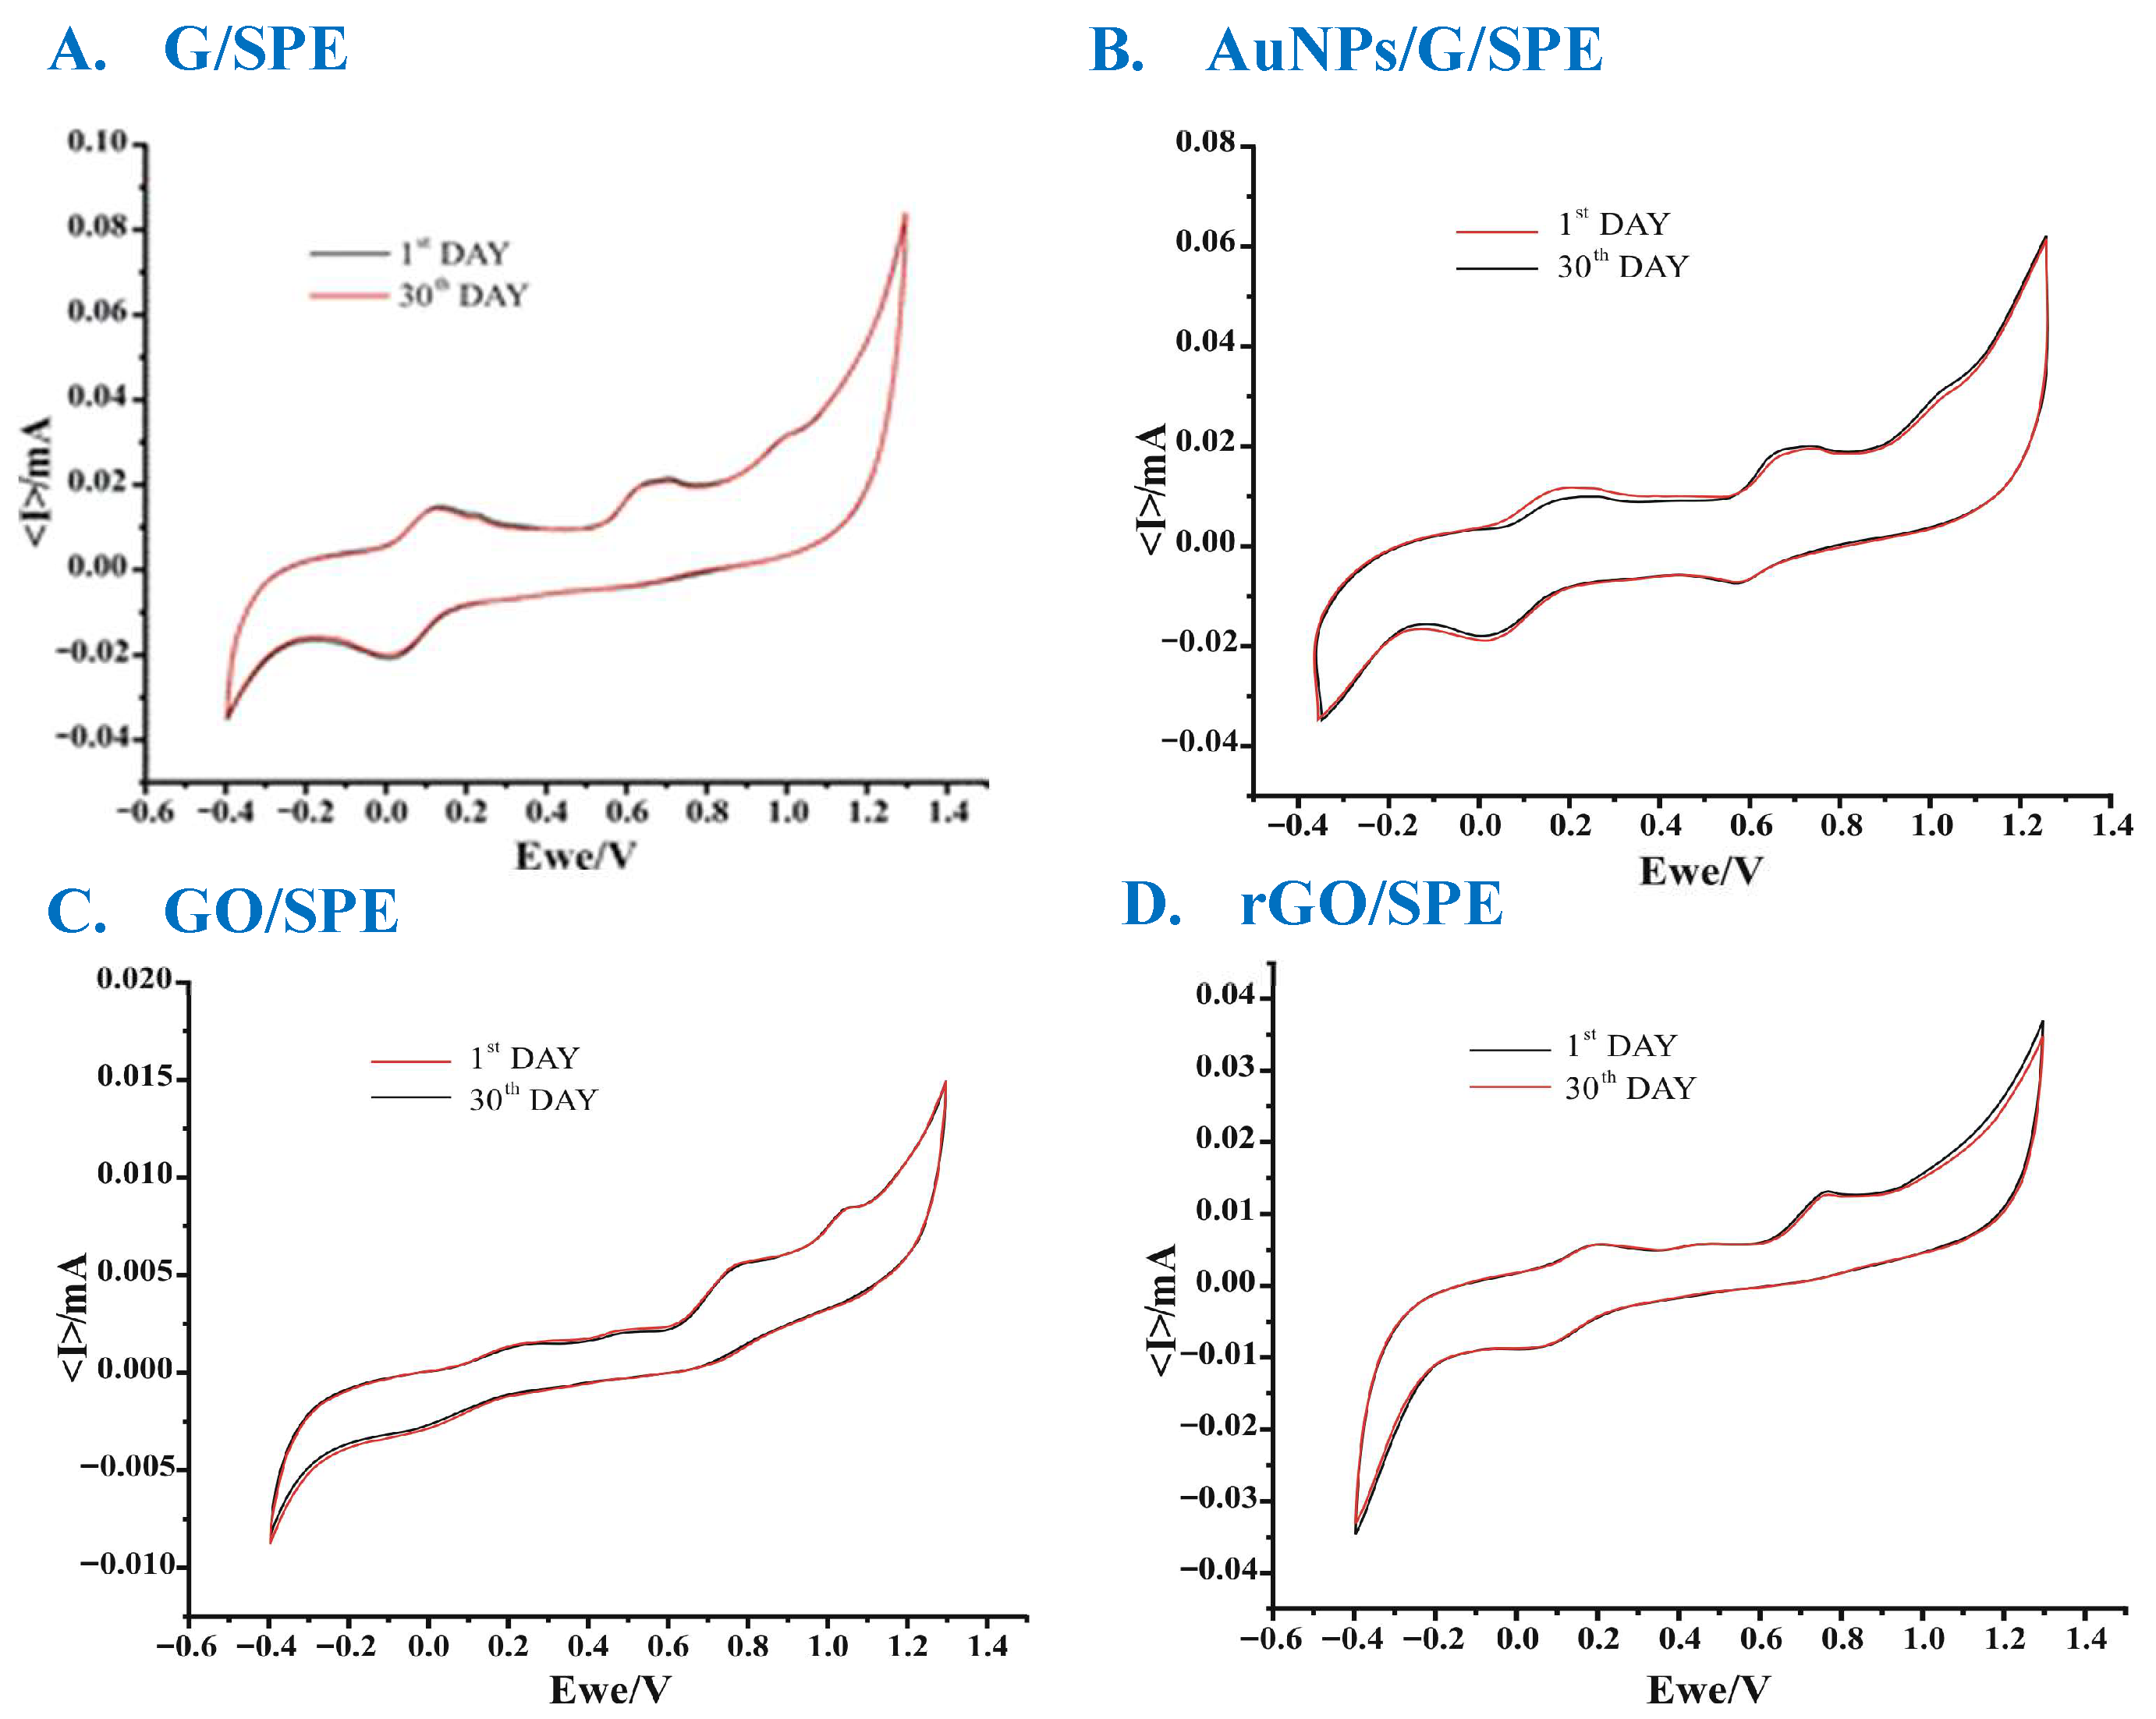
The long-term stability of the sensors was tested in MLT solution after 1 day and 30 days of being stored in the dark in a closed box at 4 °C. When comparing the cyclic voltammograms obtained on the first and 30th day, a coefficient of variation lower than 3.5% was obtained (Figure 16).
Figure 16.
Long-term stability of the sensors evaluated using cyclic voltammetry in MLT solution on the 1st and 30th day of storage (G/SPE—(A), AuNPs/G/SPE—(B), GO/SPE—(C), and rGO/SPE—(D)).
Before use, all the sensors were immersed in a standard solution of PBS buffer to evaluate repeatability. Ten cyclic voltammograms were registered, showing a variation that was less than 2% of the current values. Additionally, in the presence of MLT, only a current variation lower than 3.1% was observed (Figure 17).
Figure 17.
Repeatability of the sensors evaluated via cyclic voltammetry in MLT solution (G/SPE—(A), AuNPs/G/SPE—(B), GO/SPE—(C), and rGO/SPE—(D)). The voltammograms with different colors represent different replicate measurements.
4. Conclusions
Our comparative analysis of the four types of sensors revealed the pure graphene-based electrodes and those modified with gold nanoparticles exhibited superior electrochemical performance. They demonstrated high sensitivity and rapid electrochemical responses, making them suitable for melatonin detection. They demonstrated good long-term stability and repeatability, with only minor variations in the voltametric signals observed upon repeated use and after prolonged storage. The reduced graphene oxide sensor showed intermediate performance, reflecting a balance between restored conductivity and residual functional groups. In contrast, the graphene-oxide-based sensor showed limitations in terms of electron transfer and a smaller active surface, which reduced its efficiency. Pharmaceutical tests confirmed the reliability of the voltametric method and the accuracy of the sensors. This study highlights the relevance of the use of graphene-based nanostructured materials in the development of electrochemical sensors, providing a solid basis for further research oriented towards miniaturization, integration, and clinical applicability.
Author Contributions
Conceptualization, C.A. and A.G.T.; methodology, C.A. and A.G.T.; validation, C.A. and A.G.T.; formal analysis, A.G.T.; investigation, A.G.T.; resources, C.A.; data curation, C.A. and A.G.T.; writing—original draft preparation, A.G.T.; writing—review and editing, C.A. and A.G.T.; supervision, C.A.; project administration, C.A. and A.G.T.; funding acquisition, C.A. All authors have read and agreed to the published version of the manuscript.
Funding
This research received no external funding.
Institutional Review Board Statement
Not applicable.
Informed Consent Statement
Not applicable.
Data Availability Statement
The authors confirm that the data supporting the findings of this study are available within the article.
Conflicts of Interest
The authors declare no conflicts of interest.
Abbreviations
The following abbreviations are used in this manuscript:
| MLT | Melatonin |
| SPEs | Screen-printed electrodes |
| G | Graphene |
| AuNPs/G | Graphene modified with gold nanoparticles |
| GO | Graphene oxide |
| rGO | Reduced graphene oxide |
| LOD | Limit of detection |
| LOQ | Limit of quantification |
| PBS | Phosphate buffer solution |
| HPLC | High-performance liquid chromatography |
| ELISA | Enzyme-linked immunosorbent assay |
References
- Wang, J. Electrochemical biosensors: Towards point-of-care cancer diagnostics. Biosens. Bioelectron. 2006, 21, 1887–1892. [Google Scholar] [CrossRef] [Scilit] [PubMed]
- Kumar, N.; Weerawarna, N.E.; Alvarez, N.T. Carbon-Nanotube Microelectrodes for Electrochemical Determination of Melatonin. Electroanalysis 2024, 36, 12. [Google Scholar] [CrossRef] [Scilit] [PubMed]
- Sun, R.; Wang, H.; Zhang, H.; Li, R.; Zhang, Y. Solubility measurement, solubility behavior analysis and thermodynamic modelling of melatonin in twelve pure solvents from 278.15 K to 323.15 K. J. Mol. Liq. 2020, 319, 114139. [Google Scholar] [CrossRef] [Scilit]
- Kamfar, W.W.; Khraiwesh, H.M.; Ibrahim, M.O.; Qadhi, A.H.; Azhar, W.F.; Ghafouri, K.J.; Alhussain, M.H.; Aldairi, A.F.; AlShahrani, A.M.; Alghannam, A.F.; et al. Comprehensive Review of Melatonin as a Promising Nutritional and Nutraceutical Supplement. Heliyon 2024, 10, e24266. [Google Scholar] [CrossRef] [Scilit]
- Goheer, A.; Cespedes, E.M.; Brown, M.A.; Jones, A. What influences the ‘when’ of eating and sleeping? A qualitative interview study. Appetite 2021, 156, 104980. [Google Scholar] [CrossRef] [Scilit]
- Domingos, A.L.G.; Hermsdorff, H.H.M.; Bressan, J. Melatonin intake and potential chronobiological effects on human health. Crit. Rev. Food Sci. Nutr. 2017, 59, 133–140. [Google Scholar] [CrossRef] [Scilit]
- Jin, X.; Wang, J.; Li, X.; Zhang, Y.; Liu, Y. Development of an impedimetric sensor for susceptible detection of melatonin at picomolar concentrations in diverse pharmaceutical and human specimens. Environ. Res. 2023, 238, 117080. [Google Scholar] [CrossRef] [Scilit]
- Barreiro Astray, S.; Barbosa-Pereira, L.; Lage-Yusty, M.A.; López-Hernández, J. Comparison of Analytical Methods for the Rapid Determination of Melatonin in Food Supplements. Food Anal. Methods 2021, 14, 734–741. [Google Scholar] [CrossRef] [Scilit]
- Sainz-Urruela, C.; Vera-López, S.; San Andrés, M.P.; Díez-Pascual, A.M. Graphene-based sensors for the detection of bioactive compounds: A review. Int. J. Mol. Sci. 2021, 22, 3316. [Google Scholar] [CrossRef] [Scilit]
- Bagheri, H.; Afkhami, A.; Hashemi, P.; Ghanei, M. Simultaneous and sensitive determination of melatonin and dopamine with Fe3O4 nanoparticle-decorated reduced graphene oxide modified electrode. RSC Adv. 2015, 5, C4RA16802J. [Google Scholar] [CrossRef] [Scilit]
- Khan, Z.A.; Hong, P.J.; Lee, C.H.; Hong, Y. Recent advances in electrochemical and optical sensors for detecting tryptophan and melatonin. Int. J. Nanomed. 2021, 16, 6861–6888. [Google Scholar] [CrossRef] [Scilit]
- Hasan, H.; Hathama, H.; Zainulabdeen, J. Screening, Extraction, and Quantification of Melatonin in Waste of Some Plants. Iraqi J. Sci. 2022, 63, 1874–1884. [Google Scholar] [CrossRef] [Scilit]
- Scientific Committee on Consumer Safety (SCCS). Opinion on Melatonin (SCCS/1315/10); European Commission: Brussels, Belgium, 2010. [Google Scholar]
- Girgin, B.; Korkmaz, O.; Yavaşer, R.; Karagozler, A. Production and drug release assessment of melatonin-loaded alginate/gum arabic beads. J. Turk. Chem. Soc. Sect. A Chem. 2016, 3, 205–216. [Google Scholar] [CrossRef] [Scilit]
- Barrera Quiroz, R.A.; Ernandes Santyago, A.A.; Zenteno Mateo, B.; Gonzalez Fuentes, M.A.; Mendez Albores, A.; Mendez Albores, E. Comparison of melatonin photodegradation between sunlight and UV irradiation. Russ. J. Biol. Phys. Chem. 2023, 3, 337–341. [Google Scholar] [CrossRef] [Scilit]
- Totu, E.; Cristache, C.; Totu, R.; Dumitru, F.; Totu, T. A Card Double Face: Compounds Functionality and Synergy of a Topical Treatment Proposed for Oral Health Improvement in Periodontal Disease. Rev. Chim. 2019, 70, 1551–1557. [Google Scholar] [CrossRef] [Scilit]
- Gunasekaran, S.; Balaji, R.; Kumaresan, S.; Anand, G. Experimental and theoretical investigations of spectroscopic properties of N-acetyl-5-methoxytryptamine. Can. J. Anal. Sci. Spectrosc. 2008, 53, 149–162. [Google Scholar]
- Bertana, V.; Scordo, G.; Parmeggiani, M.; Scaltrito, L.; Ferrero, S.; Gomez, M.G.; Cocuzza, M.; Vurro, D.; D’Angelo, P.; Iannotta, S.; et al. Rapid prototyping of 3D Organic Electrochemical Transistors by composite photocurable resin. Sci. Rep. 2020, 10, 13335. [Google Scholar] [CrossRef] [Scilit]
- Yao, S.; Liu, X.; Fu, Y.; Guan, S.; Liu, Y.; Yan, L.; He, P.; Liu, G. A rapid method to measure melatonin in biological fluids (milk and serum) with liquid chromatography–tandem mass spectrometry. Food Chem. 2023, 404, 134606. [Google Scholar] [CrossRef] [Scilit]
- Filali, S.; Bergamelli, C.; Lamine Tall, M.; Salmon, D.; Laleye, D.; Dhelens, C.; Diouf, E.; Pivot, C.; Pirot, F. Formulation, stability testing, and analytical characterization of melatonin-based preparation for clinical trial. J. Pharm. Anal. 2017, 7, 237–243. [Google Scholar] [CrossRef] [Scilit]
- Apetrei, I.M.; Apetrei, C. Voltammetric determination of melatonin using a graphene-based sensor in pharmaceutical products. Int. J. Nanomed. 2016, 11, 1859–1866. [Google Scholar] [CrossRef] [Scilit]
- Ma, Z.; Overbury, S.H.; Dai, S. Gold Nanoparticles as Chemical Catalysts. In Encyclopedia of Inorganic Chemistry; King, R.B., Crabtree, R.H., Lukehart, C.M., Atwood, D.A., Scott, R.A., Eds.; Wiley: Hoboken, NJ, USA, 2009. [Google Scholar] [CrossRef] [Scilit]
- Ravi, A.; Mohanta, Z.; Kumar, M.K.; Punith, S.; Santosh, M.; Srivastava, C. Enhanced heterogeneous electron transfer kinetics in graphene oxide produced from mechanically milled graphite. Carbon Trends 2021, 5, 100095. [Google Scholar] [CrossRef] [Scilit]
- Noh, W.; Go, Y.; An, H. Reduced graphene oxide/polyelectrolyte multilayers for fast resistive humidity sensing. Sensors 2023, 23, 1977. [Google Scholar] [CrossRef] [Scilit] [PubMed]
- Pimpilova, M. A brief review on methods and materials for electrode modification: Electroanalytical applications towards biologically relevant compounds. Discov. Electrochem. 2024, 1, 12. [Google Scholar] [CrossRef] [Scilit]
- Trikkaliotis, D.G.; Christoforidis, A.K.; Mitropoulos, A.C.; Kyzas, G.Z. Graphene Oxide Synthesis, Properties and Characterization Techniques: A Comprehensive Review. ChemEngineering 2021, 5, 64. [Google Scholar] [CrossRef] [Scilit]
- Lete, C.; López-Iglesias, D.; García-Guzmán, J.J.; Leau, S.-A.; Stanciu, A.E.; Marin, M.; Palacios-Santander, J.M.; Lupu, S.; Cubillana-Aguilera, L. A Sensitive Electrochemical Sensor Based on Sonogel-Carbon Material Enriched with Gold Nanoparticles for Melatonin Determination. Sensors 2022, 22, 120. [Google Scholar] [CrossRef] [Scilit]
- Zhao, J.; Liu, L.; Li, F. Graphene Oxide: Physics and Applications; SpringerBriefs in Physics: Berlin/Heidelberg, Germany; Springer: Berlin/Heidelberg, Germany, 2015; pp. 15–56. [Google Scholar]
- Hensley, A.L.; Colley, A.R.; Ross, A.E. Real-time detection of melatonin using fast-scan cyclic voltammetry. Anal. Chem. 2018, 90, 8642–8650. [Google Scholar] [CrossRef] [Scilit]
- Topçu, E.; Dağcı Kıranşan, K. Electrochemical simultaneous sensing of melatonin and ascorbic acid at a novel flexible B-RGO composite paper electrode. Diam. Relat. Mater. 2020, 105, 107811. [Google Scholar] [CrossRef] [Scilit]
- Tavakkoli, N.; Soltani, N.; Shahdost-fard, F.; Shahlaei, M. Simultaneous voltammetric sensing of acetaminophen, epinephrine and melatonin using a carbon paste electrode modified with zinc ferrite nanoparticles. Microchim. Acta 2018, 185, 479. [Google Scholar] [CrossRef] [Scilit]
- Satianram, W.; Sunon, P.; Ngokpho, B.; Nijpanich, S.; Chanlek, N.; Khotavivattana, T.; Batchelor-McAuley, C.; Ngamchuea, K. Electrochemical detection of melatonin at nano-sized highly boron-doped diamond electrode. J. Electrochem. Soc. 2024, 171, 087504. [Google Scholar] [CrossRef] [Scilit]
- Martínez-Moro, R.; Del Pozo, M.; Vázquez, L.; Martín-Gago, J.A.; Petit-Domínguez, M.D.; Casero, E.; Quintana, C. Electrochemical sensor based on the synergy between Cucurbit[8]uril and 2D-MoS2 for enhanced melatonin quantification. Sci. Rep. 2023, 13, 10378. [Google Scholar] [CrossRef] [Scilit]
- Wu, X.P.; Zhang, L.; Liao, W.-R.; Duan, J.-P.; Chen, H.-Q.; Chen, G.-N. Study on the electrochemical behavior of melatonin with an activated electrode. Electroanalysis 2002, 14, 1654–1660. [Google Scholar] [CrossRef] [Scilit]

Disclaimer/Publisher’s Note: The statements, opinions and data contained in all publications are solely those of the individual author(s) and contributor(s) and not of MDPI and/or the editor(s). MDPI and/or the editor(s) disclaim responsibility for any injury to people or property resulting from any ideas, methods, instructions or products referred to in the content. |
© 2026 by the authors. Licensee MDPI, Basel, Switzerland. This article is an open access article distributed under the terms and conditions of the Creative Commons Attribution (CC BY) license.