


Abstract
Management of maxillomandibular transverse discrepancy (MTD) is essential for achieving stable, functional, and esthetic occlusion. This study aimed to evaluate the maxillomandibular transverse dimensions and discrepancies in relation to vertical skeletal patterns using digital dental casts and cone-beam computed tomography (CBCT) images. A total of 180 untreated adult subjects were classified into three vertical groups based on the SN-MP angle: hypodivergent (<27°), normovergent (27–37°), and hyperdivergent (>37°), with 60 subjects in each group. Dental arch widths using casts (DAWs-Casts) were measured at the canine, first premolar, first molar, and second molar, while basal arch widths using casts (BAWs-Casts) were measured at the mucogingival junction apical to the corresponding cusp tips. CBCT images were used to measure basal arch widths (BAWs-CBCT) at the estimated centers of resistance (CRes). DAW-Cast, BAW-Cast, and BAW-CBCT measurements were affected by vertical skeletal patterns. Therefore, maxillomandibular dimensions and discrepancies vary according to vertical skeletal pattern, underscoring the need for careful evaluation when planning treatment protocols for patients with MTD.
1. Introduction
The identification and treatment of transverse maxillary deficiencies are essential for ensuring long-term orthodontic stability, maintaining optimal periodontal health, and achieving harmonious facial esthetics [1,2]. While sagittal and vertical dimensions often receive primary attention in orthodontic evaluations, it is imperative to recognize that all three spatial planes—sagittal, vertical, and transverse—play a critical role in comprehensive diagnosis and effective treatment planning.
Facial morphology has been shown to correlate significantly with dental arch dimensions, with individuals exhibiting hypodivergent facial patterns typically demonstrating greater posterior arch widths than those with hyperdivergent patterns. In low-angle subjects, increased masticatory forces generated by heightened temporalis and masseter muscle activity promote bone deposition within the basal arch, resulting in wider maxillary transverse dimensions. These individuals characteristically present with reduced anterior facial height and more lingually inclined molars. Conversely, as the mandibular plane angle increases, compensatory changes occur within the dentition and alveolar process, frequently accompanied by maxillary transverse constriction and mandibular backward rotation, which pose significant orthodontic challenges. Dental compensations—including lingual tipping of mandibular molars, buccal flaring of maxillary molars, tooth size discrepancies, and crowding—may partially mask underlying skeletal transverse deficiencies and maxillomandibular disharmony. With increasing vertical facial divergence, anterior facial height typically increases and is often associated with buccal molar inclination; according to the tongue pressure theory, lateral forces exerted by the tongue on the posterior dentition may contribute to molar uprighting, thereby partially compensating for the transverse skeletal deficiency commonly observed in hyperdivergent individuals [3,4,5,6].
To assess the transverse dimension, four principal diagnostic modalities are commonly employed. Among them, the posteroanterior (PA) cephalogram is a key tool for evaluating skeletal relationships. The PA cephalogram allows for the identification of transverse skeletal discrepancies by analyzing specific craniofacial landmarks—namely, the right and left jugale points on the maxilla (JR and JL) and the right and left antegonion points on the mandible (AR and AL). Utilizing the Rocky Mountain Analysis by Ricketts, the transverse distance between these bilateral landmarks can be measured to quantify skeletal discrepancies. These measurements are instrumental in determining the severity of transverse deficiencies and guiding the appropriate intervention, whether orthodontic, orthopedic, or surgically assisted expansion [7,8,9].
However, the effectiveness of this method is constrained by challenges in accurately identifying anatomical landmarks, primarily due to the superimposition of craniofacial structures and variability in head positioning. These factors reduce landmark clarity and increase the potential for measurement error [10]. As an alternative, dental casts—derived from either conventional impressions or digital intraoral scans—allow for the assessment of intercanine and intermolar widths. These measurements are often evaluated using Andrews’ 6 keys to normal occlusion as a reference for static occlusal relationships [11]. While dental casts are valuable for quantifying arch width, they do not provide insight into root angulation or alveolar bone position, thereby limiting their utility for diagnosing true transverse skeletal discrepancies [12].
The advent of cone-beam computed tomography (CBCT) has markedly enhanced diagnostic precision by enabling detailed evaluation of buccolingual molar inclination and the transverse dimensions of maxillary and mandibular alveolar bone [13]. In a CBCT-based study involving untreated individuals with a full complement of teeth, mild crowding, and no crossbite, 99% of mandibular molars were found to be lingually inclined, while 90% of maxillary molars exhibited buccal tipping [14]. These findings highlight the importance of distinguishing true skeletal constriction from dentoalveolar compensations, which may obscure underlying transverse discrepancies. In cases requiring maxillary expansion, clinicians must exercise caution to avoid iatrogenic complications such as fenestrations and dehiscence. These defects are more frequently observed in teeth with pronounced buccolingual tipping, particularly along the buccal aspect of the maxilla [15,16].
More recently, a fourth diagnostic modality has emerged, involving the measurement of dental casts at the mucogingival junction apical to the molars to approximate the center of resistance (CRes). Koo et al. compared this approach with CBCT-derived CRes measurements in Class I and Class III patients with normal vertical proportions, identifying maxillary transverse deficiencies in the Class III group [17]. Zhang et al. evaluated Andrews’ and the Yonsei’s analyses, revealing excellent reliability and diagnostic agreement [18]. However, neither analysis has been validated in individuals with varying vertical facial patterns, such as hypodivergent or hyperdivergent types. Similarly, the Yonsei analysis and a CBCT-based protocol developed at the University of Pennsylvania (UPenn) have emphasized the evaluation of the maxillary transverse discrepancies at the level of the first molars. However, these methods neglect the anterior maxilla, thereby limiting the comprehensiveness of their diagnostic scope [19]. Hwang et al. also investigated transverse width and molar inclinations in adults using CBCT imaging, but like the UPenn approach, their analysis was confined to the molar region and did not include the anterior maxillary structures [5]. Lastly, Moon et al. evaluated the transverse relationship based on the CBCT-derived center of resistance; however, without dental casts, dental compensations were not investigated [20].
Therefore, the objective of this study was to evaluate maxillomandibular transverse dimensions and discrepancies at both the crown level and the estimated CRes and to compare these measurements among untreated subjects classified by vertical facial pattern—hypodivergent, normovergent, and hyperdivergent—in both the anterior and posterior regions of the maxilla and mandible. This investigation aimed to determine whether variations in transverse skeletal relationships are associated with specific vertical craniofacial morphologies. The working hypothesis (H1) proposed that vertical skeletal patterns significantly influence the maxillomandibular transverse relationship, whereas the null hypothesis (H0) stated that no statistically significant association exists between transverse dimensions and discrepancies and vertical skeletal patterns.
2. Materials and Methods
2.1. Participants, Eligibility Criteria, and CBCT
A power analysis was conducted using PASS software version 23.0.2 (NCSS, LLC, Kaysville, UT, USA) to determine the required sample size for this study. To detect differences among three group means using analysis of variance (ANOVA), a medium effect size (f = 0.25) was assumed. The analysis indicated that 165 participants (55 per group) would be required to achieve a statistical power of 0.80 at α = 0.05.
A total of 180 patients were included in the study, with equal representation across three vertical facial growth patterns: hypodivergent, normovergent, and hyperdivergent (n = 60 per group). Subject records—including dental casts and large field-of-view (FOV) CBCT scans—were retrieved from the database of the Arizona School of Dentistry and Oral Health Postgraduate Orthodontic Program in Mesa, Arizona. These diagnostic records were originally collected as part of the institution’s standard orthodontic screening protocol. Pretreatment lateral cephalograms were reconstructed from the CBCT scans to classify subjects according to their vertical skeletal pattern.
The study sample comprised 180 subjects (111 females and 69 males), evenly distributed across three vertical facial pattern groups: hypodivergent, normovergent, and hyperdivergent (n = 60 per group). Classification was based on the sella-nasion to mandibular plane angle (SN-MP), with thresholds defined as follows: hypodivergent (<27°), normovergent (27–37°), and hyperdivergent (>37°) [21]. Participants ranged in age from 18 to 40 years, with mean ages of 25.3, 24.6, and 25.7 years for the hypodivergent, normovergent, and hyperdivergent groups, respectively. The mean SN-MP angles and demographic characteristics for each group are summarized in Table 1. The study protocol received approval from the Institutional Review Board of A.T. Still University, Arizona (IRB No. 2024-062).
Table 1.
Cephalometric characteristics of the samples.
Strict inclusion and exclusion criteria were established to ensure the accuracy and reliability of maxillomandibular transverse measurements. The inclusion criteria were as follows: (1) availability of CBCT scans and digitized dental casts dated from 2018 onward; (2) presence of a fully erupted permanent dentition, including second molars; (3) dental crowding of ≤3 mm per arch; (4) no history of prior orthodontic treatment; and (5) absence of significant dental anomalies affecting crown or root morphology. Subjects were excluded if they exhibited (1) dental or skeletal asymmetry or (2) occlusal canting exceeding 4°.
2.2. Study Design
2.2.1. Cast Measurements
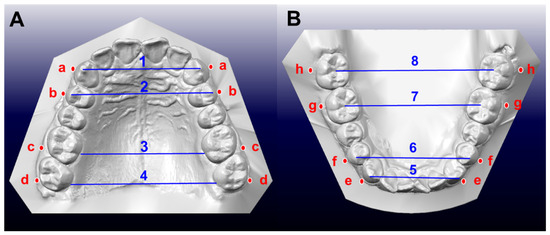
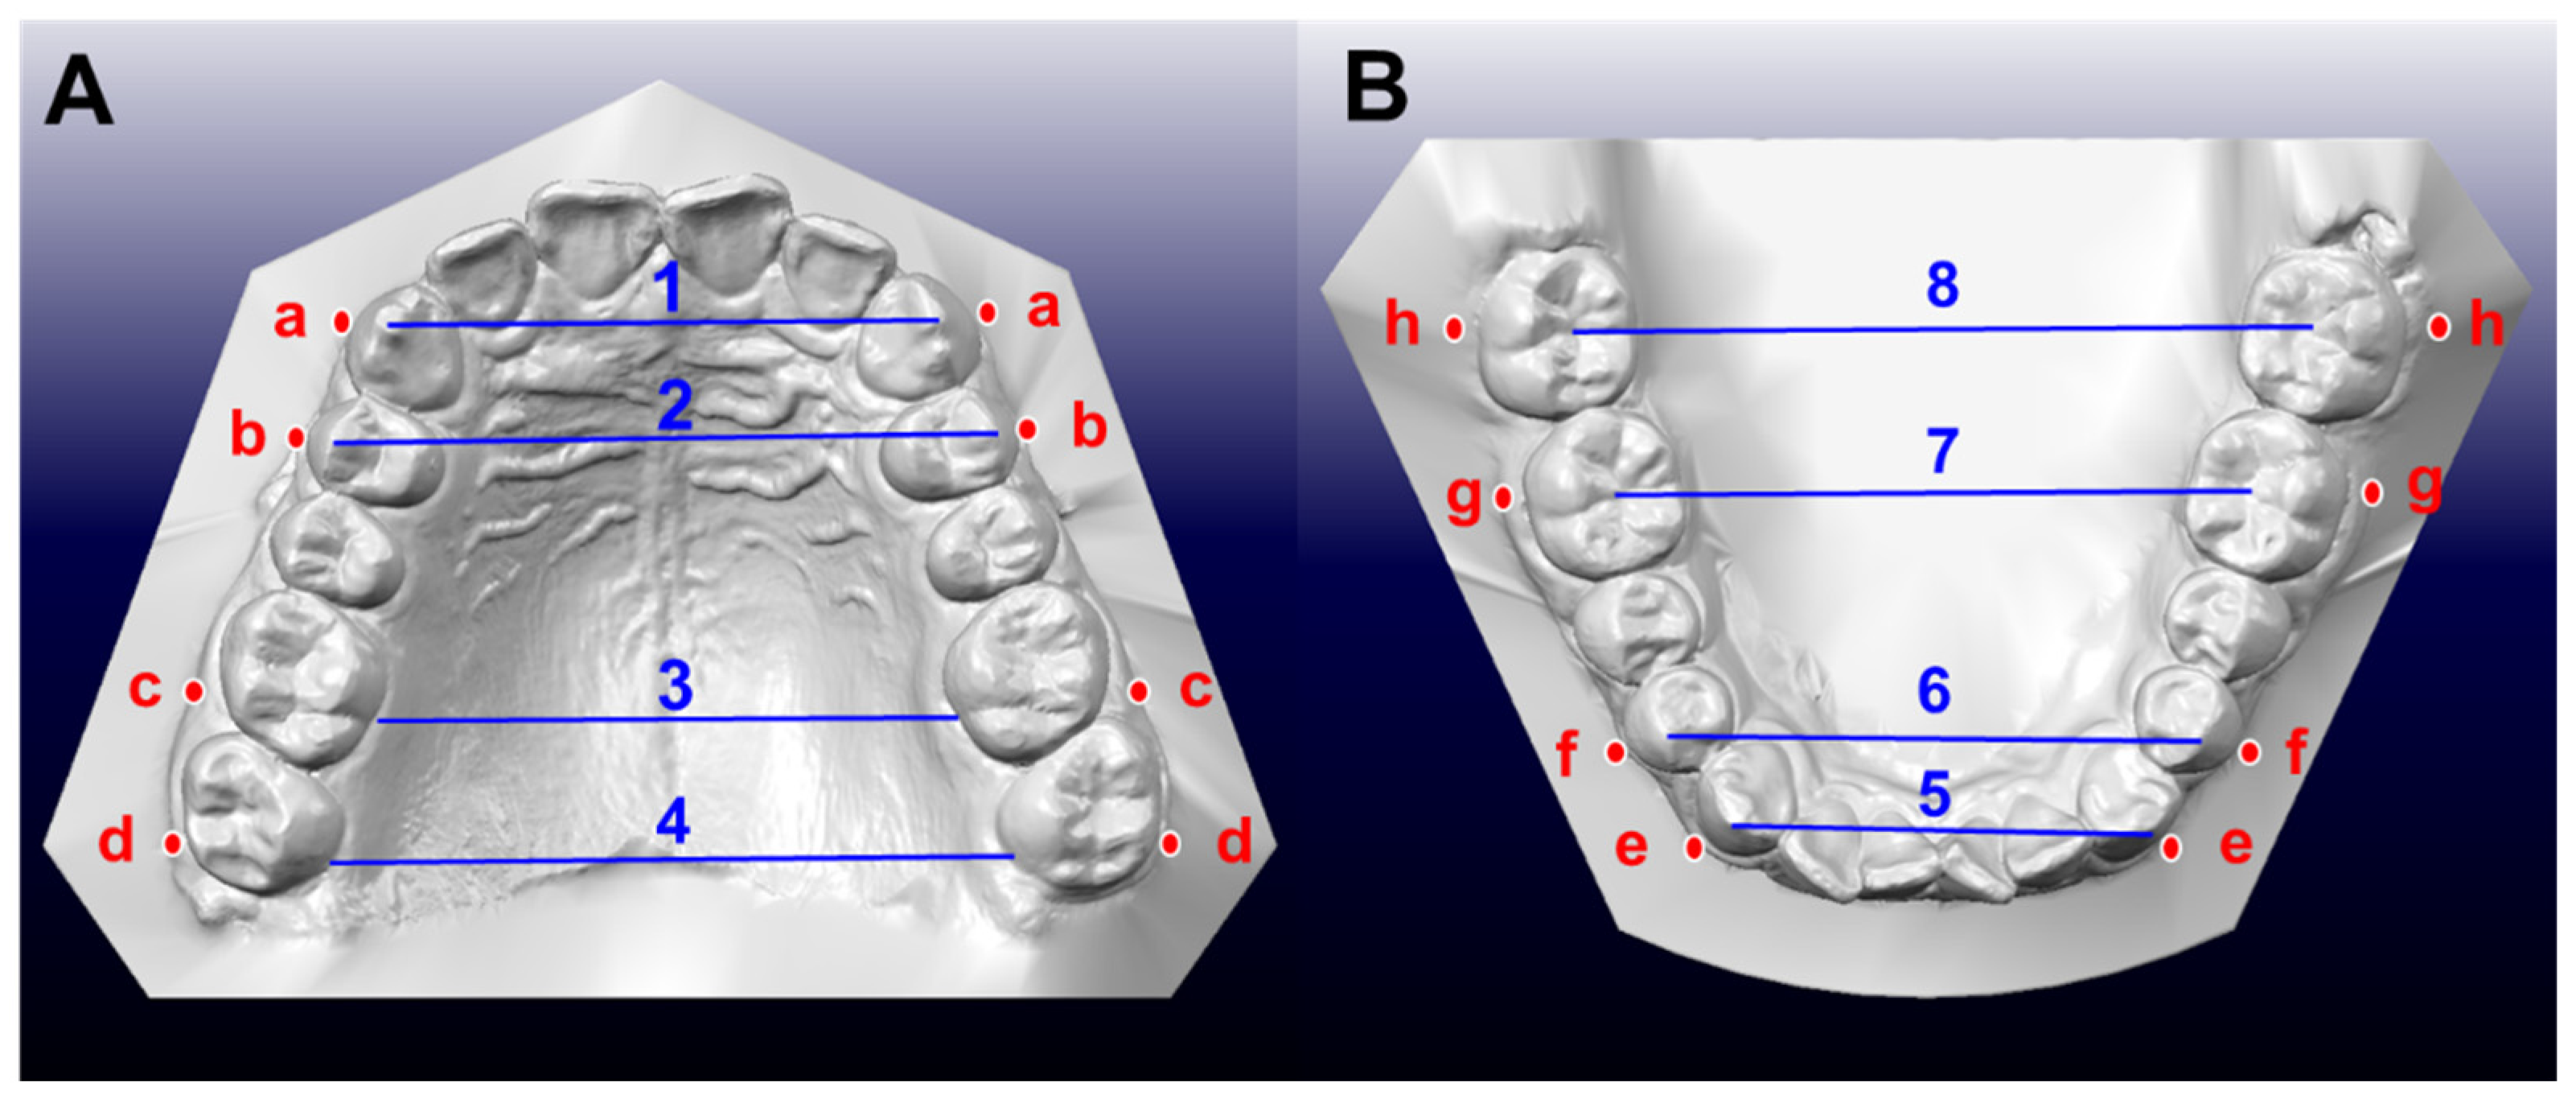
Dental arch width (DAW) and basal arch width (BAW-cast) measurements were obtained using OrthoCAD™ 5.9.1.50 software (Cadent, Carlstadt, NJ, USA), a digital platform for model analysis and storage. In accordance with the Yonsei transverse analysis protocol, DAWs were measured as cusp tip-to-cusp tip distances for the maxillary and mandibular canines and first premolars. For the maxillary first and second molars, measurements were taken at the narrowest portion of the dental arch—specifically, at the gingival junction along the palatal grooves. In the mandible, molar widths were measured from central groove to central groove. BAW-cast measurements were based on Andrews’ 6 keys to normal occlusion, using the WALA ridge as a reference point. These measurements were recorded at the mucogingival junction directly apical to the corresponding cusp tips. An illustration of the DAW and BAW-cast measurement landmarks is provided in Figure 1.
Figure 1.
Dental arch width on cast (DAW). (A), Maxilla: 1, canine; 2, first premolar; 3, first molar; 4, second molar. (B), Mandible: 5, canine; 6, first premolar; 7, first molar; 8, second molar. Basal arch width on cast (BAW-cast). (A), Maxilla: a, canine; b, first premolar; c, first molar; d, second molar. (B), Mandible: e, canine; f, first premolar; g, first molar; h, second molar.
2.2.2. CBCT Reorientation and Measurements
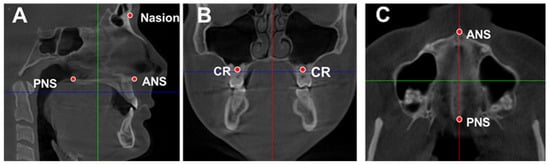
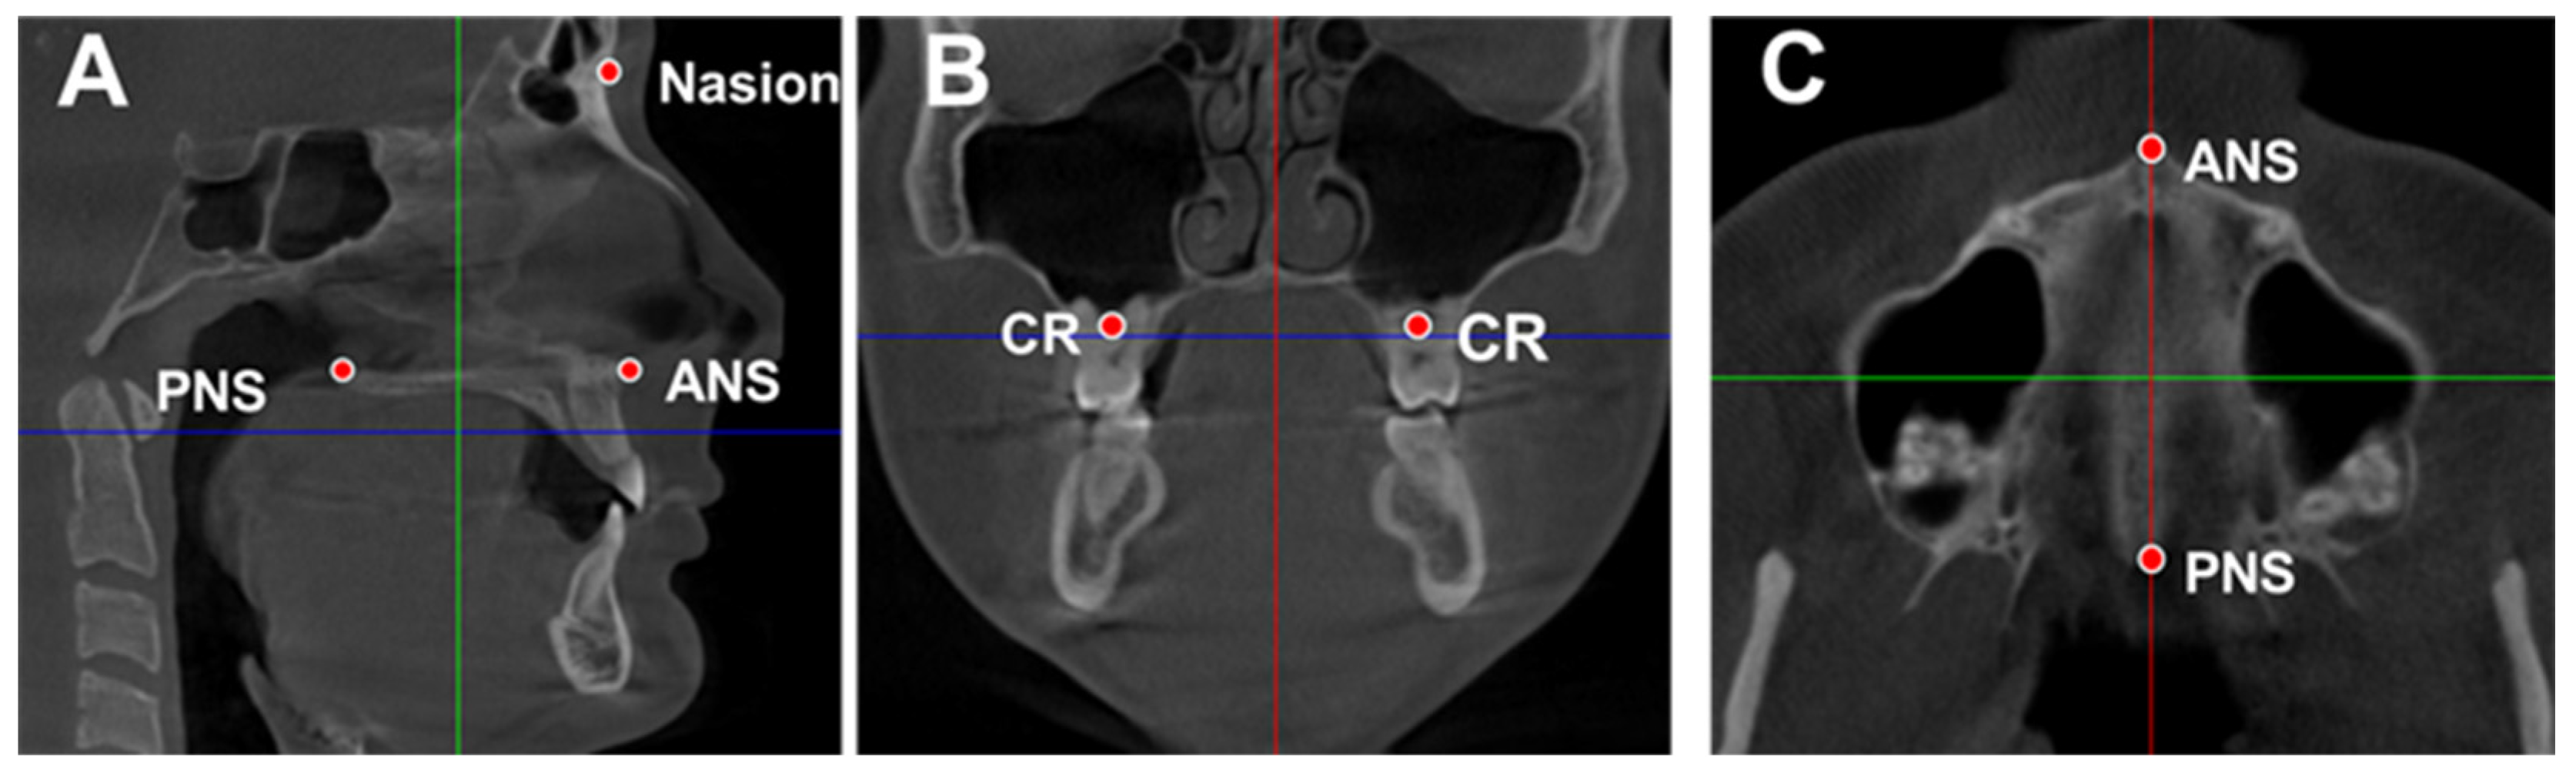
Each CBCT scan was oriented in natural head position to ensure consistency in measurement. The sagittal plane was reoriented using three anatomical landmarks: the anterior nasal spine (ANS), posterior nasal spine (PNS), and nasion (Figure 2A). The coronal plane was then established as a line perpendicular to the sagittal plane, passing through the estimated CRe of each tooth (Figure 2B). Finally, the axial plane was reoriented perpendicular to the sagittal plane and aligned with the palatal plane, defined by the ANS-PNS line (Figure 2C).
Figure 2.
Reorientation of CBCT images. (A), Sagittal plane; (B), Coronal plane; (C), Axial plane.
BAW measurements from CBCT scans (BAW-CT) were obtained using the i-CAT FLX system (Dental Imaging Technologies Corp., Hatfield, PA, USA). Scans were acquired with a standardized field of view (FOV) of 23 cm (diameter) × 17 cm (height) and a voxel resolution of 0.3 mm. The CBCT unit was operated at 120 kVp and 5 mA under standardized “Ortho” settings to ensure consistent image quality across subjects. Digital datasets were subsequently analyzed using Dolphin Imaging Software (Version 11.9; Dolphin Imaging and Management Solutions, Chatsworth, CA, USA).
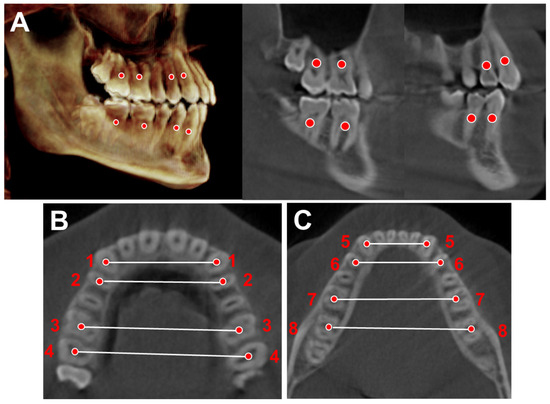
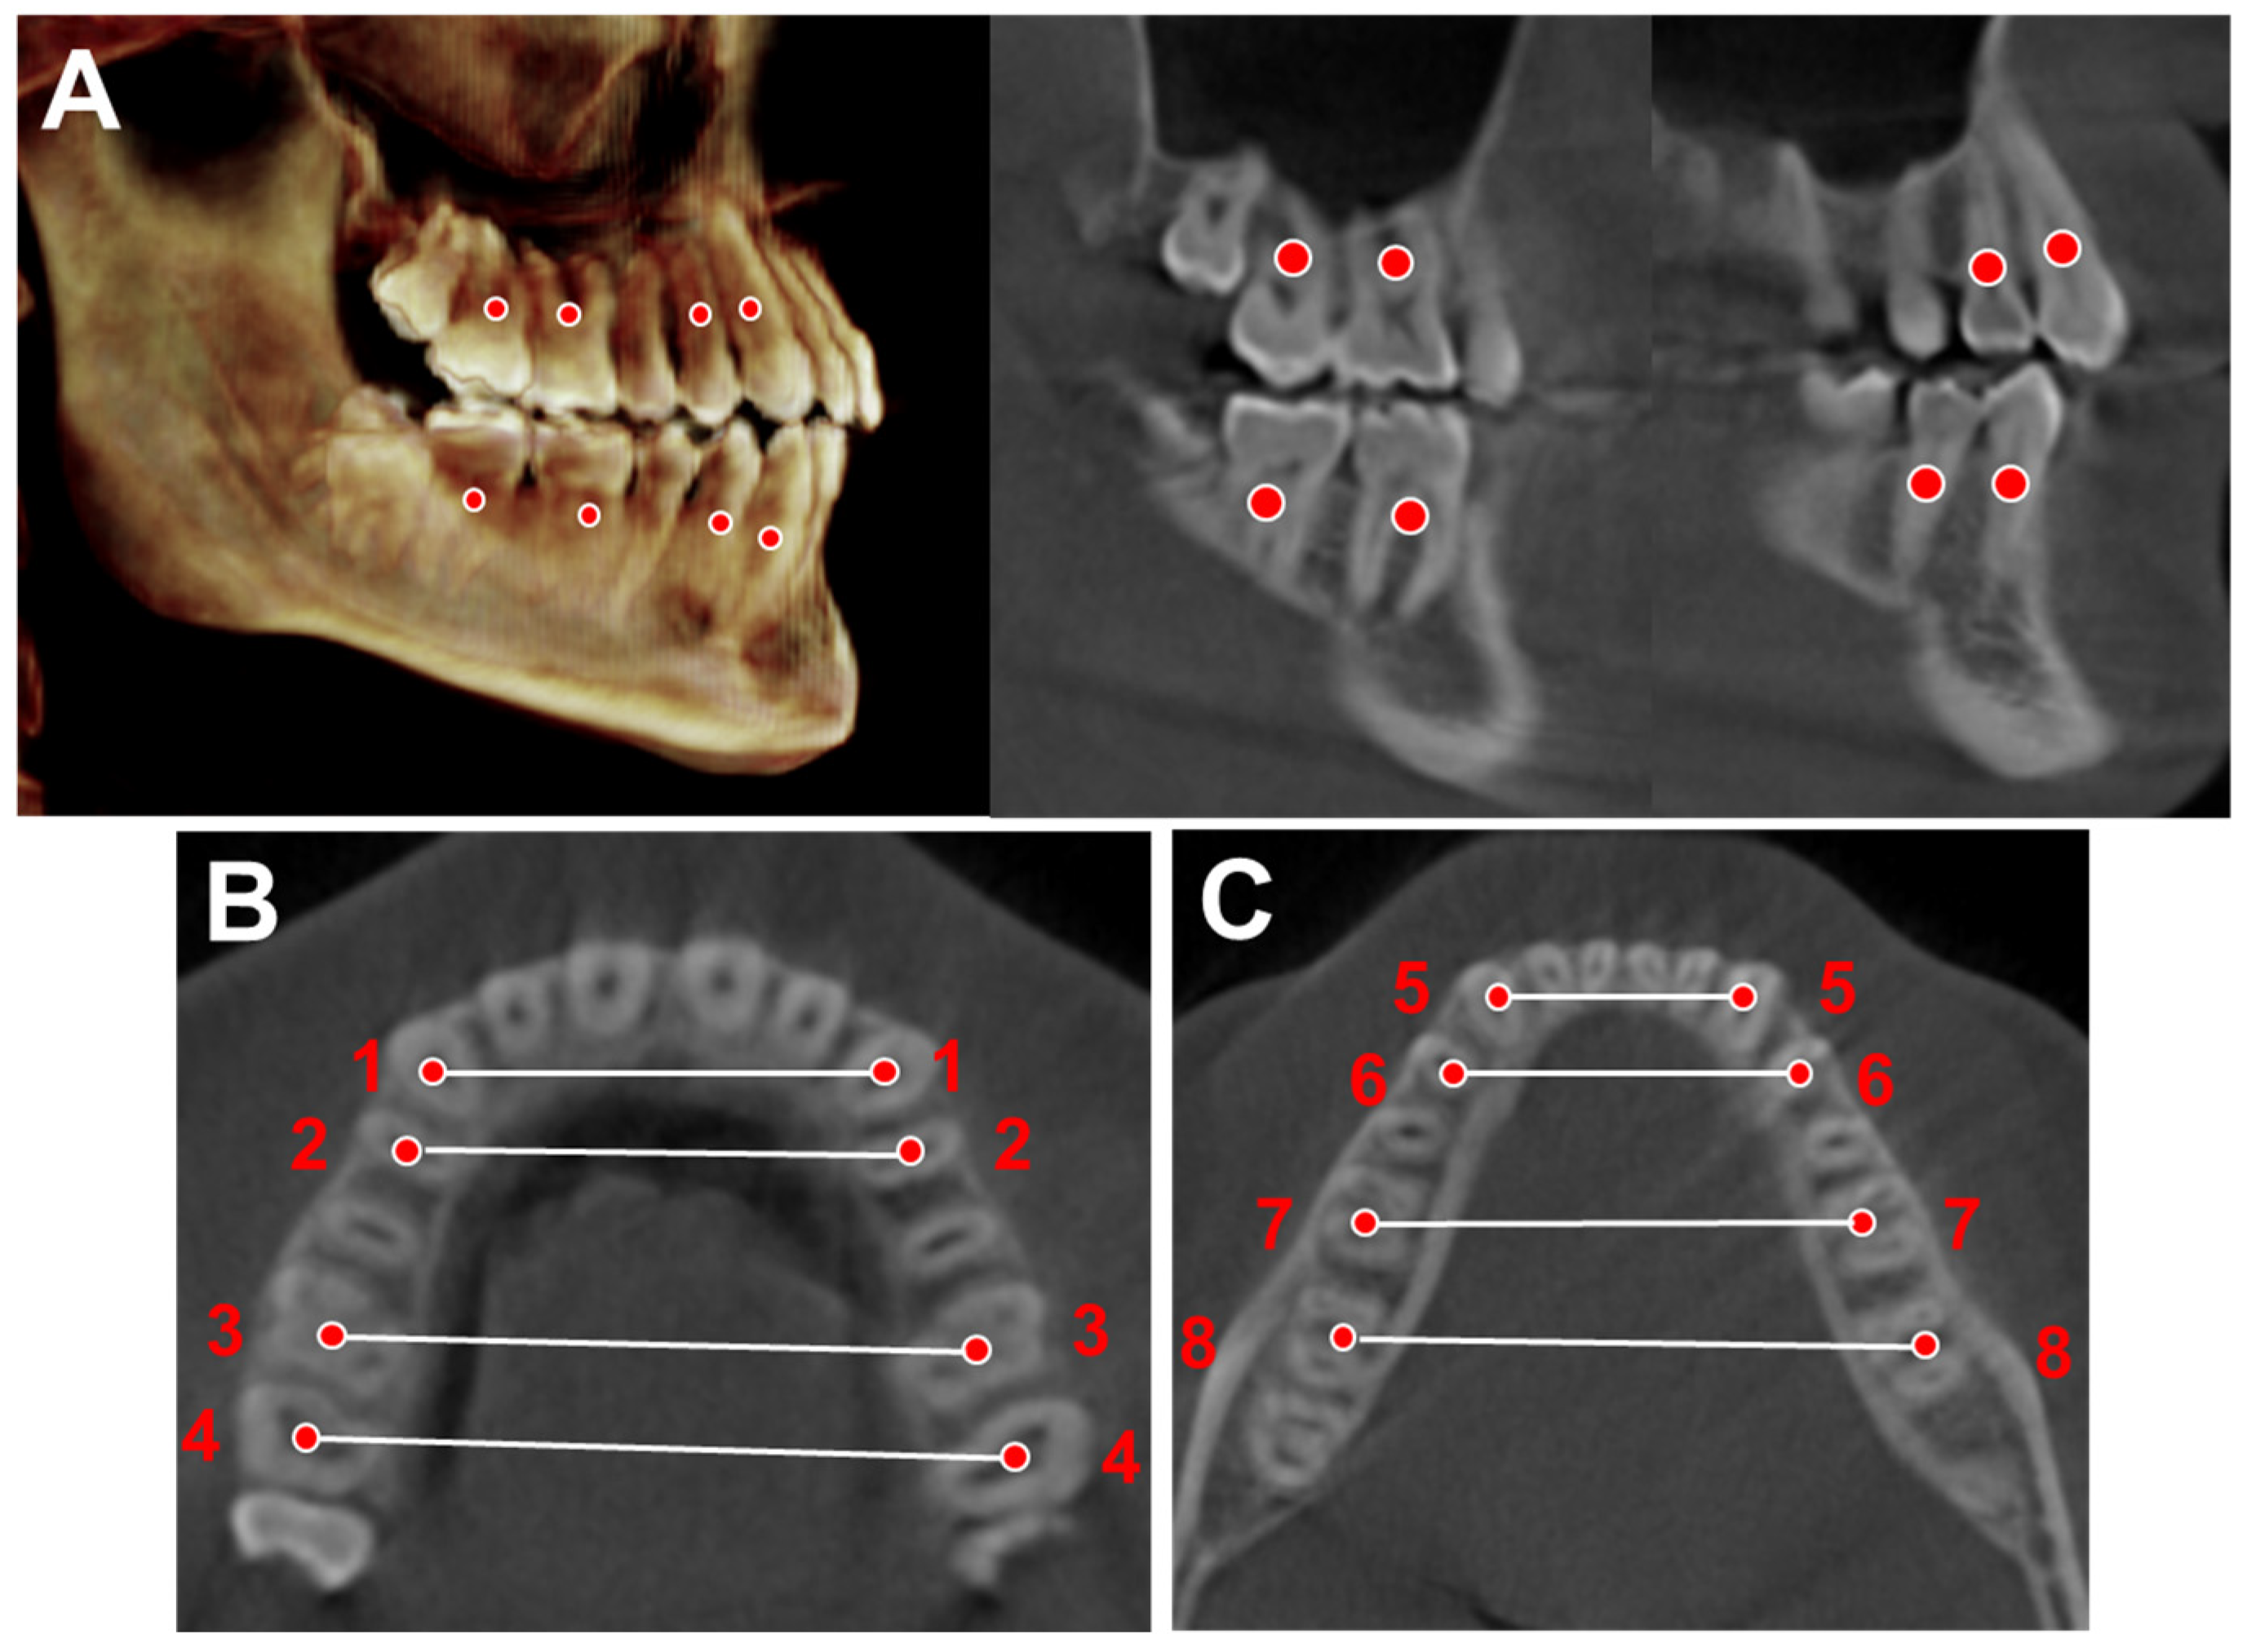
In accordance with the Yonsei transverse analysis protocol, BAW measurements from CBCT scans (BAW-CT) were obtained by identifying the estimated CRe for each tooth. For single-rooted teeth—such as canines and first premolars—the CRe was approximated at the coronal one-third of the root. For multi-rooted teeth—specifically first and second molars—the CRe was located at the furcation area. Measurements were recorded across the axial, sagittal, and coronal planes to ensure comprehensive spatial assessment (Figure 3).
Figure 3.
Basal arch width (BAW) on CBCT images. (A), The digitization of centers of resistance (CRes): a single-rooted tooth, at the level of the coronal one third; a multirooted tooth, at the level of the furcation; (B), Maxillary BAW (1, canine; 2, first premolar; 3, first molar; 4, second molar); (C), Mandibular BAW (5, canine; 6, first premolar; 7, first molar; 8, second molar).
2.2.3. Reliability
All CBCT-based measurements were conducted by a trained and calibrated examiner (S.E.), while dental cast-based measurements (DAW and BAW-cast) were performed by a separate trained and calibrated examiner (T.L.). To evaluate intra-examiner reliability, each examiner repeated measurements on 20 randomly selected CBCT scans and dental casts two weeks after the initial assessments. Intraclass correlation coefficients (ICCs) were calculated to quantify measurement consistency and ensure methodological reliability.
2.3. Statistical Analysis
Summary statistics, including means with standard deviations and counts with corresponding percentages, were computed for all variables. Intra-examiner reliability was evaluated to assess the reproducibility of measurements. Each examiner re-measured 20 randomly selected CBCT scans following a two-week interval. To assess measurement reliability, single-measurement, two-way mixed-effects intraclass correlation coefficients (ICCs) for consistency were calculated.
Outcome data were analyzed using one-way analysis of variance (ANOVA). As part of this analysis, the residuals for each ANOVA were tested for the normality assumption necessary for valid interpretation using Kolmogorov–Smirnov tests. Additionally, the assumption of homoscedasticity was examined. In the event that the residuals deviated significantly from normality, a nonparametric Kruskal–Wallis test was employed as an alternative to the ANOVA.
Following the ANOVA, Tukey’s Honestly Significant Difference (HSD) post hoc tests were conducted to identify statistically homogeneous subsets. Similarly, post hoc tests for the Kruskal–Wallis analysis were carried out using the Dunn-Bonferroni correction. Effect sizes for each omnibus test were determined using eta-squared (η2) for ANOVA and Kendall’s W (KW) for Kruskal–Wallis. All statistical analyses were conducted using SPSS software, version 30 (IBM Corp., Armonk, NY, USA), with a significance level set at α = 0.05.
3. Results
3.1. Examiner Reliability and Group Sex Differences
Preliminary tests for the one-way analysis of variance (ANOVA) revealed that all analyses satisfied the assumption of homoscedasticity. However, significantly non-normal distributions were observed for six variables: DAW Maxilla 1st Molar, DAW Maxilla 2nd Molar, BAW-cast Maxilla 2nd Molar, BAWCast Mandible Canine, BAWCast Mandible 1st Molar, and BAW-cast Mandible 2nd Molar. As previously stated, the Kruskal–Wallis test, with the Dunn-Bonferroni correction, and Kendall’s W are presented for the analysis of these variables.
3.2. DAW-Cast
Table 2 presents a comparison of DAW measurements across different vertical skeletal patterns, as determined from dental cast analysis. Statistically significant differences were observed, with the hypodivergent group exhibiting greater DAWs than the hyperdivergent group at the maxillary first molar (η2 = 0.043). In the mandible, statistically significant differences were observed at the first premolar region, with the hypodivergent group exhibiting a wider DAW than the hyperdivergent group, while the normovergent group demonstrated intermediate values. The effect size for this comparison was small to moderate (η2 = 0.041). Overall, the hypodivergent group had the widest dental arches in both the maxilla and mandible compared with the normovergent and hyperdivergent groups.
Table 2.
Comparison of dental arch width (DAW) depending on the vertical skeletal patterns using dental casts (unit: mm).
3.3. BAW-Cast
Table 3 presents a comparison of BAW measurements across different vertical skeletal patterns, as determined from dental cast analysis. Statistically significant differences were observed only in the maxillary arch, where the hypodivergent group exhibited greater BAWs than the hyperdivergent group across all measured regions, with the normovergent group consistently demonstrating intermediate values. Effect sizes ranged from moderate (η2 = 0.046) to moderate–large (η2 = 0.064). In the mandible, significant differences were observed at the canine region, where the normovergent group exhibited greater BAW than the hyperdivergent group, with the hypodivergent group demonstrating intermediate values. The effect size for this comparison was small to moderate (η2 = 0.039).
Table 3.
Comparison of basal arch width (BAW) depending on the vertical skeletal patterns using dental casts (unit: mm).
3.4. BAW-CBCT
Table 4 presents a comparison of BAW measurements across different vertical skeletal patterns, as determined from CBCT analysis. Statistically significant differences were identified only in the maxillary arch, where the hypodivergent group exhibited greater BAWs than the hyperdivergent group across all measured regions. Effect sizes were largest at the canine (η2 = 0.106) and first premolar (η2 = 0.092) regions. In contrast, no significant differences in mandibular BAWs were observed among the three groups. Overall, the hypodivergent group exhibited the widest BAs in both the maxilla and the mandible compared with the normovergent and hyperdivergent groups, with negligible effect sizes (η2 ≤ 0.009).
Table 4.
Comparison of basal arch width (BAW) depending on the vertical skeletal patterns using CBCT images (unit: mm).
3.5. Maxillomandibular Transverse Discrepancy (MTD)
Table 5 presents the MTDs, calculated as the difference between maxillary and mandibular widths, based on DAW-Cast, BAW-Cast, and BAW-CBCT, stratified by vertical skeletal patterns. No significant differences were observed in DAW-Cast across groups, with negligible effect sizes (η2 ≤ 0.011).
Table 5.
Comparison of maxillomandibular transverse discrepancy (MTD) using dental casts and CBCT images (DAW-Cast, BAW-Cast, and BAW-CBCT) depending on the vertical skeletal patterns (unit: mm).
For BAW-cast, statistically significant differences were detected across all measured regions. At the canine and first premolar regions, the hypodivergent group demonstrated greater MTDs than the hyperdivergent group, with normovergent values intermediate. At the first molar region, the normovergent group exhibited greater MTDs than the hyperdivergent group. At the second molar region, the hyperdivergent group demonstrated more negative MTD values compared with the hypodivergent group. Effect sizes ranged from moderate (η2 = 0.060) to moderate–large (η2 = 0.090).
For BAW-CBCT, statistically significant differences were observed only at the second molar region, where the hyperdivergent group exhibited more negative MTD values than the hypodivergent group, with a moderate effect size (η2 = 0.058). No significant differences were identified at the canine, first premolar, or first molar regions.
4. Discussion
MTDs are often underdiagnosed because growth in the transverse dimension typically ceases earlier than growth in the vertical or sagittal dimensions. In the absence of clinically evident crossbites or pronounced buccal corridors, such MTDs may remain undetected due to compensatory dental inclinations that mask the underlying skeletal imbalance. Accurate diagnosis of MTDs is therefore critical to ensure appropriate treatment planning and biomechanical strategies. The present study aimed to evaluate transverse dimensions across varying vertical facial patterns by analyzing both dental cast and CBCT-derived measurements in the anterior and posterior regions.
The DAW-Cast analysis revealed limited but consistent differences among vertical skeletal patterns. Statistically significant differences were identified at the maxillary first molar and mandibular first premolar regions, where the hypodivergent group exhibited wider dental arch widths than the hyperdivergent group. Although most other regions did not demonstrate statistically significant differences, mean values consistently indicated wider dental arches in hypodivergent subjects and narrower arches in hyperdivergent subjects. Overall, the hypodivergent group exhibited the widest dental arches in both the maxilla and mandible, with the normovergent group showing intermediate values. These findings suggest a close relationship between vertical growth patterns and transverse arch dimensions, with hypodivergency associated with broader arches. This observation is consistent with the reports of Betzenberger [22] and Masumoto [23], who also identified narrower maxillary and mandibular arch forms in hyperdivergent subjects. Such narrowing may be attributed to the vertical orientation of masticatory muscles and reduced occlusal forces, which limit transverse development. In contrast, hypodivergent individuals, characterized by stronger occlusal forces and more horizontally oriented musculature, tend to develop broader basal and dental arches [5]. The relatively small effect sizes observed in DAW measurements may reflect the influence of compensatory tooth inclinations that partially obscure underlying skeletal differences.
In contrast to DAW measurements, BAW analyses demonstrated more pronounced differences among vertical skeletal patterns, particularly in the maxilla. BAW-cast measurements revealed statistically significant differences across all maxillary regions, with the hypodivergent group exhibiting greater basal widths than the hyperdivergent group and the normovergent group displaying intermediate values, findings that are consistent with prior cast-based investigations evaluating vertical facial morphology and basal arch dimensions [5,20,24]. Effect sizes ranged from moderate to moderate–large. Mandibular BAW-cast measurements showed fewer intergroup differences, with a statistically significant difference observed only at the canine region, where the normovergent group exhibited greater basal width than the hyperdivergent group, a pattern that aligns with previous reports demonstrating limited mandibular basal variability across vertical skeletal types. The lack of widespread mandibular differences suggests that vertical skeletal divergence more strongly affects maxillary basal morphology than mandibular basal dimensions.
These findings were further supported by CBCT-derived measurements. BAW-CBCT analysis demonstrated statistically significant differences across all maxillary regions, with the hypodivergent group consistently exhibiting the greatest basal widths and the hyperdivergent group the smallest. Notably, effect sizes were largest in the anterior maxilla, particularly at the canine and first premolar region, corroborating CBCT-based studies emphasizing greater maxillary transverse sensitivity to craniofacial morphology. In contrast, no significant differences were observed in mandibular BAWs across vertical skeletal patterns, with negligible effect sizes, consistent with prior CBCT investigations reporting minimal mandibular basal variation related to vertical divergence.
In this study, the comparison between DAW and BAW provided clear evidence of dentoalveolar compensation across vertical skeletal patterns. In the maxilla, BAWs were significantly narrower in hyperdivergent than in hypodivergent groups, whereas DAWs exhibited smaller intergroup differences. This suggests that maxillary posterior teeth in hyperdivergent subjects are buccally inclined, compensating for skeletal constriction to preserve occlusal relationships. These findings are consistent with those of Masumoto, Albawai, and Janson [23,24,25], who reported greater buccal inclination of the maxillary molars in hyperdivergent subjects. In contrast, mandibular BAWs did not differ significantly among groups; however, hyperdivergent individuals exhibited reduced DAWs. This finding implies lingual inclination of mandibular posterior teeth in hyperdivergent subjects, consistent with observations reported by Masumoto and Shen [23,26]. These results confirm that vertical skeletal divergence is associated with compensatory posterior tooth tipping in hyperdivergent patterns, whereas hypodivergent individuals exhibit more upright tooth positions consistent with their broader skeletal bases.
Analysis of MTDs revealed important differences depending on the measurement modality. DAW-cast MTDs did not differ significantly across vertical skeletal patterns, suggesting that dentoalveolar compensation may obscure true skeletal discrepancies when dental arch widths alone are considered. In contrast, BAW-cast measurements revealed statistically significant differences across all regions, consistent with prior studies demonstrating that basal transverse dimensions are more sensitive to vertical skeletal divergence than dental arch measurements. In the anterior regions, hypodivergent subjects demonstrated greater MTDs than hyperdivergent subjects, whereas in the posterior regions—particularly at the second molar—the hyperdivergent group exhibited more negative MTD values, indicating a region-specific pattern of transverse discrepancy that varies according to vertical skeletal pattern.
BAW-CBCT measurements further refined these observations, with significant differences identified at the second molar region, where hyperdivergent subjects demonstrated greater mandibular dominance relative to the maxilla. The absence of significant anterior differences in BAW-CBCT MTDs suggests that CBCT-based assessment provides a more conservative and skeletal-specific evaluation of transverse discrepancies compared with cast-based measurements, with reduced influence from dentoalveolar compensation.
This study has several limitations that should be considered when interpreting the Section 3. Firstly, this study was conducted at a single institution, which may limit the generalizability of the findings to a broader population with differing demographics or characteristics. Secondly, the cohort included 111 women and 69 men, which may influence the observed transverse dimensions and warrants caution when extrapolating results to a more even number of women to men. In addition, patients with Class II or III sagittal patterns were excluded, limiting the applicability of findings across the full spectrum of craniofacial relationships. As a result, conclusions may be most generalizable to those with a Class I skeletal relationship. Future studies should include well-controlled cohorts of Class I, II, and III patients to assess interactions between sagittal and vertical patterns. Lastly, crossbite and other functional clinical evaluations were not included, which could have provided complementary clinical validation of CBCT and cast-based measurements.
5. Conclusions
This study evaluated the maxillomandibular transverse dimensions and discrepancies in relation to vertical skeletal patterns using digital dental casts and CBCT images.
- The hypodivergent group demonstrated the widest DAs in both the maxilla and mandible compared to the normovergent and hyperdivergent groups, with statistically significant differences observed at the maxillary first molar and mandibular first premolar regions.
- The hypodivergent group exhibited significantly greater BAWs in both cast and CBCT measurements compared to the hyperdivergent group in the maxilla, whereas no significant differences were found in the mandible among the three groups.
- Maxillomandibular transverse discrepancies measured from dental arch widths did not differ significantly among vertical skeletal patterns, suggesting that dentoalveolar compensation may obscure underlying skeletal discrepancies.
- Basal arch width–based measurements revealed region-specific transverse discrepancies, with greater anterior maxillary in hypodivergent subjects and greater posterior mandibular dominance in hyperdivergent subjects, particularly at the second molar region in both cast and CBCT-based analyses.
- Based on these findings, the null hypothesis was rejected.
Author Contributions
Conceptualization, S.E., T.L. and J.-M.C.; methodology, S.E., T.L. and J.-M.C.; software, C.B.; validation, S.E., T.L., J.-M.C. and J.H.P.; formal analysis, C.B.; investigation, S.E. and T.L.; resources, S.E. and T.L.; data curation, S.E. and T.L.; writing—original draft preparation, S.E. and T.L.; writing—review and editing, J.-M.C., J.H.P. and C.B.; visualization, S.E. and T.L.; supervision, J.-M.C. and J.H.P.; project administration, S.E., T.L., J.-M.C. and J.H.P. All authors have read and agreed to the published version of the manuscript.
Funding
This research received no external funding.
Institutional Review Board Statement
This study was conducted in accordance with the Declaration of Helsinki and was approved by the Institutional Review Board (IRB) of A.T. Still University, Arizona (protocol code IRB #2024-062, approved on the 15 April 2024. The IRB determined that this project was exempt under 45 CFR §46.104(d)(4) due to the use of de-identified human data.
Informed Consent Statement
Informed consent was waived as this study used preexisting CBCT data obtained from routine orthodontic screenings, and no identifiable personal information was used.
Data Availability Statement
Data is contained within the article.
Acknowledgments
This paper was supported by The Korean Orthodontic Research Institute Inc. This paper was supported by Wonkwang University in 2026.
Conflicts of Interest
The authors declare no conflicts of interest.
References
- Vanarsdall, R.L., Jr. Transverse dimension and long-term stability. Semin. Orthod. 1999, 5, 171–180. [Google Scholar] [CrossRef] [Scilit]
- McNamara, J.A. Maxillary transverse deficiency. Am. J. Orthod. Dentofac. Orthop. 2000, 117, 567–570. [Google Scholar] [CrossRef] [Scilit] [PubMed]
- Buschang, P.H.; Jacob, H.; Carrillo, R. The morphological characteristics, growth, and etiology of the hyperdivergent phenotype. Semin. Orthod. 2013, 19, 212–226. [Google Scholar] [CrossRef] [Scilit]
- Wagner, D.M.; Chung, C.H. Transverse growth of the maxilla and mandible in untreated girls with low, average, and high MP-SN angles: A longitudinal study. Am. J. Orthod. Dentofac. Orthop. 2005, 128, 716–723. [Google Scholar] [CrossRef] [Scilit] [PubMed]
- Hwang, S.; Jeong, S.; Choi, Y.J.; Chung, C.J.; Lee, H.S.; Kim, K.H. Three-dimensional evaluation of dentofacial transverse widths of adults with various vertical facial patterns. Am. J. Orthod. Dentofac. Orthop. 2018, 153, 692–700. [Google Scholar] [CrossRef] [Scilit] [PubMed]
- Forster, C.M.; Sunga, E.; Chung, C.H. Relationship between dental arch width and vertical facial morphology in untreated adults. Eur. J. Orthod. 2008, 30, 288–294. [Google Scholar] [CrossRef] [Scilit]
- Proffit, W.R.; Fields, H.W., Jr.; Sarver, D.M. Contemporary Orthodontics, 5th ed.; Elsevier: Amsterdam, The Netherlands; Mosby: Maryland Heights, MO, USA, 2013. [Google Scholar]
- Miner, M.R.; Al Qabandi, S.; Rigali, P.H.; Will, L.A. Cone-beam computed tomography transverse analyses. Part 2: Measures of performance. Am. J. Orthod. Dentofac. Orthop. 2015, 148, 253–263. [Google Scholar] [CrossRef] [Scilit]
- Ye, G.; Li, Q.; Guo, Z.; Yu, X.; Xu, Y.; Ding, W.; Wang, H.; Yu, M. Comparative evaluation of transverse width indices for diagnosing maxillary transverse deficiency. BMC Oral Health 2024, 24, 808. [Google Scholar] [CrossRef] [Scilit] [PubMed]
- Lee, K.M.; Hwang, H.S.; Cho, J.H. Comparison of transverse analysis between posteroanterior cephalogram and cone-beam computed tomography. Angle Orthod. 2014, 84, 715–719. [Google Scholar] [CrossRef] [Scilit]
- Andrews, L.F. The six keys to normal occlusion. Am. J. Orthod. 1972, 62, 296–309. [Google Scholar] [CrossRef] [Scilit]
- Chung, C.-H. Diagnosis of transverse problems. Semin. Orthod. 2019, 25, 16–23. [Google Scholar] [CrossRef] [Scilit]
- Kapila, S.D.; Nervina, J.M. CBCT in orthodontics: Assessment of treatment outcomes and indications for its use. Dentomaxillofac. Radiol. 2015, 44, 20140282. [Google Scholar] [CrossRef] [Scilit] [PubMed]
- Alkhatib, R.; Chung, C.H. Buccolingual inclination of first molars in untreated adults: A CBCT study. Angle Orthod. 2017, 87, 598–602. [Google Scholar] [CrossRef] [Scilit]
- Buschang, P.H.; Stroud, J.; Alexander, R.G. Differences in dental arch morphology among adult females with untreated Class I and Class II malocclusion. Eur. J. Orthod. 1994, 16, 47–52. [Google Scholar] [CrossRef] [Scilit]
- Uysal, T.; Memili, B.; Usumez, S.; Sari, Z. Dental and alveolar arch widths in normal occlusion, class II division 1 and class II division 2. Angle Orthod. 2005, 75, 941–947. [Google Scholar] [CrossRef] [Scilit]
- Koo, Y.J.; Choi, S.H.; Keum, B.T.; Yu, H.S.; Hwang, C.J.; Melsen, B.; Lee, K.J. Maxillomandibular arch width differences at estimated centers of resistance: Comparison between normal occlusion and skeletal Class III malocclusion. Korean J. Orthod. 2017, 47, 167–175. [Google Scholar] [CrossRef] [Scilit]
- Zhang, C.X.; Tan, X.M.; Wu, W.; Liu, H.; Liu, Y.; Qu, X.R.; Liu, D.X. Reliability of 2 methods in maxillary transverse deficiency diagnosis. Am. J. Orthod. Dentofac. Orthop. 2021, 159, 758–765. [Google Scholar] [CrossRef] [Scilit]
- Tamburrino, R.K.; Boucher, N.S.; Vanarsdall, R.L.; Secchi, A.G. The transverse dimension: Diagnosis and relevance to functional occlusion. RWISO J. 2010, 2, 13–22. [Google Scholar]
- Moon, H.W.; Nam, W.; Ahn, H.W.; Oh, S.H.; Kook, Y.A.; Kim, S.H. Development of a maxillomandibular arch form based on the center of resistance of teeth using cone-beam computed tomography. Am. J. Orthod. Dentofac. Orthop. 2022, 161, 208–219. [Google Scholar] [CrossRef] [Scilit] [PubMed]
- Gamm, S.H.; Gianelly, A.A. Polygonic interpretation of the Steiner analysis. Am. J. Orthod. Dentofac. Orthop. 1970, 58, 479–485. [Google Scholar] [CrossRef] [Scilit] [PubMed]
- Betzenberger, D.; Ruf, S.; Pancherz, H. The compensatory mechanism in high-angle malocclusions: A comparison of subjects in the mixed and permanent dentition. Angle Orthod. 1999, 69, 27–32. [Google Scholar]
- Masumoto, T.; Hayashi, I.; Kawamura, A.; Tanaka, K.; Kasai, K. Relationships among facial type, buccolingual molar inclination, and cortical bone thickness of the mandible. Eur. J. Orthod. 2001, 23, 15–23. [Google Scholar] [CrossRef] [Scilit] [PubMed]
- Albalawi, F.; Alwakeel, R.; Alfuriji, S.; Alqahtani, N.D.; Barakeh, R.M.; AlGhaihab, A.; Alsaeed, S. A correlation analysis between arch width and molar inclination using cone-beam computed tomography transverse measurements: A cross-sectional study. Diagnostics 2023, 13, 1875. [Google Scholar] [CrossRef] [Scilit] [PubMed]
- Janson, G.; Bombonatti, R.; Cruz, K.S.; Hassunuma, C.Y.; Del Santo, M., Jr. Buccolingual inclinations of posterior teeth in subjects with different facial patterns. Am. J. Orthod. Dentofac. Orthop. 2004, 125, 316–322. [Google Scholar] [CrossRef] [Scilit] [PubMed]
- Shen, J.; Liu, Z.; Shuai, J.; Yin, Y.; Wang, Z.; Ding, W.; Chung, C.H.; Chen, Q.; Zhao, X. Transverse dentoalveolar development in Chinese children and adolescents: A cross-sectional study using revised Andrews’ element III analysis. Am. J. Orthod. Dentofac. Orthop. 2025, 167, 144–153. [Google Scholar] [CrossRef] [Scilit]

Disclaimer/Publisher’s Note: The statements, opinions and data contained in all publications are solely those of the individual author(s) and contributor(s) and not of MDPI and/or the editor(s). MDPI and/or the editor(s) disclaim responsibility for any injury to people or property resulting from any ideas, methods, instructions or products referred to in the content. |
© 2026 by the authors. Licensee MDPI, Basel, Switzerland. This article is an open access article distributed under the terms and conditions of the Creative Commons Attribution (CC BY) license.