


Featured Application
Midsole material properties are incorporated into running shoes to alleviate negativity of impact while enhancing the propulsive performance of the runner. The data show that in-vitro material properties positively relate to spatially resolved measures of impact attenuation during treadmill running.
Abstract
Running shoe midsoles are designed to attenuate impact forces while maintaining or improving performance. However, the literature is equivocal, likely due to measurement systems, whereas in vitro testing is conclusively favourable. This study investigated three densities of ATPU foam, comparing in vitro mechanical properties with in vivo plantar force spectral characteristics derived from individualised pressure distributions during treadmill running at varied speeds. In vitro results of slab foam and shoes showed strong positive relationships between impact variables normalised to total impact energy and foam density (r2 > 0.90), and strong negative relationships for time-domain variables normalised to deformation (mm) as density increased (r2 > 0.89). During running, lower midsole density increased ground contact time across speeds (p = 0.041), while spatially resolved high-frequency PSD and peak impact force both decreased (p = 0.043; p = 0.030). However, there were no differences between total vertical force and midsole density (p = 0.232). Relationships between in vitro Peak G and high-frequency PSD were strong across all speeds (r2 = 0.63–0.91). Conversely, reducing midsole density increased active peak force across speeds (p = 0.003), which was strongly related to in vitro energy return (r2 > 0.89). Therefore, plantar force spectra and spatially resolved analyses demonstrate how foam density properties translate from in vitro to in vivo treadmill running, with lower-density foam improving impact attenuation but elevating propulsive forces. Future work needs to verify this in an outdoor setting.
1. Introduction
Running involves antero-posterior, acceleration-braking forces intricately linked to impact forces, where both increase proportionally with running speed [1]. Balancing these forces is essential to maintaining speed. However, the effort required to achieve this negatively affects technique and thus efficiency [2,3,4].
A runner can adjust components of the impact attenuation system, including segmental joint angles, muscle activity, and joint stiffness [5]. If none of these factors change with increases in running pace, the impact force must increase. A great example of system adaptation is the comparison between barefoot running, or shoes without a midsole, and running in shoes with a midsole. Barefoot running typically results in an increased stride rate, decreased stride length, greater knee flexion, greater medial gastrocnemius activation, and a resulting lower peak vertical ground reaction force [6]. Additionally, running barefoot on surfaces with greater stiffness results in underfoot impact force attenuation [7]. This underfoot impact force attenuation occurs not because the foot is more cushioned, but because the human running gait adapts to varying surface stiffness conditions [8,9].
When surface stiffness is controlled and running shod takes place in a variety of underfoot cushioning conditions, in vivo findings are inconclusive at best [10,11,12,13,14]. Total vertical force offers limited insight into whether the attenuation system adapts [15]. As such, a runner could present higher or lower impact forces due to changes in joint mechanics as seen in barefoot running [6] or in response to midsole properties [16]. Particularly, soft midsoles or surfaces can increase lower limb stiffness, leading to harder landings and increased peak impact forces compared to a harder surface [8] or harder shoes [16]. Furthermore, the combination of stack height and foam density influences the longitudinal bending stiffness (LBS) of a shoe, affecting both comfort and performance [17]. Where a high stack low-density midsole could lead to a reduction in work at the ankle compared to a lower stack height [18].
The lack of evidence supporting cushioning in vivo is worrying, as the running shoe industry has spent over 50 years developing midsole materials and their properties based on in vitro mechanical testing [19]. Specifically, foam chemistry enables the tuning of material properties, while the foaming process determines the midsole’s density, which relates to cushioning [20], where density values circa 2025 range from 0.08 g∙cm−3 for advanced high-energy absorbent materials [21] to 0.35 g∙cm−3 for more traditional polyurethanes [21,22,23,24,25]. These midsoles are then geometrically shaped to achieve improved mechanical efficiency, enhanced comfort, and reduced injury risk [26].
Despite these efforts, there are likely problems with the in vivo protocol, where the typical research practice of analysing less than 10 non-consecutive steps is increasingly viewed as insufficient [27]. Additionally, the reliability of total vertical force data has also been questioned for its inability to identify strike pattern [23] and the true impact forces [15] due to the masking effect of non-specific spatial plantar forces during the loading phase. On top of this, it has been shown that runners adjust joint mechanics to accommodate midsole compliance [16], potentially improving movement efficiency while maintaining or even exacerbating impact forces and possibly injury risk. As such, the relationship between in vitro and in vivo is poor.
A recent development in midsole material is the use of aliphatic thermoplastic polyurethane (ATPU), which addresses the limitations of thermoplastic polyurethane (TPU) in terms of tunability and density. While TPU offers recyclability, strength, and durability [28] through its soft and hard molecular segments [29,30], it cannot compete with the very soft, high-performing polyether block amide (PEBA) foams [31]. ATPU addresses these limitations by increasing cell wall strength and tunability, thus facilitating lower densities while maintaining high-performance mechanical properties comparable to PEBA.
With the emergence of new materials such as ATPU [29], advancements in foaming techniques [20], and enhanced micro-processing capabilities for biomechanical analysis [23], this study investigates the densities of ATPU foam. Specifically, comparing in vitro mechanical properties with in vivo plantar force spectral characteristics derived from individualised pressure distributions during treadmill running at varied speeds.
It is hypothesised that decreasing midsole density will reduce high-frequency, spatially resolved spectral power associated with impact attenuation. In addition, higher treadmill speeds are expected to amplify impact forces.
2. Materials and Methods
2.1. Material Properties
ATPU beads were used to produce three different foam densities. The process begins with the extrusion of the ATPU material, which is then cut into clear pellets and autoclaved for supercritical fluid foaming. The resulting foam pellets are steam-chested into an oversized blocker, sized between 120 and 140% of the required size of the foam slab (200 × 200 × 20 mm). The scale of oversizing depends on the required foam density, where a greater degree of final compression yields higher densities. The physical properties of the foam slab were subsequently tested at an accredited laboratory (Timberland Testing Laboratory, Stratham, NH, USA) as per industry standards; see Table 1. These properties were selected as they represent the foam’s ability to absorb impact, recover shape, and maintain in vitro performance under repeated use.
Table 1.
Physical properties of injection-moulded ATPU foams in slab form, with corresponding industry-standard test method.
2.2. Test Shoes
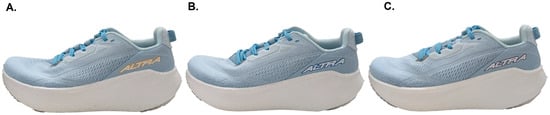
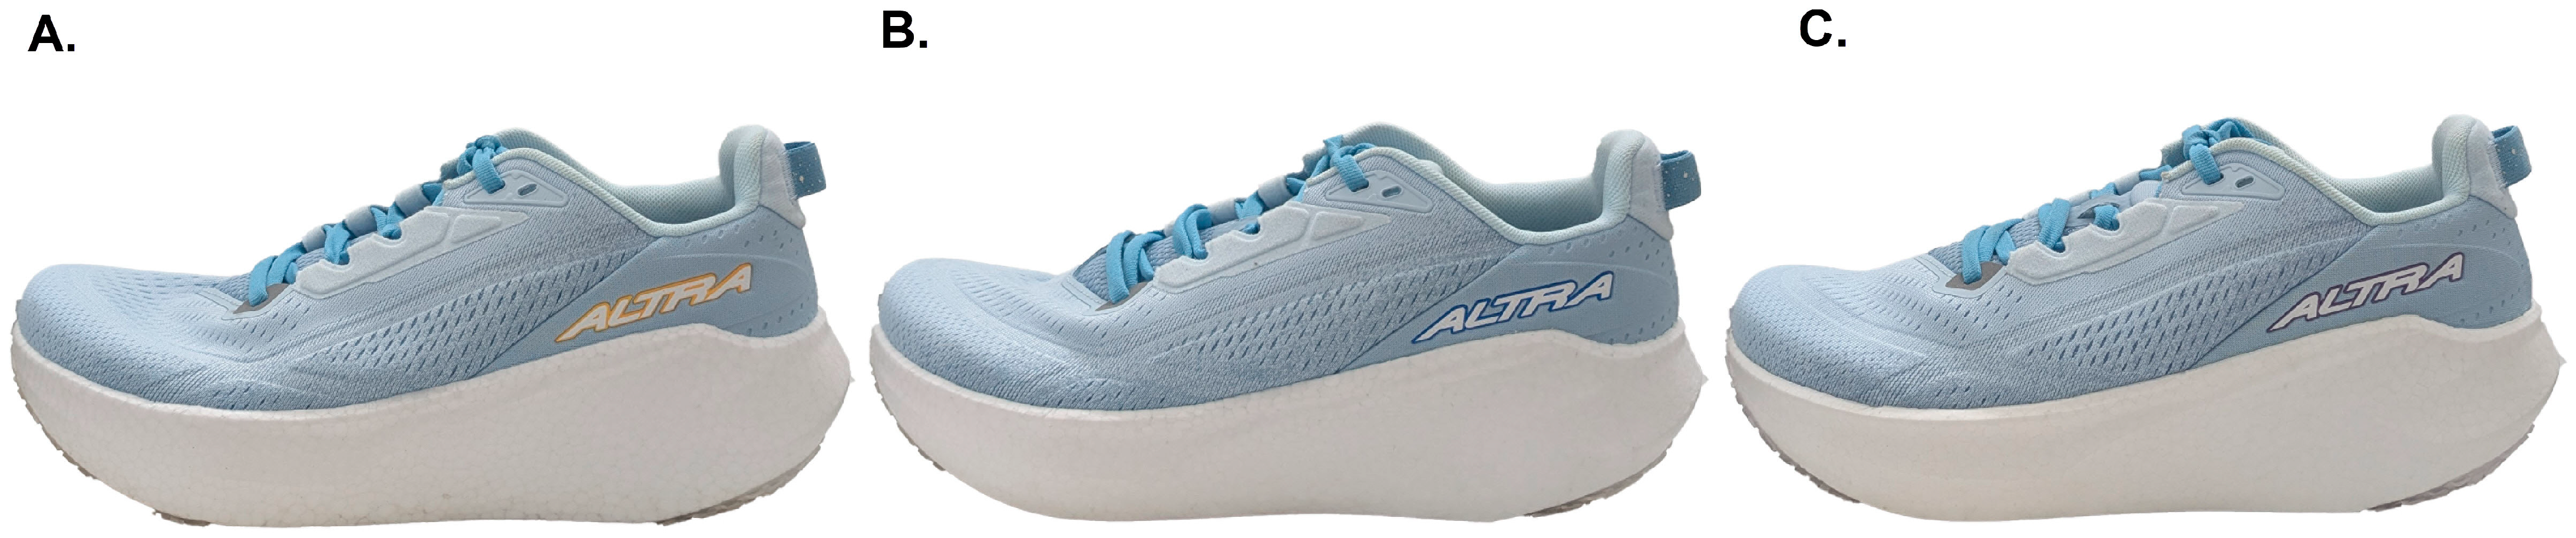
The ATPU beads underwent the same supercritical fluid foaming process, where the foam blocker sized at 120–140% of the intended midsole dimensions is drawn into the mould and compressed to form the final midsole shape and targeted density. This process was performed using the same mould, resulting in three identical midsole geometries (Figure 1). Each midsole featured a heel stack height of 38 mm, measured at 12% of the shoe’s total length from the heel, and a forefoot stack height of 32 mm, measured at 75% of total shoe length [36,37]. As a result of the different midsole densities, the weights below the foot differed: shoe A (ρ = 0.164) was 213 ± 26 g, shoe B (ρ = 0.147) was 206 ± 29 g, and shoe C (ρ = 0.122) was 183 ± 17 g. Each midsole was paired with an identical upper and TPU outsole, ensuring the only visual distinction between shoes was the colour of the brand logo (Figure 1). Total shoe weights were as follows: shoe A (ρ = 0.164) 283 ± 35 g, shoe B (ρ = 0.147) 275 ± 37 g, and shoe C (ρ = 0.122) 258 ± 32 g. At the time of data collection, only the manufacturer was aware of the midsole density assignment, and they had no contact with the research team. This blinded allocation process is a key strength of the study, as it minimises the potential for researcher bias.
Figure 1.
Photographic representation of the three test shoes, which differ only in midsole density (ρ), where (A) = 0.164, (B) = 0.147, and (C) = 0.122.
2.3. In Vitro Performance Property Tests
Slab foam performance properties were assessed prior to shoe manufacture using an in-house protocol based on ASTM F1614 [38]. The impact test was configured to deliver 2.48 J of work, with a drop height of ~50 mm, and an impact velocity of ~99 cm∙s−1. Following shoe assembly, in-shoe performance was evaluated using ASTM F1976-13 [39], with the impact tester set to deliver 4.2 J of work, with a drop height of ~50 mm and impact velocity ~99 cm∙s−1. The increased work level during the in-shoe test reflects the need to simulate real-world impact conditions, accounting for structural contributions of the upper and outsole [39]. All dependent variables were normalised to total impact energy (J) and maximum deformation (mm) to enable direct comparison between slab foam and shoe configurations across different foam densities.
Additionally, the shoe’s LBS and flexibility were assessed in relation to human foot mechanics using SATRA TM194 [40], with testing conducted at a 50° angle to capture the most functionally relevant range of motion. The reported torque reflects the shoe’s resistance to being dorsiflexed to this angle.
2.4. In Vivo Procedures and Measurements
2.4.1. Participants
Fourteen nationally competitive endurance runners, free of injury, participated in the study after providing written consent in accordance with the University Human Ethics Committee approval. Participant characteristics (mean ± SD) were age 28.9 ± 8.9 years, height 175.4 ± 8.2 cm, body mass 67.2 ± 9.3 kg, Body Mass Index 21.7 ± 1.5, and weekly training volume 77.1 ± 22.2 km∙wk−1. This sample size was based on priori statistics (G*power V 3.1.9.7, Heinrich-Heine University, Dusseldorf, Germany) for analysis of variance (ANOVA) repeated measures within factors, using an alpha value of 0.05, power of 0.95, and effect size (f) based on previously reported differences between midsole properties of cushioning: of 0.764 using spatially resolved peak pressure data [15] and peak impact force 0.457 in midsoles with similar densities to those used in this study [14].
2.4.2. In Vivo Protocol
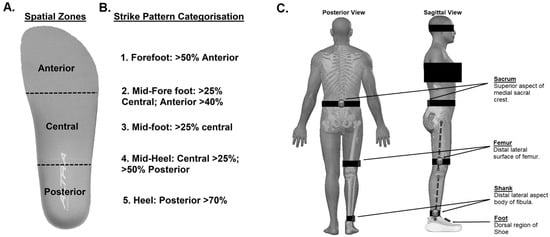
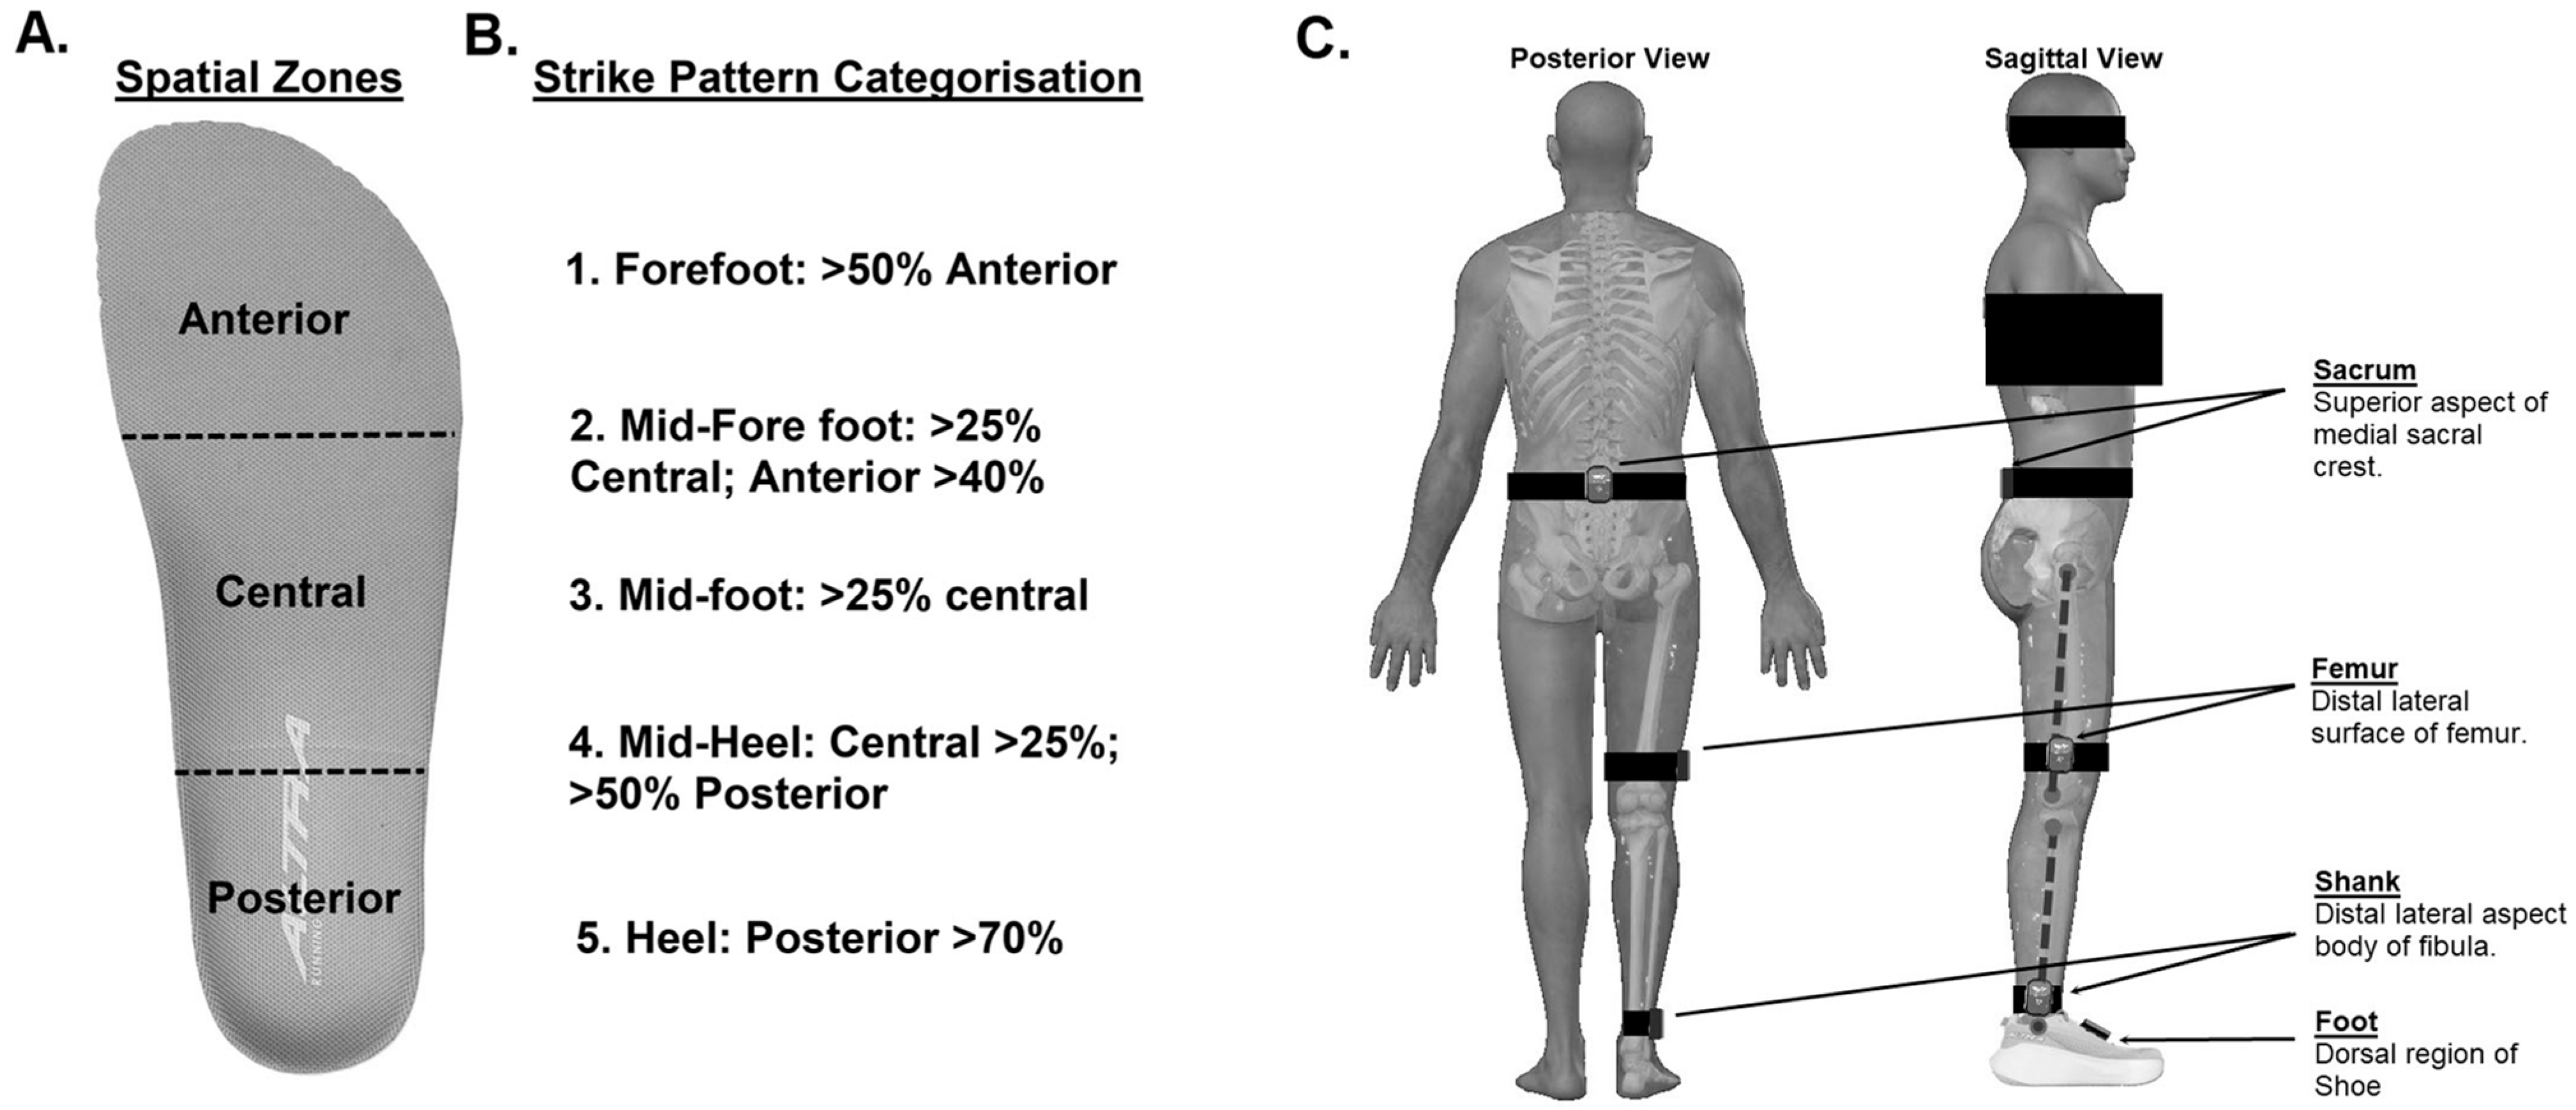
The experimental protocol was conducted in a single session. Upon arrival at the laboratory, participants were weighed, measured, and presented with the required shoe size fitted with Loadsol® pressure-sensitive insoles (novel gmbh, Munich, Germany). These insoles partition plantar forces into posterior, central, and anterior zones (Figure 2A), enabling foot-strike classification (Figure 2B) and were calibrated using manufacturer-defined instructions.
Figure 2.
Measurement systems used throughout the study: (A) the pressure-sensitive insole spatial zones; (B) the foot-strike classification system based on impact force distribution; and (C) the posterior and sagittal views of AHRS placements.
To capture orientation data, AHRS-IMU sensors (WT9011DCL-BT5.0, WITMOTION Shenzhen Co., Ltd., Shenzhen, China) were used. Each unit contained tri-axial accelerometers, gyroscopes, and a geomagnetic field sensor, along with an onboard microprocessor for dynamic calculations and a Kalman filtering algorithm to estimate axis angles. Sensors were affixed to predefined anatomical landmarks [41] on the participant’s right-hand side (Figure 2C) and secured using foam under wrap (USL Sport, Auckland, New Zealand) to minimise movement artefacts and signal noise [42,43].
Once fastened, sensor calibration required participants to stand stationary for ~40 s in the anatomical position, facing the treadmill run direction. During this period, accelerometers were zeroed, and the reference angle was set to define sensor orientation, following the manufacturer’s guidelines. Both Loadsol and AHRS-IMU sensors were recalibrated prior to each shoe condition.
Participants completed a 5 min warm-up at 10 km∙h−1 (Life Fitness Treadmill, Hamilton, New Zealand), wearing the designated shoes (Figure 1), which were assigned in a counter-balanced order. Each shoe condition was sequentially tested at 12, 14, and 16 km∙h−1 for a duration of 2 min per speed (approximately 150 right foot steps), with a 5 min rest between conditions. These speeds reflected participants’ typical easy-pace recovery, which is performed in everyday running shoes, and have previously been shown to produce significant differences in vertical ground reaction forces [44]. The 5 min recovery between conditions was implemented to minimise sequence effect on the dependent variables of interest as previously recommended [45]. All participants were familiar with the geometry of the shoe used throughout this study and had previously completed at least 25 km of running in it prior to the study commencing.
During data collection, plantar forces were recorded at 200 Hz using the Loadsol insoles, while AHRS-IMU data were logged at 100 Hz. All data were subsequently uploaded to MATLAB (R2022b, MathWorks Inc., Natick, MA, USA) and resampled to 1000 Hz to improve the precision of variable identification and analysis [23,46]. Only data from the right side were analysed [42]. To account for potential variability in running gait due to initial acceleration and final deceleration, the first 20 steps and final 5 steps of each trial were excluded from analysis [47].
Total force data were used to determine stride duration, ground contact time, and swing time. Impact kinetics were derived based on foot-strike patterns, spatially resolved using the zone classification system shown in Figure 2B. Specifically, peak vertical impact force, average loading rate, and power spectral density (PSD) were calculated using only the relevant spatial zones engaged during initial contact. In contrast, active peak vertical force and impulse were derived from the total force signal. All variables were processed as previously described [23,46], with kinetic metrics and PSD normalised to participant body weight. For spectral analysis, the first 20% of the stance was extracted and transformed using a discrete Fast Fourier Transform (FFT) without windowing or overlap. The amplitude spectrum was computed as the absolute FFT magnitude divided by segment length, with frequency resolution determined by the sample count (1000 Hz/N). Low- and high-frequency components were defined as <10 Hz and ≥10 Hz, respectively.
AHRS-IMU data were processed over the same time window to calculate deviations from each sensor’s reference angle in the sagittal plane, thereby quantifying joint angle changes. Joint angles were derived from inter-segmental sensor differences: hip deviation was calculated as the angle between the sacrum and femur sensors, knee deviation as the angle between the shank and femur sensors, and the ankle deviation as the angle between the shank and foot sensor.
Key gait cycle events (initial contact and toe-off) were identified using segment-specific acceleration signals. Initial contact was determined using total foot acceleration via the S-Method [48], while toe-off was identified using the vertical acceleration at the distal aspect of the fibula, following the M-Method [49]. Both methods have been validated as best practice for IMU-based gait analysis [50], enabling data fusion with plantar force measurements and the extraction of specific joint metrics, including the range of motion (ROM) during the impact phase of stance for ankle dorsiflexion and knee flexion, and ROM during the propulsive phase for ankle plantarflexion, knee extension, and hip extension.
2.5. Statistical Analysis
Linear regression was used to assess the relationship between foam density and material properties, with differences between the foam slab and midsole evaluated based on slope and y-intercept.
All dependent in vivo variable data were calculated per step and presented as mean ± SD for each midsole density and treadmill running speed condition. Differences between conditions were analysed using a two-way repeated-measures ANOVA, with 2 within-subject variables (midsole density x speed). Where significance was found, Sidak’s post-hoc multiple comparison testing was performed. Linear regression was also used to examine the relationship between normalised in vitro properties and specific in vivo metrics.
All statistics were performed using GraphPad Prism V 8.4 (GraphPad Software, San Diego, CA, USA), with significance set at p < 0.05. The strength of linear relationships was classified using Cohen’s system [51].
3. Results
3.1. In Vitro Results
Impact testing was conducted under standardised work inputs, with slab foam tested between 2.95 and 3.09 J and shoe condition at 5.56–5.83 J. Table 2A presents the test control parameters, while Table 2B presents the normalised outcome variables for both the slab and shoe conditions across the three foam densities. Linear regression analysis revealed strong positive relationships between foam density and impact-related variables normalised to energy input, and strong negative relationships between foam density and time-domain variables normalised to deformation (Table 2B). The resultant LBS at 50° were 7.7 ± 0.3, 7.6 ± 0.3, and 5.0 ± 0.8 N∙m for midsole densities of 0.164, 0.147, and 0.122, respectively.
Table 2.
(A) Impact test control parameters for foam slab and shoes across foam densities (ρ). (B) Impact test outputs for foam slab and shoes across foam densities (ρ). All outcome measures are normalised to total impact energy (J) and total deformation (mm) to enable direct comparison between slab and shoe conditions.
3.2. In Vivo Results
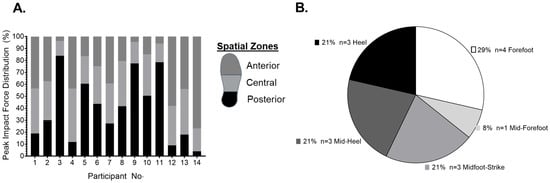
Data were analysed from a mean of 147 ± 4 right foot steps per participant. There was no speed x density interaction (F(4,117) = 0.559, p = 0.693) or main effect for density (F(2,117) = 0.119, p = 0.888) on the number of steps taken. There was a main effect for speed (F(4,117) = 6.436, p = 0.002) where post hoc testing revealed a greater number of steps during the 16 km∙h−1 trials compared to 12 km∙h−1 (151 ± 3 vs. 143 ± 1, p = 0.001) but not 14 km∙h−1 (147 ± 1). Participants’ foot-strike patterns were classified, with no speed x density interaction (F(4,52) = 0.874, p = 0.486) or main effects for speed (F(2,26) = 1.814, p = 0.183) or density (F(2,26) = 1.315, p = 0.286). Exemplary data is presented in Figure 3A,B for 14 km∙h−1.
Figure 3.
Participant strike pattern characteristics during treadmill running at 14 km∙h−1, shown as follows: (A) spatial zone distribution and (B) participant strike pattern classification.
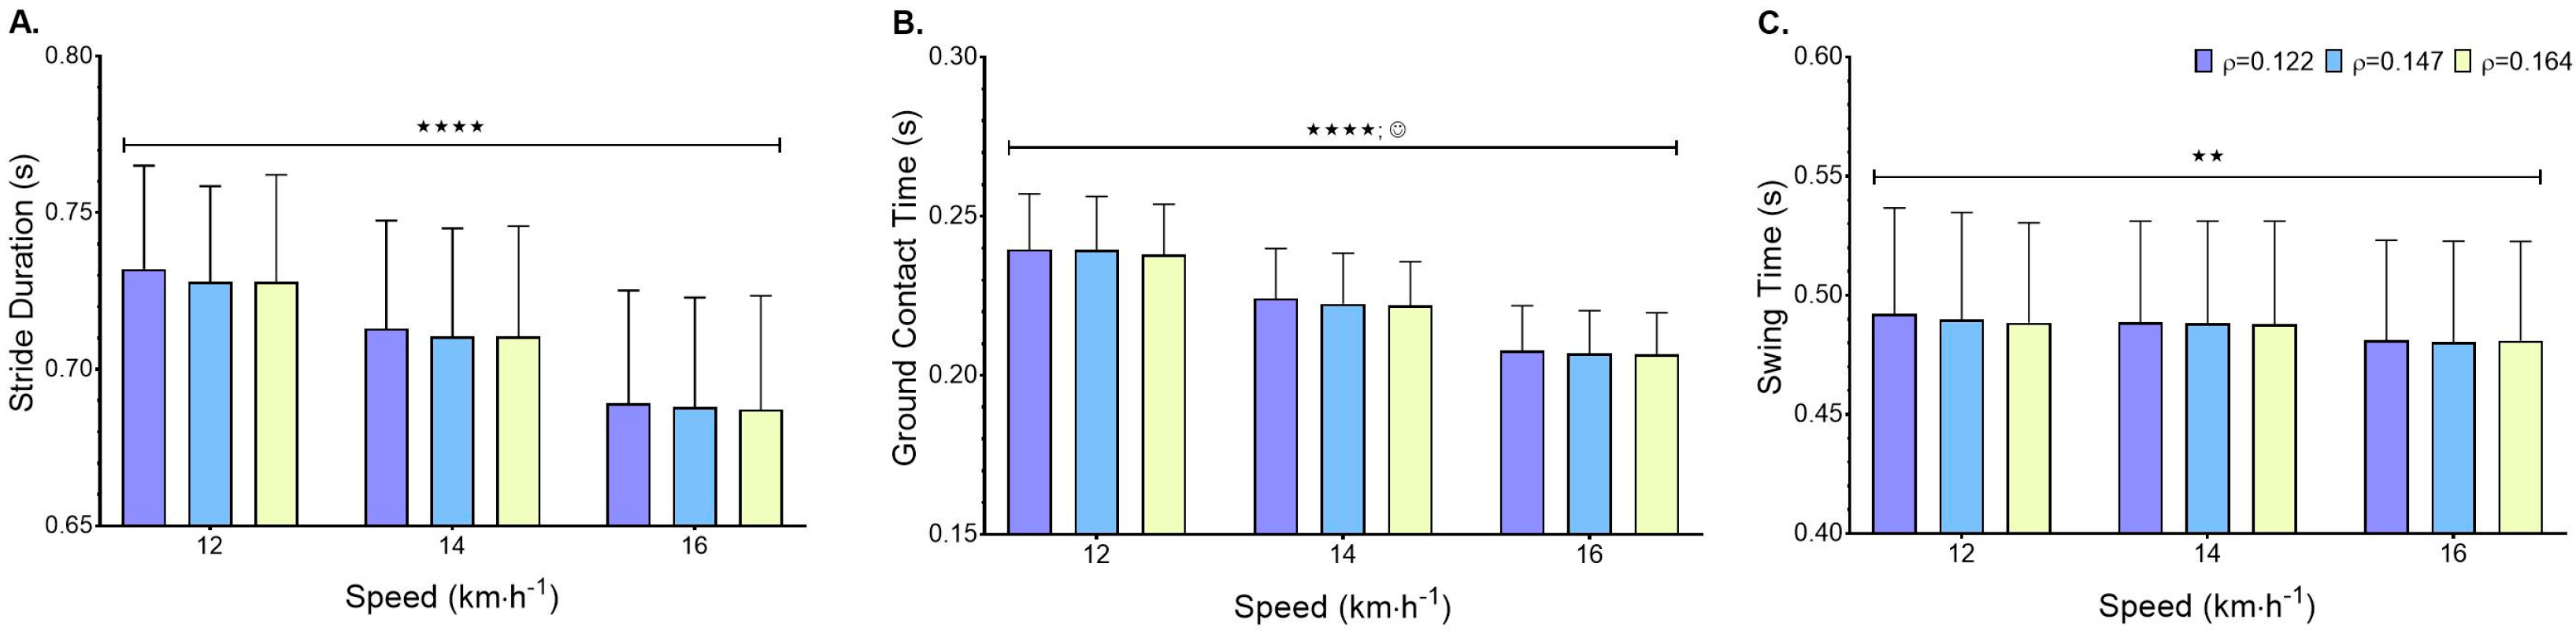
In the absence of strike pattern changes, stride and step spatiotemporal variables were analysed (Figure 4). Two-Way ANOVA identified no significant speed x density interactions for stride duration (F(2,26) = 0.806, p = 0.527), ground contact time (F(2,26) = 1.722, p = 0.159), or swing time (F(2,26) = 1.282, p = 0.289). All time components decreased with increasing speed, as presented in Figure 4. Ground contact time differed across midsole densities (F(2,26) = 3.611, p = 0.041, Figure 4B). Post hoc analysis revealed slightly shorter contact time for ρ = 0.164 compared to ρ = 0.122 (0.222 ± 0.016 vs. 0.224 ± 0.016, p = 0.041), averaged across all speed conditions.
Figure 4.
Mean ± SD spatiotemporal variables across three foam densities and running speeds: (A) stride duration (s); (B) ground contact time (s); and (C) swing time (s), where the main effect for speed is indicated by ★ (p < 0.0001 ★★★★ and p < 0.01 ★★), and main effects for density (p < 0.05) are indicated by  .
.
The relationship between ground contact time during running at the three different speeds and Dwell-t during in vitro testing across the three foam densities produced r2 values of 0.420, 0.995, and 0.979 for 12, 14, and 16 km∙h−1, respectively.
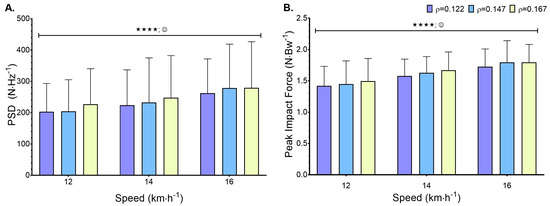
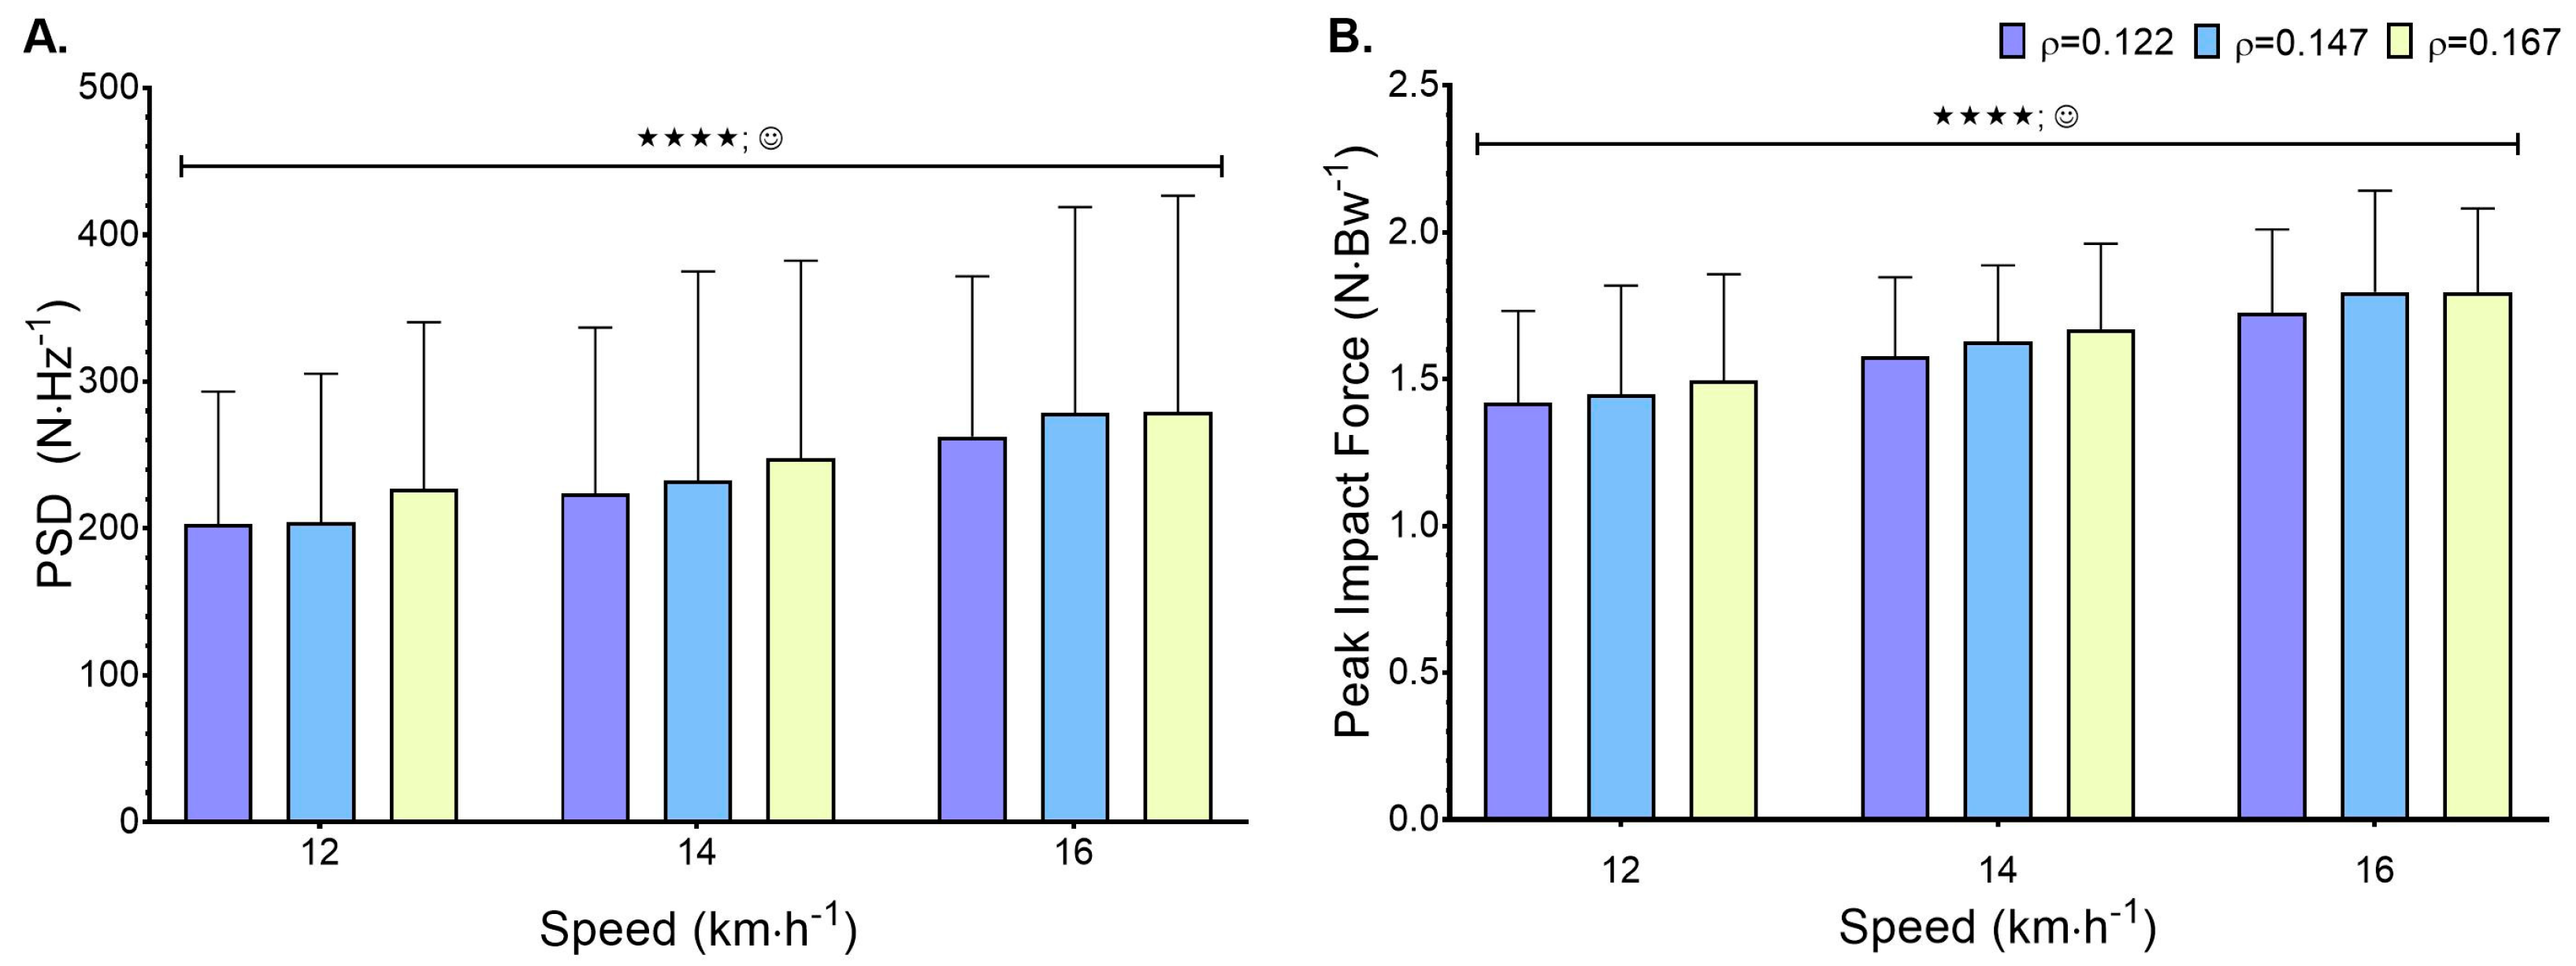
Spatially resolved, body weight-normalised PSD analysis of the high-frequency impact force component revealed no speed x density interaction (F(4,52) = 1.325, p = 0.273). Impact increased with running speed (F(2,26) = 16.74, p < 0.0001, Figure 5A) and increased midsole density (F(2,26) = 3.57, p = 0.043, Figure 5A). Post hoc analysis identified a higher-frequency PSD for ρ = 0.164 compared to ρ = 0.122 (252 ± 26 vs. 230 ± 30 N∙Hz−1, p = 0.034), averaged for all speed conditions. Likewise, spatially resolved impact force data supported these findings, with no interaction (F(4,52) = 0.41, p = 0.801), but significant main effects for speed (F(2,26) = 13.39, p = 0.0001, Figure 5B) and density (F(2,26) = 4.028, p = 0.030, Figure 5B). Post hoc analysis identified a difference between ρ = 0.164 and ρ = 0.122 (1.65 ± 0.15 vs. 1.57 ± 0.15 N∙Bw−1, p = 0.025), averaged across all speed conditions. Interestingly, total vertical peak impact force presented a similar level of difference for the main effect of speed (F(2,26) = 68.2, p < 0.0001), but there were no differences between midsole densities (F(2,26) = 1.55, p = 0.232).
Figure 5.
Mean ± SD spatially resolved plantar impact forces, normalised to body weight for each density and running speed condition. (A) High-frequency (>10 Hz) PSD component and (B) peak impact force, where the main effect for speed is indicated by ★★★★ (p < 0.0001), and the main effect for density (p < 0.05) is indicated by .
.
The relationship between in vitro Peak G of the different density foams and the normalised high-frequency component of the PSD produced strong r2 values of 0.625, 0.908, and 0.728 for running speeds 12, 14, and 16 km∙h−1, respectively. Similarly, the relationship between maximum deformation and the normalised high-frequency component of the PSD produced r2 values of 0.510, 0.831, and 0.620 for 12, 14, and 16 km∙h−1, respectively.
Overall ROM during the impact phase revealed no speed x density interaction (F(4,52) = 1.432, p = 0.238), but there was an increase in dorsiflexion ROM with increased speed during the initial stance phase (F(2,26) = 21, p < 0.0001, Table 3). The effect of midsole density on dorsiflexion ROM was non-significant (F(2,26) = 2.462, p = 0.107, Table 3). Knee flexion during the impact loading of the stance phase showed no interaction (F(4,52) = 1.081, p = 0.376), nor any significant main effects for speed (F(2,26) = 2.143, p = 0.139, η2p = 0.13, Table 3) or density (F(2,26) = 0.996, p = 0.384, Table 3).
Table 3.
Mean ± SD for joint kinematics during treadmill running at 12, 14, and 16 km∙h−1 across midsole densities.
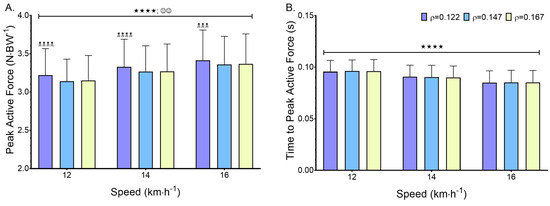
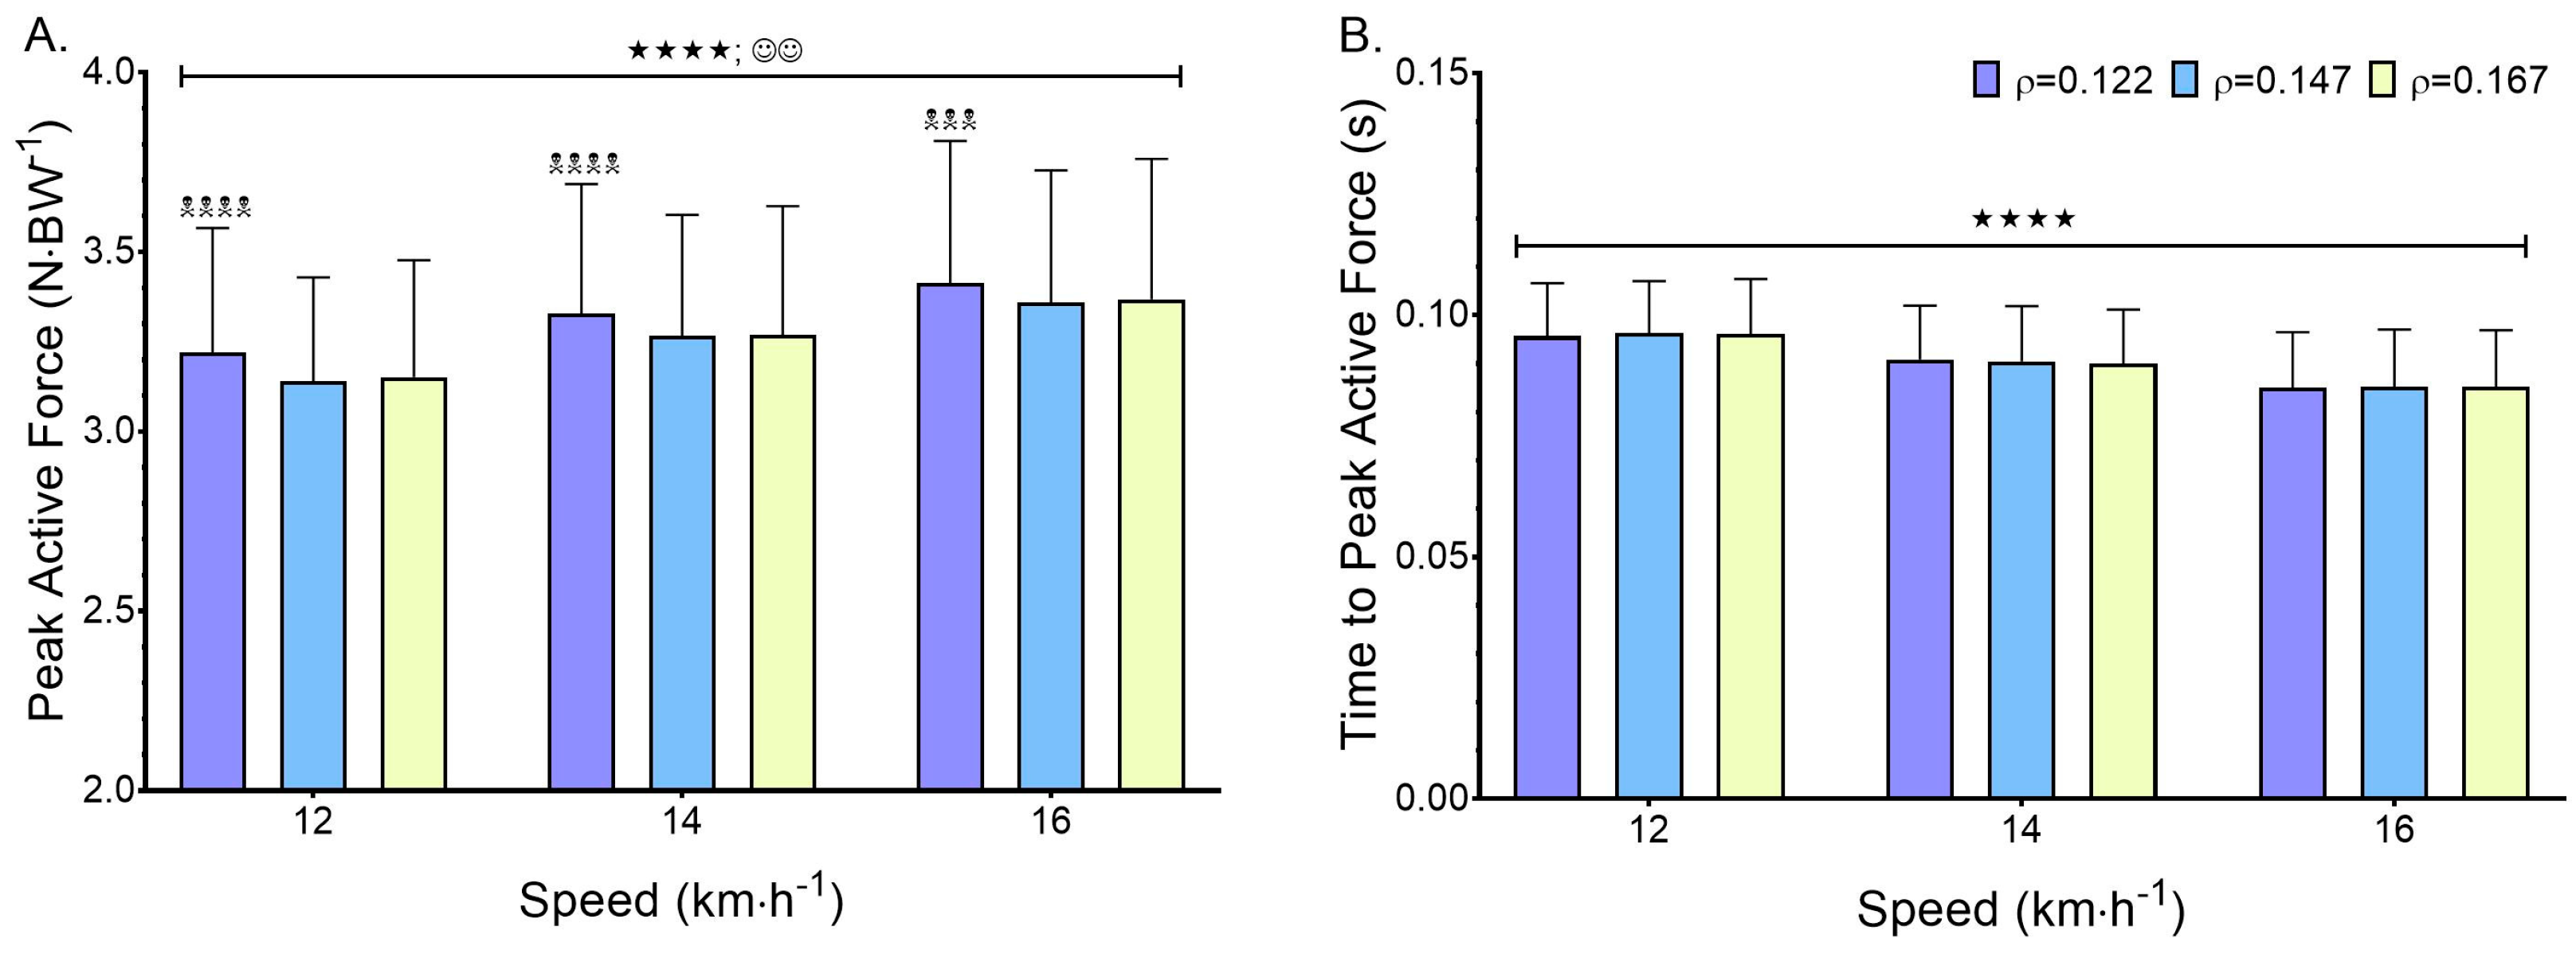
Active peak force during the propulsion phase of running showed no speed x density interaction (F(4,52) = 1.122, p = 0.356). However, active peak force increased significantly with running speed (F(2,26) = 39.6, p < 0.0001) and with decreasing midsole density (F(2,26) = 7.399, p = 0.003, Figure 6A). Post hoc idenitified increased active peak force for ρ = 0.122 when compared to ρ = 0.147 and ρ = 0.164 at 12 km∙h−1 (3.22 ± 0.35 vs. 3.14 ± 0.29 and 3.15 ± 0.33 N∙Bw−1, p < 0.0001), 14 km∙h−1 (3.33 ± 0.36 vs. 3.27 ± 0.34 and 3.27 ± 0.36 N∙Bw−1, p < 0.0001), and 16 km∙h−1 (3.41 ± 0.40 vs. 3.36 ± 0.37 and 3.37 ± 0.39 N∙Bw−1, p < 0.001), respectively.
Figure 6.
Mean ± SD data for the following: (A) active peak force and (B) time to active peak force, for each speed and density condition. Here, main effects for speed are indicated by ★★★★ (p < 0.0001), main effects for density (p < 0.01) are indicated by  , and post hoc differences in density (ρ = 0.122 vs. ρ = 0.164 and 0.147) within the same speed are indicated by
 (p < 0.0001) and
 (p < 0.001).
, and post hoc differences in density (ρ = 0.122 vs. ρ = 0.164 and 0.147) within the same speed are indicated by (p < 0.0001) and (p < 0.001).
The relationship between in vitro energy return (%) of the different density foams and the active peak force during running was very strong, producing r2 values of 0.901, 0.960, and 0.887 for speeds of 12, 14, and 16 km∙h−1, respectively.
Time to active peak force showed no speed x density interaction (F(4,52) = 0.829, p = 0.513) and no main effect of midsole density (F(2,26) = 0.126, p = 0.882). However, there was a significant main effect of speed (F(2,26) = 52.4, p < 0.0001, Figure 6B) where time decreased as speed increased.
Joint ROM during the propulsive phase of stance showed no speed x density interaction for ankle plantarflexion ROM (F(4,52) = 1.642, p = 0.179), knee extension ROM (F(4,52) = 1.081, p = 0.736), or hip extension ROM (F(4,52) = 1.331, p = 0.272). However, there was a main effect of speed for all three joints: plantarflexion ROM increased with speed (F(2,26) = 23.58, p < 0.0001, Table 3), as did knee extension ROM (F(2,26) = 4.684, p = 0.019, Table 3), and hip extension ROM (F(2,26) = 144.1, p < 0.0001, Table 3). Post hoc analysis revealed greater ROM at 14 and 16 km∙h−1 compared to 12 km∙h−1 for both plantar flexion and knee extension. While hip extension was significantly greater across all speed comparisons (p < 0.0001). A significant main effect of midsole density was also observed for hip extension ROM (F(2,26) = 2.971, p = 0.070, Table 3), though post hoc comparisons did not reach significance.
4. Discussion
This study investigated the relationship between ATPU density (ρ = 0.164, 0.147, and 0.122) in both slab and in-shoe midsole configurations in relation to in vivo plantar forces during treadmill running at multiple speeds in geometrically identical shoes. The main findings revealed strong positive relationships between in vitro impact variables normalised to total impact energy and foam density, and strong negative relationships for time-domain variables normalised to deformation (mm) as density increased. Treadmill running at increasing speeds (12, 14, and 16 km∙h−1) generated progressive decreases in temporal variables while increasing impact and propulsion variables. Lower midsole density increased ground contact time across speeds, which related strongly to the in vitro Dwell-t. Spatially resolved high-frequency PSD and peak impact force both decreased with lower density across speeds and showed moderate–strong relationships with in vitro Peak G and maximum deformation. Additionally, reducing midsole density also increased active peak force across speeds, which was strongly related to in vitro energy return.
4.1. In Vitro Discussion
Mechanical testing assumes outputs are standardised in terms of test inputs. Table 2 (A) highlights small input differences for both the slab foam and shoe midsole, even though it was assumed they were controlled as per industry practice. This variability supports the need to normalise data to total impact energy or deformation, as presented in this study. Additionally, the inputs are considerably different for the two material forms without clear knowledge of how they relate.
Once normalised, strong relationships emerged between slab and shoe properties, and between foam densities (Table 2B). However, the intercept difference indicates that the same material can respond differently in each context, so caution is required when extrapolating inferences from one to the other. Further, with only three data points (i.e., densities), the regression model lacks sensitivity to detect small slope differences and could be overshadowed by the large intercept effect. This limitation is also reflected in the non-linear trend observed for compression set, where the highest-density foam (ρ = 0.164) exhibited the lowest value. Such behaviour likely reflects formulation-specific differences in polymer structure and processing that do not scale directly with bulk density. Future work is needed on a larger scale, incorporating detailed assessment of material microstructure and density, to clarify how slab foam properties translate to midsole energy-return characteristics and resultant in vivo responses.
Previously, TPU (ρ = 0.23 g∙cm−3) and PEBA (ρ = 0.09 g∙cm−3) were shown to be the best materials for energy absorption, yet no relationship between density and mechanical properties was present [26]. In contrast, the foams tested in this study showed strong density-dependent relationships for all mechanical test properties (Table 2B). These relationships are likely due to the use of the same material (ATPU), but very different densities between midsoles.
Foam science for running shoe midsoles has come a long way since the development of TPU foams [30], which were identified as super lightweight, low-density materials (0.24–0.26 g∙cm−3). However, PEBA foams consistently outperform EVA and TPU in every aspect [31], likely due to PEBA’s low density and the weaker cell walls of TPU [26]. The ATPU midsoles tested in this study have reduced those TPU densities by 53–57%, reaching ρ = 0.122 g∙cm−3, which falls within the range of low-density midsole foams examined in 2024, although not quite as low as the lightest PEBA formulations [26].
Comparison between studies regarding material properties is difficult due to the differences in test methodologies. However, some have used ASTM F1614 [38] and SATRA TM194 [40] with the same inputs as this study. The data presented in Table 2B highlights considerable enhancements in the mechanical properties of cushioning compared to everyday running shoes from 2016 using EVA [37] and the non-disclosed material categorised as soft via global stiffness index 65 N∙mm−1 [52] compared to the hardest shoes used in this study, which had a global stiffness of 46.6 N∙mm−1. The ATPU midsoles were, in fact, more comparable to advanced footwear (AFT) midsoles constructed from PEBA, TPE + EVA, and PEBA [53]. Peak accelerations ranged from 2.01 to 2.25 G∙J−1 in AFTs, versus 1.67–1.50 G∙J−1 in the ATPU tested here, indicating greater cushioning in the present study. However, the shoes in this study were designed as everyday running shoes, while AFTs are designed to be a race shoe with a stiff plate inserted into the midsole. This distinction is reflected in the LBS and energy return. The ATPU shoes (Figure 1) had an LBS ≥ 5 N∙m, consistent with high stack heights that promote forward rolling, assuming shape is maintained during running. The higher LBS values in the higher-density ATPU foams reflect a less compliant foam, whereas AFTs achieve high stiffness through very compliant foams combined with a stiff carbon plate [53]. Even with the higher LBS in the shoes with the less compliant foam, the energy return (Table 2) was not comparable to carbon-plated PEBA shoes, which returned 16.5–16.6%∙J−1. The lowest density ATPU midsole (ρ = 0.122, no plate) of this study returned 11.3%∙J−1, which was marginally the highest out of the shoes tested despite a considerably lower LBS. Interestingly, this was similar to the TPE + EVA AFT with a carbon-nylon plate [53], which returned 11.96%∙J−1 but weighed 25 g more than the ATPU (ρ = 0.112) tested here.
4.2. In Vivo Discussion
As running shoes are designed for a broad population, it is essential to employ analytical systems capable of handling a full spectrum of strike patterns and running speeds. Spatial zone analysis [23], applied throughout this work (Figure 3), provides such a framework. Each participant’s data were analysed over a mean of 147 ± 4 steps per speed condition, providing a robust and consistent dataset that strengthens reliability, typically lacking in shoe midsole research [27].
Most recreational runners use a rearfoot strike pattern [54,55] compared to elite runners [55], where forefoot strike patterns are more likely as speed increases [56]. The present data disagrees with the latter, as participants did not alter the strike pattern with speed. This may reflect running experience or capability, combined with the modest speed increments that were insufficient to alter treadmill running technique.
Footwear design can also alter strike patterns. Decreasing the heel-toe drop promotes a flatter strike pattern [57], while increased LBS causes a forward shift in plantar pressure [58]. The shoes used in this study (Figure 1) had a 6 mm drop, traditionally classified as low [59], and as a result of changes to density, the LBS consequently decreased with decreases in density. Despite this, strike patterns varied widely between participants, although most exhibited a midfoot strike (Figure 3), which may relate to the heel–toe drop [57]. Since shoe geometry was constant across speed and density conditions, the lack of strike-pattern variation within participants is unsurprising. Consequently, changes in dependent variables can be attributed to speed, midsole density, or joint kinematics rather than alterations in strike pattern.
In the first instance, increased speed led to a reduction in temporal gait variables (Figure 4), which is well supported biomechanically [1,6]. This reduction reflects the need to preserve momentum and match the forward velocity of the centre of mass [60], resulting in less time spent on the ground. Within this shortened contact period, runners compensate by increasing the angular velocity of lower limb segments, enabling stride length to increase despite the reduced time to absorb and generate force.
Although angular velocity for specific components of gait was not directly calculated in this dataset, the observed increase in ankle ROM during the impact phase, together with greater ROM for all lower limb joints during propulsion (Table 3), combined with significantly shorter phase durations (Figure 4), supports the conclusion that segmental angular velocity increased with speed. Additionally, both spatially resolved impact data (Figure 5A,B) and active peak force (Figure 6A) increased as previously shown [1], enabling participants to support the body weight and effectively rebound COM into the next step [61].
Increased midsole cushioning is expected to extend ground contact time following impact due to its deformation and subsequent reformation. However, previous research does not show this when comparing soft versus hard shoes at 10 km∙h−1 [62]. The in vivo data presented here support increased ground contact in the lowest density midsole across speeds, despite the in vitro Dwell-t, governed by both deformation rate and hysteresis, which was faster in the low-density (ρ = 0.122) shoe. As such, in vivo ground contact time is negatively related to the normalised in vitro rate of deformation. This suggests that the mechanical testing does not mimic the dynamics of human–shoe interaction when running [63]. Here, the longer ground contact times observed between the ρ = 0.164 and ρ = 0.122 reflect the interaction between runner mechanics and foam compliance, where the foam is loaded under impact and then again during the propulsive phase.
Further, the ~26% decrease in foam density (ρ = 0.164–0.122) produced a ~12% increase in deformation, a ~10% reduction in Peak G, and a ~25% reduction in stiffness. Taken together, these changes would be expected to alter impact attenuation when running. However, the previous literature has been somewhat equivocal regarding total vertical force variables [62], where no relationship between in vitro and in vivo has been shown. More promising is the work employing frequency analysis [15]. Although the PSD was not spatially resolved in that study, the analysis was sufficient to tease out differences. However, it must be noted that stiffness differences between shoes were ~64%, much greater than those used in this study (~25%). In contrast, the results presented in this study use spatially resolved frequency PSD analysis [23], based on criteria provided in Figure 2B, in order to prevent any masking effect of forces not relevant to initial impact [15]. The combination of ATPU microcellular structure, material properties, and individual running techniques produced a significant spatial high-frequency PSD decrease of ~8.7% averaged across speeds (Figure 5A). Interestingly, when comparing this to spatially resolved peak impact force, the difference between the highest and lowest density was smaller, at ~4.9% (Figure 5B). The reduction is likely a response to a low-frequency force component masking the effectiveness of the analysis [15]. Moreover, when analysing total vertical peak impact force, the decrease was only 1.1% and non-significant. A combination of masking due to non-related spatial and low-frequency force components [15,23]. Explanations for this small non-significant total vertical peak impact force have also centred around the ankle joint [16,64]. The ankle is more sensitive to changes in footwear, and softer shoes decrease dorsiflexion during running due to lower demand to attenuate impact force [16,64]. While ankle dorsiflexion ROM increased with speed in this study, there was no significant decrease in dorsiflexion as a result of a decreased midsole density. In this case, not enough to counter the attenuating effects of the midsole density.
Importantly, even though the differences between midsole foams tested were smaller than in previous research, the analysis was sensitive enough to quantitatively show a positive effect on impact attenuation. An effect that the traditional total force-based method failed to capture. However, this was not the case when post hoc comparison between ρ = 0.164 and ρ = 0.147 was performed, and where the direction and magnitude of differences in material properties varied (Table 2B). Clearly, the lack of in vivo differences can be attributed to the lack of in vitro differences. It is currently hard to explain why, but further investigation around the materials’ microstructure and the foaming process is warranted. Despite this, a strong relationship remained between the material properties of cushioning (maximum deformation and Peak G) and impact attenuation using spatially resolved PSD and impact force.
While not the primary aim of this study, the increase in active peak force and the lack of change in time to active peak force as a result of decreasing midsole density (Figure 6A) agree with some of the earliest work investigating shoe cushioning [65] and later studies investigating the effects of LBS on kinetics and running economy [66]. Previous work has also shown that midsole compression can influence Achilles tendon loading and energy storage [67], as well as strain in the plantar fascia [68], highlighting the potential relevance of active peak force to cumulative tissue loading. The lowest density (ρ = 0.122) shoe in this study had the greatest cushioning, consequently producing the lowest LBS in geometrically identical shoes and the highest active peak forces. While it has been suggested that this additional work is likely caused by increased activity at the ankle joint [16,65], there were no differences in plantar flexion ROM. Instead, participants increased hip extension (Table 3). This likely reflects a geometric necessity, as the foot remains on the treadmill for longer, the centre of mass travels further forward relative to the stance foot, mechanically requiring greater hip extension to maintain gait velocity. This proximal adjustment could also relate to subtle changes in stability when using lower-density foams, although this interpretation is speculative and beyond the scope of the present study. Future work needs to further investigate the response to increasing LBS through midsole foam density with respect to muscle activation, cumulative tissue loading, and metabolic expenditure.
5. Conclusions
The aim of this study is to investigate three densities of ATPU foam. Specifically, comparing in vitro mechanical properties with in vivo plantar force spectral characteristics derived from individualised pressure distributions during treadmill running at varied speeds. Comparison of foam slab and in-shoe midsole properties in vitro produced similar trends with regard to material properties. However, the magnitude of differences between intercepts means inferences of response cannot be assumed, and in vivo testing must occur to determine the shoe–human interaction response. In vivo spatially resolved PSD as a measure of impact attenuation aligns with in vitro findings, where decreasing midsole density from ρ = 0.164 to ρ = 0.122 decreased the high-frequency force component of the PSD by 8.9% compared to 1.1% for total vertical force, demonstrating that PSD provides greater sensitivity to mechanical differences even though the runner’s experience does not change. In this respect, there were strong relationships between material properties in vitro and in vivo. Furthermore, there was a negative effect of decreasing density on the active peak force across all speeds, likely due to a decrease in longitudinal bending stiffness, and this correlated negatively with in vitro energy return. Future work needs to confirm these findings in an outdoor setting on a road surface.
Author Contributions
Conceptualization, P.W.M.; methodology, P.W.M. and for actual in vitro testing, A.L. and B.I.; software, P.W.M., in vitro testing, A.L. and B.I.; formal analysis, P.W.M.; investigation, in vitro, A.L. and B.I., in vivo, P.W.M. and S.J.W.; resources, in vitro, A.L., in vivo, P.W.M.; data curation, P.W.M.; writing—original draft preparation, P.W.M.; writing—review overall, S.J.W., in vitro, A.L. and B.I.; visualisation, P.W.M.; project administration, in vitro, A.L., in vivo, P.W.M. All authors have read and agreed to the published version of the manuscript.
Funding
This research received no external funding.
Institutional Review Board Statement
The study was conducted in accordance with the Declaration of Helsinki and approved by the Ethics Committee of Massey University (OM1 24/44 approved 12 June 2025).
Informed Consent Statement
Informed consent was obtained from all subjects involved in the study.
Data Availability Statement
All data supporting the conclusions of this article are provided within the manuscript.
Acknowledgments
We would like to acknowledge the support of Altra Running for the provision of the shoes used within this research.
Conflicts of Interest
Two authors (A.L. and B.I.) are employed by Altra Running Company and contributed to the in vitro testing of the block-foam and midsole materials. In this respect, they were both involved in the study design from conception, designed the methodology, and produced specific shoe results. They did not perform any statistical analysis but were instrumental in reviewing the work.
References
- Hamill, J.; Bates, B.T.; Knutzen, K.M.; Sawhill, J.A. Variations in ground reaction force parameters at different running speeds. Hum. Mov. Sci. 1983, 2, 47–56. [Google Scholar] [CrossRef] [Scilit]
- Kyröläinen, H.; Belli, A.; Komi, P.V. Biomechanical factors affecting running economy. Med. Sci. Sports Exerc. 2001, 33, 1330–1337. [Google Scholar] [CrossRef] [Scilit] [PubMed]
- Folland, J.P.; Allen, S.J.; Black, M.I.; Handsaker, J.C.; Forrester, S.E. Running Technique is an Important Component of Running Economy and Performance. Med. Sci. Sports Exerc. 2017, 49, 1412–1423. [Google Scholar] [CrossRef] [Scilit]
- Tartaruga, M.P.; Brisswalter, J.; Peyré-Tartaruga, L.A.; Ávila, A.O.V.; Alberton, C.L.; Coertjens, M.; Cadore, E.L.; Tiggemann, C.L.; Silva, E.M.; Kruel, L.F.M. The Relationship Between Running Economy and Biomechanical Variables in Distance Runners. Res. Q. Exerc. Sport. 2012, 83, 367–375. [Google Scholar] [CrossRef]
- Nigg, B.M.; Liu, W. The effect of muscle stiffness and damping on simulated impact force peaks during running. J. Biomech. 1999, 32, 849–856. [Google Scholar] [CrossRef] [Scilit]
- Jahn, V.d.S.; Correia, C.K.; Dell’Antonio, E.; Mochizuki, L.; Ruschel, C. Biomechanics of shod and barefoot running: A literature review. Rev. Bras. Med. Esporte 2020, 26, 551–557. [Google Scholar] [CrossRef] [Scilit]
- Tessutti, V.; Ribeiro, A.P.; Trombini-Souza, F.; Sacco, I.C. Attenuation of foot pressure during running on four different surfaces: Asphalt, concrete, rubber, and natural grass. J. Sports Sci. 2012, 30, 1545–1550. [Google Scholar] [CrossRef] [Scilit]
- Ferris, D.P.; Liang, K.; Farley, C.T. Runners adjust leg stiffness for their first step on a new running surface. J. Biomech. 1999, 32, 787–794. [Google Scholar] [CrossRef] [Scilit]
- Worobets, J.; Wannop, J.W.; Tomaras, E.; Stefanyshyn, D. Softer and more resilient running shoe cushioning properties enhance running economy. Footwear Sci. 2014, 6, 147–153. [Google Scholar] [CrossRef] [Scilit]
- Nigg, B.M.; Bahlsen, H.A.; Luethi, S.M.; Stokes, S. The influence of running velocity and midsole hardness on external impact forces in heel-toe running. J. Biomech. 1987, 20, 951–959. [Google Scholar] [CrossRef] [Scilit]
- Kulmala, J.-P.; Kosonen, J.; Nurminen, J.; Avela, J. Running in highly cushioned shoes increases leg stiffness and amplifies impact loading. Sci. Rep. 2018, 8, 17496. [Google Scholar] [CrossRef] [Scilit] [PubMed]
- Hannigan, J.J.; Pollard, C.D. Differences in running biomechanics between a maximal, traditional, and minimal running shoe. J. Sci. Med. Sport. 2020, 23, 15–19. [Google Scholar] [CrossRef] [Scilit]
- Stoneham, R.; Barry, G.; Saxby, L.; Waters, L.; Wilkinson, M. Differences in stride length and lower limb moments of recreational runners during over-ground running while barefoot, in minimalist and in maximalist running shoes. Footwear Sci. 2021, 13, 133–141. [Google Scholar] [CrossRef] [Scilit]
- Huang, J. Effects of the material of running shoes on biomechanical characteristics during running. Mech. Adv. Mater. Struct. 2019, 26, 2017–2022. [Google Scholar] [CrossRef] [Scilit]
- Shorten, M.; Mientjes, M.I.V. The ‘heel impact’ force peak during running is neither ‘heel’ nor ‘impact’ and does not quantify shoe cushioning effects. Footwear Sci. 2011, 3, 41–58. [Google Scholar] [CrossRef] [Scilit]
- Baltich, J.; Maurer, C.; Nigg, B.M. Increased Vertical Impact Forces and Altered Running Mechanics with Softer Midsole Shoes. PLoS ONE 2015, 10, e0125196. [Google Scholar] [CrossRef] [Scilit]
- Stefanyshyn, D.J.; Nigg, B.M. Mechanical energy contribution of the metatarsophalangeal joint to running and sprinting. J. Biomech. 1997, 30, 1081–1085. [Google Scholar] [CrossRef] [Scilit] [PubMed]
- Miyazaki, T.; Aimi, T.; Yamada, Y.; Nakamura, Y. Interaction of running shoe midsole hardness and bending stiffness on the lower-limb joints mechanics. Footwear Sci. 2023, 15, S35–S36. [Google Scholar] [CrossRef] [Scilit]
- Hamill, J.; Bates, B.T. Biomechanics and footwear research 1970–2000. Footwear Sci. 2023, 15, 123–131. [Google Scholar] [CrossRef] [Scilit]
- Chang, B.P.; Kashcheev, A.; Veksha, A.; Lisak, G.; Goei, R.; Leong, K.F.; Tok, A.l.Y.; Lipik, V. Enhancing dynamic energy return and performance of running shoes: Replacing talc with multi-walled carbon nanotubes derived from plastic wastes in midsole foam. Appl. Mater. Today 2024, 36, 102016. [Google Scholar] [CrossRef] [Scilit]
- Kram, R. Ergogenic distance running shoes: How do we think they work and how can we understand them better? Footwear Sci. 2022, 14, 139–146. [Google Scholar] [CrossRef] [Scilit]
- Uddin, K.Z.; Nguyen, H.A.; Nguyen, T.T.; Trkov, M.; Youssef, G.; Koohbor, B. In-plane density gradation of shoe midsoles for optimal energy absorption performance. Proc. Inst. Mech. Eng. Part P J. Sports Eng. Technol. 2024, 17543371241272843. [Google Scholar] [CrossRef] [Scilit]
- Macdermid, P.W.; Walker, S.J. Spectral and Spatial Analysis of Plantar Force Distributions Across Foot-Strike Patterns During Treadmill Running. Appl. Sci. 2025, 15, 8709. [Google Scholar] [CrossRef] [Scilit]
- Shorten, M.R. Energy return in footwear–revisited. Footwear Sci. 2024, 16, 149–162. [Google Scholar] [CrossRef] [Scilit]
- Nishiwaki, T.; Tateishi, J. Basic research on midsole material designing. Footwear Sci. 2011, 3, S122–S123. [Google Scholar] [CrossRef] [Scilit]
- Aimar, C.; Orgéas, L.; Rolland du Roscoat, S.; Bailly, L.; Ferré Sentis, D. Compression fatigue of elastomeric foams used in midsoles of running shoes. Footwear Sci. 2024, 16, 93–103. [Google Scholar] [CrossRef] [Scilit]
- Oliveira, A.S.; Pirscoveanu, C.I. Implications of sample size and acquired number of steps to investigate running biomechanics. Sci. Rep. 2021, 11, 3083. [Google Scholar] [CrossRef] [Scilit]
- Ates, M.; Karadag, S.; Eker, A.A.; Eker, B. Polyurethane foam materials and their industrial applications. Polym. Int. 2022, 71, 1157–1163. [Google Scholar] [CrossRef] [Scilit]
- Kim, H.; Lee, K.J. Post-crosslinkable thermoplastic polyurethane for control of mechanical properties after processes. Polymer 2021, 236, 124350. [Google Scholar] [CrossRef] [Scilit]
- Sawai, M.; Miyamoto, K.; Takemura, K.; Mori, M.; Kiuchi, K. Super Low Density Polyurethane Systems for Sports Shoes. J. Cell. Plast. 2000, 36, 286–293. [Google Scholar] [CrossRef] [Scilit]
- Hoogkamer, W.; Kipp, S.; Frank, J.H.; Farina, E.M.; Luo, G.; Kram, R. A Comparison of the Energetic Cost of Running in Marathon Racing Shoes. Sports Med. 2018, 48, 1009–1019. [Google Scholar] [CrossRef] [Scilit]
- ASTM D3574; Standard Test Methods for Flexible Cellular Materials–Slab, Bonded, and Molded Urethan Foams: Designation. ASTM International: West Conshohocken, PA, USA, 2017.
- ASTM D2240; Standard Test Method for Rubber Property–Durometer Hardness: Designation. ASTM International: West Conshohocken, PA, USA, 2021.
- ASTM D2632; Standard Test Method for Rubber Property–Resilience by Vertical Rebound: Designation. ASTM International: West Conshohocken, PA, USA, 2024.
- ASTM D412; Standard Test Methods for Vulcanized Rubber and Thermoplastic Elastomer–Tension: Designation. ASTM International: West Conshohocken, PA, USA, 2021.
- Frederick, E.C.; Slavtcheff, N.; Sterzing, T.; Isherwood, J. A method for reliable measurement of heel-to-toe offset in sports footwear. Footwear Sci. 2021, 13, S29–S30. [Google Scholar] [CrossRef] [Scilit]
- Eckelt, M.; Mally, F. Running Shoes—Possible Correlations of Biomechanical and Material Tests. Proceedings 2020, 49, 25. [Google Scholar] [CrossRef] [Scilit]
- ASTM F1614-99(2006); Standard Test Method for Shock Attenuating Properties of Materials Systems for Athletic Footwear: Designation. ASTM International: West Conshohocken, PA, USA, 2006.
- ASTM F1976-13; Standard Test Method for Impact Attenuation of Athletic Shoe Cushioning Systems and Materials: Designation. ASTM International: West Conshohocken, PA, USA, 2013.
- TM194; Longitudinal Stiffness of Footwear. SATRA Technology Centre: Kettering, UK, 2004.
- Niswander, W.; Wang, W.; Kontson, K. Optimization of IMU Sensor Placement for the Measurement of Lower Limb Joint Kinematics. Sensors 2020, 20, 5993. [Google Scholar] [CrossRef] [Scilit]
- Nüesch, C.; Roos, E.; Pagenstert, G.; Mündermann, A. Measuring joint kinematics of treadmill walking and running: Comparison between an inertial sensor based system and a camera-based system. J. Biomech. 2017, 57, 32–38. [Google Scholar] [CrossRef] [Scilit] [PubMed]
- Wolski, L.; Halaki, M.; Hiller, C.E.; Pappas, E.; Fong Yan, A. Validity of an Inertial Measurement Unit System to Measure Lower Limb Kinematics at Point of Contact during Incremental High-Speed Running. Sensors 2024, 24, 5718. [Google Scholar] [CrossRef] [Scilit]
- Arampatzis, A.; Brüggemann, G.-P.; Metzler, V. The effect of speed on leg stiffness and joint kinetics in human running. J. Biomech. 1999, 32, 1349–1353. [Google Scholar] [CrossRef] [Scilit]
- Burns, G.T.; Joubert, D.P. Running Shoes of the Postmodern Footwear Era: A Narrative Overview of Advanced Footwear Technology. Int. J. Sports Physiol. Perform. 2024, 19, 975–986. [Google Scholar] [CrossRef] [Scilit]
- Macdermid, P.W.; Walker, S.J.; Cochrane, D. The Effects of Cushioning Properties on Parameters of Gait in Habituated Females While Walking and Running. Appl. Sci. 2025, 15, 1120. [Google Scholar] [CrossRef] [Scilit]
- Melvin, J.M.A.; Preece, S.; Nester, C.J.; Howard, D. An investigation into plantar pressure measurement protocols for footwear research. Gait Posture 2014, 40, 682–687. [Google Scholar] [CrossRef] [Scilit]
- Strohrmann, C.; Harms, H.; Kappeler-Setz, C.; Troster, G. Monitoring kinematic changes with fatigue in running using body-worn sensors. IEEE Trans. Inf. Technol. Biomed. 2012, 16, 983–990. [Google Scholar] [CrossRef] [Scilit]
- Mercer, J.; Bates, B.; Dufek, J.; Hreljac, A. Characteristics of shock attenuation during fatigued running. J. Sports Sci. 2003, 21, 911–919. [Google Scholar] [CrossRef] [Scilit]
- Mo, S.; Lam, W.-K.; Ching, E.C.K.; Chan, Z.Y.S.; Zhang, J.H.; Cheung, R.T.H. Effects of heel-toe drop on running biomechanics and perceived comfort of rearfoot strikers in standard cushioned running shoes. Footwear Sci. 2020, 12, 91–99. [Google Scholar] [CrossRef] [Scilit]
- Cohen, J. Statistical Power Analysis for the Behavioral Sciences, 2nd ed.; Lawrence Erlbaum Associates: Hillsdale, NJ, USA, 1988. [Google Scholar]
- Malisoux, L.; Delattre, N.; Meyer, C.; Gette, P.; Urhausen, A.; Theisen, D. Effect of shoe cushioning on landing impact forces and spatiotemporal parameters during running: Results from a randomized trial including 800+ recreational runners. Eur. J. Sport. Sci. 2021, 21, 985–993. [Google Scholar] [CrossRef] [Scilit]
- Isherwood, J.; Woo, S.; Cho, M.; Cha, M.; Park, S.; Kim, S.; Han, S.; Jun, J.; Sung, N.; Sterzing, T. Advanced footwear technology and its impacts on running mechanics, running economy and perception of male and female recreational runners. Footwear Sci. 2024, 16, 179–189. [Google Scholar] [CrossRef] [Scilit]
- Hasegawa, H.; Yamauchi, T.; Kraemer, W.J. Foot strike patterns of runners at the 15-km point during an elite-level half marathon. J. Strength. Cond. Res. 2007, 21, 888. [Google Scholar] [PubMed]
- Kasmer, M.E.; Liu, X.-c.; Roberts, K.G.; Valadao, J.M. Foot-Strike Pattern and Performance in a Marathon. Int. J. Sports Physiol. Perform. 2013, 8, 286–292. [Google Scholar] [CrossRef] [Scilit]
- Cheung, R.T.H.; Wong, R.Y.L.; Chung, T.K.W.; Choi, R.T.; Leung, W.W.Y.; Shek, D.H.Y. Relationship between foot strike pattern, running speed, and footwear condition in recreational distance runners. Sports Biomech. 2017, 16, 238–247. [Google Scholar] [CrossRef] [Scilit]
- Horvais, N.; Samozino, P. Effect of midsole geometry on foot-strike pattern and running kinematics. Footwear Sci. 2013, 5, 81–89. [Google Scholar] [CrossRef] [Scilit]
- van Kouwenhove, L.; Verkerke, G.J.; Postema, K.; Dekker, R.; Hijmans, J.M. Effect of different forefoot rocker radii on lower-limb joint biomechanics in healthy individuals. Gait Posture 2021, 86, 150–156. [Google Scholar] [CrossRef] [Scilit]
- Malisoux, L.; Chambon, N.; Urhausen, A.; Theisen, D. Influence of the Heel-to-Toe Drop of Standard Cushioned Running Shoes on Injury Risk in Leisure-Time Runners:A Randomized Controlled Trial With 6-Month Follow-up. Am. J. Sports Med. 2016, 44, 2933–2940. [Google Scholar] [CrossRef] [Scilit] [PubMed]
- van Oeveren, B.T.; de Ruiter, C.J.; Beek, P.J.; van Dieën, J.H. The biomechanics of running and running styles: A synthesis. Sports Biomech. 2024, 23, 516–554. [Google Scholar] [CrossRef] [Scilit]
- Clark, K.P.; Meng, C.R.; Stearne, D.J. ‘Whip from the hip’: Thigh angular motion, ground contact mechanics, and running speed. Biol. Open 2020, 9, bio053546. [Google Scholar] [CrossRef] [Scilit] [PubMed]
- Malisoux, L.; Gette, P.; Backes, A.; Delattre, N.; Theisen, D. Lower impact forces but greater burden for the musculoskeletal system in running shoes with greater cushioning stiffness. Eur. J. Sport. Sci. 2023, 23, 210–220. [Google Scholar] [CrossRef] [Scilit] [PubMed]
- Nguyen, T.; Do, T.; Lau, M.; Phee, S. Modelling, design, and control of a robotic running foot for footwear testing with flexible actuator. In Proceedings of the the 1th International Conference in Sports Science & Technology (ICSST), Singapore, 12–13 December 2014; pp. 505–514. [Google Scholar]
- Hardin, E.C.; Van Den Bogert, A.J.; Hamill, J. Kinematic adaptations during running: Effects of footwear, surface, and duration. Med. Sci. Sports Exerc. 2004, 36, 838–844. [Google Scholar] [CrossRef] [Scilit]
- Clarke, T.E.; Frederick, E.C.; Cooper, L.B. Effects of Shoe Cushioning Upon Ground Reaction Forces in Running. Int. J. Sports Med. 1983, 4, 247–251. [Google Scholar] [CrossRef] [Scilit]
- Day, E.; Hahn, M. Optimal footwear longitudinal bending stiffness to improve running economy is speed dependent. Footwear Sci. 2020, 12, 3–13. [Google Scholar] [CrossRef] [Scilit]
- Esposito, M.; Wannop, J.W.; Stefanyshyn, D.J. Effects of midsole cushioning stiffness on Achilles tendon stretch during running. Sci. Rep. 2022, 12, 4193. [Google Scholar] [CrossRef] [Scilit]
- Zhu, X.; Liu, J.; Liu, H.; Liu, J.; Yang, Y.; Wang, H. Effects of Midsole Hardness on the Mechanical Response Characteristics of the Plantar Fascia during Running. Bioengineering 2023, 10, 533. [Google Scholar] [CrossRef] [Scilit]

Disclaimer/Publisher’s Note: The statements, opinions and data contained in all publications are solely those of the individual author(s) and contributor(s) and not of MDPI and/or the editor(s). MDPI and/or the editor(s) disclaim responsibility for any injury to people or property resulting from any ideas, methods, instructions or products referred to in the content. |
© 2026 by the authors. Licensee MDPI, Basel, Switzerland. This article is an open access article distributed under the terms and conditions of the Creative Commons Attribution (CC BY) license.