


Abstract
This study introduced Softball Pitching Plane (SPP), a best-fit geometric plane designed to characterize the throwing arm spatial trajectory during the windmill softball pitch. The purpose was to evaluate the reliability of this planar representation and determine whether deviations from the SPP were associated with ball velocity. Forty-nine adolescent softball pitchers each performed 15 drop-ball pitches (735 total pitches). Kinematics were recorded using a 15-sensor electromagnetic tracking system. A weighted orthogonal least-squares algorithm was applied to compute the best-fit plane across three intervals (WU–BR, TOP–BR, and DS–BR). Reliability was assessed using within-subject variability, leave-one-trial-out error, and ICCs. Linear mixed-effects models were used to examine associations between SPP parameters and ball velocity. The downswing–ball release interval of the wrist trajectory showed the most stable planar pattern (RMS = 0.053 m). SPP parameters demonstrated high reliability (CV ≤ 4.2%; ICC = 0.81–0.90). RMS deviation negatively predicted ball velocity at both within-pitcher (−0.11 km·h−1 per cm, p = 0.003) and between-pitcher levels (−0.40 km·h−1 per cm, p = 0.03). These findings indicate that, in adolescent softball pitchers, the SPP provides a reliable geometric description of throwing-arm motion during the downswing–ball release phase, with reduced deviation associated with higher pitch velocity.
1. Introduction
Softball windmill motion relies on a proximal-to-distal kinetic chain to transfer momentum efficiently to the distal segments [1,2]. For this transfer to be effective, momentum must be directed consistently toward the intended path of the distal limb. Liu et al. (2025) demonstrated that this directional energy transfer aligns with the primary rotational axes of pitching [1,3]. Building on this perspective, a best-fit motion plane may capture the dominant spatial direction of energy flow. Given that windmill pitching follows a similar proximal-to-distal sequencing pattern, energy is likely transmitted through the arm to the ball. Therefore, it remains an open question whether the arm motion during windmill pitching can be adequately described by a constrained, near-planar trajectory.
Planar analyses have been applied in other sports, such as the golf swing [4,5,6], to characterize upper-extremity kinematics. The golf downswing has been described as a predominantly planar motion, and conceptually, this planar trajectory may share kinematic features with the arm path observed in the windmill pitching motion. Importantly, the assumption of planar motion may be challenged by the inherently three-dimensional nature of glenohumeral joint kinematics, as well as by inter-individual variability in pitching styles and coordination strategies. These factors may introduce off-plane motion that limits the extent to which a single plane can fully characterize the arm path. As such, any planar representation should be viewed as an approximation whose validity must be empirically evaluated rather than assumed. Conventionally, kinematic analyses typically focus on joint angles or segment orientations at specific time points, primarily aiming to improve performance and reduce upper extremity injury [7,8,9,10,11]. The windmill arm path appears to follow a largely near-planar pattern, suggesting that a best-fit plane can provide a concise and interpretable geometric description of the motion. Since the orientation and stability of this plane may reflect mechanical efficiency and relate to ball velocity, an objective and coordinate-independent fitting method is required [12,13,14]. The orthogonal least-squares methods satisfy this requirement by minimizing the perpendicular distance of all trajectory points to the fitted plane, yielding a mathematically optimal representation of the arm path. This approach offers a simplified and uniform framework for characterizing individual movement strategies and enhancing competition performance.
This raises a fundamental question: Does a single optimally fitted plane adequately characterize the arm motion in windmill pitching? Accordingly, this study aimed to develop the Softball Pitching Plane (SPP) and assess its reliability and its relationship to ball velocity. It was hypothesized that (1) the derived pitching plane would demonstrate good-to-excellent intra- and inter-trial reliability, consistent with established benchmarks for kinematic measures, and (2) greater deviation from the plane would be associated with meaningful reductions in ball velocity at both the within- and between-pitcher levels.
2. Materials and Methods
Forty-nine junior high and high school softball pitchers were recruited to participate (height: 1.68 ± 0.05 m; mass: 65.59 ± 11.08 kg; age: 14.74 ± 1.12 y; ball velocity: 78.11 ± 3.52 km/h). Participants were required to have a minimum of three years of competitive softball pitching experience for inclusion. Participants were excluded from the study if they experienced an injury in the past year, and/or if any pain was present when pitching. The study was approved by the Auburn Board, and parental consent as well as minor assent were obtained prior to participation. A priori power analysis was not performed because the primary analyses employed linear mixed-effects models with repeated observations at both the pitch and pitcher levels, for which traditional power calculations are not straightforward. The sample size is comparable to prior biomechanical studies using random-effects modeling.
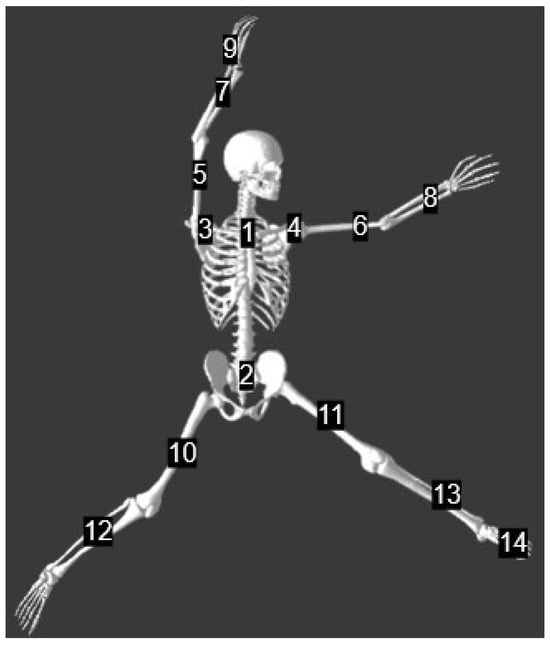
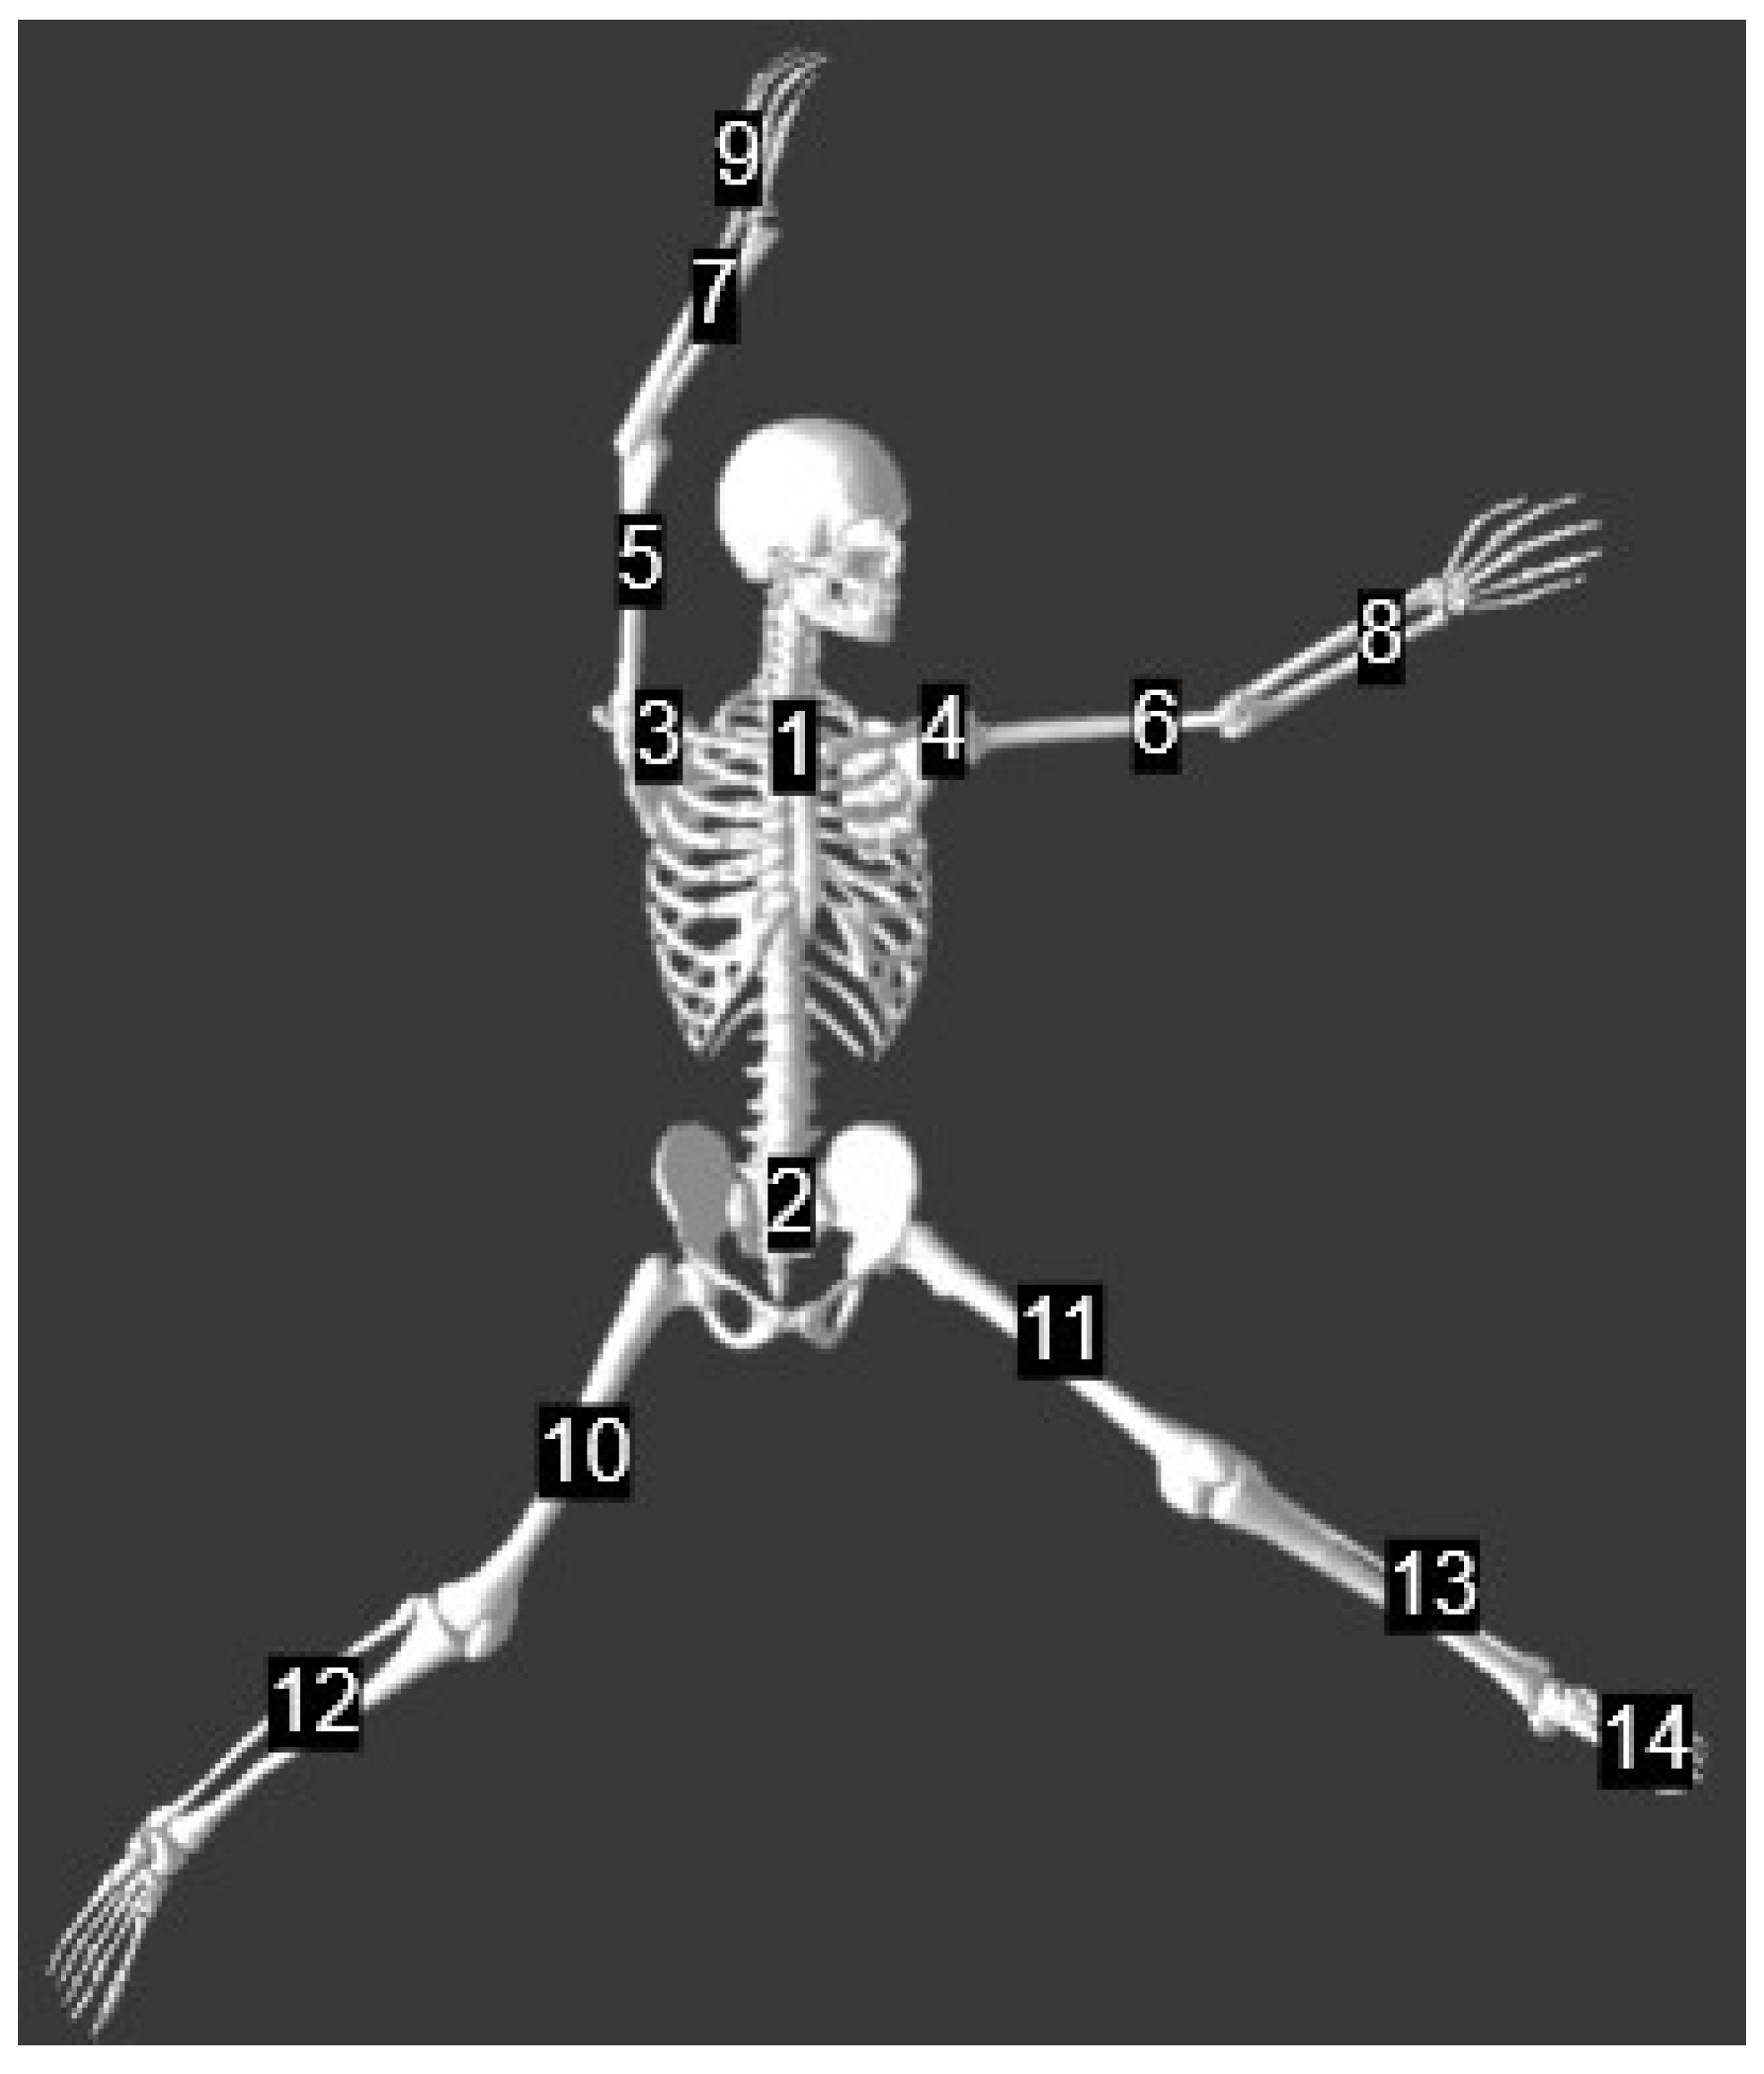
Participants wore athletic shorts and a tank top or a loose-fitting shirt to allow access for sensor placement. All pitchers completed a standardized full-body dynamic warm-up. Afterwards, participants completed 15 drop balls with maximal effort. The analysis was restricted to drop-ball pitches to reduce variability associated with pitch-type–specific mechanics and to focus on a consistently performed pitch among adolescent softball pitchers. This controlled pitch condition allowed the examination of stable geometric characteristics of the throwing-arm trajectory. A 15-sensor electromagnetic tracking system was used following previous studies [1,8,9], (trakSTAR™, Ascension Technologies, Inc., Burlington, VT, USA). Full-body kinematics were captured at 240 Hz and were synced with Biomechanics Analysis Software (xGen version 4.25.0.0, The MotionMonitor®, Innovative Sports Training, Chicago, IL, USA) (Table 1) (Figure 1).
Table 1.
Sensor Placement Locations.
Figure 1.
Electromagnetic sensor placement for a right-handed pitcher. Each number coincides with sensor numbers from Table 1.
After sensor placement, a digitizing process was performed to identify joint positions and generate the segment orientations. The joint centers were calculated as the midpoint between 2 digitized points. For the shoulder and the hip, the centers of joints were computed using a functional method [15,16,17]. Lab conditions were set up to mimic a regulation softball pitching mound, with a distance of 13.11 m from the mound to the target.
Pitch performance variables were collected using a Rapsodo 2.0 Pitching system (Rapsodo, Inc., Singapore, Singapore). The global reference frame was defined with the x-axis oriented along the anterior–posterior direction, the y-axis aligned with the vertical direction, and the z-axis corresponding to the medial–lateral direction (positive is the lateral direction; negative is the medial direction).
Throwing shoulder joint, upper arm center of mass (COM), elbow joint, forearm COM, wrist joint, and hand COM point trajectories were selected from the software. The positional data were filtered using a fourth-order zero-lag Butterworth low-pass filter (cutoff = 13.4 Hz), with the cutoff frequency determined using Winter’s residual analysis method [18], following previous studies with the RMS results [1,7,8,9].
The events of focus in this study were as follows: 1. windup (WU), defined as the pitching wrist to shoulder vector reaching a horizontal position in front of the body (3 o’clock); 2. top of pitch (TOP), defined as the pitching wrist to shoulder vector reaching a vertical position relative to the ground (12 o’clock); 3. downswing (DS), defined as the pitching wrist to shoulder vector reaching a horizontal position behind the body (9 o’clock); 4. ball release (BR), defined as one frame after peak hand resultant linear velocity.
2.1. Softball Pitching Plane (SPP)
To quantify the throwing-arm trajectory, a weighted best-fit plane, the Softball Pitching Plane (SPP) was computed using orthogonal least-squares optimization. Although movement events were identified using position vectors expressed in the global reference frame to ensure consistent temporal segmentation across trials, the Softball Pitching Plane was computed directly from the three-dimensional position data without reliance on any specific anatomical or task-related axis. The fitted plane was then used to define a plane-based local reference frame for subsequent orientation and deviation analyses. Alternative approaches, such as instantaneous rotation axes or regression-based surface fitting, can be used to approximate planar motion. These methods depend on coordinate definitions, are sensitive to noise, or do not directly minimize geometric deviation. A weighted orthogonal least-squares approach was employed to estimate the dominant plane of the position trajectory by minimizing the perpendicular distance of all trajectory points to the plane [12,13,14]. This formulation provides a coordinate-independent and mathematically optimal representation of the dominant spatial manifold of the arm path. Instantaneous hand velocity was incorporated as a weighting factor to emphasize the periods of the motion that are most biomechanically and performance relevant. In the softball windmill pitching, higher distal segmental velocities typically occur during the late acceleration phases (DS–BR), which are critical for effective momentum transfer and ball velocity generation. By contrast, lower phases (e.g., stride period [WU-TOP], and early acceleration [TOP-DS]) contribute less to performance and may introduce greater variability due to transitional or corrective movements [19]. Accordingly, velocity-based weighting allows the fitted plane to concentrate on reflecting the spatial organization of the high-intensity movement phases most relevant to pitching performance. To formalize this procedure, let denote the coordinate location for each time frame i. The plane is defined by the unit vector n and a scalar offset distance d, following the general plane equation:
Instantaneous hand COM resultant velocity at each time point was used as a weighting factor. The use of velocity-based weighting follows the biomechanical rationale underlying Kwon’s functional swing plane, which emphasizes movement phases most relevant to performance and energy transfer [7]. In dynamic throwing motions, higher hand velocities occur during late acceleration phases that contribute directly to ball propulsion, whereas lower-velocity phases primarily reflect repositioning or preparatory movement. Accordingly, velocity weighting allows the fitted plane to preferentially represent the dominant, performance-relevant spatial organization of the arm trajectory rather than treating all time points as equally informative. To prevent differences in absolute velocity magnitude from disproportionately influencing optimization, the weights were normalized within each trial. The optimal plane was estimated by minimizing the weighted sum of squared orthogonal distances from all points to the plane:
where Xi is the position of the i-th point, ωi is its assigned weight, n is the unit vector of the plane, and d is the plane offset. Alternative weighting strategies, including equal weighting across time, acceleration-based weighting, or phase-specific temporal weighting, are possible. Velocity-based weighting was chosen to emphasize periods of higher movement intensity that are most relevant to pitching performance, while avoiding excessive sensitivity to brief transient peaks or the need for predefined phase boundaries. The optimal plane parameters were estimated using a constrained nonlinear optimization implemented via the Sequential Least Squares Programming (SLSQP) algorithm in the SciPy package in Python (version 3.10.19). The unit-length constraint on the plane normal vector was enforced explicitly during optimization. Convergence was defined as a change in the objective function below 10−6 or attainment of a maximum of 1000 iterations. To reduce sensitivity to initial conditions and potential local minima, the optimization was repeated using multiple initial normal vectors uniformly sampled on the unit sphere. Optimization runs were considered successful if the convergence criteria were met and the resulting plane normal satisfied the unit-length constraint. Among all successful optimization runs, the solution yielding the lowest weighted RMS loss was retained as the final plane estimate. After obtaining the optimal plane parameters, the local coordinate system was defined using the global vertical axis ylab. The n unit vector was assigned to (iSPP).
The in-plane direction vector was computed as
and the orthogonal in-plane axis as
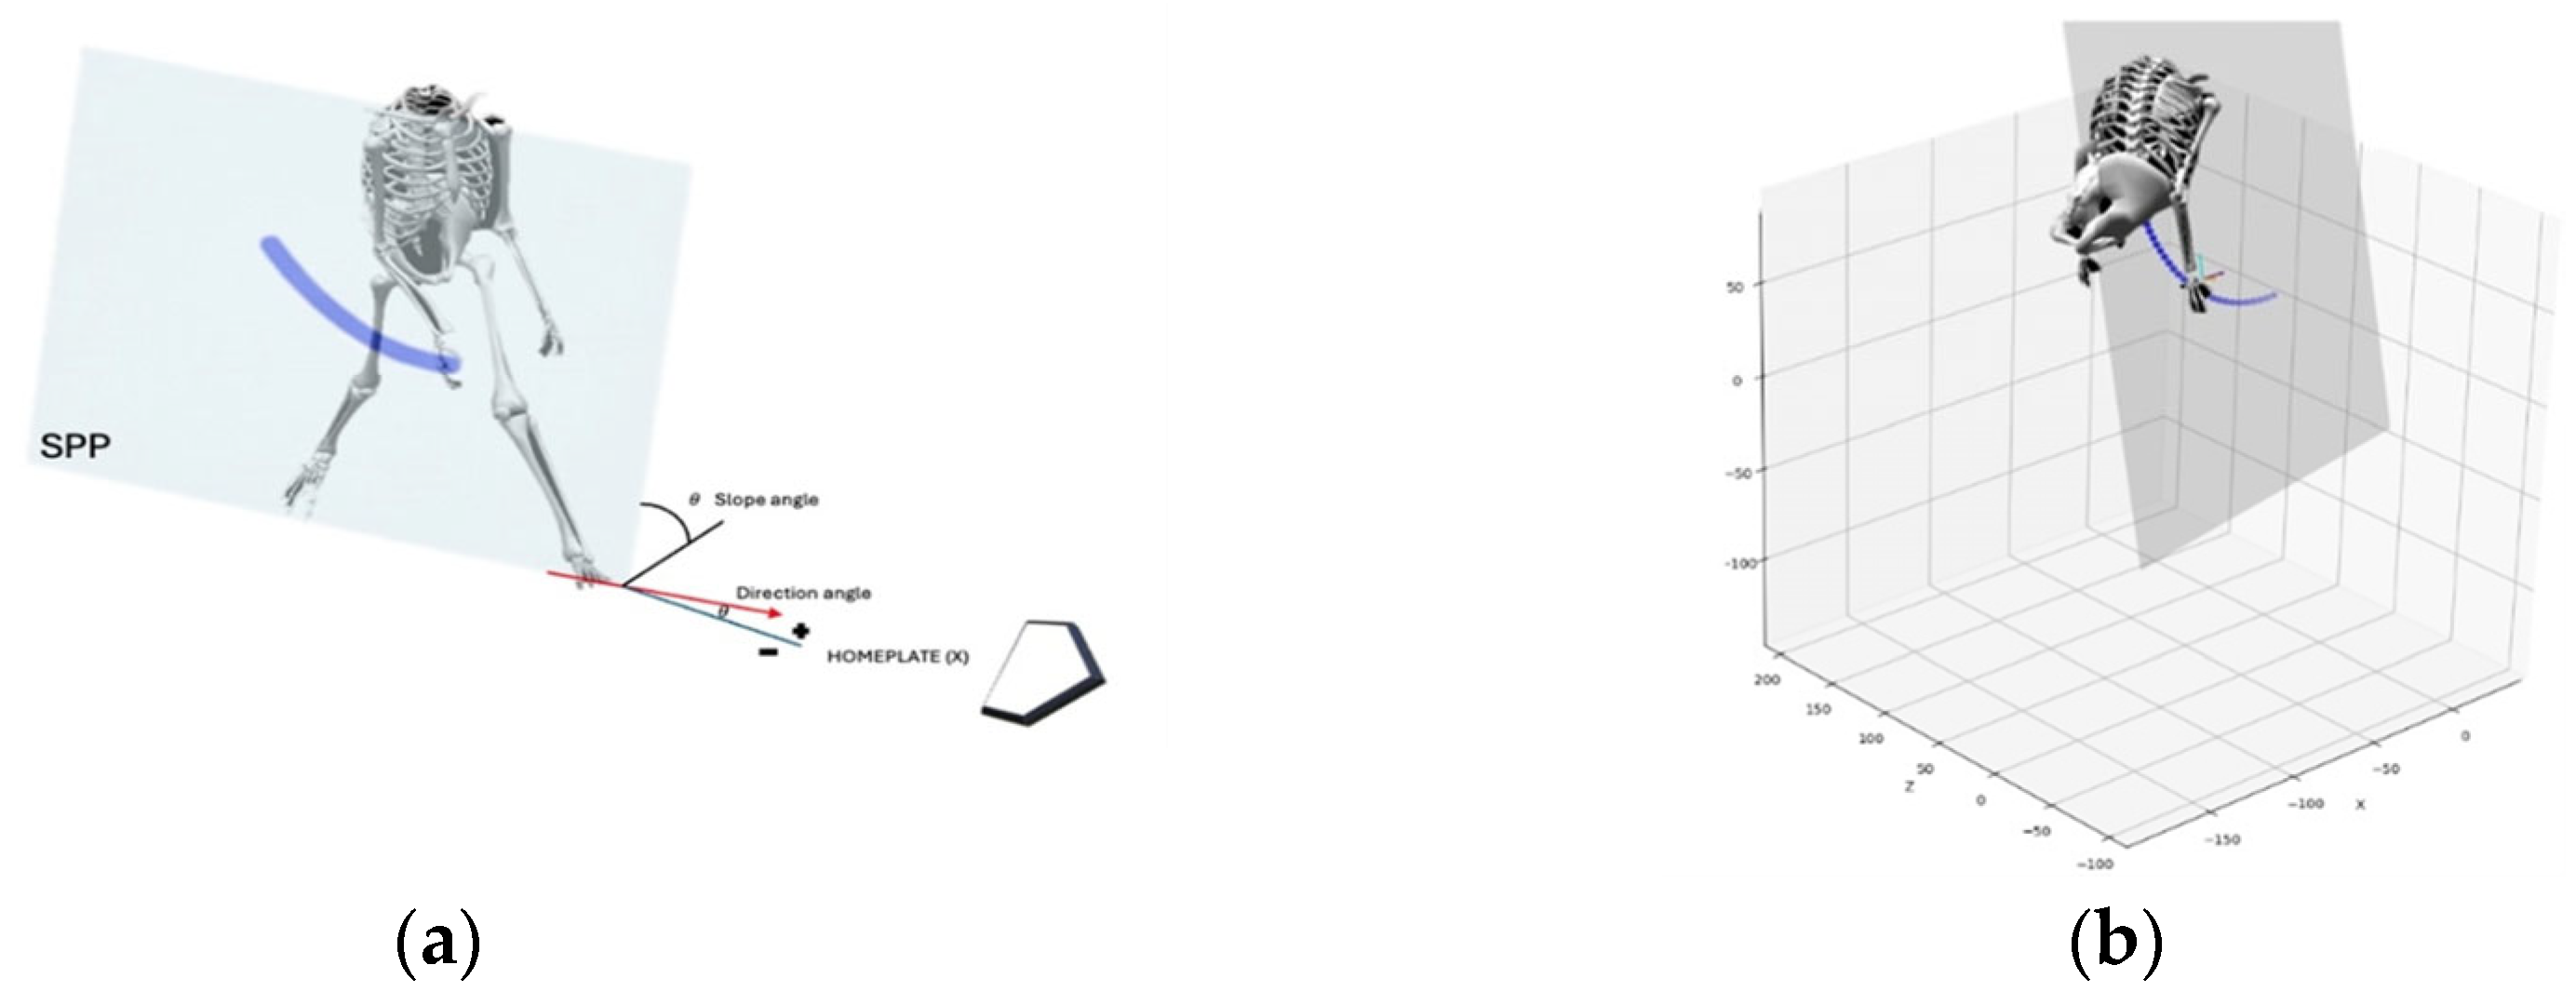
Two orientation angles were defined: the slope angle (kSPP), representing the inclination of the plane relative to the global horizontal of the plane, and the direction angle, defined as the angle between jSPP and the global target axis (x-axis). A negative direction angle indicates an orientation outward from the global x-axis, whereas a positive angle indicates an inward orientation. The RMS deviation off the plane (i.e., the perpendicular distance of each point from the fitted plane) of each segment was computed as
To determine the softball pitching plane, trajectory-plane fitting was carried out for the pitching shoulder, upper arm, elbow, forearm, wrist, and hand in three different phases: WU–BR, TOP–BR, DS–BR. The RMS deviation of the fitted trajectory was compared across phases to determine which interval yielded the most optimal-fitting plane. For subsequent analyses, the plane with the smallest RMS deviation for each segment and joint within each interval was selected as the optimal-fitting plane.
2.2. Statistics
Analyses were performed in R (version 4.5.0) using the psych package for reliability assessment and the lme4 package for linear mixed-effects model fitting [20], with lmerTest used to obtain p-values. Statistical significance was set at p < 0.05. The analyses consisted of two main phases: (1) reliability assessment and (2) ball velocity prediction using mixed-effects modeling.
2.3. Reliability
To evaluate Hypothesis 1, trial-to-trial consistency and absolute reliability of the SPP parameters (slope, direction, and RMS deviation) were examined. Reliability was assessed using three complementary indices: (1) within-subject variability, (2) leave-one-trial-out (LOTO) consistency, and (3) intraclass correlation coefficients. Within-subject variability was quantified using the mean, standard deviation (SD), and coefficient of variation (CV%). A lower CV% indicates greater consistency across repeated trials, with values below 5% generally considered acceptable for kinematic reliability in biomechanical measures of segment orientation and movement consistency. This threshold was adopted to facilitate interpretation of relative variability rather than as a strict criterion for statistical inference [21,22]. Because direction is circular data, CV% is not appropriate; therefore, circular standard deviation (CSD) and mean angular deviation were used as recommended for directional measures [23]. Absolute agreement reliability was assessed using the intraclass correlation coefficient ICC (3.1), a two-way mixed-effects, single-measure model evaluating absolute agreement. Higher ICC values reflect greater stability of each parameter as a pitcher-specific characteristic. Absolute error was quantified using a leave-one-trial-out (LOTO) procedure, in which the absolute difference between each trial and the mean of all remaining trials was computed. This approach provides a robust estimate of trial-level precision and sensitivity to outlier movements.
2.4. Validation
A two-level linear mixed effect model was constructed to examine the associations between plane variables (slope angle, direction angle, and RMS deviation) and ball velocity. Individual pitches (Level 1) were nested within pitchers (Level 2).
Model 0 was an unconditional means model, estimating the variance in pitch velocity without any predictors. This baseline model served as a baseline to partition between- and within-subject variability. Model 1 included a Level 2 grand-mean-centered person-mean score of slope angle, direction angle, and RMS deviation (between-person effect) and a Level 1 person mean-centered score of slope angle, direction angle, and RMS deviation (within-person effect). The former captures the mean slope angle, direction angle, and RMS deviation for each pitcher, reflecting between-pitcher variability. The latter reflects the within-pitcher variability and how each pitch deviates from the pitcher’s average performance. A random intercept and fixed slope were included in Model 1. Finally, Model 2 extended Model 1 by adding random slopes to account for individual differences between players on the association between slope angle, direction angle, RMS deviation, and pitch velocity.
2.5. Model Check
Model assumptions were evaluated prior to statistical inference. Normality and homoscedasticity of residuals were assessed using visual inspection of residual-versus-fitted plots and normal Q–Q plots. Multicollinearity among fixed effects was examined using variance inflation factors (VIFs). VIF values for all predictors were low (VIF range: 1.00–1.17), indicating negligible multicollinearity. Residual diagnostics indicated minor deviations from normality at the distribution tails and mild heteroscedasticity; however, visual inspection suggested that these deviations were limited and did not substantially affect the central tendency of residuals. Given the robustness of linear mixed-effects models to moderate violations of distributional assumptions, particularly in the presence of balanced repeated measures, the models were retained for inference.
3. Results
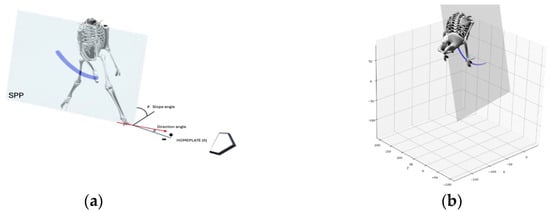
Among all combinations, the wrist joint center trajectory during the DS–BR interval yielded the lowest RMS deviation (0.053 m), indicating the most stable planar representation of the throwing arm path (Table 2) (Figure 2a,b). The selection of the wrist DS–BR interval was based on a model-selection criterion, in which the combination minimizing RMS deviation was considered the most appropriate geometric basis for defining the SPP, rather than on inferential statistical comparisons across phases or segments. Accordingly, this interval was selected for subsequent analyses, with the Softball Pitching Plane (SPP) defined by the wrist trajectory that minimized RMS deviation during the DS–BR phase. From a proximal-to-distal perspective, the wrist represents the terminal segment of the upper-extremity kinetic chain during the windmill pitching motion and reflects the cumulative outcome of coordinated motion across the trunk, shoulder, elbow, and forearm throughout the circumduction. During the late acceleration phase, wrist and hand velocities reach their peak and are strongly associated with ball velocity. Accordingly, wrist-based measures provide a biomechanically meaningful representation of distal segment function in windmill softball pitching [3,19].
Table 2.
RMS deviation across arm segments and pitch phases.
Figure 2.
Orientation and the RMS of the SPP. The slope angle and direction angle of the SPP were calculated relative to the ground and with respect to the target axis (x-axis) of the global reference frame, respectively. The RMS was calculated as the sum of wrist deviation from the SPP between DS to BR. (a) Lateral 2-dimentional depiction of the SPP. (b) 3-Dimentional depiction of the SPP.
3.1. Reliability
Across 15 repeated trials per subject, all parameters of the softball pitching plane demonstrated high within-subject reliability (Table 3). Slope showed small trial-to-trial error (LOTO = 1.32 ± 1.18) with excellent absolute agreement (ICC (3,1) = 0.90, 95% CI [0.88–0.93]) and low relative variability (CV = 3.5%). Directional measures also exhibited good consistency, reflected by low LOTO error (1.8° ± 2.31°), limited dispersion (circular SD = 2.12° ± 1.28°), which are well below the 5° threshold typically considered acceptable for kinematic consistency [24]. Moderate-to-high reliability (ICC = 0.81, 95% CI [0.74–0.86]). RMS deviation displayed minimal variability across trials (LOTO = 0.0177 ± 0.021 ICC = 0.85, 95% CI [0.81–0.9]; CV = 4.2%), indicating stable representation of the arm–plane relationship.
Table 3.
Reliability indices of the derived softball pitching plane parameters.
3.2. Validation
The ICC from the unconditional means model indicated that 94.6% of the total variance in pitch velocity occurred between pitchers and 5.4% within pitchers. Among predictors, RMS showed 90.9% between-pitcher variance, slope angle 88.3%, and directional angle 80.8%, indicating high within-pitcher consistency for all variables, with direction showing the most trial-to-trial variability. These high ICCs support the use of linear mixed effect modeling to distinguish between- and within-pitcher sources of variance.
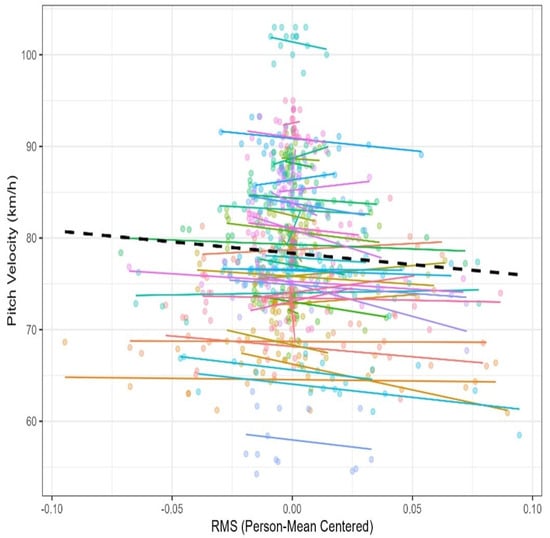
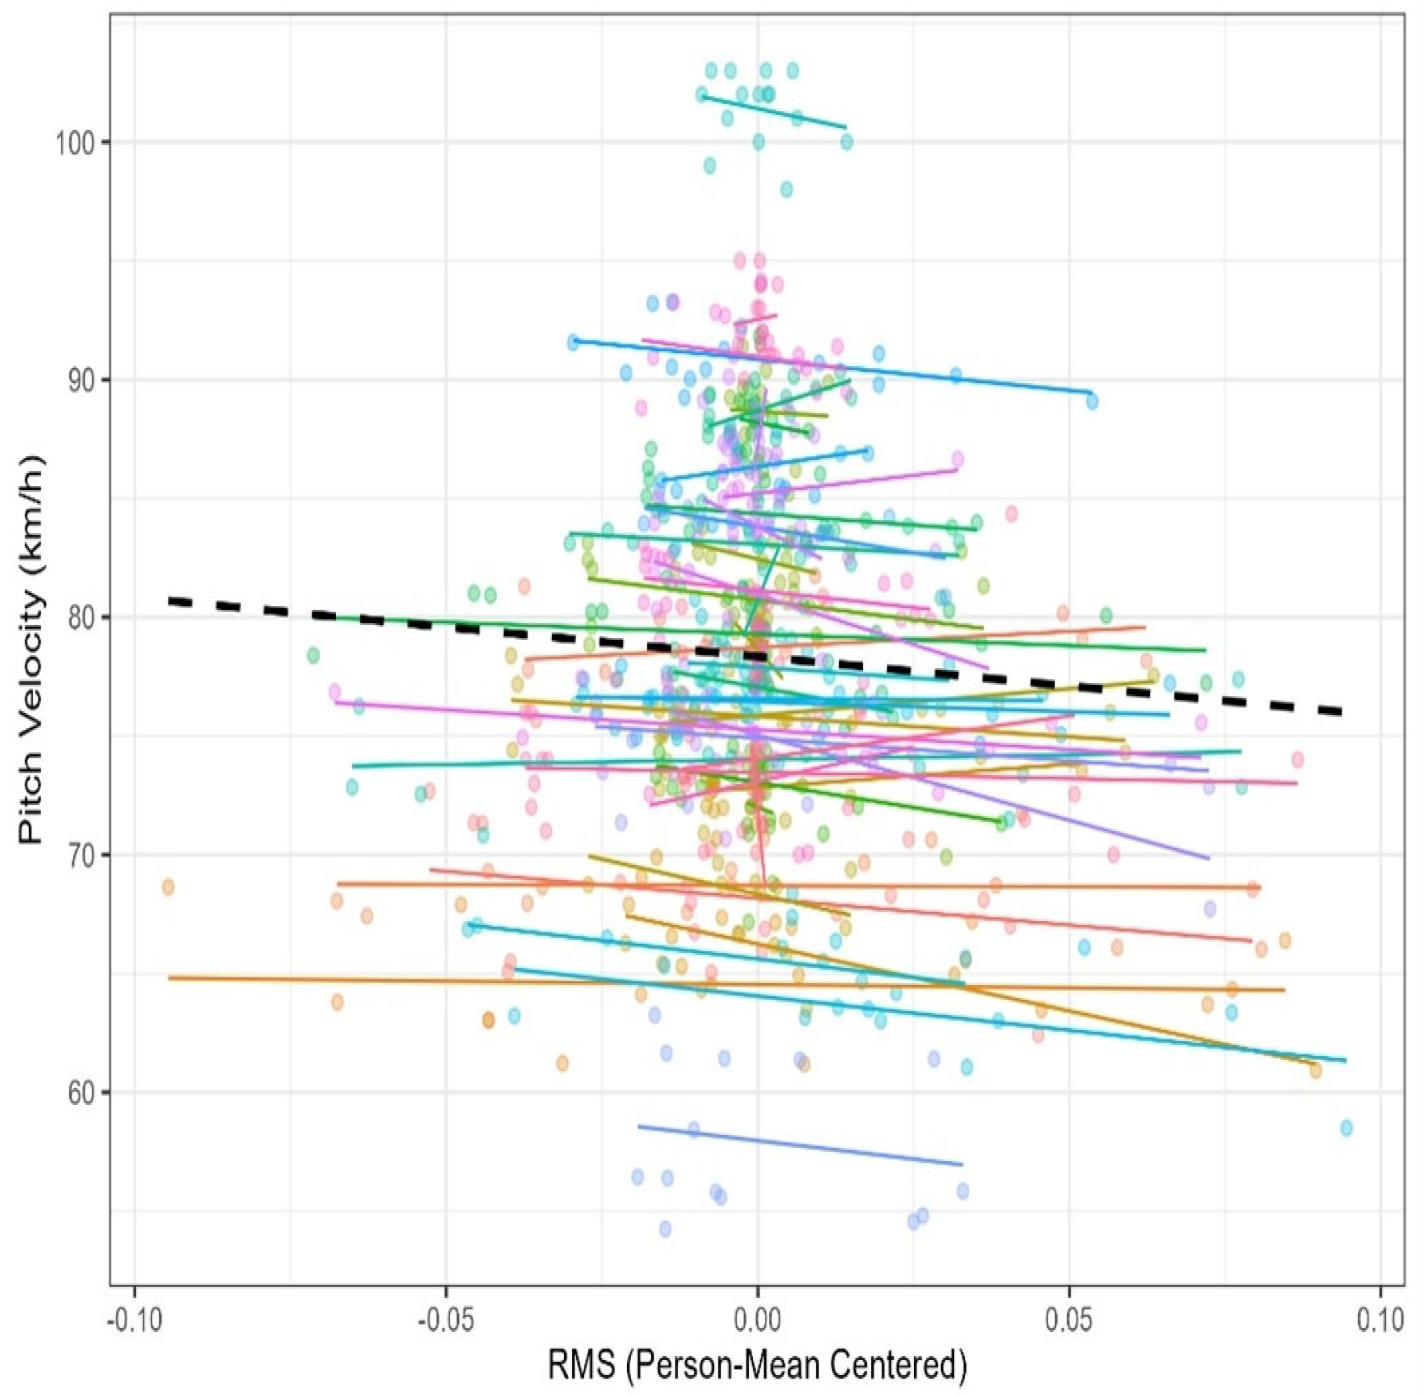
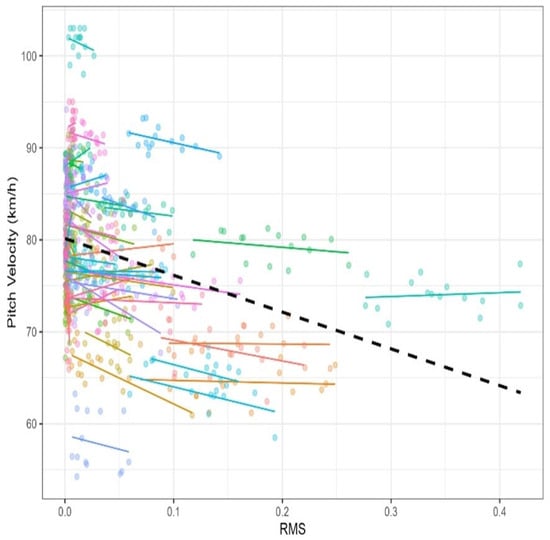
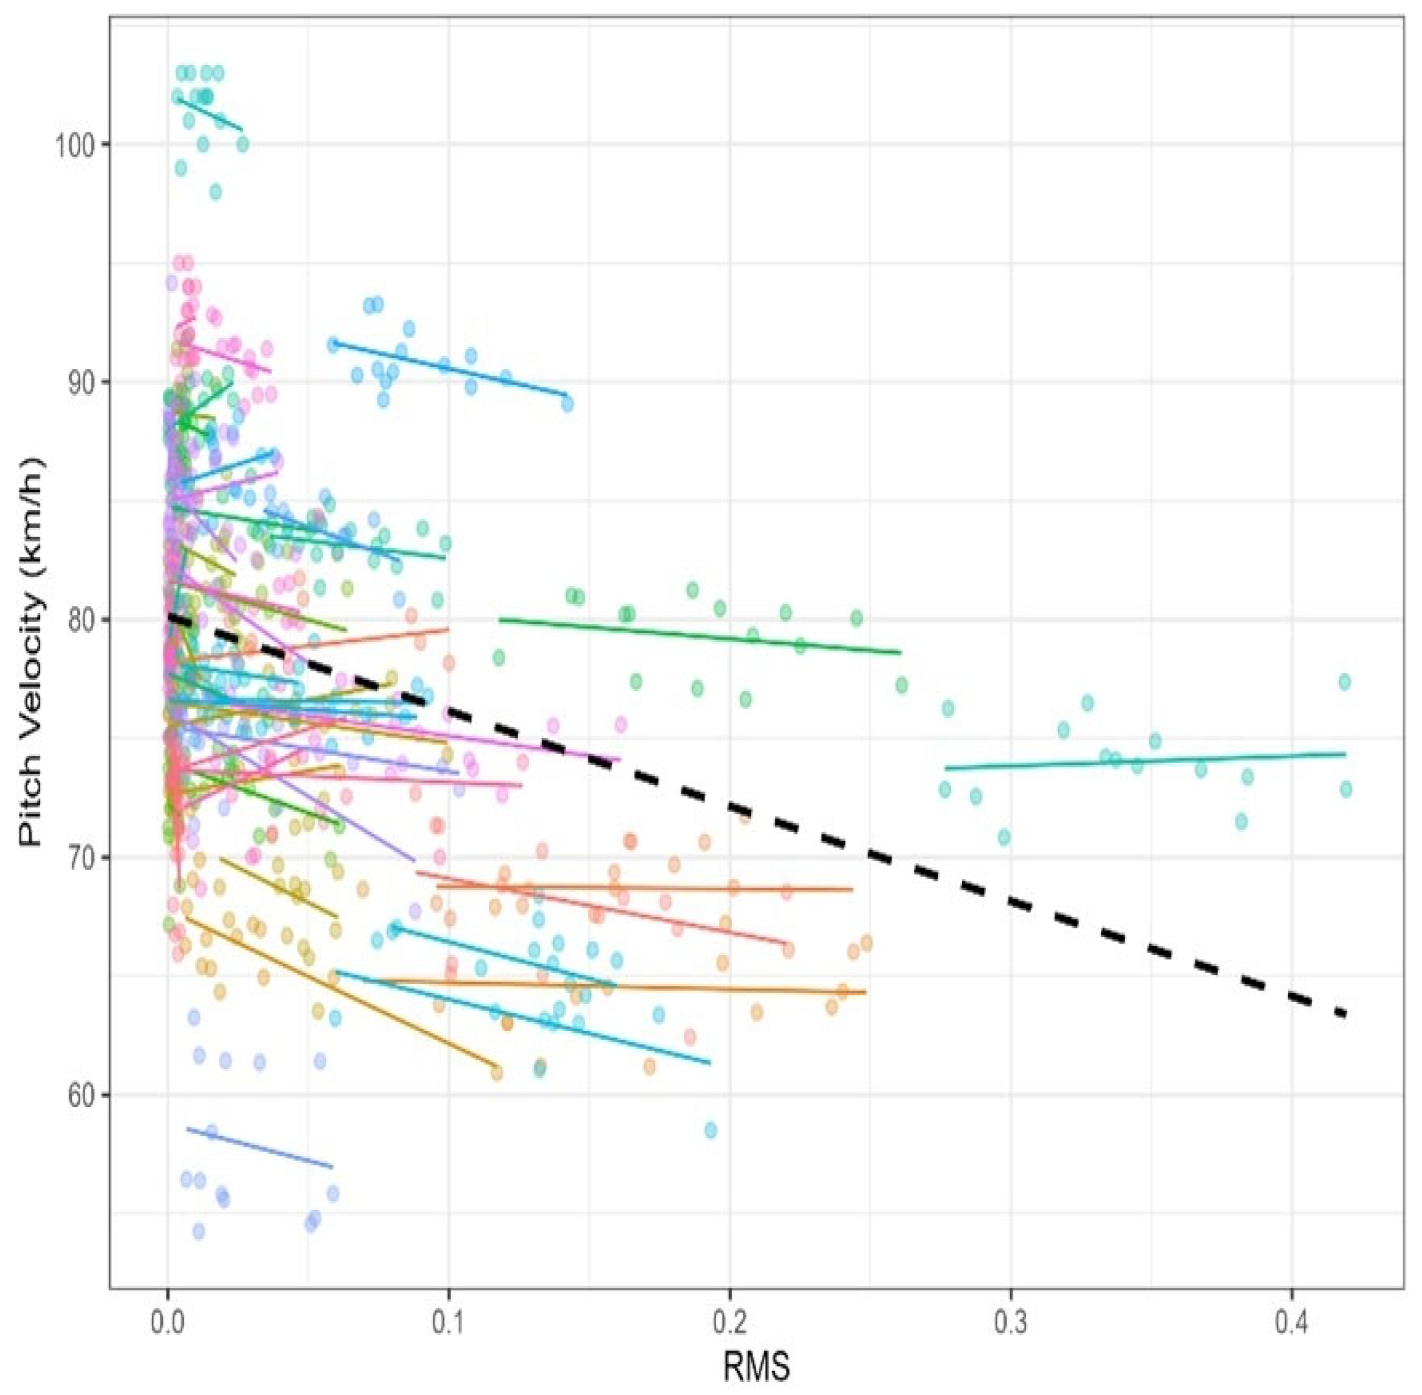
In Model 1, the average pitch velocity at mean levels of all predictors was 78.11 km∙h−1 (p < 0.001). Within pitchers, for every 1 cm increase in RMS relative to a pitcher’s own mean was associated with a 0.44 km∙h−1 decrease in pitch velocity (p = 0.03). Between pitchers, for every 1 cm increase in mean RMS deviation corresponded to a 0.13 km∙h−1 reduction in average pitch velocity (p < 0.001). Neither slope angle nor direction angle showed statistically significant effects at either the within- or between-pitcher level (p > 0.05). The model accounted for a substantial proportion of variance in pitch velocity (marginal R2 = 0.231; conditional R2 = 0.949). Model 2 extended Model 1 by allowing the within-pitcher effects of RMS, slope angle, and direction angle to vary across individuals. The average pitch velocity at mean predictor levels was 78.11 km∙h−1 (p < 0.001). Within pitchers, for every 1 cm increase in RMS was associated with a 0.11 km∙h−1 decrease in pitch velocity (p = 0.003). Between pitchers, for every 1 cm increase in RMS deviation corresponded to a 0.4 km∙h−1 reduction (p = 0.03). No significant within- or between-pitcher effects were observed for slope angle or direction angle (p ≥ 0.05). Fixed and random effects estimates are summarized in Table 4 and Table 5. Within-pitcher RMS deviation is illustrated in Figure 3, and raw RMS is illustrated in Figure 4 for Model 2.
Table 4.
Model 1. Fixed effect for linear mixed effect model predicting pitch velocity (random intercepts model).
Table 5.
Model 2. Fixed effect for linear mixed effect model predicting pitch velocity (random intercepts and random slopes model).
Figure 3.
Random slopes illustrate the within-pitcher relationship between RMS deviation (person−mean centered) and pitch velocity. Each color depicts an individual participant, with dots being each trial and the line indicating the individual’s slope.
Figure 4.
Random slopes illustrating the within-pitcher association between raw RMS and pitch velocity. Each colored line represents an individual pitcher’s estimated within-subject slope based on Model 2, while the dashed line denotes the overall population-level fixed effect. Each color depicts an individual participant, with dots being each trial and the line indicating the individual’s slope.
Model comparison based on maximum-likelihood estimation showed clear improvements in fit as model complexity increased (Table 6). Adding fixed effects (Model 1) significantly improved model fit over the null random-intercepts model, Δχ2(6) = 17.80, p = 0.007. Further allowing the within-pitcher effects of RMS, slope angle, and direction angle to vary across individuals (Model 2) produced an additional and statistically significant improvement, Δχ2(9) = 27.50, p = 0.001. Model 2 also yielded the lowest AIC (3373) and BIC (3455), indicating superior overall fit compared to both Model 0 and Model 1. Together, these indices suggest that incorporating random slopes captures meaningful between- and within-pitcher heterogeneity in the effects of RMS and angular variables. Accordingly, Model 2 was retained as the final and best-fitting model.
Table 6.
Model Comparison Statistics.
4. Discussion
The present study introduced a novel geometric framework, the Softball Pitching Plane (SPP), to characterize the spatial trajectory of the throwing arm during windmill softball pitching. The wrist trajectory between downswing (DS) and ball release (BR) provided the most stable and representative planar configuration with high intra- and inter-trial reliability, supporting our first hypothesis. Furthermore, a larger deviation from this plane was associated with reduced ball velocity, confirming our second hypothesis. These results indicate that the SPP captures a fundamental spatial characteristic of the pitching motion that reflects mechanical efficiency and intersegmental coordination.
Event-based metrics, which examine kinematics at discrete time points, provide limited insight into the continuous dynamics of movement [7,8,9,10,11]. This approach can overlook the coordinated, continuous geometric pattern of the arm’s full path during the pitch. In contrast, the weighted orthogonal least-squares approach identifies a best-fit plane by minimizing perpendicular distance from all trajectory points, producing a coordinate-independent representation of the movement [12,13,14]. By weighting points according to segment velocity, the method further emphasizes the high-velocity phases most relevant to mechanical precision and energy transfer. As a result, the SPP offers a compact yet powerful model that integrates geometric characteristics and biomechanical perspectives on softball windmill pitching coordination.
Among all geometric parameters derived from the SPP, RMS emerged as the most critical and informative indicator of ball velocity. RMS represents the degree to which an individual’s motion deviates from their own best-fit plane of motion, reflecting the geometric consistency of movement within the kinetic chain. When a greater proportion of the wrist’s motion deviates from the primary plane, the resulting off-axis movement reflects a loss of mechanical efficiency that does not contribute to ball velocity. Between pitchers, those who maintained more stable arm trajectories relative to their individual SPP exhibited higher average velocities, reflecting superior mechanical efficiency. Within pitchers, pitches showing greater deviations from a player’s own mean RMS were slower, indicating that disruptions in planar consistency can diminish energy transfer on a trial-to-trial basis. Importantly, the significant random slopes for RMS indicate that the relationship between planar deviation and pitch velocity varied across pitchers. Although greater deviations from the pitching plane were generally associated with slower pitches, the magnitude of this effect differed between individuals. These differences may reflect individual variation in coordination strategies, neuromuscular control, or the ability to compensate for off-plane motion. These findings suggest that planar consistency contributes to performance in a pitcher-specific manner rather than serving as a uniform determinant across all athletes.
The high conditional R2 values should be interpreted in the context of mixed-effects modeling, as they reflect variance explained by both fixed and pitcher-level random effects. Given the stability of pitch velocity within individuals, a large contribution from random effects is expected and does not imply overfitting, while the modest marginal R2 indicates a meaningful but limited contribution of the fixed effects.
The smaller fixed within-pitcher RMS effect in Model 2 reflects the inclusion of random slopes rather than a weakening of the relationship. Allowing the RMS–velocity association to vary across pitchers reallocates variance to the random-effect structure, indicating that the strength of this relationship differs across individuals. Accordingly, Model 2 represents a refinement that captures inter-individual heterogeneity, suggesting that while greater deviation from the Softball Pitching Plane is generally associated with reduced ball velocity, the magnitude of this effect is pitcher-specific rather than uniform across athletes.
The markedly larger RMS values observed during the windup–ball release and top-of-pitch–ball release intervals (often exceeding 1 m; Table 2) likely reflect the inclusion of substantial non-propulsive arm motion. During these earlier phases, the arm undergoes large circumduction and repositioning movements that are not primarily directed toward ball propulsion, resulting in substantial off-plane displacement. In contrast, the DS–BR interval corresponds to the late acceleration phase, during which the arm motion becomes more constrained and goal-directed, producing a more stable planar organization. Thus, the large RMS differences across phases primarily reflect phase-specific functional roles rather than measurement error, supporting the selection of the DS–BR interval as the most biomechanically meaningful basis for defining the SPP.
From a biomechanical standpoint, smaller RMS values reflect greater spatial consistency of distal segment motion relative to an individual’s dominant plane of movement. When the wrist trajectory remains closely aligned with a defined planar organization, the throwing motion exhibits a more coherent geometric structure across the kinetic chain [25,26]. Conversely, larger deviations from the SPP likely reflect greater variability or compensatory adjustments in arm motion that are less directly aligned with the primary movement path associated with ball propulsion.
Although the present study did not directly quantify joint moments, power, or energy transfer, the observed association between lower RMS deviation and higher ball velocity suggests that planar consistency may serve as an indirect indicator of coordinated proximal-to-distal motion. In this context, RMS deviation should be interpreted as a geometric measure of movement organization and consistency rather than a direct measure of energy-transfer efficiency. Future studies incorporating kinetic analyses are needed to determine how deviations from the SPP relate to underlying joint-level mechanics and energy transmission.
Interestingly, neither the slope nor the direction angle of the SPP significantly predicted ball velocity. The absence of significant effects for plane orientation suggests that efficient pitching mechanics are not constrained to a single arm-slot style or geometric configuration. Thus, the SPP accommodates stylistic diversity while preserving biomechanical interpretability, with RMS deviation serving as the most meaningful indicator of internal coordination stability. The framework does not prescribe one “ideal” technique but rather captures the essential geometry of efficient throwing across various pitching strategies.
Overall, the SPP provides a practical and accessible tool for quantifying throwing-arm motion in softball pitching. By reducing complex kinematics into the interpretable parameters of slope, direction, and deviation, the SPP offers a concise yet comprehensive description of an athlete’s energy-transfer strategy.
Importantly, the findings from this study also offer implications for environments where they may not have motion capture systems. Since the results indicated that athletes who maintained a more stable and repeatable hand trajectory tended to throw faster pitches. Improvements in velocity may coincide with more consistent spatial trajectories during the pitching. Even without access to SPP calculations, coaches can observe markers of consistency, such as repeatable release point positions or repeatable hand path, as indirect indicators of lower deviation and more efficient energy transfer. Its ability to highlight key movement qualities also makes the SPP translatable into actionable coaching cues for athletes and teams lacking high-tech measurement tools.
Future studies should build on these findings in several practical ways. In addition to its association with ball velocity, the SPP may help researchers examine changes in motor coordination, performance variability, and potential contributors to injury risk. Work is needed to determine whether larger deviations from the SPP emerge under fatigue or mechanical inefficiency, and whether these deviations relate to increased joint loading. Applying the framework to different pitch types and incorporating kinetic or classification methods may also help clarify how spatial characteristics of the arm path influence performance and movement efficiency.
There are some limitations that should be noted, including that the sample consisted of the current study. Firstly, our sample consisted of adolescent pitchers, which may limit the generalizability of the results to more advanced pitchers who could employ different coordination strategies or exhibit mechanical adaptations. Critically, characteristics of the SPP, including the inclined and directional angles, consistency, and RMS deviation from the plane, may be reflected by individual maturation and skill development. As pitchers mature, improvements in strength, neuromuscular control, and body coordination may lead to more stable planar organization and a stronger link between planar consistency and ball velocity. On the other hand, adolescent pitchers might display greater variability in mechanical strategies as technical proficiency and motor control continue to develop. Secondly, data collected in a controlled laboratory environment may not fully replicate the dynamic variability and environmental demands of real game environments. Future research should examine similar planar coordination patterns and observe a relationship between RMS and ball velocity across multiple competitive levels and pitching context to better understand how the SPP evolves with skill acquisition and maturation. Thirdly, the analysis was limited to a single pitch type performed under controlled conditions. As a result, the findings may not generalize to other pitch types that involve different mechanical demands or arm-slot strategies. Future studies should evaluate the robustness of the Softball Pitching Plane framework across a broader range of pitch types and performance contexts.
5. Conclusions
In conclusion, this study established the Softball Pitching Plane (SPP) as a reliable and geometric throwing-arm motion in adolescent softball pitchers during the late acceleration (DS–BR) period in windmill pitching. Greater deviation from the SPP was statistically associated with reduced ball velocity, suggesting that planar consistency reflects coordination stability within this population. These findings should be interpreted within the specific age group and movement phase studied, and further work is needed to evaluate the practical relevance of the SPP across competitive levels.
Author Contributions
Conceptualization, K.-J.C. and G.D.O.; methodology, K.-J.C.; software, K.-J.C.; validation, K.-J.C., I.P.J. and R.M.Z.; formal analysis, K.-J.C., I.P.J. and R.M.Z.; investigation, A.W.F.; resources, G.D.O.; data curation, K.-J.C. and A.W.F.; writing—original draft preparation, K.-J.C., M.R.K. and J.H.C.; writing—review and editing, K.-J.C., I.P.J., R.M.Z. and G.D.O.; visualization, K.-J.C.; supervision, G.D.O.; project administration, G.D.O. All authors have read and agreed to the published version of the manuscript.
Funding
This research received no external funding.
Institutional Review Board Statement
This study was conducted in accordance with the Declaration of Helsinki and approved by the Institutional Review Board of Auburn University (MODCR 00000120).
Informed Consent Statement
Informed consent was obtained from all subjects involved in the study. Written parental consent and minor assent were obtained prior to participation.
Data Availability Statement
The data supporting the findings of this study are not publicly available due to athlete privacy and institutional restrictions. De-identified data may be provided by the corresponding author upon reasonable request.
Acknowledgments
The authors would like to thank the participating athletes, families, and coaching staff for their cooperation throughout data collection. We also acknowledge the laboratory staff and student research assistants for their assistance with instrumentation and testing procedures. During the preparation of this manuscript, the authors used ChatGPT (OpenAI, GPT-5.1, 2025) for language refinement and organization. The authors reviewed and edited the content and accept full responsibility for the final manuscript.
Conflicts of Interest
The authors declare that they have no conflicts of interest.
Abbreviations
The following abbreviations are used in this manuscript:
| SPP | Softball pitching plane |
| RMS | Root mean square |
| COM | Center of mass |
| WU | Windup |
| TOP | Top of pitch |
| DS | Downswing |
| BR | Ball release |
| LOTO | Leave-one-trial-out |
| CV | Coefficient of variation |
| ICC | Intraclass correlation coefficient |
| M | Mean |
| SD | Standard deviation |
| Est | Estimate |
| SE | Standard error |
| BS | Between-subject |
| WS | Within-subject |
| Npar | Number of parameters |
| AIC | Akaike information criterion |
| BIC | Bayesian information criterion |
| logLik | Log-likelihood |
| −2× log | −2 times log-likelihood |
| Chisq | Chi-square statistic |
References
- Oliver, G.D.; Plummer, H. Ground reaction forces, kinematics, and muscle activations during the windmill softball pitch. Clin. Trial. J. Sports Sci. 2011, 29, 1071–1077. [Google Scholar] [CrossRef] [Scilit]
- Oliver, G.D.; Dwelly, P.M.; Kwon, Y.H. Kinematic motion of the windmill softball pitch in prepubescent and pubescent girls. J. Strength Cond. Res. 2010, 24, 2400–2407. [Google Scholar] [CrossRef] [Scilit]
- Liu, J.M.; Knowlton, C.; Gauthier, M.; Tropp, Z.; Verma, N.; Nicholson, G.; Romeo, A.; Zaferiou, A. How maximal whole-body and segmental angular momenta relate to fastball speeds in high school baseball pitchers. J. Biomech. 2025, 191, 112919. [Google Scholar] [CrossRef] [Scilit] [PubMed]
- Kwon, Y.-H.; Tuttle, N.J.; Hung, C.-J.; Levine, N.A.; Baek, S. Linear relationships among the hand and clubhead motion characteristics in golf driving in skilled male golfers. J. Appl. Biomech. 2021, 37, 619–628. [Google Scholar] [CrossRef] [Scilit] [PubMed]
- Cheng, K.-J.; Mori, K.; Lee, B.; Martinez, A.; Baek, S.; Alvis, H.B.; Kwon, Y.-H. Effects of on-plane wrist release style on morphological, temporal, and kinematic swing characteristics in golf drives performed by skilled male golfers. Sports Biomech. 2025, 1–18. [Google Scholar] [CrossRef] [Scilit]
- Han, K.H.; Como, C.; Kim, J.; Hung, C.-J.; Hasan, M.; Kwon, Y.-H. Effects of pelvis–shoulders torsional separation style on kinematic sequence in golf driving. Sports Biomech. 2019, 18, 663–685. [Google Scholar] [CrossRef] [Scilit] [PubMed]
- Friesen, K.; Aguinaldo, A.L.; Oliver, G.D. Athlete body composition influences movement during sporting tasks: An analysis of softball pitchers’ joint angular velocities. Sports Biomech. 2024, 23, 2836–2849. [Google Scholar] [CrossRef] [Scilit]
- Friesen, K.; Barfield, J.; Murrah, W.M.; Dugas, J.; Andrews, J.R.; Oliver, G.D. The association of upper-body kinematics and earned run average of National Collegiate Athletic Association Division I softball pitchers. J. Strength Cond. Res. 2021, 35, 3145–3150. [Google Scholar] [CrossRef] [Scilit]
- Oliver, G.D.; Gilmer, G.G.; Anz, A.W.; Friesen, K.B.; Brittain, A.R.; Goodlett, M.D.; Dugas, J.R.; Andrews, J.R. Upper extremity pain and pitching mechanics in NCAA Division I softball. Int. J. Sports Med. 2018, 39, 929–935. [Google Scholar] [CrossRef] [Scilit]
- Barrentine, S.W.; Fleisig, G.S.; Whiteside, J.A.; Escamilla, R.F.; Andrews, J.R. Biomechanics of windmill softball pitching with implications about injury mechanisms at the shoulder and elbow. J. Orthop. Sports Phys. Ther. 1998, 28, 405–415. [Google Scholar] [CrossRef] [Scilit]
- Werner, S.L.; Jones, D.G.; Guido, J.A.; Brunet, M.E., Jr. Kinematics and kinetics of elite windmill softball pitching. Am. J. Sports Med. 2006, 34, 597–603. [Google Scholar] [CrossRef] [Scilit]
- Markovsky, I.; Van Huffel, S. Overview of total least-squares methods. Signal Process. 2007, 87, 2283–2302. [Google Scholar] [CrossRef] [Scilit]
- Björck, Å.; Golub, G.H. Numerical methods for computing angles between linear subspaces. Math. Comput. 1973, 27, 579–594. [Google Scholar] [CrossRef] [Scilit]
- Golub, G.H.; VanLoan, C.F. An analysis of the total least squares problem. SIAM J. Numer. Anal. 1980, 17, 883–893. Available online: http://www.jstor.org/stable/2156807 (accessed on 29 December 2025). [CrossRef] [Scilit]
- Veeger, H.E. The position of the rotation center of the glenohumeral joint. J. Biomech. 2000, 33, 1711–1715. [Google Scholar] [CrossRef] [Scilit]
- Wu, G.; Van Der Helm, F.C.; Veeger, H.E.J.; Makhsous, M.; Van Roy, P.; Anglin, C.; Nagels, J.; Karduna, A.R.; McQuade, K.; Wang, X.; et al. ISB recommendation on definitions of joint coordinate systems of various joints for the reporting of human joint motion—Part II: Shoulder, elbow, wrist and hand. J. Biomech. 2005, 38, 981–992. [Google Scholar] [CrossRef] [Scilit] [PubMed]
- Wu, G.; Siegler, S.; Allard, P.; Kirtley, C.; Leardini, A.; Rosenbaum, D.; Whittle, M.; D’Lima, D.D.; Cristofolini, L.; Witte, H.; et al. ISB recommendation on definitions of joint coordinate system of various joints for reporting of human joint motion-part I: Ankle, hip, and spine. J. Biomech. 2002, 35, 543–548. [Google Scholar] [CrossRef] [Scilit]
- Winter, D.A. Biomechanics and Motor Control of Human Movement; Wiley: Hoboken, NJ, USA, 2009. [Google Scholar]
- Friesen, K.B.; Butler, L.S.; Bordelon, N.M.; Downs-Talmage, J.L.; Fleisig, G.S.; Ulman, S.; Oliver, G.D. Biomechanics of fastpitch softball pitching: A practitioner’s guide. Sports Health 2025, 17, 1200–1213. [Google Scholar] [CrossRef] [Scilit]
- Bates, D.; Mächler, M.; Bolker, B.; Walker, S. Fitting Linear Mixed-Effects Models Using lme4. J. Stat. Softw. 2015, 67, 1–48. [Google Scholar] [CrossRef] [Scilit]
- Atkinson, G.; Nevill, A.M. Statistical methods for assessing measurement error (Reliability) in variables relevant to sports medicine. Sports Med. 1998, 26, 217–238. [Google Scholar] [CrossRef] [Scilit]
- Hopkins, W.G. Measures of reliability in sports medicine and science. Sports Med. 2000, 30, 1–15. [Google Scholar] [CrossRef] [Scilit] [PubMed]
- Batschelet, E. Circular Statistics in Biology; Academic Press: San Diego, CA, USA, 1981. [Google Scholar]
- Schwartz, M.H.; Trost, J.P.; Wervey, R.A. Measurement and management of errors in quantitative gait data. Gait Posture 2004, 20, 196–203. [Google Scholar] [CrossRef] [Scilit]
- Aguinaldo, A.L.; Escamilla, R.F. Segmental power analysis of sequential body motion and elbow valgus loading during baseball pitching: Comparison Between Professional and High School Baseball Players. Orthop. J. Sports Med. 2019, 7, 2325967119827924. [Google Scholar] [CrossRef] [Scilit] [PubMed]
- Aguinaldo, A.L.; Chambers, H. Correlation of throwing mechanics with elbow valgus load in adult baseball pitchers. Am. J. Sports Med. 2009, 37, 2043–2048. [Google Scholar] [CrossRef] [Scilit] [PubMed]

Disclaimer/Publisher’s Note: The statements, opinions and data contained in all publications are solely those of the individual author(s) and contributor(s) and not of MDPI and/or the editor(s). MDPI and/or the editor(s) disclaim responsibility for any injury to people or property resulting from any ideas, methods, instructions or products referred to in the content. |
© 2026 by the authors. Licensee MDPI, Basel, Switzerland. This article is an open access article distributed under the terms and conditions of the Creative Commons Attribution (CC BY) license.