


Abstract
In recent times, field crop damage caused by birds, such as corvids and pigeons, has become crucial for many farmers. Damage can be as serious as the loss of a large part of the harvest. Several solutions have been proposed, but none are effective. An example is the use of scarecrows, but birds eventually adapt to them over time, and so they become ineffective. To study bird behavior and to propose a bird deterrent that would adapt to the presence of birds, we set up an experimental image-taking system on several plots of land over a period of 4–5 years. Around fifteen terabytes of images taken in the field were acquired. Our aim was to automatically detect these birds using deep learning methods and then to activate a real-time scarer. This work meets two challenges: the first is agroecological, as bird damage has become a major issue, and the second is IT, as it is difficult to detect birds in the field: the individuals are small because they are far from the camera lens, and field conditions are often less than optimal: darkness, confusion between the pigeons’ colors and the ground, etc. The Mask-RCNN in its original configuration is not suited to detecting small individuals. We mainly focused on the model’s hyperparameters to better adapt it to our study context. As a result, we improved the detection of small individuals using, among other things, appropriate anchor scales design and image processing techniques. At the same time, we built an original dataset focused on small individuals called BirdyDataset. The model can detect corvids and pigeons with an accuracy of 78% under real field conditions.
1. Introduction
Bird damage at field crop establishment is a major problem for growers of certain crops such as corn and sunflower [1]. Current protection methods are unsatisfactory. With the supply of repellent products dwindling due to their toxicity, farmers are resorting to the controversial method of bird killing, or to scaring devices, especially with sound, which may be ineffective due to the birds’ habituation [2]. Bird damage has a heavy-tailed distribution [3]: it affects a few fields but is highly damaging and random. This implies preventive and systematic scaring strategies, which encourage conflicts with nearby residents and bird habituation. Furthermore, it makes it difficult for observers to study how birds frequent fields, which could provide us with knowledge prior to establishing prevention strategies. In addition, these methods are generally time-consuming or lack precision.
Optical bird detection offers opportunities on both sides. Real-time analysis would make it possible to trigger a bird scaring device only when birds are present, or even to send an alert to the farmer. For research purposes, the detection of birds on the ground using vast banks of images from time-lapse cameras would make it possible to establish precise patterns of field frequentation over time and space. More generally, bird identification and detection (BIAD) has become an important topic in the fields of computer visualization, acoustic sensing, and artificial intelligence. Indeed, BIAD has a wide range of applications.
Work on BIAD has mainly been carried out in the context of building [4] and airport protection or endangered bird protection [5]. Research on agricultural applications concerns on-board optical detection by UAVs in the case of rice [6] and ripening crops [7]. However, to our knowledge, no work has been published for application to our case of birds landing in field crops at emergence with image acquisition by fixed horizontal shooting. This case presents specific difficulties. The fields to be monitored are large (4.38 ha for sunflowers in France), which reduces the size of the objects to be detected. The background may be heterogeneous, with bare soil of varying degrees of stoniness, and plants or weeds at emergence. Finally, damage can occur at dawn or dusk in variable lighting conditions and, of course, in different weather conditions.
Over the past 5 years, we acquired many images taken in the field on several plots, with a view to analyzing them using the latest image processing and deep learning methods. Our aim is to be able to detect the presence of birds in real time and thus scare them off at that precise moment. The aim is also to prevent birds from getting used to these new scarecrows in the same way as the more conventional ones.
This paper presents an automatic method for detecting birds from raw field images. By detection, we mean the location of individuals on the image and their classification, i.e., assigning them the correct class label. Our study focuses on corvids and pigeons, which cause a great deal of damage to field crops such as corn and sunflowers.
2. Related Works in Bird Identification and Detection (BIAD)
The most advanced methods for detecting and classifying individuals are based on Neural Convolution Networks (CNN), in particular, the region convolutional neural network (RCNN) [8,9]. Among the RCNN we have chosen the Mask-RCNN [10] which combines the latest advances in the fields of neural networks and computer vision. Mask-RCNN is a two-pass CNN model. However, there are single-pass models for detecting individuals in real time which are faster but less accurate than two-pass models. YOLO (You Only Look Once), by simultaneously detecting and classifying objects in a single pass, has made it possible to combine real-time speed with accuracy. YOLO has evolved through several versions since its initial introduction by Joseph Redmon and his collaborators in 2016 [11]. The first version, YOLOv1, revolutionized real-time object detection with its ability to predict multiple objects in an image with a single pass through the network. Since then, YOLO has undergone several iterations, with the latest being YOLOv13.
Recently, Lou et al. [12] proposed DC-YOLOv8, a small-object detection algorithm (ODA) based on a camera sensor for special scenarios. Their results show that the mAP (mean average precision) rises from 39% for YOLO to 41.5% for DC-YOLO. So, these scores remain rather modest compared with the challenges of real-time detection of small objects. YOLO has also been used in an agricultural and environmental context for smoke and fire detection [13]. To do this, the authors attempted to optimize the model’s hyperparameters, obtaining results with accuracy and recall greater than 1.39% and 1.48%, respectively.
Regarding bird detection, YOLO has been used in the field [14]. However, in this latest study, the recommended exposure distance for individuals facing the camera is 3 m, with a maximum of 5 m. Our study focuses on the presence of birds in real plots; this distance could be 100 m or more. It should be noted that the majority of BIADs are based on Yolo or its improvement for reasons of simplicity and real-time performance.
While Mask-RCNN, in its default parameter configuration, performs well with large objects, when individuals are clearly visible in the image, occupying a good proportion of it, the same cannot be said for detecting small objects or at a distance from the acquisition camera lens.
On the other hand, in the MS-COCO [15] dataset, objects are classified according to their pixel size into three categories [16] namely large, medium, and small objects, as is shown in Table 1.
Table 1.
The definitions of small, medium, and large objects in MS-COCO in pixel size.
According to this author [16] apart from MS-COCO, there are no large datasets of small individuals. It turns out that in our terabytes of images acquired over the last five years, most of our individuals in the images are small, as we will describe below.
We then built a so-called BirdyDataset of more than 3100 annotated images. “Therefore, a common small object dataset is vital which is accepted by most researchers and can provide a universal performance evaluation. However, building a small object dataset costs a lot of time and placing the bounding box properly for Intersection Over Union (IoU) evaluation is hard for the limited pixels of small objects.” [17]. In fact, for good annotation that avoids “forgetting” to frame small individuals, i.e., reducing the number of False Negatives (FN), each image must be zoomed in on, which makes the task delicate and time-consuming. Often, the work of one annotator is reviewed by other annotators to ensure its validity.
Detecting small objects is a current research topic in image processing and deep learning, and this has been investigated in multiple application areas such as mechanical engineering, satellite image processing, and autonomous car driving. In their article [18] give a review of small object detection, the different methods used, and their performance.
In recent work, the Mask-RCNN has been improved to better detect small objects. There are three ways in which Mask-RCNN can be improved:
- The neural network model: we can cite [6] for aircraft detection in remote sensing, which used an improved version of Mask-RCNN called SDMask-RCNN based on the RestNet101 backbone. These authors achieved a 2% increase in the average precision (AP).
- The model parameter calibration: we can cite the work of [19] for surface defect detection of automotive engine parts. These authors propose an IA-Mask R-CNN detection method with an improved anchor scales design.
- The data: we can cite the paper by Kisantal et al. [16]. According to these authors, the reasons for poor detection are twofold: few images contain small objects, and small objects do not appear sufficiently in the images that contain them. The proposed solution is to multiply the number of images using augmentation techniques. They also showed that the overlap between small ground-truth objects and the predicted anchors is much lower than the expected IoU threshold default value of 0.5. In other words, they showed that an IoU value of 0.3 is more appropriate for detecting small individuals.
As we will see in this paper, Mask-RCNN’s parameters can be used to select suitable anchors according to their size and shape. However, before describing the methodology used to construct our model, we first present the “Materials and Methods” section.
3. Materials and Methods
Several cameras were installed in different plots. These cameras were equipped with a hard disk and were programmed to take an image every fifteen seconds between 4 a.m. and 10 p.m. These cameras were controlled by a Raspberry Pi, a nano-computer equipped with an ARM microprocessor, 4 Giga Bytes RAM memory, a video card, and a Wi-Fi module. This device is easily transportable in the field. A web interface makes it easy to use. The hard disk was emptied every day and recorded on our image server. A raw image taken in the field in the JPEG format was 5–8 MB in size, with a high resolution.
Between 2020 and 2024, approximately 15 TB of images were acquired. Each image includes several attributes, such as the date and time of acquisition, as well as the camera used. Additionally, each image is linked to a specific plot of land, which was monitored in various regions of the country using GPS coordinates.
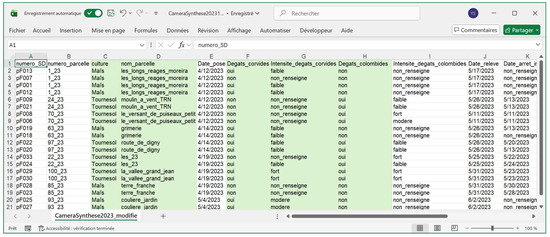
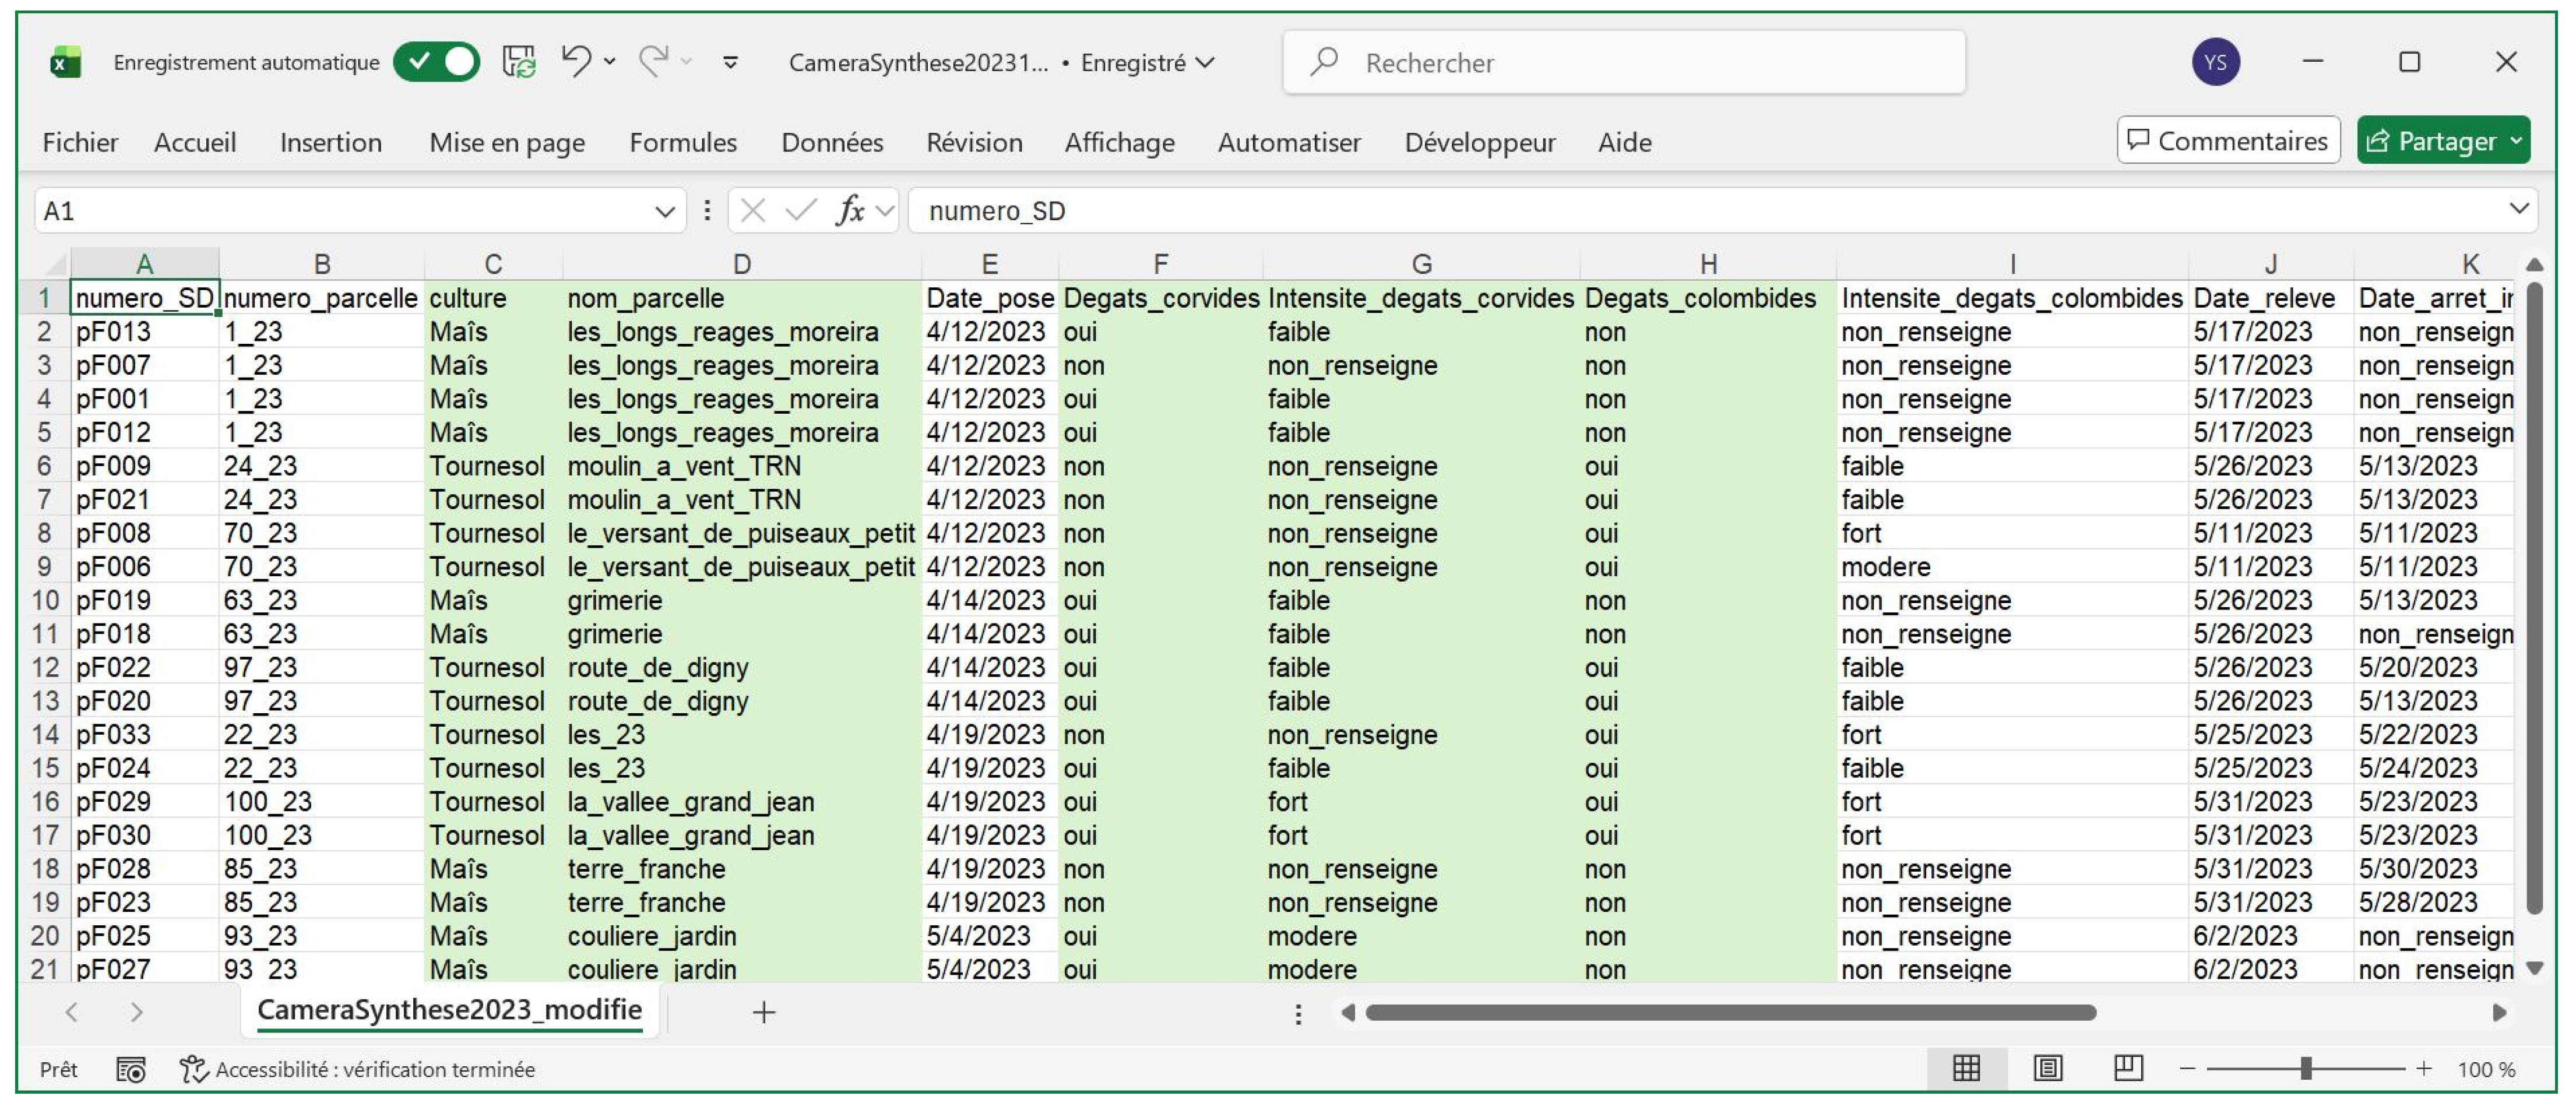
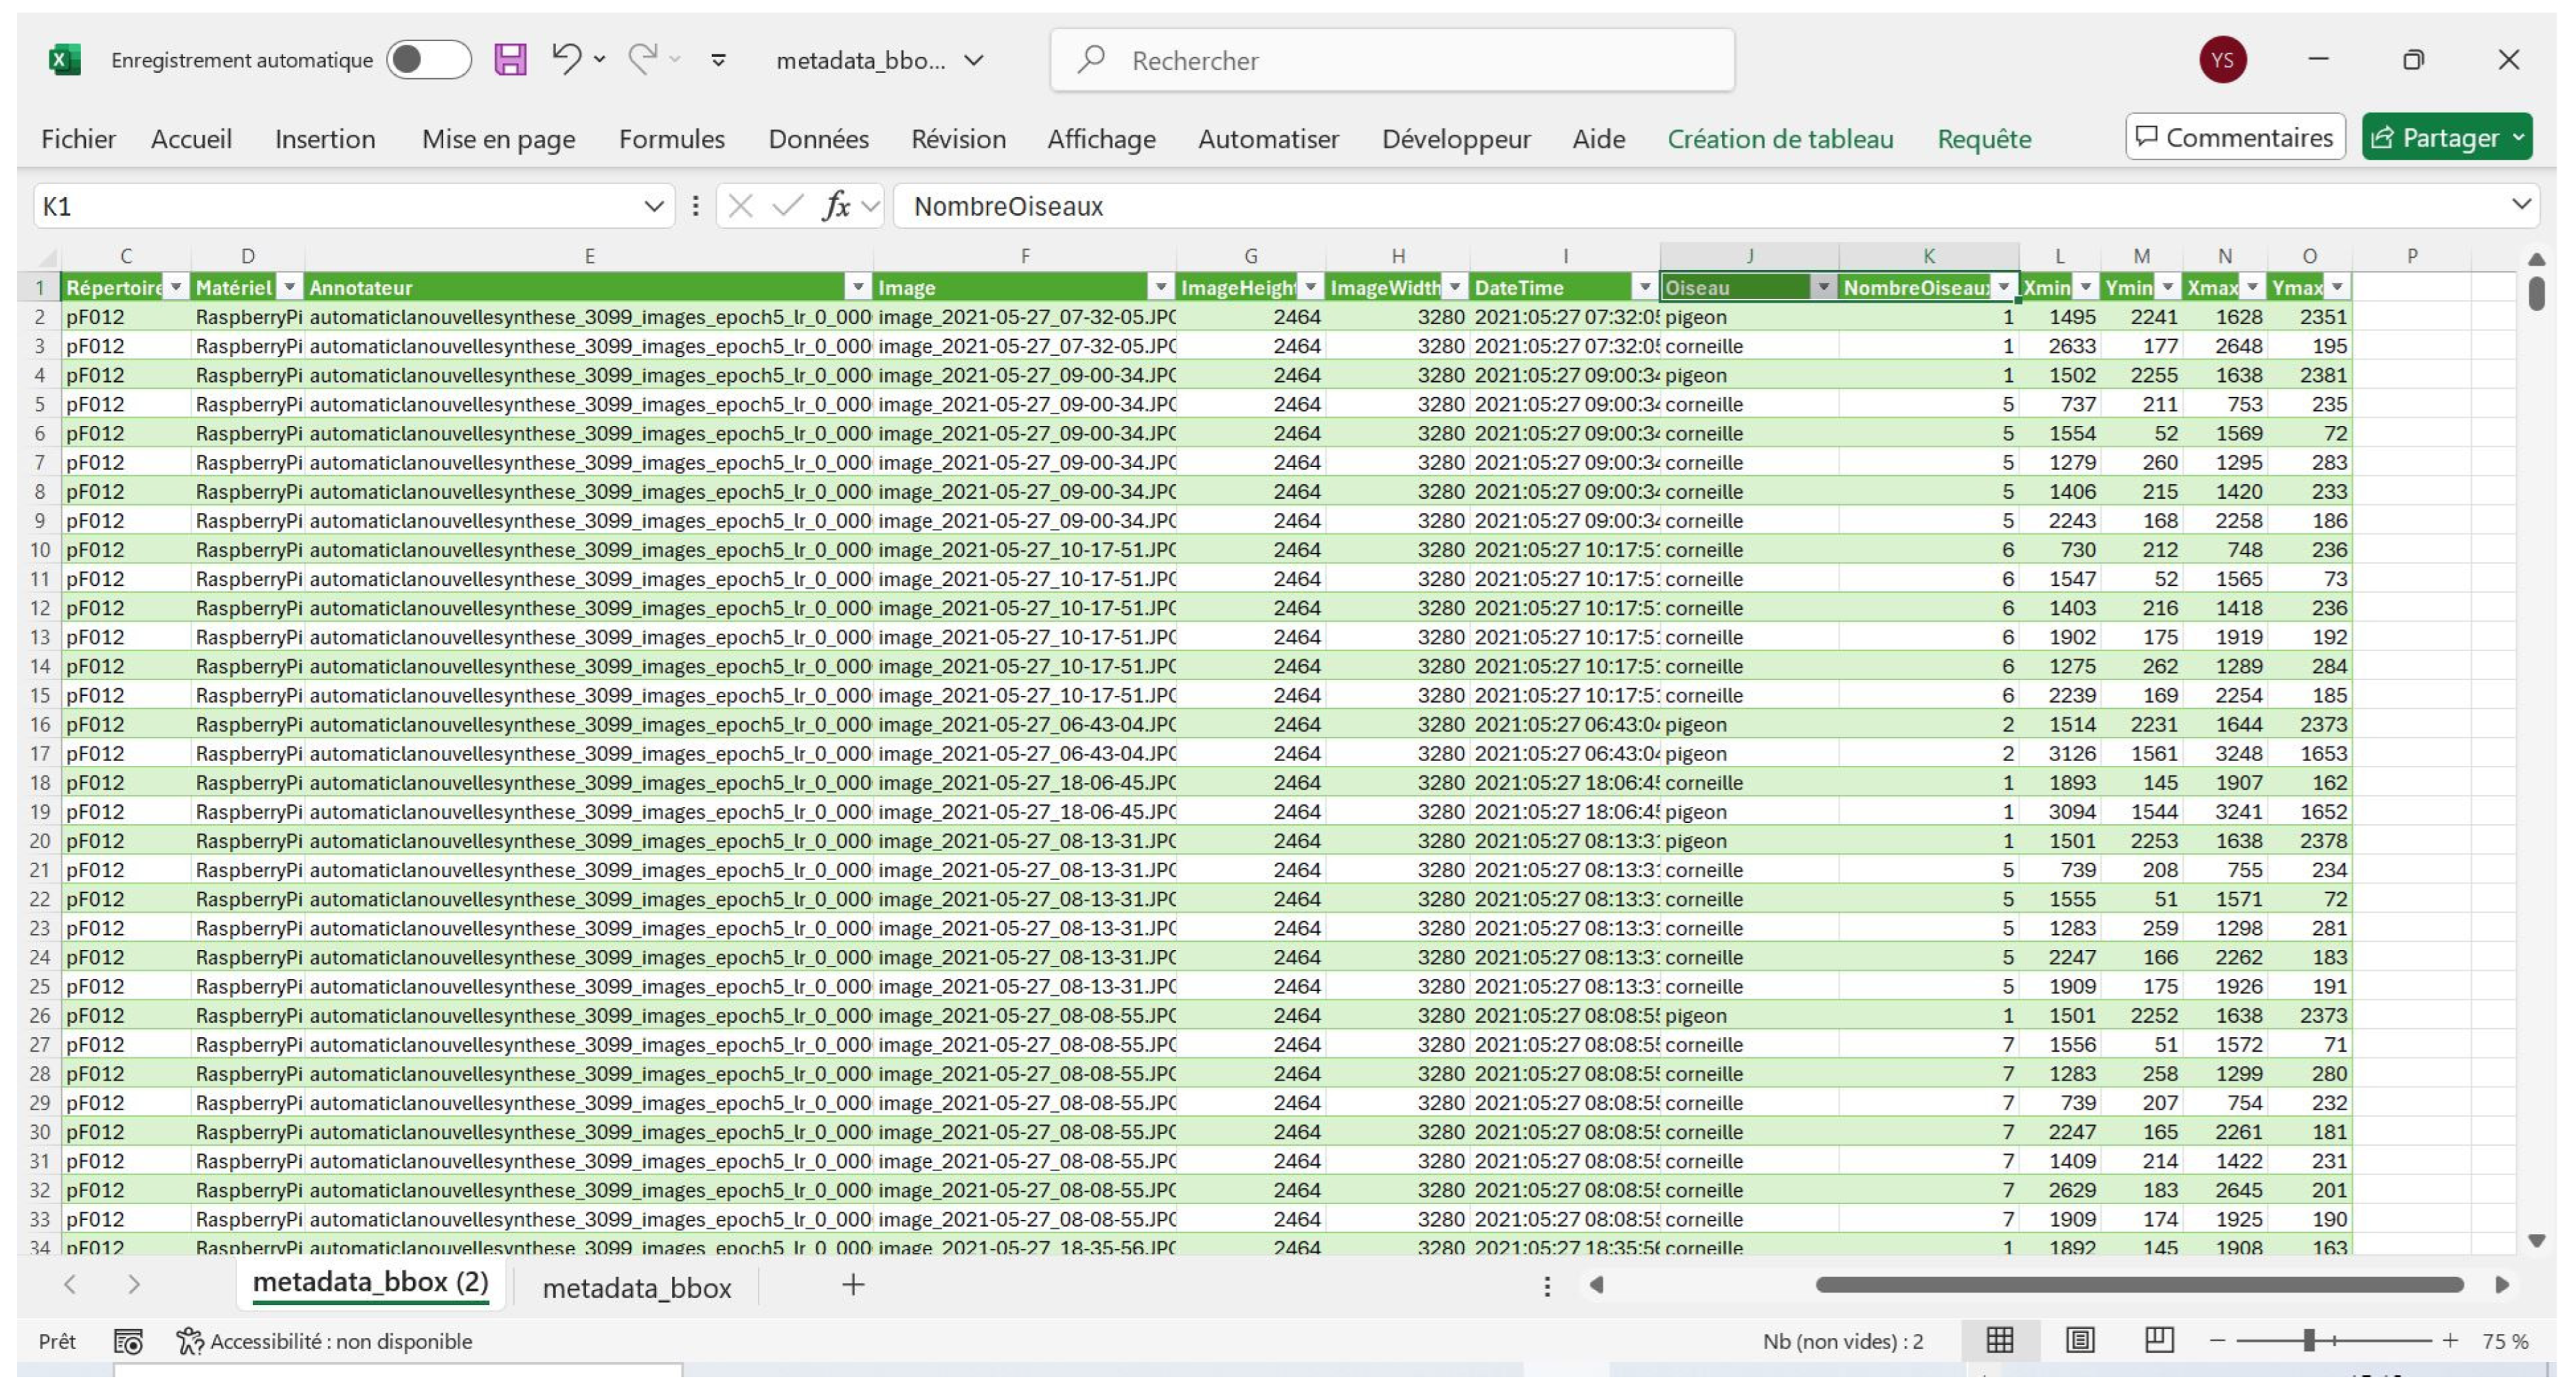
For each plot, we recorded 23 metadata fields, including details such as the crop type, cropping system, and the extent of damage caused by corvids and pigeons. The intensity of the damage was categorized into four qualitative levels: no attack, weak attack, moderate attack, and strong attack. The primary crops grown on these plots are corn and sunflowers. This metadata was stored in a CSV format, as shown in Figure 1.
Figure 1.
Example of key metadata related to damage caused to plots by corvids and pigeons in 2023.
Furthermore, we developed our model using the following hardware and software resources:
3.1. Software and Hardware Ecosystem
3.1.1. Software
The primary packages and libraries utilized in this study are as follows:
- Mask-RCNN2 framework (the latest version), based on TensorFlow 2.2.0 and Keras 2.3.1.
- Anaconda Navigator 2.5.0.
- Conda 23.3.1.
- H5py 2.10.0.
- Matplotlib 3.5.3.
- Numpy 1.21.6.
- OpenCv-Python 4.5.1.78.
- Pandas 1.3.5.
- Plotly 5.18.0.
- Python 3.7.16.
- Scikit-image 0.16.2.
- Scikit-learn 1.0.2.
- Scipy 1.4.1.
- Spyder 5.0.1.
- Red hat Enterprise Linux 9.4 (Plow).
3.1.2. Hardware
This work was made possible thanks to the Jean-Zay supercomputer at Idris (Hewlett Packard Enterprise, CNRS campus in Orsay, France). For our development pipelines during both the training and validation phases, we used the Partition V100 (GPU-p2) configuration, which consists of 31 octo-GPU accelerated compute nodes with the following specifications:
- 2 Intel Xeon Gold 6226 processors (12 cores at 2.7 GHz), providing a total of 24 cores per node;
- 20 nodes with 384 GB of memory.
- 11 nodes with 768 GB of memory.
- 8 Nvidia Tesla V100 SXM2 32 GB GPUs.
3.2. Model Construction Methodology
The construction of the model can be summarized in several stages. It began with the acquisition of images in the field, their annotation, the reduction of their size without loss of quality, image augmentation by instantiating the hyperparameters, the learning phase on a high-performance computing (HPC), the validation of the model on new data, and, finally, the exploitation of the model through its various uses. This multi-step process was essentially iterative until satisfactory results were achieved. The following key points describe the main steps involved in this process:
3.3. Data Processing
To build our neural network model, we began by annotating a large number (3099) of these images with the help of several annotators. We named this annotated dataset BirdyDataset.
- Raw Images: The images acquired in the field generally range in size from 5 to 8.2 MB. We enhanced our dataset with smaller images, the smallest being 31.7 KB, with resolutions ranging from 5200 × 3900 to 228 × 228 pixels.
- Image Size Reduction: Using the OpenCV library, we reduced the size of these images to approximately 1 MB without any loss of quality. This reduction resulted in time savings during processing and improved accuracy for Mask-RCNN.
- Image Annotation: We used LabelImg, a graphical image annotation tool, for the annotation process. The annotations were saved as XML files in the PASCAL VOC format, with some annotations also stored in JSON format. We annotated over 3000 of these raw images. Because the individuals in the images were very small, the process of annotation and verification required zooming in on each image. Despite our best efforts, occasional oversight (i.e., false negatives) could occur. This annotation process, along with the necessary verification, involved multiple iterations and was quite tedious and time-consuming.
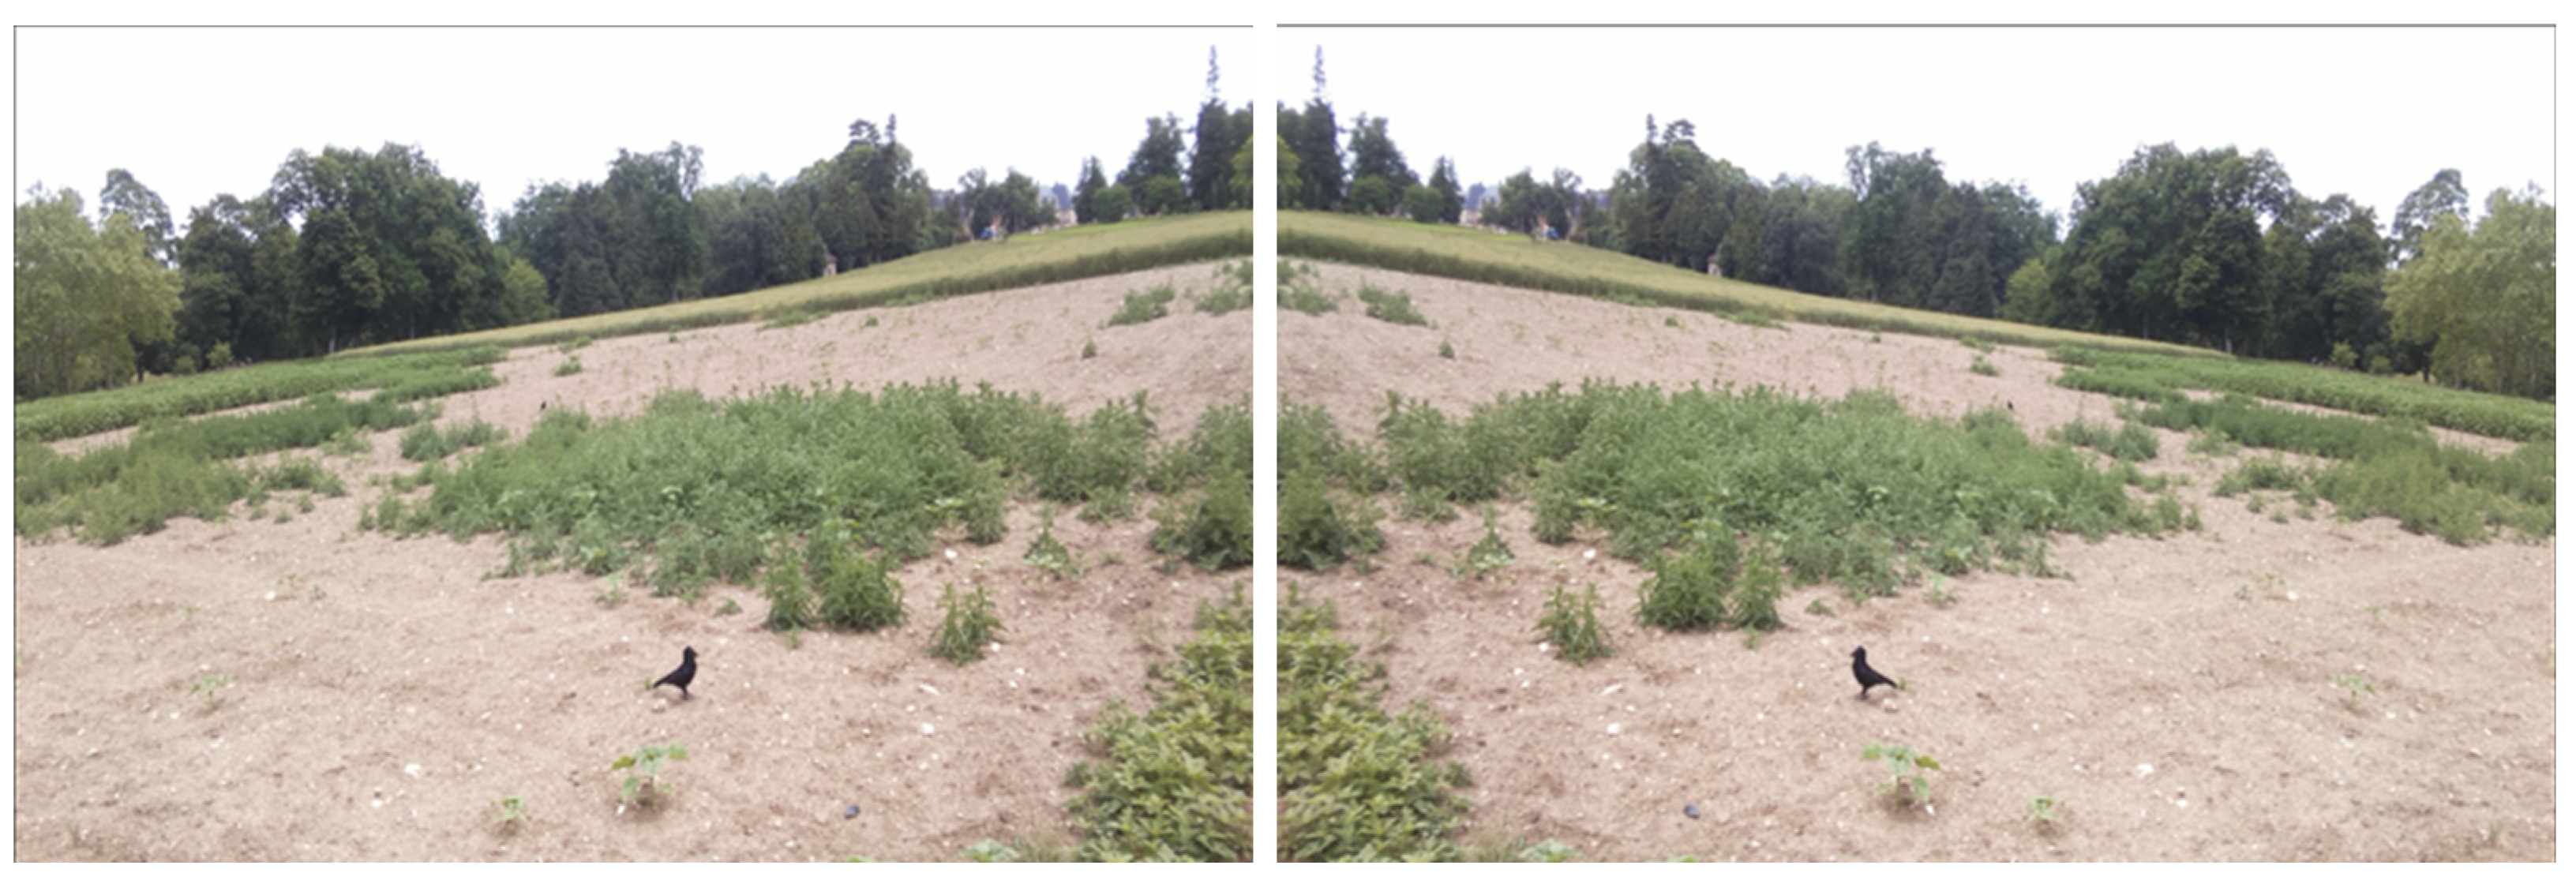
- Image augmentation: To avoid distorting the individuals, we applied image augmentation using only mirror symmetry, as shown in Figure 2.Figure 2. An example of image augmentation using mirror symmetry. The original image is shown on the (left), while the mirror-symmetrical version of the image is displayed on the (right).
- Dataset: Over 3000 images, each no larger than 1 MB, were annotated to form our dataset, named BirdyDataset. This size is optimal for processing with Mask-RCNN, which, while capable of handling larger images, reduces all inputs to a standard size of no more than 1 MB before processing. This resizing by Mask-RCNN can potentially result in a loss of image quality as well as misalignment in the bounding box coordinates.In 2024, we annotated 2753 new JPG images, which were not part of the initial training phase. These images were converted from JSON to XML format to align with our processing pipeline. The annotated images contain 547 corvids and 165 pigeons, though many of them are devoid of individuals, featuring only the plot or background. This provides an excellent opportunity to test our model’s ability to detect the presence or absence of individuals in a given scene.
- Query the metadata: In the Python ecosystem, Lambda functions and the Pandas library allow us to query databases in a simple and concise manner. To illustrate, let’s say we want to identify the plots most intensely damaged by corvids and pigeons. Before we can formulate this question, we first need to load our metadata, which is typically stored in a CSV or similar format. For example, we can use Pandas to read the metadata as follows:
Step 1: Read the Dataset
First, you need to load your dataset using pandas.read_csv() correctly:
	import pandas as pd
	# Read the dataset from the 'metadata.csv' file
	datagram = pd.read_csv('metadata.csv')
Step 2: Apply the Lambda Function for Querying
Now, let us write the query you mentioned to find plots that have been attacked by both corvids and pigeons with strong damage.
  # Create a new column to check for both corvid and pigeon
  #damage with strong intensity
  datagram['newcolumn'] = datagram.apply(lambda x:
  (x['corvid_damage'] == 'yes') and
  (x['corvid_damage_intensity'] == 'strong') and
  (x['colombid_damage'] == 'yes') and
  (x['colombid_damage_intensity'] == 'strong'), axis=1)
Step 3: Filter Rows Based on the Condition
You then filter the DataFrame to only include rows where the newcolumn is True (i.e., where both corvid and pigeon damage meet the criteria):
datagram_both_damage = datagram[datagram['newcolumn'] == True]
  # Display the result
  print(datagram_both_damage)
Step 4: Output
The output should be a list of plots that have both corvid and pigeon damage with a strong intensity. If the dataset includes a plot named “la_vallee_grand_jean”, it should appear in the result:
  # The result of the query should give the identifiers of the
  #plots attacked:
  print(datagram_both_damage['plot_id'])
This would print the plot identifiers where the damage by both species meets your criteria. If “la_vallee_grand_jean” is part of the result, it will be displayed here.
3.4. Hyperparameters
Over the last five years, in a separate research project focused on the detection of crop pests and auxiliary organisms (such as worms, slugs, and carabids), we developed a realistic annotated dataset called BioAuxDataset [20]. This dataset was used to train a Mask-RCNN model for automatic organism recognition. The results from this model were highly successful, with both mean average precision (mAP) and recall exceeding 90%.
However, when applying the Mask-RCNN model to our BirdyDataset, the results were far from satisfactory. Using the default configuration of Mask-RCNN—designed primarily for large and medium-sized individuals—we obtained a disappointing mAP of only 20%.
Upon closer inspection of the size distribution of individuals in the BirdyDataset, we found that a significant majority of the individuals are small. The statistical breakdown of the dataset is as follows:
- Small individuals: 86.79%.
- Medium-sized individuals: 11.98%.
- Large individuals: 1.23%.
This size distribution (represented in Table 2 below) explains the poor performance of Mask-RCNN with the default configuration. The model, optimized for detecting larger organisms, is not well-suited to the predominantly small individuals in the BirdyDataset.
Table 2.
The distribution of small, medium, and large objects in BirdyDataset.
Existing deep learning-based methods, such as Mask-RCNN, often struggle to accurately detect small objects because their default anchor scales are not well-suited for these sizes. To address this limitation, Zhu et al. [19] proposed the IA-Mask-RCNN detection method, which incorporates an improved anchor scale design for the detection of surface defects in automotive engine parts. Their results highlight the significant influence of choosing appropriate anchor scales on the model’s detection performance. Before discussing the optimization of anchor scale selection, it is important to first define the concept of anchor boxes, as this parameter plays a crucial role in object detection using convolutional neural networks (CNNs). If anchor boxes are not properly tuned, the network will struggle to learn the correct representation of small or large objects, which will negatively affect its ability to detect them accurately.
3.4.1. Anchor Boxes and Bounding Boxes
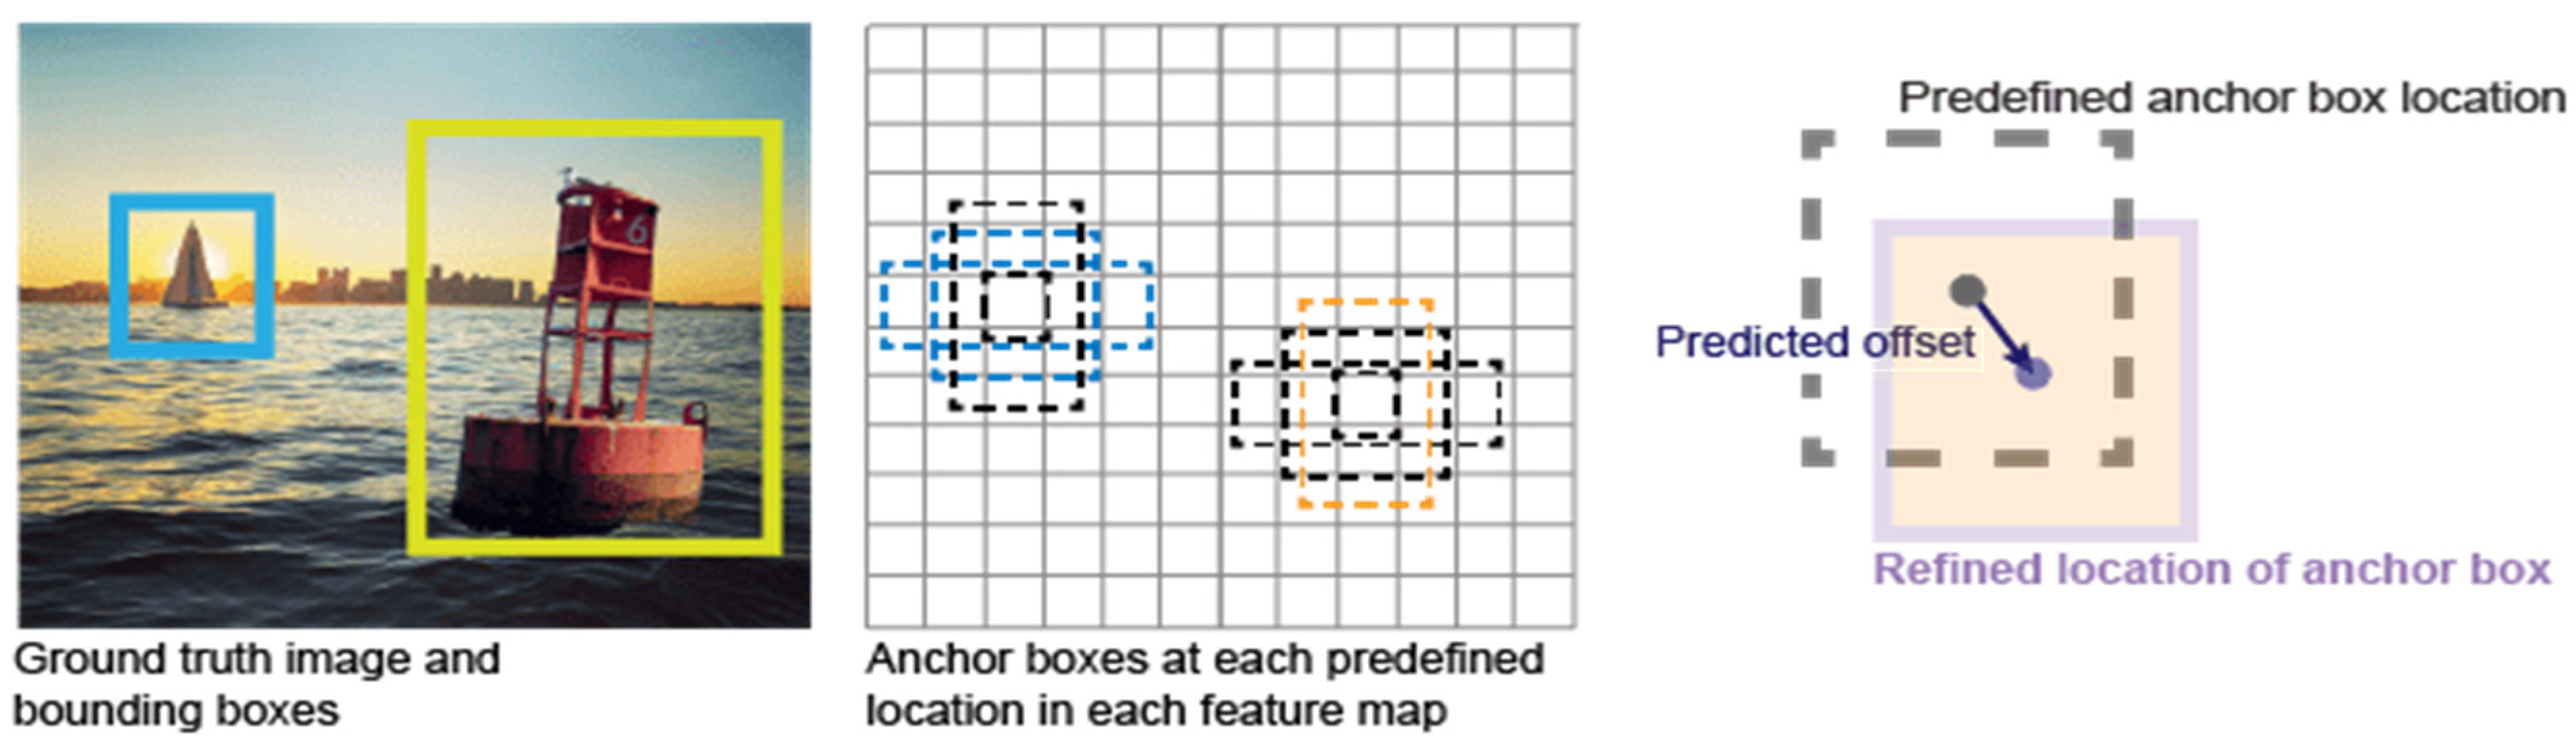
In object detection algorithms such as Mask-RCNN and YOLO, anchor boxes are used to generate candidate regions and predict adjustments to bounding boxes along with associated confidence scores. These predictions allow the model to refine the anchor boxes so that they better match the ground-truth bounding boxes, which are the actual annotated locations of objects used to evaluate the model’s accuracy during training and testing.
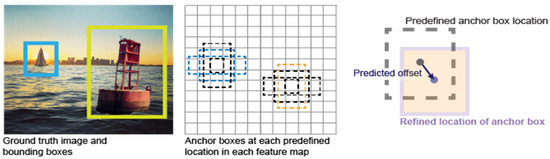
A bounding box is a rectangular region that encloses an object or a specific region of interest within an image. It is defined by four coordinates: for the top-left corner and for the bottom-right corner (illustrated in the leftmost figure of Figure 2).
Anchor boxes, on the other hand, are predefined bounding boxes with specific sizes, aspect ratios, and positions that serve as reference templates during object detection (central figure in Figure 2). These anchor boxes are placed systematically across the image, often in a grid-like pattern, to capture objects of different scales and shapes (rightmost figure in Figure 3).
Figure 3.
Bounding boxes (left image) represent the ground-truth annotations used to localize objects. Anchor boxes (center and right images) are predefined reference boxes with specific sizes and aspect ratios, systematically placed across the image to capture objects of varying scales and shapes.
During both training and inference, thousands of anchor boxes (also called prior boxes) are generated to predict the most accurate location, size, and shape of objects relative to their reference boxes. For each anchor box, the model calculates which ground-truth bounding box it overlaps with the most. This overlap is measured using Intersection over Union (IoU), defined as follows:
By default, Mask-RCNN uses an IoU threshold of 0.5. This means that if an anchor box overlaps with a ground-truth bounding box with an IoU greater than or equal to 0.5, the object is considered detected. While this threshold works well for medium and large objects, it is often too high for small objects, which tend to produce lower IoU values with the default anchor boxes.
For this reason, and due to other limitations of the default configuration, we began fine-tuning the Mask-RCNN hyperparameters, including anchor scales and IoU thresholds, to improve detection performance on small objects.
3.4.2. Hyperparameters Tuning
Essentially, we focused on 3 hyperparameters:
- The IoU: By default, in the Mask-RCNN, the IoU is set to 0.5. However, with this value, small individuals will not be detected and never recognized in the learning phase. Therefore, to detect these small objects, we set this threshold to a smaller value, namely 0.35.
- The anchor shape: Anchors shape varies in form as the height-to-width ratio quotient. The anchor ratio adopted by default is (0.5, 1, 2), which can cover 95.91% of the samples. Therefore, this ratio value was also adopted in our method.
- The anchor size: In the Mask-RCNN, the anchor width and height in pixels vary from the smallest interval to the largest: 0–2, 2–4, 4–8, 8–16, 16–32, 32–64, 64–128, 128–256, and 256–512. The Mask-RCNN, in its default configuration, is more suitable for medium to large objects; the anchor scale adopted in this study was (32, 64, 128, 256, 512).
To measure the performance of a learning model built with the Mask-RCNN, the most important error indicators are the overall error of the model (Total Loss), the prediction errors on the bounding boxes (Bbox Loss), and the error prediction on the classes (Class Loss). Zhu et al. (2022) [19] tested the performance of 5 networks with different anchors scales: (a) anchor scale = (32, 64, 128, 256, 512), (b) anchor scale = (16, 32, 64, 128, 256), (c) anchor scale = (8, 16, 32, 64, 128), (d) anchor scale = (4, 8, 16, 32, 64), and (e) anchor scale = (2, 4, 8, 16, 32).
It turned out that for the surface defect detection of automotive engine parts, the best-suited anchor scale was (8, 16, 32, 64, 128).
In our research project, as shown in Table 2, the majority of individuals in BirdyDataset were small, while the remaining, i.e., less than 16%, were medium-sized. Consequently, and in line with the definition of individual category sizes in Table 1, the size of our individuals in BirdyDataset varied in the interval [0 × 0, 96 × 96], and more precisely, in the interval [16 × 16, 96 × 96], as the smallest bounding box was 16 × 16 pixels in size. Hence, the most optimal choice for our study was the anchor scale [16, 32, 64, 128, 256]. With this anchor scale, we could detect not only small and medium-sized objects but also a good proportion of large objects. We therefore used this anchor scale in both the learning and detection phases.
For our part, to detect small individuals, we essentially relied on the right choice of anchors in terms of size and shape, and on image augmentation. We also acted on certain key parameters in both the learning and detection phases, such as the learning rate and the intersection over union (IoU) values.
3.5. Metrics and Confusion Matrix
As seen previously, to measure the precision of a prediction on an image, we define the IoU (Intersection over Union) as follows:
IoU = Overlap area/Union area
By default, the IoU threshold is set to 0.5, but in our study, we set it to 0.35, as explained above.
- TP: True Positive: if IoU ≥ 0.35 and the label predicted corresponds to the object detected
- FP: False Positive: We have two cases:
- IoU < 0.35.
- Duplicate bounding boxes, e.g., many detections for one object.
- FN: False Negative: We have two cases:
- No detection at all while the object is present in the image.
- IoU ≥ 0.35, but the object has a wrong classification.
- TN: True Negative: This case supposes that there is no object inside a bounding box.
We do not have this case because it is assumed that there is always an object in it.
A confusion matrix is a table used to measure the performance of a machine learning algorithm. Each row of the confusion matrix represents the instances of a real class, and each column represents the instances of a predicted class. An element of the confusion matrix MCij expresses the number of times an object of class i is predicted as an object of class j. The elements located on the diagonal, i.e., MCii, are the correctly classified or correctly predicted elements, so the TP. So, prediction errors can be easily found in the table, as they will be represented by values outside the diagonal. Accuracy and recall are defined as follows:
Precisioni = Mii/∑jMji = Mii/∑ rows
Recalli = Mii/∑jMij = Mii/∑ columns
The mean precision is the fraction of cases where the algorithm correctly predicted class i out of all instances where the algorithm predicted i (correctly and incorrectly, so TP and FP). Recall, on the other hand, is the fraction of cases where the algorithm correctly predicted i out of all the cases which are labeled as i (TP and FN). In other words:
Precision = TP/(TP + FP)
Recall = TP/(TP + FN)
If we fix a row and sum over the columns,
Σ columns = TP + FN
And, if we fix a column and sum over the rows,
Σ rows = TP + FP
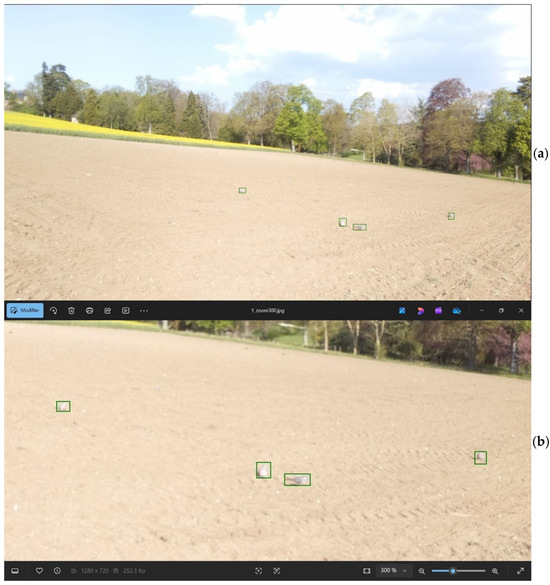
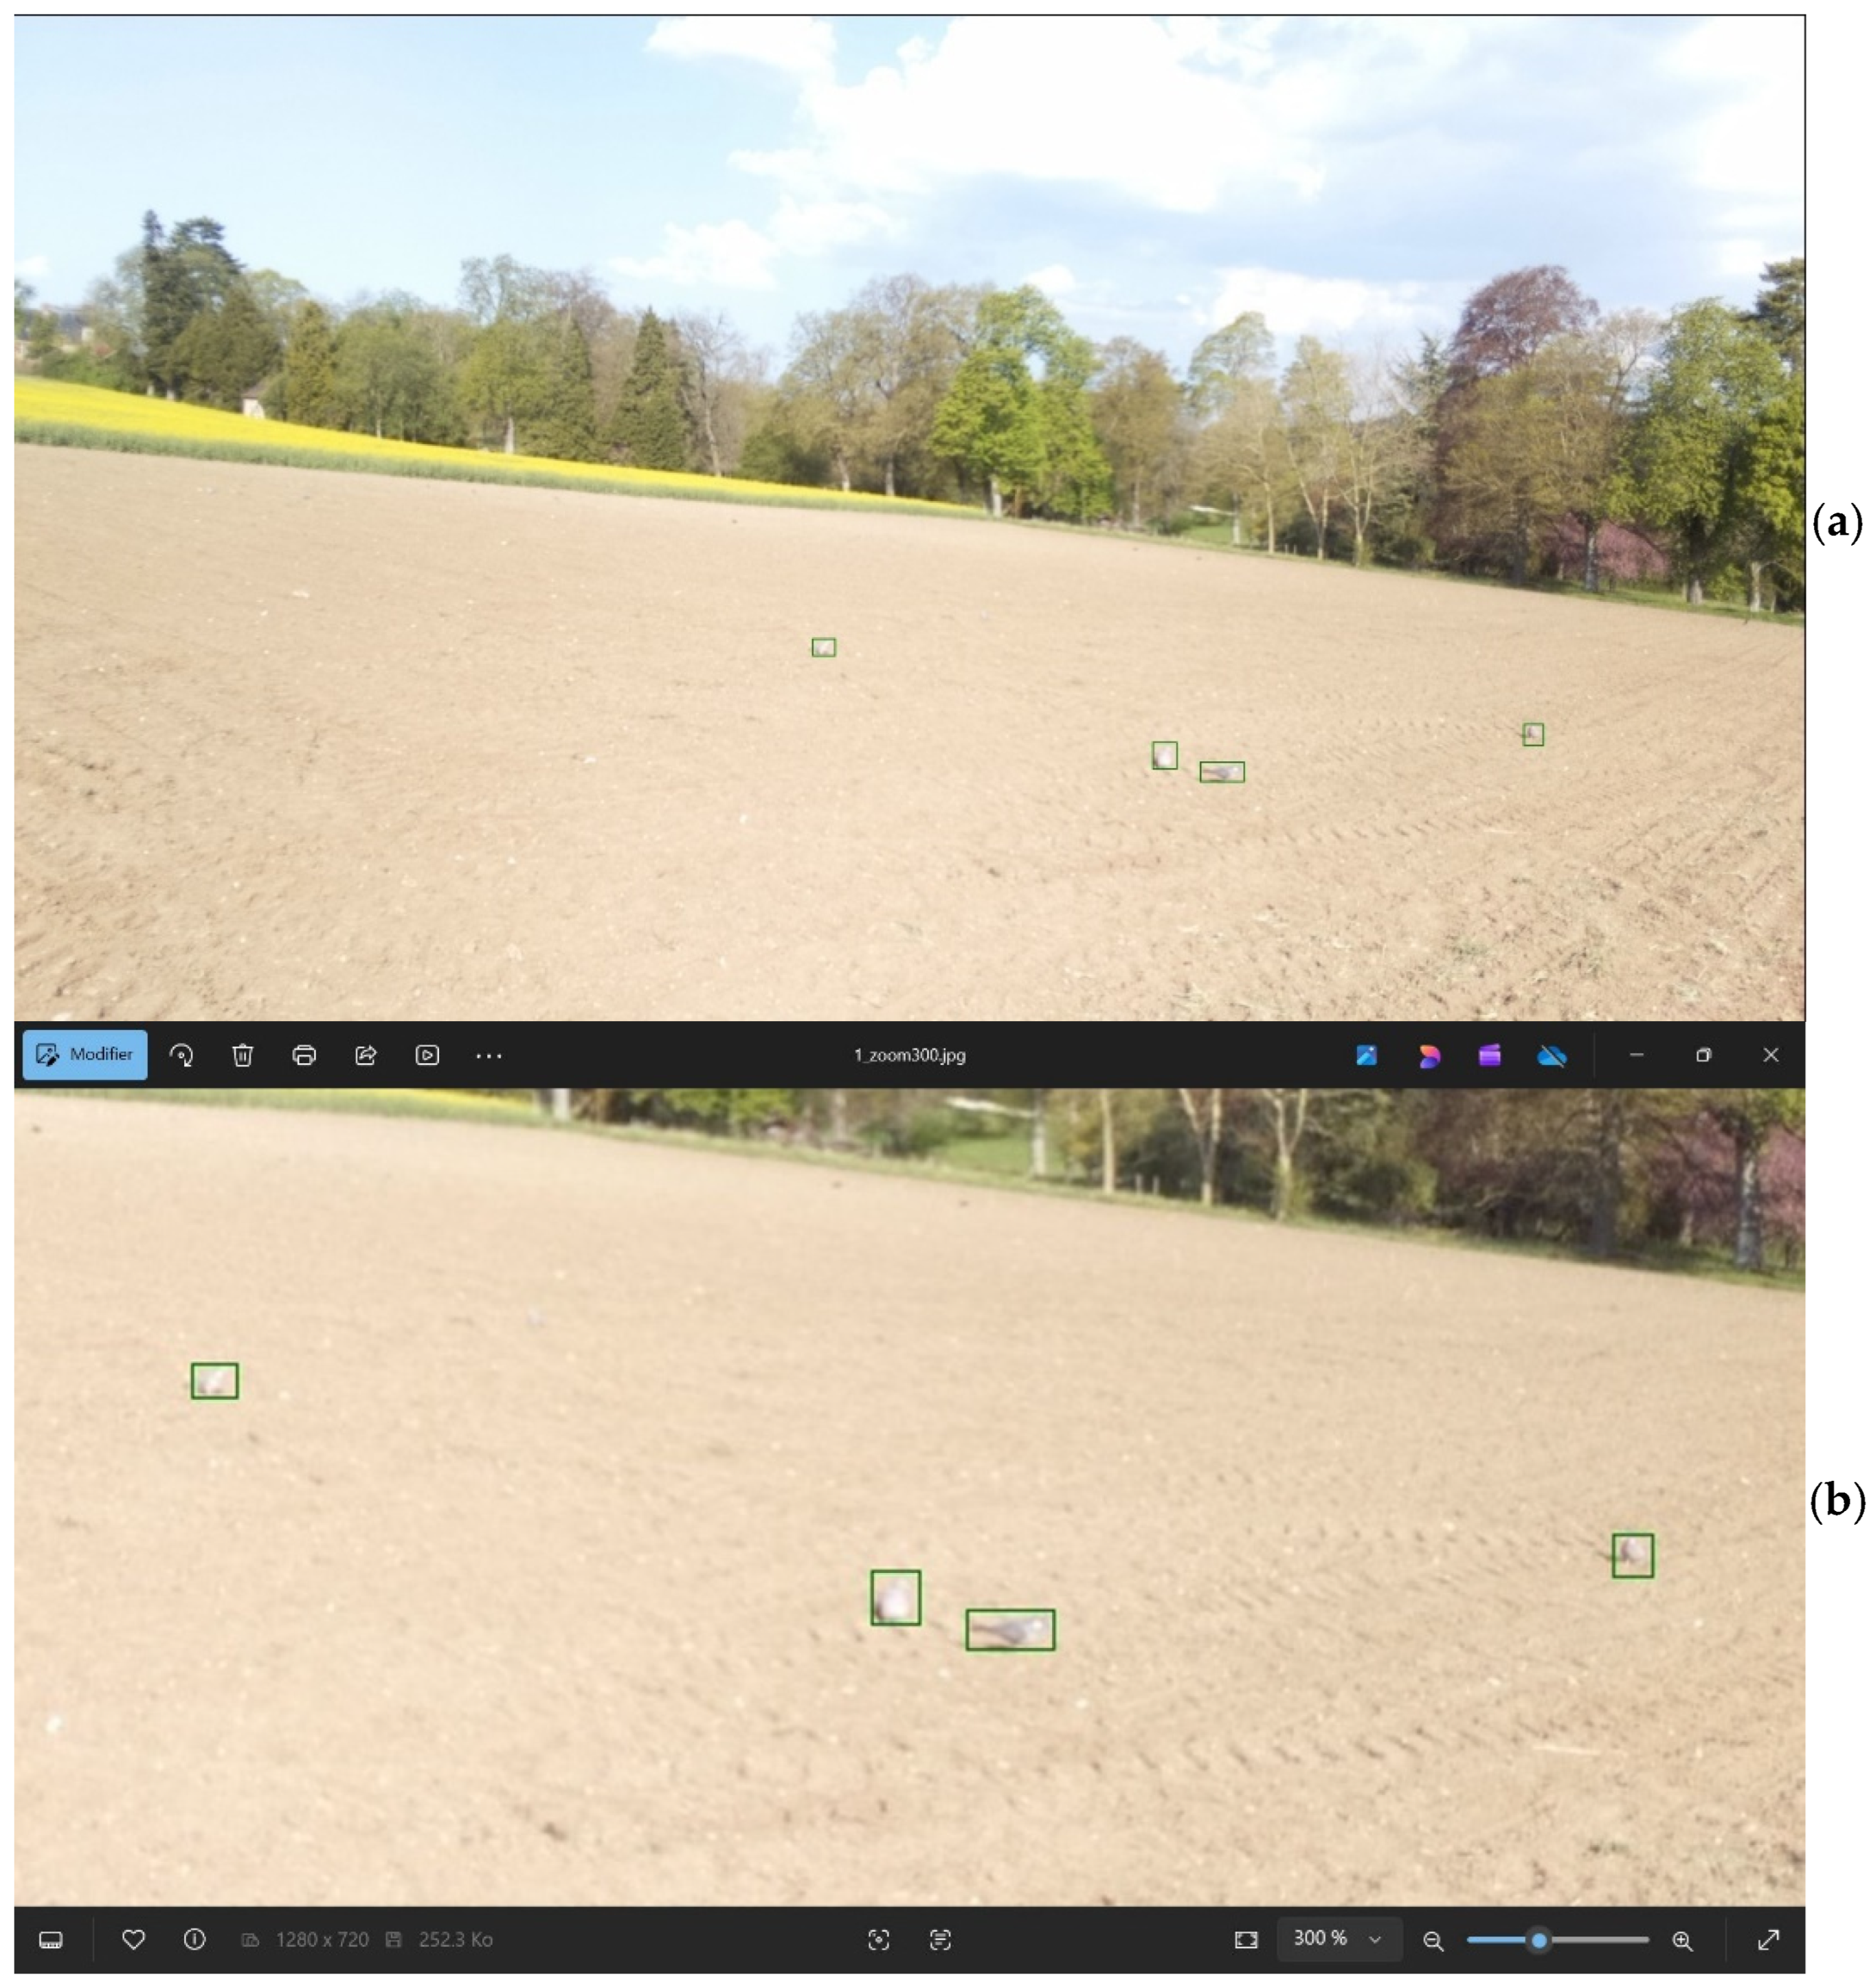
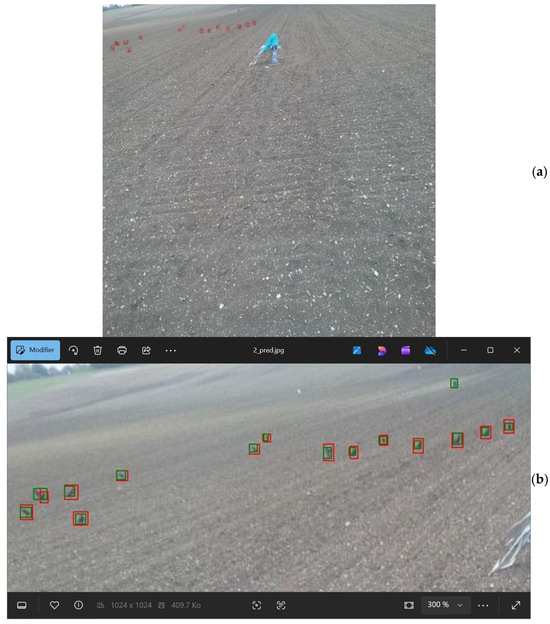
In the following, we present sample images from our dataset to illustrate these concepts and to give an overview of the various field conditions that can influence both manual annotation and, consequently, the training phase and bird detection (see Figure 4 and Figure 5).
Figure 4.
(a) Original image without zoom. In this image, all four pigeons are correctly detected, resulting in four True Positives (TP = 4). (b) Zoomed-in view (300%) of the original image, providing a clearer distinction of the detected pigeons. In the background, small black spots—no larger than 5 pixels—are faintly visible and could potentially correspond to the presence of corvids or additional pigeons.
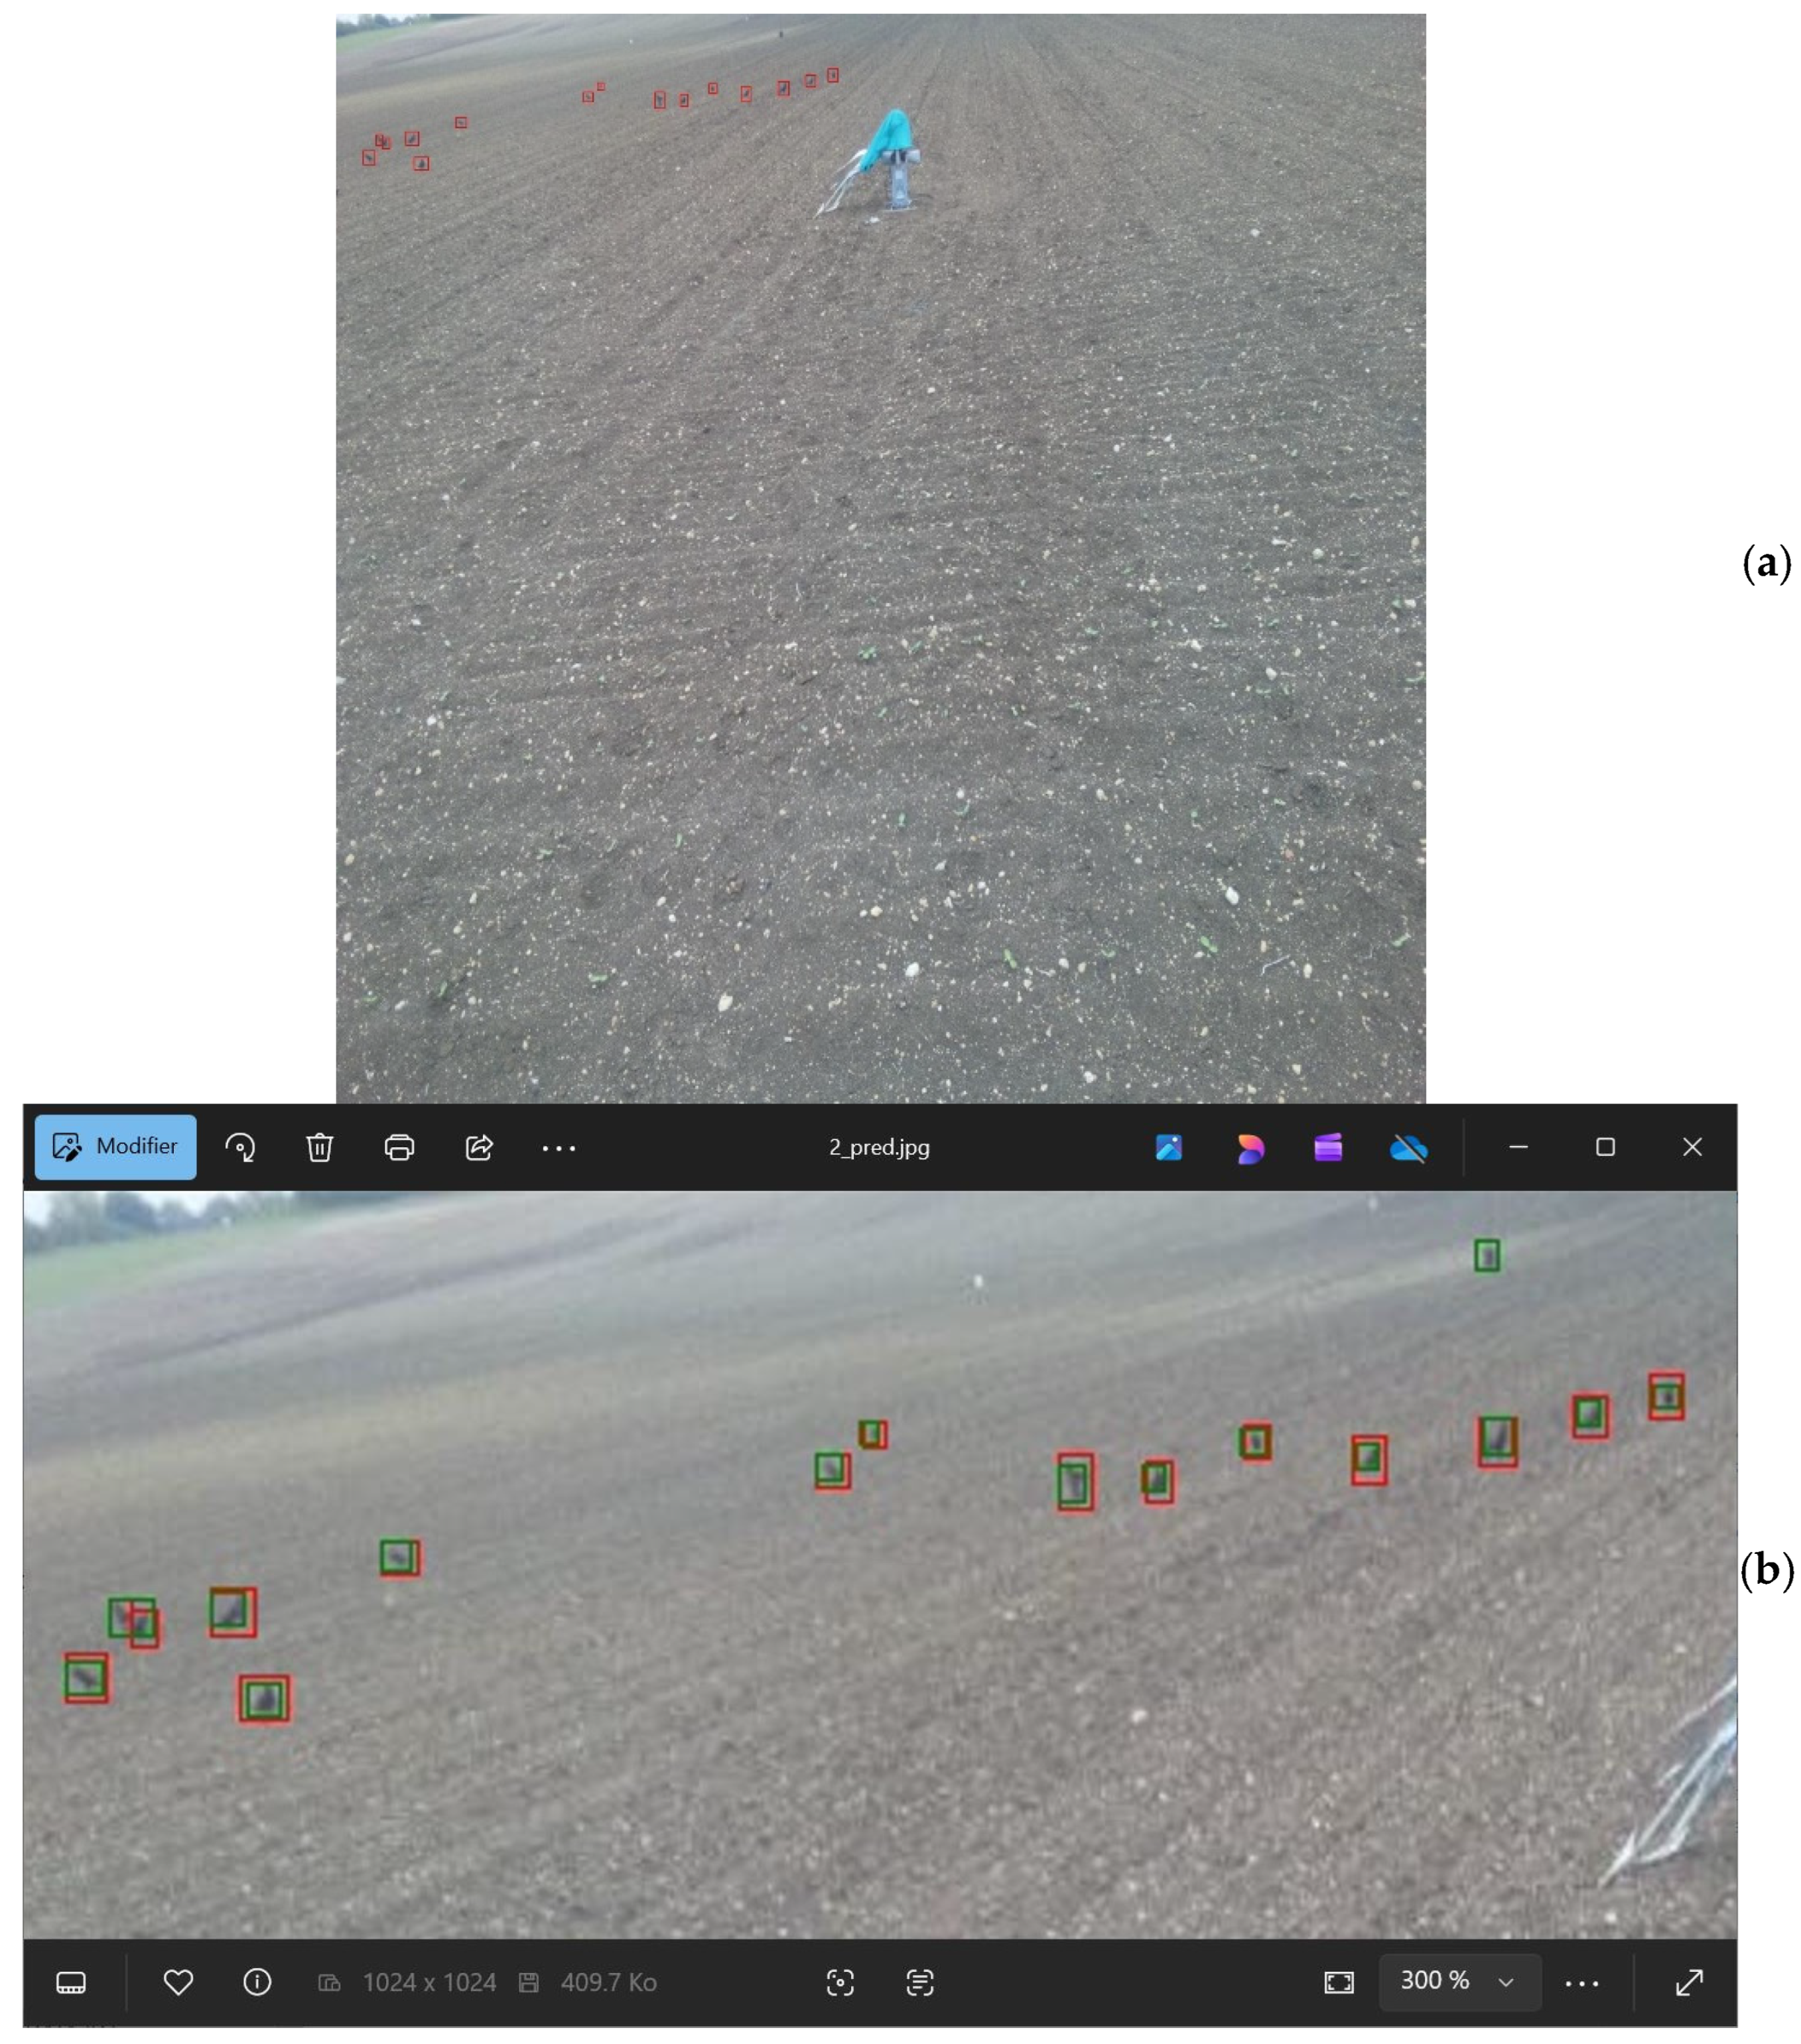
Figure 5.
(a) The original image showing 15 manually annotated corvids. Two overlapping corvids were annotated as a single individual due to their small size, which resulted in one corvid being missed in the manual annotation. However, the model (shown in the bottom image) accurately distinguishes between the two corvids. A scarecrow pole is also visible in the center of the image. (b) A zoomed-in view (300%) of the same image. All 15 corvids (highlighted in green) are correctly detected. However, the model also produced a false positive detection at the bottom of the image, which corresponds to a terminal, not a corvid.
4. Model Construction and Optimization
4.1. Training Phase
After building our BirdyDataset with 3099 annotated images, we adapted Mask-RCNN to our specific context. Although the model has around a hundred meta-parameters, we focused on a select few that had the most impact on performance. Various configurations were tested, with the best results obtained using the following hyperparameter settings:
- IoU (learning phase): 0.35.
- IoU (detection phase): 0.5.
- IMAGE_MAX_DIM: 1024.
- IMAGE_MIN_DIM: 500.
- STEPS_PER_EPOCH: 3099.
- RPN_ANCHOR_SCALES: (16, 32, 64, 128, 256).
- LEARNING_RATE: 0.0006.
- BATCH_SIZE: 3099.
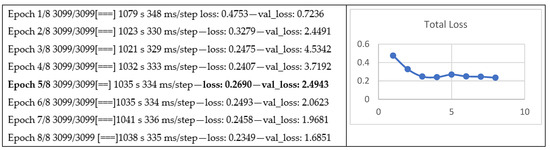
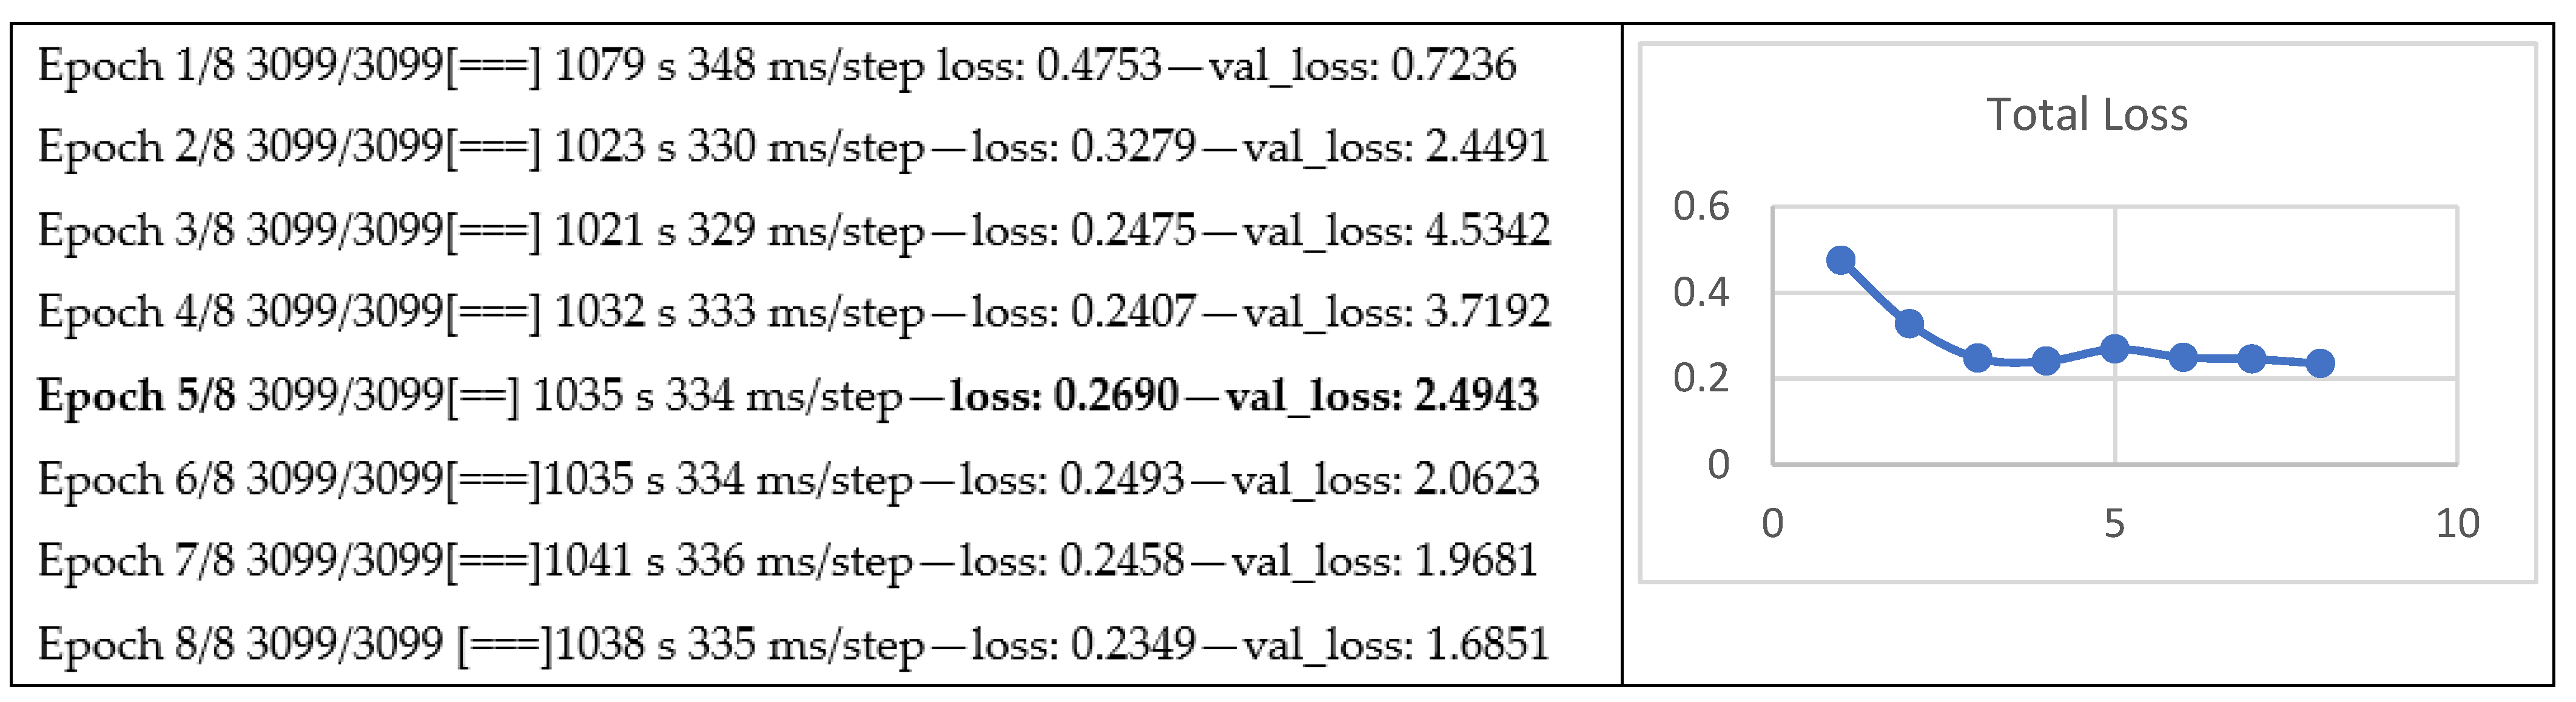
The model was trained for 8 epochs on 3099 annotated images. Each epoch took approximately 17–18 min, with the loss and validation loss evolving as follows (Figure 6):
Figure 6.
Epochs 4, 5, and 6 are near the minimum of the loss curve. Epoch 5, with a training loss of 0.2690, represents the best compromise balancing accurate learning while avoiding overfitting.
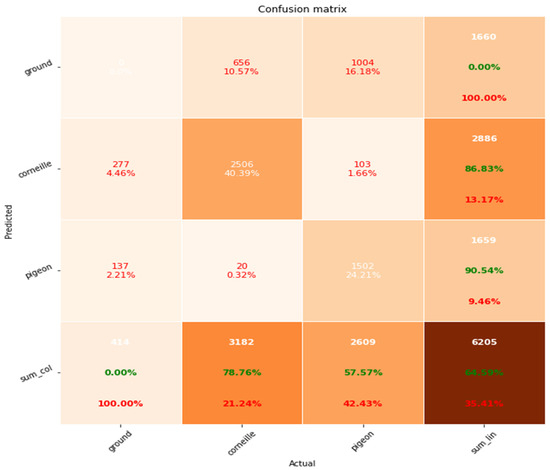
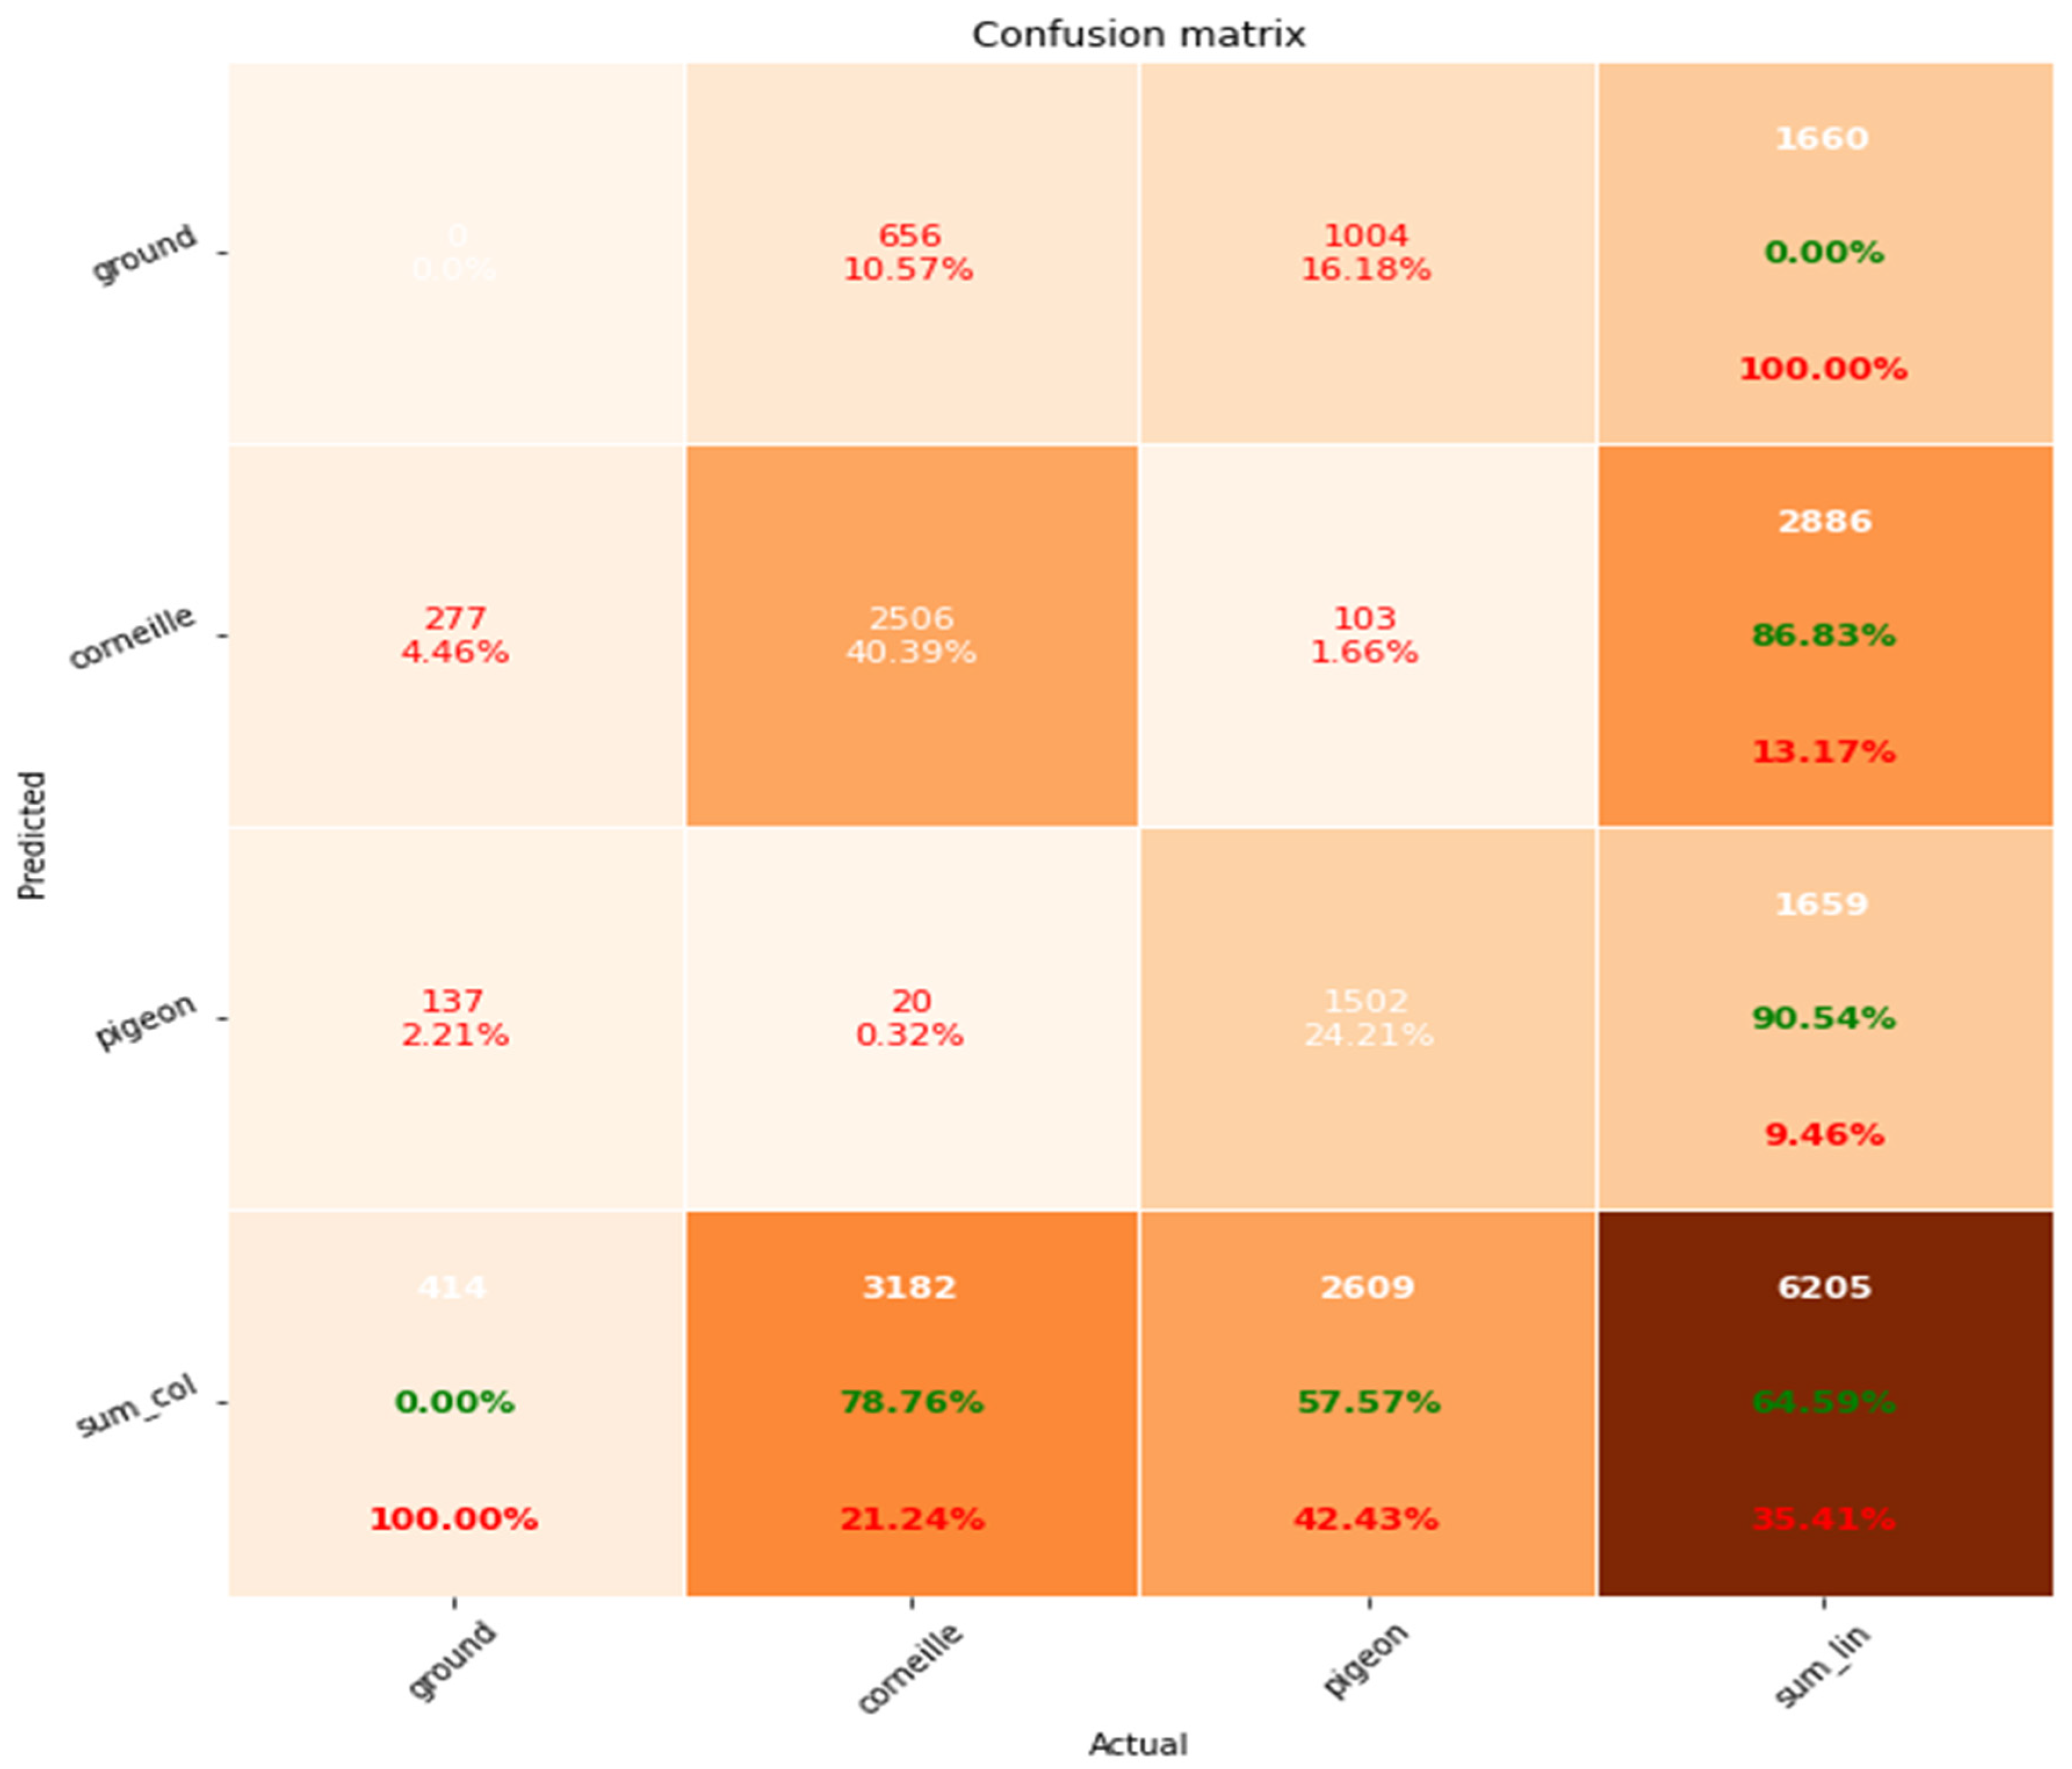
Furthermore, the confusion matrix for this training phase is presented in Figure 7.
Figure 7.
Metrics calculation from the training confusion matrix of the BirdyDataset (3099 images).
For the corvid class:
- True positives (TP) = 2506.
- False negatives (FN) = 277 + 103 = 380.
- False positives (FP) = 20 + 656 = 676.
The resulting precision and recall are calculated as follows:
For the pigeon class:
- TP = 1502.
- FN = 137 + 20 = 157.
- FP = 1004 + 103 = 1007.
Precision and recall are as follows:
It can be observed that corvids are detected more accurately than pigeons. This difference is primarily due to the coloration of pigeons, which often blends with the ground, making them less conspicuous and more difficult to detect. Images were acquired from dawn to sunset, and therefore, lighting conditions, weather variations (such as clouds or rain), and ground color significantly affect detection performance.
4.2. Model Optimization by Eliminating Large Individuals from the BirdyDataset
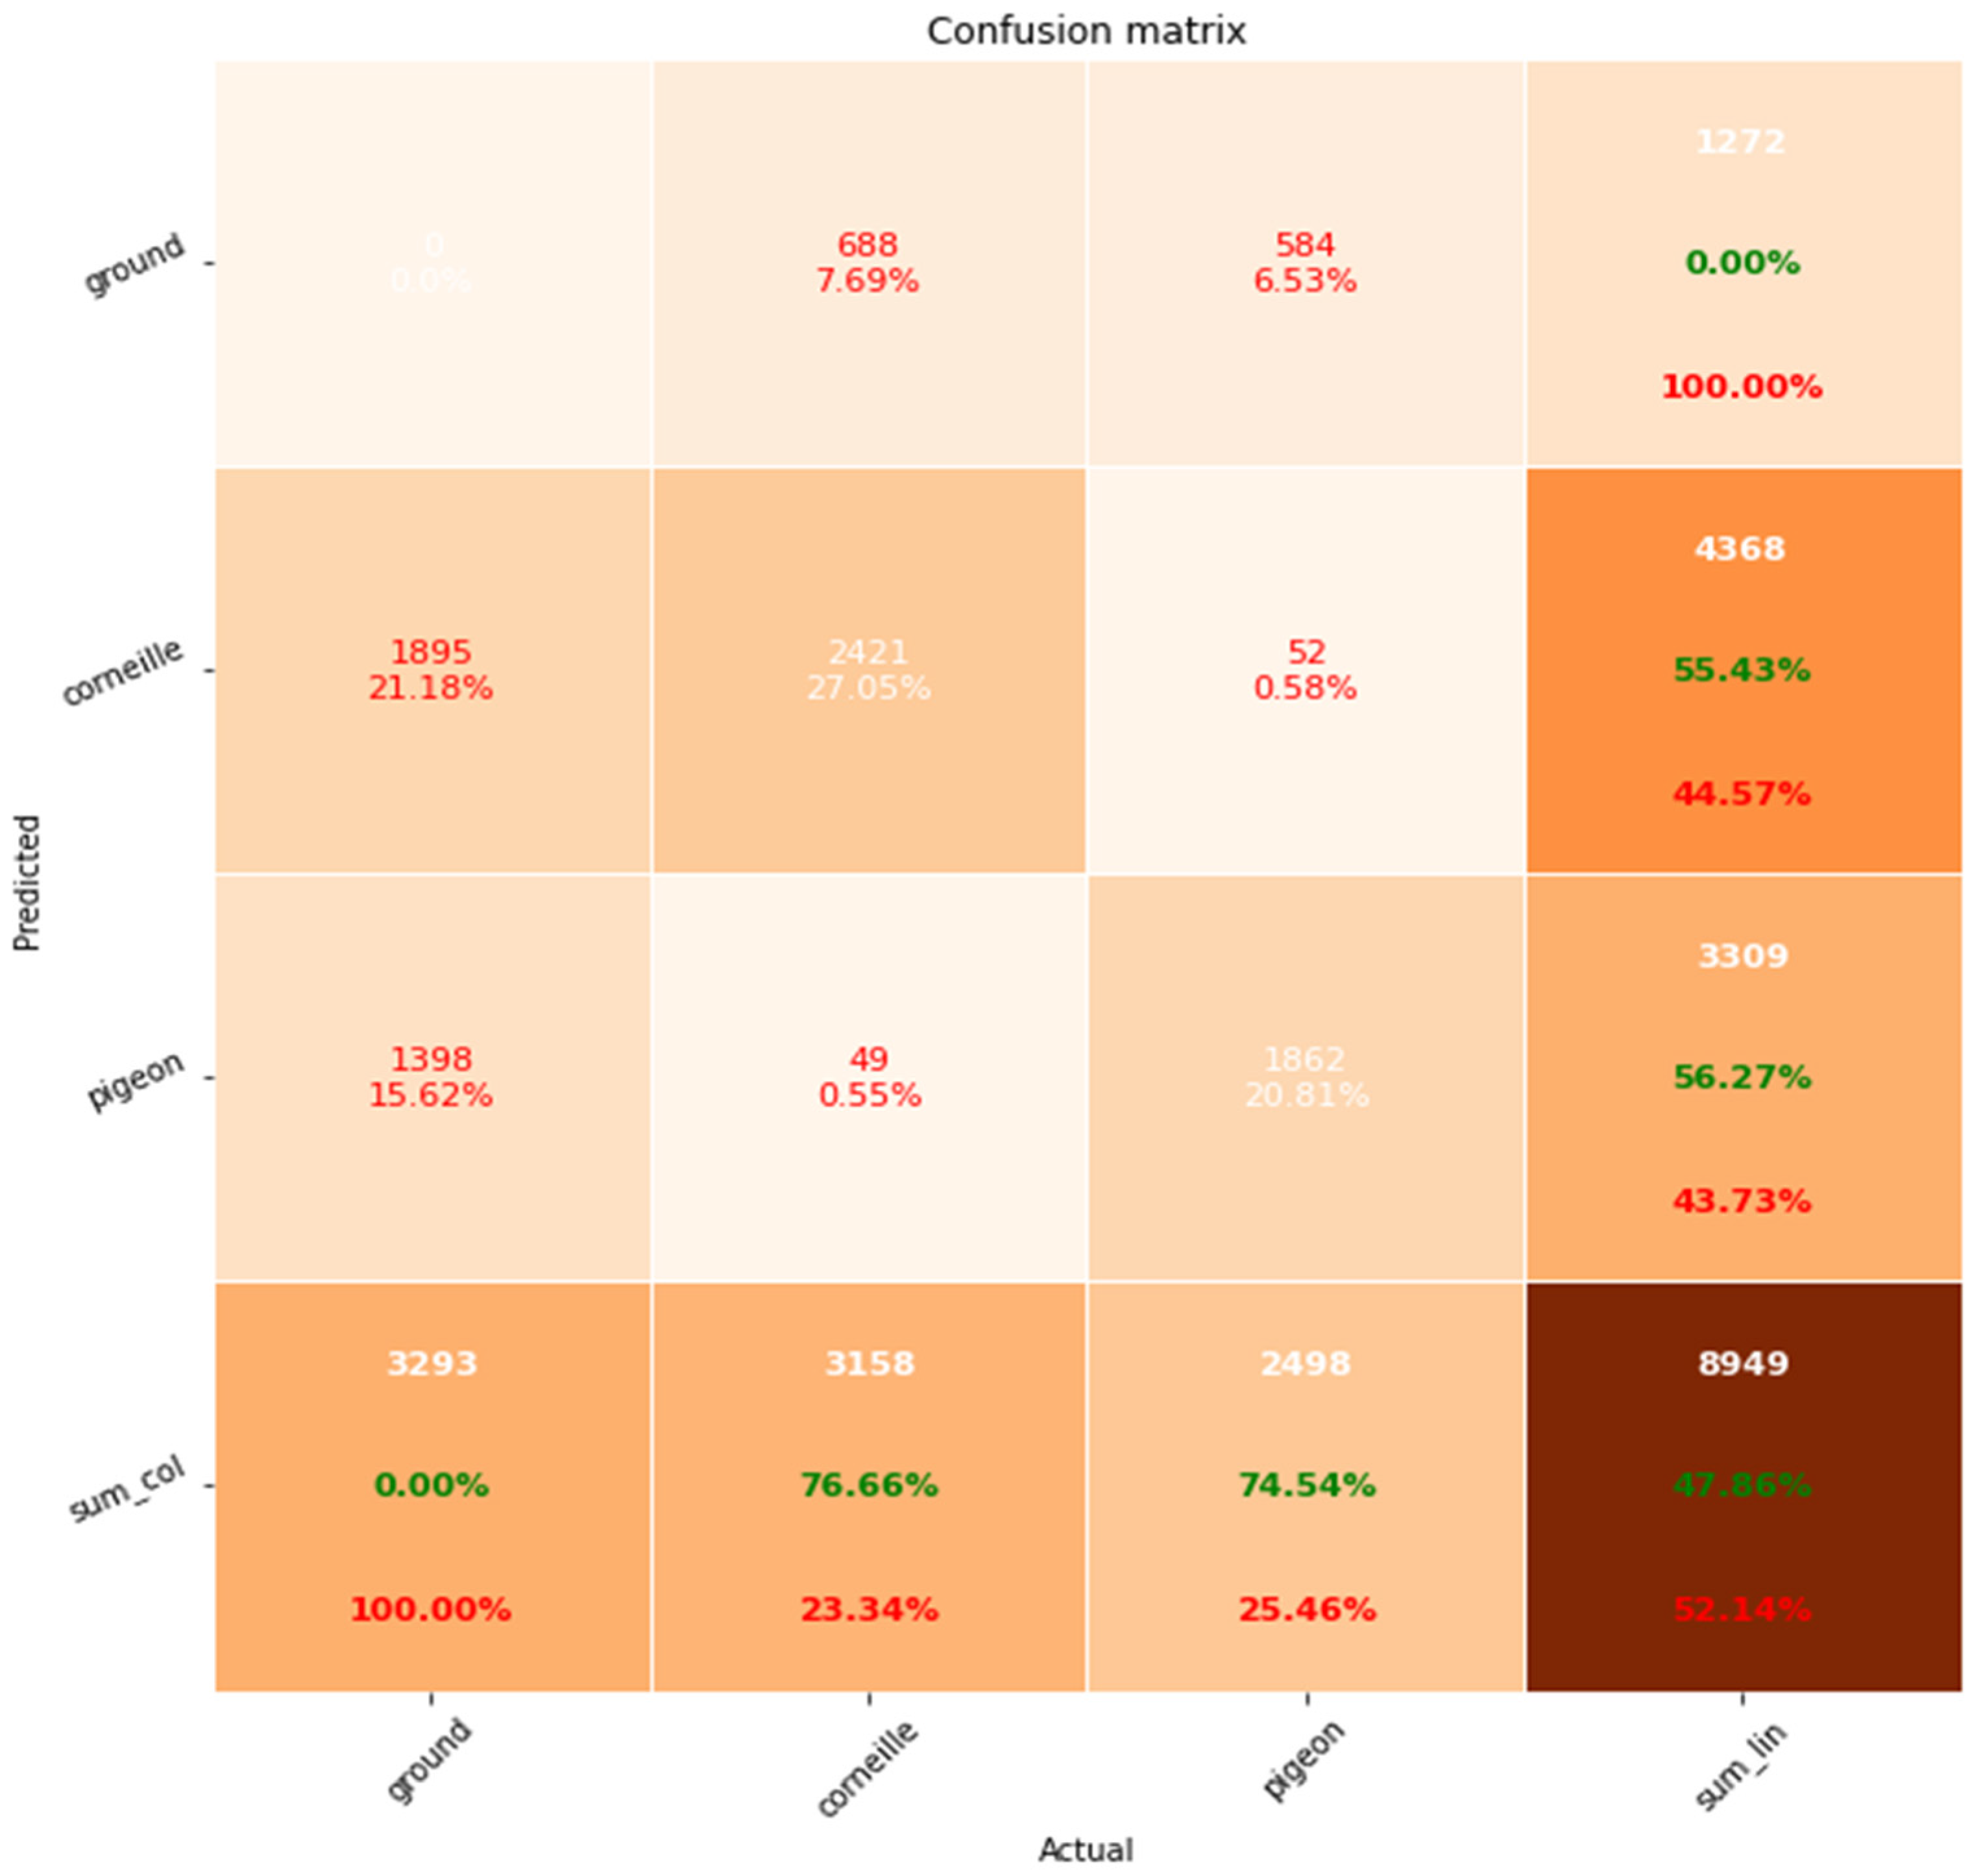
Since the hyperparameters of our model were specifically optimized for the detection of small and medium-sized individuals and given that only 1.23% of the individuals in the BirdyDataset are large (Table 2), we removed these large individuals to evaluate the model’s performance on the remaining dataset. The resulting BirdyDataset contains 3030 images of small and medium-sized birds. A new model was then trained on this dataset.
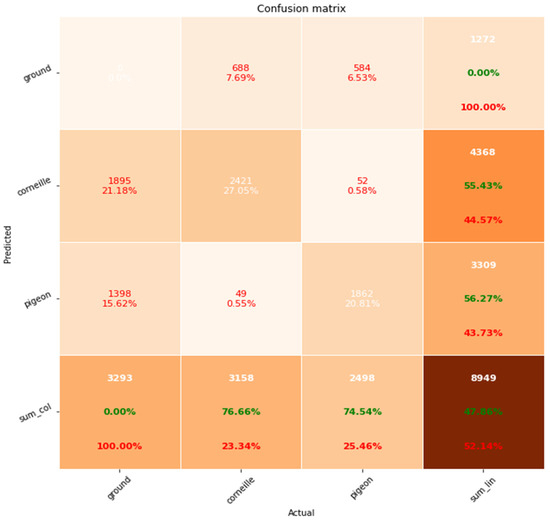
We observed that the accuracy (76.66%) and recall (55.43%) for corvids remained largely unchanged, whereas the precision (74.54%) and recall (56.27%) for pigeons improved significantly (Figure 8). This result indicates that the model performs better on small and medium-sized objects, which is consistent with the hyperparameter optimization strategy. As a next step, a dedicated model for large individuals could be developed to further extend the detection capabilities of the system.
Figure 8.
Confusion matrix of the new BirdyDataset (3030 images), i.e., excluding large bird size.
The accuracy of both classes improved compared to the previous model. This demonstrates that filtering out large individuals enhances the model’s performance, as it was specifically designed for small and medium-sized birds. It is also noteworthy that, for both classes, recall is lower than precision. In our application, the primary objective is to trigger an alarm whenever the number of birds in a plot exceeds a predefined threshold. Therefore, precision is more critical than recall.
To validate the proposed model, we adopted a twofold approach. First, qualitative validation was performed through visual inspection of detection results in field images. Second, quantitative validation was conducted using numerical metrics computed on both manually annotated and automatically annotated images.
5. Model Validation
5.1. Qualitative Validation
Over the past 4–5 years, we acquired more than 15 TB of raw images taken in different plots located in four regions in France. We annotated several thousand of these images. This automatic annotation process was only feasible using a high-performance computing (HPC) system, with processing times ranging from one day to one week, depending on the dataset size. The results of these automatic annotations, or simulated data, were then compared with the qualitative metadata described in Section 3, Materials and Methods.
Using lambda calculus queries, we were able to determine that a specific plot, “La Valée Grand Jean”, experienced severe damage in 2023 caused by both corvids and pigeons. More generally, this approach allowed us to identify plots that were moderately attacked or not attacked at all, providing a comprehensive overview of bird damage across all surveyed plots.
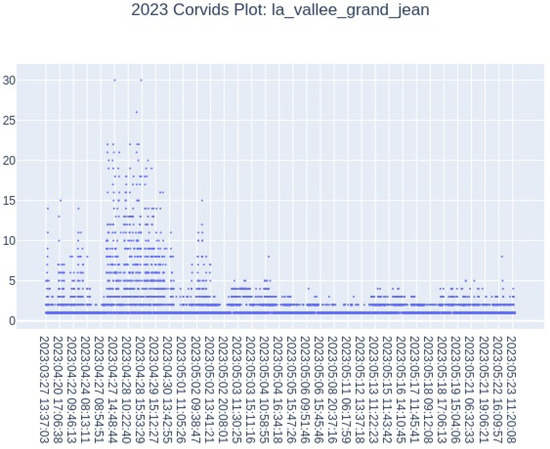
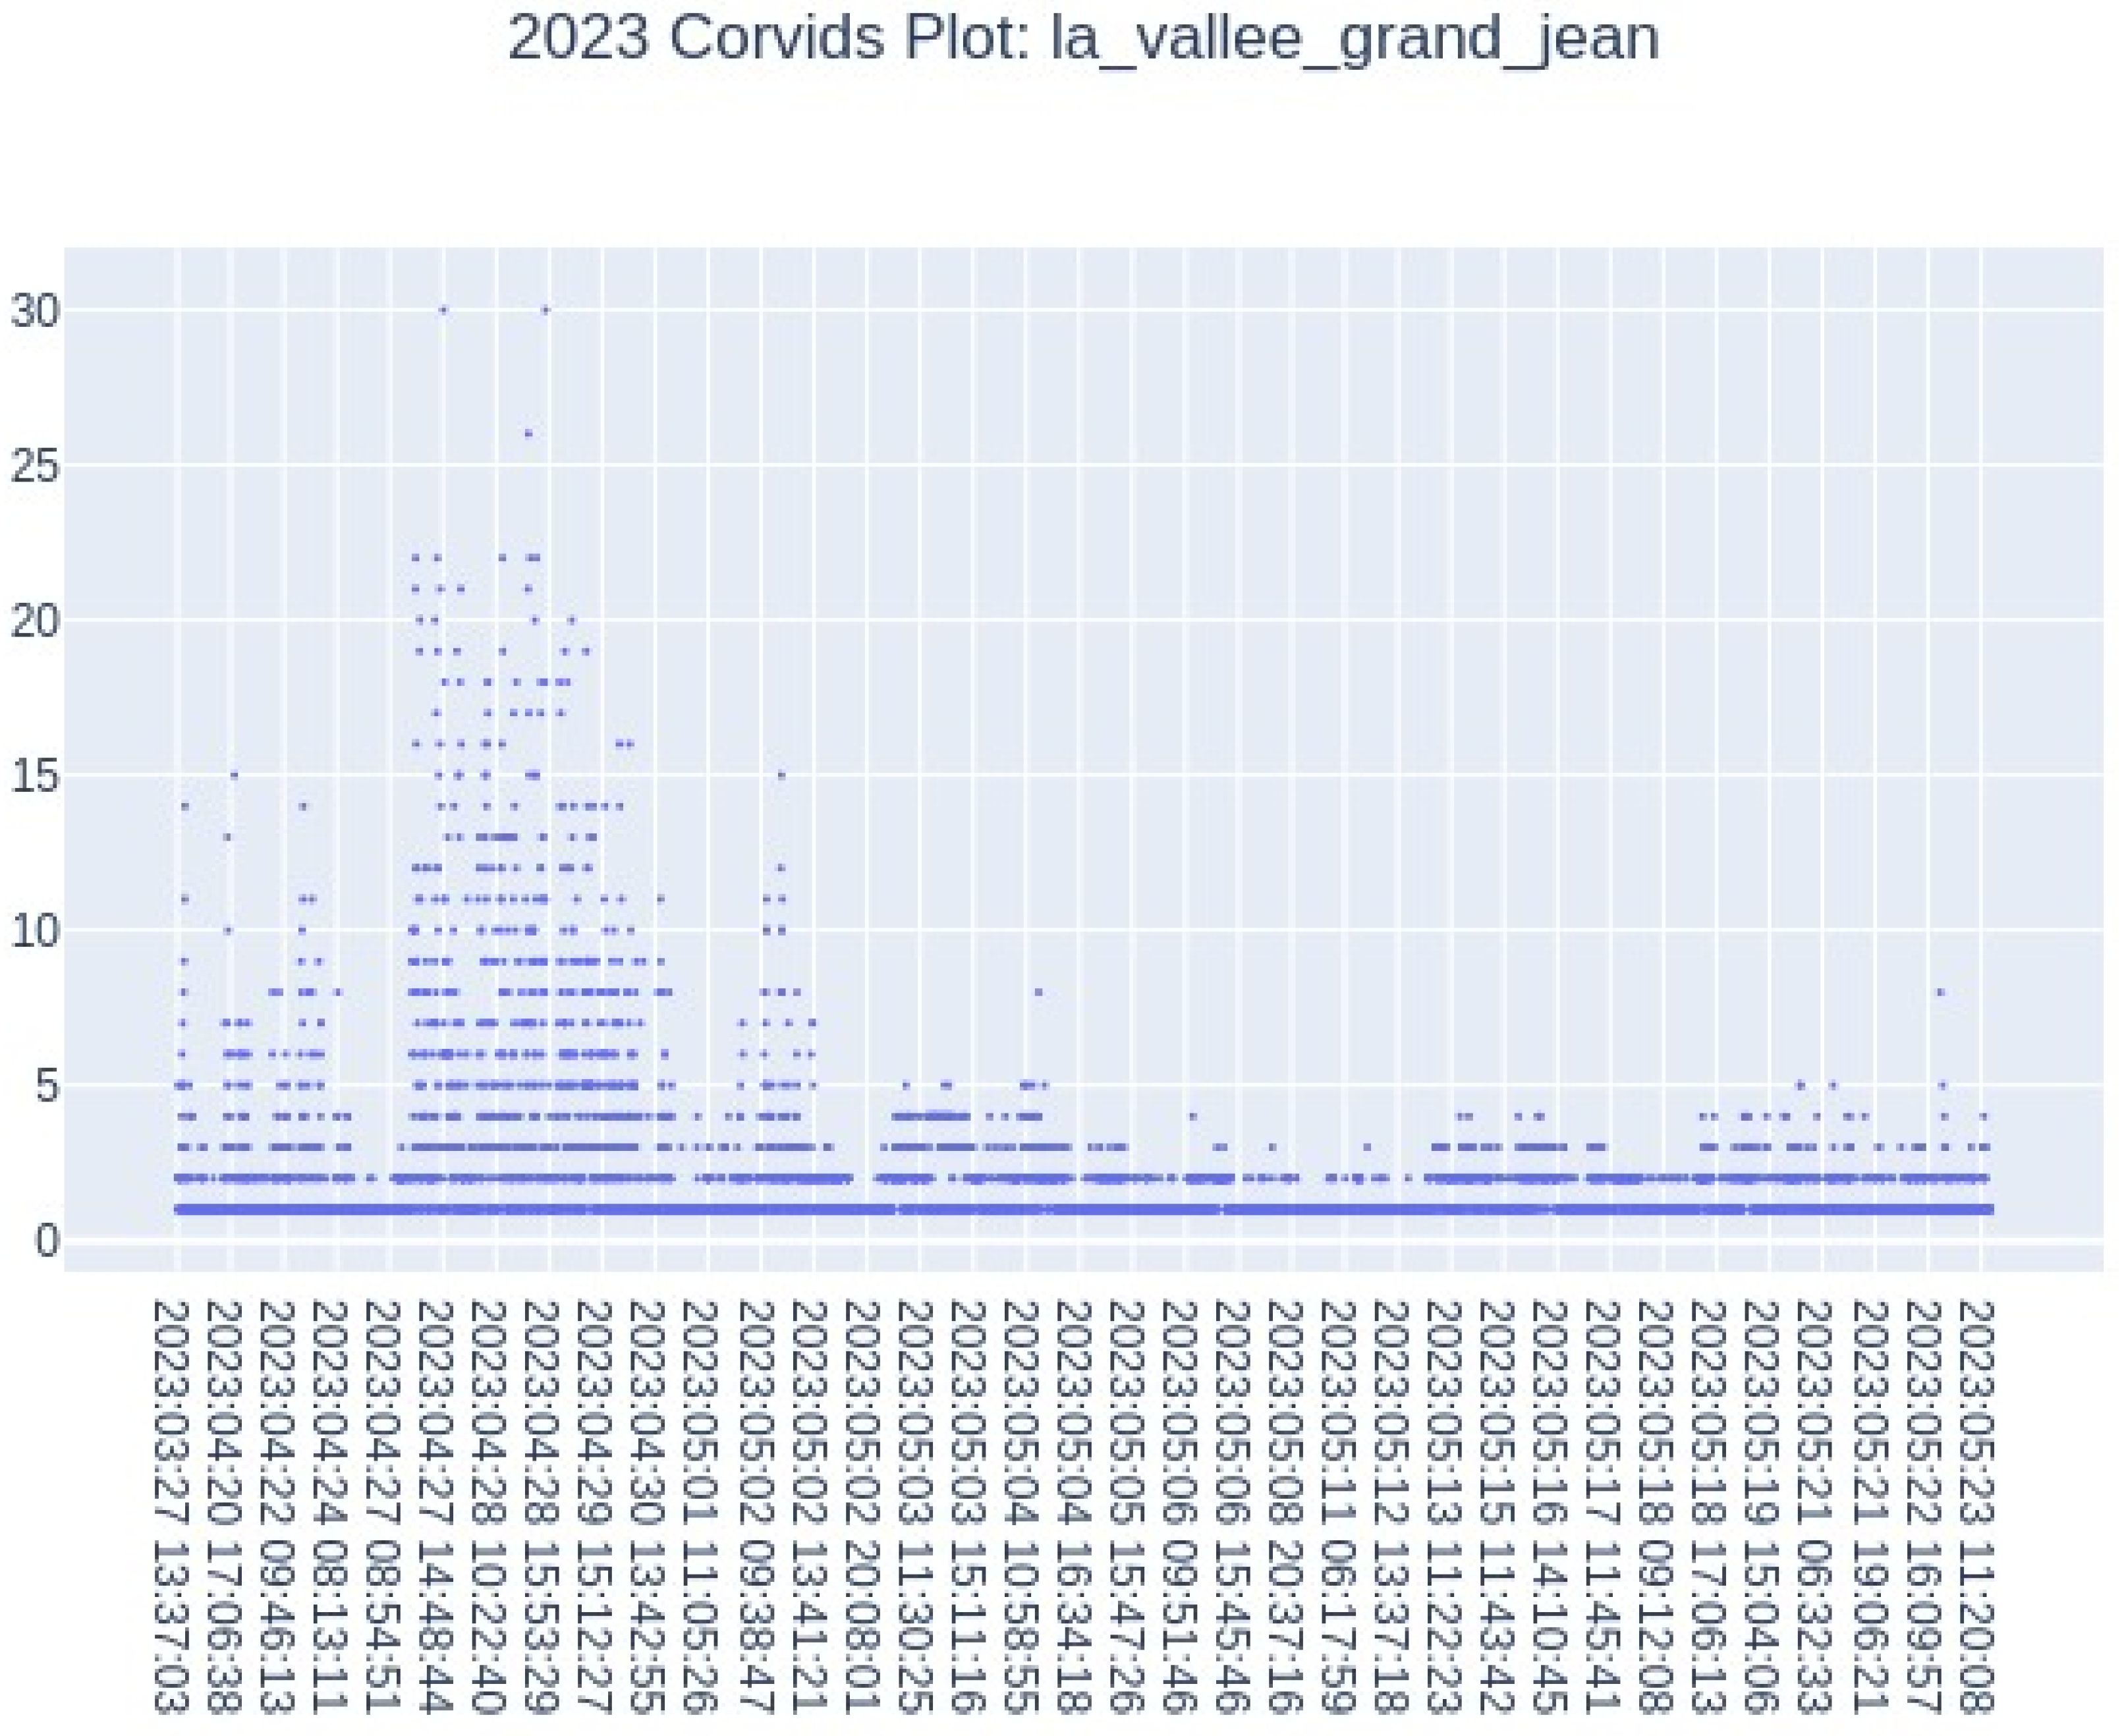
Furthermore, from the results of automatic annotation for the plot “La Vallée Grand Jean” in the year 2023, shown in Figure 9, we can see that there was indeed a severe attack by corvids in April. Therefore, this confirms the farmer’s observation.
Figure 9.
Results of automatic annotation for the year 2023, with the date on the x-axis and the number of individuals on the y-axis. Significant presence of corvids in April.
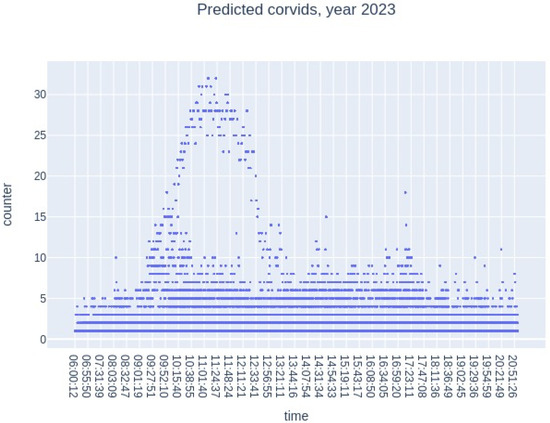
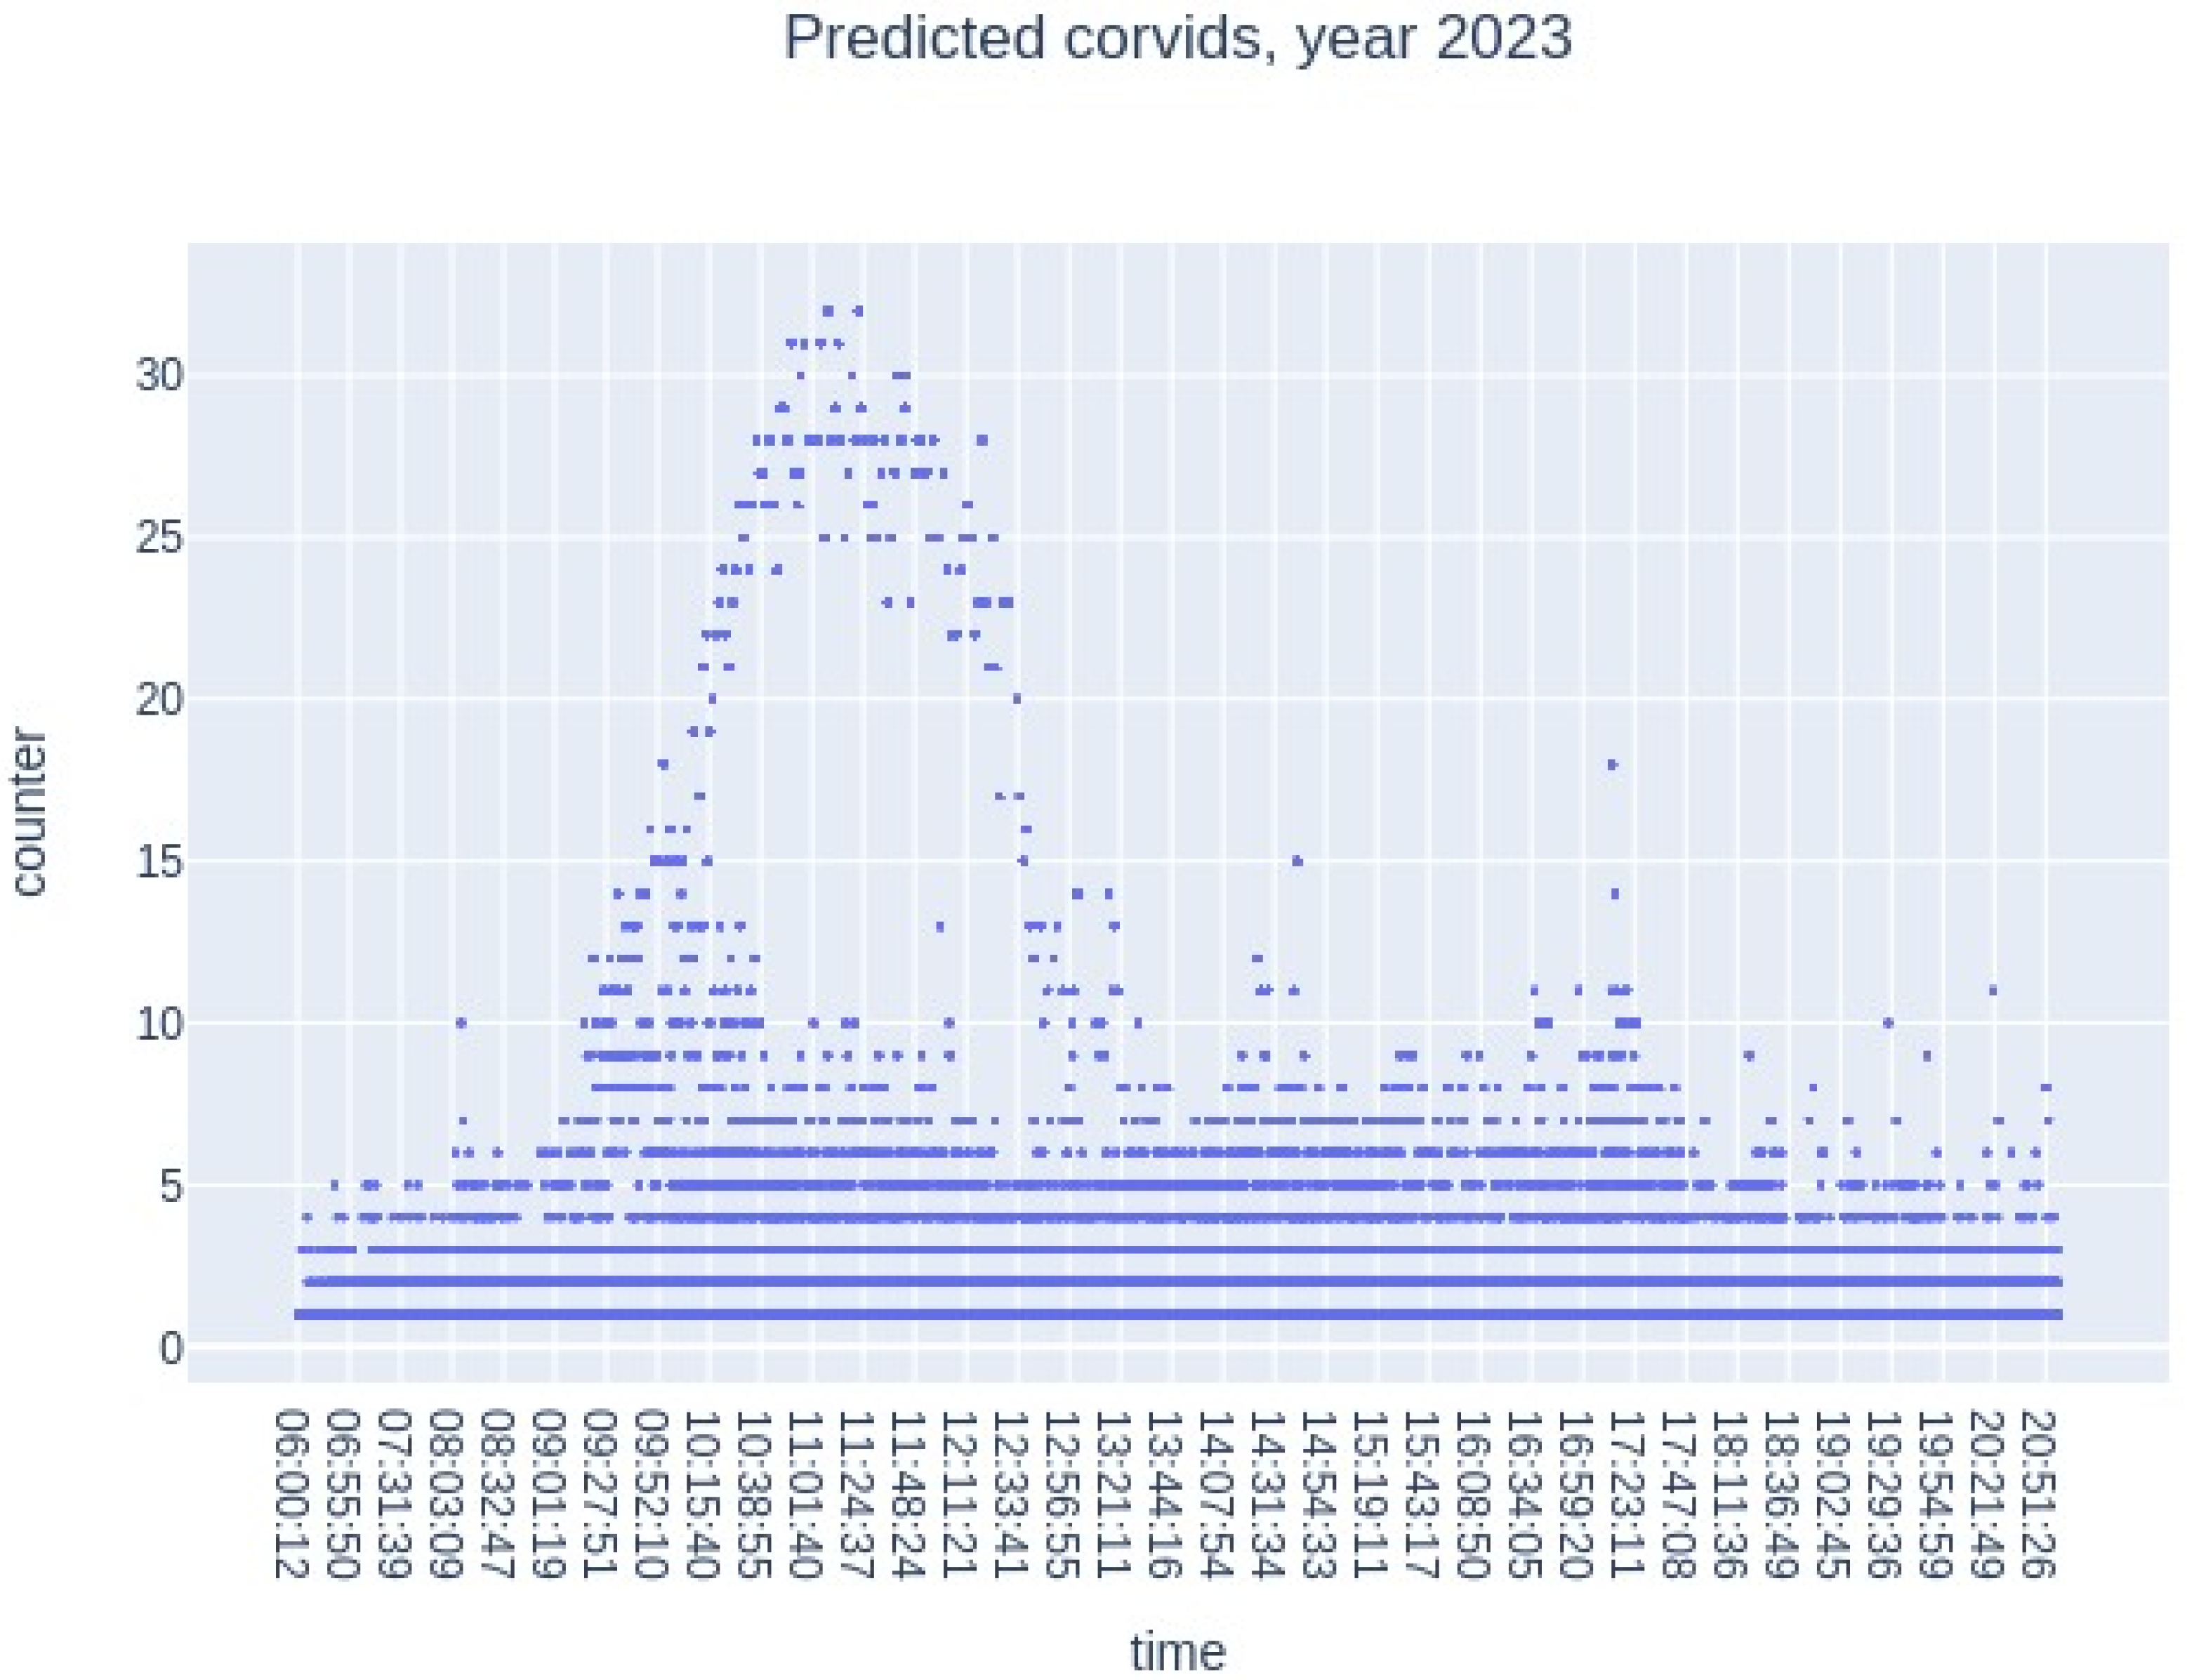
Another way to visualize the temporality of birds is to focus on their presence during the day. If we look at the number of individuals according to the time of day, we see that the highest number of individuals is between 10 a.m. and 2 p.m. (Figure 10).
Figure 10.
Results of automatic annotation for the year 2023, on the x-axis, the time from dawn to sunset; on the y-axis, the number of individuals. Significant presence of birds between 10 a.m. and 2 p.m.
5.2. Quantitative Validation
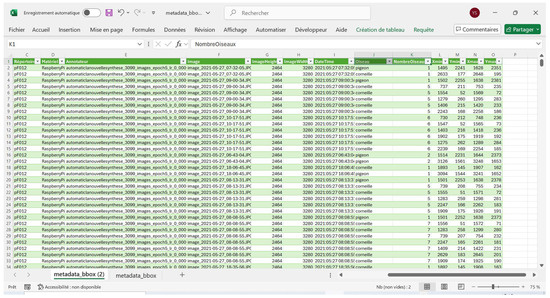
To quantitatively validate our model, a new set of manually annotated images was acquired in 2024. These manual annotations were then compared with the results of the automatic annotation. Each line of the automatic annotation data contains 14 columns, including information such as the annotated image, the detection model used, the number of corvids and pigeons detected, and the corresponding bounding boxes for each detected bird (see Figure 11).
Figure 11.
Automatic annotation metadata:14 columns of metadata, including information on annotated images, the number of corvids and pigeons present, and the coordinates of the bounding boxes.
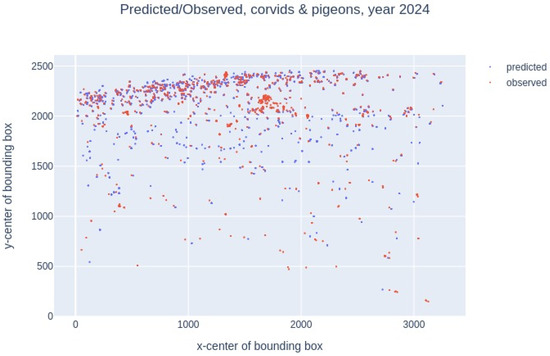
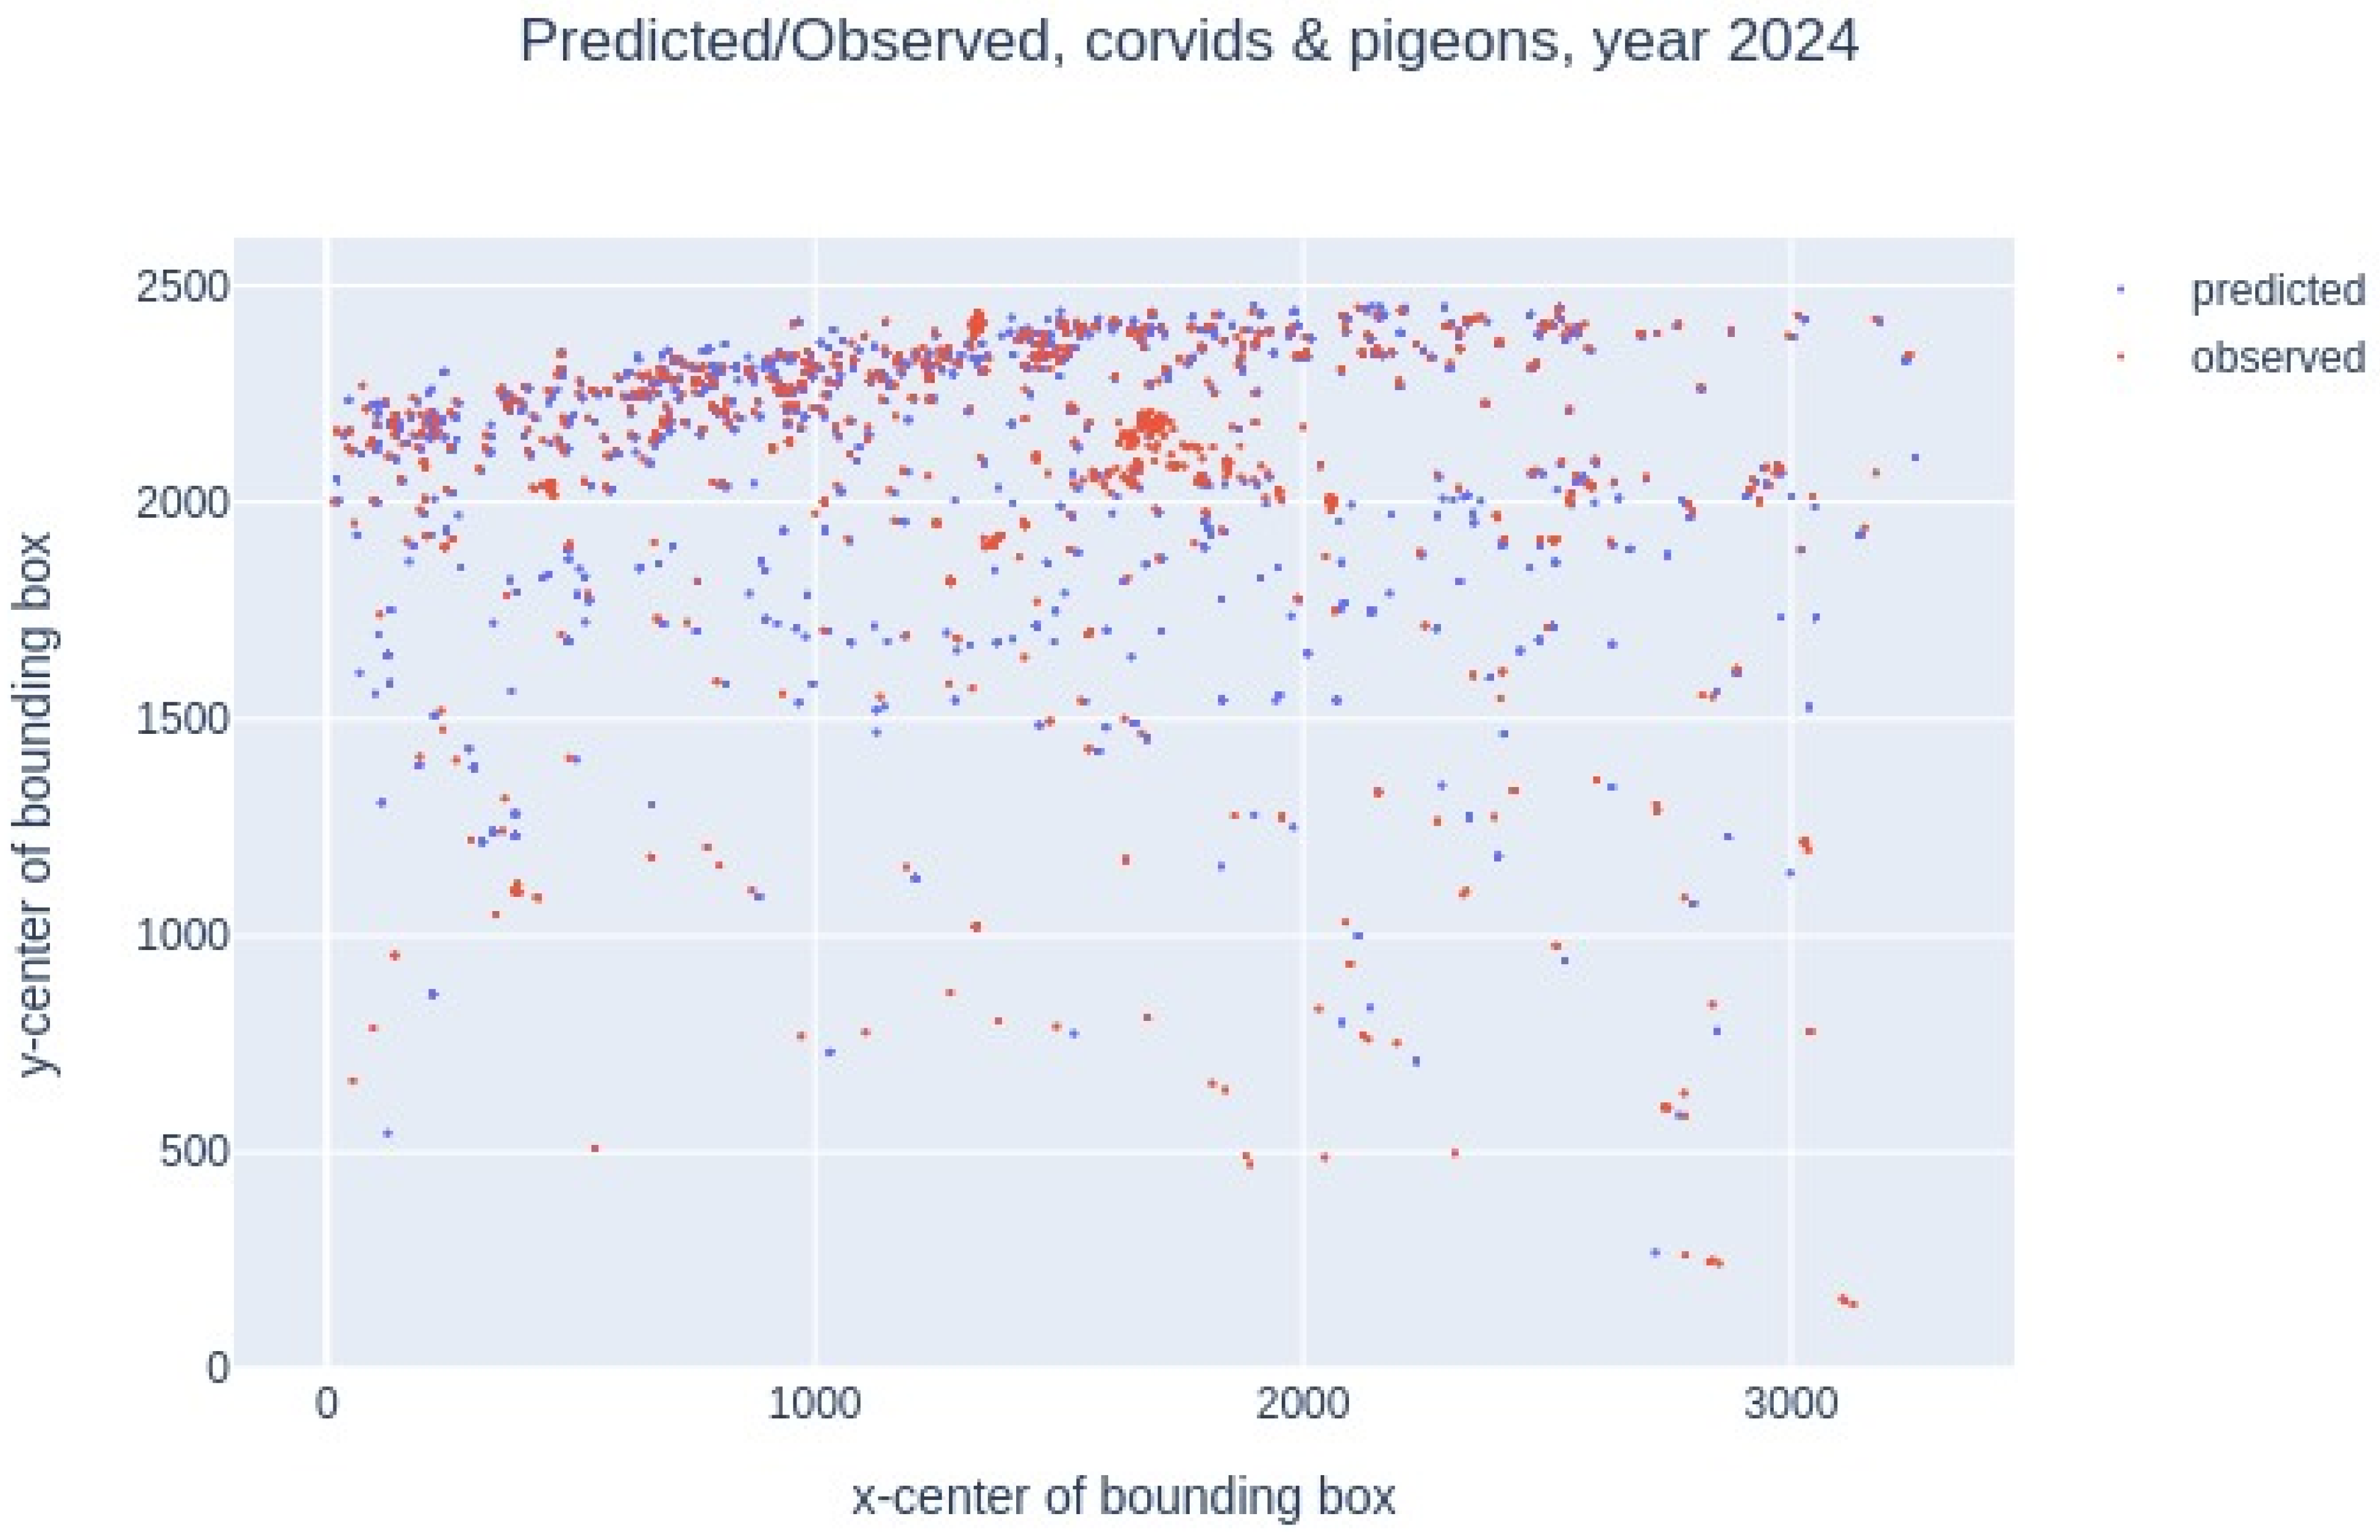
Therefore, we compared the centers of simulated bounding boxes (in blue) and observed bounding boxes (in red). The points at the top of the graph (Figure 12) are the furthest from the camera, and, conversely, the points at the bottom, closest to 0, are the closest to the camera. We note that the observed/predicted points overlap well and that most of these points are at the top of the graph, far from the camera lens.
Figure 12.
Year 2024, comparison of manually (red color) and automatically (blue color) annotated bounding box centers.
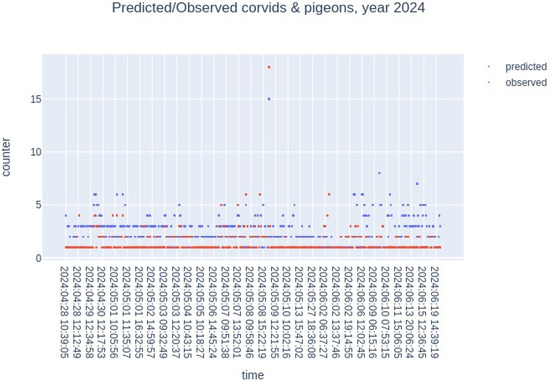
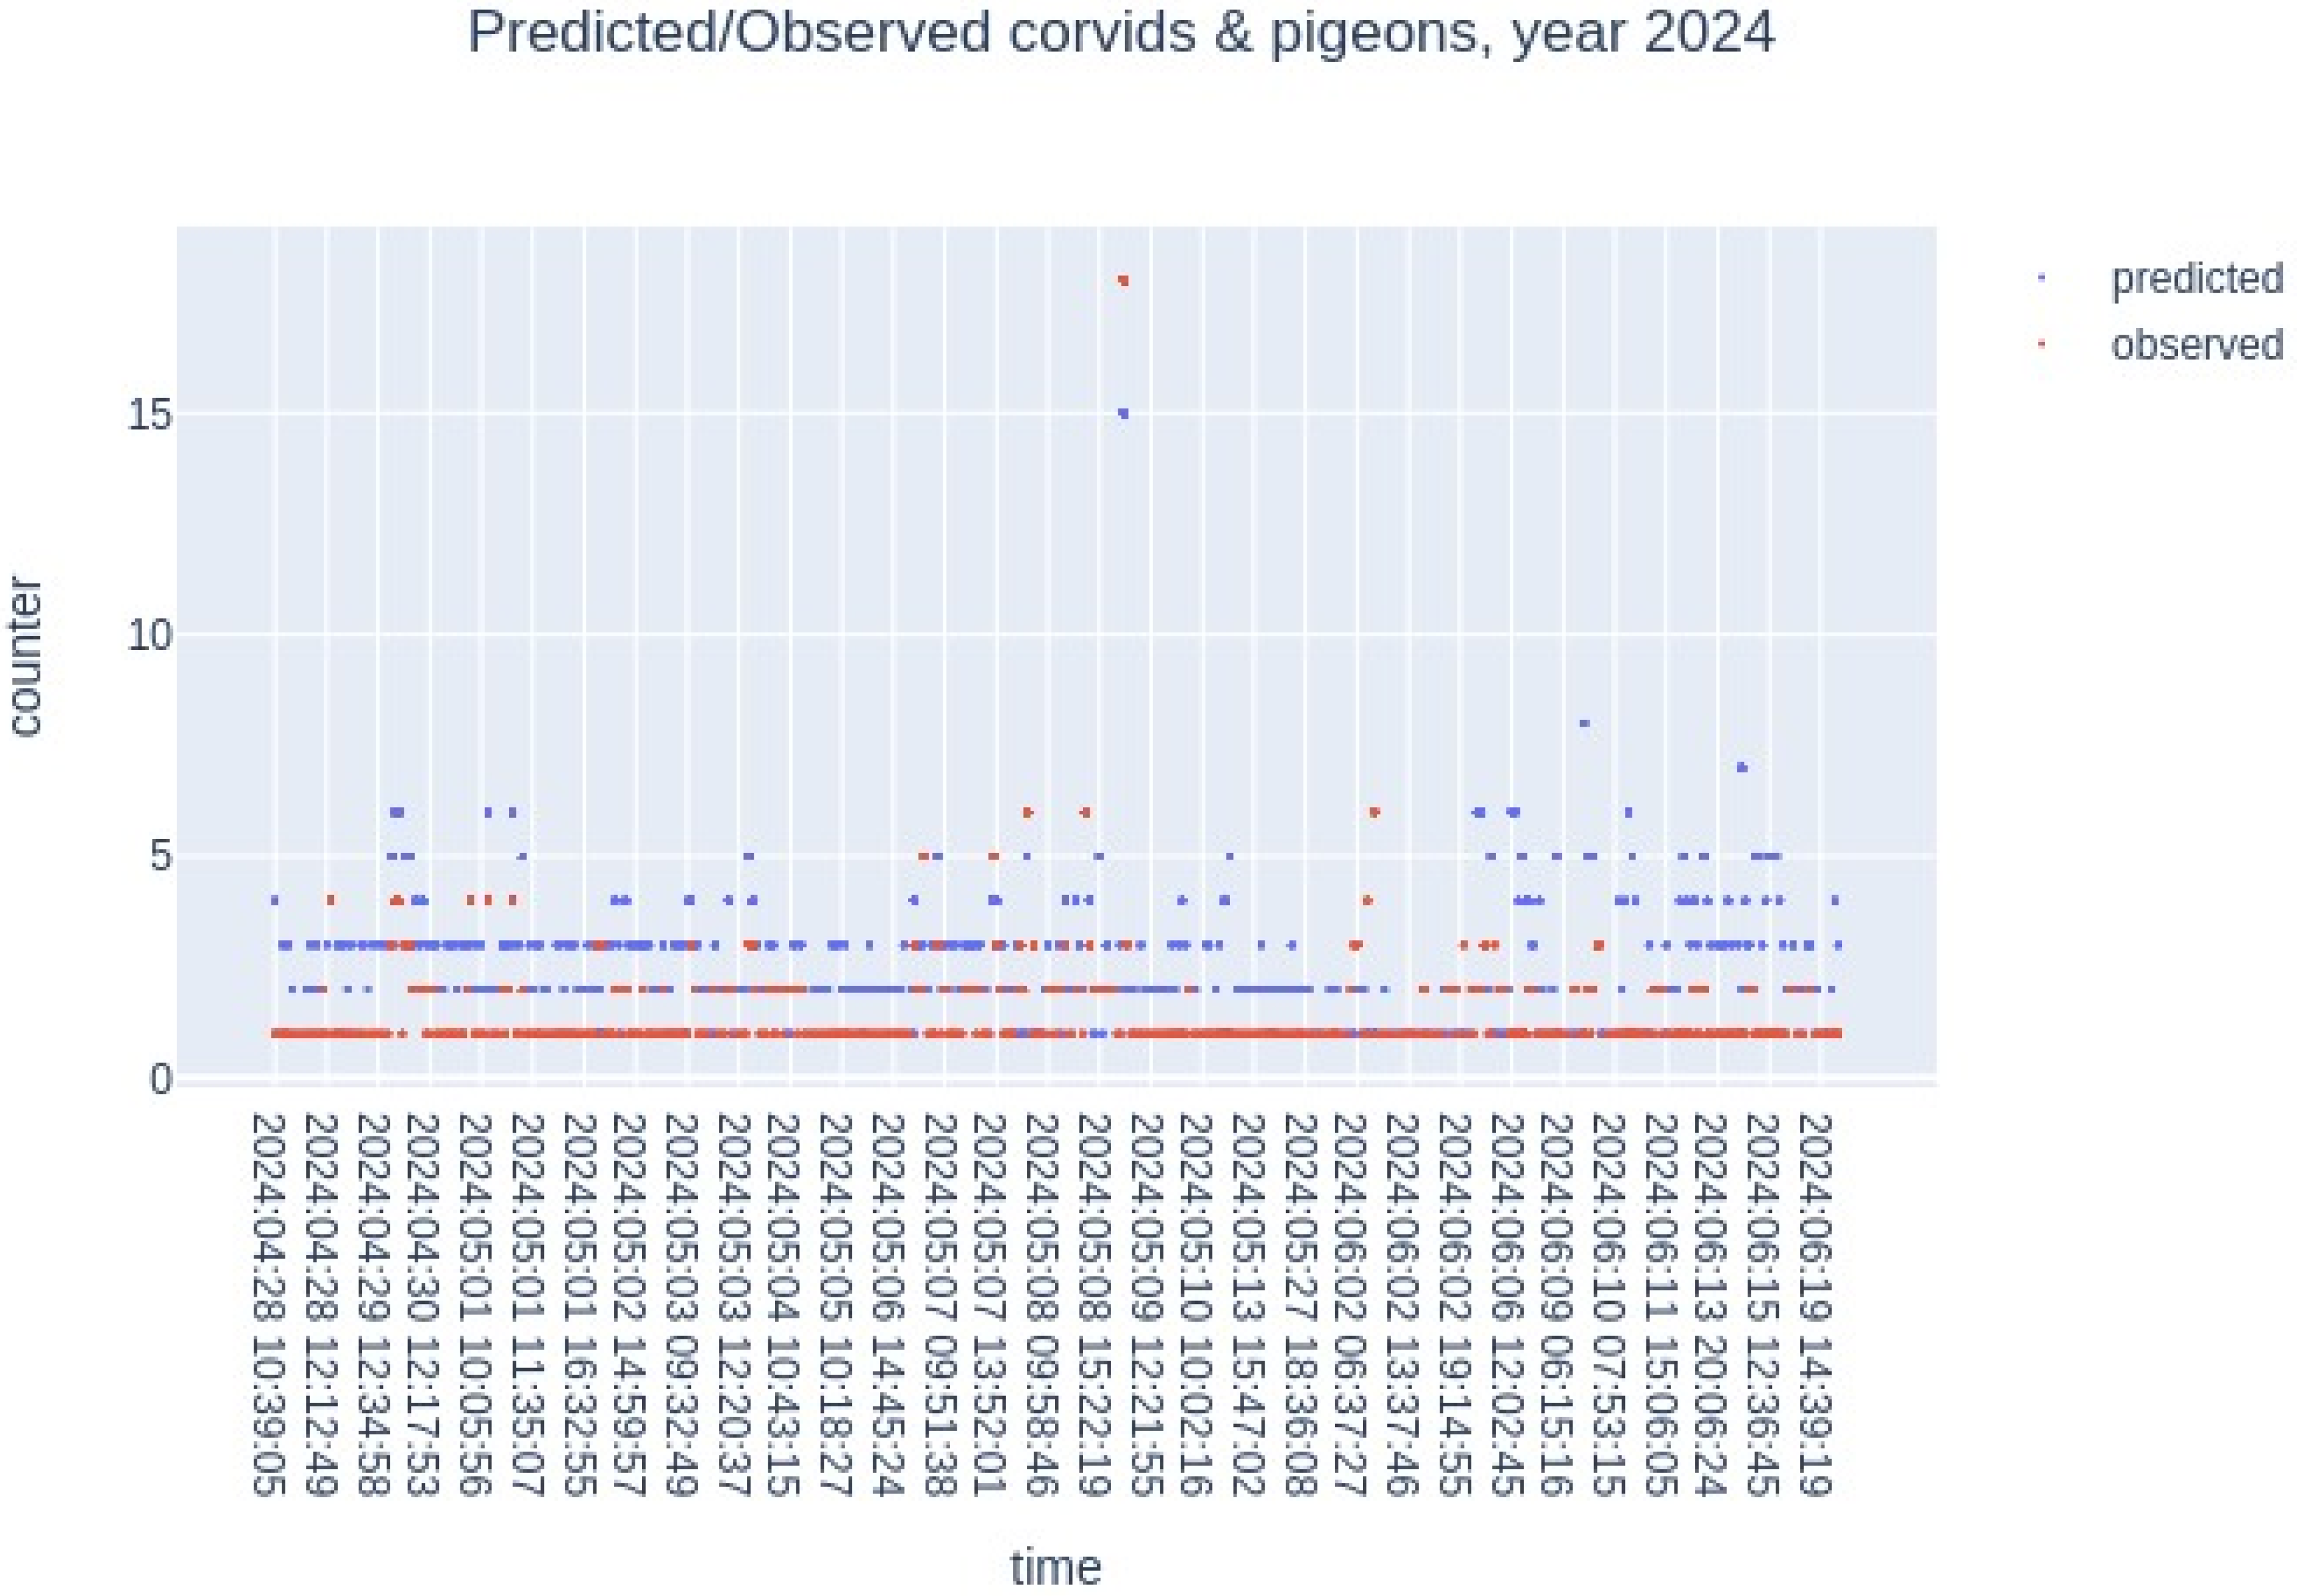
In addition, we tracked the temporal dynamics of the number of individuals by counting both the simulated and observed numbers of birds over time (by day and hour), with observations made from dawn to sunset (see Figure 13). We observed a good overlap between the simulated and observed values, although the model slightly underestimated the number of birds.
Figure 13.
Year 2024, number of simulated individuals (in blue) and observed individuals (in red) over time. The data overlap quite well.
For farmers, the number of birds present at any given moment on a plot is crucial. This count, or threshold of individuals, is what ultimately determines whether an alert is triggered.
6. Discussion
As discussed in the introduction, bird detection has been extensively investigated across various application domains, leading to the development of numerous bird-related datasets. However, datasets specifically dedicated to the detection of small individuals remain scarce. Most existing datasets are limited to laboratory conditions or images acquired at short distances, typically below 5 m. In contrast, the dataset introduced in this study consists of images captured at distances exceeding 50 m, representing a significantly more challenging and realistic agricultural scenario for small bird detection.
Environmental conditions have a strong impact on detection performance. Light-colored ground surfaces, as illustrated in Figure 3, complicate pigeon detection when individuals are located far from the camera. Similarly, corvid detection is affected when the ground exhibits darker tones or is poorly illuminated (Figure 4). In addition, adverse weather conditions such as rain or drizzle, as well as temporal variations in lighting during sunrise and sunset, reduce image contrast and further hinder detection. The annotation process required careful manual inspection of each image, including zooming to identify small individuals. Although annotation quality was prioritized, some omissions remain unavoidable. These limitations highlight the need for robust learning approaches capable of handling imperfect annotations and reduced human intervention.
Hyperparameter optimization played a critical role in achieving satisfactory detection performance. Seven key hyperparameters were fine-tuned, as described in Section 4.1. Among them, anchor scales and Intersection over Union (IoU) thresholds were identified as the most influential parameters. Learning rate decay was also evaluated but did not lead to measurable improvements. A learning rate of 0.006 yielded the best performance across experiments. The batch size was set equal to the dataset size, which proved effective for the MaskRCNN architecture and remained compatible with the available memory resources.
Regarding data augmentation, only mirror symmetry was retained. Other techniques, including rotation, flipping, and cropping, were tested but did not improve performance. This result can be explained by the small size of the targets and the fact that detection was restricted to birds on the ground rather than in flight, limiting the relevance of such transformations.
Recent studies have proposed several enhancements to YOLO-based architecture for small object detection, reporting mean average precision (mAP) values of approximately 41%. Despite additional architectural refinements introduced in YOLOv13, reported performance levels remain below 50%. Therefore, their applicability to detect small birds in agricultural environments requires further investigation. Comprehensive comparative studies are necessary to systematically evaluate existing approaches in terms of detection accuracy, inference time, and memory consumption.
7. Conclusions
In this study, we proposed an automated framework for detecting small bird species in agricultural environments using deep learning-based object detection. By fine-tuning a Mask-RCNN architecture and optimizing key hyperparameters, we addressed one of the primary challenges in both agronomy and computer vision: the reliable detection of small individuals at long distances.
Several datasets were constructed, ranging from an initial set of 200 images to a comprehensive dataset comprising 3099 images. Leveraging high-performance computing resources and extended GPU training times, we developed a model specifically tailored to small bird detection. The proposed approach achieved mean average precision (mAP) scores of 78.76% for corvids and 57.57% for pigeons.
The trained model was subsequently applied to automatically annotate terabytes of field-acquired imagery. A manually annotated subset of images, excluded from the training phase, was used to validate the model’s performance. In practical deployments, the proposed system enables real-time bird counting and triggers alerts when bird populations exceed predefined thresholds defined by farmers.
Future work will focus on deploying the model on embedded platforms, such as the NVIDIA Jetson TX2, coupled with camera systems. The current implementation requires approximately 250 MB of RAM, making it suitable for edge computing applications. While this study focused on small individuals, the proposed framework can be readily extended to larger bird species. Multiple detection models could potentially operate simultaneously on the same embedded platform, providing a flexible and scalable solution.
Finally, given the limited availability of datasets dedicated to small bird detection, the proposed BirdyDataset constitutes a valuable contribution to the research community. It can be leveraged to train and benchmark future detection models, thereby improving robustness and generalization. Overall, this work demonstrates the strong potential of deep learning-based object detection for agricultural pest management and its integration into real-time, field-deployable monitoring and bird-scaring systems.
Author Contributions
Conceptualization, Y.S.; methodology, Y.S.; software, Y.S.; validation, Y.S., L.Z. and C.S.; data annotation L.Z. and Y.S.; visualization, Y.S., L.Z. and C.S.; writing—original draft preparation, Y.S. and C.S.; writing—review and editing, Y.S. All authors have read and agreed to the published version of the manuscript.
Funding
This work was conducted as part of the LIDO project and received funding from the French government, managed by the National Research Agency (ANR), under the Ecophyto-Maturation program (project ANR-21-ECOM-0004-01), as well as from Semae (the seed and plant interbranch organization).
Data Availability Statement
The data is currently unavailable in an open-source format.
Acknowledgments
This research was granted access to the HPC resources of IDRIS under allocation 2024–2025 [AD011011832R5] made by GENCI. We would like to express our sincere gratitude to Corentin Barbu (INRAE) for the insightful discussions and valuable input throughout the project. We would also like to thank Michel Bertrand (INRAE) for his generous financial support, which made this work possible.
Conflicts of Interest
The authors declare no conflict of interest.
Abbreviations
| BIAD | Bird Identification And Detection |
| CNN | Convolutional Neural Network |
| DETR | Detection Transformer |
| FN | False Positive |
| FP | False Positive |
| mAP | Mean Average Precision |
| MS-COCO | Microsoft Common Objects in Context |
| RCNN | Region-Based Convolutional Network |
| TP | True Positive |
References
- Sausse, C.; Baux, A.; Bertrand, M.; Bonnaud, E.; Canavelli, S.; Destrez, A.; Klug, P.E.; Olivera, L.; Rodriguez, E.; Tellechea, G.; et al. Contemporary challenges and opportunities for the management of bird damage at field crop establishment. Crop Prot. 2021, 148, 105736. [Google Scholar] [CrossRef] [Scilit]
- Gilsdorf, J.M.; Hygnstrom, S.E.; VerCauteren, K.C. Use of Frightening Devices in Wildlife Damage Management. Integr. Pest Manag. Rev. 2022, 7, 29–45. [Google Scholar] [CrossRef] [Scilit]
- Sausse, C.; Chevalot, A.; Lévy, M. Hungry birds are a major threat for sunflower seedlings in France. Crop Prot. 2021, 148, 105712. [Google Scholar] [CrossRef] [Scilit]
- Schiano, F.; Natter, D.; Zambrano, D.; Floreano, D. Autonomous Detection and Deterrence of Pigeons on Buildings by Drones. IEEE Access 2024, 10, 1745–1755. [Google Scholar] [CrossRef] [Scilit]
- Zhu, J.; Ma, C.; Rong, J.; Cao, Y. Bird and UAVs recognition detection and tracking based on improved YOLOv9-DeepSORT. IEEE Access 2024, 12, 147942–147957. [Google Scholar] [CrossRef] [Scilit]
- Wu, Q.; Feng, D.; Cao, C.; Zeng, X.; Feng, Z.; Wu, J.; Huang, Z. Improved Mask-RCNN for Aircraft Detection in Remote Sensing Images. Sensors 2021, 21, 2618. [Google Scholar] [CrossRef] [Scilit]
- Nirmala Devi, L.; Subba Reddy, K.V.; Nageswar Rao, A. A Novel Autonomous Bird Deterrent System for Crop Protection Using Drones. In Agricultural-Centric Computation; ICA 2024; Communications in Computer and Information Science; Saini, M.K., Goel, N., Miguez, M., Singh, D., Eds.; Springer: Cham, Switzerland, 2025; Volume 2207, pp. 138–147. [Google Scholar] [CrossRef] [Scilit]
- Girshick, R. Fast R-CNN. Microsoft Research. arXiv 2015, arXiv:1504.08083. [Google Scholar]
- Ren, S.; He, K.; Girshick, R.; Sun, J. Faster R-CNN: Towards Real-Time Object Detection with Region Proposal Networks. arXiv 2016, arXiv:1506.01497. [Google Scholar] [CrossRef] [Scilit] [PubMed]
- He, K.; Gkioxari, G.; Dollár, P.; Girshick, R. Facebook AI Research (FAIR), Mask-RCNN, Cornell University. arXiv 2018, arXiv:1703.06870. [Google Scholar]
- Redmon, J.; Divvala, S.; Girshick, R.; Farhadi, A. You Only Look Once: Unified, Real-Time Object Detection, Computer Vision and Pattern Recognition. arXiv 2015, arXiv:1506.02640. [Google Scholar]
- Lou, H.; Duan, X.; Guo, J.; Liu, H.; Gu, J.; Bi, L.; Chen, H. DC-YOLOv8: Small-Size Object Detection Algorithm Based on Camera Sensor. Electronics 2023, 12, 2323. [Google Scholar] [CrossRef] [Scilit]
- Ramos, L.; Casas, E.; Bendek, E.; Romero, C.; Rivas-Echeverría, F. Hyperparameter optimization of YOLOv8 for smoke and wildfire detection: Implications for agricultural and environmental safety. Artif. Intell. Agric. 2024, 12, 109–126. [Google Scholar] [CrossRef] [Scilit]
- Félix-Jiménez, A.F.; Sánchez-Lee, V.S.; Acuña-Cid, H.A.; Ibarra-Belmonte, I.; Arredondo-Morales, E.; Ahumada-Tello, E. Integration of YOLOv8 Small and MobileNet V3 Large for Efficient Bird Detection and Classification on Mobile Devices. AI 2025, 6, 57. [Google Scholar] [CrossRef] [Scilit]
- Lin, T.Y.; Maire, M.; Belongie, S.J.; Bourdev, L.D.; Girshick, R.B.; Hays, J.; Perona, P.; Ramanan, D.; Zitnick, C.L.; Dollár, P. Microsoft COCO: Common Objects in Context, Computer Vision and Pattern Recognition. arXiv 2014, arXiv:1405.0312. [Google Scholar]
- Kisantal, M.; Wojna, Z.; Murawski, J.; Naruniec, J.; Cho, K. Augmentation for small object detection. arXiv 2019, arXiv:1902.07296. [Google Scholar] [CrossRef] [Scilit]
- Chen, G.; Wang, H.; Chen, K.; Li, Z.; Song, Z.; Liu, Y.; Chen, W.; Knoll, A. A Survey of the Four Pillars for Small Object Detection: Multiscale Representation, Contextual Information, Super-Resolution, and Region Proposal. IEEE Trans. Syst. Man Cybern. Syst. 2022, 52, 936–953. [Google Scholar] [CrossRef] [Scilit]
- Wang, X.; Wang, A.; Yi, J.; Song, Y.; Chehri, A. Small Object Detection Based on Deep Learning for Remote Sensing: A Comprehensive Review. Remote Sens. 2023, 15, 3265. [Google Scholar] [CrossRef] [Scilit]
- Zhu, H.; Wang, Y.; Fan, J. IA-Mask-RCNN: Improved Anchor Design Mask-RCNN for Surface Defect Detection of Automotive Engine Parts. Appl. Sci. 2022, 12, 6633. [Google Scholar] [CrossRef] [Scilit]
- Sohbi, Y.; Teulé, J.M.; Morisseau, A.; Serrée, L.; Barbu, C.; Gardarin, A. A dataset of ground-dwelling nocturnal fauna for object detection and classification. Data Brief. 2024, 54, 110537. [Google Scholar] [CrossRef] [Scilit] [PubMed]

Disclaimer/Publisher’s Note: The statements, opinions and data contained in all publications are solely those of the individual author(s) and contributor(s) and not of MDPI and/or the editor(s). MDPI and/or the editor(s) disclaim responsibility for any injury to people or property resulting from any ideas, methods, instructions or products referred to in the content. |
© 2026 by the authors. Licensee MDPI, Basel, Switzerland. This article is an open access article distributed under the terms and conditions of the Creative Commons Attribution (CC BY) license.