Article

Comparative Evaluation of the Mechanical and Physical Properties of 3D-Printed Resin Posts

1
Department of Restorative Dentistry, Faculty of Dentistry, Ege University, Izmir 35040, Turkey
2
Department of Endodontics, Faculty of Dentistry, Ege University, Izmir 35040, Turkey
*
Author to whom correspondence should be addressed.
Appl. Sci. 2026, 16(14), 7220; https://doi.org/10.3390/app16147220
Submission received: 21 May 2026 / Revised: 11 July 2026 / Accepted: 16 July 2026 / Published: 19 July 2026
(This article belongs to the Special Issue 3D Printing Applications in Dentistry)

Abstract

The aim of this in vitro study was to evaluate the internal adaptation and adhesion performance of a novel 3D-printed custom post system compared with three commercially available intra-canal post systems with different physical and surface characteristics. Twenty extracted human mandibular premolars were endodontically treated and divided into four groups according to the post system used: RelyX Fiber Post (3M ESPE), Splendor SAP Post (Angelus), everStick Post (GC), and custom 3D-printed posts fabricated from a permanent restoration resin. Following cementation with a self-adhesive resin cement, micro-computed tomography was used to assess cement thickness and gap formation in the apical, middle, and coronal regions, while push-out bond strength was evaluated using a universal testing machine. The 3D-printed custom posts exhibited the lowest mean cement thickness (39.27 ± 14.47 µm in the apical and 66.25 ± 47.98 µm in the coronal region), whereas the Splendor SAP group showed the highest values (reaching up to 219.76 ± 74.64 µm in the coronal region). In contrast, the highest push-out bond strength was observed in the RelyX Fiber Post (46.52 ± 26.00 MPa) and GC everStick (48.17 ± 4.64 MPa) groups in the coronal region, while the 3D-printed custom posts demonstrated the lowest overall bond strength values, dropping to 8.53 ± 3.56 MPa in the apical region. In all groups, bond strength significantly decreased from the coronal to the apical region. Within the limitations of this study, 3D-printed custom posts provided superior intra-canal adaptation but inferior adhesion performance compared with conventional post systems.

1. Introduction

Endodontically treated teeth present a major restorative challenge due to the loss of structural integrity, reduced dentin strength, and extensive coronal tissue destruction, all of which may compromise the long-term success of restorations. In post-endodontic restorations, achieving adequate biomechanical resistance while maintaining the integrity of the adhesive interface is essential for clinical longevity [1,2].
Fiber-reinforced post systems are widely preferred because their elastic modulus is similar to that of dentin, allowing more favorable stress distribution and reducing the risk of catastrophic root fracture [3]. However, prefabricated post systems often fail to adapt completely to the complex morphology of the root canal. This mismatch may result in increased resin cement thickness and gap formation between the post and dentin walls, potentially weakening the adhesive interface and reducing bond strength [4].
To overcome these limitations, customized post systems have been introduced to improve adaptation to the root canal anatomy [5,6]. Previous studies have suggested that individualized post systems may provide a more homogeneous cement layer and enhanced internal adaptation [7,8]. These approaches include fiber-supported direct customization techniques, such as the everStick system, as well as digitally fabricated systems produced using computer-aided design/computer-aided manufacturing (CAD/CAM) and three-dimensional (3D) printing technologies [9].
With the advancement of digital dentistry, 3D-printing technologies have emerged as a promising approach for the fabrication of customized intra-canal posts. By enabling the digital modeling of root canal morphology and the production of anatomically adapted posts, these systems may provide superior adaptation compared with conventional prefabricated systems [10,11]. Nevertheless, the clinical performance of 3D-printed posts depends on several factors, including material properties, manufacturing parameters, and adhesive compatibility [12].
Despite the reported adaptation advantages of customized post systems, the relationship between cement thickness, gap formation, and bond strength remains controversial in the literature. Furthermore, limited evidence is available regarding the combined evaluation of these parameters in 3D-printed custom post systems [6,13]. Therefore, the aim of this in vitro study was to evaluate and compare the internal adaptation and push-out bond strength of a novel 3D-printed custom post system with different commercially available intra-canal post systems [9,14]. The null hypothesis was that no significant differences would be observed among the evaluated post systems in terms of internal adaptation and bond strength.
The null hypotheses of this study were that [1] no significant differences would be observed among the evaluated post systems regarding cement thickness, gap formation, and push-out bond strength, and [2] no significant relationship would exist between cement thickness and bond strength.

2. Materials and Methods

2.1. Specimen Selection and Root Canal Treatment

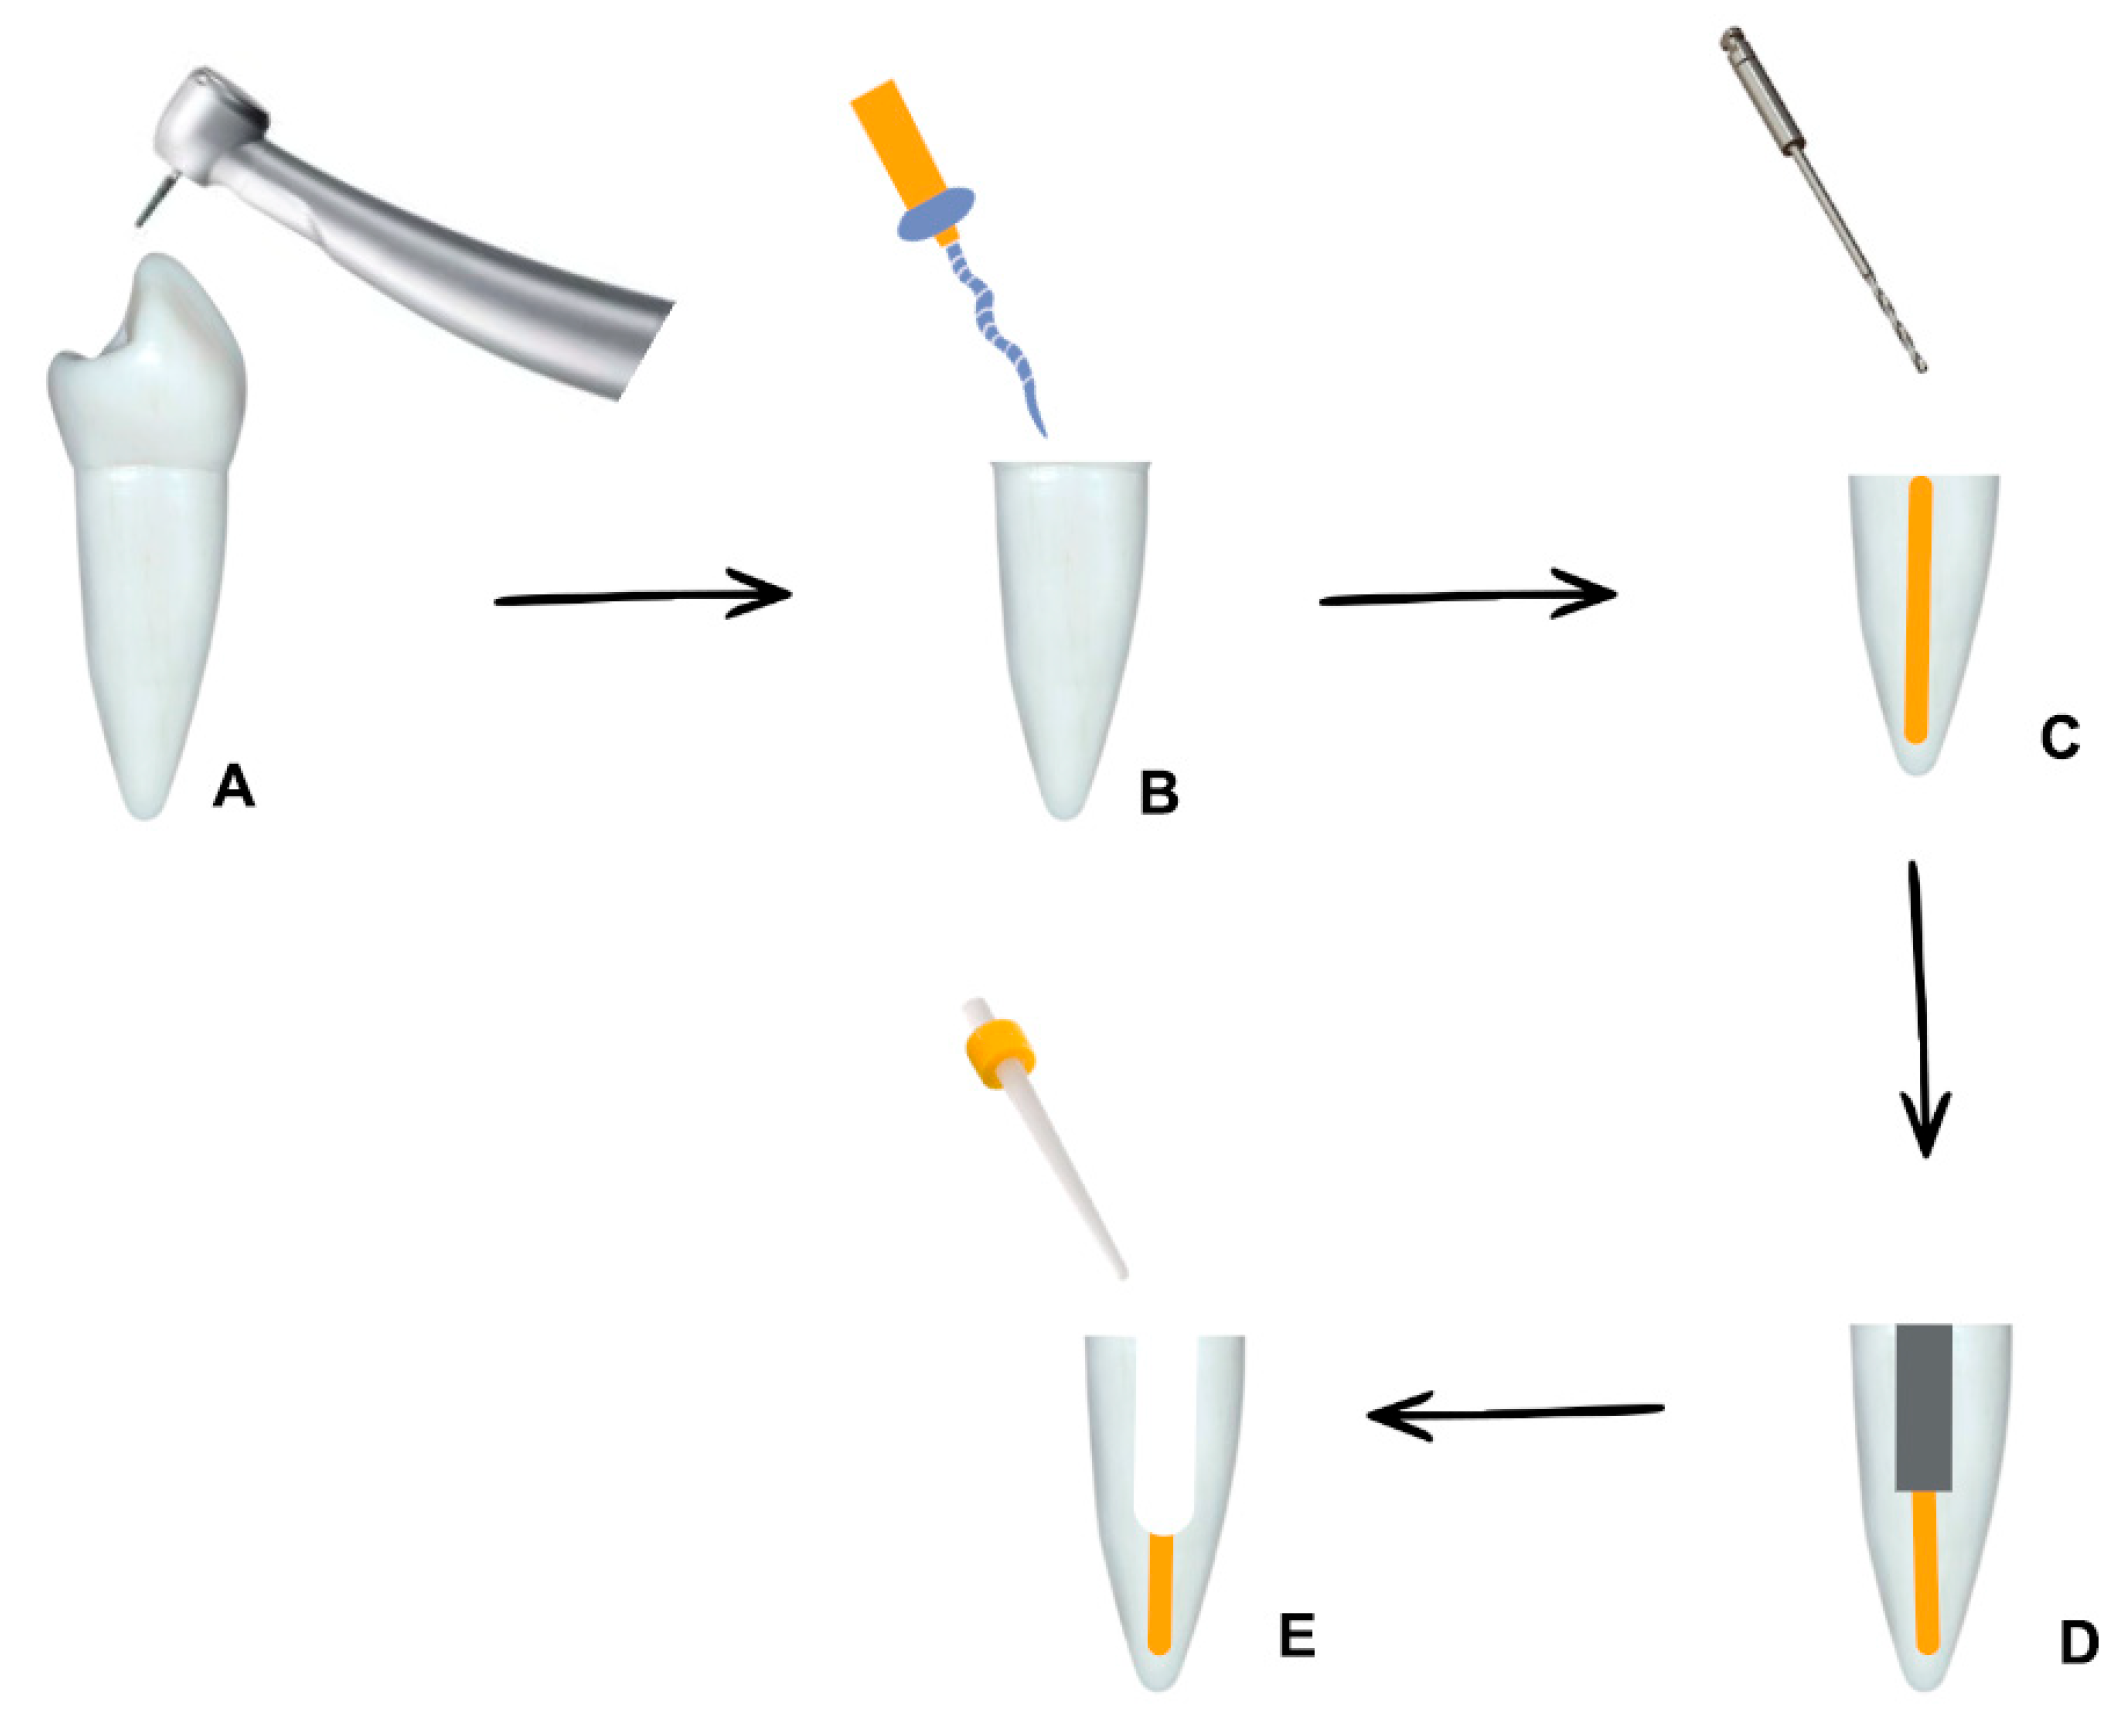
Twenty extracted human mandibular premolars with highly similar external dimensions, single roots, and single canals were included in the study. Teeth with root resorption, cracks, fractures, previous endodontic treatment, caries, restorations, or incomplete root formation were excluded. Soft tissue remnants were removed, and the specimens were disinfected in 0.5% sodium hypochlorite solution and stored in artificial saliva at 4 °C until use. Prior to the main experiment, a pilot study was conducted on various root anatomies with canal lengths ranging from 9 to 15 mm to evaluate the intraoral scanner’s depth capacity. Based on the preliminary findings, the scanner reliably captured the post space anatomy up to a maximum depth of 13.5 mm when the canal was numerically divided into three equal segments above the apical gutta-percha. Therefore, the crowns were sectioned at the cemento-enamel junction under water cooling to achieve a standardized root length of 13.5 ± 0.5 mm. Root canal preparation was performed using the ProTaper Next R25 rotary system (Dentsply Sirona, Ballaigues, Switzerland). Irrigation was carried out with 2.5% NaOCl during instrumentation, followed by 17% EDTA, NaOCl, and distilled water. The canals were obturated using the single-cone technique with R25 gutta-percha cones and root canal sealer. Specimens were stored at 37 °C and 100% humidity for 72 h to allow complete sealer setting (Figure 1).
This in vitro experimental study was approved by the Medical Research Ethics Committee of Ege University (25-8T/100). To ensure a strict double-blind protocol and eliminate operator bias, all endodontic treatments were performed by a single specialist from the Department of Endodontics. Following canal obturation, all specimens were pooled together, and the subsequent post space preparations and cementation procedures were executed by a different, independent endodontist who was completely blinded to the initial root canal preparation parameters. All experimental procedures were performed under standardized conditions.

2.2. Experimental Groups and Post Space Preparation

A power analysis was performed using G*Power software (v.3.1.9.7, Heinrich-Heine-University, Düsseldorf, Germany) with an effect size of 0.86, critical F = 3.238, and 82.53% achieved power, resulting in a minimum sample size of 5 specimens per group and 15 slices for the regional push-out analysis, while 5 specimens per group (yielding 600 sections per tooth) were randomly selected for the micro-CT evaluation:
  • Group 1: 3D-printed custom post (VarseoSmile TriniQ, BEGO, Bremen, Germany).
  • Group 2: everStick Post (GC Corporation, Tokyo, Japan).
  • Group 3: RelyX Fiber Post (3M ESPE, St. Paul, MN, USA).
  • Group 4: Splendor SAP (Angelus, Londrina, Brazil).
Post spaces were prepared while maintaining 4–5 mm of apical gutta-percha. Manufacturer-specific drills were used for the RelyX Fiber Post and Splendor SAP groups. For standardization, the size #2 RelyX drill was also used in the everStick and 3D-printed post groups. Following preparation, ultrasonic irrigation was performed for 30 s to remove residual debris and sealer remnants.

2.3. Post-Fabrication and Cementation

All post systems were cemented using dual-cure self-adhesive resin cement (RelyX Universal Resin Cement, 3M ESPE, St. Paul, MN, USA). Prior to cementation, post spaces were irrigated with 2.5% NaOCl and distilled water, gently dried with paper points, and treated with a universal silane integrated adhesive system (Scotchbond Universal Plus, 3M ESPE, St. Paul, MN, USA) according to the manufacturer’s instructions. The everStick posts were individually adapted to the root canal morphology and pre-polymerized before final cementation.
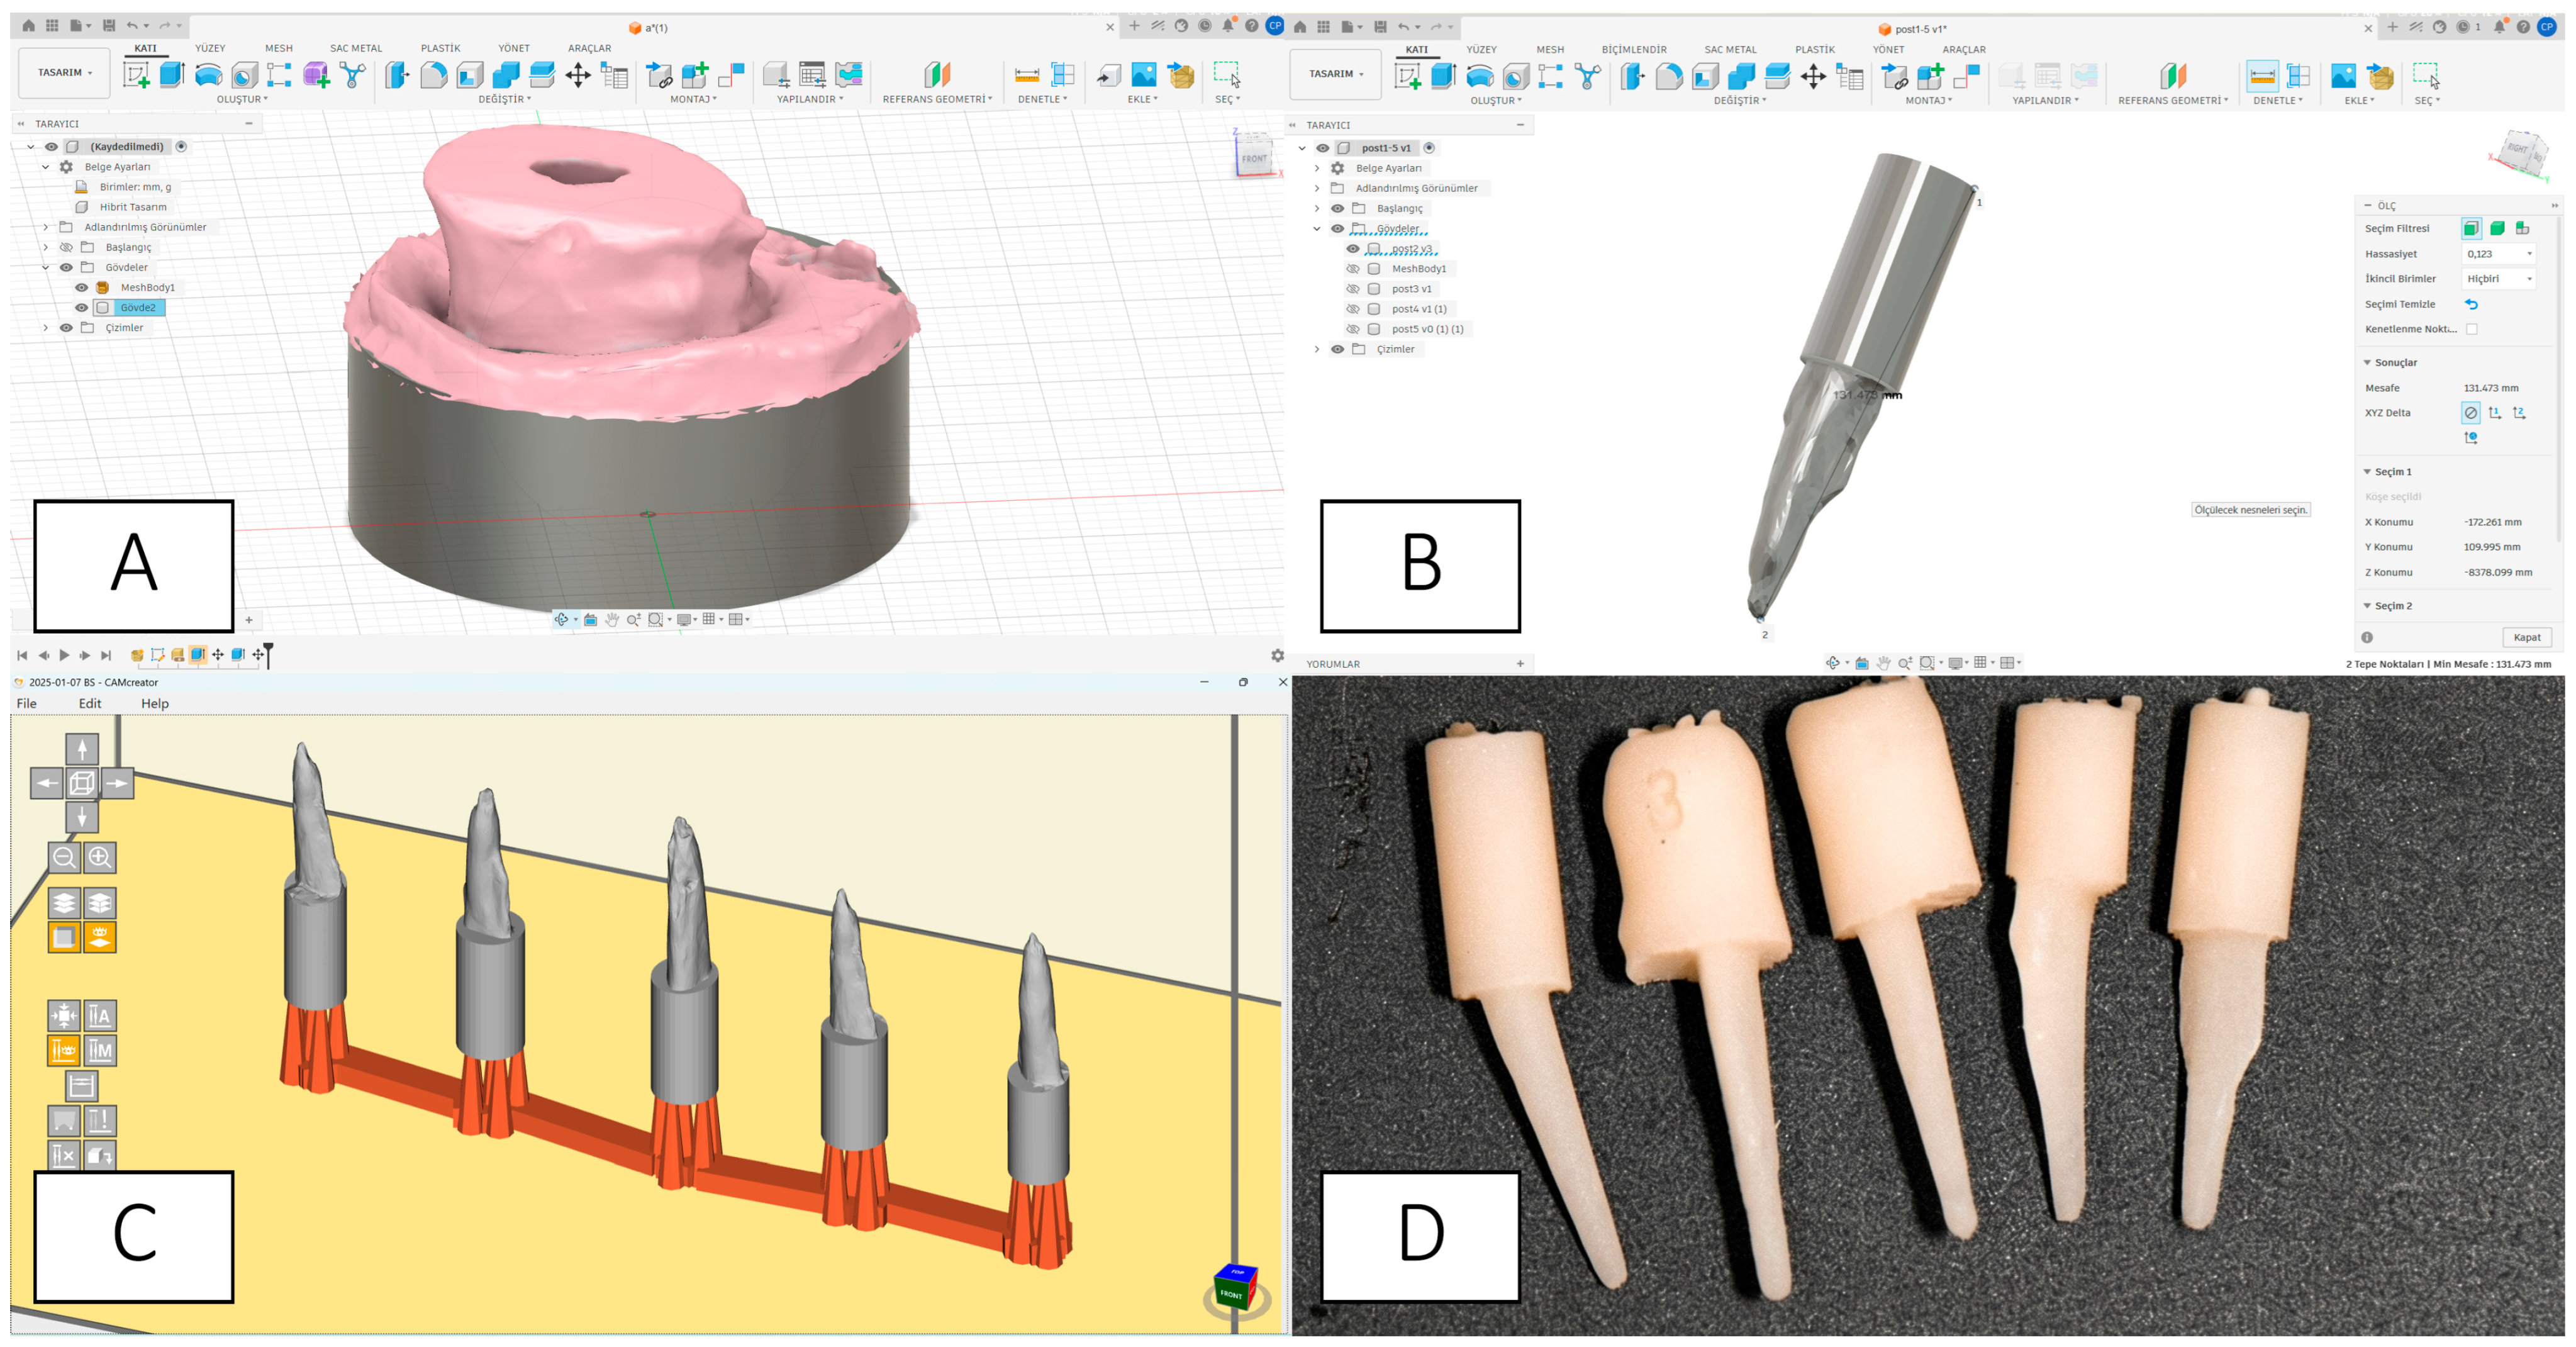
For the experimental group, root canal morphology was digitally scanned using an intraoral scanner (TRIOS 5, 3Shape, Copenhagen, Denmark). Customized posts were designed using CAD software (Fusion 360, v.2605.1.39, Autodesk Inc., San Francisco, CA, USA) and fabricated with a digital light processing (DLP) 3D printer (Varseo XS, BEGO, Bremen, Germany) using a permanent hybrid composite resin (VarseoSmile TriniQ, BEGO, Bremen, Germany). The printed posts were cleaned in 99% isopropyl alcohol and post-cured according to the manufacturer’s instructions before cementation (Figure 2).

2.4. Micro-Computed Tomography Evaluation

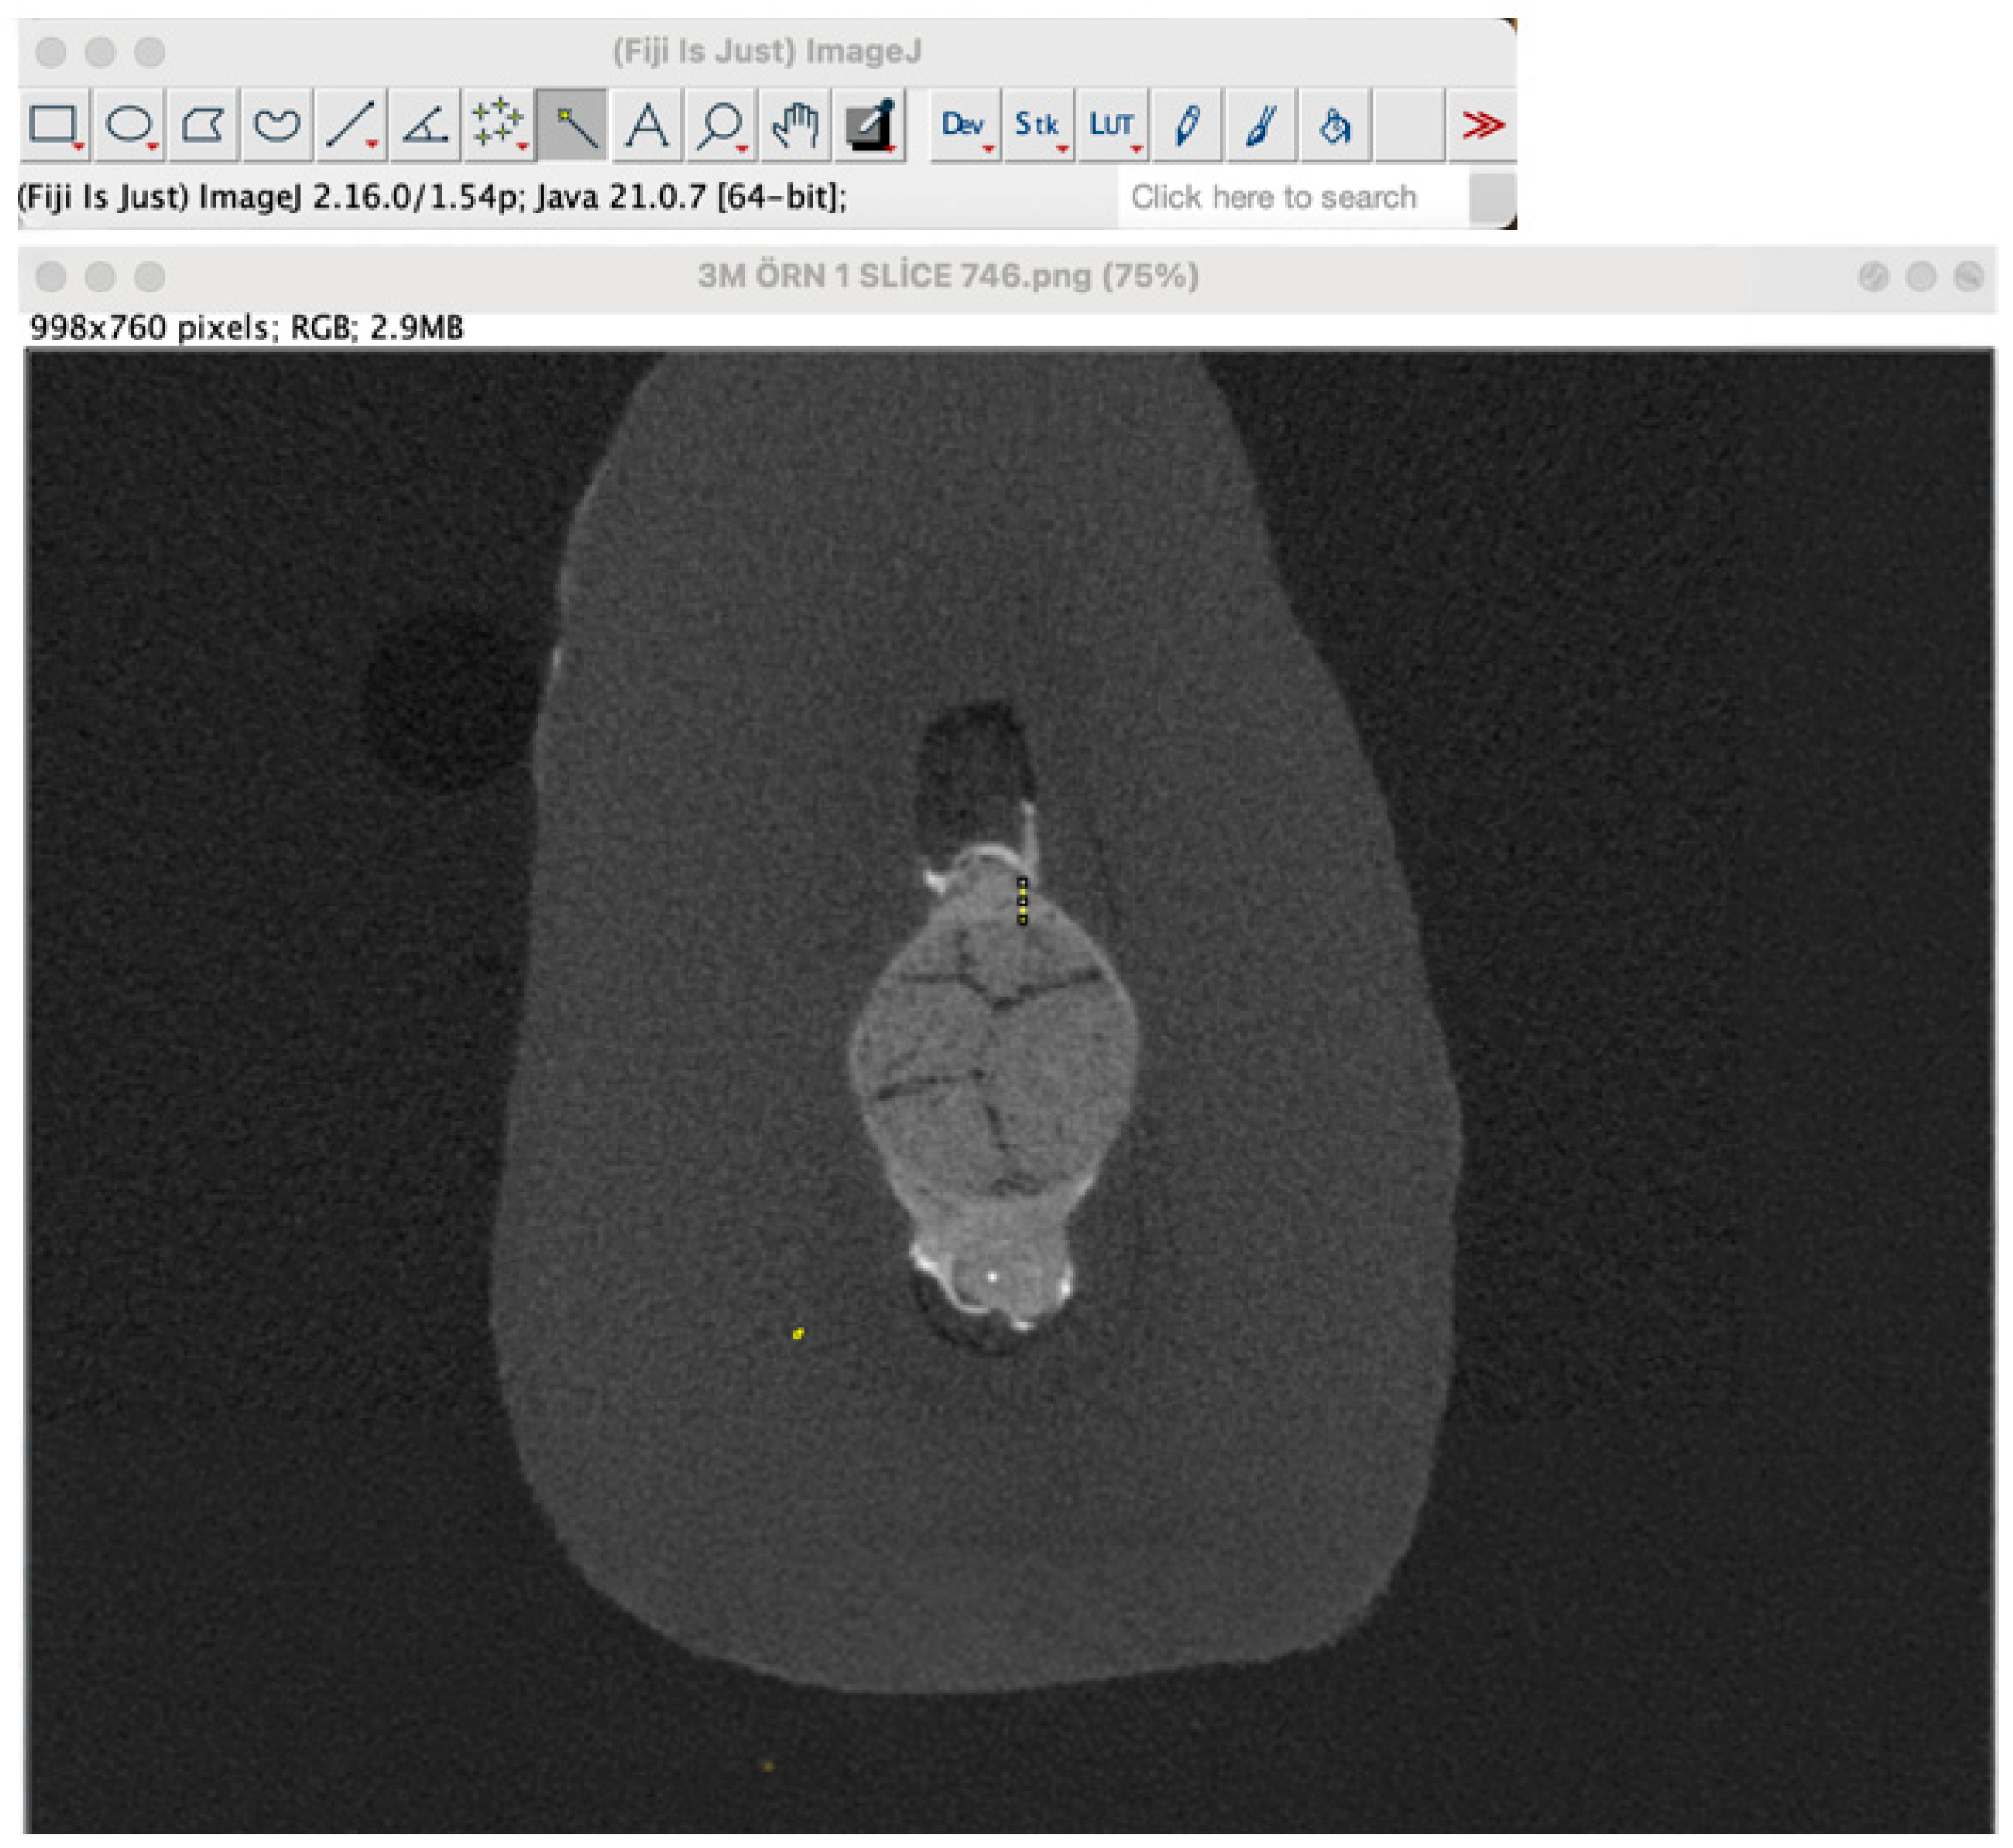
Internal adaptation, cement thickness, and interfacial gap formation were evaluated using a high-resolution micro-computed tomography device (RX Solutions, Chavanod, France). Five randomly selected specimens from each group were scanned under standardized conditions (80 kV, 125 µA, 1.2 mm Al filter). Approximately 853 cross-sectional images were obtained per specimen. The acquired images were analyzed using ImageJ software (v1.54p, National Institutes of Health, Bethesda, MD, USA). The evaluated region consisted of 600 sections divided equally into apical, middle, and coronal thirds. Cement thickness measurements were obtained from three different points along the post–dentin interface in each section, and mean values were calculated. Gap formation and voids within the cement layer were also recorded in micrometers (µm) (Figure 3).
To prevent the subjective drift often associated with human visual estimation, all interface tracking and gap boundary measurements were conducted using computerized image processing software. The software calibrated spatial resolutions automatically by converting pixel units directly into micrometers based on fixed micro-CT scan inputs. Furthermore, automated gray-scale density thresholding was applied to segment the radio-opacity profiles of dentin, resin cement, and post materials objectively based on distinct contrast density variations.

2.5. Push-Out Bond Strength Test

After cementation, the roots were sectioned perpendicular to their long axis using a precision saw (IsoMet, Buehler Ltd., Lake Bluff, IL, USA) to obtain 1–2 mm thick slices representing the coronal, middle, and apical regions (yielding exactly 3 slices per tooth, resulting in n = 5 slices per region and a total of 15 slices per group). Push-out bond strength testing was performed using a universal testing machine (Shimadzu Corp., Kyoto, Japan) with a 0.8 mm cylindrical plunger at a crosshead speed of 0.5 mm/min.
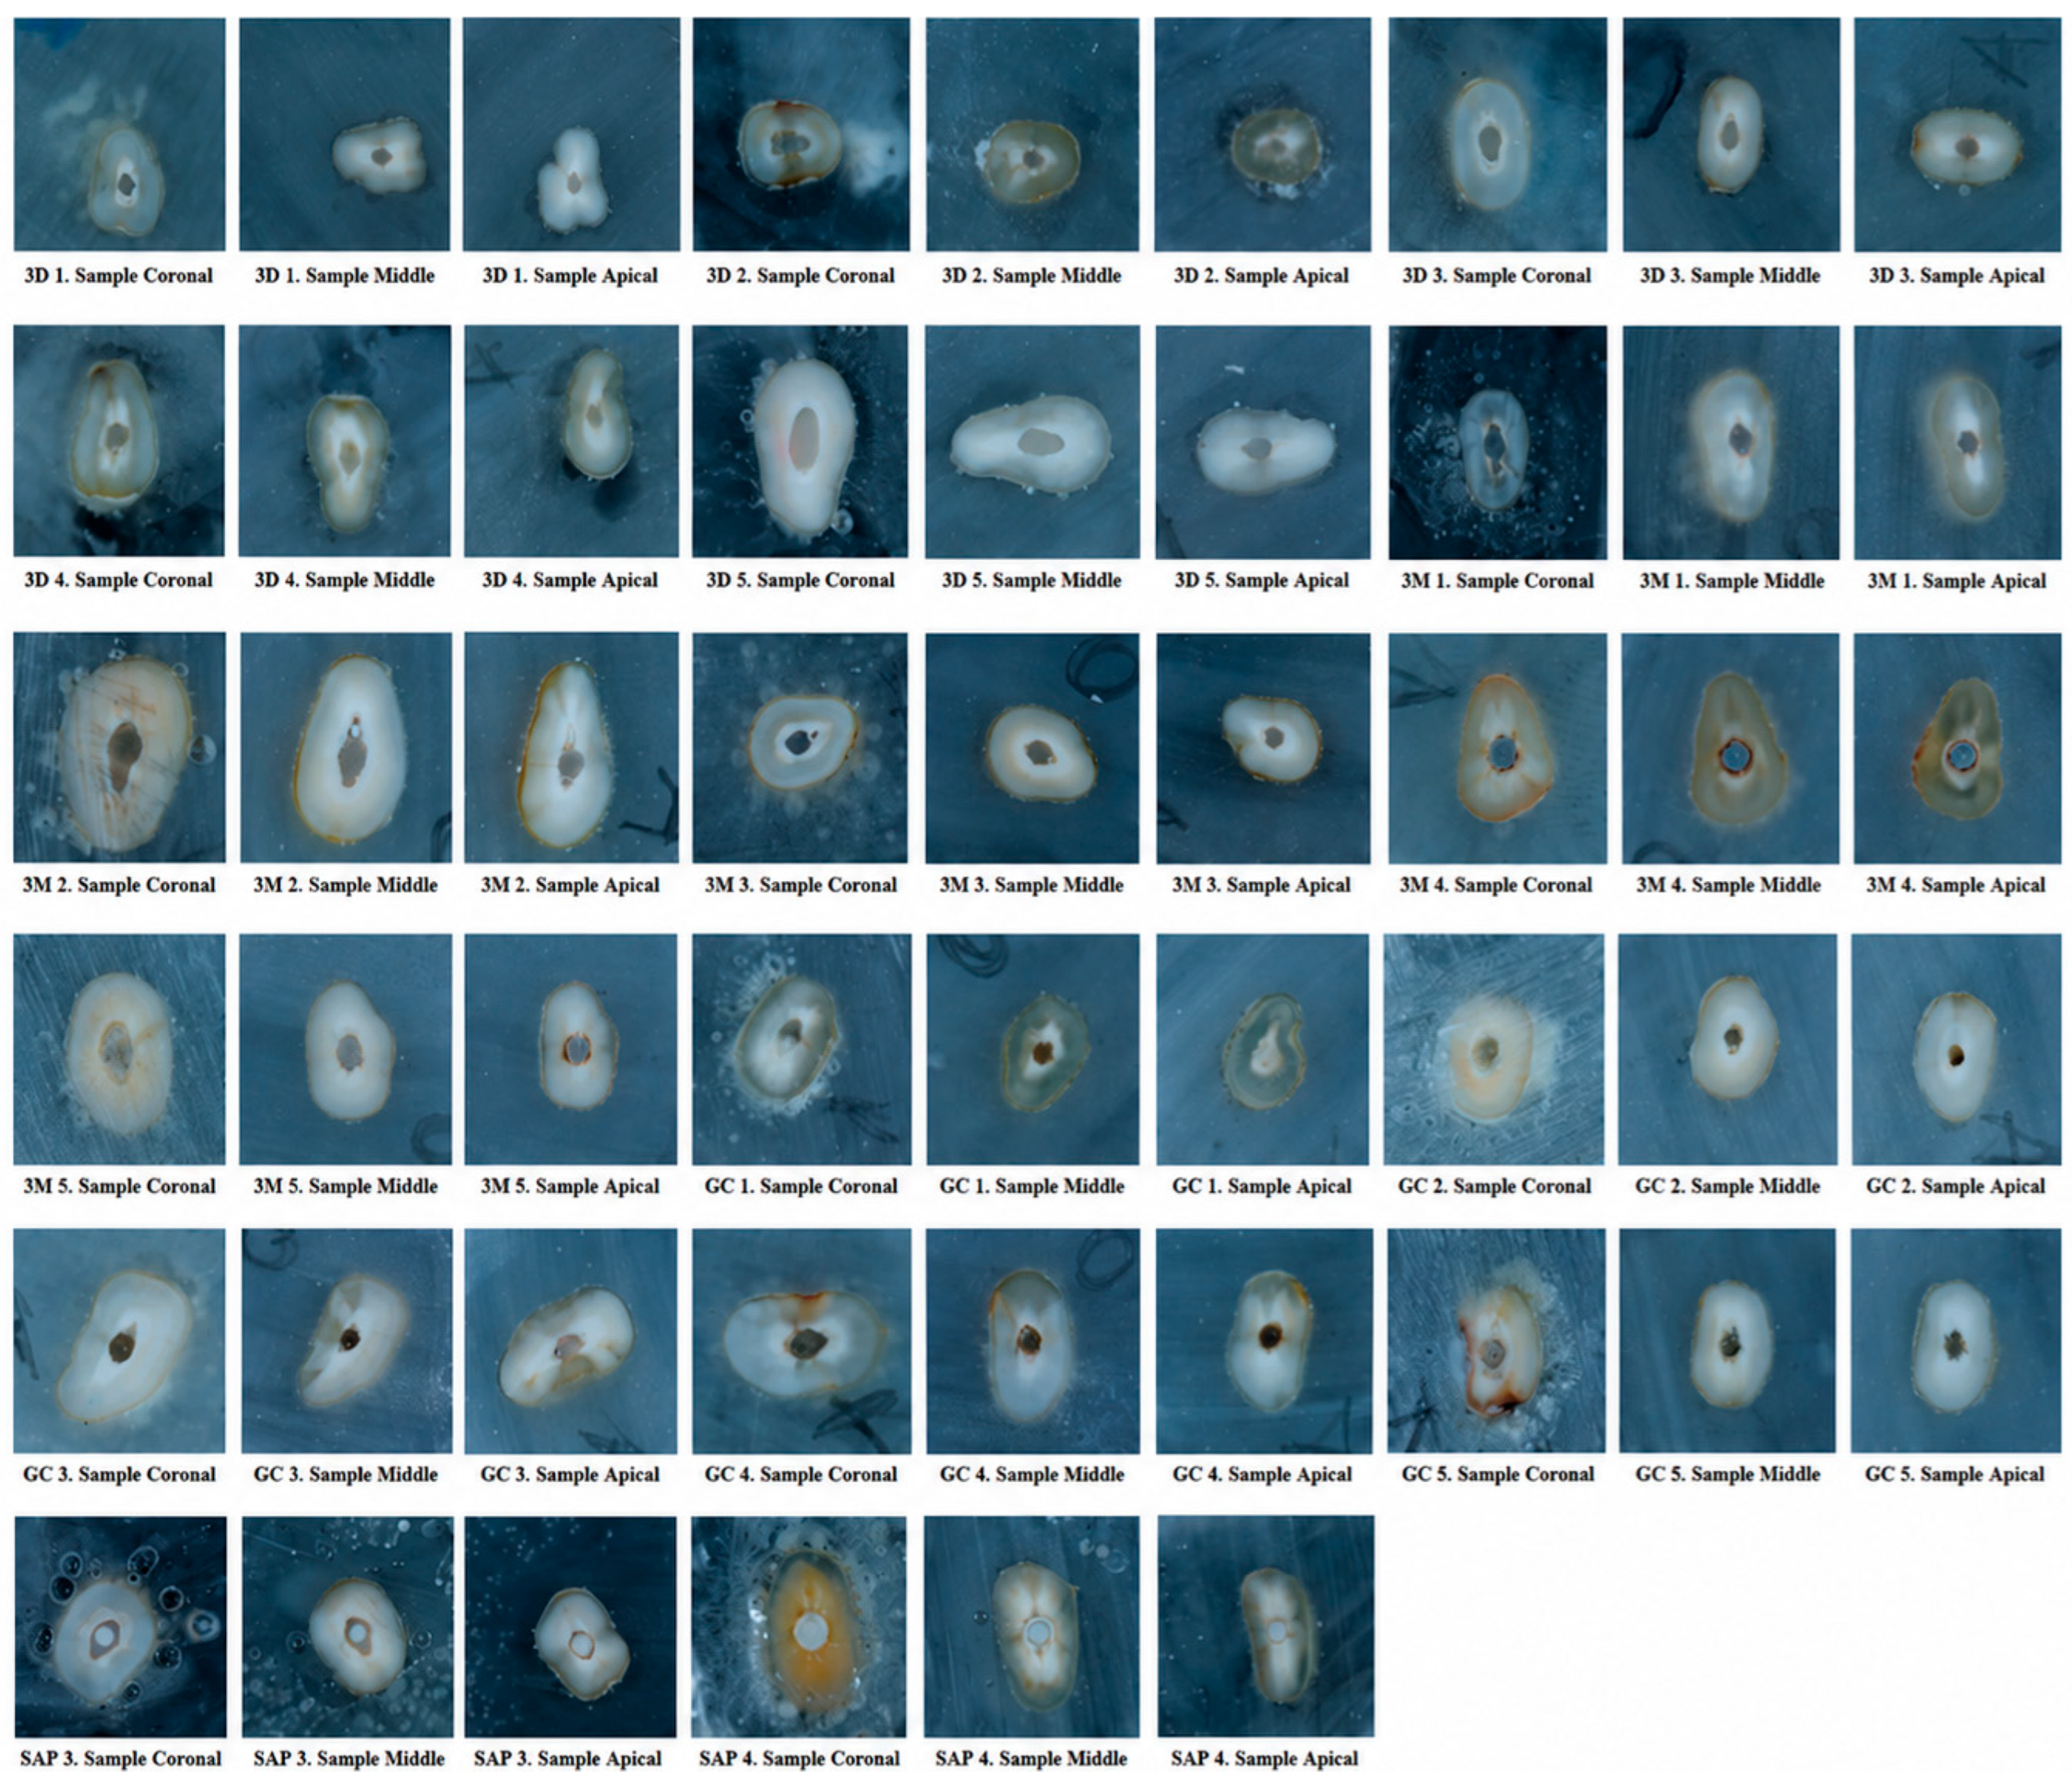
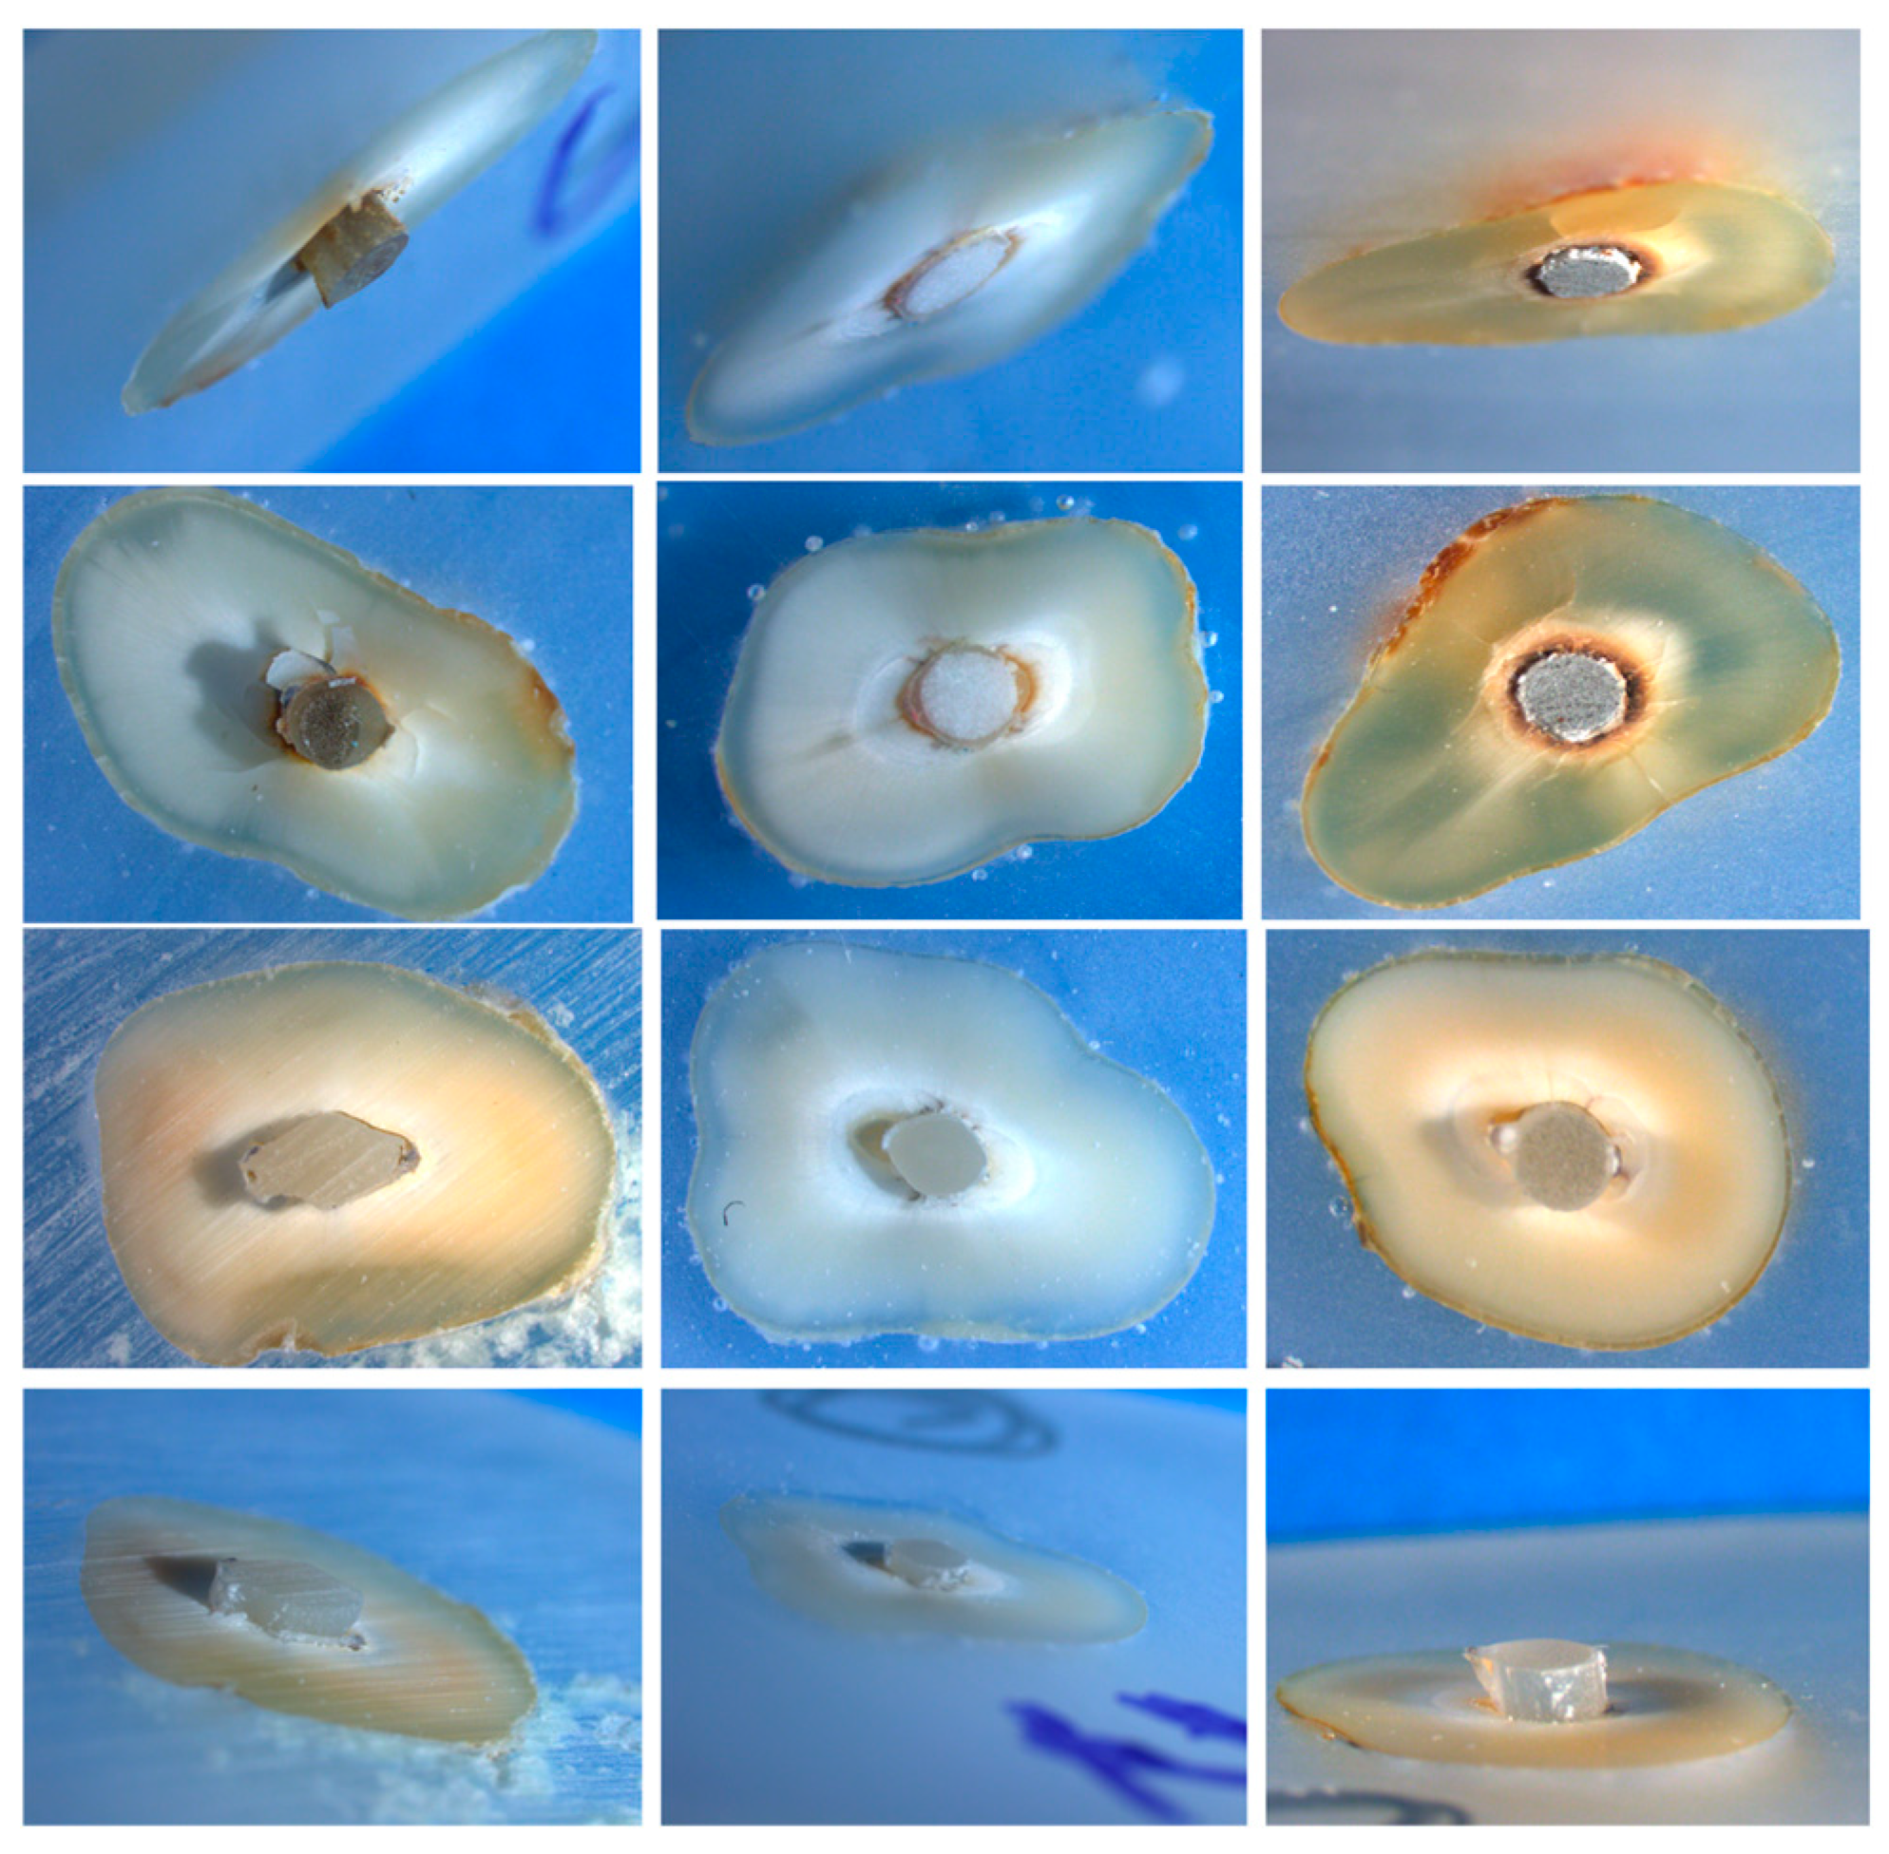
The maximum load at failure was recorded in Newtons (N), and bond strength values were calculated in megapascals (MPa) by dividing the load by the bonded surface area. The bonded area was calculated according to the conical geometry of the specimens. Representative sections from all experimental groups used for push-out bond strength testing are shown in Figure 4.

2.6. Statistical Analysis

Statistical analyses were performed using IBM SPSS Statistics software (v.27.0, IBM Corp., Armonk, NY, USA). Data distribution was assessed using the Shapiro–Wilk test. Since the data were not normally distributed, non-parametric tests were used. Intergroup comparisons were performed using the Kruskal–Wallis test followed by Dunn’s post hoc test with the Benjamini–Krieger–Yekutieli correction. The relationship between cement thickness and push-out bond strength was evaluated using Spearman correlation analysis. Statistical significance was set at p < 0.05.

3. Results

3.1. Cement Thickness Evaluation

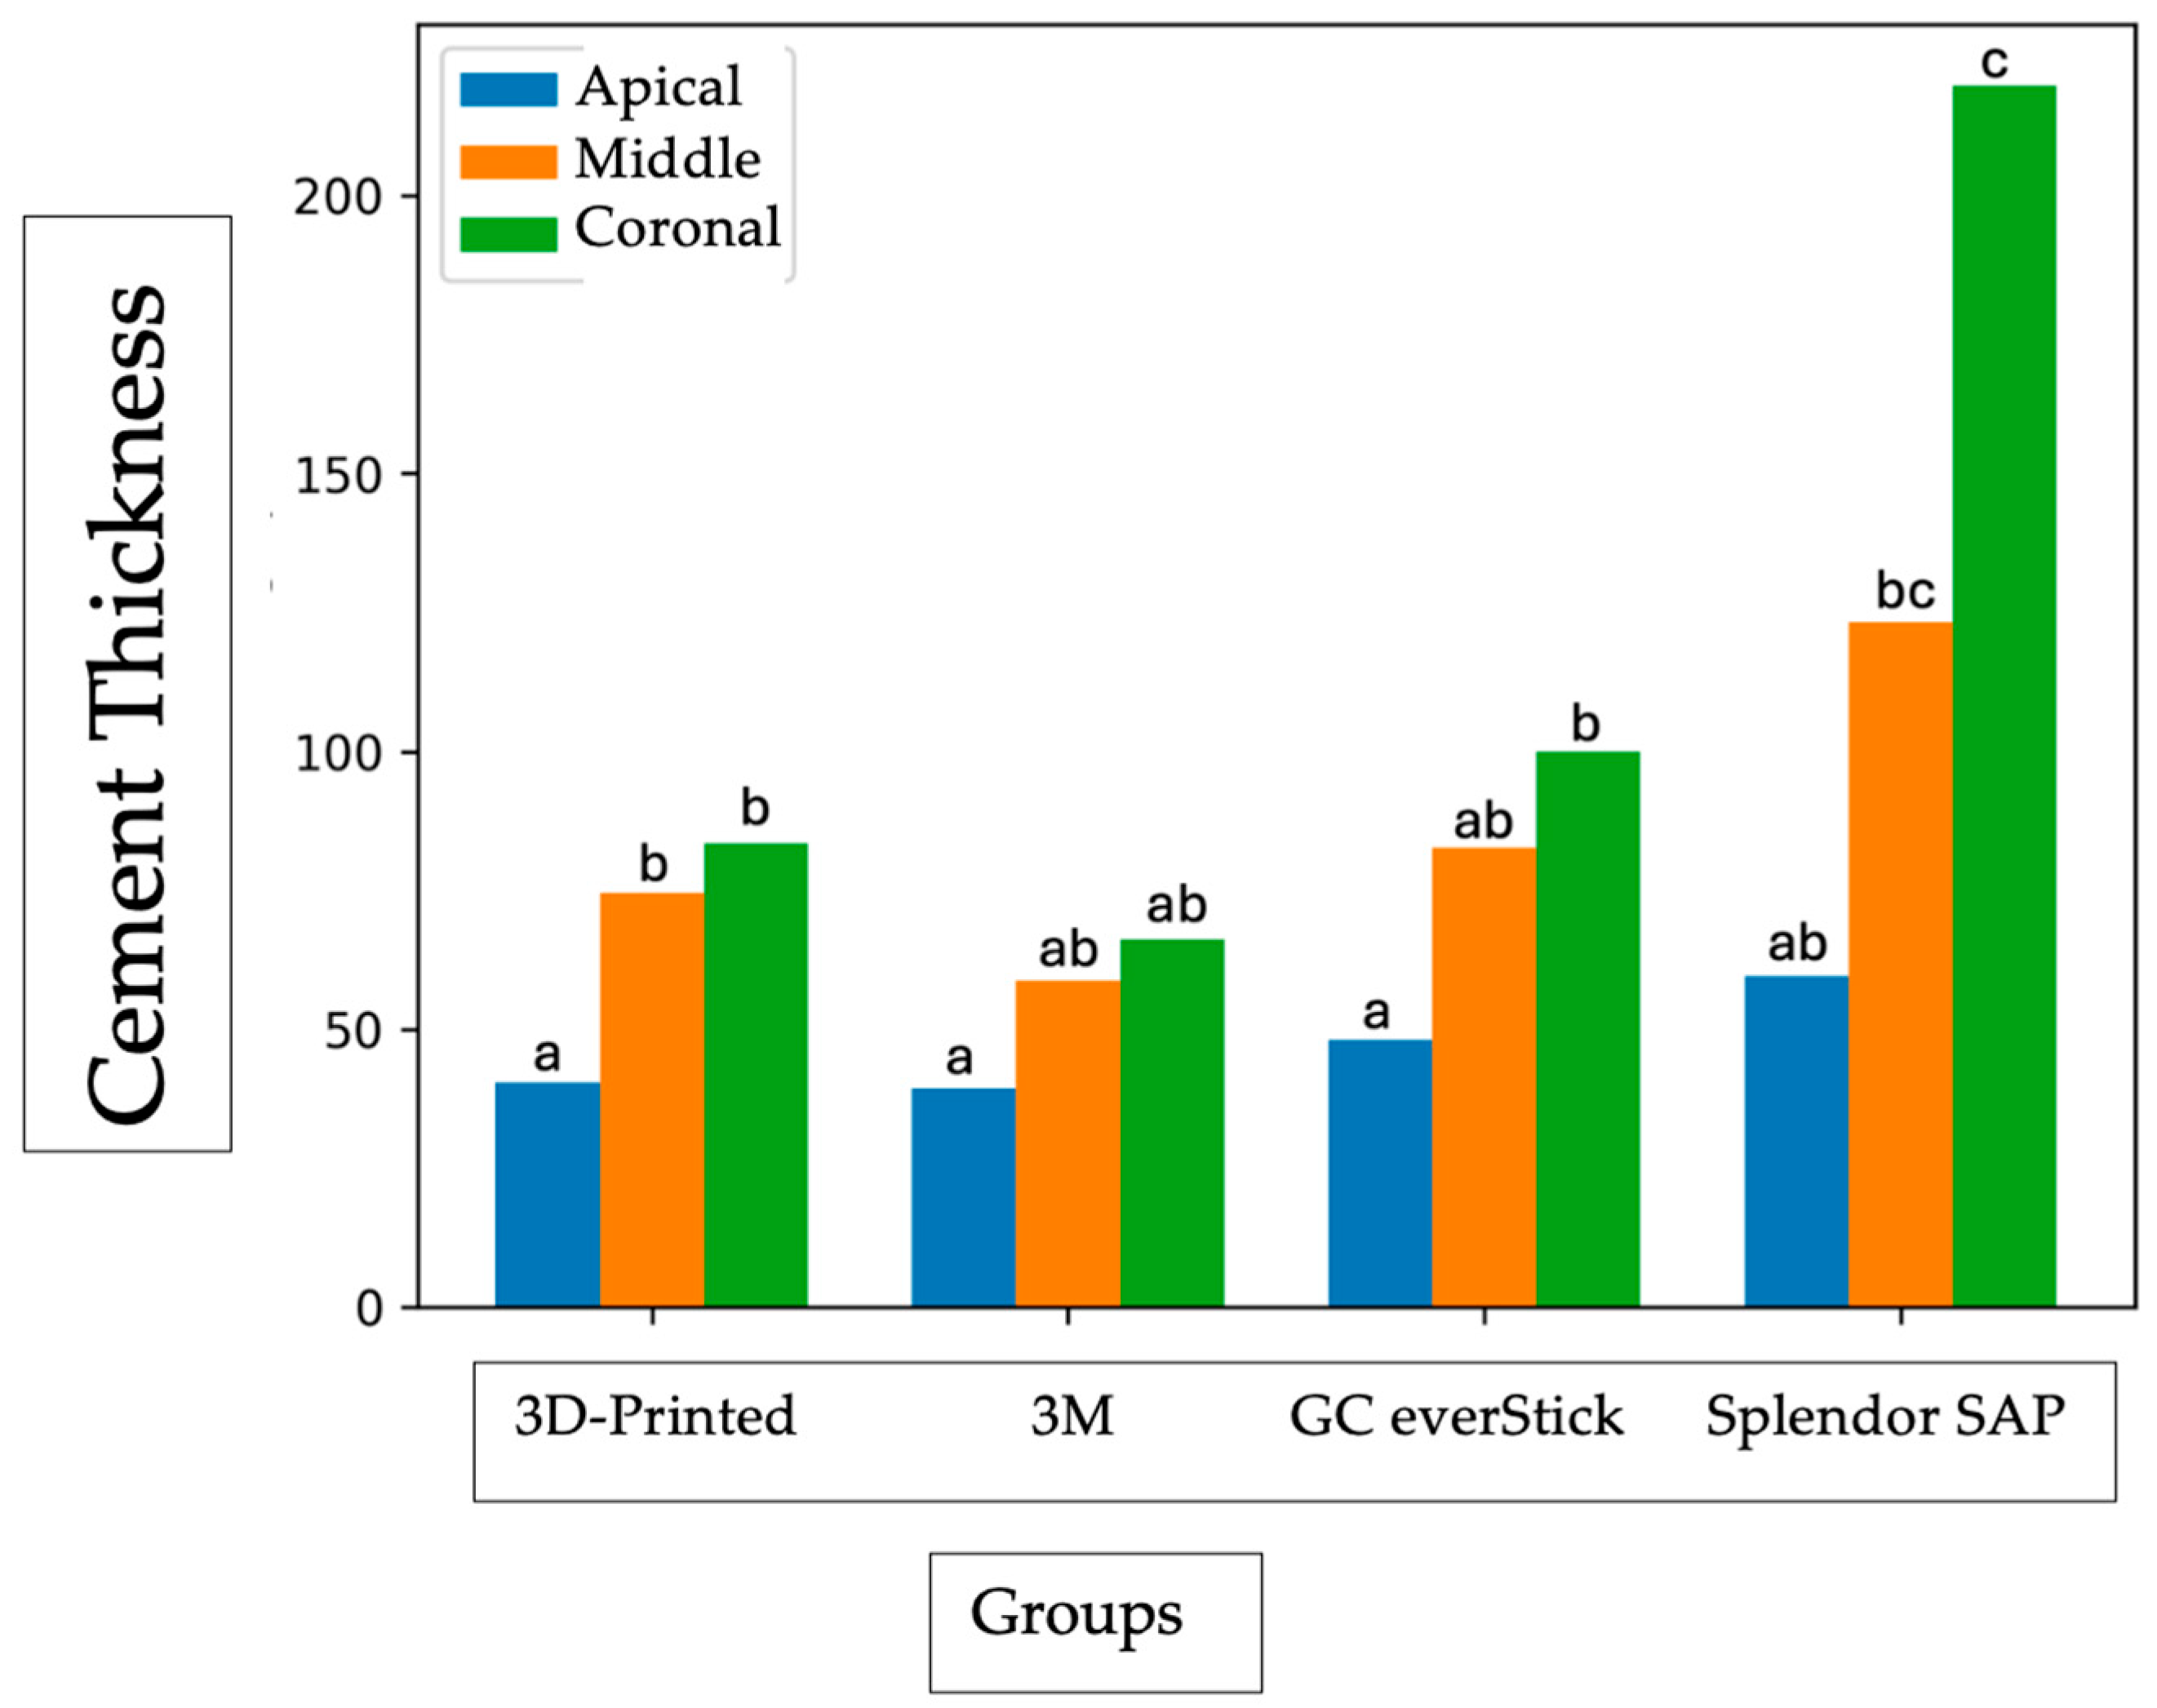
Mean cement thickness values for all groups and root regions are presented in Table 1. In all post systems, cement thickness increased from the apical toward the coronal region. The lowest mean cement thickness values were observed in the 3D-printed post group, whereas the highest values were recorded in the Splendor SAP group. Statistically significant differences among the groups were identified in the apical and coronal regions (p < 0.05), while no significant differences were observed in the middle region (p > 0.05). In the apical region, a significant difference was detected between the 3M RelyX and Splendor SAP groups (p < 0.05). In the coronal region, the Splendor SAP group demonstrated significantly greater cement thickness values compared with the 3D-printed, 3M RelyX, and GC everStick groups (p < 0.05) (Figure 5).

3.2. Gap Formation Analysis

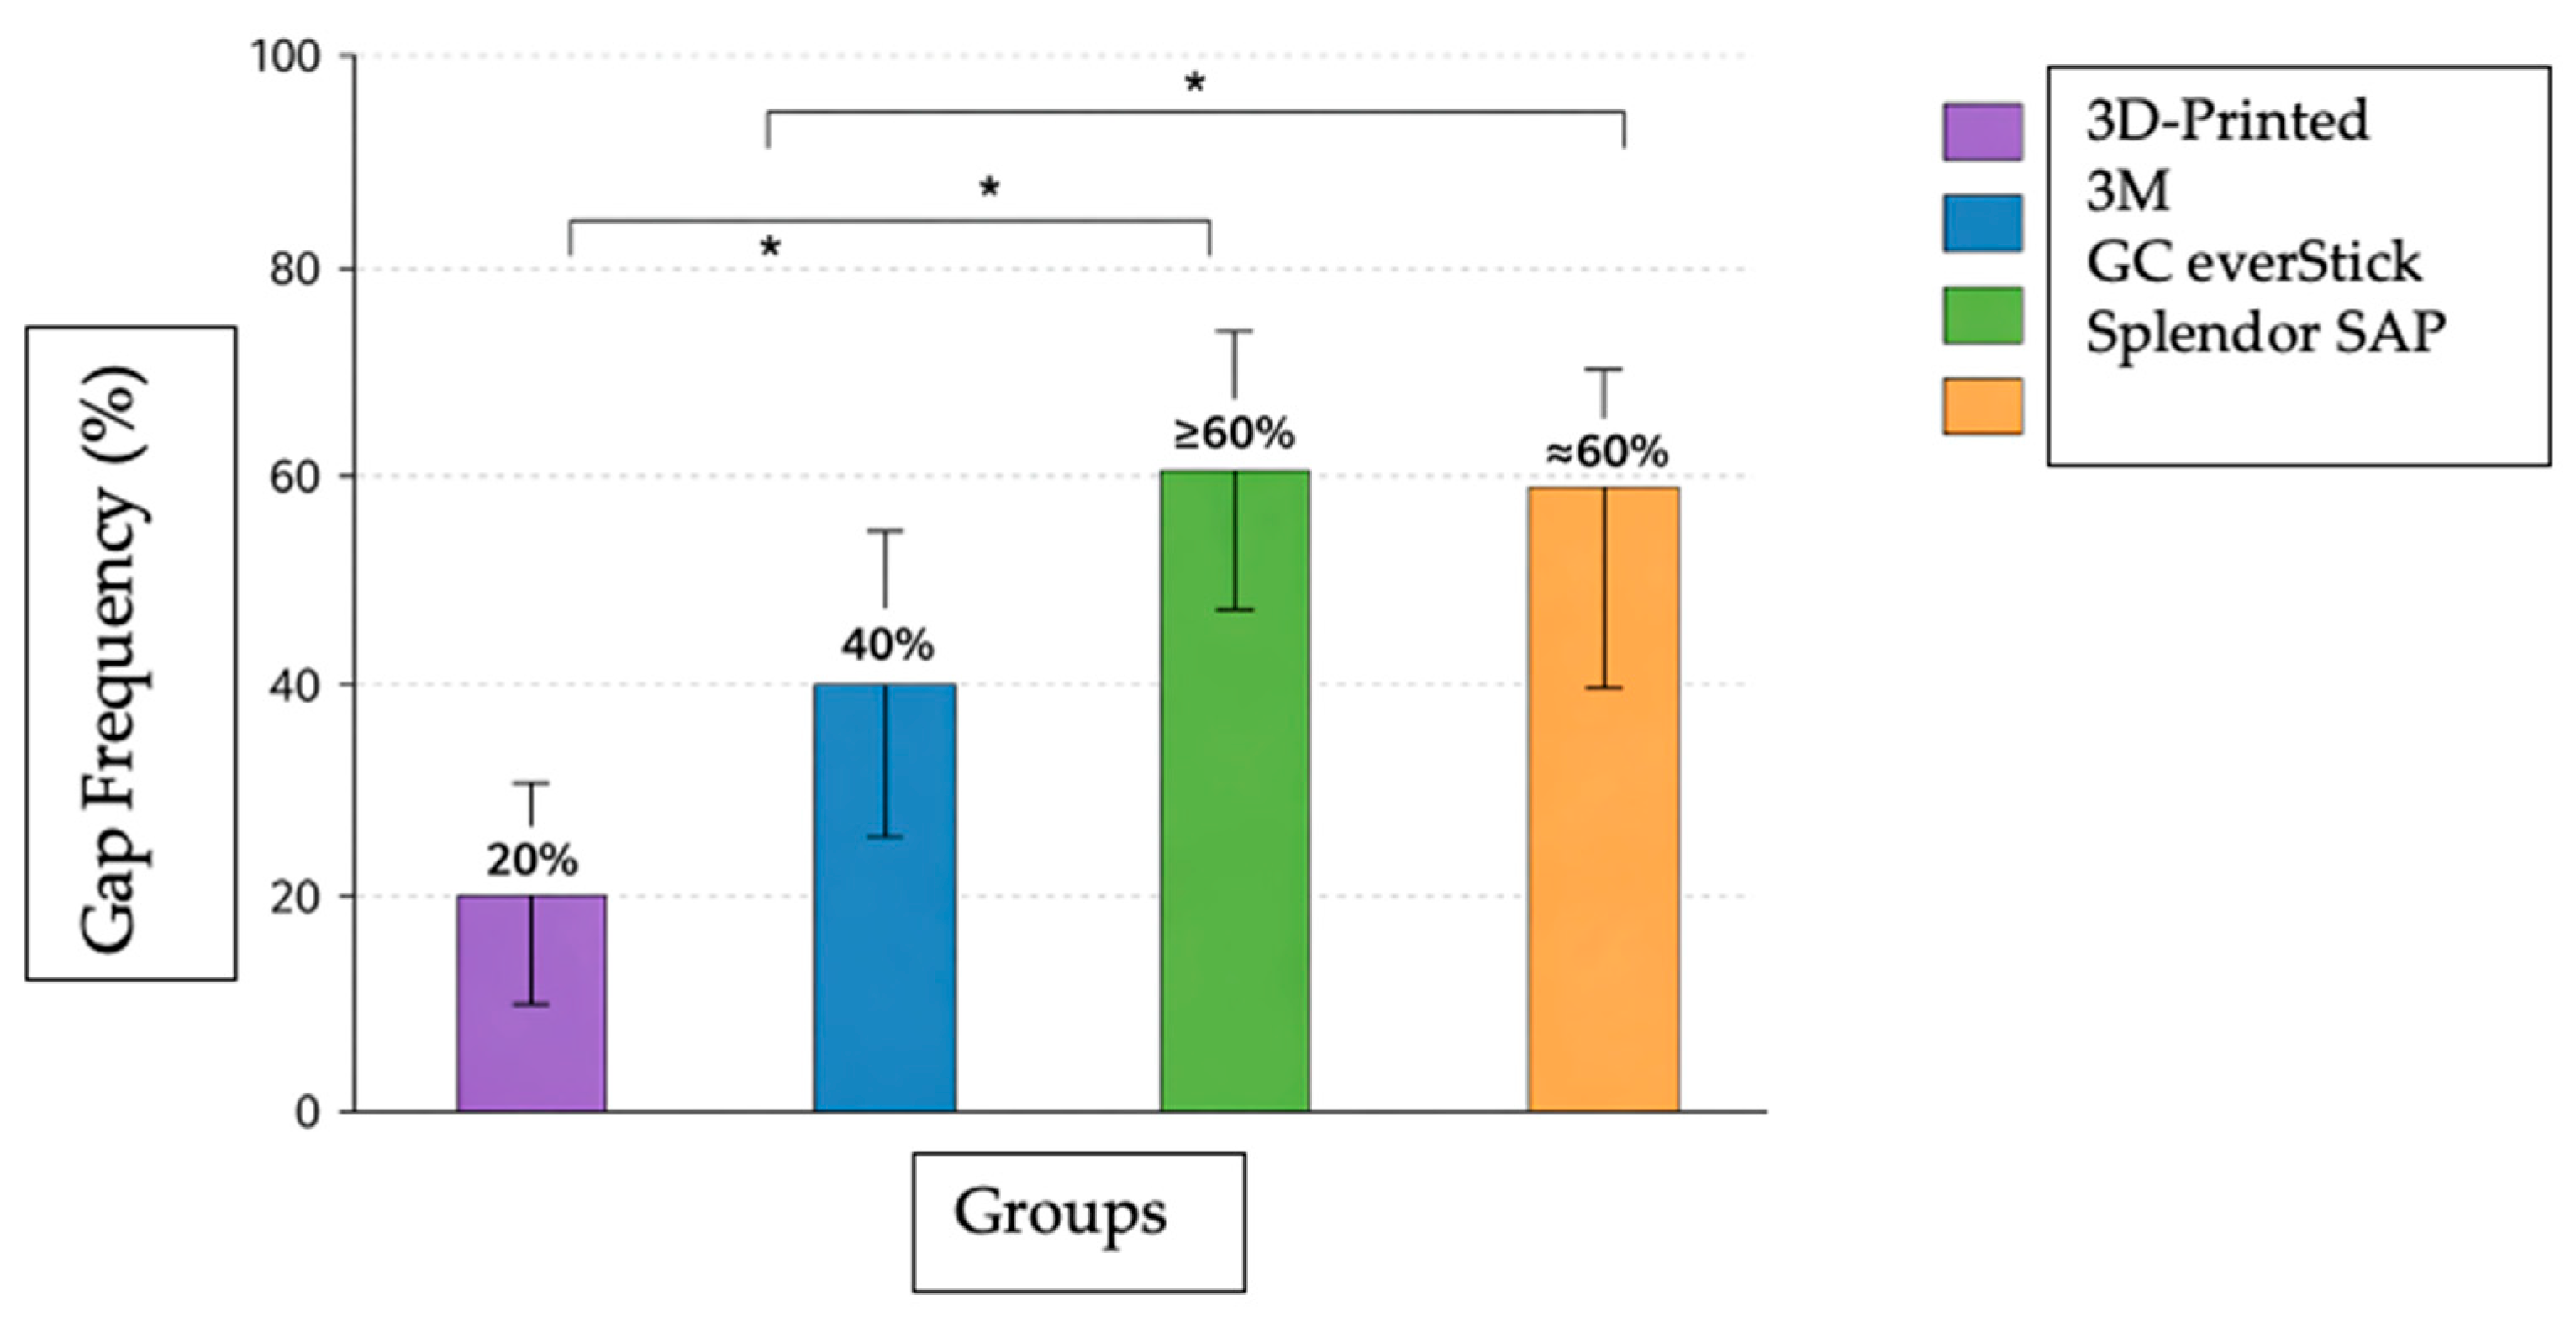
Gap formation analysis demonstrated that the 3D-printed post group exhibited the lowest frequency of interfacial gaps, whereas the GC everStick and Splendor SAP groups showed significantly higher gap frequencies (p < 0.05). Gap formation was observed predominantly in the coronal region, while the apical region demonstrated the lowest frequency of gaps (Figure 6).
Regarding gap width, the lowest values were observed in the 3D-printed group (34.36 µm), whereas the highest values were recorded in the GC everStick group (143.51 µm). Although Splendor SAP demonstrated frequent gap formation, the gap widths were lower than those observed in the GC everStick group. No statistically significant differences were observed among the groups regarding overall gap width values (p > 0.05).

3.3. Push-Out Bond Strength

Push-out bond strength values are presented in Table 2. Significant differences were identified among the evaluated post systems (p < 0.05). The highest bond strength values were observed in the 3M RelyX and GC everStick groups, whereas the lowest values were obtained in the 3D-printed post group.
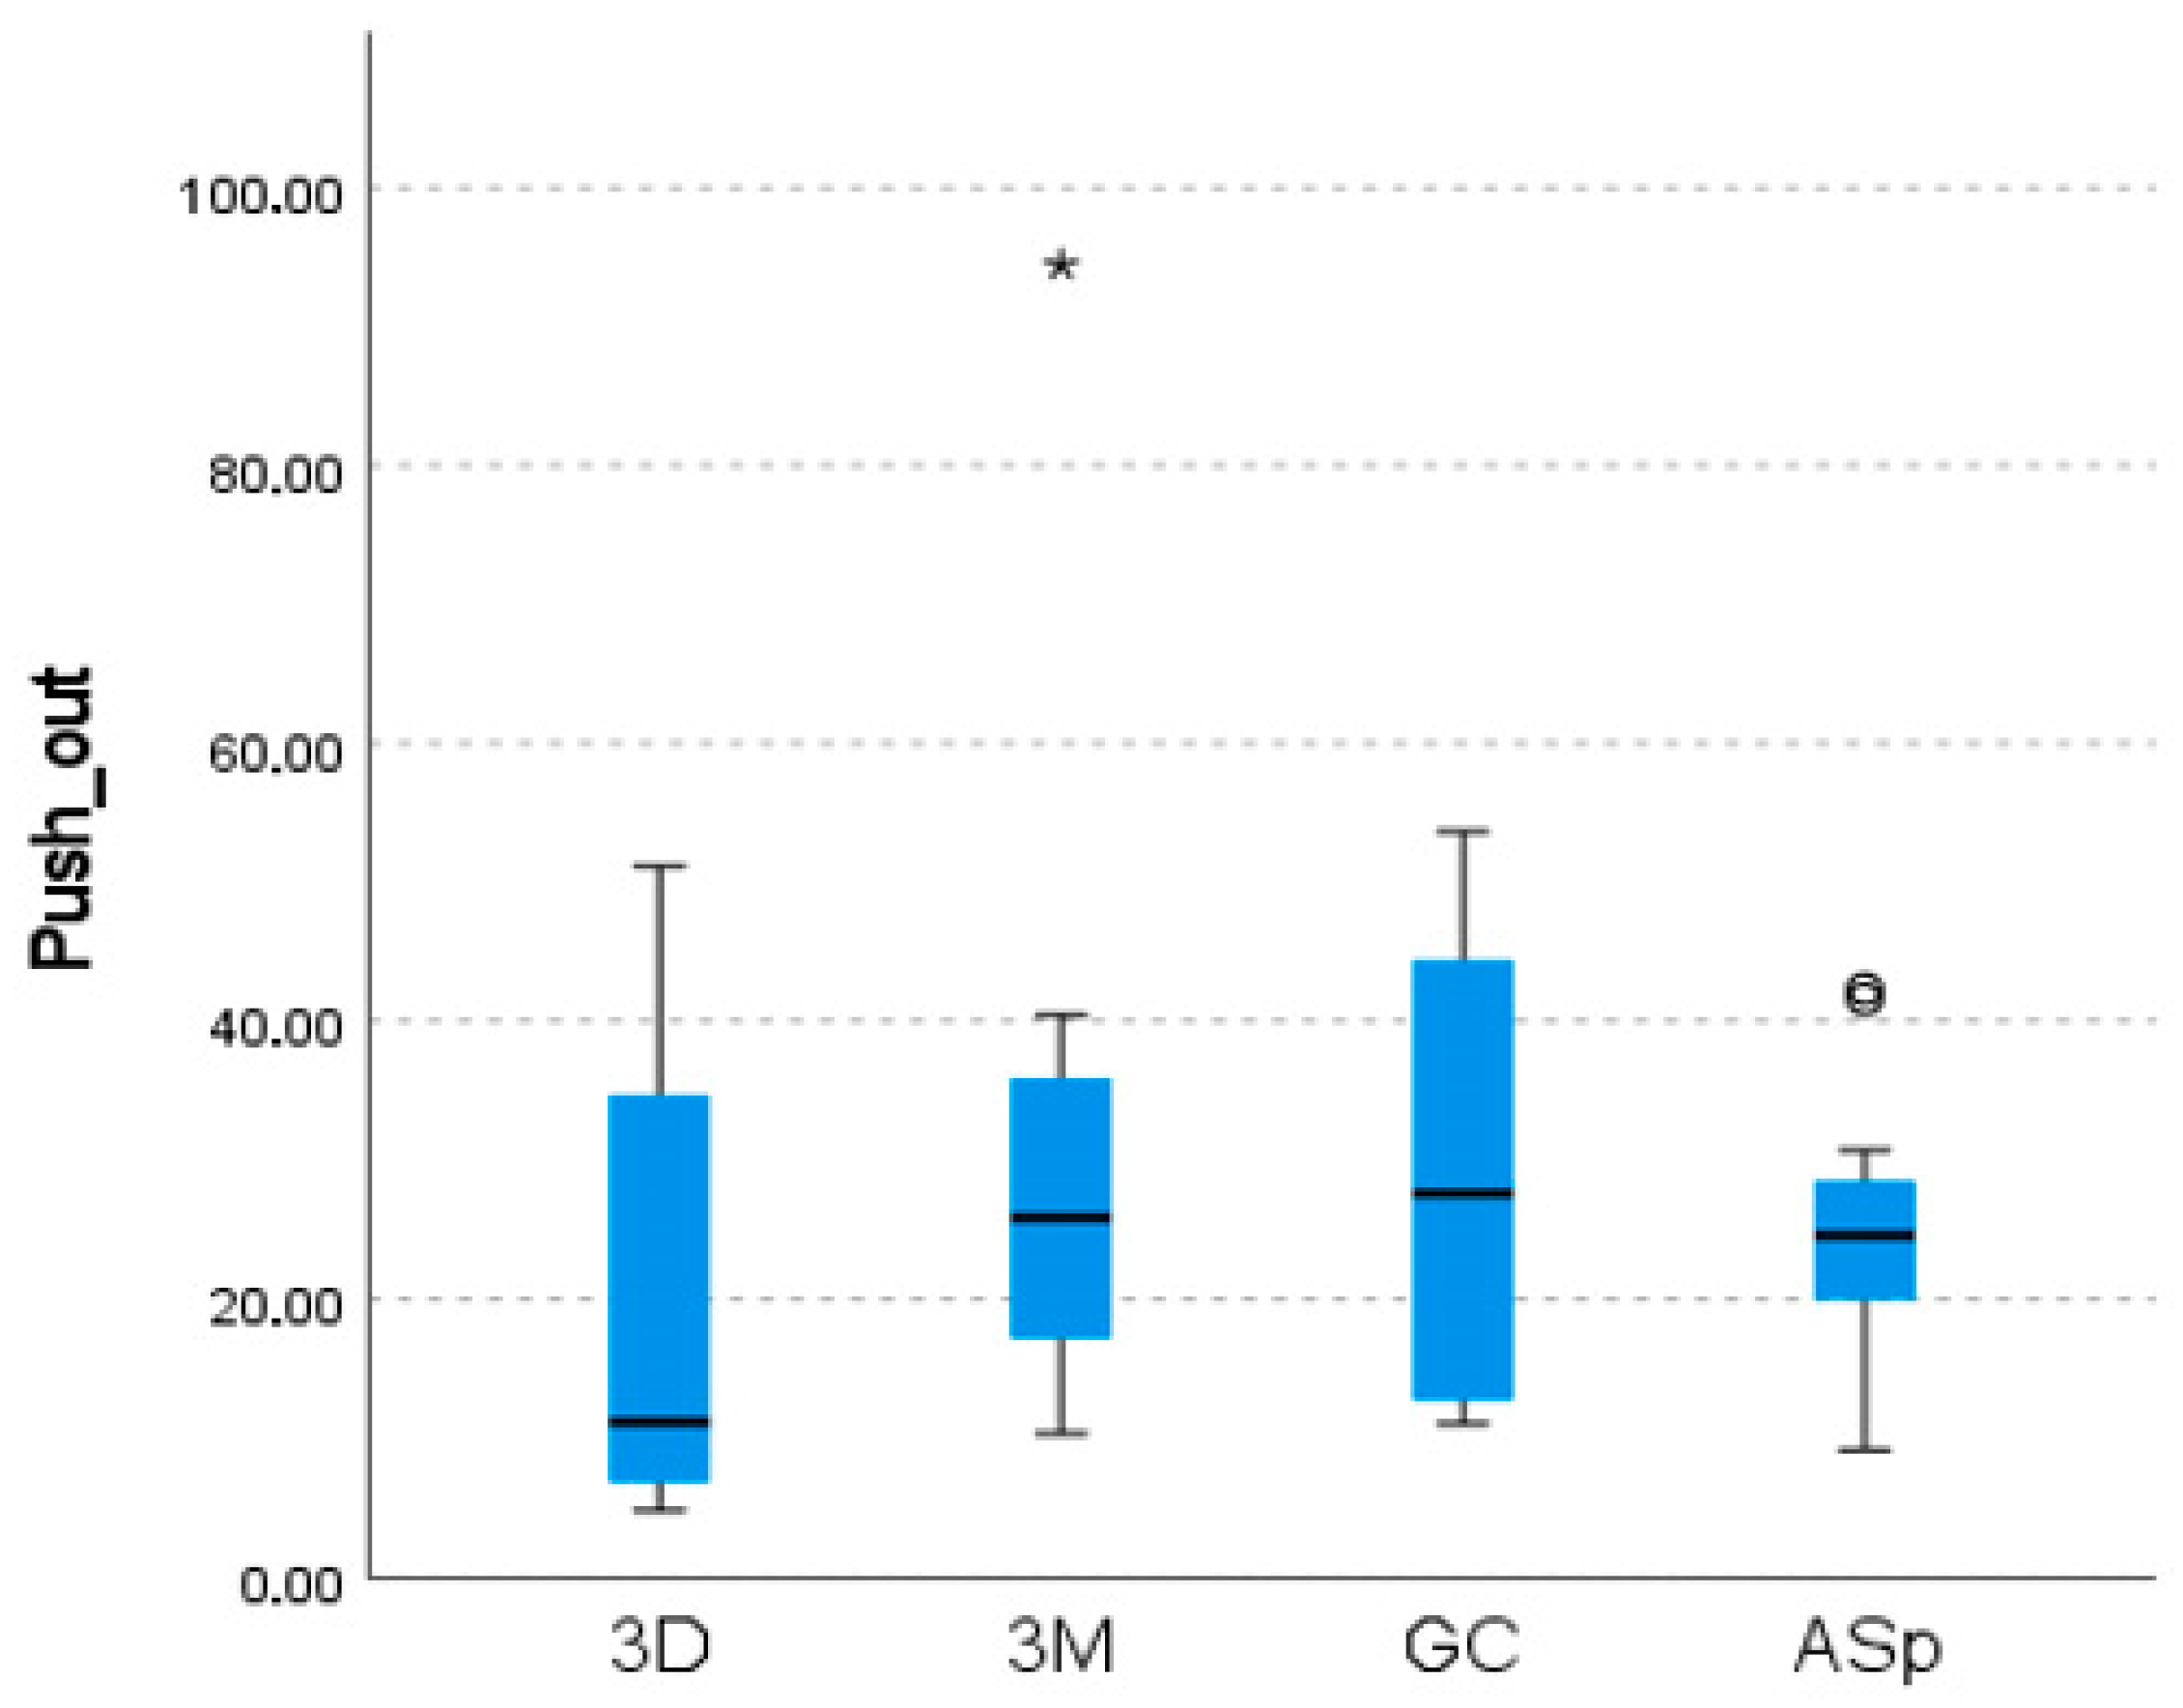
For all groups, bond strength values significantly decreased from the coronal toward the apical region (p < 0.05). The highest bond strength values were recorded in the coronal region, followed by the middle and apical regions. The 3D-printed group demonstrated significantly lower bond strength values in the middle and apical regions compared with the conventional post systems (Figure 7). Representative stereomicroscopic images obtained after push-out testing are presented in Figure 8. Fracture classification was also presented in Table 3.
According to the fracture classification, cohesive-type fractures were most frequently observed in apical sections, where the material thickness was significantly reduced, resulting in fractures in the post material rather than the tooth surface. The same situation was observed in mixed-type fractures. Only in the 3D-printed post group was a cohesive fracture observed in one mid-section, and this was found to be statistically insignificant (p > 0.05).

3.4. Correlation Analysis

Spearman correlation analysis revealed a significant negative correlation between cement thickness and push-out bond strength in the 3D-printed post group (rho = −0.614, p = 0.015). In the 3M RelyX and GC everStick groups, weak negative correlations were observed, whereas the Splendor SAP group demonstrated a weak positive correlation. However, these correlations were not statistically significant (p > 0.05) (Table 4).

4. Discussion

The present study demonstrated that the 3D-printed custom post system provided superior internal adaptation and lower cement thickness values compared with the conventional post systems. However, despite the improved adaptation, the 3D-printed posts exhibited lower push-out bond strength values than the fiber-based post systems. These findings indicate that improved geometric adaptation alone may not guarantee superior adhesive performance at the post–dentin interface.
In the present study, cement thickness increased from the apical toward the coronal region in all evaluated post systems. This finding is consistent with the conical anatomy of root canals, where the coronal region generally presents a wider morphology and reduced adaptation of prefabricated posts to dentin walls [15]. Among the evaluated systems, the 3D-printed custom posts demonstrated the lowest and most homogeneous cement thickness values, whereas the Splendor SAP group exhibited the highest values, particularly in the coronal region. Previous studies have reported that customized and CAD/CAM-fabricated post systems provide thinner and more uniform cement layers than prefabricated systems [16,17]. Similarly, digitally fabricated customized posts have been shown to improve adaptation by minimizing the mismatch between the post and root canal morphology [14]. The improved adaptation observed in the 3D-printed group in the present study may therefore be attributed to the direct digital acquisition of root canal morphology and the customized CAD workflow used during post-fabrication [18].
The significantly greater cement thickness observed in the Splendor SAP group, especially in the coronal region, suggests incomplete adaptation to the canal walls despite the sleeve-supported design of the system [19]. Previous studies have reported that increased cement thickness may adversely affect interfacial integrity by increasing polymerization shrinkage stress and void formation within the resin cement layer [20]. Furthermore, D’Arcangelo et al. suggested that excessive cement thickness may compromise post retention and adhesive stability [21]. In the present study, the coronal cement thickness values observed in the Splendor SAP group approached the upper limits of the clinically recommended cement thickness range.
Regarding gap formation, the 3D-printed post group demonstrated the lowest frequency of interfacial gaps, whereas the GC everStick and Splendor SAP groups exhibited significantly higher gap frequencies. In all groups, gap formation was predominantly observed in the coronal region, which may be associated with increased cement thickness and reduced post-adaptation in wider canal areas. Previous studies have shown that increased cement volume may generate higher polymerization shrinkage stress, particularly in high C-factor environments such as root canals, thereby increasing the risk of interfacial debonding and gap formation [22,23]. Similarly, Rocha et al. reported that increased void formation within the cement layer negatively affects interfacial integrity and adhesive stability [16].
The reduced gap formation observed in the 3D-printed group supports previous findings suggesting that customized post systems may improve internal adaptation by reducing cement volume and promoting a more homogeneous interface [17,24]. Additionally, studies evaluating direct digital workflows have demonstrated that digital acquisition of root canal morphology may reduce distortion and improve adaptation compared with indirect impression techniques [25]. In the present study, the direct digital scanning approach may have contributed to the lower gap frequency and improved adaptation observed in the customized 3D-printed group.
Despite demonstrating superior adaptation and reduced gap formation, the 3D-printed posts exhibited the lowest push-out bond strength values. In contrast, the fiber-based systems, particularly the 3M RelyX and GC everStick groups, showed higher bond strength values, especially in the coronal region. Previous studies have reported that fiber-reinforced post systems may provide improved adhesion due to their elastic modulus being closer to dentin and their favorable interaction with adhesive resin cements [26,27]. Furthermore, individualized fiber systems such as GC everStick may combine anatomical adaptation with improved micromechanical and chemical bonding capacity.
The lower bond strength values observed in the 3D-printed group are directly corroborated by our failure mode analysis (Table 3), which revealed a noticeable distribution of cohesive fractures within the printed post material (20%) and mixed-type fractures (6.6%), whereas the fiber-based conventional systems failed exclusively via the adhesive route (100% for 3M RelyX and Splendor SAP). These findings can be associated with the highly cross-linked polymeric structure of the printed resin material. Previous studies have suggested that CAD/CAM and additively manufactured resin materials contain fewer reactive monomers on their surfaces, thereby limiting chemical interaction with resin cements. [24]. The empirical finding that cohesive failures occurred predominantly in the apical regions of the 3D-printed posts suggests that when the structural volume of this printable hybrid composite resin is significantly reduced, the internal cohesive strength of the material becomes the limiting factor rather than the adhesive interface alone. Furthermore, because no additional surface treatment procedures, such as airborne-particle abrasion or silanization, were applied to the 3D-printed posts in this study, the chemical bond potential remained unoptimized. However, to avoid an uncontrolled layer thickness that might interfere with the high-precision fit of the digital custom post, a standalone silane application was omitted; instead, a universal adhesive containing integrated silane (Scotchbond Universal Plus) was strategically preferred to chemically optimize the interface without altering dimensional accuracy. Previous literature has demonstrated that surface modifications may significantly improve the bond strength of resin-based materials by creating reactive sites, which could mitigate the high rate of non-adhesive failures observed in customized digital configurations [28,29].
Correlation analysis demonstrated a significant negative relationship between cement thickness and push-out bond strength only in the 3D-printed post group (rho = −0.614, p = 0.015). This unique finding can be attributed to the structural uniformity and low-volume standardization of the cement layer achieved through the customized CAD/CAM workflow. In conventional prefabricated post configurations, the cement layer is inherently highly variable, bulky, and irregular, causing polymerization shrinkage stresses, porosities, and volumetric defects to distribute unpredictably; this severe data scattering masks any direct linear relationship between thickness and retention. Conversely, because the customized 3D-printed configurations maintained an exceptionally thin and homogeneous cement matrix across all specimens, the confounding variables of excessive cement volume were eliminated. Within this highly controlled micro-environment, any subtle, micron-level increase in cement thickness, especially toward the structurally restricted apical thirds, where cohesive fractures within the printed material became the limiting factor, directly and linearly compromised the post’s resistance to displacement [30,31]. However, the present results also demonstrated that improved geometric adaptation alone does not necessarily result in superior absolute bond strength values. Although the 3D-printed group exhibited the thinnest cement layer and lowest gap frequency, its native bond strength values remained lower than those of the fiber-based systems. This outcome highlights the multifactorial nature of adhesion within the root canal system, demonstrating that optimal performance depends not only on macro-geometric fit but also heavily on material chemistry, surface reactivity, and adhesive dynamics [24,32].
From a clinical perspective, the findings of the present study suggest that customized digital post systems may provide important advantages regarding internal adaptation and interfacial homogeneity. Reduced cement thickness and lower gap formation may contribute to improved interface stability and potentially reduce the risk of microleakage. However, the lower bond strength values observed in the 3D-printed group indicate that additional optimization of material composition and surface treatment protocols may be necessary before widespread clinical implementation. Fiber-based systems, particularly anatomically adaptable systems such as GC everStick, may currently offer a more balanced combination of adaptation and adhesion performance.
This pilot study has several pioneering trials and limitations, including biological parameters, materials, and methodology during the examination of the use of 3D-printed dental materials in potential intra-canal post applications after root canal treatment, which is a novel potential field given the increasing importance of these materials today. First of all, the investigation was performed under in vitro conditions, which cannot fully reproduce the complex thermal, mechanical, and biological dynamics of the oral environment. Second, no artificial thermal cycling, dynamic mechanical loading, or prolonged storage conditions were incorporated into this investigation. This omission was based on a specific clinical rationale, which is that the baseline study utilized only the root structures without constructing post-and-core systems or coronal restorations over the specimens. Anatomical crowns are the primary sites directly exposed to intraoral thermal changes and masticatory forces, whereas the root complex is naturally protected within the periodontal and alveolar tissues, making the isolated aging response of the luting cement highly unpredictable in an uncovered root setup. Subjecting bare roots to direct aging without a coronal shield would fail to simulate true clinical conditions accurately; thus, evaluating diverse core/crown designs under complex aging protocols remains the subject of a future investigation.
Limitations in the materials and methodological parameters begin with the micro-CT analysis, which was performed on a limited sample size per group, and only one printable resin material and one specific cementation protocol were evaluated, which are the minimal required conditions to perform this study. Furthermore, unlike the other standardized materials evaluated, the application success of a system like everStick is directly dependent on the operator’s clinical skill and is highly sensitive to environmental factors, timing, and specific root canal morphology. Consequently, increasing the sample size for such operator-dependent techniques inherently leads to larger standard deviations, which can critically affect the reproducibility of the results. For these reasons, the sample size was kept at five per group to minimize operator-induced variability, which itself represents an experimental limitation. Third, obtaining intraoral scans of the post space using an optical scanner (TRIOS 5) immediately after preparation possesses inherent limitations due to the deep, narrow, and potentially moist nature of the root canal environment. In the present study, a direct validation of the accuracy and trueness of the digital impressions against the micro-CT gold standard was not performed prior to fabrication. Although our final micro-CT adaptation data indirectly suggest that the scan quality was clinically sufficient to yield superior fit, the lack of direct geometric scanning validation represents a technological limitation. Additionally, only one printable resin material and one specific cementation protocol were evaluated; therefore, the present findings should be interpreted as specific to the investigated experimental conditions.
Within the limitations of the present study, the null hypotheses were partially rejected. Significant differences were observed among the evaluated post systems regarding cement thickness, gap formation, and push-out bond strength. Furthermore, a significant negative correlation between cement thickness and bond strength was identified in the 3D-printed post group. Although the customized 3D-printed posts demonstrated superior internal adaptation and reduced gap formation, fiber-based post systems exhibited superior adhesion performance. Future studies involving larger sample sizes, additional printing materials, and adhesive systems should investigate the effects of different adhesives, surface treatment protocols, aging procedures, and fiber-reinforced printable materials on the long-term performance of customized 3D-printed materials.

5. Conclusions

Within the limitations of this in vitro study, the following conclusions can be drawn:
(1)
Customized 3D-printed post systems exhibited superior internal adaptation with significantly lower cement thickness values across all root regions compared to conventional systems.
(2)
Regarding adhesion performance, conventional fiber-based systems demonstrated significantly higher push-out bond strength, with 3M RelyX achieving the highest mean values (up to 29.88 ± 13.551 MPa), whereas the 3D-printed post group yielded the lowest bond strength values (dropping to 19.29 ± 14.21 MPa).
(3)
Micro-CT analysis confirmed that gap formation was inversely proportional to adaptation, where the 3D-printed group exhibited the lowest gap volume percentages (20.84% ± 0.12%), while conventional prefabricated configurations showed significantly larger adhesion area gaps, particularly in the apical thirds (reaching up to 64.52% ± 0.68%).
Consequently, while 3D-printed customized posts offer an excellent morphological fit to the root canal space, their adhesive interfaces, especially in structurally reduced dimensions, require further surface optimization to match the clinical performance of established fiber post protocols. These results show that, since the mechanical strength of 3D-printed resin posts varies depending on the filler content and the curing level of the organic matrix, they need significant improvement in their physical properties before being used in intra-canal post systems.

Author Contributions

Conceptualization, C.P. and I.I.; methodology, B.S., E.D. and C.P.; software, C.P.; validation, C.P. and I.I.; formal analysis, B.S.; investigation, B.S. and E.D.; resources, B.S. and E.D.; data curation, C.P.; writing—original draft preparation, B.S.; writing—review and editing, C.P. and I.I.; visualization, B.S.; supervision, C.P.; project administration, I.I.; funding acquisition, B.S. and C.P. All authors have read and agreed to the published version of the manuscript.

Funding

This research received no external funding.

Institutional Review Board Statement

The study was conducted in accordance with the Declaration of Helsinki and approved by the Ethics Committee of Ege University Medical Research Ethics Committee (21.08.2026, protocol code 25-8T/100).

Informed Consent Statement

Informed consent was obtained from all subjects involved in the study.

Data Availability Statement

The original contributions presented in the study are included in the article; further inquiries can be directed to the corresponding author.

Conflicts of Interest

All materials used in this study were commercially available products obtained through standard procurement channels. The authors declare that they have no financial, commercial, or personal relationships with the manufacturers of the products evaluated in this study.

References

  1. Huerta, J.H.A.; Maldonado, P.D.; García Palencia, P. Fracture resistance evaluation of crowns in endodontically treated anterior teeth restored with glass fiber posts: A literature review. Int. J. Appl. Dent. Sci. 2025, 11, 193–196. [Google Scholar] [CrossRef]
  2. Maroulakos, G.; He, J.; Nagy, W.W. The post-endodontic adhesive interface: Theoretical perspectives and potential flaws. J. Endod. 2018, 44, 363–371. [Google Scholar] [CrossRef] [PubMed]
  3. Kasuya, A.V.B.; Favarão, I.N.; Machado, A.C.; Rezende Spini, P.H.; Soares, P.V.; Fonseca, R.B. Development of a fiber-reinforced material for fiber posts: Evaluation of stress distribution, fracture load, and failure mode of restored roots. J. Prosthet. Dent. 2020, 123, 829–838. [Google Scholar] [CrossRef] [PubMed]
  4. Soares, A.P.; Bitter, K.; Lagrange, A.; Rack, A.; Shemesh, H.; Zaslansky, P. Gaps at the interface between dentine and self-adhesive resin cement in post-endodontic restorations quantified in 3D by phase contrast-enhanced micro-CT. Int. Endod. J. 2020, 53, 392–402. [Google Scholar] [PubMed]
  5. Almualm, A.; Bin Husein, A.; Elsahn, N.A.; El-Damanhoury, H.M. Internal fit and bond strength of customised CAD/CAM 3D-printed and milled resin-based posts vs relined fibre posts. Int. Dent. J. 2026, 76, 109310. [Google Scholar] [CrossRef] [PubMed]
  6. Leandrin, T.; Fernández, E.; Lima, R.; Besegato, J.; Escalante-Otárola, W.; Kuga, M. Customized fiber post improves the bond strength and dentinal penetrability of resin cementation system to root dentin. Oper. Dent. 2022, 47, E22–E34. [Google Scholar] [CrossRef] [PubMed]
  7. Prado, N.A.S.; Ferreira, R.D.S.; Maurício, M.H.D.P.; Paciornik, S.; Miranda, M.S. Influence of the cement film thickness on the push-out bond strength of glass fiber posts cemented in human root canals. Int. J. Dent. 2016, 2016, 9319534. [Google Scholar] [CrossRef] [PubMed]
  8. Ribeiro, M.T.H.; Oliveira, G.; Oliveira, H.L.Q.; Mendoza, L.C.L.; Melo, C.; Silva Peres, T.; Soares, C.J. Survival of severely compromised endodontically treated teeth restored with or without a fiber glass post. J. Appl. Oral Sci. 2023, 31, e20230241. [Google Scholar] [CrossRef] [PubMed]
  9. Celik Oge, S.; Kuden, C.; Ekren, O. Evaluation of the mechanical properties of 3D-printed post and core systems. Int. J. Prosthodont. 2024, 37, S127–S131. [Google Scholar] [CrossRef]
  10. Anderson, J.; Wealleans, J.; Ray, J. Endodontic applications of 3D printing. Int. Endod. J. 2018, 51, 1005–1018. [Google Scholar] [CrossRef] [PubMed]
  11. Tonini, R.; Xhajanka, E.; Giovarruscio, M.; Foschi, F.; Boschi, G.; Atav-Ates, A.; Cicconetti, A.; Seracchiani, M.; Gambarini, G.; Testarelli, L.; et al. Print and try technique: 3D-printing of teeth with complex anatomy a novel endodontic approach. Appl. Sci. 2021, 11, 1511. [Google Scholar] [CrossRef]
  12. Alanazi, K.K.; Robaian Alqahtani, A.; Alshehri, A.M.; Alqahtani, A.A.; Almudahi, A.; Al-Mansour, O.A.; Al-Harbi, N.A.; Alqahtani, S.S.A.; Raffat Hussein, E.M.; Soliman, T.A. Adhesion of 3D-Printed Versus Milled Resin Posts to Composite Resin Core Build-Up Material: Influence of Surface Treatments. Polymers 2025, 17, 1711. [Google Scholar] [CrossRef] [PubMed]
  13. Gomes, G.M.; Rezende, E.C.; Gomes, O.M.; Gomes, J.C.; Loguercio, A.D.; Reis, A. Influence of the resin cement thickness on bond strength and gap formation of fiber posts bonded to root dentin. J. Adhes. Dent. 2014, 16, 71–78. [Google Scholar] [CrossRef] [PubMed]
  14. Alqarni, H.; AlHelal, A.A.; Jekki, R.; Kattadiyil, M.T.; Sayed, M.E.; Jain, S.; Vahdati, S.A.; Dehom, S. In Vitro Study Comparing Retention of Custom Post and Cores Fabricated Using Conventional, CAD/CAM Milling and 3D-Printing Techniques. Appl. Sci. 2022, 12, 11896. [Google Scholar] [CrossRef]
  15. Coniglio, I.; Magni, E.; Goracci, C.; Radovic, I.; Carvalho, C.A.; Grandini, S.; Ferrari, M. Post space cleaning using a new nickel titanium endodontic drill combined with different cleaning regimens. J. Endod. 2008, 34, 83–86. [Google Scholar] [CrossRef] [PubMed]
  16. Rocha, A.T.; Gonçalves, L.M.H.; Vasconcelos, A.J.D.C.; Matos Maia Filho, E.; Nunes Carvalho, C.; De Jesus Tavarez, R.R. Effect of anatomical customization of the fiber post on the bond strength of a self-adhesive resin cement. Int. J. Dent. 2017, 2017, 5010712. [Google Scholar] [CrossRef] [PubMed]
  17. Gama, M.; Balbinot, G.S.; Ferreira, G.C.; Mota, E.G.; Leitune, V.; Collares, F.M. CAD/CAM milled glass fiber posts: Adaptation and mechanical behavior in flared root canals. Oper. Dent. 2021, 46, 438–447. [Google Scholar] [CrossRef] [PubMed]
  18. Xiao, P.; Zheng, Z.; Zhang, Y.; Zeng, Y.; Yan, W. Accuracy and adaptation of one-piece endodontic crowns fabricated through 3D printing and milling. J. Prosthet. Dent. 2024, 132, 422–433. [Google Scholar] [CrossRef] [PubMed]
  19. Pinto, C.; França, F.; Basting, R.T.; Turssi, C.P.; Amaral, F. Evaluation of bond strength of three glass fiber post-systems cemented to large root canals. Oper. Dent. 2024, 49, 222–230. [Google Scholar] [CrossRef] [PubMed]
  20. Campaner, L.M.; Alves Pinto, A.B.; Demachkia, A.M.; Paes-Junior, T.J.d.A.; Pagani, C.; Borges, A.L.S. Influence of Cement Thickness on the Polymerization Shrinkage Stress of Adhesively Cemented Composite Inlays: Photoelastic and Finite Element Analysis. Oral 2021, 1, 168–180. [Google Scholar] [CrossRef]
  21. D’Arcangelo, C.; Cinelli, M.; De Angelis, F.; D’Amario, M. The effect of resin cement film thickness on the pullout strength of a fiber-reinforced post system. J. Prosthet. Dent. 2007, 98, 193–198. [Google Scholar] [CrossRef] [PubMed]
  22. Scotti, N.; Forniglia, A.; Bergantin, E.; Paolino, D.S.; Pasqualini, D.; Berutti, E. Fibre post adaptation and bond strength in oval canals. Int. Endod. J. 2014, 47, 366–372. [Google Scholar] [CrossRef] [PubMed]
  23. Huang, M.; Wang, B.; Zhang, K.; Yan, X.; Chen, Z.; Zhang, X. Comparative analysis of stress distribution in residual roots with different canal morphologies: Evaluating CAD/CAM glass fiber and other post-core materials. BMC Oral Health 2024, 24, 337. [Google Scholar] [CrossRef] [PubMed]
  24. Eid, R.Y.; Koken, S.; Baba, N.Z.; Ounsi, H.; Ferrari, M.; Salameh, Z. Effect of fabrication technique and thermal cycling on the bond strength of CAD/CAM milled custom fit anatomical post and cores: An in vitro study. J. Prosthodont. 2019, 28, 898–905. [Google Scholar] [CrossRef] [PubMed]
  25. Tsintsadze, N.; Juloski, J.; Carrabba, M.; Goracci, C.; Vichi, A.; Grandini, S.; Ferrari, M. Effects of scanning technique on in vitro performance of CAD/CAM-fabricated fiber posts. J. Oral Sci. 2018, 60, 262–268. [Google Scholar] [CrossRef] [PubMed]
  26. Kalkan, M.; Usumez, A.; Ozturk, A.N.; Belli, S.; Eskitascioglu, G. Bond strength between root dentin and three glass-fiber post systems. J. Prosthet. Dent. 2006, 96, 41–46. [Google Scholar] [CrossRef] [PubMed]
  27. Zaitter, S.; Sousa-Neto, M.D.; Roperto, R.C.; Silva-Sousa, Y.T.C.; El-Mowafy, O. Microtensile bond strength of glass fiber posts cemented with self-adhesive and self-etching resin cements. J. Adhes. Dent. 2011, 13, 55–59. [Google Scholar] [CrossRef] [PubMed]
  28. Machado, F.W.; Bossardi, M.; Ramos, T.S.; Valente, L.L.; Münchow, E.A.; Piva, E. Application of resin adhesive on the surface of a silanized glass fiber–reinforced post and its effect on the retention to root dentin. J. Endod. 2015, 41, 106–110. [Google Scholar] [CrossRef] [PubMed]
  29. Souza, J.C.M.; Fernandes, V.; Correia, A.; Miller, P.; Carvalho, O.; Silva, F.; Özcan, M.; Henriques, B. Surface modification of glass fiber-reinforced composite posts to enhance their bond strength to resin-matrix cements: An integrative review. Clin. Oral Investig. 2022, 26, 95–107. [Google Scholar] [CrossRef] [PubMed]
  30. Goracci, C.; Ferrari, M. Current perspectives on post systems: A literature review. Aust. Dent. J. 2011, 56, 77–83. [Google Scholar] [CrossRef] [PubMed]
  31. Kremeier, K.; Fasen, L.; Klaiber, B.; Hofmann, N. Influence of endodontic post type (glass fiber, quartz fiber or gold) and luting material on push-out bond strength to dentin in vitro. Dent. Mater. 2008, 24, 660–666. [Google Scholar] [CrossRef] [PubMed]
  32. Aydemir, M.; Bağlar, S. Contemporary classification of post-core systems. Turk. Klin. J. Dent. Sci. 2019, 25, 319–333. [Google Scholar] [CrossRef]
Figure 1. Schematic illustration of the experimental workflow. (A) preparation of the access cavity, (B) root canal treatment, (C) obturation of the canal with gutta-percha, (D) removal of gutta-percha from the canal using drills (except for the apex 1/3), (E) cementation of intracanal posts.
Applsci 16 07220 g001
Figure 2. Workflow for fabrication of the customized 3D-printed posts: (A) digital scanned impression, (B) CAD design, (C) slicing procedure with Bego CAM-creator, and (D) final printed 3D posts.
Applsci 16 07220 g002
Figure 3. Measurement of cement thickness on micro-CT images using ImageJ software.
Applsci 16 07220 g003
Figure 4. Representative images of apical, middle, and coronal sections from the 3D, 3M, GC everStick, and Splendor SAP groups were used for the push-out bond strength test.
Applsci 16 07220 g004
Figure 5. Comparison of mean cement thickness values among the evaluated post systems in the apical, middle, and coronal regions. No statistically significant difference were found between the same superscript lowercase letters.
Applsci 16 07220 g005
Figure 6. Comparison of gap frequency (%) among the evaluated post systems. The 3D-printed post group demonstrated the lowest gap frequency, whereas the GC everStick and Splendor SAP groups exhibited significantly higher values (* p < 0.05). Error bars represent standard deviation.
Applsci 16 07220 g006
Figure 7. Comparison of push-out bond strength values among the evaluated post systems in different root canal regions. * One sample (extreme) in 3M group (94.4 MPa) and ° two samples (slight) in Splendor SAP group (41.6 MPa & 42.3 MPa) presented as outliners.
Applsci 16 07220 g007
Figure 8. Representative stereomicroscopic images of the post–dentin interface after push-out bond strength testing.
Applsci 16 07220 g008
Table 1. Mean cement thickness values (µm) according to post systems and root canal regions.
GroupRegionnMinMaxMean ± SS
3DApical519.4368.0039.27 ± 14.47
Middle518.97127.7958.68 ± 31.31
Coronal514.58180.7366.25 ± 47.98
3MApical518.8959.7937.65 ± 11.30
Middle535.22198.5874.51 ± 44.16
Coronal529.56185.5083.40 ± 46.01
GCApical521.7383.5448.12 ± 15.76
Middle525.30243.5782.68 ± 56.79
Coronal515.55250.6399.85 ± 66.73
SAPApical522.9697.8059.52 ± 22.41
Middle543.46249.23123.32 ± 56.95
Coronal5116.63354.45219.76 ± 74.64
Table 2. Push-out bond strength values (MPa) according to post systems and root canal regions.
GroupRegionnMinMaxMean ± SS
3DApical55.1913.398.53 ± 3.56
Middle54.8219.139.97 ± 5.79
Coronal534.6251.1639.36 ± 7.53
3MApical510.3420.3913.43 ± 4.19
Middle521.8940.3529.7 ± 7.7
Coronal525.9094.4046.52 ± 26
GCApical511.0514.6412.56 ± 1.35
Middle512.3840.5825.12 ± 12.24
Coronal542.8653.6848.17 ± 4.64
SAPApical510.224.6117.98 ± 6.27
Middle59.227.1321 ± 7.33
Coronal528.3442.3334.35 ± 6.87
Table 3. Fracture classification after push-out strength tests.
GroupFracture Typep-Value
AdhesiveCohesiveMix
3D-Printed11 (73.3%)3 (20%)1 (6.6%)<0.001
3M RelyX15 (100%)00<0.001
GC everStick14 (93.3%)1 (6.6%)0<0.001
Splendor SAP15 (100%)00<0.001
p-Value0.1120.2720.624
Table 4. Correlation between cement thickness and push-out bond strength according to post systems.
GroupCorrelation Coefficient (Rho)Directionp-ValueSignificance
3D-Printed−0.614Negative0.015Significant
3M RelyX−0.043Negative0.879Not significant
GC everStick−0.307Negative0.265Not significant
Splendor SAP0.286Positive0.302Not significant
Disclaimer/Publisher’s Note: The statements, opinions and data contained in all publications are solely those of the individual author(s) and contributor(s) and not of MDPI and/or the editor(s). MDPI and/or the editor(s) disclaim responsibility for any injury to people or property resulting from any ideas, methods, instructions or products referred to in the content.