


Featured Application
The findings of this study are directly applicable to the revision of technical standards and industrial protocols for pneumatic leak testing of gas pipeline networks. Specifically, they provide a critical foundation for implementing viscosity-based correction factors when existing or new infrastructure, intended for the transport of low-viscosity alternative fuels (such as pure hydrogen or hydrogen blends), is tested using conventional gases like nitrogen or air.
Abstract
Current industrial standards for gas pipeline leak testing often assume inert testing gases are universally interchangeable, neglecting specific fluid dynamics. This study quantifies how testing gas properties affect integral pressure decay leak tests. Experimental measurements (5000 Pa initial pressure) were conducted on a PE100RC (polyethylene resistant to crack propagation) pipe assembly with artificial capillary defects (0.13 mm diameter) using five media: nitrogen, air, argon, carbon dioxide, and a propane−butane (PB) mixture. Results demonstrate that in the continuous viscous flow regime, leak rates depend strictly on the gas’s dynamic viscosity. For identical defects, PB (the lowest viscosity gas tested) increased the leak rate by up to 129% compared to standard nitrogen. This relationship is statistically validated by a strong negative Pearson correlation (r = −0.92). To facilitate industrial application, a preliminary mathematical correction procedure is proposed for safely extrapolating these trends to infrastructure intended for pure hydrogen operation. To prevent false-positive tightness certifications during the transition to low-viscosity alternative fuels like pure hydrogen, implementing a dynamic viscosity correction factor is essential.
1. Introduction
Leak testing represents a fundamental tool for the non-destructive evaluation of the integral integrity of pipe and pressure assemblies used in the energy, gas, and chemical industries. The requirement for the safe operation of these facilities is established in relevant technical standards, such as EN 1779 [1] or EN 13184 [2], which define leak detection methods and their execution conditions. The integral pressure decay leak test is among the most frequently applied methods, especially for testing polyethylene objects, where defect localization is not required, but rather the determination of the overall integral leak rate of the system.
Current European and national regulations (e.g., EN 12327 [3] and the Slovak technical standard TPP 704 01 [4]) define test pressures, stabilization times, and acceptance criteria for leak tests; however, the type of testing medium is often considered a secondary parameter, with standards explicitly allowing the use of air or inert gases (most commonly nitrogen). Polyethylene PE100RC is currently widely used in the manufacture of pipeline systems due to its enhanced resistance to Slow Crack Growth (SCG) and favourable mechanical properties.
However, the global shift towards decarbonization has accelerated the transition of existing natural gas (NG) infrastructure to transport alternative fuels, particularly pure hydrogen or hydrogen-blended natural gas [5,6,7]. This retrofitting and blending introduce significant engineering challenges, affecting pipeline integrity, environmental greenhouse gas estimates, and overall safety [8,9]. A major concern is the sealing performance of joints and pipes under pure hydrogen, as hydrogen’s low density and high diffusivity pose unique leakage challenges [10]. Recent experimental studies on typical low-pressure gas infrastructure have compared hydrogen leakage rates to methane, revealing that leakage behaviors are highly dependent on the flow regimes, operational pressures, and the physical nature of the leaks [11,12]. Furthermore, the transition to hydrogen raises concerns regarding the material compatibility of polymers. Research into the permeability behavior of polyethylene pipelines confirms that hydrogen exhibits significantly different diffusion and permeation rates compared to natural gas [13,14,15]. While permeation through the intact pipe wall is a factor over long periods, the immediate safety risks arise from macroscopic leaks at joints, seals, and physical defects.
Recent studies on hydrogen-blended natural gas (HBNG) indicate that leakage assessment must also consider gas dispersion and the surrounding installation environment, not only permeation through polymer walls. For underground utility tunnels, Xu et al. [16] showed that increasing the hydrogen fraction can accelerate the dispersion of leaked HBNG and enlarge hazardous concentration zones under unfavourable ventilation and leakage conditions. For buried pipelines, Pan et al. [17] demonstrated that leak-hole characteristics, pipeline parameters and soil conditions significantly affect gas migration around the pipe. These findings are directly relevant to pressure decay testing because the measured pressure loss must be interpreted together with the expected operating medium, defect geometry and installation conditions; therefore, reliable leakage-rate identification methods for underground gas infrastructure, including data-driven approaches proposed by Jiang et al. [18], are increasingly important for HBNG networks.
From a physical perspective, gas flow through a leak is determined by its transport properties and flow regime, which can be described by the Knudsen number (Kn) [19]. At high Kn values (microleaks), the molecular flow regime prevails, where the gas leak rate is inversely proportional to the square root of its molar mass. This phenomenon explains the exceptionally high leak rates of light gases, such as hydrogen and helium. Research published by ASME (Bouzid and Aweimer) [20] and NIST (Tison) [21] confirms that differences in the flow of helium, nitrogen, methane, or air through microleaks and flange gaskets can be orders of magnitude apart, with the flow rate critically depending on the transition between molecular, slip, and viscous regimes. Gacek in his work [22] experimentally confirmed that testing measurement devices with nitrogen underestimates the actual leakage of hydrogen, which exhibits the highest leak rate among all investigated gases.
Conversely, for larger leaks (or at lower Knudsen numbers, Kn ≪ 0.01), the flow transitions into the continuous viscous regime. In this region, molar mass ceases to dominate, and the dynamic viscosity of the gas assumes a fundamental role, allowing the flow to be approximated by the Hagen−Poiseuille law [23,24,25]. While previous research has intensively focused on leaks in the molecular regime (microdefects) [20,21], the acoustic manifestations of leaks in underground gas pipelines [26], the diffusion and propagation of hydrogen and natural gas in soil [17,27], and the overall safety risk assessment of transitioning to a hydrogen infrastructure [8], there is a lack of systematic experimental evaluation regarding the effect of the dynamic viscosity of various testing gases on the results of integral leak tests under continuous flow conditions.
This research gap is critical. If a pipeline network is tested using nitrogen (a relatively high-viscosity gas) as permitted by current standards but is intended to operate with low-viscosity hydrogen blends, the standard pneumatic test may dangerously underestimate the true operational leakage, leading to a false sense of security.
Therefore, the objective of this article is to quantify the effect of the physical properties of various testing gases (N2, air, Ar, CO2, and propane−butane), with an emphasis on dynamic viscosity, on the determined leak rate of an experimental PE100RC polyethylene assembly equipped with artificial defects of known geometry. Although pure hydrogen (H2) represents the primary industrial motivation for this study due to the impending gas infrastructure transition, its direct physical testing in a conventional laboratory environment introduces severe safety constraints and explosion hazards. To overcome these experimental limitations while rigorously addressing the underlying fluid dynamics, this study utilizes a propane−butane mixture as a safe, low-viscosity analogue to simulate and isolate the flow behavior characteristic of low-viscosity media such as hydrogen. By validating the pressure decay methodology and the Hagen−Poiseuille relationship across this controlled viscosity range, the findings provide a foundational baseline that can be theoretically extrapolated to predict hydrogen leakage behavior without compromising laboratory safety.
2. Materials and Methods
2.1. Experimental Design and Methodological Framework
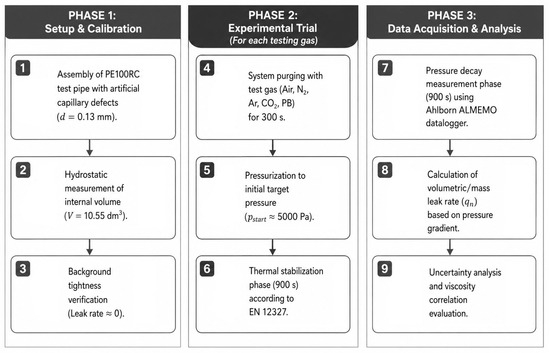
To systematically evaluate the effect of gas viscosity on leak rates, this study employs an experimental framework based on the integral pressure decay method, governed by the principles of the Hagen−Poiseuille law for continuous viscous flow. The comprehensive methodology is designed to isolate the fluid dynamic behavior of five distinct testing media (Nitrogen, Air, Argon, Carbon Dioxide, and a Propane−Butane mixture) under identical geometric and thermodynamic boundary conditions. The proposed research methodology is structured into three primary phases:
- Preparation and Calibration: Construction of the PE100RC reference assembly, precise hydrostatic determination of its internal volume, and verification of the system’s background tightness.
- Experimental Trial Execution: Purging the system with the selected test gas to ensure atmospheric purity, pressurization to the target level of 5000 Pa, and a strict thermal stabilization phase to eliminate adiabatic temperature variations.
- Data Acquisition and Analysis: Continuous recording of the pressure gradient over the measurement period, mathematical evaluation of the integral leak rate (qn), and the propagation of measurement uncertainties.
To ensure maximum repeatability and to clearly define the step-by-step procedures carried out during the trials, the entire experimental workflow is visualized in the methodological flowchart presented in Figure 1.
Figure 1.
Methodological flowchart of the experimental leak testing procedure.
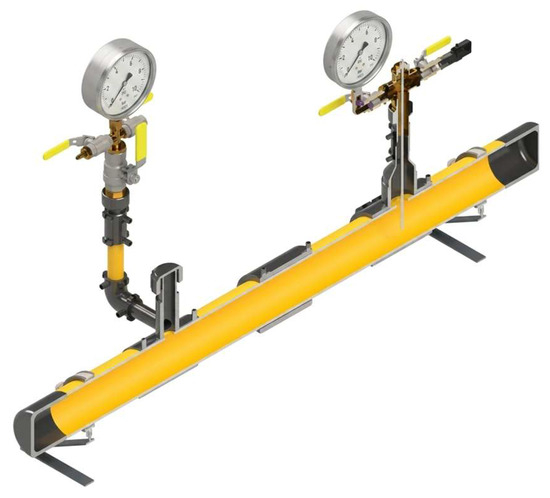
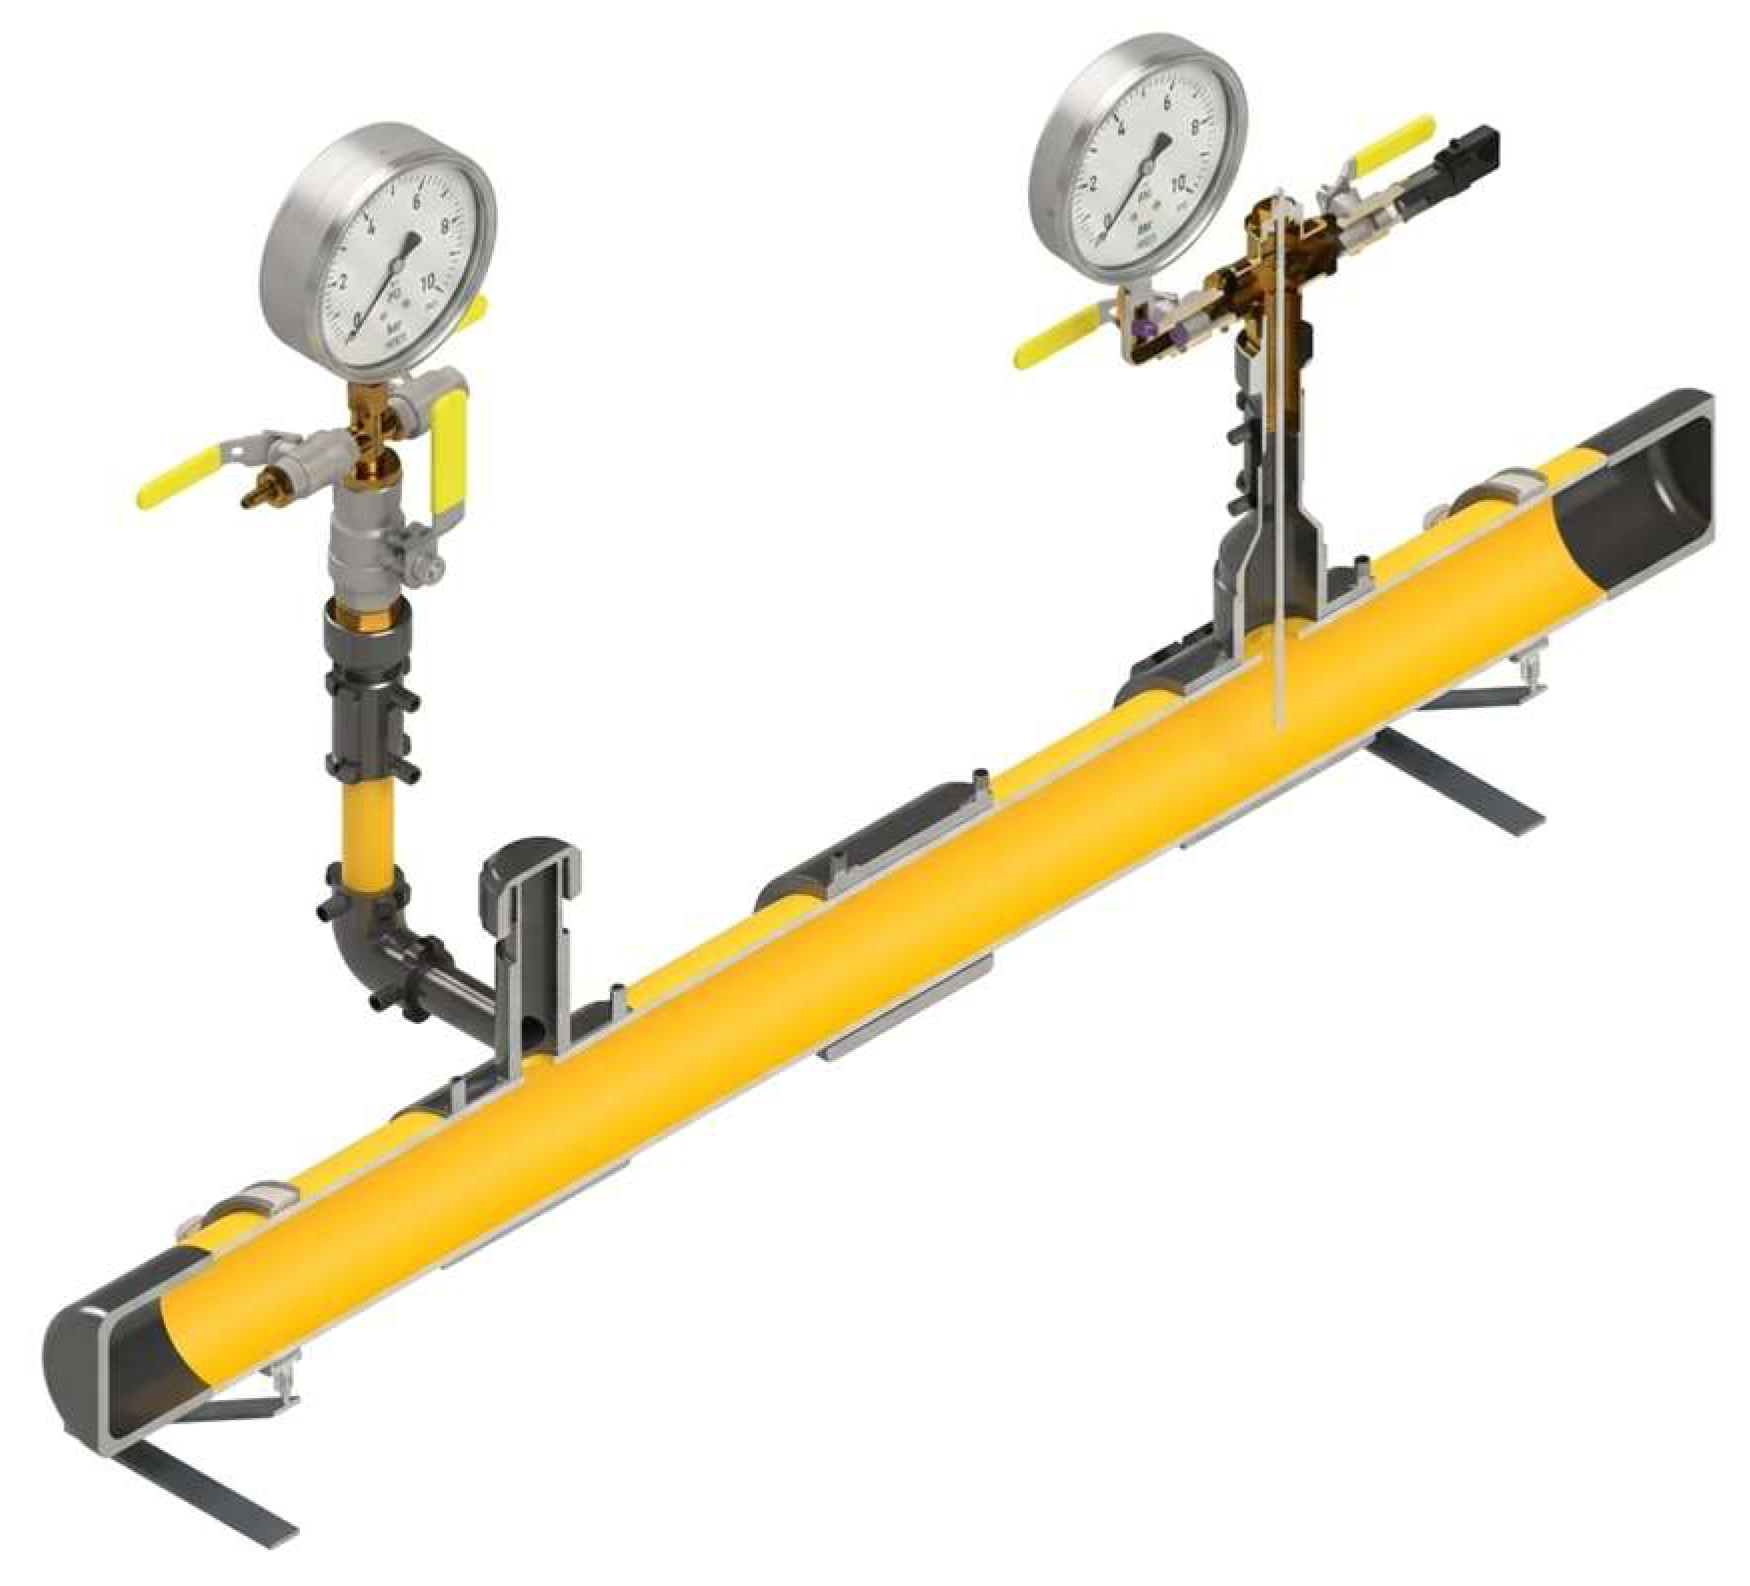
Construction of the PE100RC reference assembly, precise hydrostatic determination of its internal volume, and verification of the system’s background tightness. Experimental measurements were performed on a pipe assembly made of PE100RC material. The main pipe of the assembly had a nominal outer diameter D = 110 mm with a wall thickness t = 6.6 mm (corresponding to the SDR 17 dimension ratio). The assembly was constructed using a combination of two standard plastic welding technologies: electrofusion welding using electrofusion fittings and butt fusion welding. The ends of the assembly were closed with PE end caps. Figure 2 shows a longitudinal cross-section of the experimental assembly model for the leak test.
Figure 2.
Longitudinal cross-section of the experimental assembly model for the leak test.
To accurately determine the integral leak rate (qn), it was essential to precisely establish the internal geometric volume of the test object (VSO). The volume was verified using three independent methodologies: analytical calculation based on the 3D CAD model, the static gas expansion method using a calibrated reference vessel and measuring the mass of water required to completely flood the assembly. Given the minimal variance in results among these methods (up to 1%), the value determined by hydrostatic weighing was adopted as the reference VSO = 10.55 dm3 = 0.01055 m3.
After volume verification, the assembly was thoroughly dried with a stream of warm, filtered air to eliminate the presence of residual moisture, which could affect pressure-decay response. The first leak-test measurement was performed one week after completion of the hydrostatic volume determination and subsequent drying procedure. During this interval, the assembly remained open to the atmosphere, allowing evaporation of residual moisture before the experimental leak-testing campaign.
To simulate real leaks with precisely defined geometry, calibrated PE capillaries with a constant internal diameter d = 0.13 mm were used. For the purpose of assessing the effect of linear pressure losses, two types of artificial defects were prepared:
- Artificial defect No. 1: capillary with geometry Ø 0.13 × 100 mm;
- Artificial defect No. 2: capillary with geometry Ø 0.13 × 20 mm.
Each capillary was fixed into a brass connecting component using a two-component epoxy adhesive with high chemical and pressure resistance. The component was connected to the experimental assembly via a threaded joint sealed with PTFE tape.
2.2. Legislative Framework and Testing Gases
The experiment parameters were designed to reflect the actual conditions of low-pressure gas networks in accordance with the European standard EN 12327 [3] and the national technical regulation TPP 704 01 [4] (Slovak Gas and Oil Association). According to these regulations, integral pneumatic leak tests are performed with dry air or an inert gas at a minimum test pressure of 5 kPa (5000 Pa), while the limit criterion for the immediate operability of the pipeline is defined by an hourly leak rate of up to 1 L·h−1. Converted to standard engineering units of integral leak rate, this represents a threshold of qn,criterion ≤ 0.044 Pa·m3·s−1.
A spectrum of five testing gases with different physical properties was selected for testing, supplemented by pure hydrogen (H2) as a theoretical reference for the final discussion. The physical properties of the testing gases used are listed in Table 1.
Table 1.
Physical properties of the tested gases.
2.3. Measurement Apparatus and Experimental Design Parameters
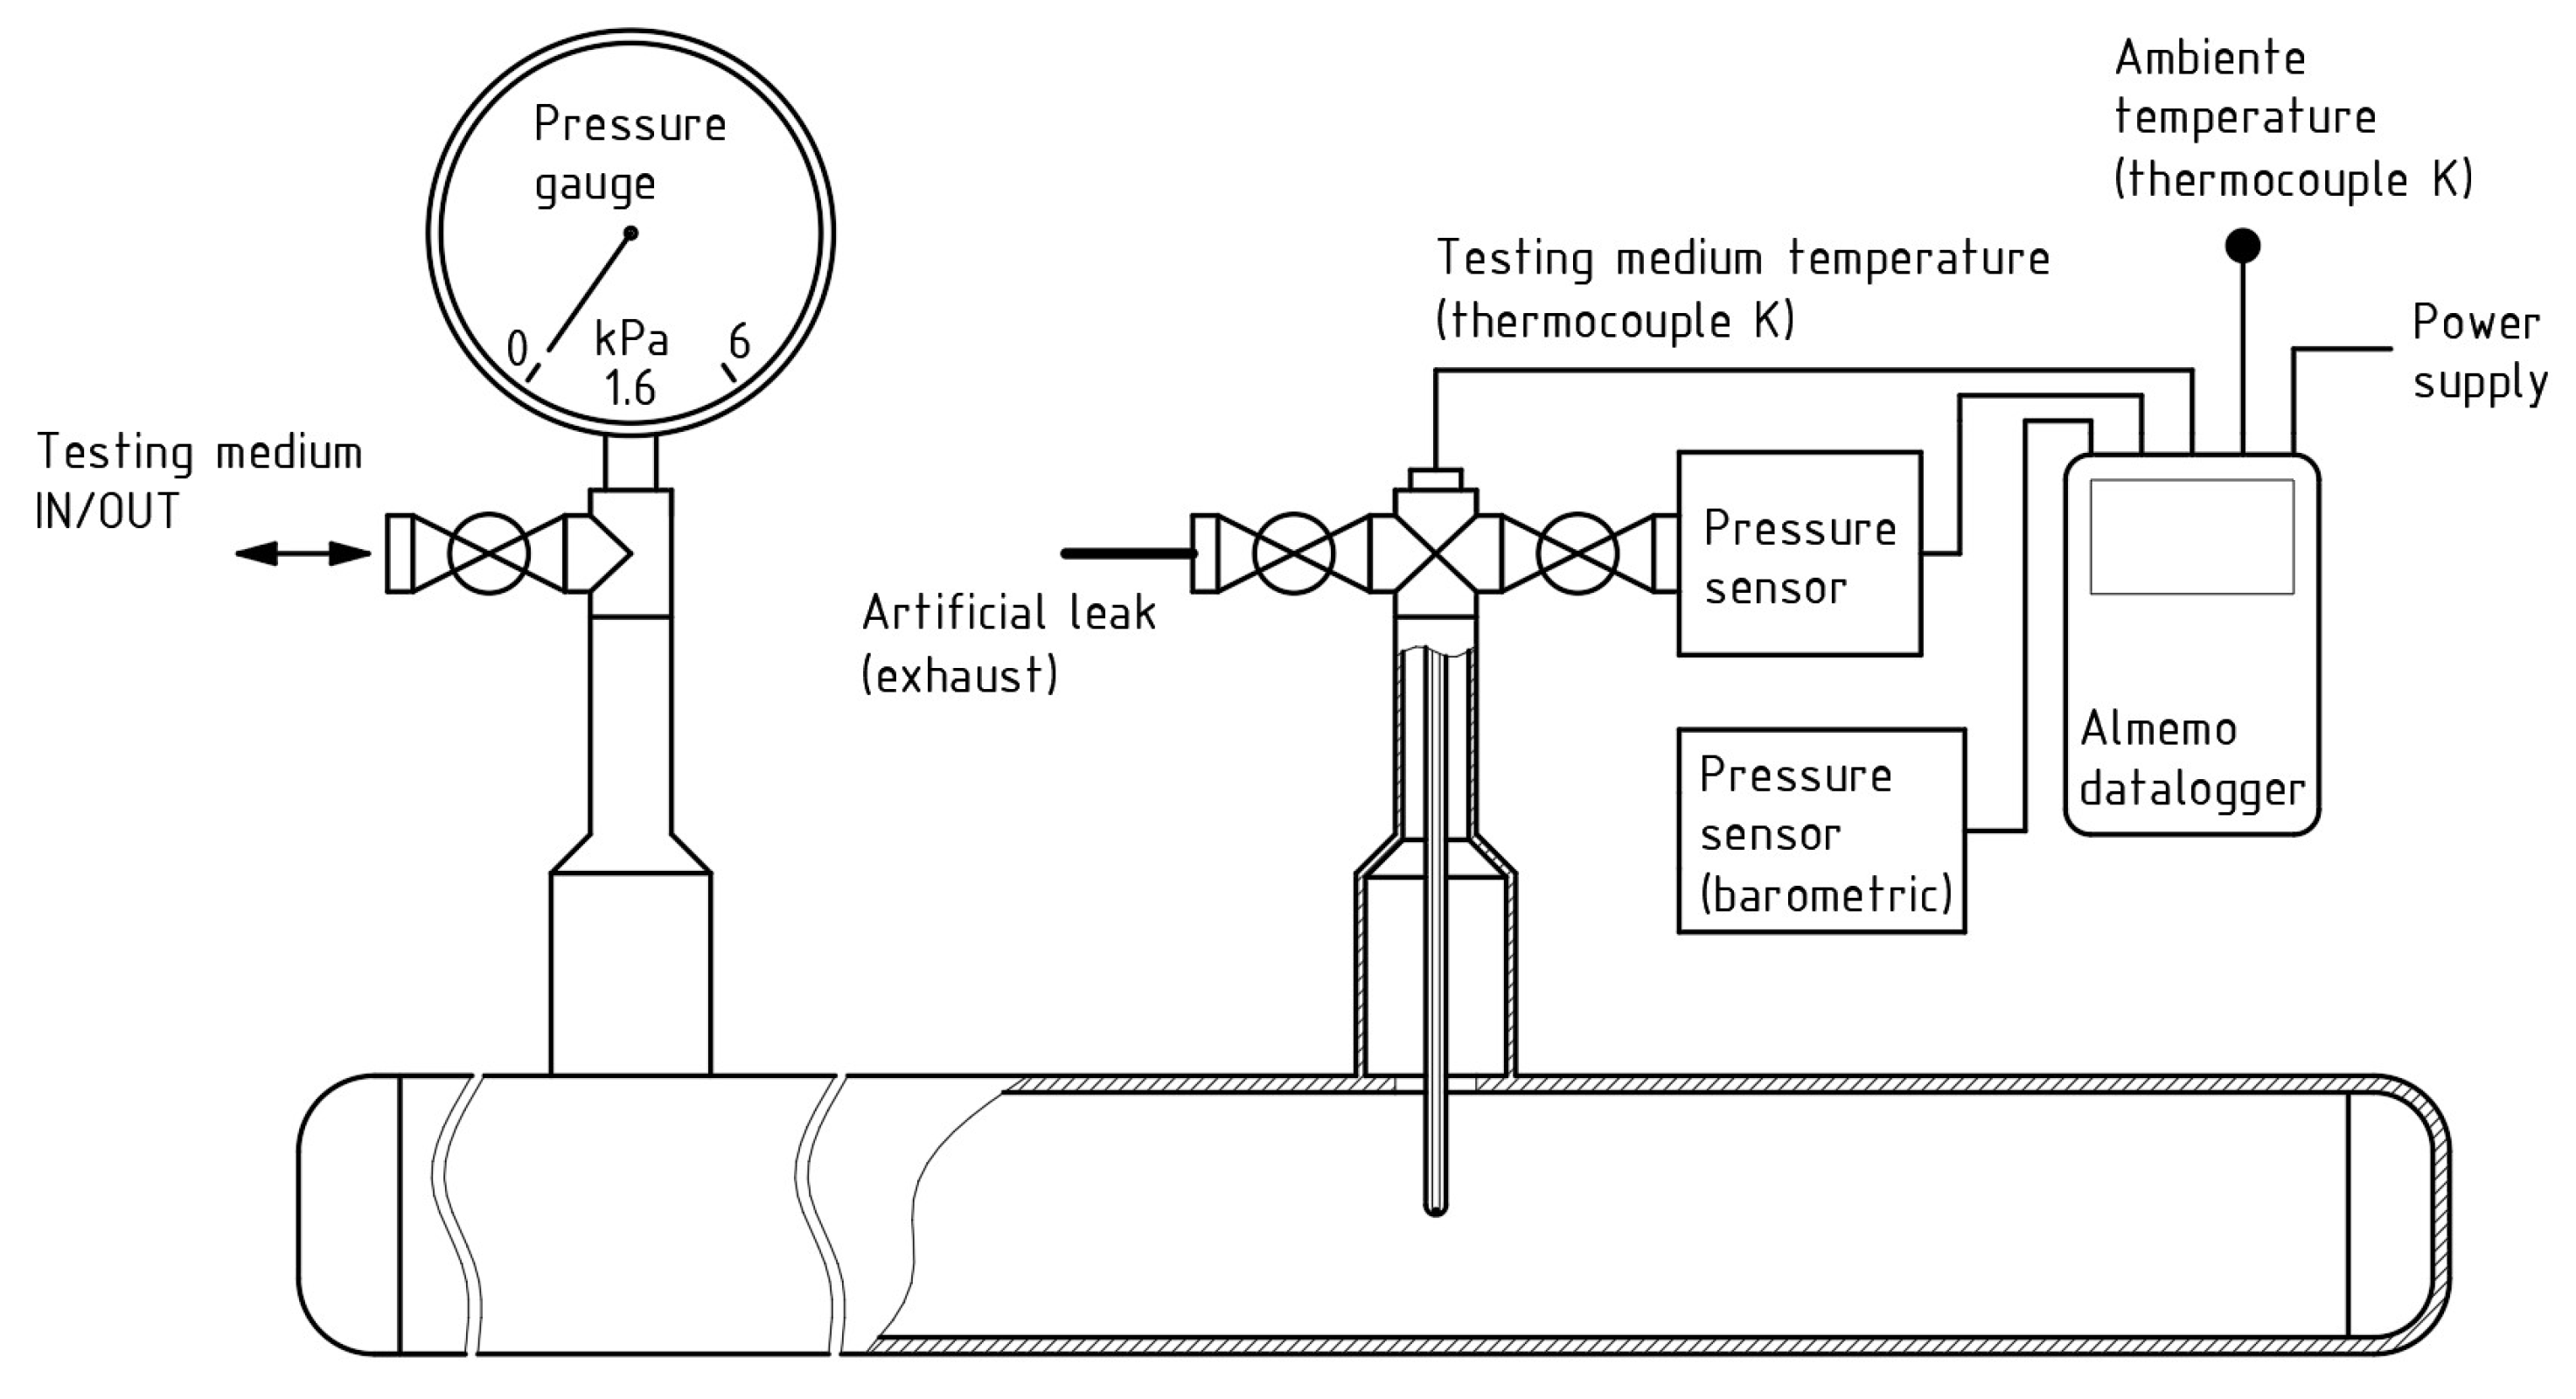
The measurement was controlled by an Ahlborn Almemo 2590-4AS (AHLBORN GmbH, Hildesheim, Germany) universal digital data acquisition system equipped with a 16-bit A/D converter with a sampling frequency of 10 Hz per channel. The following calibrated sensors were connected to the datalogger:
- digital piezoresistive relative (gauge) pressure sensor (pman) FDAD3302R (AHLBORN GmbH, Hildesheim, Germany) with a range of 0 to 300 kPa and a guaranteed accuracy of ±10 Pa;
- digital barometric (atmospheric) pressure sensor (pbar) FDAD12SA with an accuracy of ±250 Pa;
- K-type sheathed thermocouple placed in a hermetic stainless steel capillary filled with thermal paste, situated exactly in the geometric center of the PE pipe profile for measuring the testing gas temperature (T) with an accuracy of ±0.1 °C;
- identical K-type thermocouple for continuous monitoring of the ambient temperature (Tamb).
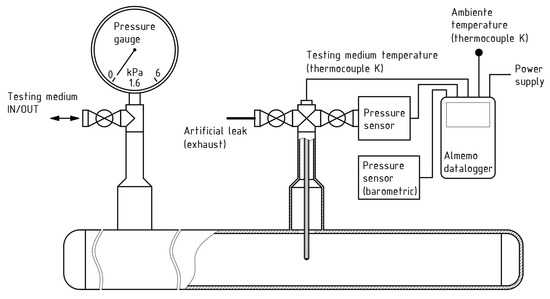
The schematic of the measurement apparatus is shown in Figure 3.
Figure 3.
Schematic of the measurement apparatus for the leak test.
To systematically isolate the fluid dynamic effects of different testing media, the experimental trial is structured as a controlled comparative case study. The boundaries, elements, and thermodynamic parameters of the experimental design are explicitly classified as follows:
- Controlled Constants (Boundary Conditions): The internal volume of the reference assembly (V = 10.55 dm3), target nominal charging pressure (p = 5000 Pa overpressure), the inner diameter of the artificial capillary defects (d = 0.13 mm), and the controlled laboratory ambient temperature (T = 22.0 ± 0.5 °C), and the ambient barometric pressure (pbar), which was treated as a constant baseline due to the short duration of the data acquisition phase (900 s) and the stable laboratory environment.
- Independent Variables (Input Elements): The type of testing gas medium (Nitrogen, Air, Argon, Carbon Dioxide, Propane−Butane mix) and the physical length of the capillary defect (L = 20 mm and L = 100 mm).
- Dependent Variables (Measured Outputs): The decaying pressure over time (p(t)), the internal gas temperature variation (ΔT), and the calculated integral leak rate (qn).
2.4. Experimental Trial Protocol
To ensure reproducibility and clarify what was proposed and how the experiment was conducted, the procedure for measuring the pressure drop was structured as a step-by-step workflow. The proposed approach involves comparing the integral response of the leakage rate for the same PE100RC test assembly under identical geometric and pressure conditions, with only the test gas being varied. This methodology simulates the conditions of the existing regulatory methodology for testing low-pressure gas pipelines. The testing procedure was divided into four time phases:
- System Purging Phase: With each change in testing gas, the assembly was first purged with compressed air for 120 s and subsequently purged with the selected test gas for 300 s with the outlet open. The test-gas purge was performed at a flow rate of 15 L·min−1, corresponding to a total purge volume of approximately 75 L. This represents approximately 7.1 times the internal volume of the 10.55 dm3 assembly and was therefore considered sufficient to reduce the residual concentration of the previous gas to a negligible level relative to the uncertainty of the pressure-decay measurement. For gases with a higher density than air, the exhaust outlet was oriented upward to support displacement of the lighter residual gas, whereas for nitrogen the outlet was oriented downward.
- Pressurization Phase: The assembly’s exhaust valves were sealed, and the system was slowly pressurized using the target gas until the internal pressure reached the target baseline of 5000 Pa.
- Thermal Stabilization Phase: In compliance with the functional requirements of the EN 12327 standard, the pressurized system was isolated for exactly 900 s without data recording. This phase allowed the heat generated by the adiabatic compression of the gas to dissipate through the PE100RC pipe walls, ensuring the gas temperature fully equilibrated with the ambient laboratory environment.
- Data Acquisition Phase: Upon completion of the stabilization period, the automated data logging on the ALMEMO system was initiated. It is worth noting that the actual initial pressure (pman,0) at the exact moment data logging commenced fluctuated slightly around the 5000 Pa nominal baseline due to the gas-specific thermal equilibration and adiabatic cooling rates experienced during the preceding stabilization phase. The pressure decay and temperature profiles were continuously recorded for a fixed measurement duration of 900 s. Once completed, the system was safely depressurized, and the protocol was restarted for the next gas-defect combination.
For each of the five testing gases, a test was first performed on the assembly without the presence of an artificial defect, thereby verifying the integral tightness of the experimental assembly itself (qn,assembly). Subsequently, measurements were conducted with the attached artificial defect No. 1 and then with artificial defect No. 2. The true leak rate value (qn) of the artificial defect itself was determined as the difference:
The basic equation for calculating the integral leak rate, taking into account barometric pressure compensation and real gas temperature compensation, is as follows:
where index 0 denotes the state at the beginning of the measurement phase (t = 0 s) and index e denotes the state at the end of the measurement phase (t = 900 s).
2.5. Measurement Uncertainty Analysis (Type B)
Given the nature of the experiment and the use of precision instrumentation, a Type B combined measurement uncertainty analysis was performed in accordance with the ISO/IEC Guide 98-3 (Guide to the Expression of Uncertainty in Measurement) [28] and applied scientific practice for evaluating measurement chains [29].
This approach was specifically chosen as independent replications of the trial runs that were omitted. Instead, the mathematical robustness of the primary input parameter—the pressure decay gradient (dp/dt)—was established by applying a linear regression analysis across a discrete dataset of 31 continuous pressure readings logged at 30 s intervals over the 900 s data acquisition window. The high statistical reliability of this gradient fit (0.9504 ≤ R2 ≤ 1.0) effectively suppressed Type A random noise. Consequently, the systematic instrumental uncertainty of the pressure transducer (±10 Pa), alongside the tolerances of the internal volume and temperature sensors, was rigorously propagated through the Type B mathematical model to establish the final expanded uncertainty boundaries for the integrated leak rate (qn).
The dominant influence on the uncertainty of the resulting quantity qn is attributed to the systematic instrumental uncertainties of the sensors, derived from their calibration certificates assuming a rectangular probability distribution (√3).
The standard uncertainties of the individual direct quantities were determined as follows:
- uncertainty of gauge pressure measurement: u(pman) ≈ 5.77 Pa.
- uncertainty of barometric pressure measurement: u(pbar) ≈ 144.34 Pa.
- uncertainty of gas temperature measurement: u(T) ≈ 0.058 K.
- uncertainty of internal volume determination: u(VSO) ≈ 6.09 × 10⁻⁵ m3.
The combined standard uncertainty of the integral leak rate uc(qn) was calculated by applying the law of propagation of uncertainty through the partial derivatives of the functional relationship:
The application of the law of propagation of uncertainty via partial derivatives (sensitivity coefficients) enabled the exact consolidation of diverse physical quantities into a total combined uncertainty. A detailed analytical check demonstrated that the influence of the instrumental uncertainties of barometric pressure and temperature is almost entirely eliminated in the resulting model. This phenomenon is a consequence of the differential nature of the measurement (difference in barometric pressures) and the ratiometric expression of temperatures in the correction factor, where the systematic errors of the sensors mathematically cancel each other out. The absolute dominant influence on the combined uncertainty uc(qn) is the accuracy of the gauge pressure sensor (±10 Pa), which defines the limit sensitivity threshold of the entire experimental apparatus. The calculation determined that the limit threshold uncertainty of the measurement chain represents:
3. Results
Within the experimental program, a total of 15 measurement cycles of the integral leak test were conducted. The tests were performed for five defined testing gases in three configurations of the pipe assembly: reference state without an artificial defect, artificial defect No. 1 (100 mm capillary), and artificial defect No. 2 (20 mm capillary).
3.1. Verification of the Tightness of the Reference Assembly
Prior to the actual measurement of the artificial defects, the tightness of the polyethylene assembly (welds and mechanical joints) was verified. At the same time, this measurement was used to verify the potential contribution of gas permeation through the 6.6 mm pipe wall. The recorded integral leak rate values (qn,assembly) for all testing gases ranged from 0.0000 to 0.0002 Pa·m3·s−1. Since these values do not exceed the limit threshold uncertainty of the measurement chain (uc(qn) ≈ ± 0.0002 Pa·m3·s−1), the system was declared absolutely tight in terms of the required accuracy. Nevertheless, to conservatively eliminate any potential systematic micro-bias from the subsequent artificial-defect trials, these background values were systematically subtracted from the total measured leak rates. These results are summarized in Table 2.
Table 2.
Measured integral leak rate values of the assembly without artificial defects.
3.2. Analysis of the Pressure Decay Profiles
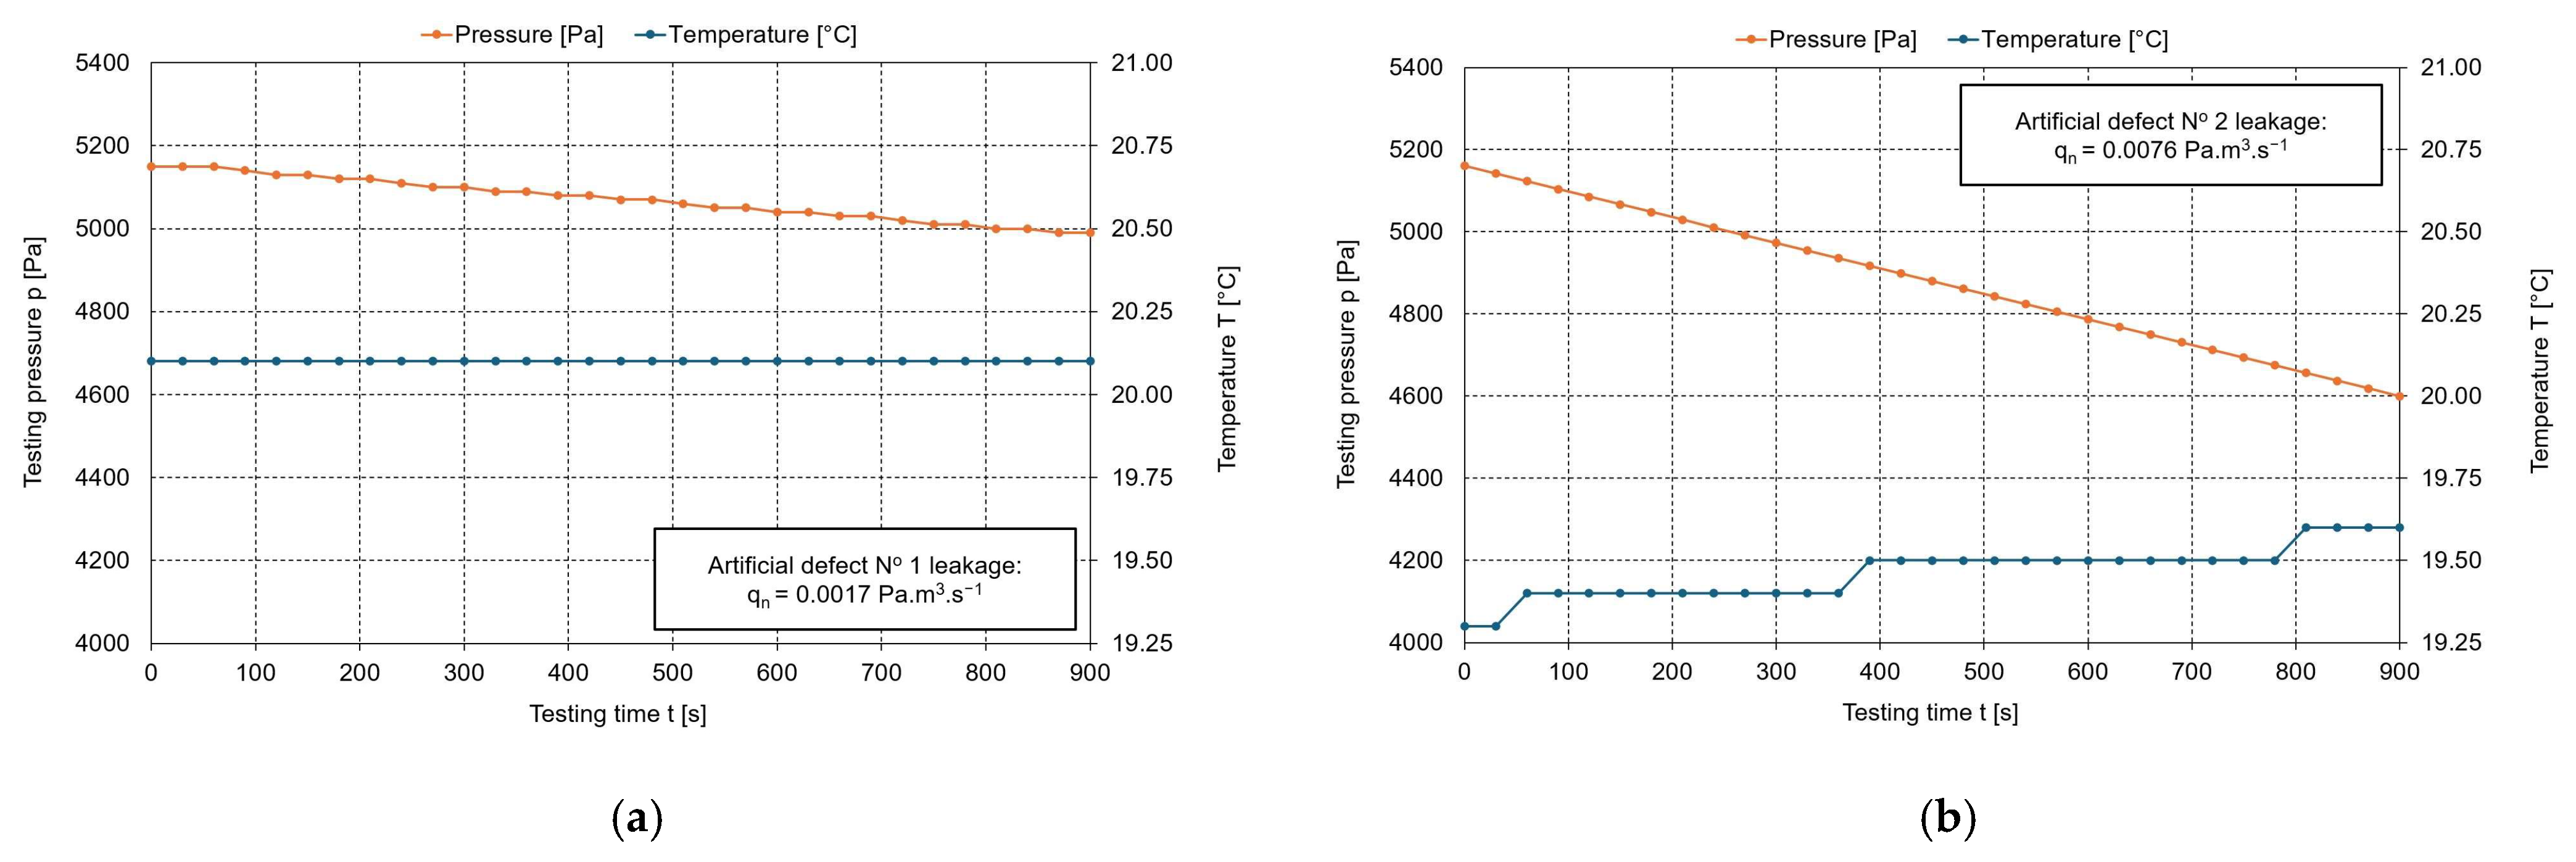
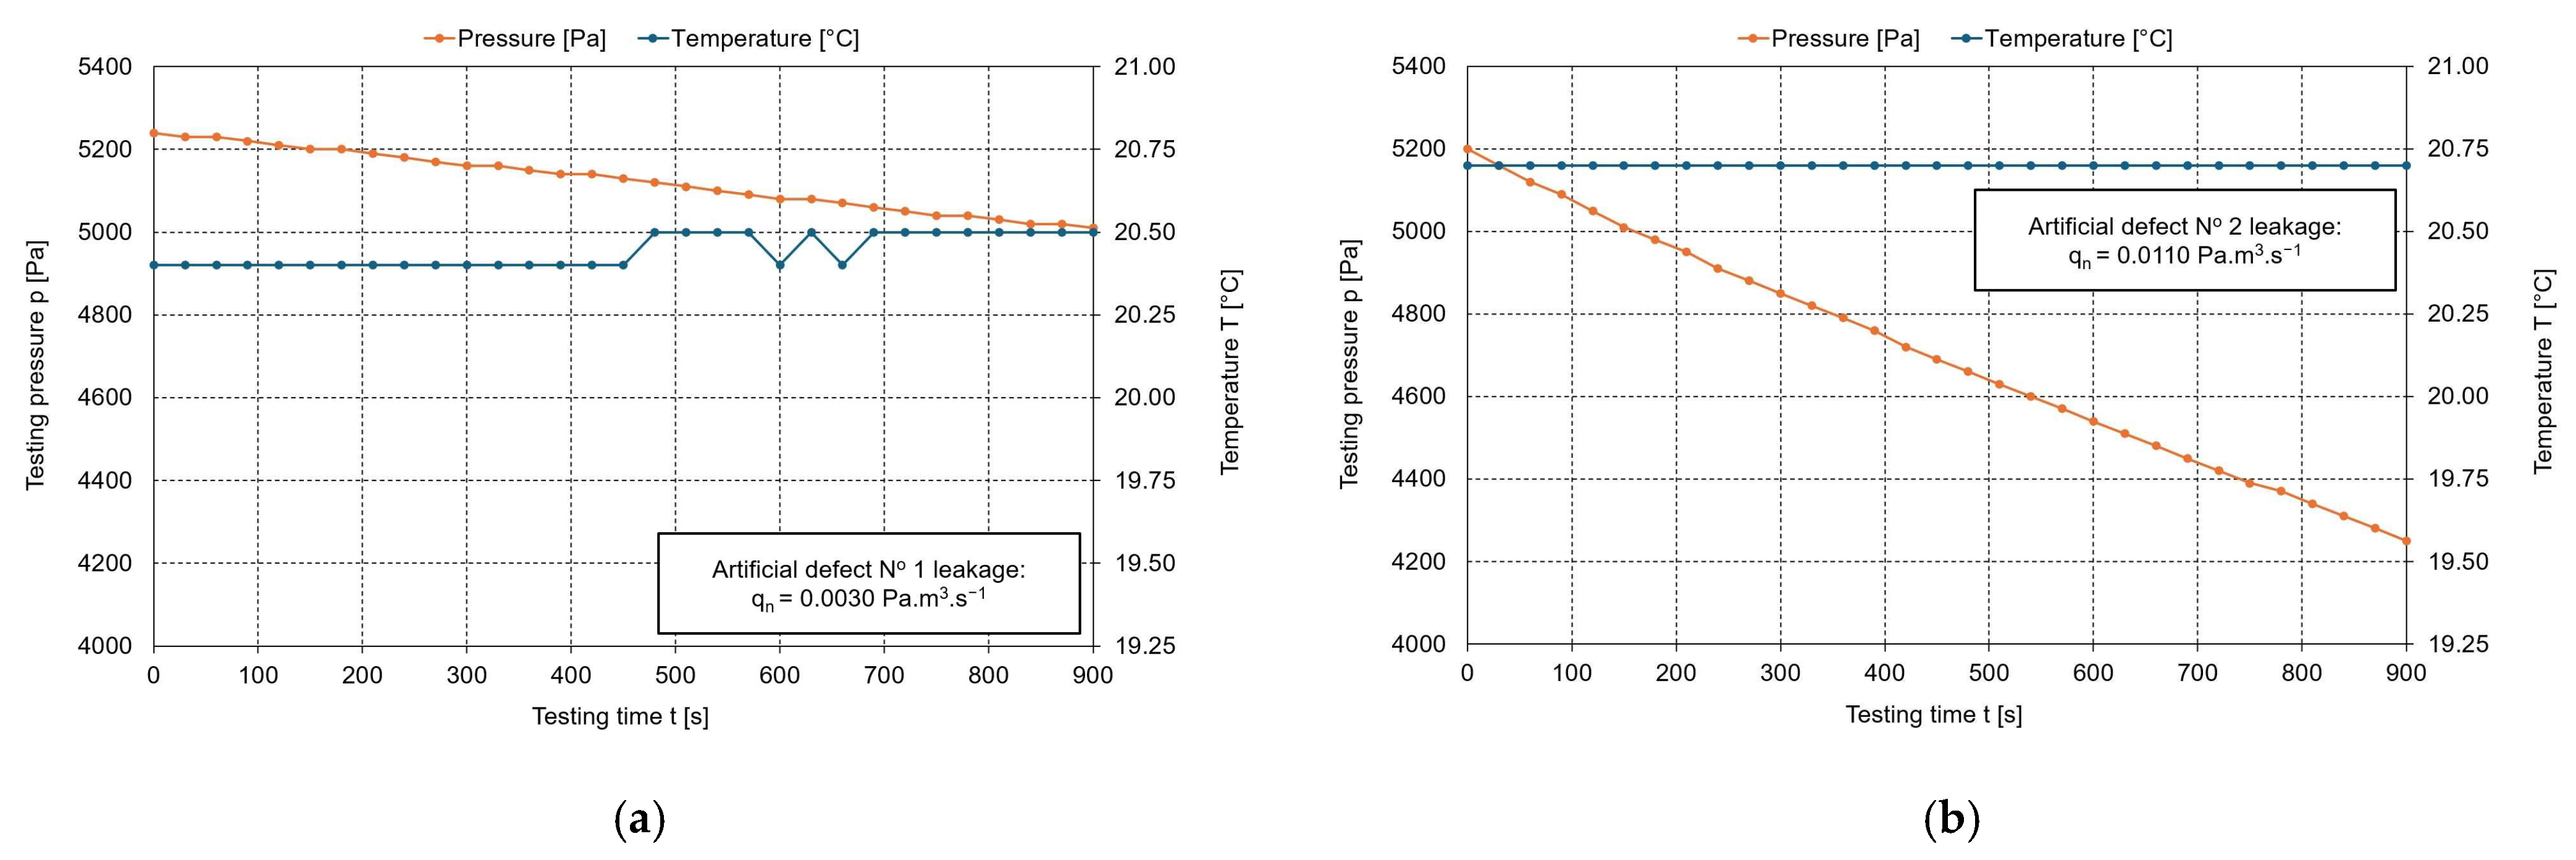
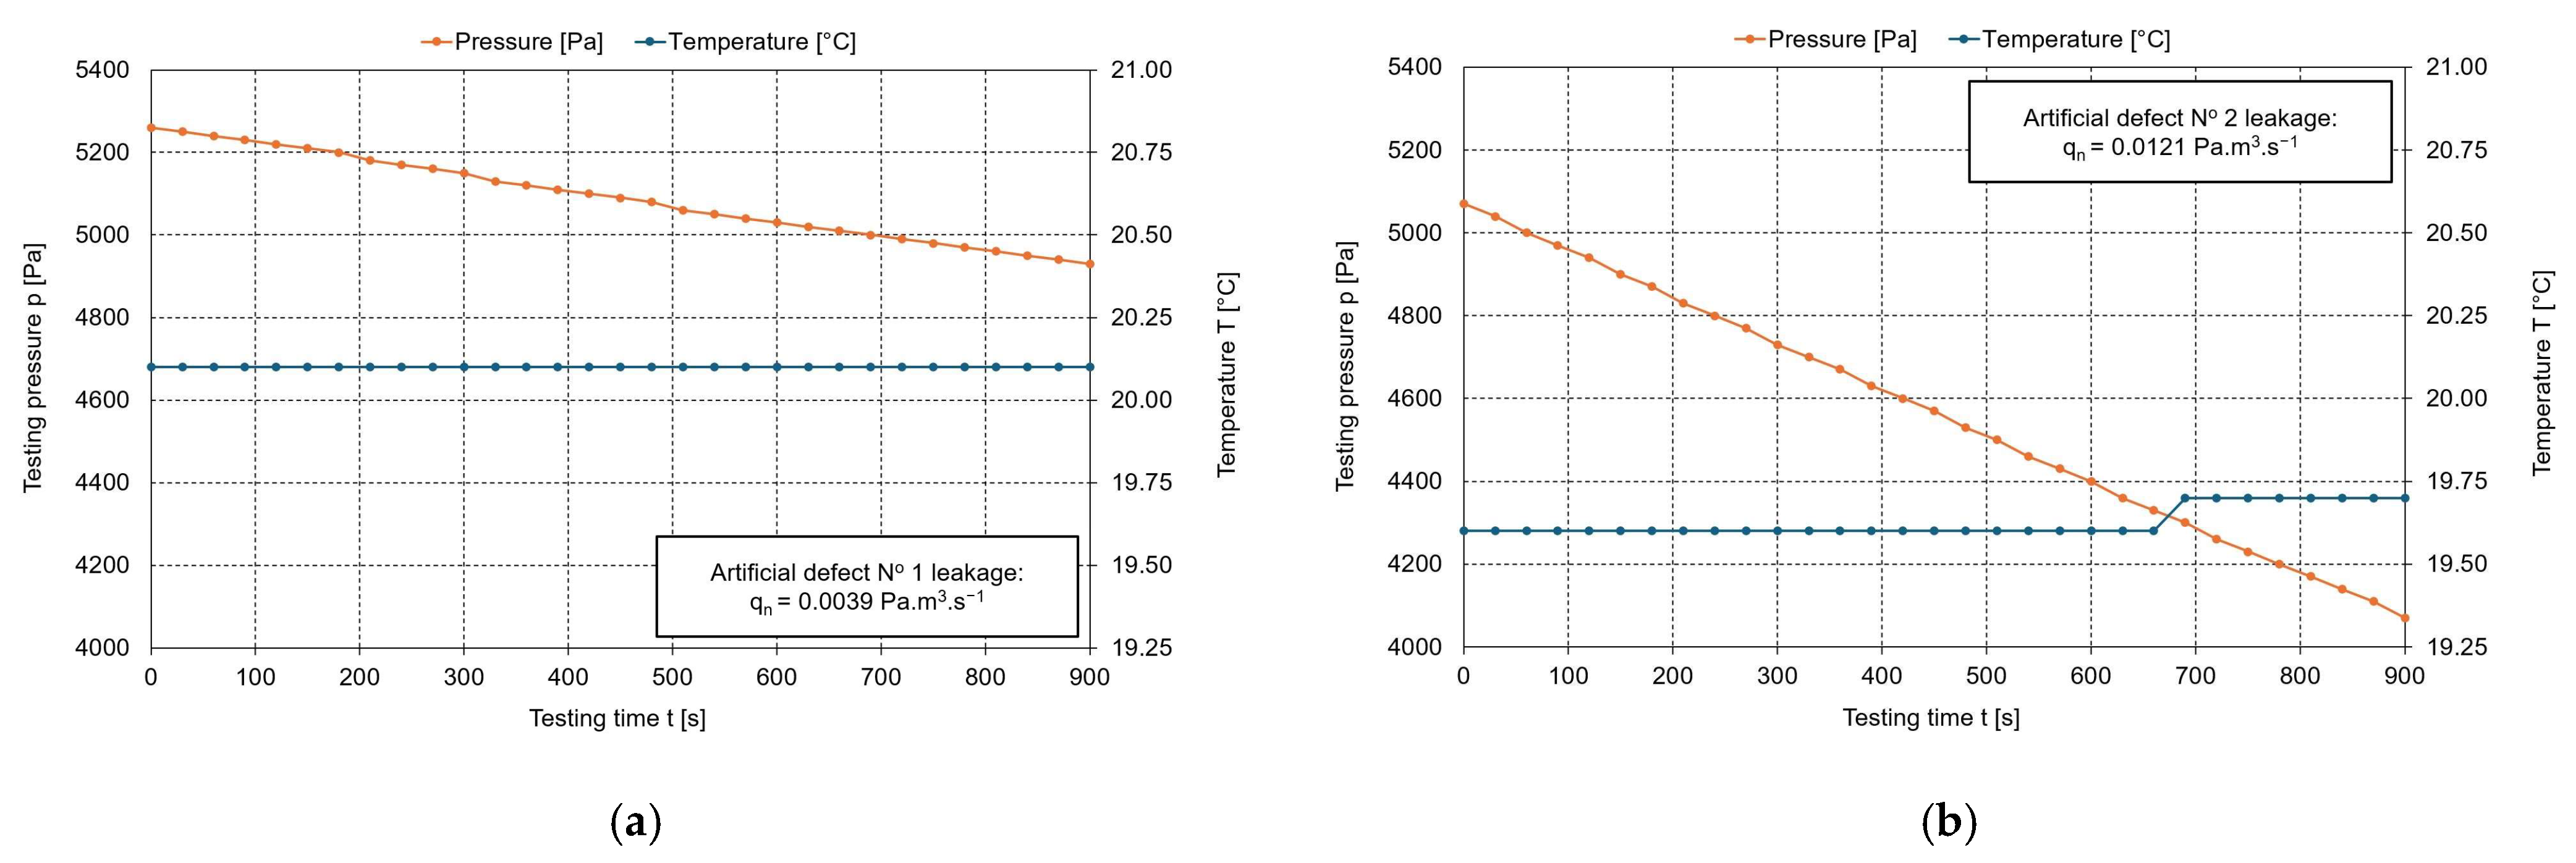
The complete profiles of the relative pressure drop (pman) and testing gas temperature (T) versus time (t = 900 s) for all five evaluated testing media are shown in Figure 4, Figure 5, Figure 6, Figure 7 and Figure 8. From these primary data, final integral leak rate values (qn) were calculated using exact temperature compensation and subtracting the assembly’s background leakage parameter (qn,assembly). The resulting values for all testing gases and defect geometries are summarized in Table 3.
Figure 4.
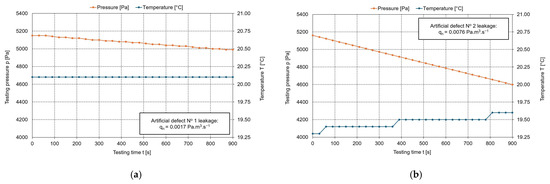
Dynamics of relative pressure drop and temperature over time for nitrogen (N2): (a) Artificial defect No. 1 (Ø 0.13 × 100 mm); (b) Artificial defect No. 2 (Ø 0.13 × 20 mm).
Figure 5.
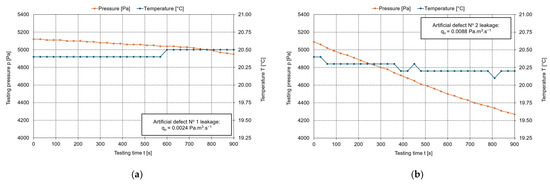
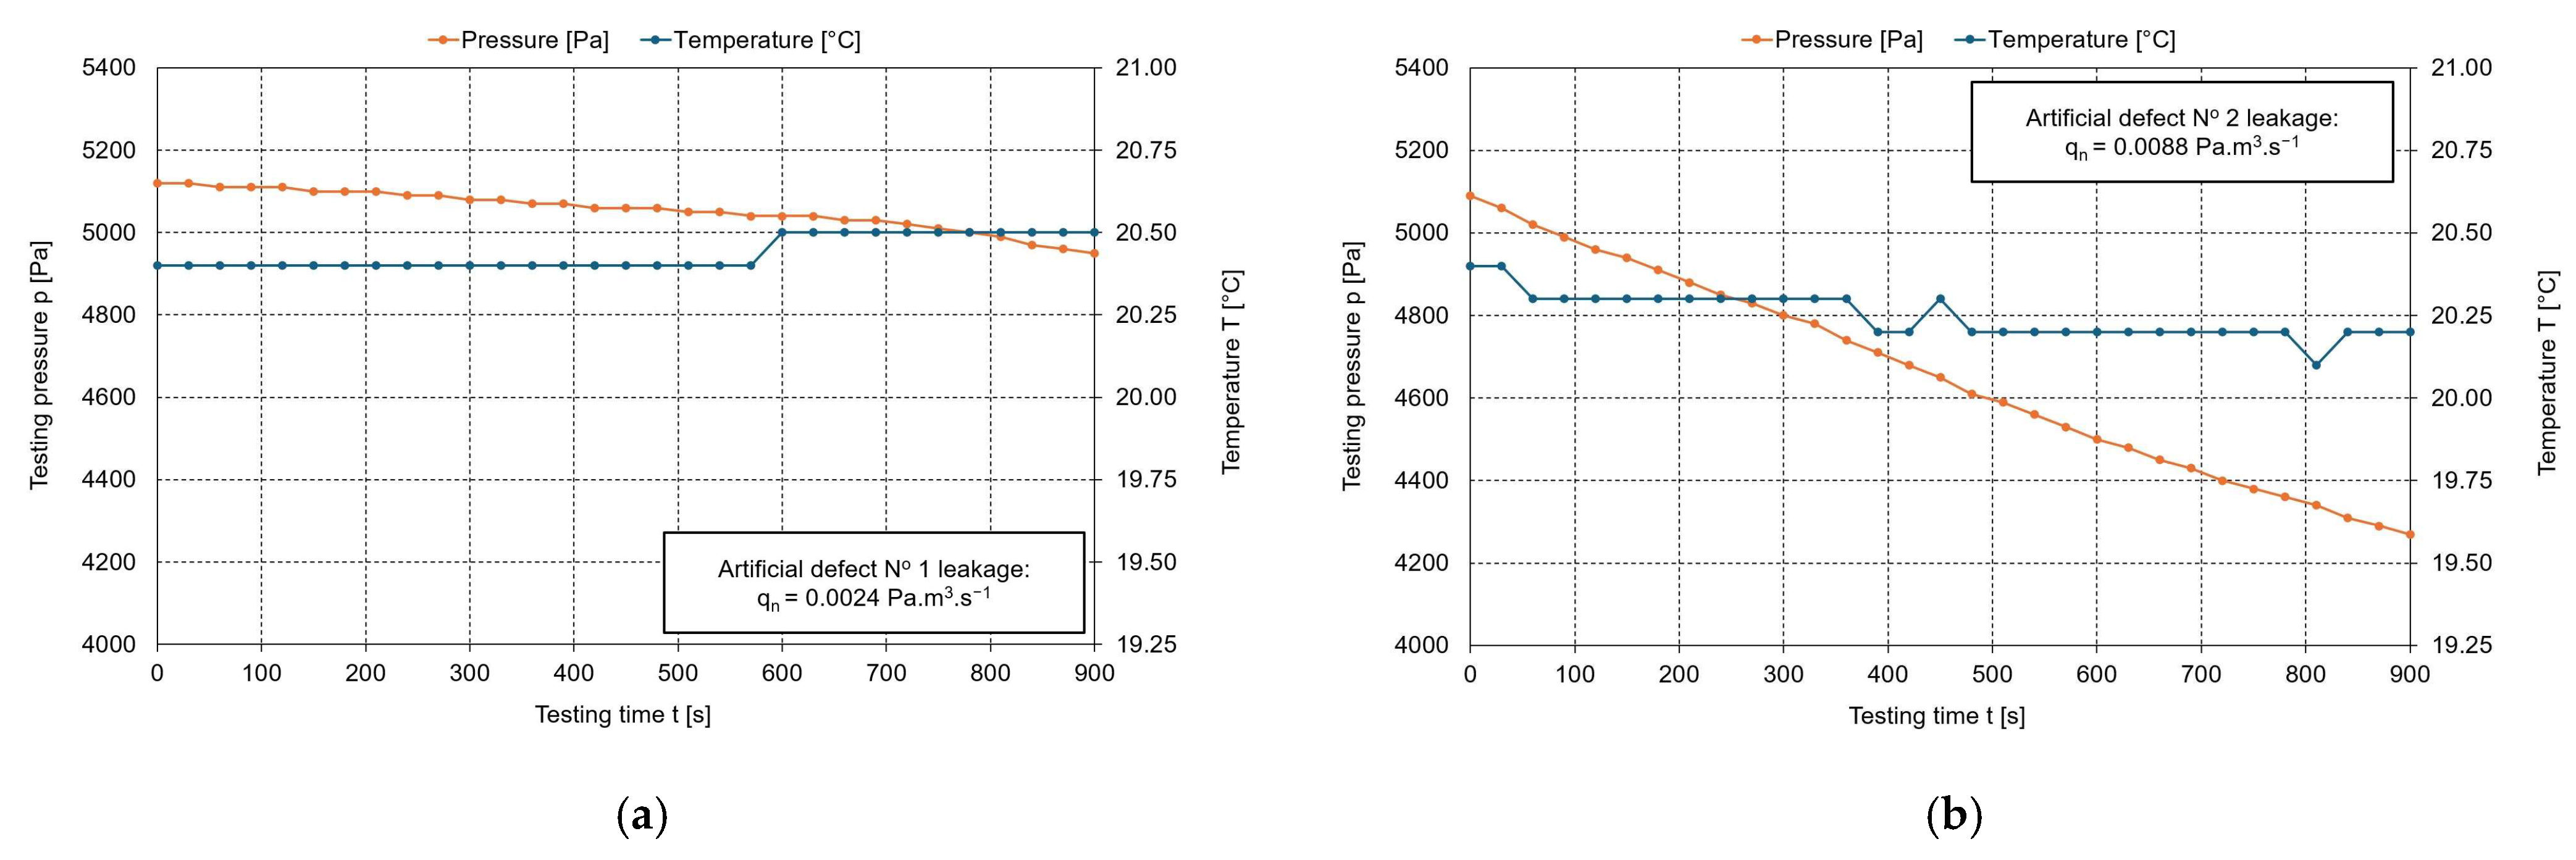
Dynamics of relative pressure drop and temperature over time for air: (a) Artificial defect No. 1 (Ø 0.13 × 100 mm); (b) Artificial defect No. 2 (Ø 0.13 × 20 mm).
Figure 6.
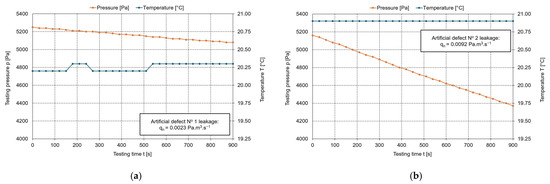
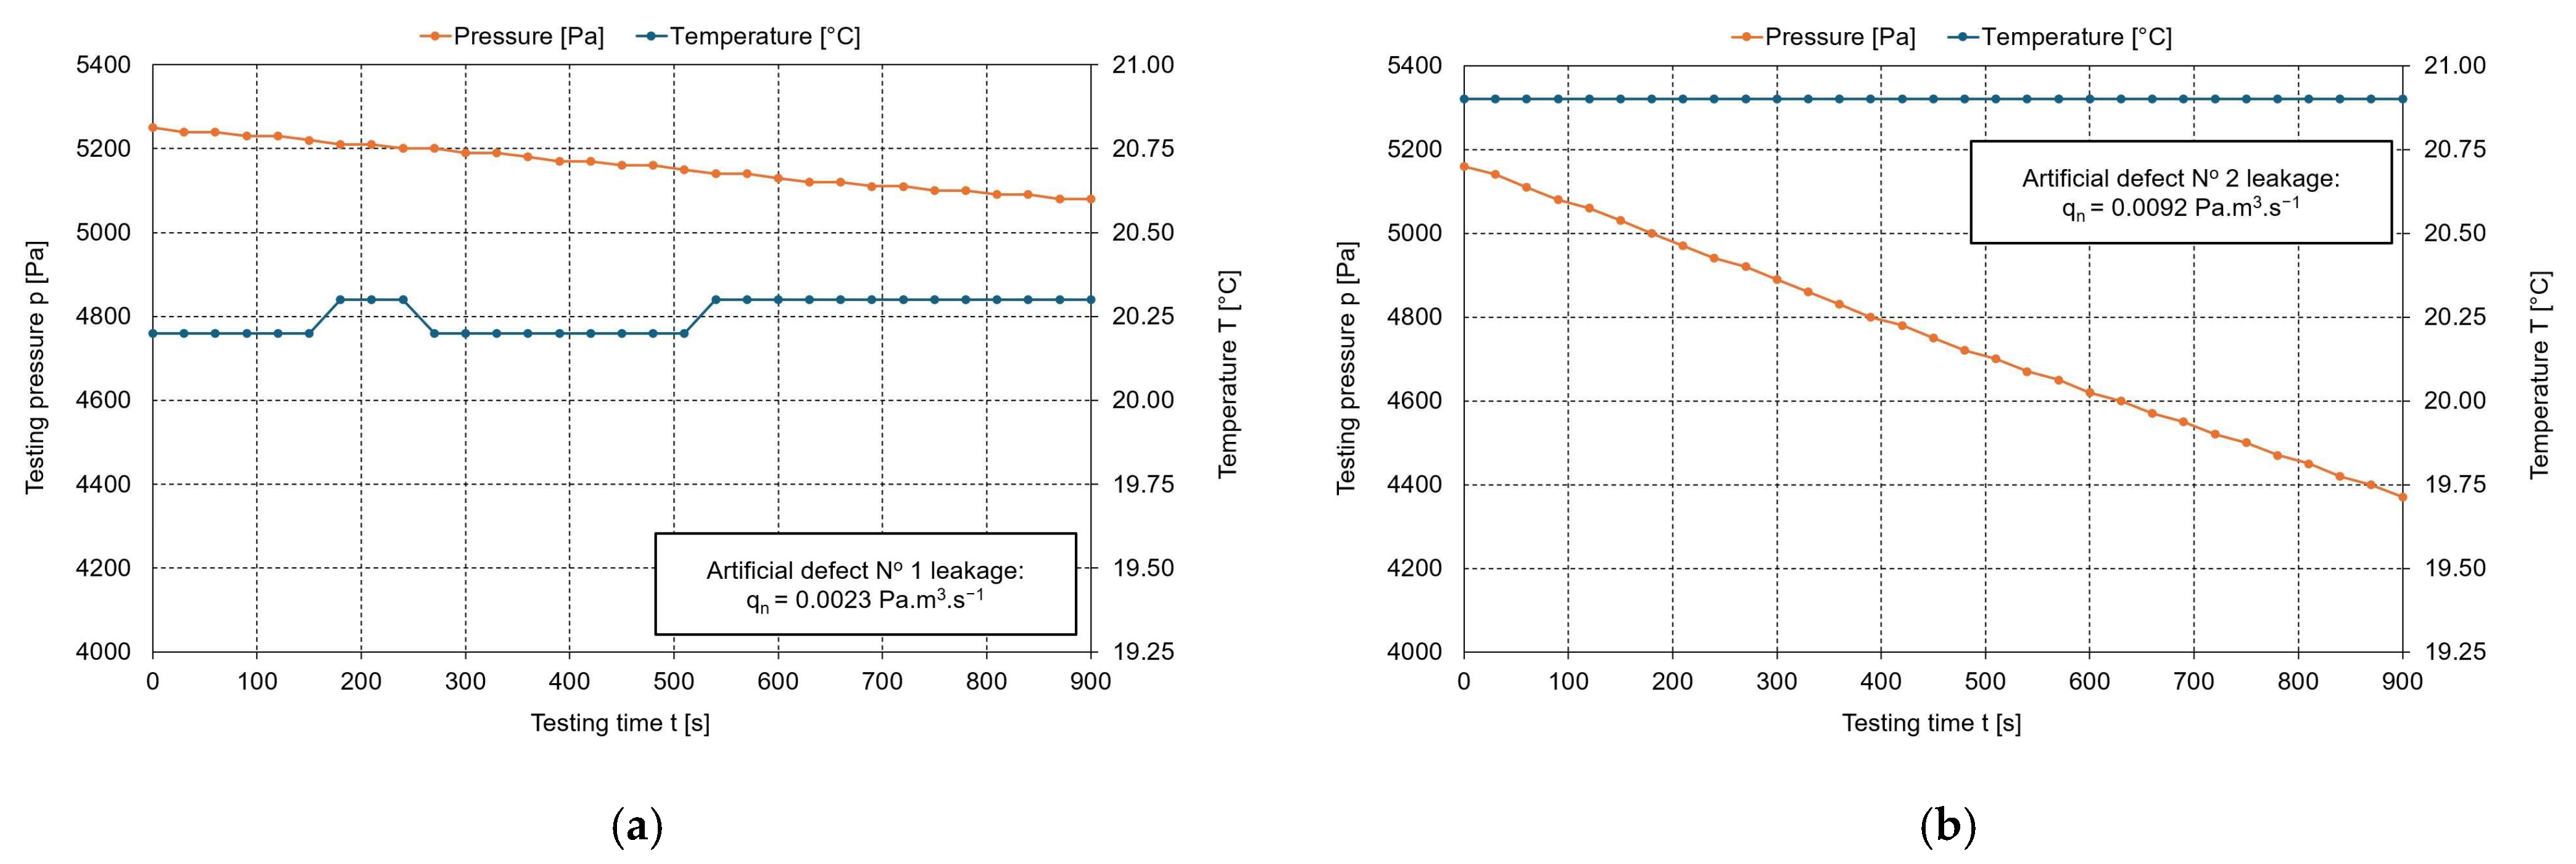
Dynamics of relative pressure drop and temperature over time for argon (Ar): (a) Artificial defect No. 1 (Ø 0.13 × 100 mm); (b) Artificial defect No. 2 (Ø 0.13 × 20 mm).
Figure 7.
Dynamics of relative pressure drop and temperature over time for carbon dioxide (CO2): (a) Artificial defect No. 1 (Ø 0.13 × 100 mm); (b) Artificial defect No. 2 (Ø 0.13 × 20 mm).
Figure 8.
Dynamics of relative pressure drop and temperature over time for propane−butane (PB): (a) Artificial defect No. 1 (Ø 0.13 × 100 mm); (b) Artificial defect No. 2 (Ø 0.13 × 20 mm).
Table 3.
Measured integral leak rate values qn for various gases with stated combined standard measurement uncertainty.
First, the leak test results for the artificial defects using nitrogen as the test gas are presented (Figure 4). After gas stabilization and the subsequent test, artificial defect No. 1 (Ø 0.13 × 100 mm) exhibited a pressure drop Δp = 60 Pa, while the temperature remained constant throughout the measurement. For artificial defect No. 2 (Ø 0.13 × 20 mm), the pressure drop Δp = 460 Pa, and the temperature increased by ΔT = 0.3 °C during the measurement. In both cases, the pressure drop exhibited a linear trend, indicating steady linear flow of the test gas through the artificial defects. Local changes in the rate of pressure drop can be observed on the graphs, which are caused by temperature fluctuations and the resulting pressure changes within the assembly. Naturally, the accuracy of the measuring instruments used must also be considered regarding these variations. The experimentally determined leak rate qn = 0.0017 Pa·m3·s−1 for defect No. 1 and qn = 0.0076 Pa·m3·s−1 for defect No. 2.
The second test medium used for the leak test was air (Figure 5). During the test, the pressure drop measured for artificial defect No. 1 was Δp = 170 Pa, and the temperature increased by ΔT = 0.1 °C. For artificial defect No. 2, the pressure drop was Δp = 820 Pa, and the temperature decreased by ΔT = 0.2 °C during the measurement. In both cases, the pressure drop exhibited a linear trend. The experimentally determined leak rate for air was qn = 0.0024 ± 0.0002 Pa·m3·s−1 for defect No. 1 and qn = 0.0088 ± 0.0002 Pa·m3·s−1 for defect No. 2.
The third test medium used for the leak test was argon (Figure 6). During the test, the pressure drop measured for artificial defect No. 1 was Δp = 170 Pa, and the temperature increased by ΔT = 0.1 °C. For artificial defect No. 2, the pressure drop was Δp = 790 Pa, and the temperature remained constant during the measurement. The experimentally determined leak rate for argon was qn = 0.0023 ± 0.0002 Pa·m3·s−1 for defect No. 1 and qn = 0.0092 ± 0.0002 Pa·m3·s−1 for defect No. 2.
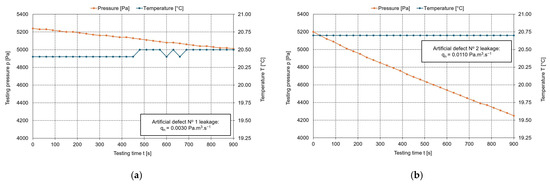
The fourth test medium used for the tightness test was carbon dioxide (Figure 7). During the test, the pressure drop measured for artificial defect No. 1 was Δp = 230 Pa, and the temperature increased by ΔT = 0.1 °C. For artificial defect No. 2, the pressure drop was Δp = 950 Pa, and the temperature remained constant. The experimentally determined leak rate for carbon dioxide was qn = 0.0030 ± 0.0002 Pa·m3·s−1 for defect No. 1 and qn = 0.0110 ± 0.0002 Pa·m3·s−1 for defect No. 2.
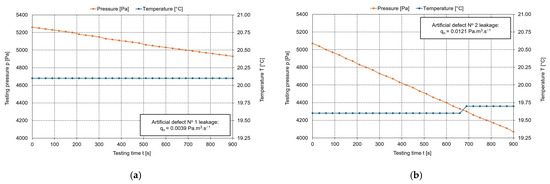
The final test medium used for the test was propane−butane (Figure 8). During the test, the pressure drop measured for artificial defect No. 1 was Δp = 310 Pa, and the temperature remained constant during the test. For artificial defect No. 2, the pressure drop was Δp = 1000 Pa, and the temperature increased by ΔT = 0.1 °C. The experimentally determined leak rate for propane−butane was qn = 0.0039 ± 0.0002 Pa·m3·s−1 for defect No. 1 and qn = 0.0121 ± 0.0002 Pa·m3·s−1 for defect No. 2.
The pressure decay profiles presented in Figure 4, Figure 5, Figure 6, Figure 7 and Figure 8 visually and quantitatively demonstrate the distinct fluid dynamic behavior of the five testing media under identical geometric conditions. As observed in the pressure-time graphs, the slope of the pressure drop is not uniform across the inert gases. Nitrogen and air, which possess the highest dynamic viscosities among the tested media (approximately 1.76 × 10⁻⁵ and 1.72 × 10⁻⁵ Pa·s, respectively), exhibit the shallowest pressure decay curves. Conversely, the propane−butane mixture, acting as the low-viscosity analogue (approximately 0.78 × 10⁻⁵ Pa·s), shows a significantly steeper pressure drop.
This divergent behavior in the continuous viscous flow regime directly corroborates the theoretical framework established by the Hagen−Poiseuille law [23,24], where volumetric flow is inversely proportional to dynamic viscosity. However, as these figures illustrate, the conventional industrial assumption that any inert gas can be used interchangeably (as currently permitted by EN 12327 [3]) is fundamentally flawed. When testing the 100 mm capillary defect, the low-viscosity propane−butane mixture yielded a leak rate up to 129% higher than standard nitrogen. This phenomenon aligns with recent studies on alternative fuel transportation [11,12], which indicate that low-viscosity gases like hydrogen exhibit considerably higher volumetric leakage rates through macroscopic defects compared to standard natural gas or testing nitrogen.
Furthermore, a comparative analysis of the figures reveals the specific influence of defect geometry. While the 100 mm capillary strictly follows the viscosity-driven wall friction model, the relative differences between the testing gases are notably reduced in the 20 mm capillary tests. As experimentally described by Gimelshein et al. [25], in shorter capillary tubes, the entrance and exit aerodynamic losses—governed by the Bernoulli principle and the specific density of the gas—begin to dominate over the viscous friction of the walls. This indicates that for short, tortuous leak paths, the density of the testing gas also introduces secondary aerodynamic effects that must be carefully considered.
Overall, the substantive differences highlighted in Figure 4, Figure 5, Figure 6, Figure 7 and Figure 8 emphasize the core novelty of this study: if a pipeline network intended for low-viscosity fuels (such as pure hydrogen) is pressure-tested using standard nitrogen, the pneumatic test will inherently and dangerously underestimate the actual operational leak rate. Therefore, the empirical data derived from these figures strongly advocate for the implementation of a viscosity-based mathematical correction factor in future non-destructive testing protocols.
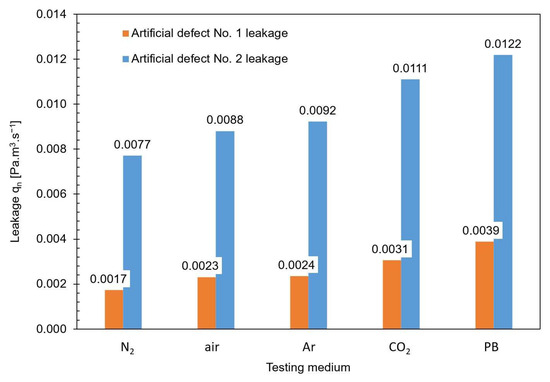
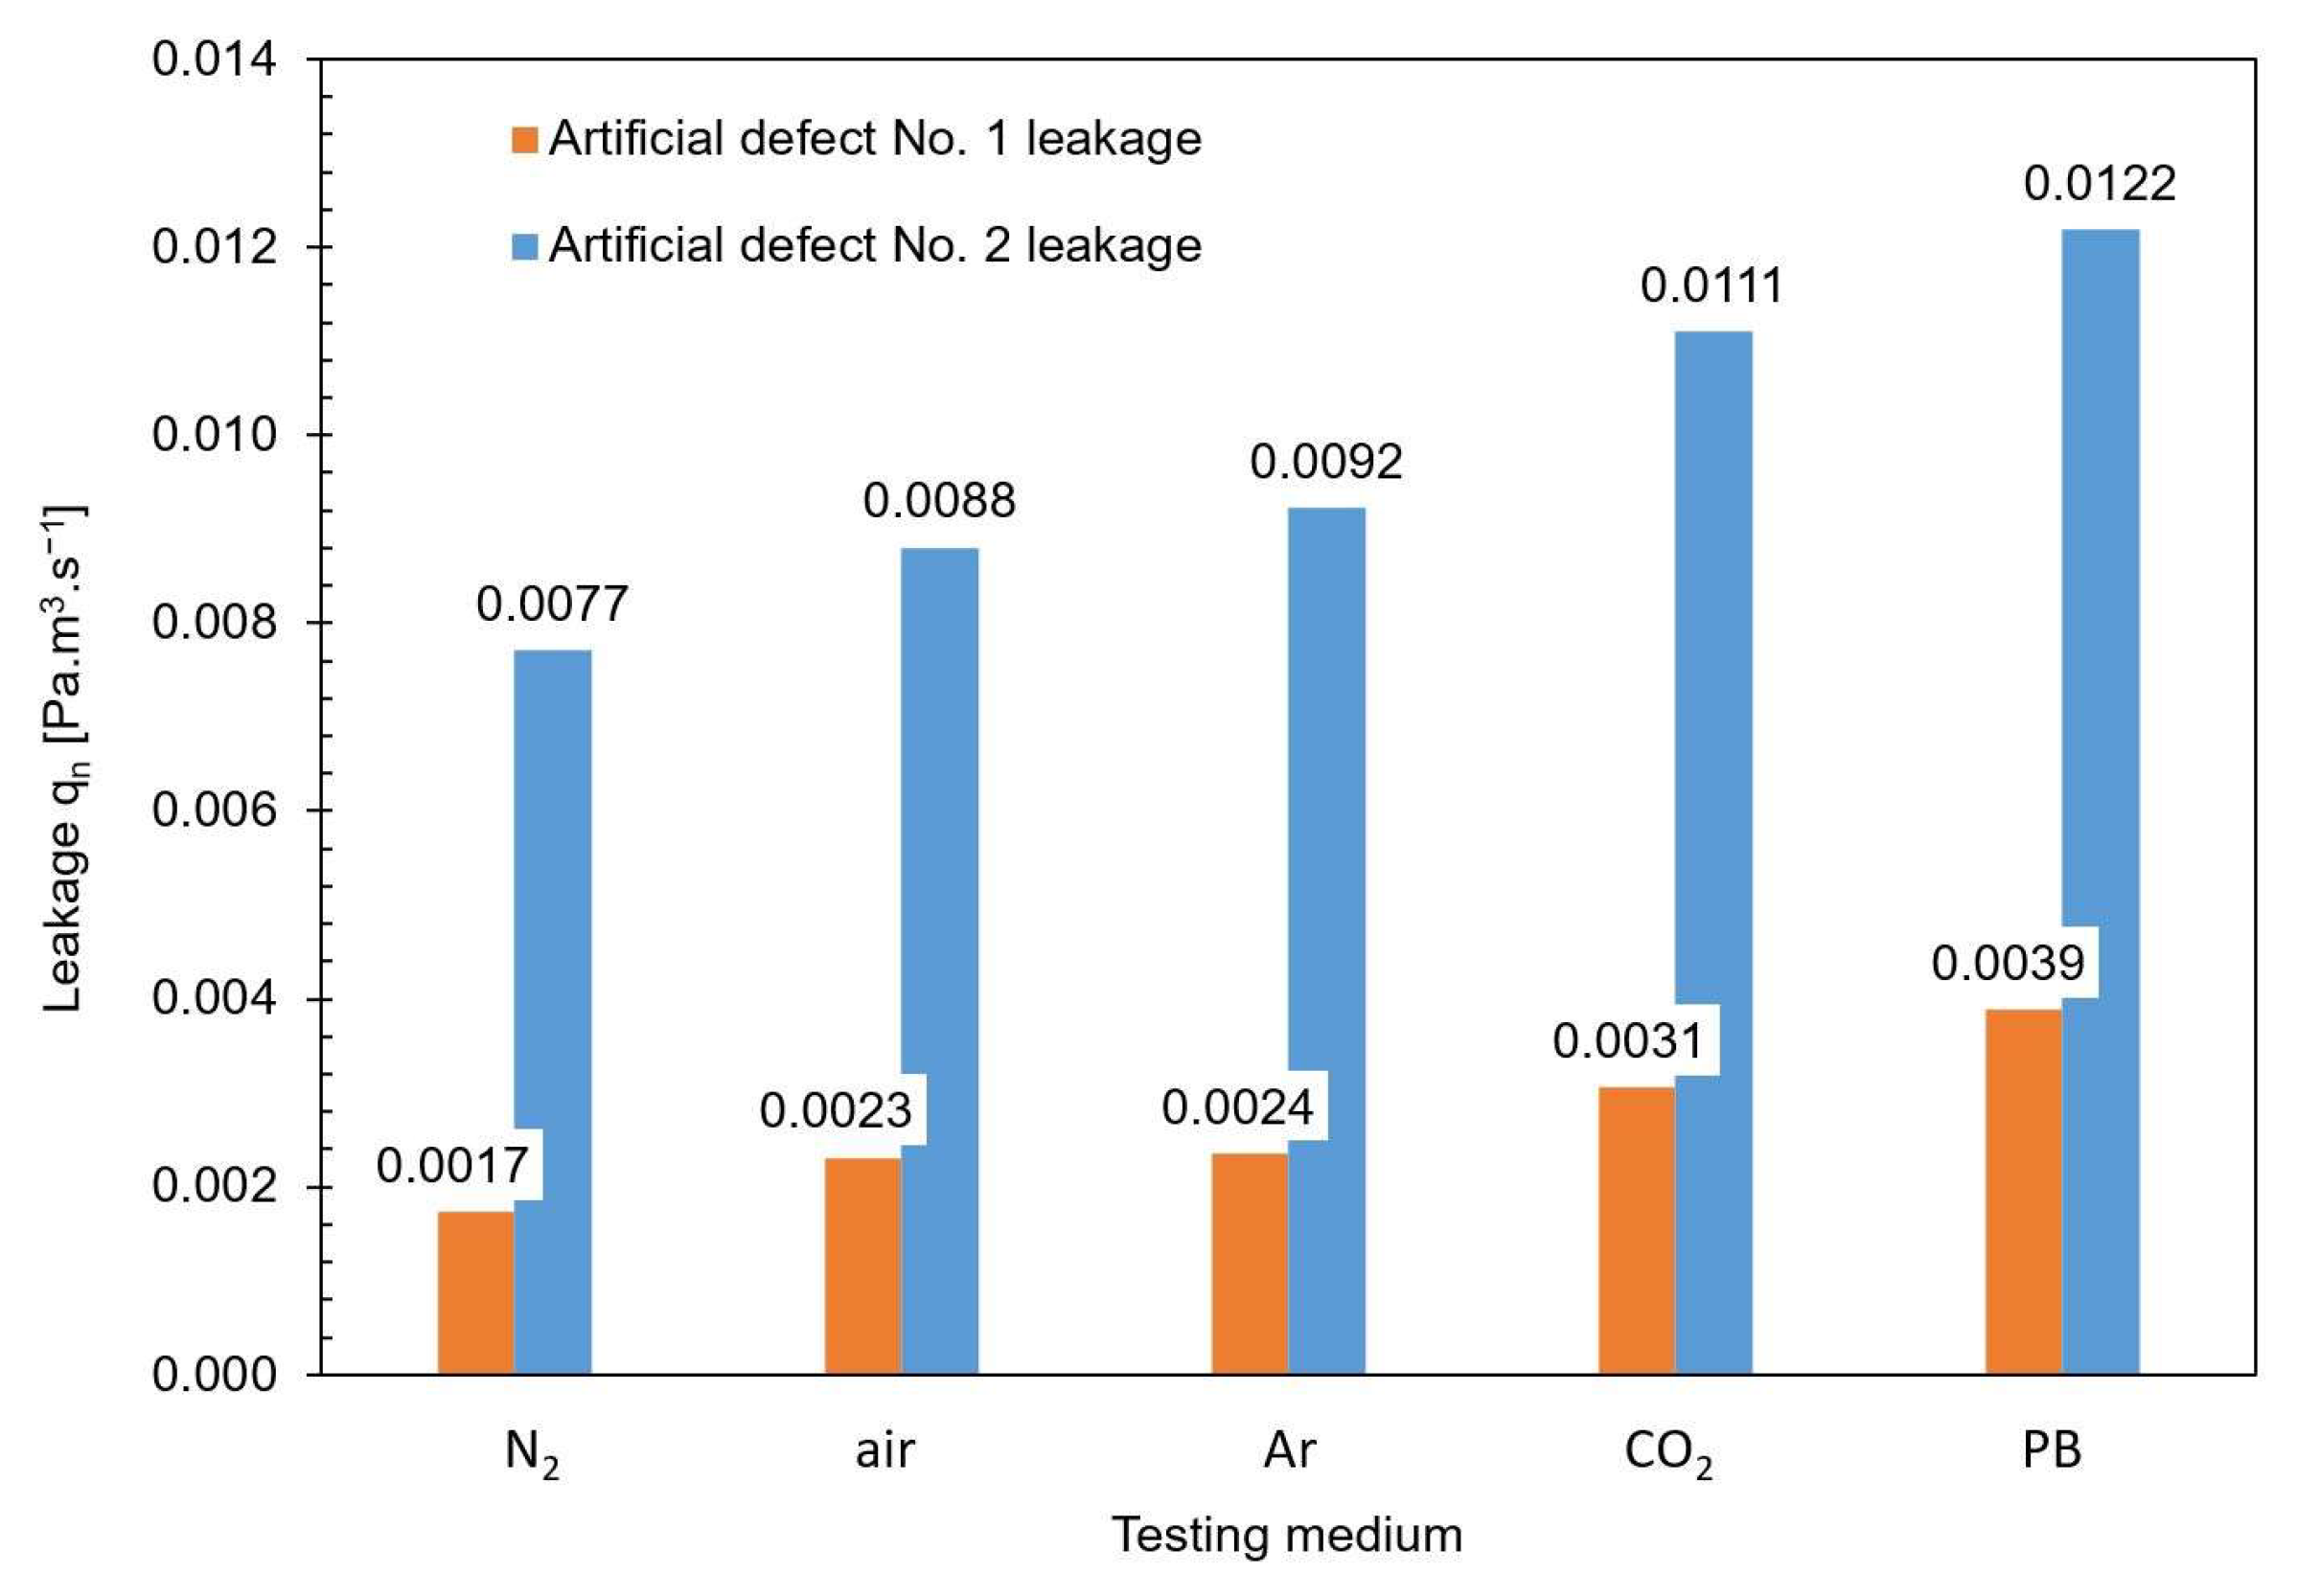
For a more intuitive visual comparison, the calculated integral leak rate values (qn) detailed in Table 3 are graphically summarized in Figure 9. The grouped bar chart clearly illustrates the substantial variability in leakage magnitudes across the different testing media for both the 100 mm and 20 mm capillary defects.
Figure 9.
Graphical representation of measured integral leak rate values qn for all testing gases.
From the presented data, it is evident that for an unchanged defect geometry, significant variability in leak rates occurs depending on the gaseous medium used. The lowest leak rate value for both capillary lengths was recorded when using nitrogen (N2). Conversely, the highest values were consistently measured when using propane−butane (PB). All measured values for artificial defects were safely below the legislative limit for full operability of the equipment, qn,criterion ≤ 0.044 Pa·m3·s−1.
4. Discussion
The results of the experimental measurements clearly demonstrated that when using the same integral leak test (pressure decay method) and identical defect geometry, the use of different gaseous media leads to significantly different determined leak rate values (qn). These findings directly challenge the common industrial assumption that the type of inert gas is a secondary parameter in leak testing that can be neglected.
4.1. Effect of Dynamic Viscosity in the Viscous Flow Regime
For capillaries with an internal diameter of Ø 0.13 mm and under the defined testing conditions (atmospheric pressure and room temperature), the Knudsen number (Kn) for all testing gases is in the order of 10−4, satisfying the condition Kn ≪ 0.01. From the perspective of fluid mechanics, this means that the gas flow through the artificial leak was entirely within the continuous (viscous) flow regime. In this regime, the volumetric flow rate is governed by relationships derived from the Hagen−Poiseuille law:
where Q represents the volumetric flow rate, r is the capillary radius, η is the dynamic viscosity of the fluid, L is the capillary length, and Δp is the pressure difference.
It should be noted that Equation (5) describes the instantaneous volumetric flow rate Q (m3·s−1) governed by the Hagen−Poiseuille relationship. In the experimental framework of the pressure-decay method, the reported leak rate qn (Pa·m3·s−1) represents the pressure-normalized gas throughput. These two quantities are related via the system volume V and the pressure decay gradient dp/dt, such that qn = V·(dp/dt). While the Hagen−Poiseuille law provides the theoretical basis for the inverse dependence of flow on dynamic viscosity (µ), the experimental parameter qn serves as the practical metric for quantifying the integral integrity of the assembly under specific boundary conditions.
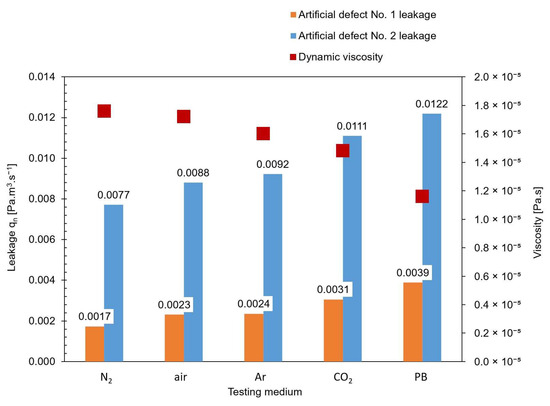
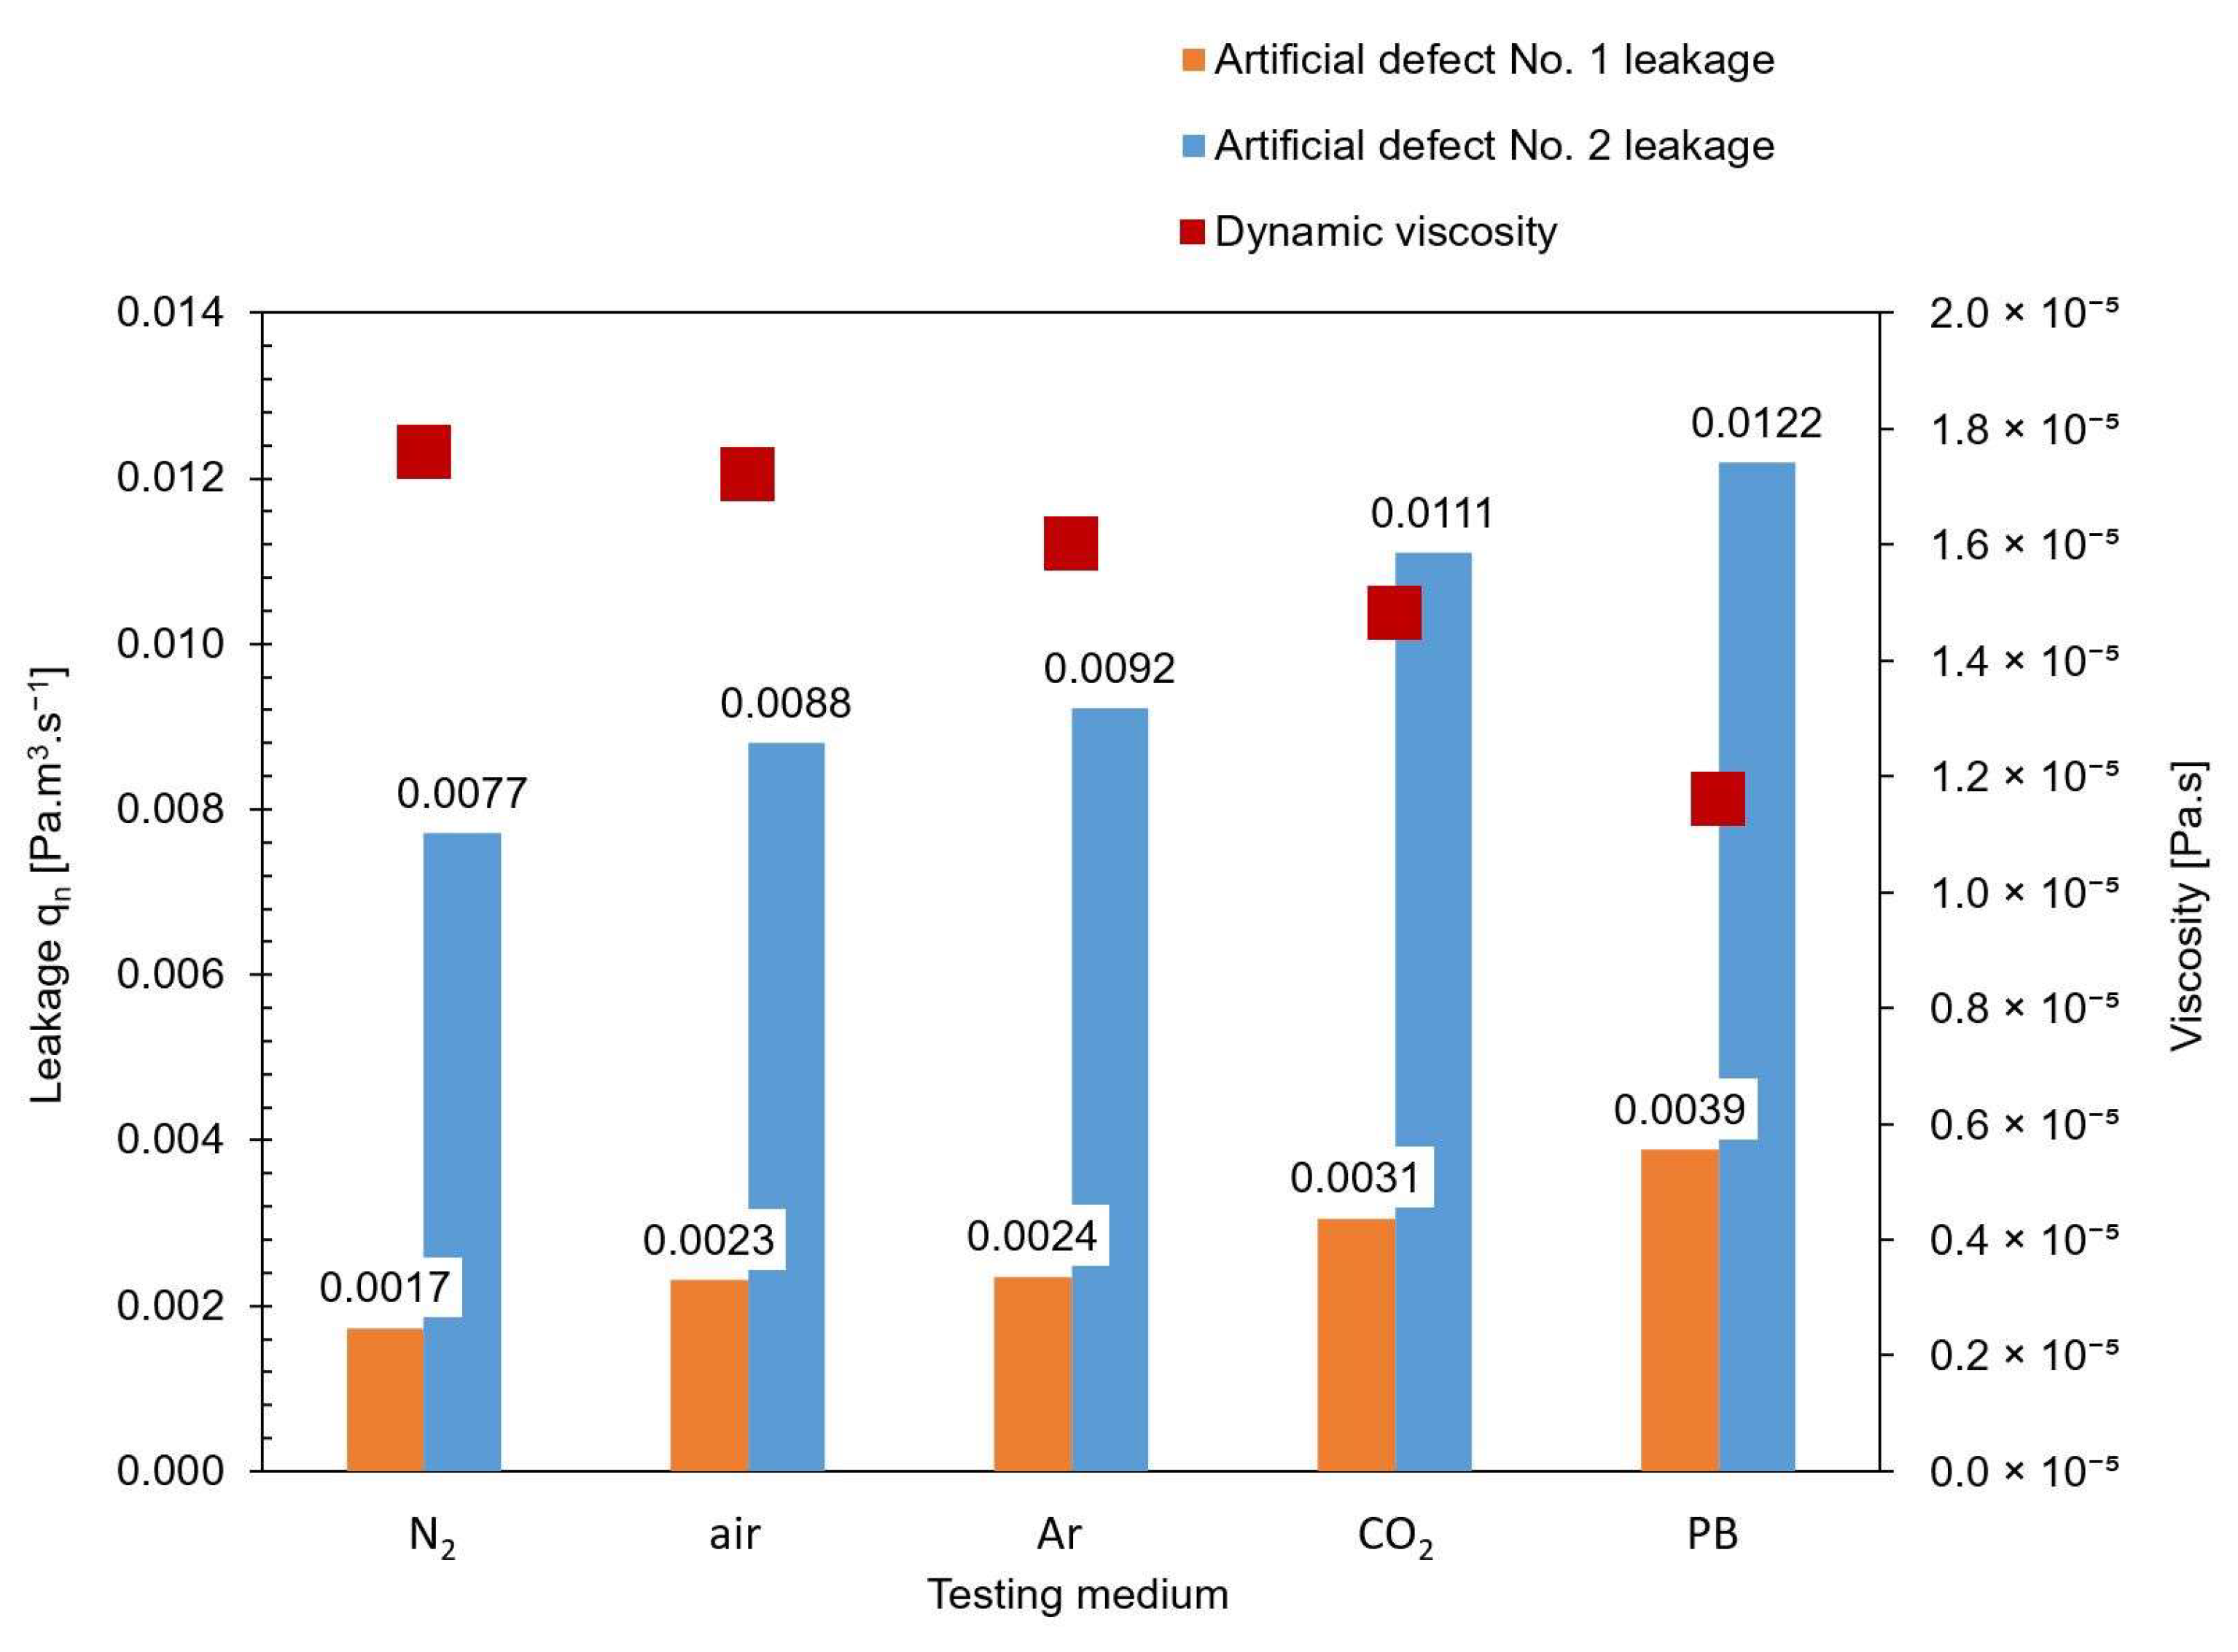
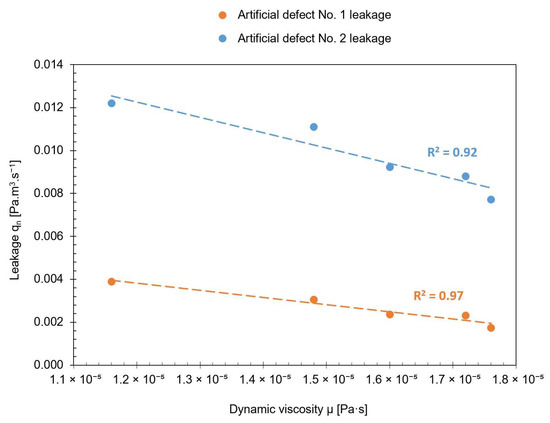
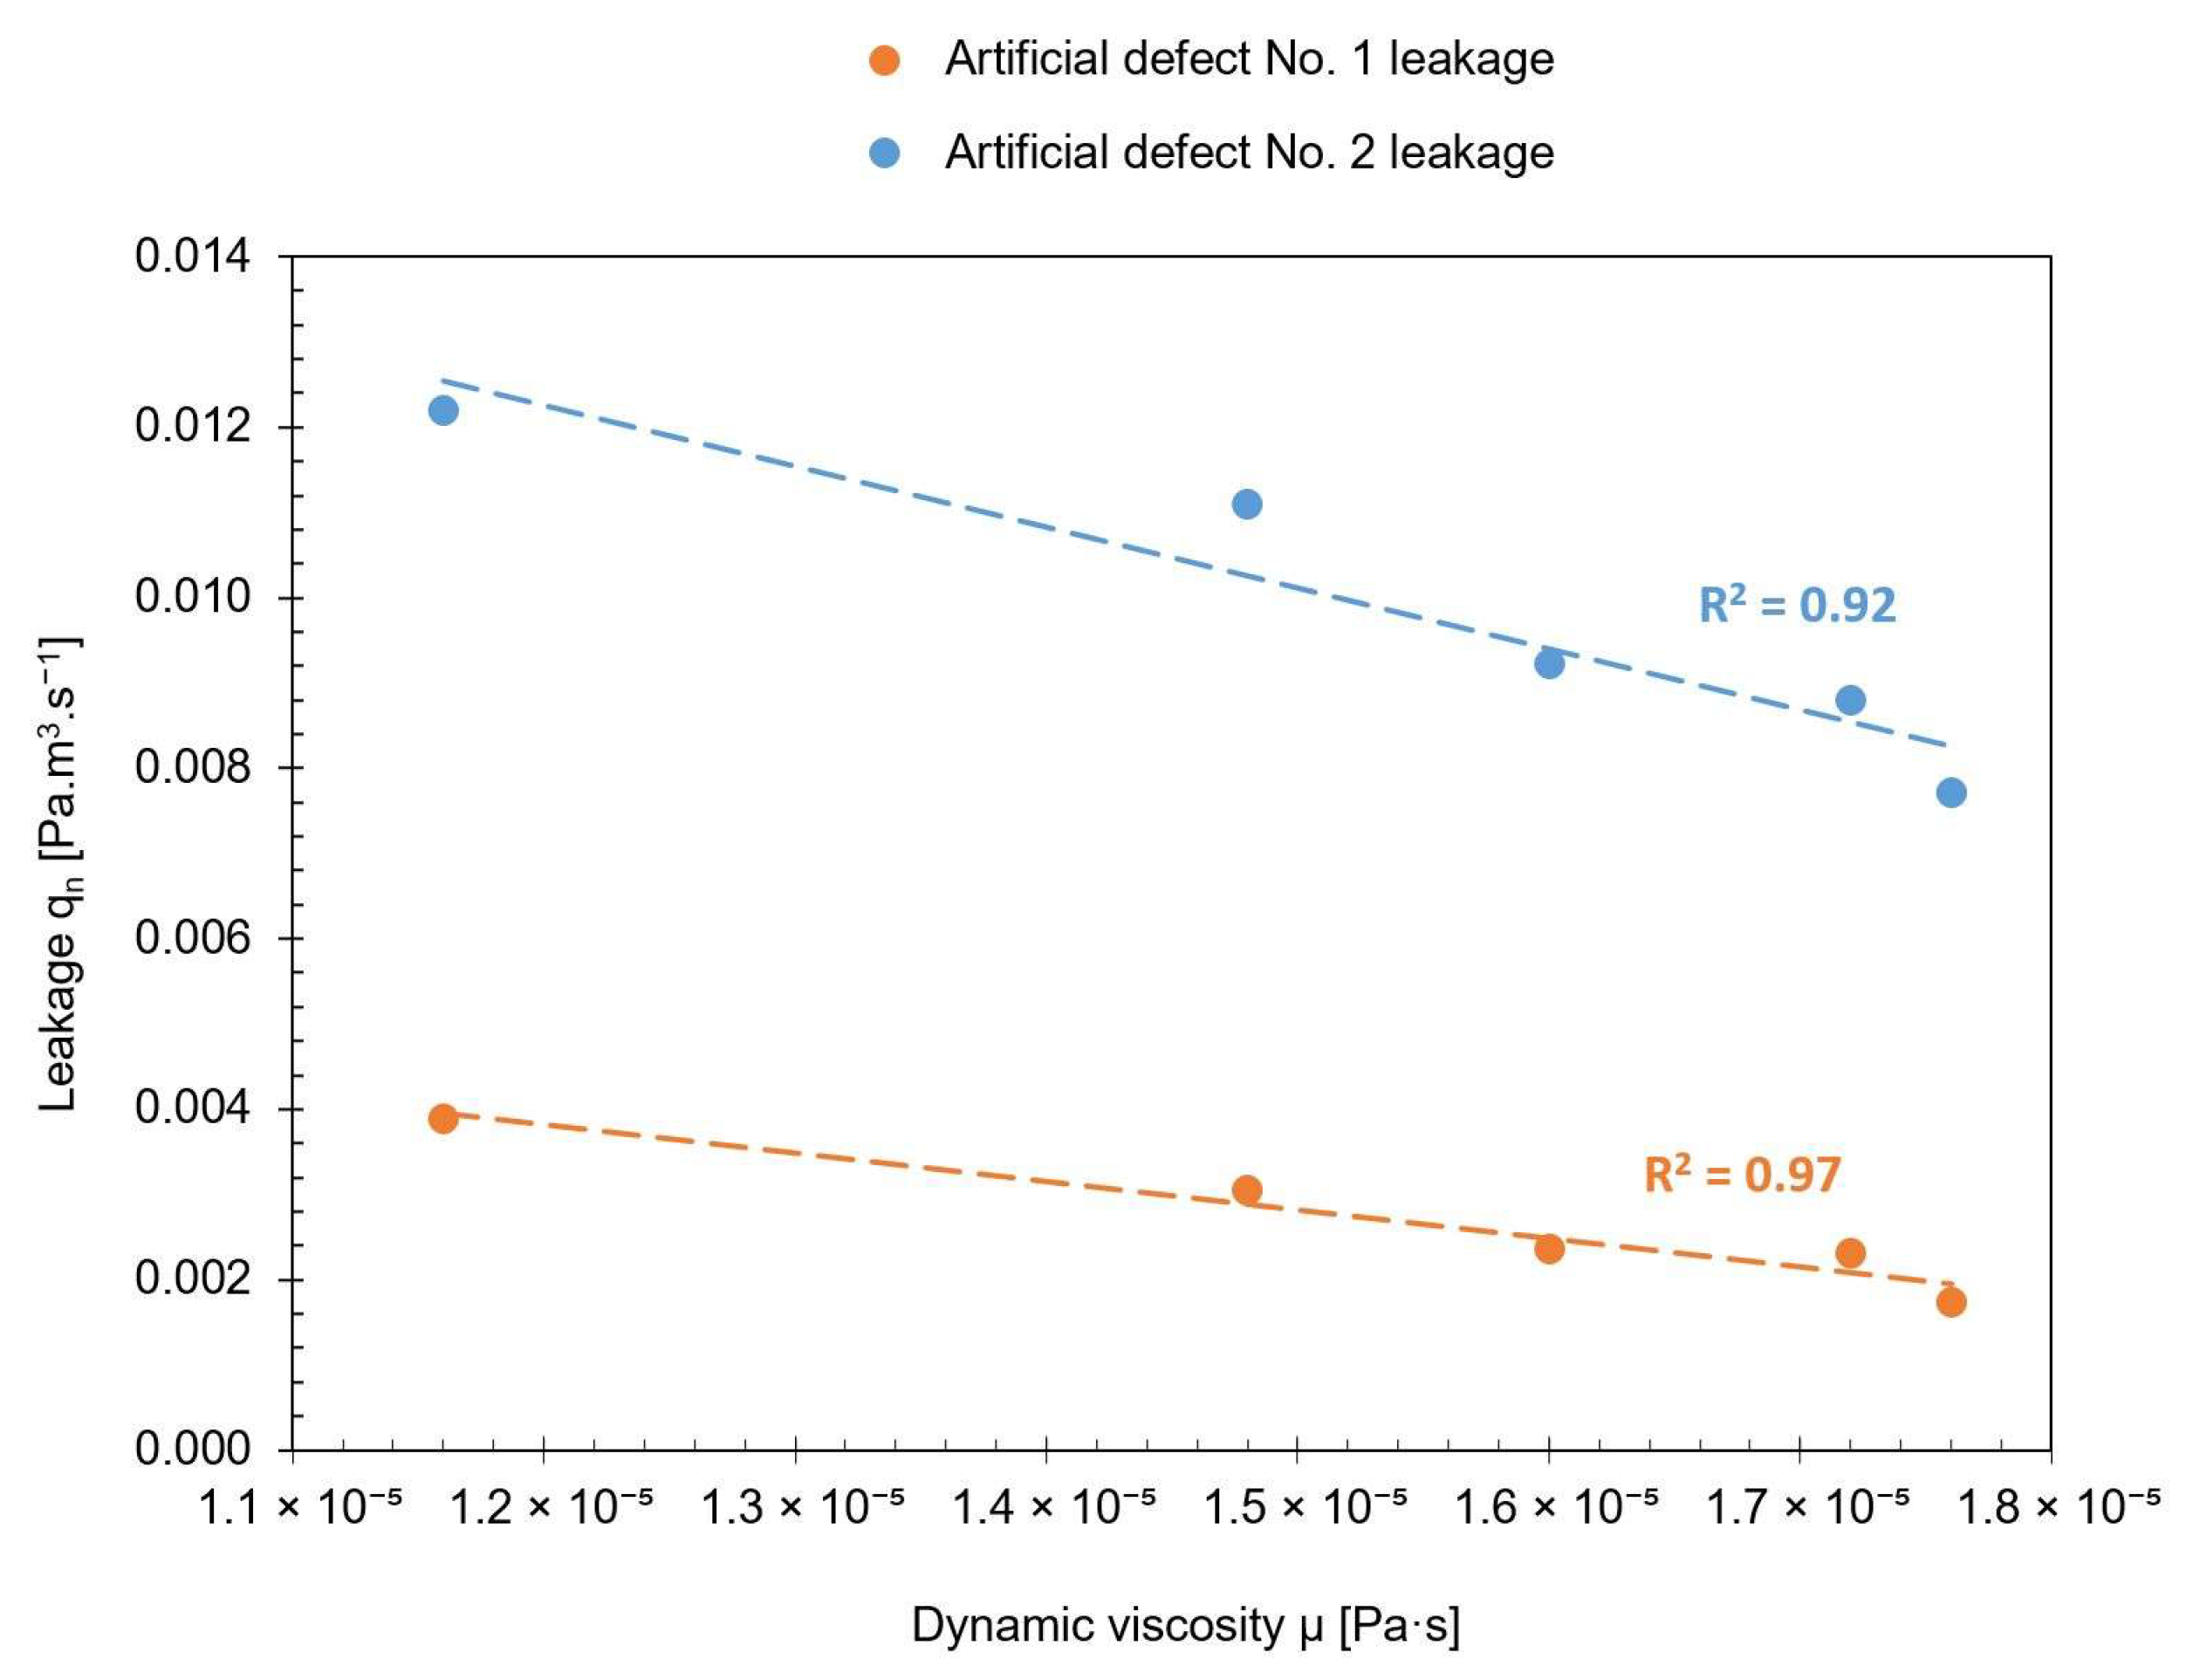
From this dependence, it follows that the volumetric gas flow rate is inversely proportional to its dynamic viscosity. Therefore, for identical defect geometry, a gas with lower viscosity exhibits a higher leak rate. Experimental data fully confirm this theoretical dependence. The lowest leak rate was measured for nitrogen (N2), which has the highest dynamic viscosity among the tested gases (μ ≈ 1.76 × 10⁻⁵ Pa·s). Conversely, the highest leak rate was recorded for the propane−butane (PB) mixture, which has the lowest viscosity (μ ≈ 0.78 × 10⁻⁵ Pa·s). The order of increasing leak rate (N2 → air → Ar → CO2 → PB) exactly mirrors the decreasing trend of the dynamic viscosity of these media, as shown in Table 4 and graphically illustrated in Figure 10.
Table 4.
Dynamic viscosity of testing gases and measured integral leak rate values qn.
Figure 10.
Dependence of gas viscosity on the measured leak rate (qn).
While the present experimental validation utilized a single constant capillary diameter (d = 0.13 mm), it is important to address the applicability of these findings to other defect sizes. According to the Hagen−Poiseuille relationship, altering the physical radius of the defect will exponentially affect the absolute volumetric flow rate, as it scales with the fourth power of the radius (r4). However, the relative leakage differences between the individual testing gases—which are dictated exclusively by the inverse ratio of their dynamic viscosities—will remain strictly consistent across different defect sizes, provided that the flow remains within the boundaries of the continuous laminar viscous regime (Kn << 0.01).
If a real-world defect is significantly smaller (e.g., micro-leaks or polymer permeation), the flow may transition into the molecular or Knudsen slip regime, where the molar mass of the gas becomes the dominant driver instead of viscosity. Conversely, for excessively large defects that induce turbulent flow, gas density and aerodynamic minor losses would begin to overshadow viscous friction. Therefore, the viscosity-based conclusions and correction principles proposed in this study are broadly applicable to a wide spectrum of macroscopic leaks in gas infrastructure, as long as the fundamental criteria for laminar viscous flow are satisfied.
To move beyond a purely qualitative assessment and quantitatively substantiate this relationship, a statistical correlation analysis was performed. For artificial defect No. 1 (100 mm capillary), where the flow is fully developed and dominated by viscous wall friction, the Pearson correlation coefficient (r) between the dynamic viscosity of the respective gases and their measured integral leak rates (qn) was calculated. The analysis yielded a strong negative correlation coefficient of r = −0.98 (coefficient of determination R2 = 0.97). Similarly, for artificial defect No. 2 (20 mm capillary), the correlation analysis yielded a strong negative coefficient of r = −0.96 (coefficient of determination R2 = 0.92). The slightly lower correlation value for the shorter capillary perfectly aligns with the fluid-dynamic boundary phenomena. As the channel shortens, non-linear entrance and exit losses begin to partially interfere with the pure viscous friction model. Nevertheless, both coefficients mathematically validate the physical premise derived from the Hagen−Poiseuille law: a decrease in the dynamic viscosity of the testing gas exerts a robust and statistically significant influence on the resultant increase in the integral leak rate.
This statistically significant inverse relationship is further visualized in Figure 11, which plots the measured integral leak rates against the dynamic viscosities of the respective testing gases.
Figure 11.
Correlation between the dynamic viscosity of the testing gases and the measured integral leak rate (qn) for artificial defects No. 1 and No. 2.
The linear trendlines for both defect geometries clearly illustrate the strong negative correlation, visually corroborating the theoretical framework of the Hagen−Poiseuille law within the continuous viscous flow regime.
4.2. Effect of Defect Geometry and Frictional Pressure Losses
An important aspect of the analysis is the non-linear response of the leak rate increase depending on the length of the leak channel. After the exact data correction (removal of the assembly’s background leak and application of temperature compensation), a net increase in the leak rate of up to 129% (from 0.0017 to 0.0039 Pa·m3·s−1) was recorded for artificial defect No. 1 (100 mm capillary length) when using propane−butane compared to nitrogen. In the case of the geometrically shorter defect No. 2 (20 mm length), this increase was 59% (from 0.0076 to 0.0121 Pa·m3·s−1). This difference can be physically explained by the change in the dominance of viscous friction depending on the capillary length.
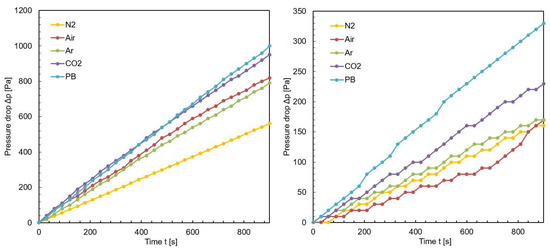
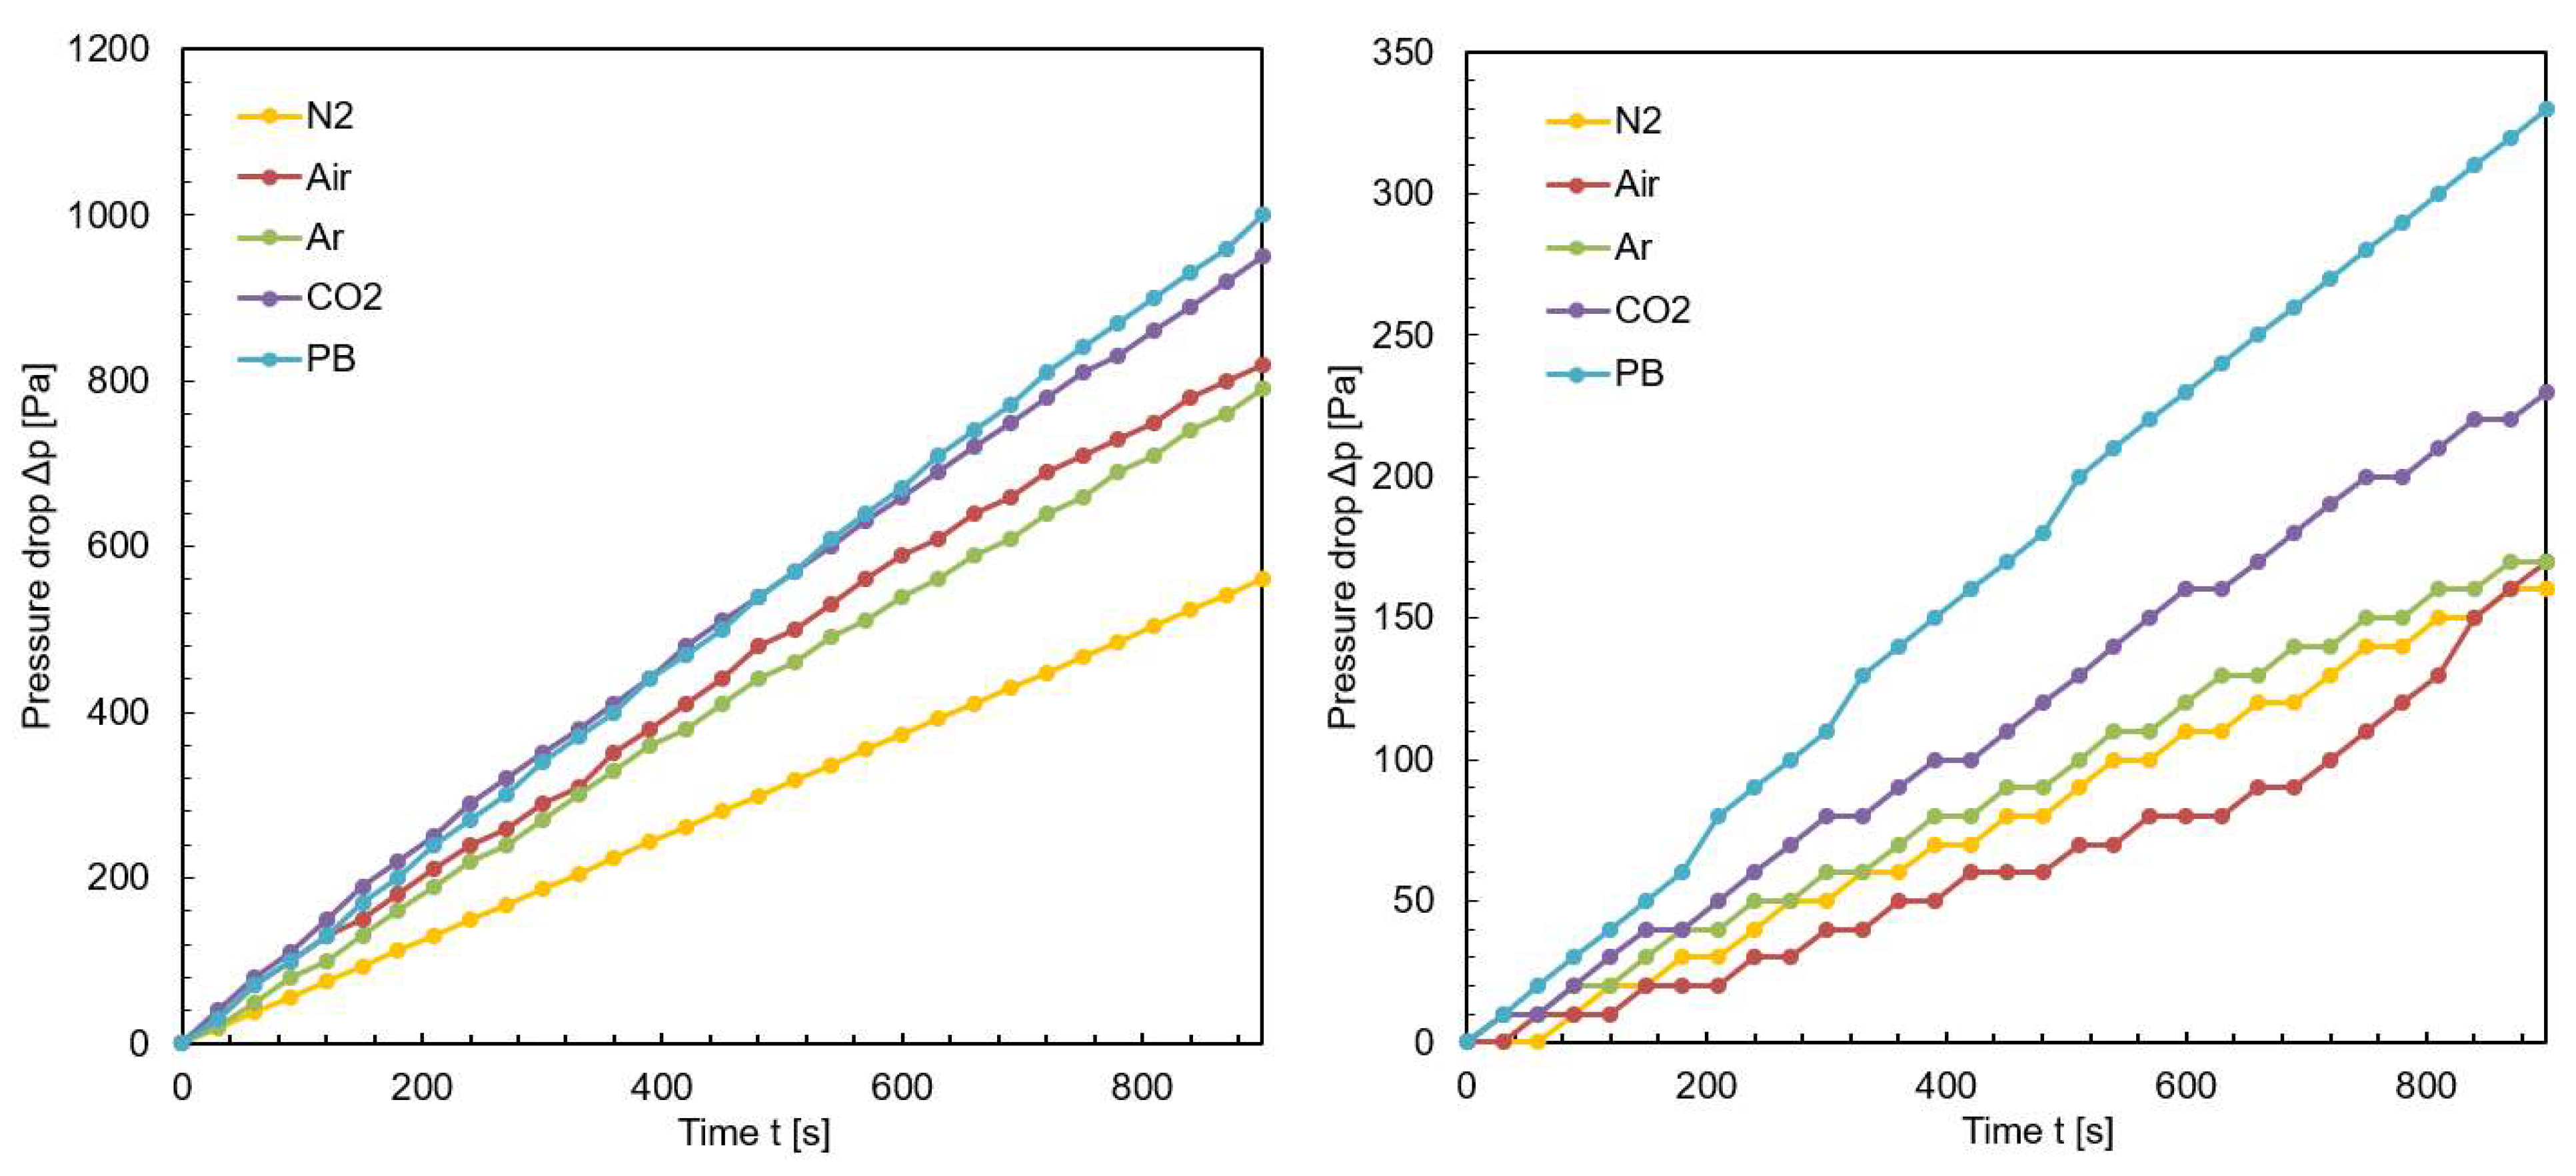
In the longer capillary (100 mm), the flow is fully developed, and the total hydrodynamic resistance is formed almost exclusively by the linear friction of the gas against the walls. Precisely for this reason, the damping effect of the different dynamic viscosities of the tested gases was maximally manifested in this long channel. Detailed analysis of the dynamic records of normalized pressure drop (Figure 12 right) demonstrated that the pressure decreased strictly linearly for all gases during the entire measurement interval (900 s). The driving pressure gradient was constantly large enough to continuously overcome the frictional forces. It should be noted that for laminar viscous flow through an ideal capillary, the volumetric flow rate decreases continuously as a function of the driving pressure difference, meaning no discrete physical stagnation threshold exists within the investigated pressure range. Accordingly, no measurable reduction in the pressure decay rate indicative of flow cessation was observed throughout the entire 900 s measurement phase, confirming that the driving gradient remained constantly large enough to continuously overcome the frictional forces.
Figure 12.
Dynamics of normalized pressure drop (Δp) over time for all tested gases using a 20 mm capillary (left) and a 100 mm capillary (right).
Looking at the graphical representation for the 100 mm capillary (Figure 12 right), it is evident that some curves (especially for air and nitrogen) exhibit a slightly “stepped” and locally non-linear character. This visual phenomenon does not represent a physical pulsation of the flow but is a direct consequence of the measurement chain limits and a low signal-to-noise ratio. As demonstrated in the study [30] in integral leak tests with extremely slow leakage, measurement uncertainty is critically dependent on sensor resolution and temperature fluctuations. For the 100 mm capillary, the total pressure drop was only 160 to 350 Pa. Since the guaranteed instrumental uncertainty of the pressure gauge is ±10 Pa and the quantization step of the thermocouple is 0.1 °C (which in the given enclosed volume physically corresponds to a pressure change of approximately 36 Pa), sudden stepwise flipping of digital sensor values momentarily visually obscures the otherwise extremely slow and smooth gas leak. However, thanks to the analytical ratio of initial and final temperatures (Equation (3)), the resulting integral leak rate value qn exactly eliminates this quantization noise.
Conversely, in the shorter capillary (20 mm), the total linear resistance of viscous friction significantly decreased. From the fluid mechanics point of view, boundary conditions (entrance and exit pressure losses) began to play a dominant role at the expense of wall friction. This phenomenon was experimentally described by Gimelshein et al. [25], who confirmed that in short capillaries (with a low length-to-inner-diameter ratio), the classical viscous model loses its dominance, and the flow is primarily governed by hydrodynamic losses at the inlet and outlet. These dynamic phenomena led to a massive increase in the absolute leak values, with the normalized pressure drop for this geometry reaching 560 to 1000 Pa (Figure 12 left). With such a strong signal, the sensor resolution step became visually negligible, which is confirmed by perfectly smooth and steep decay curves. At the same time, this massive flow driven by boundary phenomena partially suppressed the relative percentage difference between the gases, which was induced purely by viscosity in the 100 mm capillary (a reduction in the difference from 129% to 59%).
It should be emphasized that the attribution of this reduced relative difference to dominant entrance and exit losses is currently presented as a physically plausible interpretation based on the observed empirical data and existing literature, rather than a fully quantified mathematical model. An extended Bernoulli approach incorporating specific minor loss coefficients would undoubtedly provide a robust quantitative validation of these dynamic boundary phenomena. However, constructing such a model was outside the scope of the present purely experimental study. Developing a comprehensive quantitative framework that accurately combines local entrance/exit minor loss coefficients with continuous viscous wall-friction terms for short-capillary leakage represents a critical area for our future research.
While the Hagen−Poiseuille law provides a robust theoretical foundation for the observed continuous viscous flow, it is essential to acknowledge the geometric idealization of the artificial defects used in this study. The calibrated smooth-bore circular capillaries were intentionally selected as simplified, highly reproducible model defects. This methodological choice was critical to isolate the purely fluid-dynamic influence of the testing gases from uncontrolled geometrical variability. In real-world PE100RC pipeline networks, actual defects—such as micro-cracks, pinholes, or flaws in electrofusion and butt-fusion welds—rarely form perfect cylinders. Instead, they constitute non-ideal, tortuous leak paths with significant surface roughness.
Nevertheless, as long as the gas flow remains within the continuous viscous regime, the qualitative inverse dependence of the volumetric leak rate on dynamic viscosity is expected to hold true for these field defects. However, the absolute quantitative leak rates in real applications will inevitably be modulated by the actual hydraulic resistance of the defect, which incorporates surface roughness, tortuosity, and local aerodynamic entrance or exit losses. This highlights that while the viscosity-based behavior observed in this study provides a crucial physical baseline, practical field assessments must eventually account for the complex morphology of actual pipeline weld defects.
4.3. Implications for Practice in Transitioning to Hydrogen Infrastructure
The acquired experimental knowledge has a direct impact on the revision of gas industry methodologies and related technical standards. Current legislation (EN 12327 [3], TPP 704 01 [4]) permits conducting integral pneumatic leak tests using air or nitrogen regardless of the type of subsequently transported gaseous medium. However, if a pipeline network (e.g., made of PE100RC material) is being prepared for the distribution of alternative fuels with low dynamic viscosity, such as pure hydrogen (μ ≈ 0.89 × 10⁻⁵ Pa·s at 20 °C) or its blends, a traditional nitrogen test will dangerously underestimate actual leaks.
By extrapolating the obtained data and applying the Hagen−Poiseuille model, it can be concluded that hydrogen, possessing an even lower viscosity than propane−butane, will exhibit the highest leak rate through identical capillary defects. A standard test using nitrogen may thus provide a false certification of tightness for a system that will exhibit unacceptable losses and safety risks when operated with hydrogen. Therefore, it is essential to implement correction factors into the evaluation criteria of integral tests (allowable pressure drop per unit time) dependent on the ratio of the dynamic viscosities of the testing and operating gases.
An additional aspect supporting the use of propane–butane (PB) as a surrogate medium in the present experimental programme is the close similarity of its dynamic viscosity to that of hydrogen. Published thermophysical property databases report hydrogen viscosity at 20 °C of approximately 0.88–0.89 × 10⁻⁵ Pa·s, while propane and butane exhibit viscosities of approximately 0.82 × 10⁻⁵ Pa·s and 0.75 × 10⁻⁵ Pa·s, respectively. As a result, the dynamic viscosity of commercial propane–butane mixtures varies only between approximately 0.77 × 10⁻⁵ and 0.79 × 10⁻⁵ Pa·s for propane contents between 30% and 60%. The difference between hydrogen and propane–butane therefore remains below approximately 15%, whereas the viscosity of nitrogen is nearly twice as high (1.76 × 10⁻⁵ Pa·s). Consequently, under viscous flow conditions governed by the Hagen–Poiseuille relationship, propane–butane provides a substantially more representative approximation of hydrogen leakage behaviour than conventionally used nitrogen. For identical defect geometries, the viscosity-based difference between hydrogen and propane–butane leak rates is expected to be only about 10–15%, supporting the suitability of PB as a low-viscosity analogue for preliminary investigations of hydrogen pipeline leakage.
From the perspective of dynamic viscosity, propane–butane mixtures are considerably closer to hydrogen than to nitrogen, indicating that the experimental trends obtained using PB provide a realistic basis for estimating the influence of low-viscosity gaseous media on integral pressure decay leak-test results.
To facilitate industrial implementation, a preliminary calculation procedure for a viscosity-based correction factor (Cµ) can be derived directly from the Hagen−Poiseuille relationship. Assuming the leak path geometry and testing pressures remain constant, and the flow is strictly in the laminar viscous regime (Kn << 0.01), the predicted operational leak rate (qn,predicted) can be estimated using the following preliminary equation:
where µtest is the dynamic viscosity of the gas used during the leak test, and µoperating is the dynamic viscosity of the intended alternative testing gas. For instance, if an existing pipeline is tested with standard nitrogen µ ≈ 1.76 × 10⁻⁵ Pa·s but is intended to operate with pure hydrogen (µ ≈ 0.89 × 10⁻⁵ Pa·s), the preliminary correction factor is approximately 1.98. This means the actual operational hydrogen leak rate will be roughly double the measured nitrogen leak rate. While this simple linear correction provides a critical baseline safety margin for industrial practitioners, it should be treated as a first-order engineering approximation. As demonstrated by the short-capillary data in this study, future standardized procedures must eventually incorporate secondary corrections for minor aerodynamic losses and specific defect morphologies.
5. Conclusions
The presented study experimentally quantified the effect of the physical properties of various testing gases on determining the integral leak rate value (qn) of polyethylene pipe assemblies made of PE100RC material. Using the pressure decay method, applied at a test pressure of 5000 Pa and a measurement time of 900 s, leaks through calibrated capillary defects (0.13 mm diameter) were analyzed for five gaseous media: nitrogen, air, argon, carbon dioxide, and propane−butane.
The core novelty of this research lies in the empirical and theoretical demonstration that the conventional industrial assumption of universal interchangeability among inert testing gases—as currently permitted by standards such as EN 12327—is fundamentally inaccurate for continuous viscous flow regimes. By isolating the fluid dynamics across five distinct media, the findings reveal that leak rates through macroscopic defects are strictly dictated by the dynamic viscosity of the testing medium rather than its molar mass. Specifically, utilizing a low-viscosity medium like a propane−butane mixture yields an increase in the volumetric leak rate of up to 129% compared to standard nitrogen under identical geometric and pressure boundaries.
From a practical and industrial applicability perspective, these insights are highly critical for the impending transition of natural gas infrastructure toward alternative, low-viscosity fuels such as pure hydrogen (H2) or hydrogen-blended natural gas. If a pipeline network is certified as “tight” using standard high-viscosity nitrogen or air, the pneumatic test will inherently and dangerously underestimate the true operational leakage of a low-viscosity fuel. To mitigate the risk of false-positive tightness certifications and enhance operational safety, this research strongly advocates for the integration of viscosity-based mathematical correction factors directly into industrial testing protocols and future updates of non-destructive testing standards.
Despite the clear trends established, certain methodological limitations of this study must be acknowledged to guide future research contributions. First, due to laboratory safety constraints and explosion hazards, pure hydrogen was not physically tested, and the hydrogen-related implications are based on the theoretical extrapolation of the verified Hagen−Poiseuille model via the low-viscosity surrogate gas. Second, the experimental trials utilized smooth-bore circular capillaries, which represent an idealization; real-world defects in polyethylene welds (e.g., micro-cracks, pores, or tortuous leak paths) feature rough boundaries where viscous friction losses might be even more pronounced. Finally, the short measurement timeframe (900 s) and low pressure (5000 Pa) focused strictly on continuous macro-leaks, meaning that long-term phenomena, such as gas permeation directly through the intact PE100RC polymer matrix, were outside the scope of this evaluation. Future research paths will focus on validating these viscosity correction factors using actual hydrogen blends under high-pressure operating conditions on reeled rough defects.
Author Contributions
Conceptualization, R.K. and L.G.; methodology, M.M. and L.G.; validation, R.K. and M.M.; formal analysis, M.M. and L.G.; investigation, L.G.; writing—original draft preparation, L.G. and R.K.; writing—review and editing, M.M.; funding acquisition, M.M. All authors have read and agreed to the published version of the manuscript.
Funding
The research was funded by the Slovak agency KEGA [grant number KEGA 018ŽU-4/2025] and the Slovak agency VEGA [grant number VEGA 1/0181/26], and this work was supported by the Slovakia Program (Project code ITMS2021+: 401101C504).
Institutional Review Board Statement
Not applicable.
Informed Consent Statement
Not applicable.
Data Availability Statement
The datasets generated and analyzed during the current study are available in the Zenodo repository: https://doi.org/10.5281/zenodo.20582921.
Acknowledgments
During the preparation of this manuscript, the authors used Gemini 3.1 Pro for the sole purpose of translating the original text into academic English and for stylistic language editing. The authors have thoroughly reviewed and edited the output, verified all scientific data and figures, and take full responsibility for the final content of this publication.
Conflicts of Interest
Author Lucia Grünermelová was employed by the company TÜV SÜD Slovakia s.r.o. The remaining authors declare that the re-search was con-ducted in the absence of any commercial or financial relationships that could be construed as a potential conflict of interest.
Abbreviations
The following abbreviations are used in this manuscript:
| A/D | Analog-to-digital |
| ASME | American Society of Mechanical Engineers |
| CAD | Computer-aided design |
| GUM | Guide to the Expression of Uncertainty in Measurement |
| Kn | Knudsen number |
| NIST | National Institute of Standards and Technology |
| PB | Propane−butane |
| PE | Polyethylene |
| PTFE | Polytetrafluoroethylene |
| SCG | Slow crack growth |
| SDR | Standard dimension ratio |
References
- EN 1779:1999+A1:2003; Non-Destructive Testing—Leak Testing—Criteria for Method and Technique Selection. CEN: Brussels, Belgium, 2003.
- EN 13184:2001+A1:2003; Non-Destructive Testing—Leak Testing—Pressure Change Method. CEN: Brussels, Belgium, 2003.
- EN 12327:2013; Gas Infrastructure—Pressure Testing, Commissioning and Decommissioning Procedures—Functional Requirements. CEN: Brussels, Belgium, 2013.
- TPP 704 01; Natural Gas Installations in Buildings. SPNZ: Bratislava, Slovakia, 2009.
- Hormaza Mejia, A.; Brouwer, J.; MacKinnon, M. Hydrogen leaks at the same rate as natural gas in typical low-pressure gas infrastructure. Int. J. Hydrogen Energy 2020, 45, 8810–8826. [Google Scholar] [CrossRef] [Scilit]
- Paglini, R.; Minuto, F.D.; Lanzini, A. Estimating Greenhouse Gas Emissions from Hydrogen-Blended Natural Gas Networks. Energies 2024, 17, 6369. [Google Scholar] [CrossRef] [Scilit]
- Passoni, F.; Ravida, A.; Valenti, G.; Denora, I.; Marano, C. Sealing performance of pipes and joints in pure hydrogen. J. Phys. Conf. Ser. 2025, 3143, 012086. [Google Scholar] [CrossRef] [Scilit]
- Gregorovičová, E.; Pospíšil, J. Hydrogen Safety in Energy Infrastructure: A Review. Energies 2025, 18, 5470. [Google Scholar] [CrossRef] [Scilit]
- Li, X.; Shao, P.; Wang, J.; Huang, L.; Dong, Z.; Zhong, F. Study on the permeability behaviour of hydrogen doped natural gas in polyethylene pipeline. J. Phys. Conf. Ser. 2024, 2713, 012001. [Google Scholar] [CrossRef] [Scilit]
- Garrison, A.J.; Gant, S. An Investigation into the Change in Leakage when Switching from Natural Gas to Hydrogen in the UK Gas Distribution Network. In Proceedings of the International Conference on Hydrogen Safety (ICHS 2021), Edinburgh, UK, 21–24 September 2021; pp. 1–12. [Google Scholar]
- Anheuer, D.; Schwarz, J.; Debera, P.; Heinrich, K.; Kutter, C.; Richter, M. Air Leakages at Microvalves: Pressure Decay Measurements and Extended Continuum Modelling of Knudsen Flows. Micromachines 2024, 15, 1263. [Google Scholar] [CrossRef] [Scilit] [PubMed]
- Khaing, M.M.; Chai, Y.; Asgarpour, S.; Yin, S. Retrofitting of Natural Gas Pipelines for Hydrogen Transport in Canada: A Technical Feasibility Study. Clean. Technol. 2026, 8, 26. [Google Scholar] [CrossRef] [Scilit]
- Zhang, X.; Zhai, L.; Li, H.; Qi, G.; Gao, X.; Yang, W. Molecular Simulation Study on the Hydrogen Permeation Behavior and Mechanism of Common Polymers. Polymers 2024, 16, 953. [Google Scholar] [CrossRef] [Scilit] [PubMed]
- Melaina, M.W.; Antonia, O.; Penev, M. Blending Hydrogen into Natural Gas Pipeline Networks: A Review of Key Issues; Technical Report NREL/TP-5600-51995; National Renewable Energy Laboratory (NREL): Golden, CO, USA, 2013. [CrossRef] [Scilit]
- Mahajan, D.; Tan, K.; Venkatesh, T.; Kileti, P.; Clayton, C.R. Hydrogen Blending in Gas Pipeline Networks—A Review. Energies 2022, 15, 3582. [Google Scholar] [CrossRef] [Scilit]
- Xu, Z.; Guan, B.; Wei, L.; Chen, S.; Li, M.; Jiang, X. Investigation of Hydrogen-Blended Natural Gas Pipelines in Utility Tunnel Leakage and Development of an Accident Ventilation Strategy for the Worst Leakage Conditions. Appl. Sci. 2024, 14, 2667. [Google Scholar] [CrossRef] [Scilit]
- Pan, T.; Wang, X.; Li, F.; Yu, Z.; Liu, K.; Li, Z.; Yin, Z.; Hong, Z.; Hong, B. Numerical Investigation on Natural Gas Leakage and Diffusion from Buried Pipelines in Soil: Effects of Pipeline Parameters and Leakage Hole Characteristics. Appl. Sci. 2024, 14, 4731. [Google Scholar] [CrossRef] [Scilit]
- Jiang, Z.; Zhang, C.; Xu, Z.; Song, W. Gas Leak Detection and Leakage Rate Identification in Underground Utility Tunnels Using a Convolutional Recurrent Neural Network. Appl. Sci. 2025, 15, 8022. [Google Scholar] [CrossRef] [Scilit]
- Leybold. Fundamentals of Leak Detection. Available online: https://www.leybold.com/content/dam/brands/leybold/downloads/gated/Fundamentals-of-leak-detection-2024.pdf (accessed on 6 June 2026).
- Bouzid, A.H.; Aweimer, A.S. On the use of gas flow models to predict leak rates through sheet gasket materials. J. Press. Vessel Technol. 2019, 141, 051204. [Google Scholar] [CrossRef] [Scilit]
- Tison, S.A. Experimental data and theoretical modeling of gas flows through metal capillary leaks. Vacuum 1993, 44, 1171–1175. [Google Scholar] [CrossRef] [Scilit]
- Gacek, Z. Leakage testing of gas meters designed for measuring hydrogen-containing gas mixtures and pure hydrogen. Energies 2025, 18, 4207. [Google Scholar] [CrossRef] [Scilit]
- Kandula, M.; Nufer, B.M. On the Equivalence of Gas and Liquid Leak Flow Rates for Application to Propulsion and Propellant Transfer Systems. In Proceedings of the AIAA SCITECH 2024 Forum, Orlando, FL, USA, 8–12 January 2024. [Google Scholar] [CrossRef] [Scilit]
- Sensor, F. Mass Flow Versus Volumetric Flow. Available online: https://www.first-sensor.com/cms/upload/appnotes/AN_Massflow_E_11153.pdf (accessed on 6 June 2026).
- Gimelshein, S.; Markelov, G.; Lilly, T.C.; Selden, N.; Ketsdever, A.D. Experimental and Numerical Modeling of Rarefied Gas Flows Through Orifices and Short Tubes. AIP Conf. Proc. 2005, 762, 437–443. [Google Scholar] [CrossRef] [Scilit]
- Lin, T.; Wang, Z.; Hu, B.; Ji, Y.; Liang, X. Simulation and experimental study of buried natural gas pipeline leak detection based on sound source characteristics. Therm. Sci. 2024, 28, 101–113. [Google Scholar] [CrossRef] [Scilit]
- Li, J.; Xie, B.; Gong, L. Numerical Research on Leakage Characteristics of Pure Hydrogen/Hydrogen-Blended Natural Gas in Medium- and Low-Pressure Buried Pipelines. Energies 2024, 17, 2951. [Google Scholar] [CrossRef] [Scilit]
- ISO/IEC Guide 98-3:2008; Uncertainty of Measurement Part 3: Guide to the Expression of Uncertainty in Measurement (GUM:1995). ISO: Geneva, Switzerland, 2008.
- Kelemenová, T.; Kelemen, M. Uncertainty of Temperature Measurement in Working Environment. Acta Mech. Slovaca 2019, 23, 20–23. [Google Scholar] [CrossRef] [Scilit]
- Kollár, L.E.; Lucas, G.P.; Meng, Y. Reconstruction of velocity profiles in axisymmetric and asymmetric flows using an electromagnetic flow meter. Meas. Sci. Technol. 2015, 26, 055301. [Google Scholar] [CrossRef] [Scilit]

Disclaimer/Publisher’s Note: The statements, opinions and data contained in all publications are solely those of the individual author(s) and contributor(s) and not of MDPI and/or the editor(s). MDPI and/or the editor(s) disclaim responsibility for any injury to people or property resulting from any ideas, methods, instructions or products referred to in the content. |
© 2026 by the authors. Licensee MDPI, Basel, Switzerland. This article is an open access article distributed under the terms and conditions of the Creative Commons Attribution (CC BY) license.