


Abstract
Historic stone-built heritage is continually exposed to environmental stressors that promote material degradation and surface alteration, often in spatially heterogeneous ways. Rapid, non-destructive diagnostic tools capable of capturing both spectral and spatial information are therefore essential to support preventive conservation strategies. In this study, short-wave infrared hyperspectral imaging (SWIR-HSI), combined with chemometric analysis, three-dimensional (3D) visualisation, and complementary spectroscopic techniques, is investigated as an integrated framework for assessing the conservation state of historical stonework. A field campaign was conducted at the 15th- to 17th-century San Emeterio and San Celedonio Church (Larrabetzu, Spain), a sandstone structure exposed to environmental pollution and adverse conditions. SWIR hyperspectral images (1000–2500 nm) were acquired in situ and analysed using Principal Component Analysis (PCA) and K-Means clustering to explore spectral variability and segment the façade into spectrally homogeneous regions. The resulting chemometric outputs were projected onto a photogrammetry-based 3D RGB model, enabling volumetric visualisation of material heterogeneity and surface alteration patterns. To support the interpretation of hyperspectral features, selected regions were further analysed using X-ray fluorescence (XRF) and Raman spectroscopy. The proposed 3D-SWIR approach enhances the interpretability of hyperspectral data by embedding it within its architectural context and linking spectral variability to underlying physicochemical processes. This integrated methodology demonstrates strong potential as a non-destructive diagnostic and decision-support tool for assessing, monitoring, and conserving cultural heritage stone structures.
1. Introduction
Historic stone-built heritage is continually exposed to environmental stressors, including atmospheric pollution, moisture, salt crystallisation, and biological colonisation, which can lead to progressive material degradation and loss of cultural value [1,2,3]. These processes are often spatially heterogeneous and evolve over long time scales, making their early detection and systematic monitoring particularly challenging [4]. Reliable, non-destructive diagnostic tools are therefore essential to support preventive conservation strategies and informed decision-making in heritage management [5].
In this context, advanced imaging techniques have become increasingly relevant, as they enable spatially resolved characterisation of materials and surface conditions without physical intervention [6]. Hyperspectral imaging (HSI) [7], particularly short-wave infrared hyperspectral imaging (SWIR-HSI), is well suited to heritage applications due to its sensitivity to molecular vibrations associated with minerals, alteration products, and surface deposits [8,9]. By acquiring a full reflectance spectrum at each pixel, SWIR-HSI enables the combined analysis of spectral and spatial information, facilitating the identification of material heterogeneities, weathering patterns, and surface alterations across large areas [10,11,12,13].
The complex structure of hyperspectral data, however, requires appropriate multivariate data analysis techniques to extract meaningful information. Chemometric methods such as Principal Component Analysis (PCA) and unsupervised clustering algorithms have proven effective for exploratory analysis, dimensionality reduction, and segmentation of hyperspectral datasets, enabling the interpretation of subtle spectral variations related to material composition or surface condition [14]. These approaches are particularly valuable in heritage contexts, where prior knowledge is often limited and invasive validation must be minimised [15].
However, while hyperspectral imaging provides detailed spatial information on spectral variability, its interpretation in terms of specific material composition or degradation mechanisms often remains indirect. For this reason, complementary analytical techniques such as X-ray fluorescence (XRF) and Raman spectroscopy are frequently employed as reference methods, providing elemental and molecular information that supports the assignment of hyperspectral features to underlying chemical processes [16,17]. The combination of spatially resolved imaging and targeted point-based measurements offers a powerful strategy for linking spectral patterns to material composition and for improving the reliability of non-destructive diagnostics in heritage studies.
Beyond two-dimensional surface mapping, integrating analytical imaging results into three-dimensional (3D) representations of heritage assets has attracted increasing attention to improve the spatial interpretation of complex surfaces [18]. Three-dimensional models provide geometric and architectural context that complements spectroscopic and chemometric analyses, thereby enabling visualisation of analytical information directly on the object surface. This integrated representation facilitates the interpretation of spatial patterns, supports interdisciplinary communication, and contributes to a more comprehensive understanding of material heterogeneity and surface alteration processes in historical structures [19].
Despite the aforementioned advantages, the integration of SWIR-HSI and chemometric results into 3D environments remains relatively limited, particularly in in situ studies of built heritage. One of the main challenges lies in the differing acquisition principles of the imaging modalities involved: RGB images are typically acquired using matrix sensors, whereas SWIR-HSI systems commonly rely on linear (push-broom) sensors [20]. These differences complicate the direct co-registration and fusion of spectral and geometric information, especially under field conditions where acquisition geometry, illumination, and surface accessibility are constrained. Consequently, robust and reproducible workflows for embedding SWIR-HSI and chemometric information into photogrammetric 3D models remain scarce, underscoring the need for integrated strategies that bridge analytical imaging and geometric documentation.
Within this framework, the present study explores the combined use of SWIR-HSI, chemometrics, and 3D visualisation as an integrated approach for the non-destructive assessment of spatially heterogeneous degradation patterns on historical stone surfaces. The proposed methodology is demonstrated through an in-situ field campaign conducted at the San Emeterio and San Celedonio Church, a 15th- to 17th-century sandstone building (with remnants of a Romanesque façade, followed by a Gothic structure, and culminating in Renaissance architecture) of recognised cultural and architectural significance.
2. Materials and Methods
2.1. Case Study: San Emeterio and San Celedonio Church
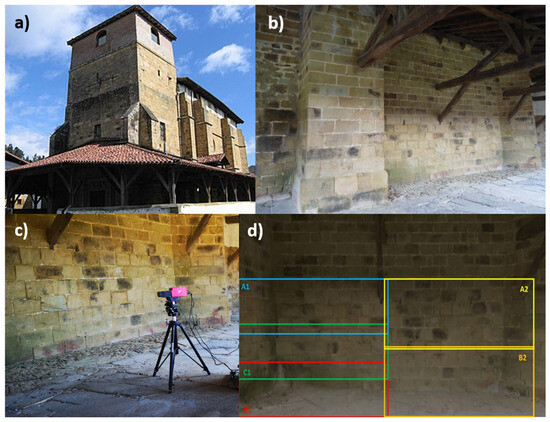
San Emeterio and San Celedonio Church (43°16′01″ N 2°46′59″ O) is a small 17th-century religious building located in Larrabetzu (Spain). The structure is primarily constructed of sandstone and features an external portico supported by wooden posts, which partially encloses the building (Figure 1a,b). Due to its architectural configuration and orientation, the portico walls are particularly exposed to environmental stressors, including high humidity, airborne pollutants, and saline aerosols, which accelerate stone degradation.
Figure 1.
(a) External view of the San Emeterio y San Celedonio Church (left). (b) The external portico object of this study. (c) Measurements with the SWIR-HSI camera. (d) Details of the 5 scanned areas. (Image source: (a) https://es.wikipedia.org/wiki/Iglesia_de_San_Emeterio_y_San_Celedonio_(Larrabez%C3%BAa) (accessed on 25 May 2026).) (b–d) Right: Private source.
Visible signs of surface alteration from the original sandstone that can be found in the surroundings of the architectural place, loss of the original colour, and heterogeneity motivated the selection of this site as a representative case study to evaluate non-destructive imaging-based approaches for material assessment and degradation mapping.
2.2. SWIR-HSI Data Acquisition
Hyperspectral data were acquired using a HySpex (Norsk Elektro Optikk—NEO, Oslo, Norway) short-wave infrared hyperspectral imaging system (SWIR-HSI), covering the spectral range from 1000 to 2500 nm. The sensor was mounted on a tripod equipped with a rotational stage to ensure stable and controlled acquisition geometry during the field campaign.
The hyperspectral camera was positioned approximately 1 m from the wall surface, covering a façade section of approximately 1.5 m through a total angular rotation of 25°. Illumination was provided by two 500 W halogen lamps placed at the same height and distance as the camera to ensure homogeneous lighting conditions. Since the field of view did not cover the entire façade, the camera and illumination system were sequentially displaced horizontally by approximately 1 m, enabling the acquisition of five partially overlapping wall sections (Figure 1d). The acquisition geometry was maintained as constant as possible throughout the field campaign to minimise illumination and perspective variability among scans. The overlap between adjacent acquisitions facilitated subsequent spatial registration and mosaicking, ensuring continuous spatial coverage of the analysed façade sections (Figure 1c,d). Under these conditions, the resulting spatial resolution was approximately 1 mm2 per pixel, which was considered sufficient to resolve local surface heterogeneity and alteration patterns relevant to heritage assessment.
Reflectance calibration panels of Spectralon were placed within the measurement area to enable radiometric calibration and to correct for illumination variability caused by environmental conditions, such as changing sunlight.
The acquisition strategy was adapted to the architectural constraints of the site, including surface orientation and accessibility, while maintaining sufficient spatial resolution to resolve local material heterogeneities and surface alterations. For clarity and subsequent interpretation, the five scanned wall sections were labelled A1, A2, B1, B2, and C1, as indicated in Figure 1d. These labels are consistently used throughout the manuscript to describe the spatial distribution of PCA features, K-Means clusters, and complementary spectroscopic measurements across the façade.
2.3. Data Preprocessing
The 5 hyperspectral images were analysed together. Raw spectra (over a million spectra) were first radiometrically calibrated using reflectance measurements from the calibration panels. This step corrected for illumination-related variability and ensured consistency across the different scanned sections. Before chemometric analysis, noisy spectral regions at the extremes of the SWIR range were removed to improve the signal-to-noise ratio, and the first derivative (Savitzky–Golay with a window of 13) was calculated for the spectra.
2.4. Chemometric Analysis
Principal Component Analysis (PCA) was applied as an exploratory tool to identify the dominant sources of spectral variance within the entire façade. PCA score images were reconstructed to visualise the spatial distribution of the principal components and to assess their potential relationship with material composition and surface condition, as inferred from the corresponding loading profiles.
The hyperspectral data cube X (X, Y, λ) was unfolded into a two-dimensional matrix X, where X × Y represents the number of pixels and λ the number of spectral variables (wavelengths). Before analysis, spectra were preprocessed using standard normal variate (SNV) correction followed by mean-centring.
Principal Component Analysis (PCA) was then applied to decompose the data matrix as:
where T contains the score vectors, P contains the loading vectors, and E represents the residual matrix. This decomposition enables identification of the dominant sources of spectral variance and their spatial distribution via score image reconstruction.
X = TP⊤ + E
The interpretation of score images was supported by inspection of the corresponding loading vectors, enabling the identification of spectral features contributing to each principal component. Due to the large volume of data, PCA was performed using the randomised SVD-based algorithm described in [21].
Unsupervised K-Means clustering was subsequently performed using the PCA scores to segment the façade into regions with similar spectral characteristics. Unsupervised K-Means clustering was applied to the spectral data to partition the pixels into k clusters by minimising the within-cluster variance. Formally, the algorithm aims to minimise:
where Ci represents the set of pixels assigned to cluster i, and μi is the centroid of cluster i. Euclidean distance was used as the similarity metric.
The resulting cluster maps were analysed to identify spatially coherent zones that may be associated with different materials, alteration states, or surface treatments. The number of clusters was selected empirically to balance spatial interpretability and spectral discrimination, avoiding both under-segmentation and over-fragmentation of the façade.
The partially overlapped results for the 5 scans were spatially aligned and assembled into continuous mosaics. Spatial registration between adjacent scans was performed using manually selected corresponding points extracted from pseudo-RGB representations of the PCA scores images. A projective geometric transformation was estimated to compensate for perspective distortions and slight variations in acquisition geometry. The resulting transformation matrices were subsequently applied to the individual responses (either PCA score surfaces or K-Means). The final stitched images were visually inspected to ensure spatial continuity and consistency across overlapping regions and to be inserted into the 3D reconstruction.
Spectral preprocessing, PCA, K-Means clustering and the stitching procedures were carried out using HYPER-Tools (HYPER-Tools v.3. https://www.hypertools.org/ (accessed on 24 May 2026 [22]) and in-house routines working under MATLAB (MATLAB version 2024b; The MathWorks, Natick, MA, USA).
2.5. 3D Reconstruction and Volumetric Integration of Hyperspectral Results
A three-dimensional (3D) surface model of the analysed façade was generated to provide a geometrically accurate spatial framework for integrating and visualising hyperspectral and chemometric results.
The 3D reconstruction was based on high-resolution RGB images acquired in situ under controlled conditions to ensure homogeneous illumination, minimise shadows, and preserve surface texture quality. Image acquisition adhered to standard close-range photogrammetric principles, including high overlap between consecutive images, a fixed focal length, and constant camera settings throughout the acquisition sequence. The photogrammetric processing followed a conventional pipeline comprising (i) detection and matching of homologous features across overlapping images, (ii) generation of a sparse point cloud, (iii) densification of the point cloud, (iv) triangulation to produce a polygonal surface mesh, and (v) application of photorealistic texture derived from the RGB images. This workflow produced a detailed 3D representation of the wall surface, capturing both geometry and fine-scale textural features relevant to subsequent analytical interpretation.
The reconstructed 3D mesh was scaled using reference distances measured directly on the wall surface and visually identifiable architectural features, ensuring geometric consistency and preservation of real-world dimensions. Minor mesh-cleaning operations were performed in Blender to remove isolated artefacts while preserving the original surface geometry. K-Means outputs derived from the SWIR hyperspectral analysis were subsequently registered to the RGB imagery used for photogrammetric reconstruction and projected onto the 3D mesh using manually selected control points. Given the differing acquisition geometries of push-broom SWIR imaging and RGB photogrammetry, the registration process was intended to preserve spatial coherence at the façade scale rather than achieve pixel-level correspondence. Visual inspection confirmed satisfactory alignment between major architectural features and spectrally distinct regions across the reconstructed surface.
2.6. Complementary XRF and Raman Analysis
To support the interpretation of the spectral variability observed in the SWIR hyperspectral data and the chemometric segmentation results, complementary point-based analytical techniques were employed. X-ray fluorescence (XRF) and Raman spectroscopy were selected for their well-established ability to provide elemental and molecular information, respectively, in a non-destructive manner, making them particularly suitable for heritage applications. They were not intended to provide an exhaustive chemical characterisation of the façade, but rather to serve as reference measurements for interpreting the hyperspectral and chemometric results.
XRF measurements were carried out using a TRACER 5 g instrument (Bruker Corp., Billerica, MA, USA), equipped with a Rh thin-window X-ray tube (maximum voltage of 50 kV) and a large-area (20 mm2) silicon drift detector (SDD) with a graphene window.
Raman spectra were acquired using a BWTEK InnoRam spectrometer (BWTek, Newark, NJ, USA) operating at an excitation wavelength of 785 nm and equipped with a 5 m fibre-optic probe with a spot field of view of 200 μm.
3. Results
3.1. Exploratory Analysis by Principal Component Analysis
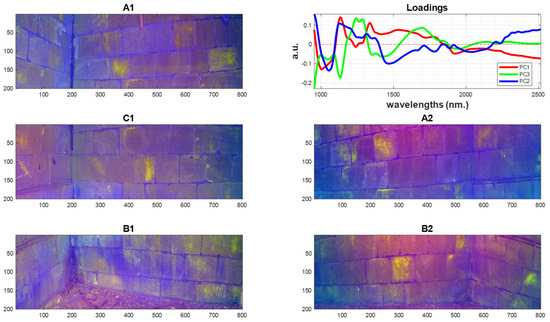
PCA was applied to the complete reconstructed façade of the church (Figure 2). In general terms, the first three PCs can be interpreted as reflecting a hierarchy of material composition and surface alteration processes across the wall. Composite RGB images constructed from the scores of PC1, PC2, and PC3 further enhanced the visualisation of these patterns (Figure 2). Distinct colour variations were observed across the wall sections, reflecting the combined influence of the main substrate and subtler spectral features. This representation proved useful for rapidly identifying areas that differ spectrally from the dominant stone matrix and may therefore warrant further investigation.
Figure 2.
False-colour composite image constructed from the first three principal components (PC1–PC3) obtained from the SWIR hyperspectral analysis of the church façade, where PC1, PC2, and PC3 are assigned to the red, green, and blue channels, respectively. The analysed façade comprises five partially overlapping wall sections labelled (A1,A2,B1,B2,C1) (see Figure 1d). Colour variations reflect differences in the dominant spectral contributions across the wall surface. The inset figure displays the loading profiles for PC1–PC3, highlighting the spectral regions that contribute most strongly to the observed spatial variability.
The first principal component (PC1), which accounts for the largest proportion of spectral variance (93%), is associated with the dominant sandstone matrix and its bulk optical behaviour. This extremely high value of explained variance, even after preprocessing and mean centring, indicates that the dominant source of variability remains highly structured and common across the façade, since it is largely composed of the same quartz-rich sandstone material (siliciclastic sandstone).
In contrast, the second principal component, PC2, which accounts for 3% of the explained variance, captures more localised spectral variability plausibly associated with moisture-related alteration processes. In the SWIR region, absorptions near 1400 and 1900 nm are characteristic of water and hydroxyl-related species, including hydrated minerals and hygroscopic salts. The spatial distribution of the PC2 scores suggests that these processes are concentrated in environmentally exposed regions of the façade.
PC3 (1% of the explained variance) highlights subtler spectral variations associated with surface-specific phenomena, particularly those related to biological colonisation and organic deposits. Organic compounds, including pigments produced by microorganisms, exhibit characteristic absorption features in the SWIR region linked to C–H bonds and other molecular vibrations. PC3 may reflect spectral variability associated with biologically influenced surface regions. Areas with high PC3 contributions may therefore be associated with biofilm formation, microbial colonisation, or the accumulation of organic residues, typically occurring in zones where moisture and environmental conditions favour biological growth.
3.2. Unsupervised Segmentation by K-Means Clustering
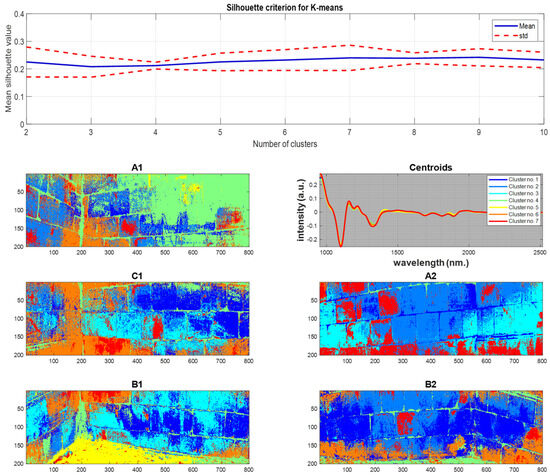
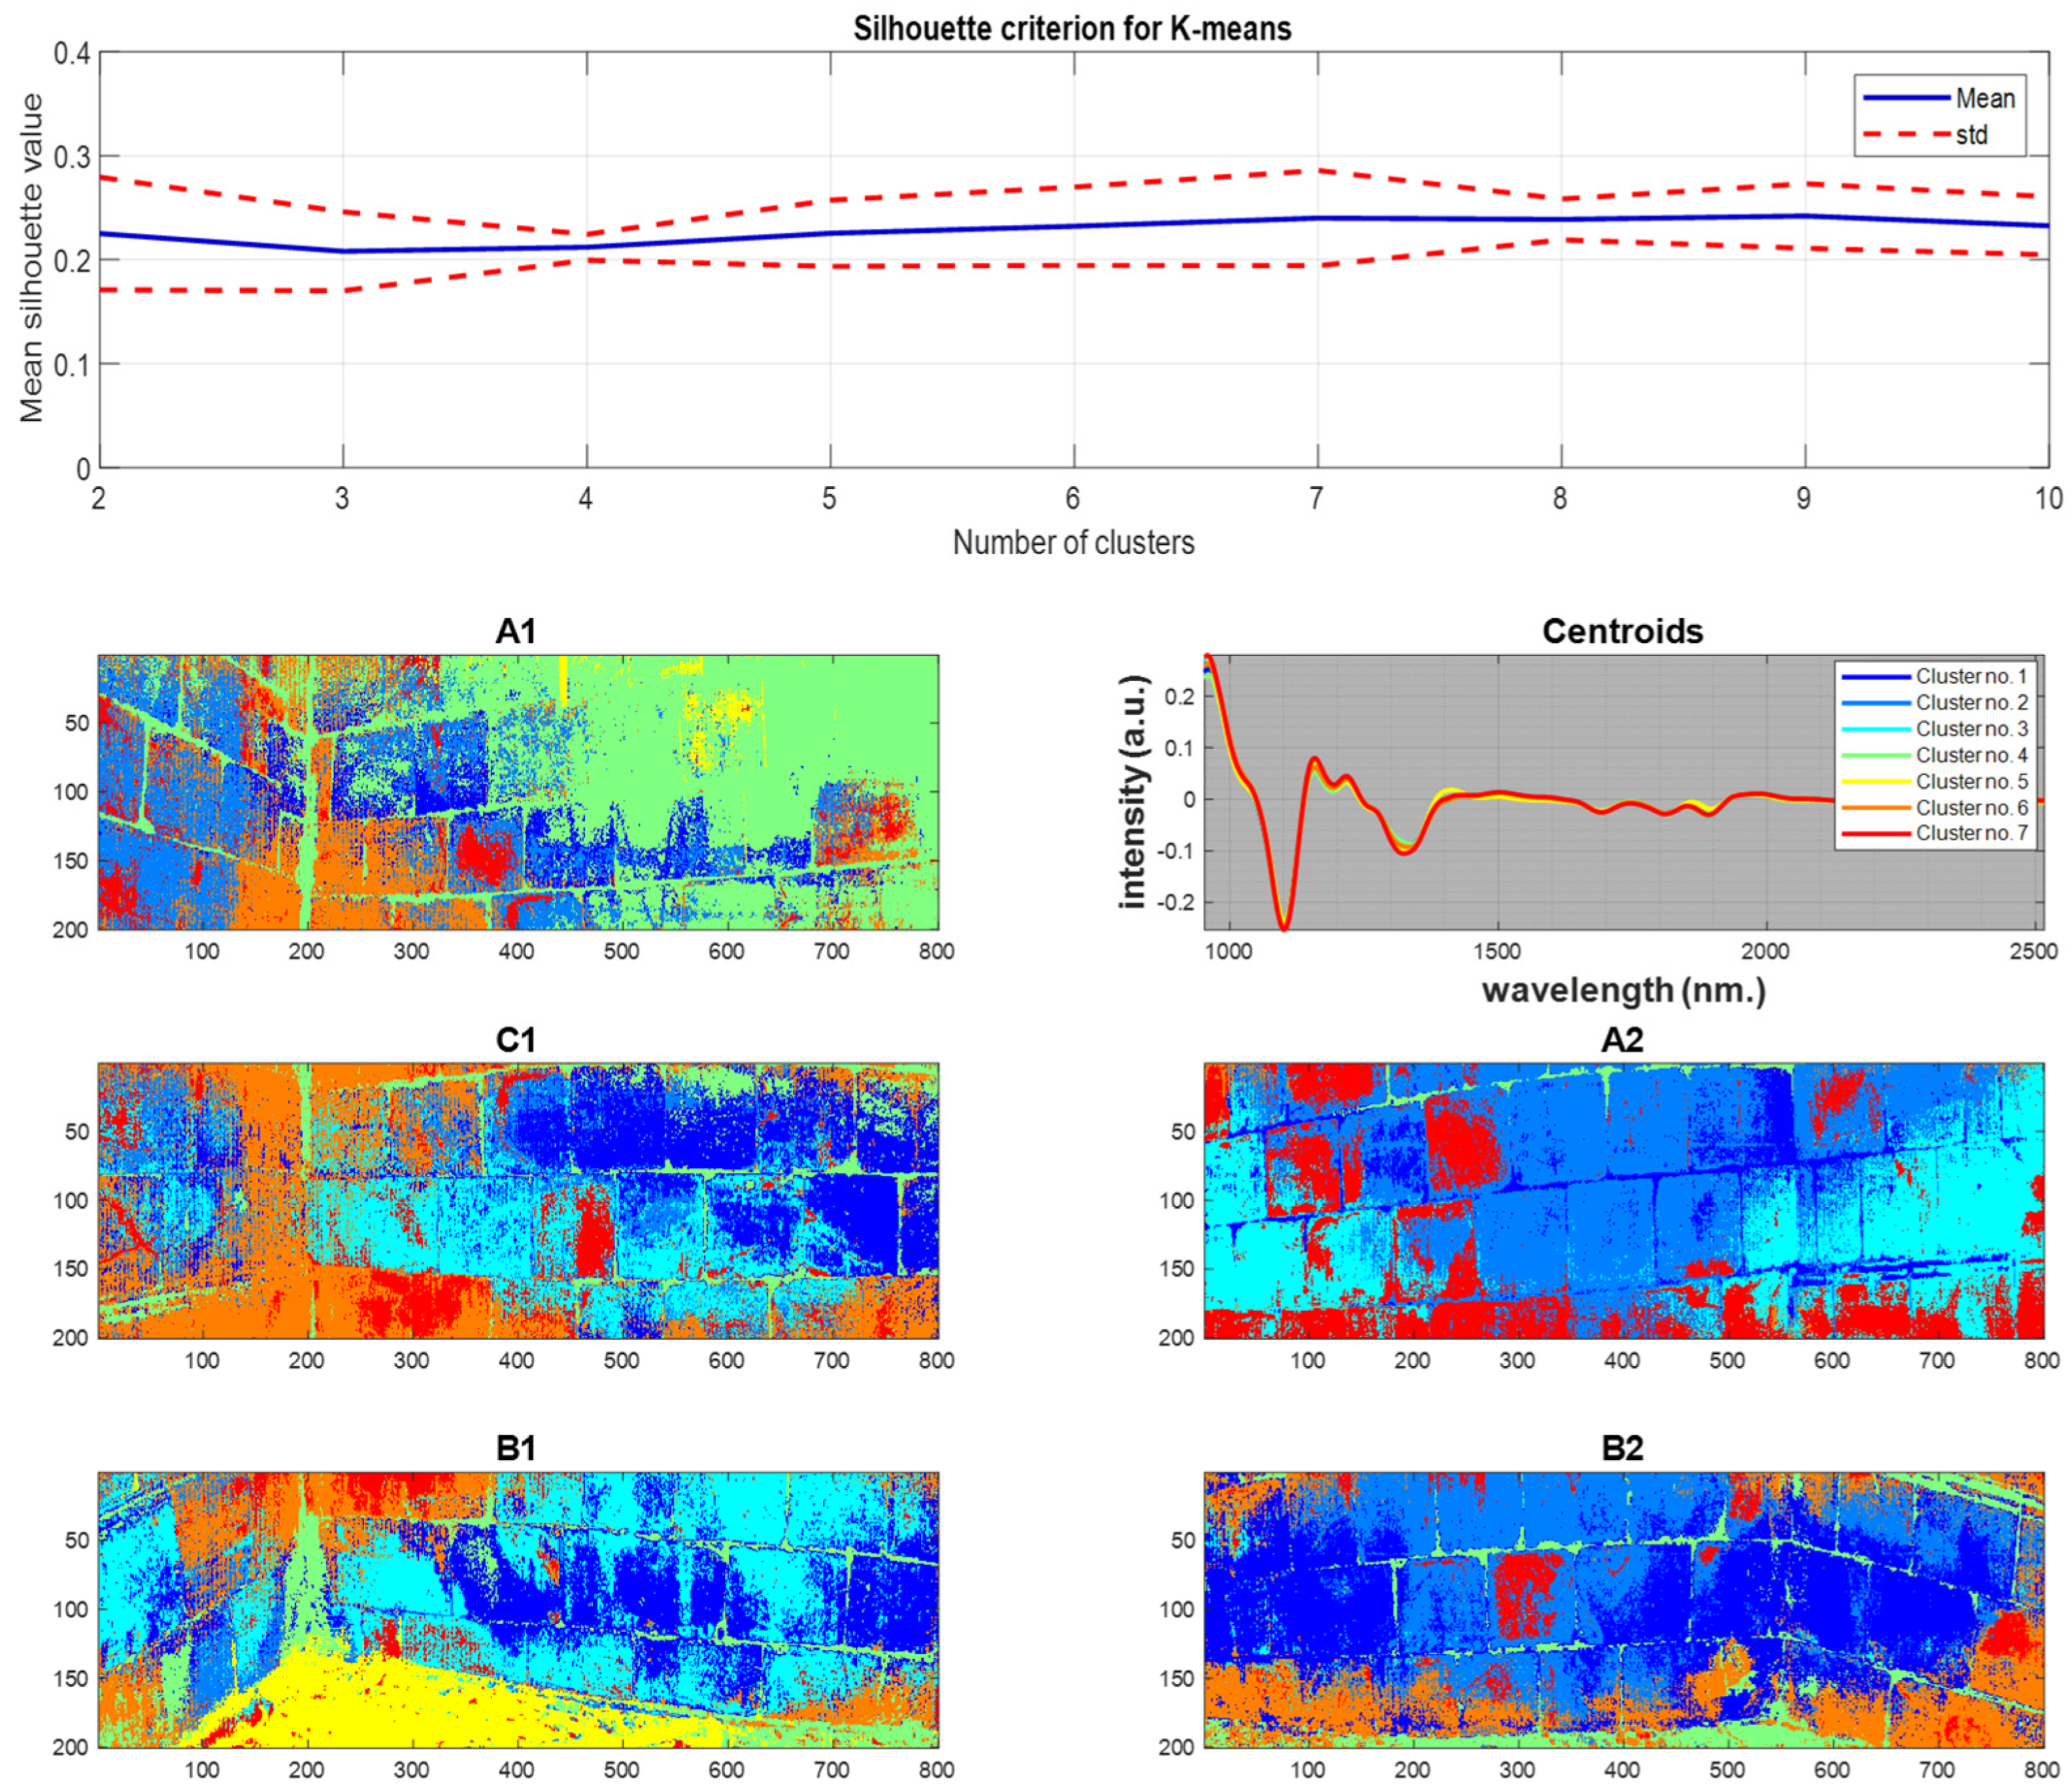
To complement the exploratory PCA and provide a more explicit segmentation of the wall surfaces, K-Means clustering was applied to the hyperspectral data (Figure 3). To support the selection of the number of clusters used in the K-means analysis, silhouette analysis was performed for different K values using repeated randomisation experiments (Figure 3, Top). The average silhouette values obtained were relatively moderate and showed limited variation across a broad range of cluster numbers. This behaviour suggests that the spectral variability within the historical stone surface is characterised by gradual transitions and partially overlapping alteration patterns rather than by strictly separated classes. Although slightly higher silhouette values were observed for K values between 7 and 9, no single sharply dominant optimum was identified. Consequently, seven clusters were selected as a compromise between clustering compactness, spatial coherence, and chemically meaningful interpretation of the different surface alteration features.
Figure 3.
(Top): Mean silhouette criterion obtained for K-means clustering using different numbers of clusters (K = 2–10). The solid blue line represents the average silhouette value obtained across repeated randomisation experiments, while the dashed lines indicate the corresponding standard deviation interval. (Bottom): spatial distribution of the seven clusters obtained from K-Means segmentation of the SWIR hyperspectral data across the five façade sections (A1,A2,B1,B2,C1). Each colour corresponds to a spectrally distinct cluster identified from the PCA score space.
As we saw in the previous PCA model, the dataset is largely dominated by the common quartz-rich sandstone substrate. Consequently, the spectral variability associated with alteration processes represents comparatively subtle deviations from the dominant material composition. This strong covariance structure also affects the clustering behaviour of the dataset, as the separation between altered and non-altered regions is not governed by sharply distinct spectral classes but rather by gradual physicochemical transitions.
Clusters that dominate large, spatially contiguous regions of the wall (Clusters 2 and 4) can be associated with the main sandstone substrate and are consistent with quartz-rich material and limited surface alteration. Their widespread distribution across all sections (A1, A2, B1, B2, and C1) suggests that they can be interpreted as the reference material of the wall and are consistent with the regions highlighted by PC1 in the PCA.
In contrast, several clusters appear preferentially in lower sections of the wall and in zones with clear signs of environmental exposure (Clusters 6 and 7). These clusters are particularly evident in the bottom areas of B1 and B2, as well as in portions of A2, where accumulation patterns are visible. Their spectral behaviour, together with their spatial localisation, suggests an association with increased moisture content and hydrated alteration products. In the SWIR region, strong absorptions near 1400 nm and 1900 nm are indicative of water and hydroxyl-related species, supporting the interpretation that these clusters correspond to areas affected by capillary moisture and salt crystallisation. These zones are consistent with active deterioration processes driven by repeated wetting–drying cycles.
Other clusters exhibit patchy and heterogeneous spatial distributions across the façade (Clusters 1 and 3), often appearing as intermediate regions between the dominant substrate (Clusters 2 and 4) and the more altered zones (Clusters 6 and 7). These clusters are particularly visible in transitional areas of A1 and C1, where the wall shows gradual changes in colour and texture. Their spectral profiles suggest partial modification of the stone surface, which may be attributed to early-stage weathering, deposition of airborne pollutants, or the initial formation of secondary mineral phases. These clusters likely represent intermediate degradation states, in which the original sandstone matrix remains dominant yet is already influenced by environmental processes.
A further subset of clusters can be plausibly linked to biologically influenced regions (Cluster 5). This cluster appears in more localised and structurally constrained areas, such as edges, joints between stones, or sheltered zones where moisture persists (e.g., parts of B1 and A1). Although its spectral signature is subtler than that of strongly altered clusters, its spatial distribution is consistent with conditions favourable to biological colonisation. In combination with Raman bands compatible with carotenoids, this cluster can be associated with biofilms, algae, or microbial growth, which introduce organic spectral features related to C–H vibrations in the SWIR region.
3.3. 3D-SWIR Volumetric Visualisation of Chemometric Results
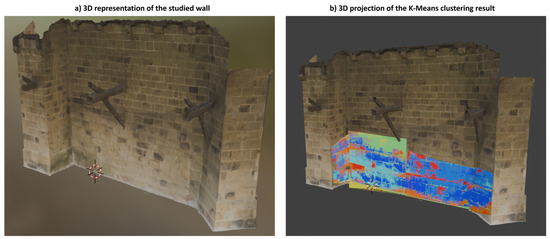
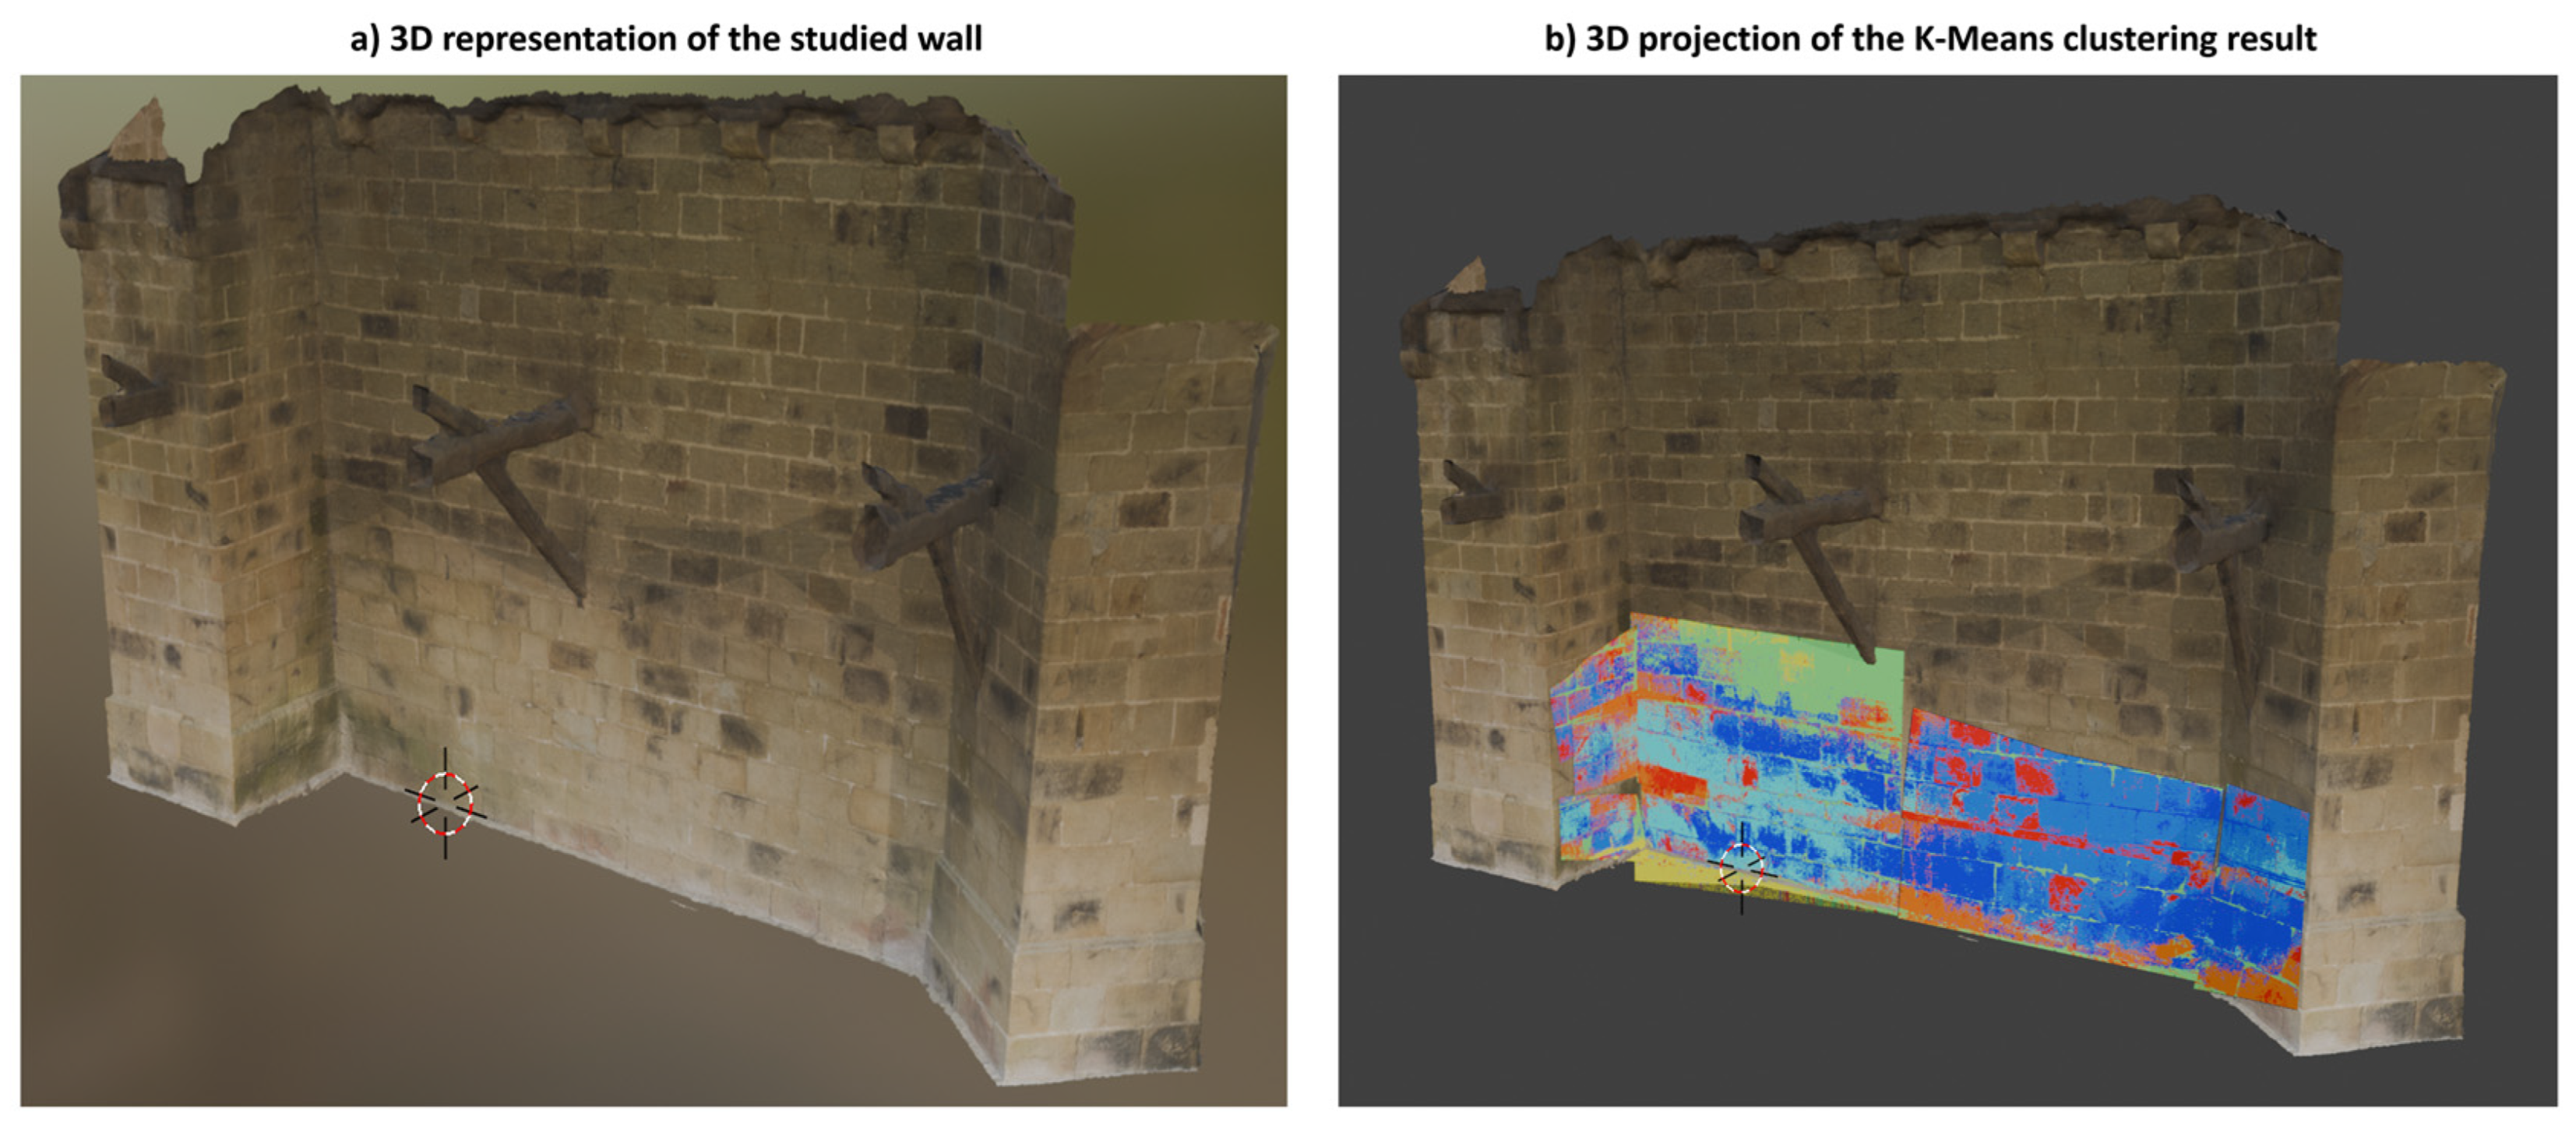
Projecting K-Means results onto the 3D model provided an enhanced visualisation of the spatial distribution of spectrally distinct regions across the church façade (Figure 4).
Figure 4.
Projection of the K-Means clustering results onto the photogrammetry-based 3D model of the church façade. The colour coding corresponds to the seven spectral clusters shown in Figure 3. The volumetric representation enables direct visualisation of the spatial relationship between spectral variability, architectural geometry, and surface exposure conditions.
Registration quality was evaluated using 50 manually selected homologous control points that were identifiable in both the K-Means results and the photogrammetric 3D model, including distinct features and singular surface points. The residual spatial discrepancy between corresponding points was used as an approximate measure of registration uncertainty. Taking into account the different spatial resolutions of the hyperspectral and 3D representations, the estimated spatial uncertainty was approximately 5 hyperspectral pixels, corresponding to approximately 3 mm on the stone surface. Although this level of accuracy was considered sufficient for interpreting centimetre-scale alteration patterns and degradation features, small local misalignments may still affect the precise spatial correspondence of fine surface details.
Regions identified as spectrally distinct in the two-dimensional analysis were consistently localised on the 3D surface, confirming the spatial coherence of the PCA and clustering results. The 3D visualisation further facilitated the identification of degradation patterns extending across multiple wall sections and highlighted areas where spectral variability coincides with specific exposure conditions or structural features.
3.4. Interpretation of Spectral Variability Using Complementary XRF and Raman Analysis
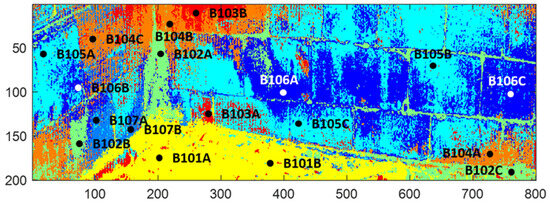
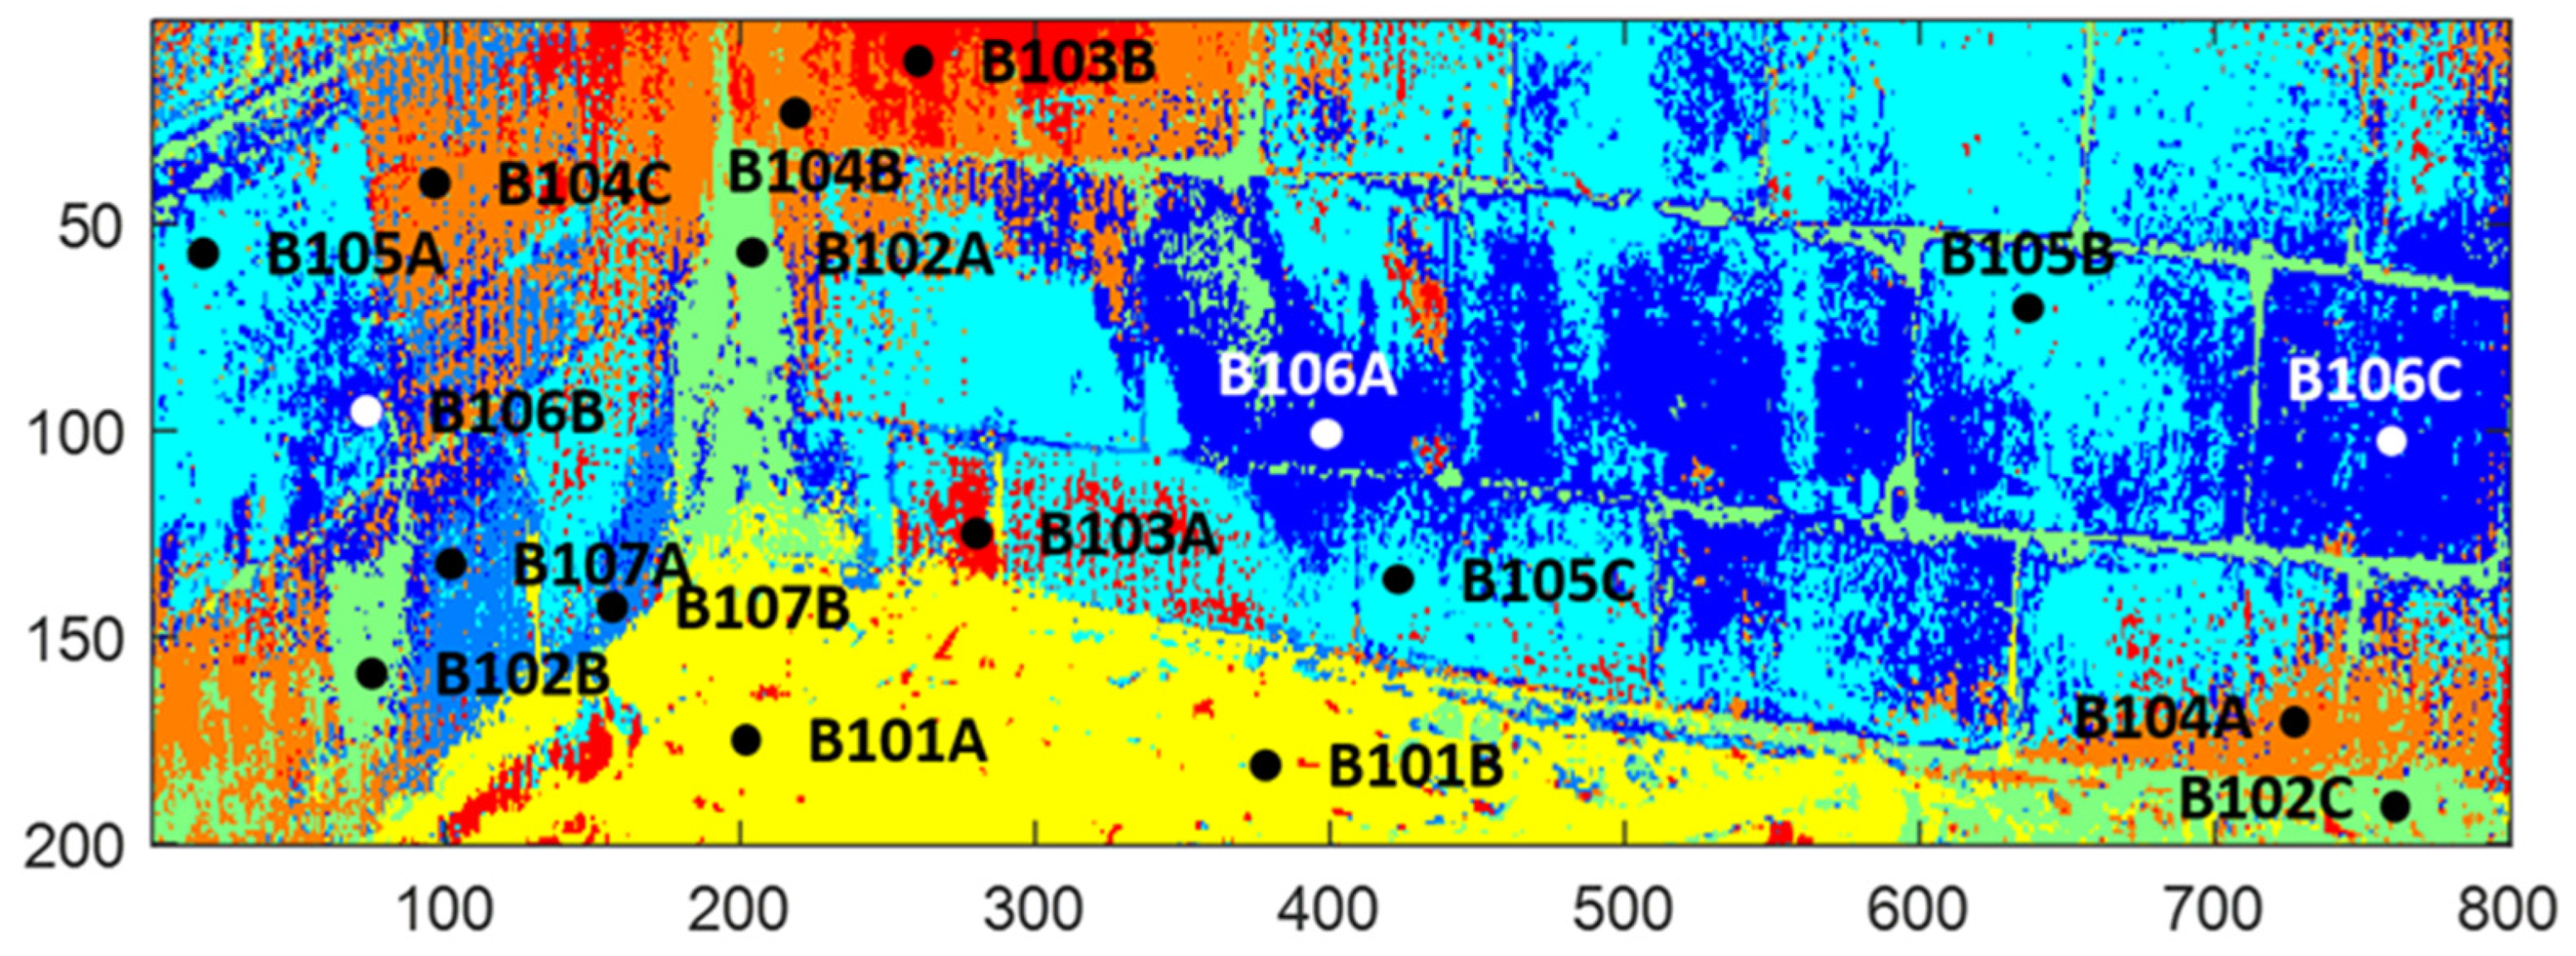
To further support the interpretation of the spectral variability observed in the SWIR hyperspectral data, complementary XRF and Raman spectroscopy measurements were performed on selected regions of the façade (Figure 5). The analysed regions were chosen to represent distinct spectral behaviours identified through PCA and K-Means clustering, including areas associated with the dominant sandstone substrate (Clusters 2 and 4), moisture-affected zones (Clusters 6 and 7), intermediate alteration regions (Clusters 1 and 3), and areas potentially influenced by biological activity (Cluster 5). This targeted approach enables a direct correlation between spatially resolved hyperspectral patterns and point-based chemical information.
Figure 5.
Selection of representative regions of interest (ROIs) on the façade for complementary XRF and Raman analysis.
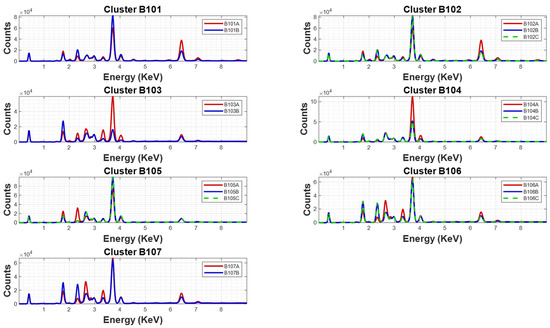
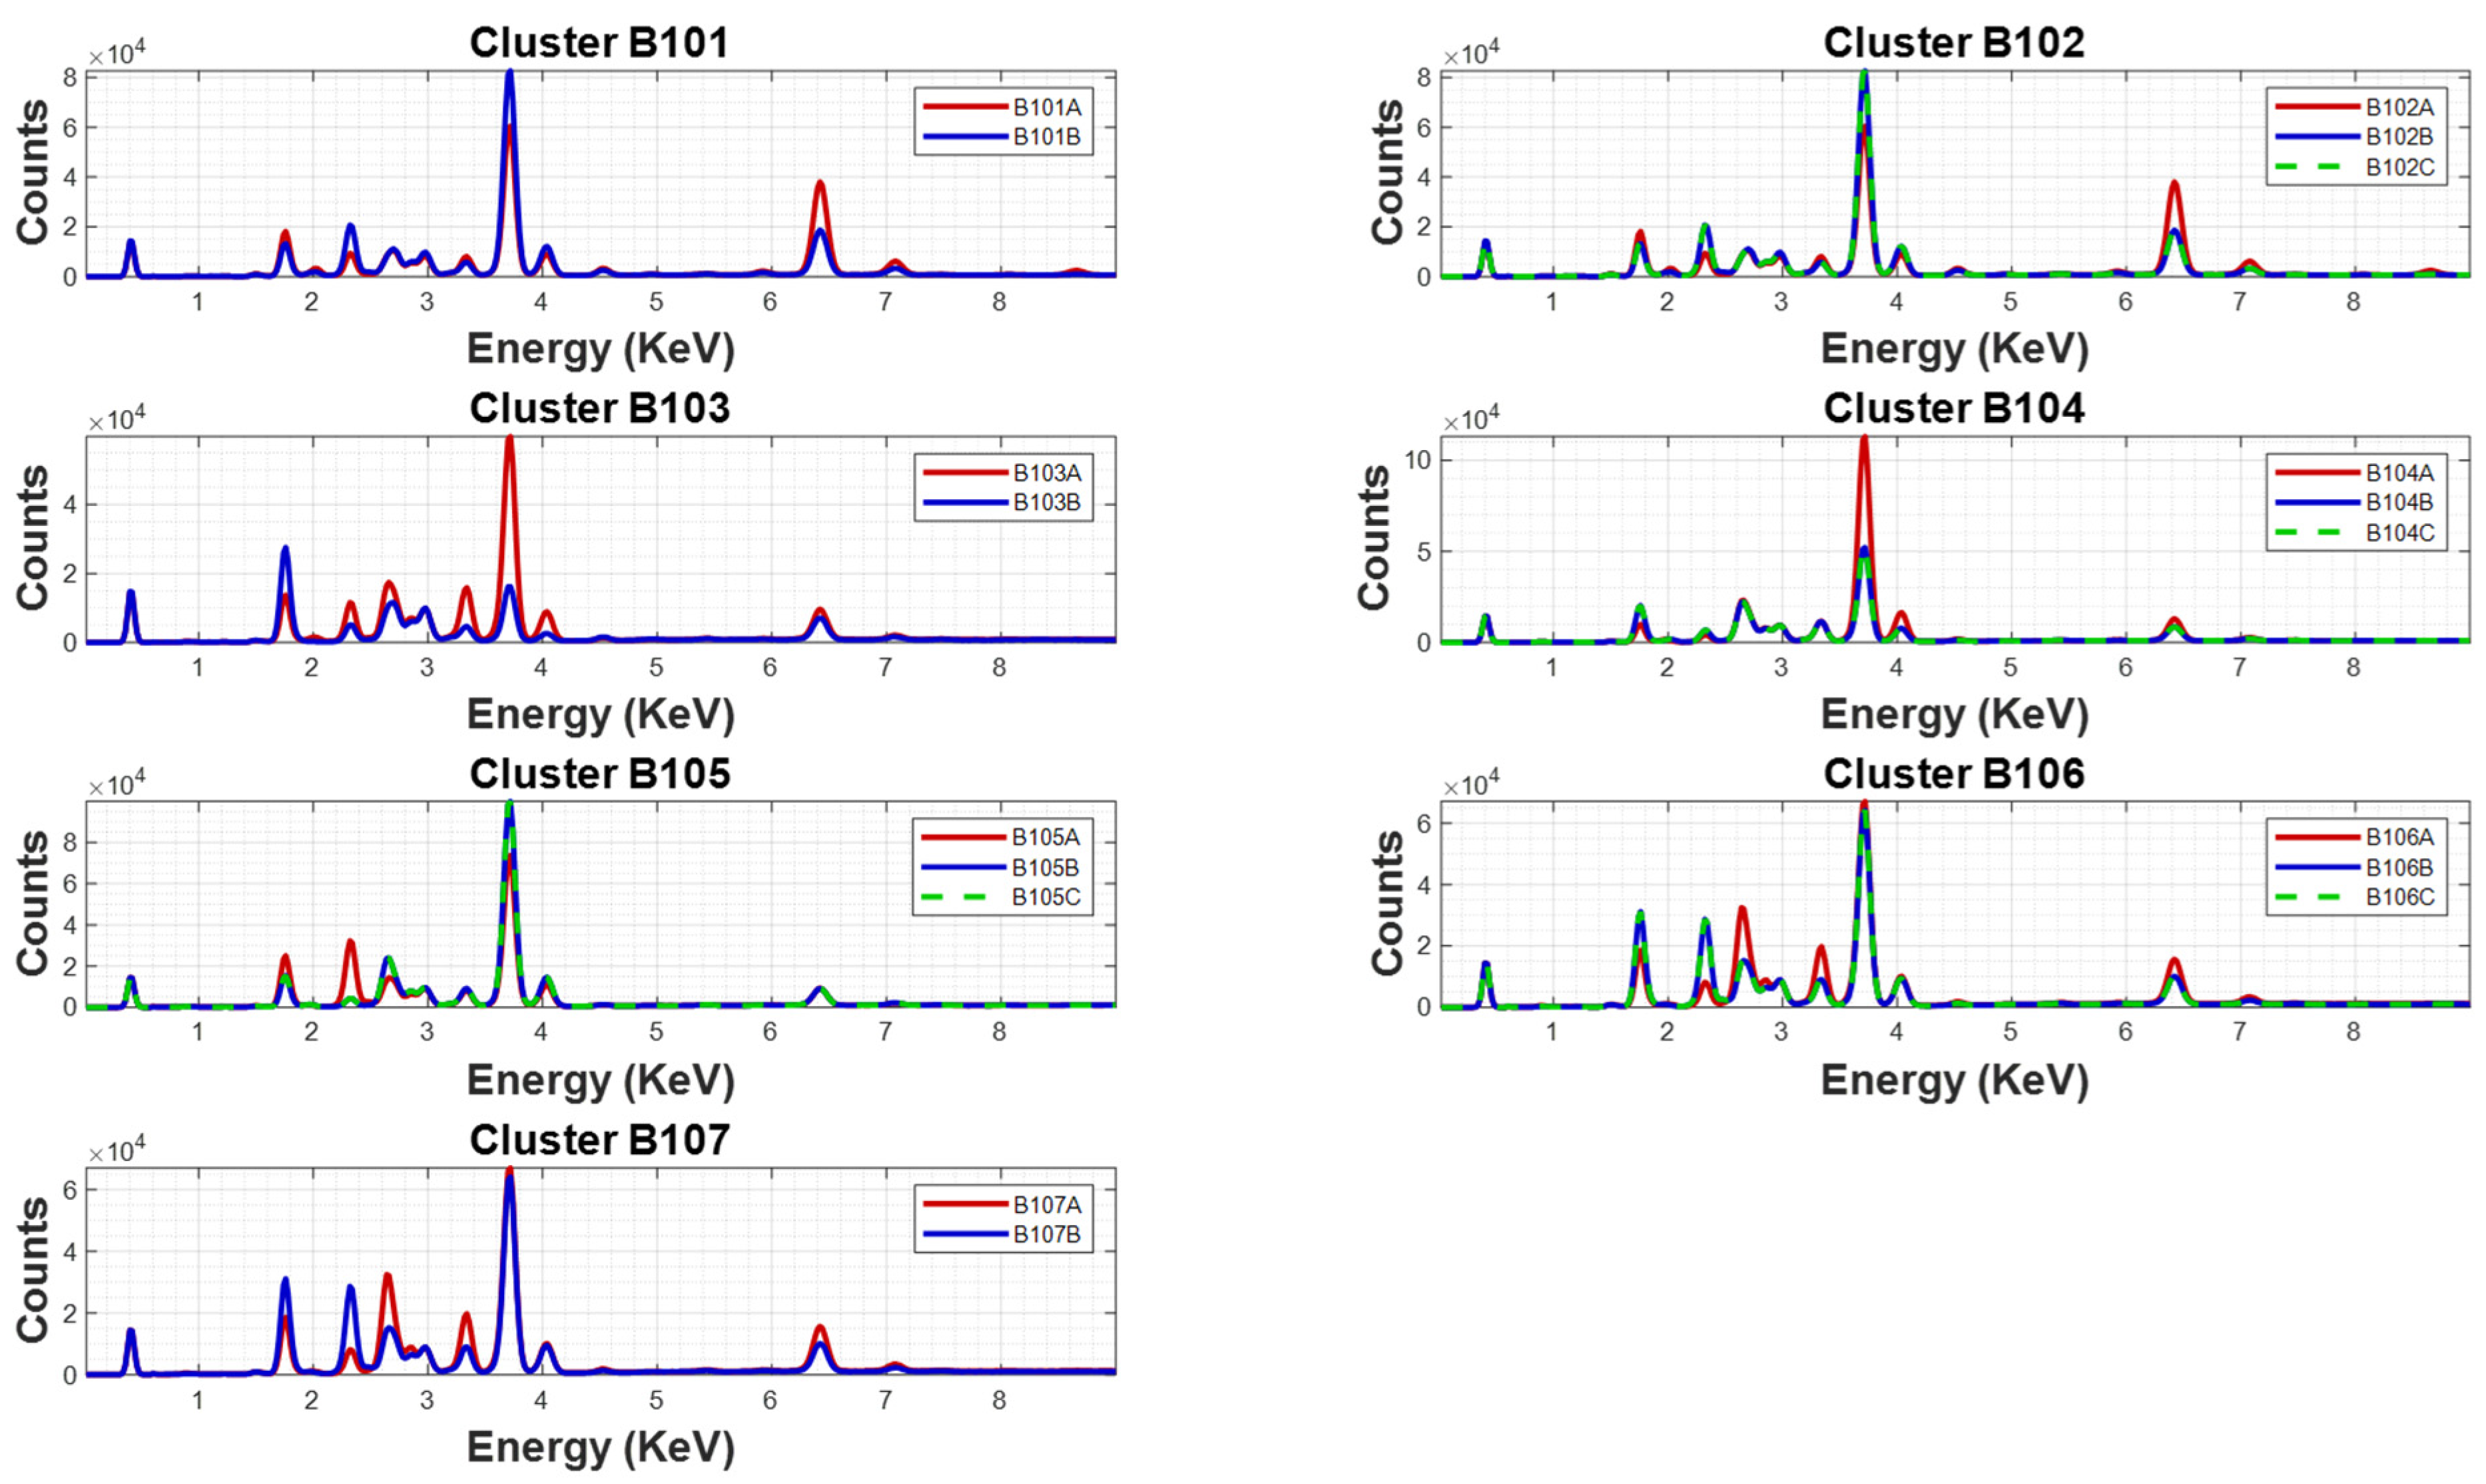
The XRF spectra (Figure 6) reveal that silicon (Si) is the dominant element across all analysed regions, confirming quartz (SiO2) and/or siliciclastic material as the principal constituent of the sandstone matrix. Calcium (Ca) is also consistently detected, with variable intensity across the sampled zones, indicating the presence of carbonate phases and/or secondary alteration products such as gypsum (CaSO4·2H2O). In addition, minor contributions from elements such as sulfur (S) and potassium (K) are observed in specific regions, suggesting sulfation and other plausible alteration products associated with atmospheric deposition.
Figure 6.
X-ray fluorescence (XRF) spectra acquired from representative regions of interest (ROIs) of the church façade. The colour of each spectrum corresponds to the colour of the associated ROI indicated in Figure 5, enabling direct visual correlation between the spectroscopic measurements and their spatial location on the wall surface.
Notably, regions associated with clusters indicative of moisture-related processes (Clusters 6 and 7) exhibit enhanced signals for calcium and sulfur, compatible with the presence of gypsum or other sulfate phases formed through interactions between the stone surface and polluted, humid environments. These findings are consistent with the hyperspectral interpretation of these clusters as areas affected by water ingress, salt crystallisation, and chemically driven weathering. The accumulation of such compounds is particularly expected in lower sections of the wall, where capillary rise and water retention promote the mobilisation and precipitation of soluble salts.
Raman spectroscopy (Figure 7) provides complementary molecular-level information that further refines the interpretation of the hyperspectral clusters. The Raman spectra are consistent with the presence of quartz as the dominant mineral phase in regions corresponding to the main substrate (Clusters 2 and 4), with characteristic bands associated with Si–O vibrations. In addition to quartz, calcium carbonate (CaCO3) is detected in several regions, indicating either original mineralogical components or secondary deposition processes. The presence of gypsum is also identified in specific areas, particularly those associated with moisture-related clusters (Clusters 6 and 7), reinforcing the interpretation of these zones as chemically altered and environmentally impacted.
Figure 7.
Raman spectra acquired from representative ROIs of the church façade. The colour of each spectrum corresponds to the colour of the associated ROI shown in Figure 5, facilitating the relationship between the Raman measurements and their spatial distribution on the façade.
Raman analysis revealed bands compatible with carotenoids, with characteristic bands at approximately 1000, 1150, and 1520 cm−1. These features are indicative of biological colonisation and are consistent with the spatial distribution of Cluster 5, which was previously associated with biofilm formation and organic surface deposits. The localisation of these signals in sheltered and moisture-prone areas supports the interpretation that biological activity is strongly controlled by micro-environmental conditions, particularly the availability of water and reduced exposure to direct sunlight.
The interpretation of the K-Means results is strengthened by integrating SWIR hyperspectral data with complementary XRF and Raman analyses, thereby enabling a consistent relationship among spectral variability, chemical composition, and surface alteration processes. In the SWIR region, absorptions around 1400 and 1900 nm are associated with water and hydroxyl-related species, whereas features near 2200 nm may indicate hydrated aluminosilicates or clay-related phases.
Clusters 2 and 4, which dominate large portions of the façade, are associated with the baseline substrate. This interpretation is supported by dominant silicon signals in XRF and characteristic quartz Raman bands at approximately 460–463 cm−1. In contrast, Clusters 6 and 7, located mainly in lower moisture-exposed areas, exhibit stronger water-related SWIR absorptions together with enhanced calcium and sulfur signals in XRF. Raman bands in the 1000–1030 cm−1 region are consistent with sulfate-bearing phases, suggesting moisture-related alteration and salt crystallisation. Although these features are compatible with gypsum- or bassanite-like compounds, definitive discrimination among sulfate phases cannot be established solely from the available spectral information.
Clusters 1 and 3 exhibit intermediate spectral behaviour and likely represent transitional states between relatively unaltered and altered material. Their XRF and Raman signatures suggest partial modification of the sandstone matrix associated with early-stage weathering and secondary mineral formation. Cluster 5 is spatially associated with sheltered and moisture-retaining regions and is conservatively interpreted as an organically or biologically influenced area. Raman bands in the 1000–1200 cm−1 region may indicate organic compounds or pigments, although a definitive assignment remains uncertain.
Minor XRF contributions from Cl, Ti, Mn, and Zn are interpreted as trace components or environmental contaminants. Similarly, tentative phosphate-related Raman features should be interpreted cautiously and are not considered definitive phase identifications. A summary of the integrated interpretation of the seven clusters is provided in Table 1.
Table 1.
Integrated interpretation of the seven clusters identified from the SWIR hyperspectral image, including the main spectral characteristics, complementary XRF and Raman evidence, and the proposed physicochemical interpretation of the different surface conditions observed on the church façade.
Given the complexity of stone degradation processes and the partially overlapping spectral signatures of several alteration products, the proposed assignments should be interpreted as chemically plausible scenarios rather than definitive phase identifications.
4. Conclusions and Future Perspectives
This study demonstrates that the combined use of SWIR hyperspectral imaging, chemometric analysis, and three-dimensional (3D) visualisation provides a coherent and non-destructive framework for assessing heterogeneous surface conditions in historical stonework. The results obtained from the San Emeterio and San Celedonio Church façades show that hyperspectral data, when analysed within their spatial and architectural context, contain meaningful information related to both material composition and surface alteration processes.
Principal Component Analysis revealed that the quartz-rich sandstone substrate dominates the spectral variability of the façade. At the same time, higher-order components capture more localised variations associated with moisture-related alteration and biologically influenced regions. Complementarily, K-Means clustering enabled the segmentation of the façade into spatially coherent regions representing different surface conditions, ranging from relatively unaltered sandstone to moisture-affected and chemically altered areas.
A key aspect of this work is integrating chemometric outputs into a photogrammetry-based 3D model. Projecting spectral and clustering information onto the reconstructed façade geometry improves the spatial interpretation of degradation patterns and facilitates the identification of critical zones within their architectural context.
Complementary XRF and Raman spectroscopy further supported the interpretation of the hyperspectral results by providing elemental and molecular information associated with the dominant sandstone matrix and secondary alteration products. Although the proposed assignments should be interpreted cautiously, the combined analytical approach demonstrates that SWIR-HSI and chemometric analysis can effectively reveal chemically and spatially meaningful heterogeneity in heritage stone surfaces.
The proposed 3D-SWIR hyperspectral framework represents a promising non-destructive tool for assessing and monitoring cultural heritage structures. Nevertheless, the promising results obtained in this study, several limitations of the proposed methodology should be acknowledged. The interpretation of SWIR hyperspectral features in historical stonework remains challenging due to the low intensity of bands in this region of the NIR and the overlap of spectral signatures from different compounds. Consequently, some mineralogical or degradation-related assignments should be considered as plausible hypotheses. In addition, special care and attention should be paid to illumination conditions, acquisition geometry, surface roughness, and local shadowing effects, all of which can introduce spectral variability unrelated to material composition. Additionally, the registration and projection of chemometric information onto the 3D photogrammetric model are affected by differences in spatial resolution and geometric alignment uncertainties. Future work will therefore focus on improving acquisition standardisation, incorporating more extensive complementary analytical validation using comprehensive close-up photo-documentation (RGB) of the architectural site, and developing more robust multimodal registration approaches to increase the reliability and interpretability of the proposed workflow.
Author Contributions
Conceptualisation, J.M.A., G.A. and J.M.M.; methodology, J.M.A., I.C., G.G., J.A.I., I.Á., L.K., G.A. and J.M.M.; software, J.M.A., G.G. and J.A.I.; validation, J.M.A., I.C., G.G., J.A.I., G.A. and J.M.M.; formal analysis, J.M.A., G.A. and J.M.M.; investigation, J.M.A., I.C., G.G., J.A.I., I.Á., L.K., G.A. and J.M.M.; resources, G.A. and J.M.M.; data curation, J.M.A., G.G. and J.A.I.; writing—original draft preparation, J.M.A.; writing—review and editing, J.M.A.; visualisation, J.M.A. and J.A.I.; supervision, J.M.A., G.A. and J.M.M.; project administration, G.A. and J.M.M.; funding acquisition, G.A. and J.M.M. All authors have read and agreed to the published version of the manuscript.
Funding
This research was conducted within the framework of the SIDIRE project (Grant No. PID2023-146230OB-I00), funded by the Spanish Agency for Research (through the Spanish Ministry of Science, Innovation and Universities, and the European Regional Development Fund, FEDER, MICIU/AEI/10.13039/501100011033/FEDER/UE.
Institutional Review Board Statement
Not applicable.
Informed Consent Statement
Not applicable.
Data Availability Statement
The raw data supporting the conclusions of this article will be made available by the authors on request.
Conflicts of Interest
Author José Manuel Amigo is the CEO and owned 10% of the company HYPER-Tools S. L. The remaining authors declare that the research was conducted in the absence of any commercial or financial relationships that could be construed as a potential conflict of interest.
Abbreviations
The following abbreviations are used in this manuscript:
| Abbreviation | Definition |
| 3D | Three-dimensional |
| E | Residual matrix |
| HSI | Hyperspectral imaging |
| k | Number of clusters |
| NIR | Near-infrared |
| NMR | Nuclear magnetic resonance |
| P (matrix) | Loadings matrix (Principal Component Analysis) |
| PCA | Principal Component Analysis |
| PC | Principal component |
| RGB | Red, green, blue |
| ROI | Region of interest |
| SDD | Silicon drift detector |
| SNV | Standard normal variate |
| SVD | Singular value decomposition |
| SWIR | Short-wave infrared |
| SWIR-HSI | Short-wave infrared hyperspectral imaging |
| T | Scores matrix (Principal Component Analysis) |
| VNIR | Visible and near-infrared |
| X | Data matrix |
| XRF | X-ray fluorescence |
References
- Fisya, N.; Hamdi, F.; Salleh, N.H. A systematic review: Understanding environmental driving factors of heritage building degradation. J. Surv. Constr. Prop. 2025, 16, 1985–7527. [Google Scholar] [CrossRef] [Scilit]
- Da Costa, V.S.; da Silveira, A.M.; da Silva Torres, A. Evaluation of Degradation State of Historic Building Facades Through Qualitative and Quantitative Indicators: Case Study in Pelotas, Brazil. Int. J. Archit. Herit. 2022, 16, 1642–1665. [Google Scholar] [CrossRef] [Scilit]
- Pinheiro, V.R.F.; Fontenele, R.; Magalhães, A.; Frota, N.; Mesquita, E. Evaluation of the influence of climatic changes on the degradation of the historic buildings. Energy Build. 2024, 323, 114813. [Google Scholar] [CrossRef] [Scilit]
- Laohaviraphap, N.; Waroonkun, T. Integrating Artificial Intelligence and the Internet of Things in Cultural Heritage Preservation: A Systematic Review of Risk Management and Environmental Monitoring Strategies. Buildings 2024, 14, 3979. [Google Scholar] [CrossRef] [Scilit]
- Casillo, M.; Colace, F.; Gaeta, R.; Lorusso, A.; Santaniello, D.; Valentino, C. Revolutionizing cultural heritage preservation: An innovative IoT-based framework for protecting historical buildings. Evol. Intell. 2024, 17, 3815–3831. [Google Scholar] [CrossRef] [Scilit]
- Hong, D.; Li, C.; Yokoya, N.; Zhang, B.; Jia, X.; Plaza, A.; Gamba, P.; Benediktsson, J.A.; Chanussot, J. Hyperspectral imaging. Nat. Rev. Methods Primers 2026, 6, 19. [Google Scholar] [CrossRef] [Scilit]
- Amigo, J.M. Hyperspectral and multispectral imaging: Setting the scene. Data Handl. Sci. Technol. 2020, 32, 3–16. [Google Scholar] [CrossRef] [Scilit]
- Picollo, M.; Cucci, C.; Casini, A.; Stefani, L. Hyper-spectral imaging technique in the cultural heritage field: New possible scenarios. Sensors 2020, 20, 2843. [Google Scholar] [CrossRef] [Scilit]
- Defrasne, C.; Massé, M.; Giraud, M.; Schmitt, B.; Fligiel, D.; Le Mouélic, S.; Chalmin, E. The contribution of VNIR and SWIR hyperspectral imaging to rock art studies: Example of the Otello schematic rock art site (Saint-Rémy-de-Provence, Bouches-du-Rhône, France). Archaeol. Anthropol. Sci. 2023, 15, 116. [Google Scholar] [CrossRef] [Scilit]
- Suzuki, A.; Vettori, S.; Giorgi, S.; Carretti, E.; Di Benedetto, F.; Dei, L.; Benvenuti, M.; Moretti, S.; Pecchioni, E.; Costagliola, P. Laboratory study of the sulfation of carbonate stones through SWIR hyperspectral investigation. J. Cult. Herit. 2018, 32, 30–37. [Google Scholar] [CrossRef] [Scilit]
- Catelli, E.; Sciutto, G.; Prati, S.; Lozano, M.V.C.; Gatti, L.; Lugli, F.; Silvestrini, S.; Benazzi, S.; Genorini, E.; Mazzeo, R. A new miniaturised short-wave infrared (SWIR) spectrometer for on-site cultural heritage investigations. Talanta 2020, 218, 121112. [Google Scholar] [CrossRef] [Scilit] [PubMed]
- Vettori, S.; Romoli, D.; Salvatici, T.; Rimondi, V.; Pecchioni, E.; Moretti, S.; Benvenuti, M.; Costagliola, P.; Manganelli Del Fà, R.; Coppola, M.; et al. Non-Invasive SWIR Monitoring of White Marble Surface of the Cathedral of Santa Maria del Fiore (Florence, Italy). Sustainability 2023, 15, 1421. [Google Scholar] [CrossRef] [Scilit]
- Sandak, J.; Sandak, A.; Legan, L.; Retko, K.; Kavčič, M.; Kosel, J.; Poohphajai, F.; Diaz, R.H.; Ponnuchamy, V.; Sajinčič, N.; et al. Nondestructive evaluation of heritage object coatings with four hyperspectral imaging systems. Coatings 2021, 11, 244. [Google Scholar] [CrossRef] [Scilit]
- Amigo, J.M. Hyperspectral Imaging; Elsevier: Amsterdam, The Netherlands, 2020. [Google Scholar]
- Giannuzzi, V.; Fatiguso, F. Historic Built Environment Assessment and Management by Deep Learning Techniques: A Scoping Review. Appl. Sci. 2024, 14, 7116. [Google Scholar] [CrossRef] [Scilit]
- Madariaga, J.M. Raman spectroscopy in art and archaeology. J. Raman Spectrosc. 2010, 41, 1099–1103. [Google Scholar] [CrossRef] [Scilit]
- Castro, K.; Pessanha, S.; Proietti, N.; Princi, E.; Capitani, D.; Carvalho, M.L.; Madariaga, J.M. Noninvasive and nondestructive NMR, Raman and XRF analysis of a Blaeu coloured map from the seventeenth century. Anal. Bioanal. Chem. 2008, 391, 433–441. [Google Scholar] [CrossRef] [Scilit] [PubMed]
- Münster, S. Advancements in 3D Heritage Data Aggregation and Enrichment in Europe: Implications for Designing the Jena Experimental Repository for the DFG 3D Viewer. Appl. Sci. 2023, 13, 9781. [Google Scholar] [CrossRef] [Scilit]
- Stech, A.; Kamencay, P.; Hudec, R. Enhancing 3D Models with Spectral Imaging for Surface Reflectivity. Sensors 2024, 24, 6352. [Google Scholar] [CrossRef] [Scilit] [PubMed]
- Amigo, J.M.; Grassi, S. Configuration of hyperspectral and multispectral imaging systems. Data Handl. Sci. Technol. 2020, 32, 17–34. [Google Scholar] [CrossRef] [Scilit]
- Cruz-Tirado, J.P.; Amigo, J.M.; Barbin, D.F.; Kucheryavskiy, S. Data reduction by randomization subsampling for the study of large hyperspectral datasets. Anal. Chim. Acta 2022, 1209, 339793. [Google Scholar] [CrossRef] [Scilit]
- Mobaraki, N.; Amigo, J.M. HYPER-Tools. A graphical user-friendly interface for hyperspectral image analysis. Chemom. Intell. Lab. Syst. 2018, 172, 174–187. [Google Scholar] [CrossRef] [Scilit]

Disclaimer/Publisher’s Note: The statements, opinions and data contained in all publications are solely those of the individual author(s) and contributor(s) and not of MDPI and/or the editor(s). MDPI and/or the editor(s) disclaim responsibility for any injury to people or property resulting from any ideas, methods, instructions or products referred to in the content. |
© 2026 by the authors. Licensee MDPI, Basel, Switzerland. This article is an open access article distributed under the terms and conditions of the Creative Commons Attribution (CC BY) license.