Article

ASTER Mineral Mapping of Beresite–Listvenite Gold Systems in West Kalba, East Kazakhstan
1
School of Earth Sciences, D. Serikbayev East Kazakhstan Technical University, Ust-Kamenogorsk 070000, Kazakhstan
2
GFZ Helmholtz Centre for Geosciences, 14473 Potsdam, Germany
3
Department of Aerospace Engineering, King Fahd University of Petroleum and Minerals, Academic Ring Road 4340, Dhahran 34463, Saudi Arabia
4
Department of Geomatics, Faculty of Civil Engineering, Czech Technical University in Prague, 16636 Prague, Czech Republic
5
Centre of Applied Remote Sensing and GIS Applications, Sharof Rashidov Samarkand State University, Samarkand 140104, Uzbekistan
*
Authors to whom correspondence should be addressed.
Geosciences 2026, 16(7), 266; https://doi.org/10.3390/geosciences16070266
Submission received: 19 May 2026 / Revised: 26 June 2026 / Accepted: 29 June 2026 / Published: 2 July 2026

Abstract

Multispectral satellite imagery is a very useful technique to identify altered wall rocks around orogenic gold systems. In this study in the Akzhal–Vasilyevskoye district, Kazakhstan, we show that a geology-based ASTER band-ratio workflow is a useful technique to trace metasomatic footprints of mineralization. In the West Kalba camp, beresite and listvenite both produce usable ASTER SWIR signals, while pyrite and arsenopyrite are largely featureless at multispectral resolution. Five ratios on AST_07XT surface-reflectance data, screened with upper-tail anomaly masks, have enabled identification of sericitic cores, chloritic and carbonate halos, ferric caps, and zones containing mixtures of ferrous phyllosilicates. We show that district-scale Al–OH sericitic anomalies occur within Mg–OH and carbonate shells. At Vasilyevskoye the pattern is due to beresite nuclei within listvenite rims, while at Tokum the sericitic centres remain compact within wider Mg–OH and carbonate halos. Mean polygon spectra differ between the two footprints across Bands B4–B6 and across the SWIR tail (B7–B9). SEM–EDS at Vasilyevskoye links the mapped anomalies to chlorite, sericite, and carbonate gangue assemblages with sulfide-bearing volumes. The data also allow identification of subordinate REE, phosphate, and Ti enrichment within carbonaceous and polymineralic host lithologies.

1. Introduction

The Akzhal–Vasilyevskoye ore district lies in the West Kalba metallogenic zone. It is a vein and beresite system in which ore localizes along major faults and subsidiary splays [1]. This setting matches the global orogenic gold model of fluid focusing along crustal structures [2,3]. Two district deposits are used as principal case studies: Vasilyevskoye, the largest known accumulation, and Tokum, a nearby vein–stockwork system with broader distal chlorite–carbonate and carbonatization halos in the country rock [4].
Orogenic gold systems are typically evaluated through field geology, sampling, petrography, and geochemistry [3]. Underground and drill control are added where available. West Kalba syntheses report reserve depletion in mature mining districts [1,5]. Replenishment now depends on re-evaluating medium and small deposits, exploring known ore fields at depth, and updating analytical workflows. Petrology at individual deposits and ore type reviews for eastern Kazakhstan gold fields [4,6], together with grain-scale work on gold as fine sulfide inclusions versus free grains [7], show that recoverability and resource reassessment are dominated by sulfide paragenesis.
Remote sensing can delineate alteration over wide areas at low cost [8], yet in Kazakhstan gold campaigns it remains comparatively peripheral because the ore minerals carry little VNIR–SWIR expression [9]. Broad band ratios and principal component analysis can nonetheless map alteration-mineral groups where the index design follows diagnostic spectral behavior and the outputs are screened with conservative masks [10,11]. The trade-offs are well known: broad ASTER channels limit the separation of spectrally similar minerals, and vegetation cover, mixed pixels, and variable surface conditions can suppress or distort the alteration response [12], so hyperspectral data remain better suited to detailed mineral discrimination in complex terrains.
ASTER alteration targeting has been applied to gold and porphyry systems [13,14], mineral mapping at project scale [15], multisensor classification such as SAM [16], and quantitative uncertainty treatment in spectroscopy [17]. Integrated prospectivity mapping that fuses remote sensing with gravity or other geophysical layers is now routine [18,19]. Local work in East Kazakhstan has focused on metallogenic synthesis, structural frameworks, and GIS prospectivity forecasting [20,21]. Peer-reviewed satellite studies in Kazakhstan have more often addressed porphyry-copper alteration with multispectral or UAV data [22,23]. Recent applications also include ASTER/Landsat alteration mapping for major porphyry systems and integrated prospectivity frameworks [24,25]. Mineral paragenesis at individual deposits and alteration architecture across the district are still rarely reconciled within one multispectral workflow. This study applies that paired scope to the beresite–listvenite Akzhal–Vasilyevskoye district: standard ASTER mineral-index ratios [8,10] map metasomatic zoning across the district and at each deposit, while SEM–EDS at Vasilyevskoye tests paragenesis, a combination not pursued in recent Kazakhstan ASTER/Landsat alteration or prospectivity work [22,23,24,25].
In this study, ASTER multispectral imagery is integrated with targeted field sampling in the Akzhal–Vasilyevskoye district. Band-ratio selection follows the ASTER mineral-index logic of Geoscience Australia [10], with reference to epithermal PCA precedents [11] and lithologic mapping practice with the same sensor [8], and the ratios emphasize Al-rich phyllosilicates in beresitic cores, Mg–OH chloritic halos, carbonates marking listvenitic flooding, oxidative ferric iron, and ferrous-silicate mixtures between those shells. Because gold in West Kalba settings occurs both as free particles and as fine inclusions in pyrite and arsenopyrite [5,26], the alteration mapping targets the enclosing halos rather than gold itself, and petrography with SEM–EDS at Vasilyevskoye verifies the mineral aggregates that correspond to the mapped anomalies. Tokum lies a few kilometres along the same structure but is mapped from imagery alone, with no matching field campaign. Regional studies of the Bakyrchik system [27] and CAOB-scale syntheses of orogenic gold timing, sources, and structural context [6] provide the broader interpretive framework.

2. Geological Background

The Akzhal–Vasilyevskoye ore district lies within the West Kalba structural-formational zone of Eastern Kazakhstan, one of the principal metallogenic domains of the Greater Altai within the Central Asian Orogenic Belt [1,6]. This collage is a Paleozoic accretionary system built by progressive convergence and amalgamation of microcontinents and island arcs, with associated magmatism and metallogenesis [6]. The West Kalba gold belt extends about 400–500 km in a northwest–southeast direction and hosts numerous gold deposits whose distribution follows the global orogenic gold pattern [1,3].
Gold mineralization in the West Kalba belt is localized along major faults and shear zones and is typically associated with quartz veins and sulfide assemblages [1,3]. Ore formation is linked to late-orogenic fluid flow and sulfidation of the country rock, producing metasomatic quartz–sericite and chlorite–carbonate pairs, pervasive carbonatization, oxidation of sulfide-rich packages, and local silicification [2]. These halos trace fluid pathways and flag mineralized structures.
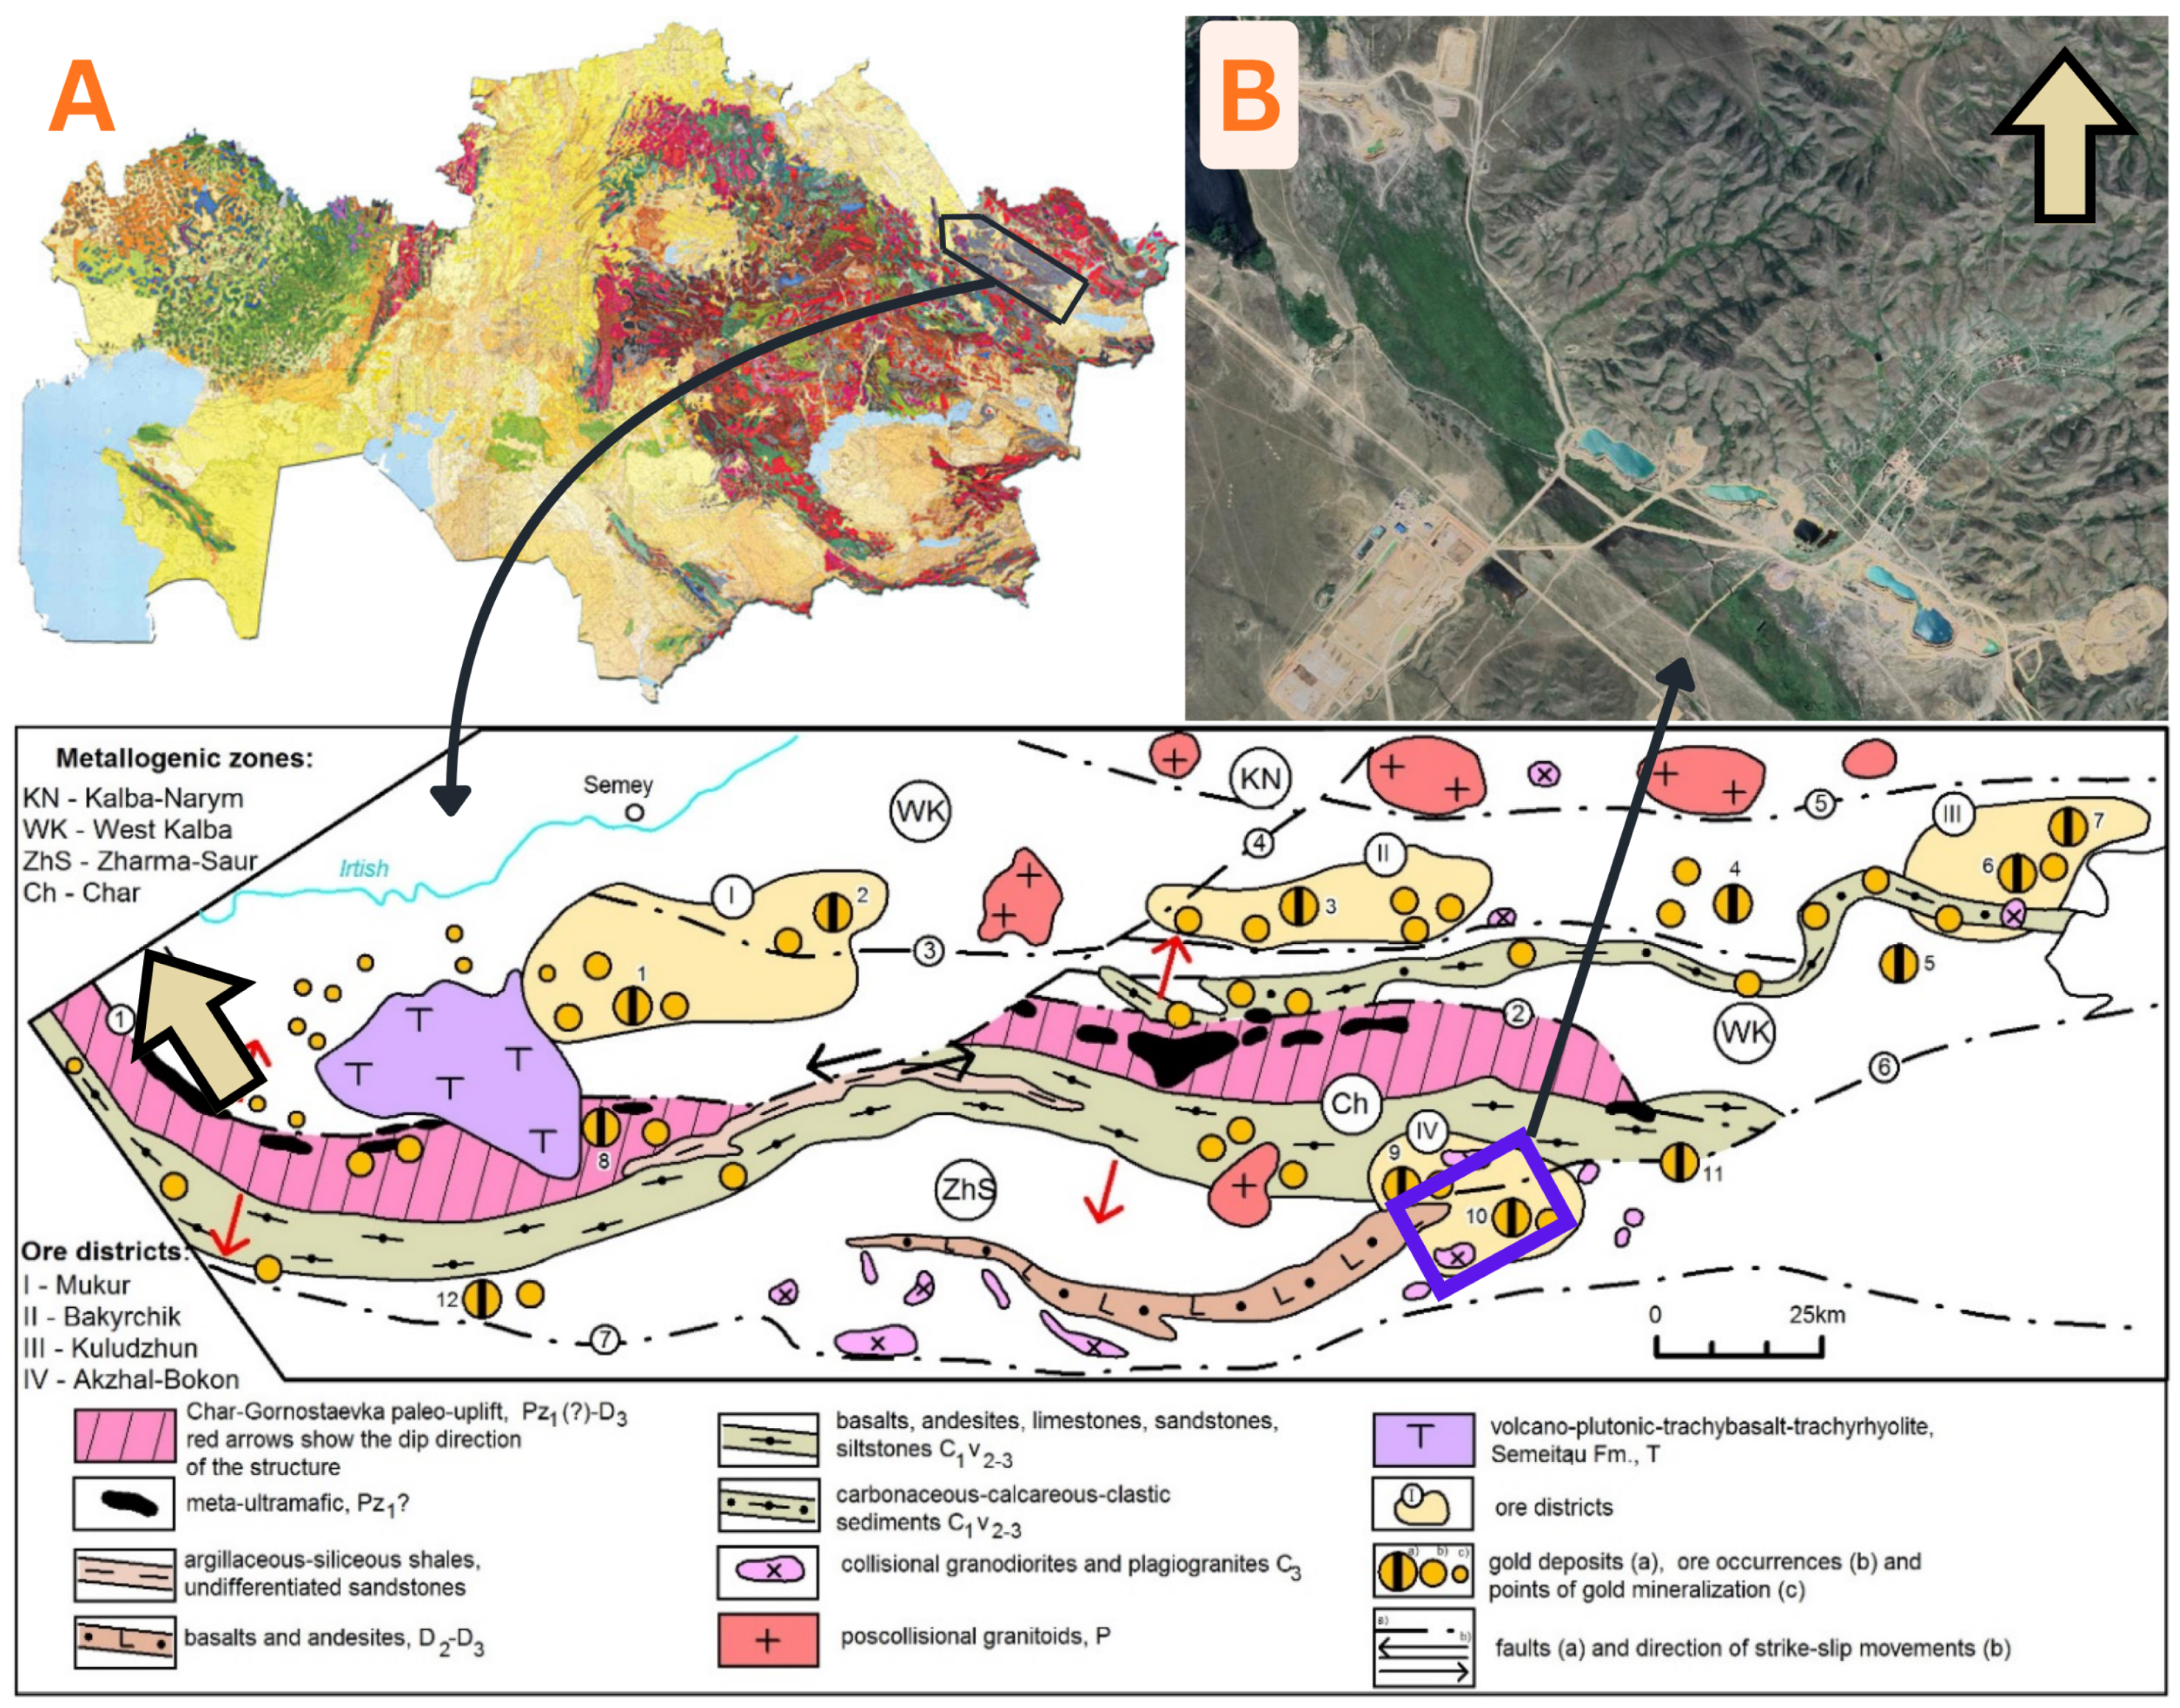
Regional and local syntheses describe the West Kalba zone as a belt of vein, stockwork, and beresite–listvenite gold systems hosted mainly by Paleozoic terrigenous and volcanogenic–terrigenous sequences [4,28]. These studies link gold mineralization to quartz veins, sulfides, and carbonaceous host rocks, with metasomatism concentrated along structures and a local magmatic–hydrothermal contribution. That association is the geological basis for targeting alteration minerals rather than gold itself. Figure 1 locates the major faults and representative gold deposits along the West Kalba and Zharma–Saur belts.
The regional stratigraphy is dominated by Devonian to Carboniferous terrigenous and volcanogenic–terrigenous sequences, including carbonaceous shales, siltstones, and graywackes [1,29]. Magmatic activity is represented by Late Carboniferous subvolcanic intrusions and dike complexes of intermediate to felsic composition, commonly spatially associated with gold mineralization [1,6]. The adjacent Kalba–Narym Batholith hosts rare-metal pegmatite fields in which ICP-MS trace-element signatures in muscovite and K-feldspar record LCT pegmatite fractionation and zonation [30], offering a complementary line of evidence on granitic evolution in eastern Kazakhstan relative to alteration in the country rock as the main spectral target of this study.
At the regional scale, mineralization is controlled by fault systems that act as permeable conduits for ore-forming fluids [2]. These structures appear as linear corridors of metasomatism along faults that focus the zoning and deposition responsible for gold systems throughout the belt [1,4].

3. Study Area

The present study is focused on Vasilyevskoye and Tokum in the Akzhal–Vasilyevskoye district [1]. The two deposits share beresite–listvenite style metasomatism along the Bokon fault system but differ in scale, grade, and distal halo development [4].

3.1. Vasilyevskoye Deposit

Vasilyevskoye, the largest deposit in the district, has been mined since 1946 and shows beresite–listvenite alteration with quartz–sulfide ores in carbonaceous Bokon host rocks along faults related to Bokon [1,4]. Mineralization is localized within a narrow fault corridor at the district scale and forms lenses and shoots that pinch and swell along the strike and down dip. The ore bodies are hosted mainly by carbonaceous siltstones, slates, and aleurolites. Veining and alteration extend only short distances into adjacent units outside the main structural zone. Near surface, individual zones can split into multiple veins that coalesce at depth into thicker bodies, which is typical of structurally focused quartz–sulfide systems in carbonaceous sequences [4].
Ore styles include auriferous quartz veins, veinlet–stockwork zones, and disseminated pyrite–arsenopyrite lenses with subordinate base metal sulfides and native gold [4]. Gold is very fine grained in arsenopyrite, pyrite, and quartz, consistent with an early sulfide-rich stage followed by a quartz–polymetallic stage [26]. National inventories later report wider alteration halos at lower bulk grade than the early high-grade ledgers, once the richest near surface shoots were partly worked out, and mineralization remains open along the strike and at depth [1]. Distal chlorite–carbonate halos enclosing sericitic fronts match the sulfidation paths that the multispectral ratios are designed to trace [3]. Table 1 lists the alteration-mineral proxies used in the ASTER workflow.

3.2. Tokum Deposit

Tokum is a nearby veinlet–stockwork analogue a few kilometres northwest of the Vasilyevskoye allotment, in the hanging wall of the Bokon thrust and partly concealed by valley fill [1]. Carbonaceous Bokon metasediments are thrust over Daubay volcanic units. Deformation produces a blocky structural pattern in which northwest-trending fractures and splays host most mineralized zones [4]. Drill and trench evidence describes mineralization as a set of multiple irregular lenses elongated down the dip and expressed discontinuously along the corridor. The ore is essentially monometallic in economic terms, with a strong Au–As association and pyrite–arsenopyrite as the principal sulfides [26].
Gold occurs as disseminations and veinlet stockworks within pyrite–arsenopyrite assemblages tied to quartz–carbonate stockworks and beresite–listvenite halos along northwest-trending structures, near a plagioporphyry contact [4]. The chloritic–propylitic overprint in the wall volcanics is more pervasive than at Vasilyevskoye and produces broader Mg–OH and carbonate halos that contrast with the tighter sericitic core at Vasilyevskoye [1]. The inventoried metal at Tokum is much smaller than at Vasilyevskoye. Tokum therefore stands as a comparison between deposits, not as an independent reserve audit. The band-ratio workflow is validated at Vasilyevskoye by SEM–EDS and is then applied unchanged to Tokum. No microanalysis is available at Tokum, so the mineral assignments there are inferred from the validated ratios rather than confirmed by ground sampling.

4. Materials and Methods

The methodology follows a spectral targeting pipeline, corresponding to a local geology. First, archival data on mineralization and ore context were collected from geological reports, maps, and the published literature to establish the expected alteration-mineral assemblage at Vasilyevskoye. Reference spectra for these minerals were then retrieved from the USGS spectral library, and their diagnostic reflectance and absorption features in the VNIR–SWIR range were identified. ASTER band ratios were selected and tuned to highlight the spectral responses of these target mineral groups, enabling spatial mapping of relative anomaly patterns. Spectral signatures were extracted from the ASTER imagery at anomaly locations. Finally, field samples from the deposit were analyzed by microscopy and SEM–EDS to validate the remote sensing results against field mineralogy. The samples used here were collected in an earlier campaign and were not sited from the maps (Section 4.5).

4.1. USGS Spectral Library Reference Spectra

Reference spectra for the target mineral assemblages were retrieved from the USGS Spectral Library (version 7) [31], which provides laboratory-measured reflectance across the VNIR–SWIR range. Mineral targets were chosen to match the metasomatic assemblages described for West Kalba gold systems in the Geological Background and were further constrained to features that remain usable at ASTER VNIR–SWIR sampling, following established ASTER mineral mapping practices [8,10]. Spectra were therefore selected for muscovite/sericite/illite, chlorite and other Mg–OH silicates, carbonates (calcite, dolomite, and ankerite), and ferric-iron oxides/hydroxides (hematite; goethite). Feature positions and mineral assignments were taken from the spectral library documentation and used as prior constraints for the band-ratio design, not as results of this study. Band positions guidance for silicate and oxide minerals was cross-checked against the classic USGS mid-infrared compilations where relevant [32].
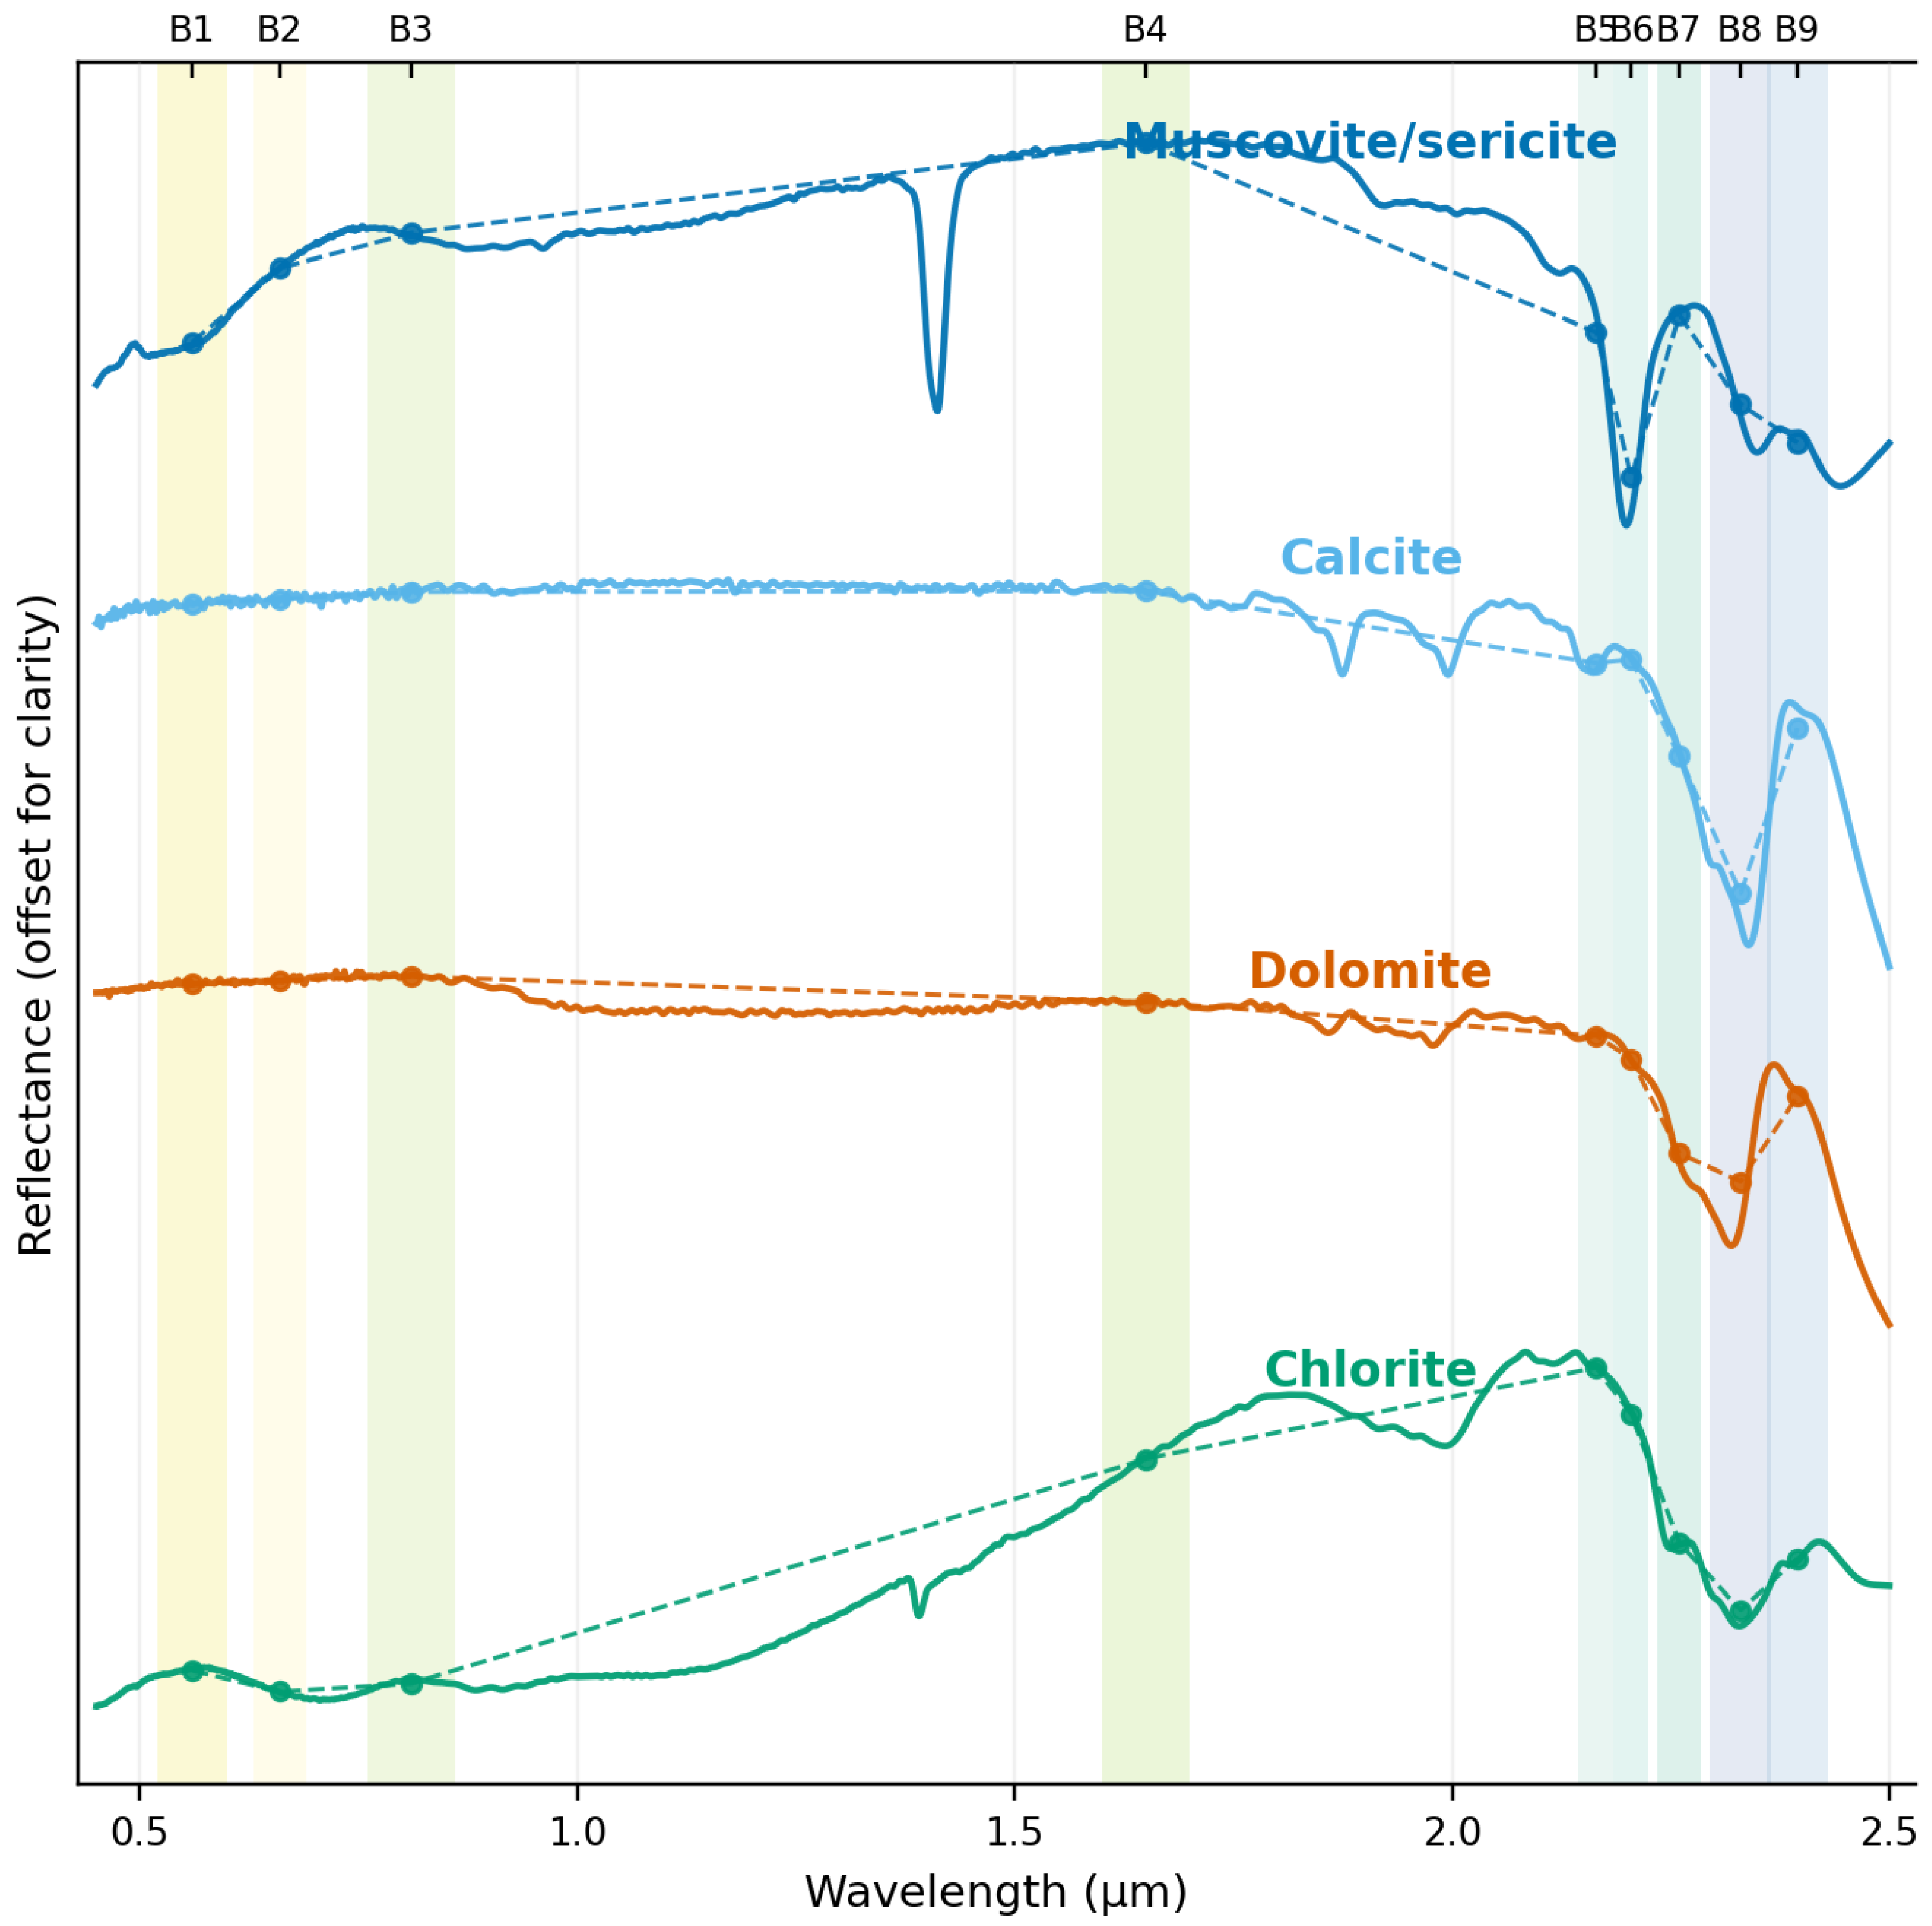
Figure 2 compares the selected USGS library spectra with their shapes after convolution to ASTER band sampling, which motivates the ratio set used below. To evaluate which diagnostic features remain separable at ASTER multispectral resolution, each laboratory spectrum was convolved with the published ASTER relative spectral response (RSR) functions for bands B4–B9 (1.60–2.43 µm at 30 m spatial resolution). The convolution was computed as a weighted mean of the laboratory spectrum over each band’s RSR profile, following standard ASTER mineral-index practices [10,33,34]. This step provided the quantitative basis for the band-ratio selection and for interpreting the polygon spectra discussed in Section 5.2.

4.2. ASTER Dataset

ASTER Level-2 surface reflectance products (AST_07XT) from NASA’s standard processing stream were used to map alteration mineral groups across the Akzhal–Vasilyevskoye district [35]. Using a surface reflectance product keeps numerators and denominators of band ratios internally consistent across mosaics and is the recommended input for Geoscience Australia mineral indices [10]. Four ASTER granules from two orbit passes were selected to cover the study area (Table 2). On each pass, two consecutive along-track granules were used (9 s separation). Spatial extents in the table are individual granule footprints from LP DAAC metadata, not a shared mosaic extent. Scene identifiers encode UTC acquisition time in mmddyyyyhhss format, and listed acquisition times were taken from the corresponding time of the day metadata fields. Scene selection prioritized low cloud cover and acquisitions prior to 2008, when ASTER SWIR data quality degraded and was eventually lost [35]. The resulting maps therefore represent surface conditions at the time of acquisition (2003–2004) and do not account for subsequent mine development or disturbance visible in more recent imagery. Because our targets include OH-bearing mineral groups, the chosen granules were acquired in May–June 2003–2004 (late spring to early summer). Spring imagery can raise the vegetation-moisture response relative to dry-season scenes, and this was controlled with a vegetation mask from NDVI and additional manual masking of strong vegetation responses [36]. ASTER performs well in such semi-arid, sparsely vegetated terrain, in line with recent ASTER alteration mapping in eastern Kazakhstan [37].

4.3. Band Ratio Alteration Mapping

Band ratios were chosen to match the diagnostic absorption features identified by convolving the USGS library spectra to the ASTER bands (Section 4.1) and were interpreted within the metasomatic zoning of the West Kalba ore system. We used pairwise band ratios rather than full-spectrum similarity metrics. Pairwise ratios are simple to compute, stable on atmospherically corrected reflectance mosaics, and consistent with established mineral-index recipes, and they perform well when the numerator and denominator are chosen with reference to the local geology and the results are masked [8,10]. Because pyrite and arsenopyrite lack diagnostic features in the ASTER VNIR–SWIR bands, the ratios target the alteration minerals, the hydration and carbonate signals of the country rock, ferric oxides, and Fe-bearing ferrous silicates rather than the sulfides themselves [10,38].
Five ratios summarize the alteration domains used in this study: proximal sericitic beresitic cores, chlorite-bearing listvenitic halos, carbonate flooding, oxidative caps, and ferrous-silicate contrast fields (Table 3). Silica (quartz) flooding is deliberately not represented as a separate proxy: quartz lacks diagnostic VNIR–SWIR absorption features at the ASTER bandwidth and cannot be uniquely mapped with these ratios. Accordingly, the fifth ratio (B05/B04) targets Fe2+-bearing silicate mixtures and is termed “ferrous silicates” throughout. Legacy GIS export tags labeled “silicification” refer to this same B05/B04 proxy and not to free silica. For each deposit, anomaly maps retained pixels in the 95th–99th percentile of each masked ratio image. That percentile window acts as a mapping threshold, not a statistical confidence level, and was chosen to isolate strong responses while limiting broad background responses. Clouds, water bodies, vegetation, and other non-geological responses were masked beforehand.

4.4. Spectral Signatures from Band-Ratio Training Polygons

For each alteration proxy in Table 3, band-ratio surfaces were computed from the AST_07XT reflectance mosaic (Section 4.3). Within each deposit footprint we outlined abundance polygons that capture high-ratio responses for that proxy. GIS spectral profiles export one vector of mean surface reflectance per ASTER band B1–B9 for each polygon. Where several polygons or spectral classes pertained to the same deposit and alteration combination, band values were averaged for each band to obtain one representative curve per (deposit; alteration) pair. All curves presented in Section 5.2 are derived from measured training polygons, and no synthetic spectra are used.
Table 3. ASTER VNIR–SWIR band ratios used for metasomatic proxy mapping. Ratio interpretations reflect multispectral behavior at ASTER bandwidth and should be treated as mineral group proxies rather than unique mineral identifications.
Alteration/ProcessRatioDominant Spectral TargetMineral Group Emphasized
SericitizationB05/B06Al–OH absorption at ∼2.20 µmMuscovite–sericite–illite (Al-rich phyllosilicates, beresite core)
ChloritizationB07/B09Mg–OH absorption contrast near ∼2.31 µmChlorite and related Mg–Fe(-Al) phyllosilicates (listvenite halo)
CarbonatizationB09/B08CO3 combination bands at ∼2.32–2.35 µmCalcite–dolomite–ankerite group
OxidationB02/B01Fe3+ absorption at ∼0.63–0.9 µmHematite–goethite/limonite group
Ferrous silicatesB05/B04Fe2+-bearing silicate mixture behavior at multispectral samplingMg–Fe–Al silicate mixtures
We also ran a principal component analysis (PCA) on SWIR band triplets as a cross-check [11]. The PC2 and PC3 images reproduced the same OH- and carbonate-related contrasts already seen in the band ratios, so we did not carry PCA forward as a separate mapping product.

4.5. Field Sampling and Validation

Samples were collected at Vasilyevskoye in 2022. Sampling was carried out during a single field campaign that predated this analysis, so the sites were not selected from the ASTER maps. The material provides independent field control over a limited area rather than a validation grid designed for the maps. Four samples were targeted (Table 4). Polished sections were prepared and analyzed by reflected-light microscopy and SEM–EDS. Sections were prepared by progressive grinding (MD-Piano resin-bonded diamond discs, 220–1200 grit, and water-cooled) and diamond polishing (DiaDuo-2 suspensions, 9, 6, 3, and 1 µm), with ultrasonic cleaning (Metason-60) and drying (Drybox-2) between stages (Struers ApS, Ballerup, Denmark), and were carbon-coated prior to analysis.
Analyses were carried out with a JEOL JSM-6390LV scanning electron microscope (JEOL Ltd., Akishima, Tokyo, Japan) equipped with an Oxford Instruments INCA Energy Penta FET X3 energy-dispersive X-ray spectrometer (Oxford Instruments NanoAnalysis, High Wycombe, UK) [39,40]. Operating conditions were 20 kV accelerating voltage with the standard high-vacuum mode, approximately 10 mm working distance, and live acquisition times of about 60 s per spot. Element concentrations were obtained with the INCA normalized quantification routine, with each spot total normalized to 100 wt% over the quantified elements. Because the sections were carbon-coated, carbon was not quantified and is not reported in Appendix A, and carbonate (CO3) was not determined directly by SEM–EDS. The carbon contribution is therefore redistributed across the reported elements during normalization. Oxygen was measured directly as part of the all-element quantification rather than assigned stoichiometrically, but remains semi-quantitative as a light element. The values are accordingly semi-quantitative normalized elemental compositions, not complete mineral analyses [41,42], and carbonate- and carbonaceous-host interpretations rely on polished-section petrography and major-element associations rather than measured C or CO3. The SEM–EDS work targeted mineral assemblages in metasomatized host rocks and ores, including the composition of inclusions and impurity elements in the main ore minerals. Pyrite and arsenopyrite were examined in detail, with subordinate sphalerite, galena, tennantite–tetrahedrite, and chalcopyrite also identified where present. Sample identifiers link hand specimens, micrographs, and SEM–EDS data.

4.6. Software and Data Processing

ASTER scenes (AST_07XT) were mosaicked, band ratios were computed, percentile anomaly masks were generated, and training polygons were extracted in QGIS 3.40.15 (Bratislava, Slovakia). Band-ratio arithmetic, 95th–99th percentile thresholding (Section 4.3), vegetation/cloud/water masking, and polygon extraction were carried out in QGIS 3.40.15 (Bratislava). The published ratio maps (Figure 3, Figure 4 and Figure 5) come from this stack. Spectral signatures were exported as CSV per training polygon. Python 3.12.7 with NumPy 2.1.3 and Matplotlib 3.10.0 was used for downstream visualization only: aggregating the per-polygon CSVs, building the spectral-signature figure (Figure 6), and summarizing the SEM–EDS spot data. USGS reference spectra were convolved to the ASTER RSR functions in the same Python environment (plot_usgs_aster_comparison.py). Band values were read from the mosaic as the AST_07XT exports in QGIS 3.40.15 (Bratislava) (stored 0–1000 scale; factor 0.001) and are plotted in Figure 6 as surface reflectance in percent (stored value ×0.1).
Table 4. Field sample catalog (Vasilyevskoye); campaign VS_2022_vasil. Sample ID links to Figure 7, Figure 8, Figure 9, Figure 10, Figure 11 and Figure 12.
SampleCatalog IDDepositLithologyCoordinates
122-BC-01VasilyevskoyeListvenite (veinlet)49°05′02.8″ N, 81°35′51.2″ E
222-BC-03VasilyevskoyeCarbonaceous clay shale49°05′02.86″ N, 81°35′51.2″ E
322-BC-02VasilyevskoyeBeresite49°05′06.5″ N, 81°35′48.5″ E
422-BC-04VasilyevskoyeOther/unclassified49°05′02.93″ N, 81°35′51.2″ E
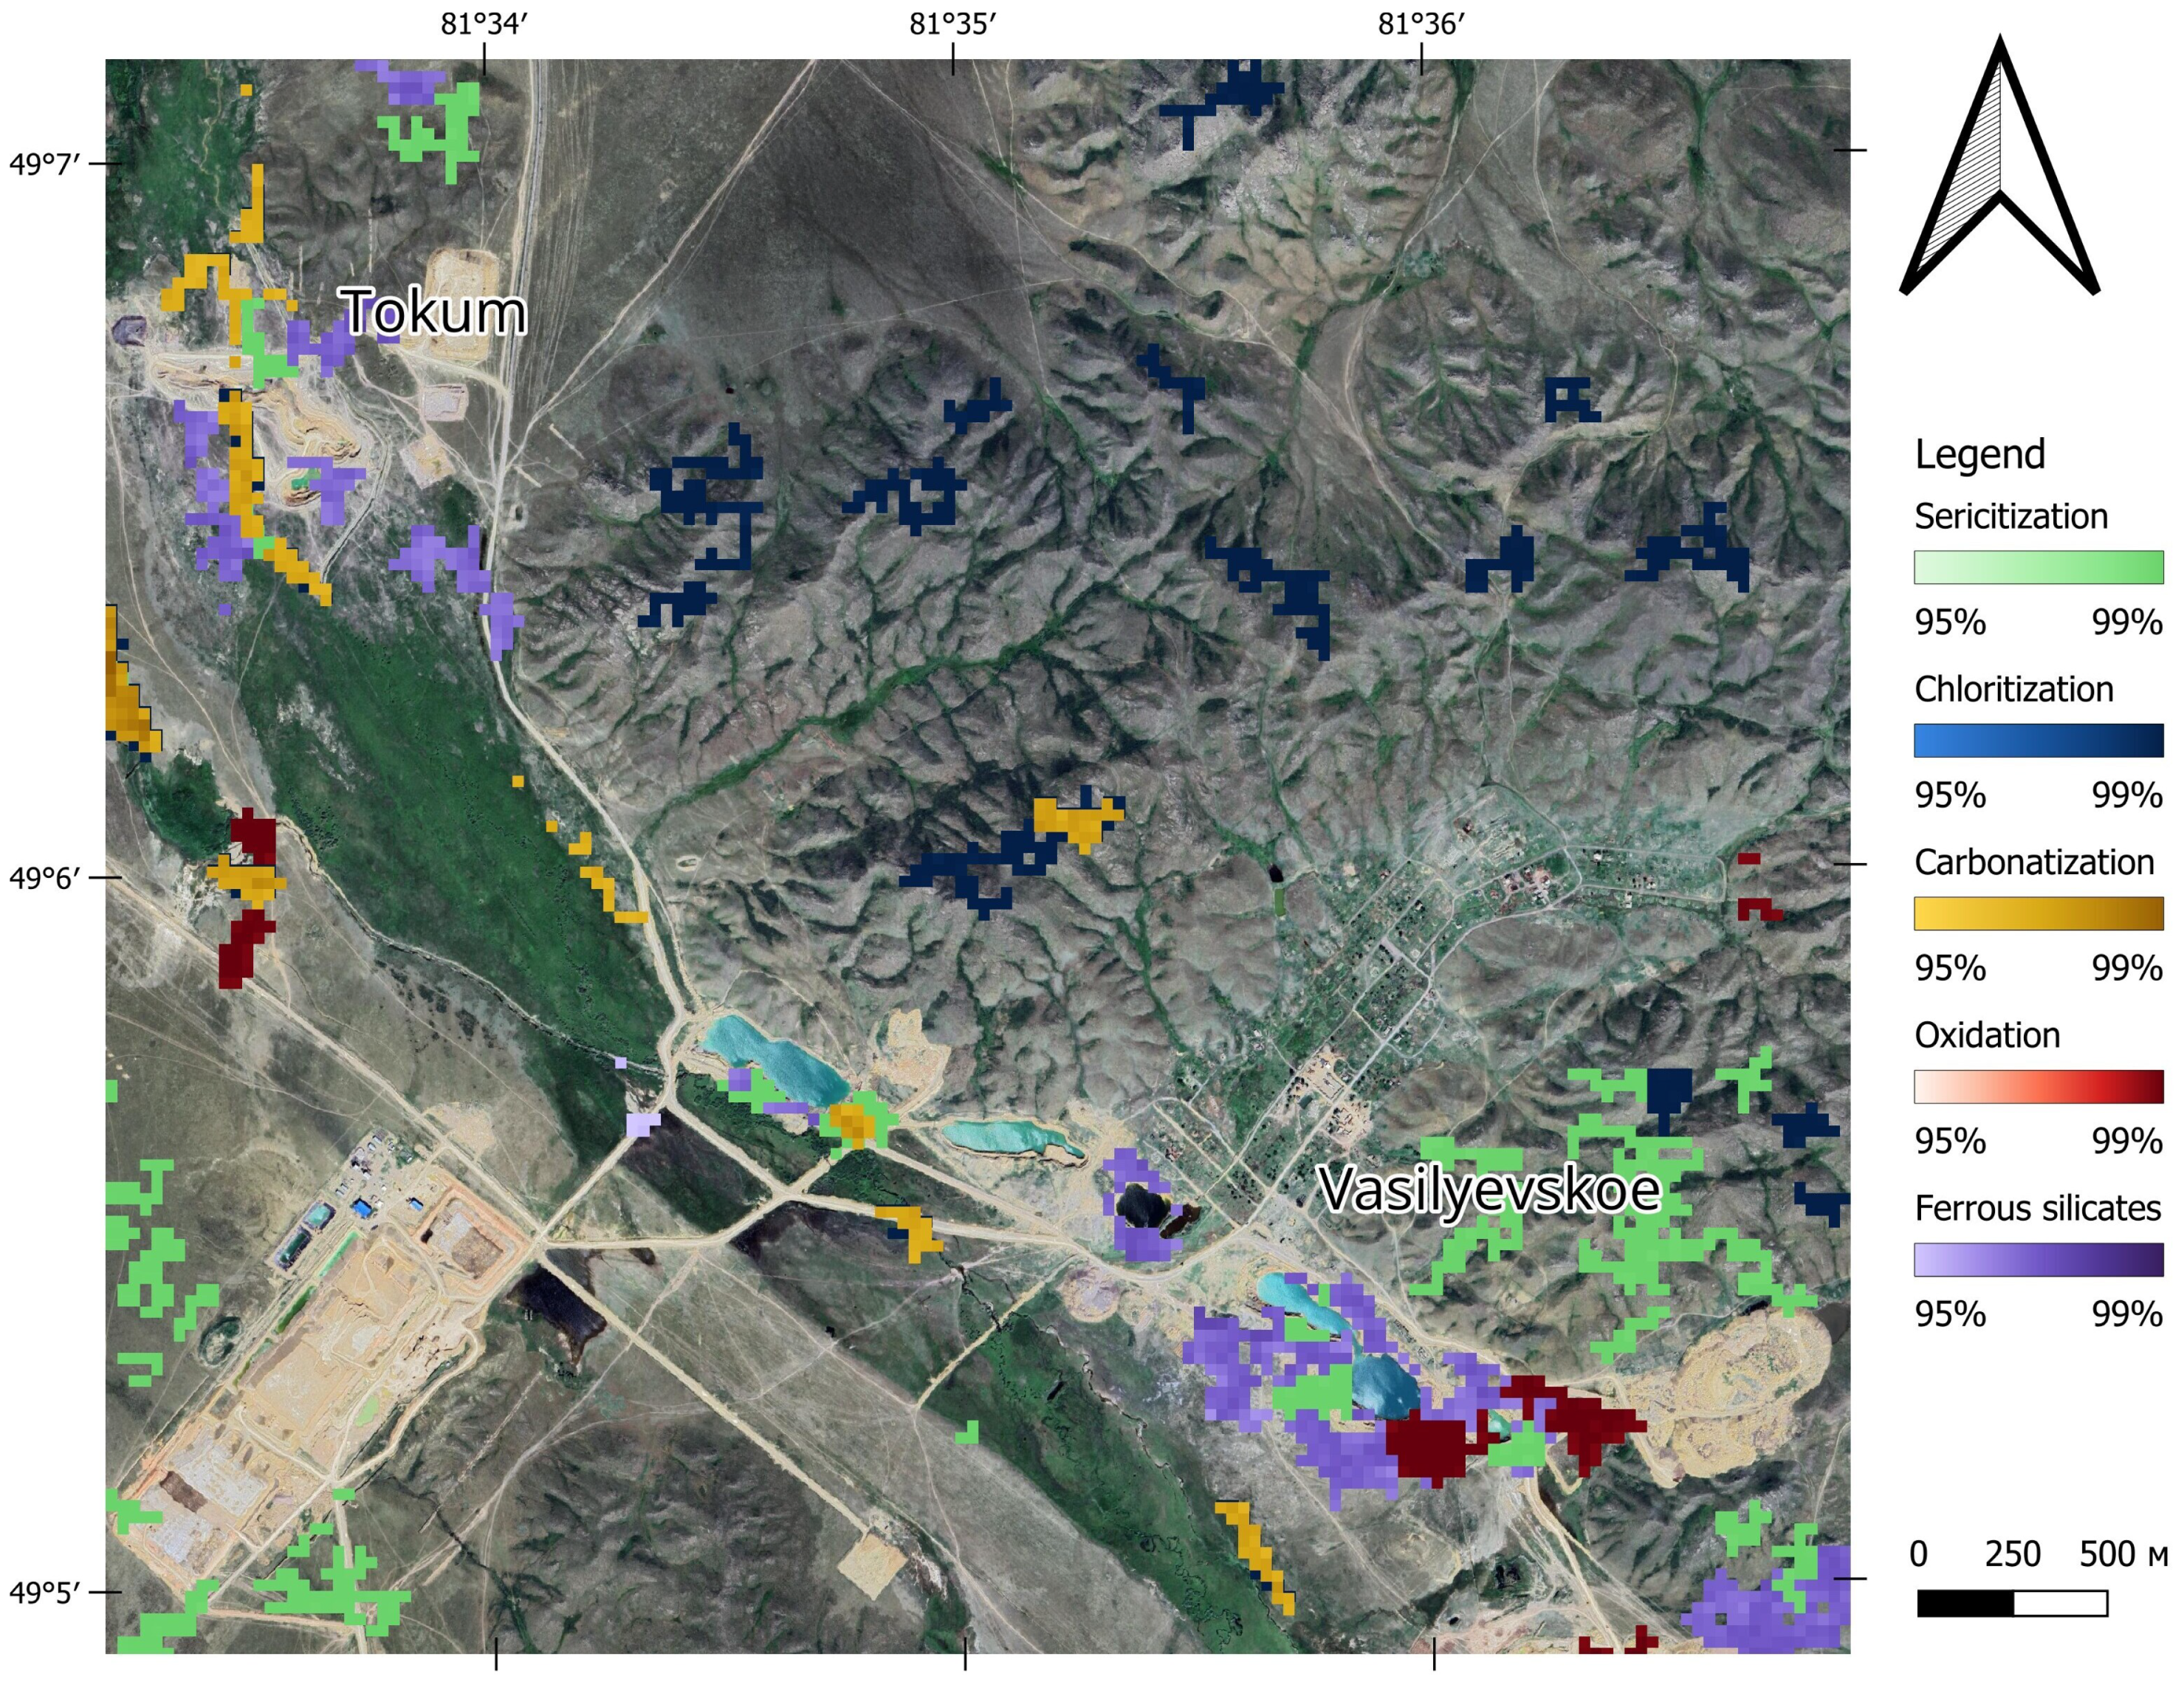
Figure 3. Regional band ratio enhanced map showing Vasilyevskoye and Tokum gold deposits.
Geosciences 16 00266 g003
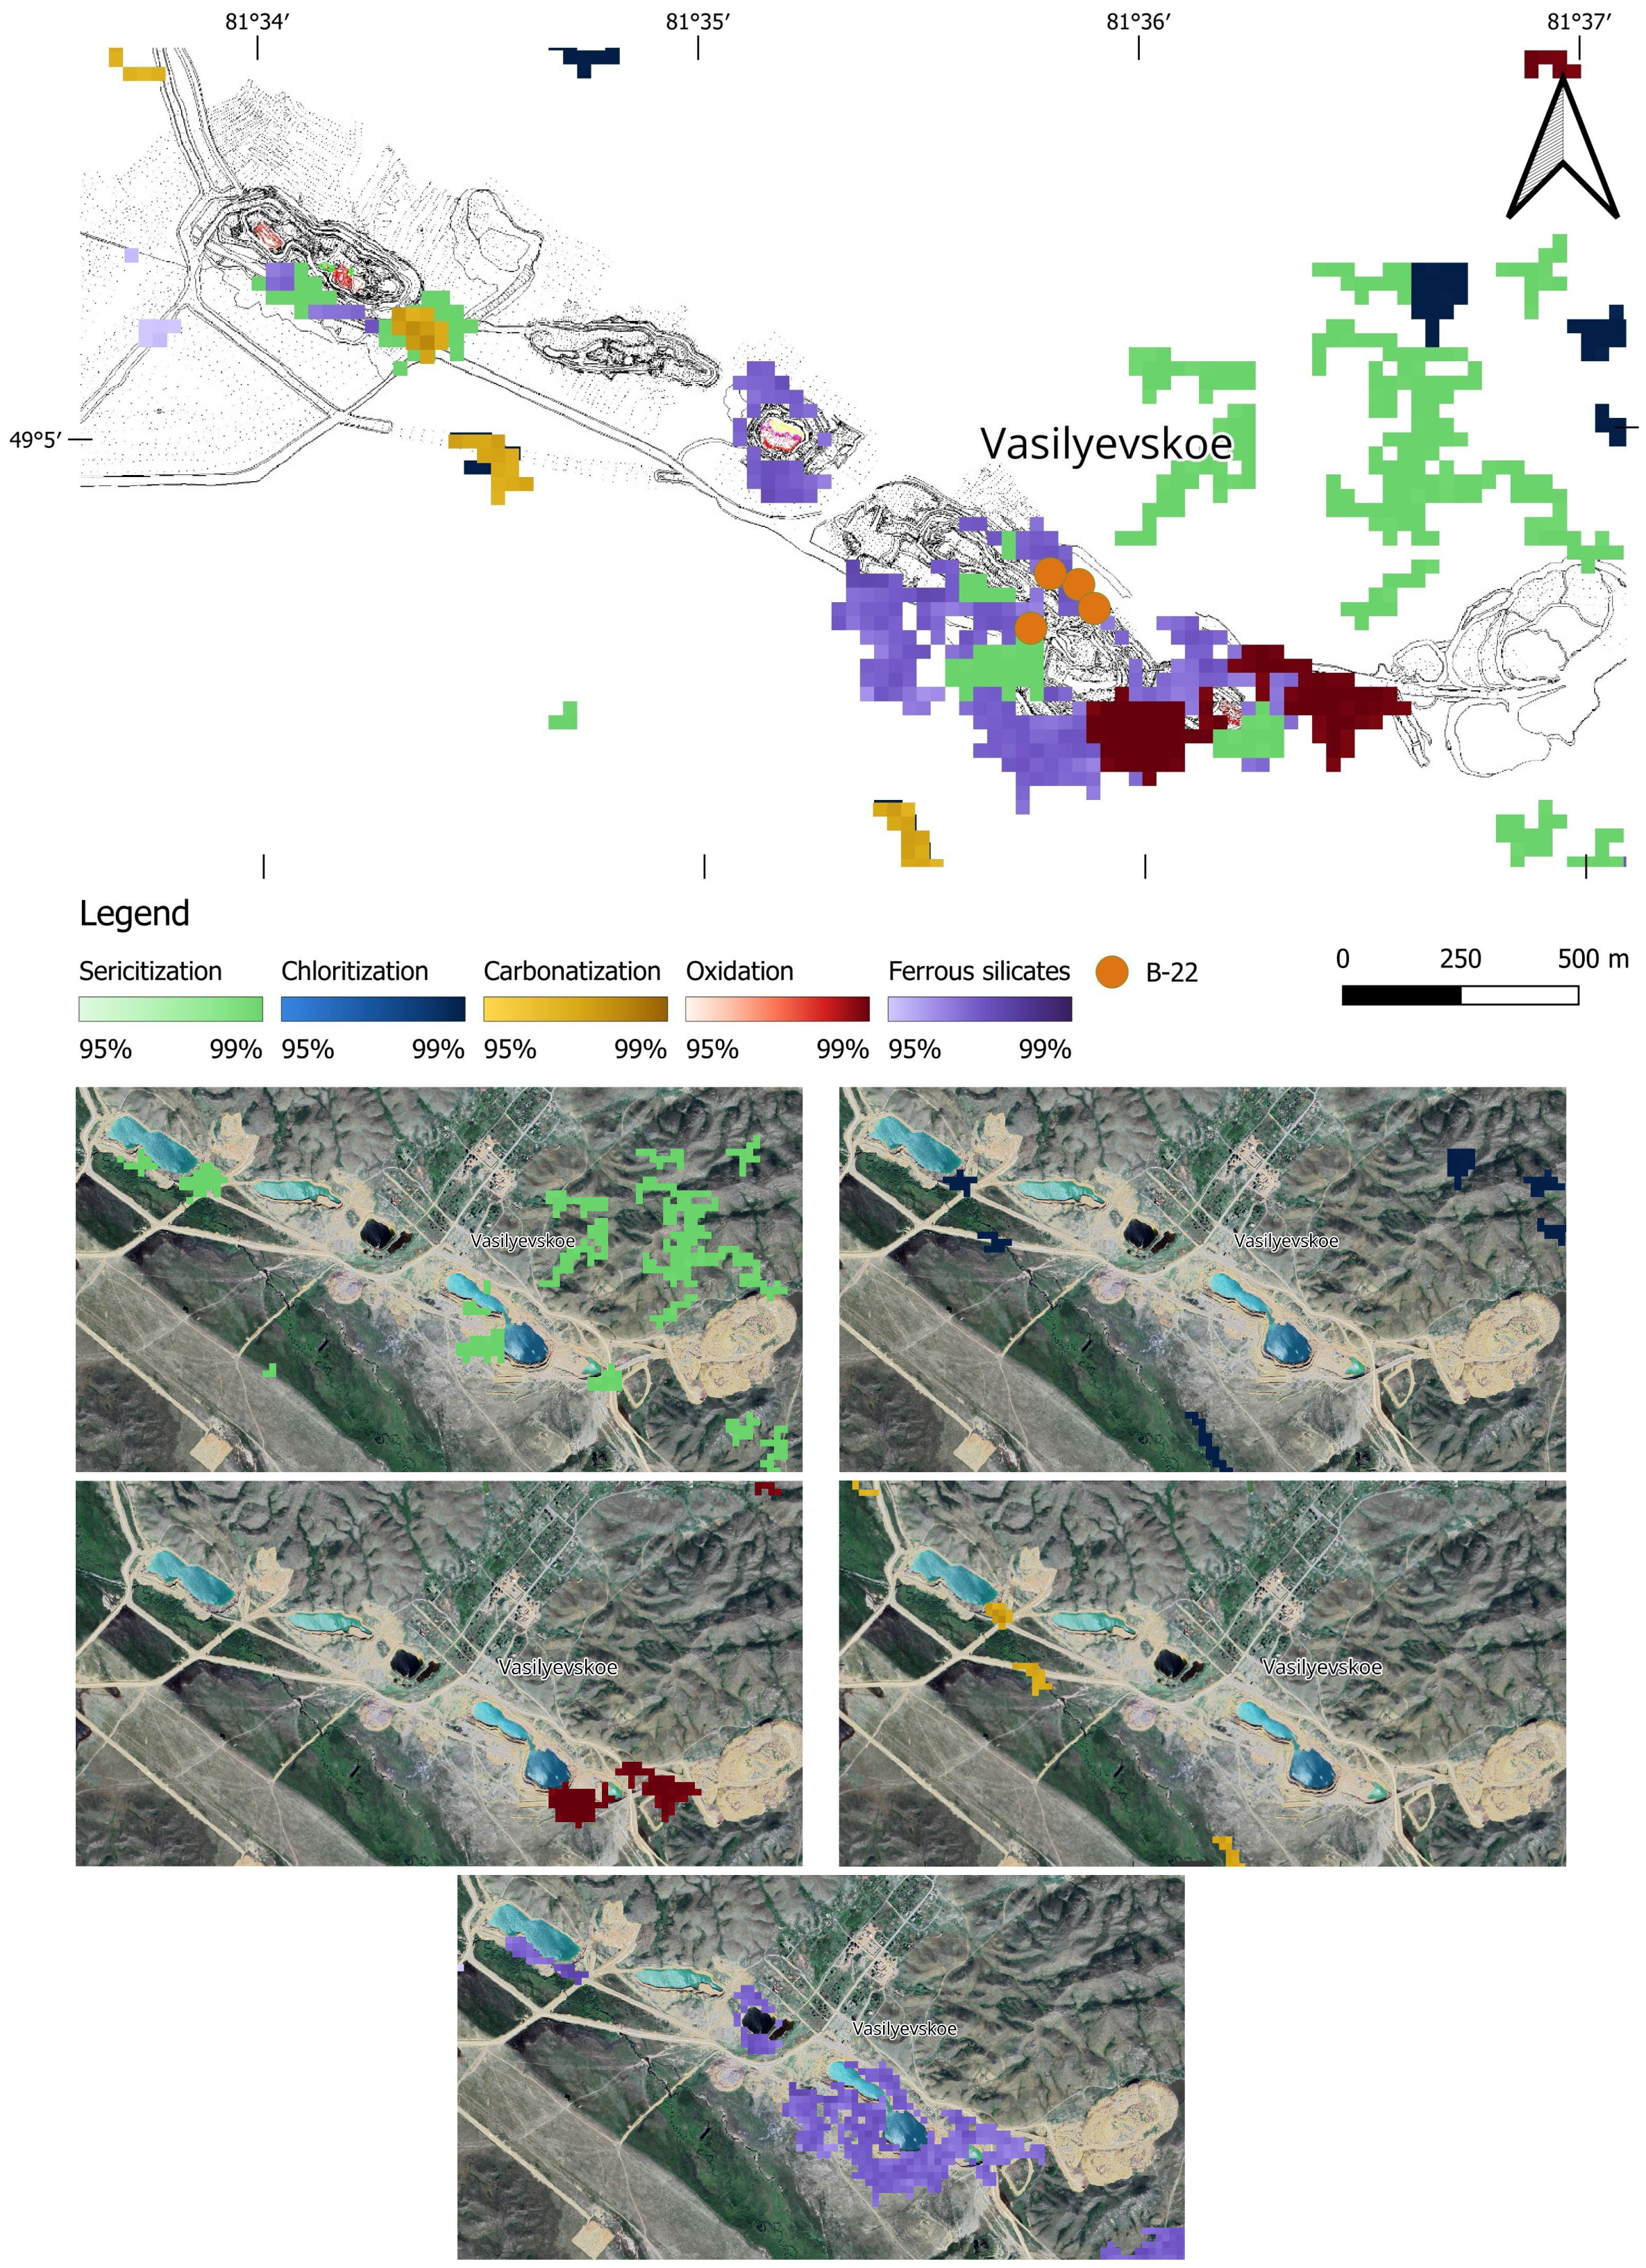
Figure 4. Vasilyevskoye deposit: band-ratio overview map (top) and spatially referenced individual alteration mineral maps.
Geosciences 16 00266 g004
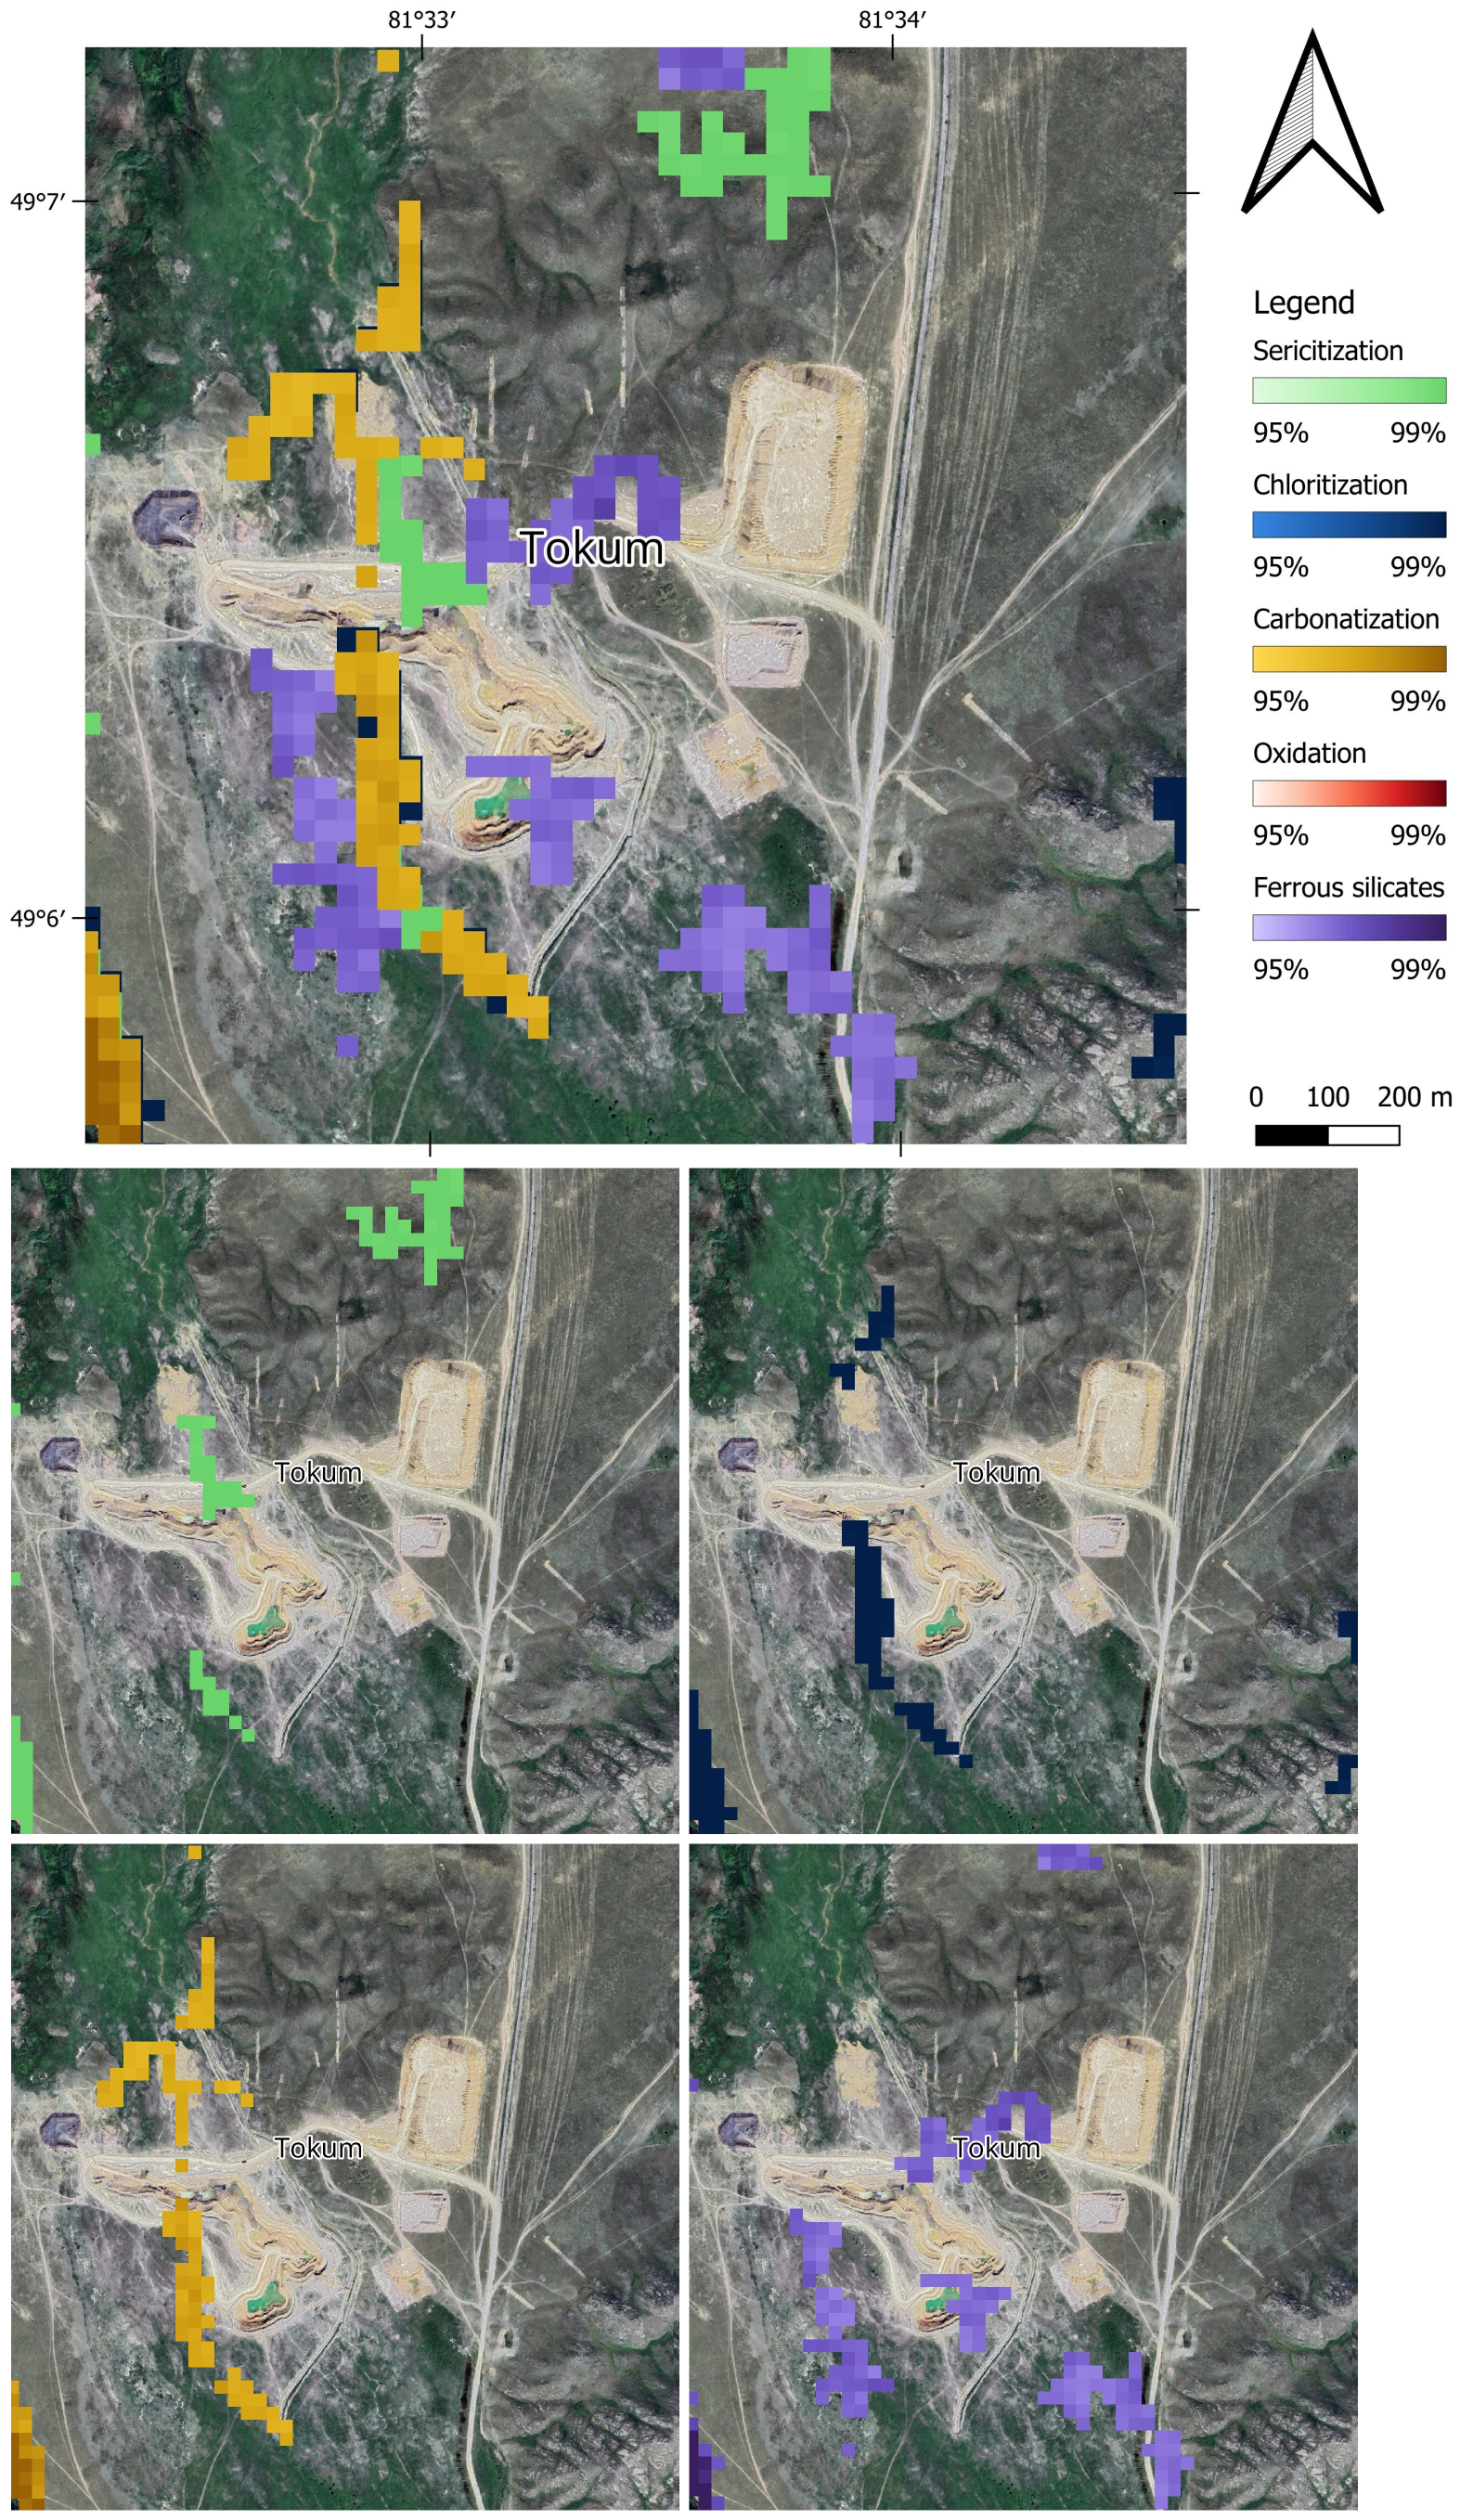
Figure 5. Tokum deposit: overview map (top) and spatially referenced individual alteration mineral maps. The ferric-iron (oxidation, B02/B01) panel is omitted because no pixels within the Tokum footprint met the anomaly threshold defined in Section 4.3.
Geosciences 16 00266 g005
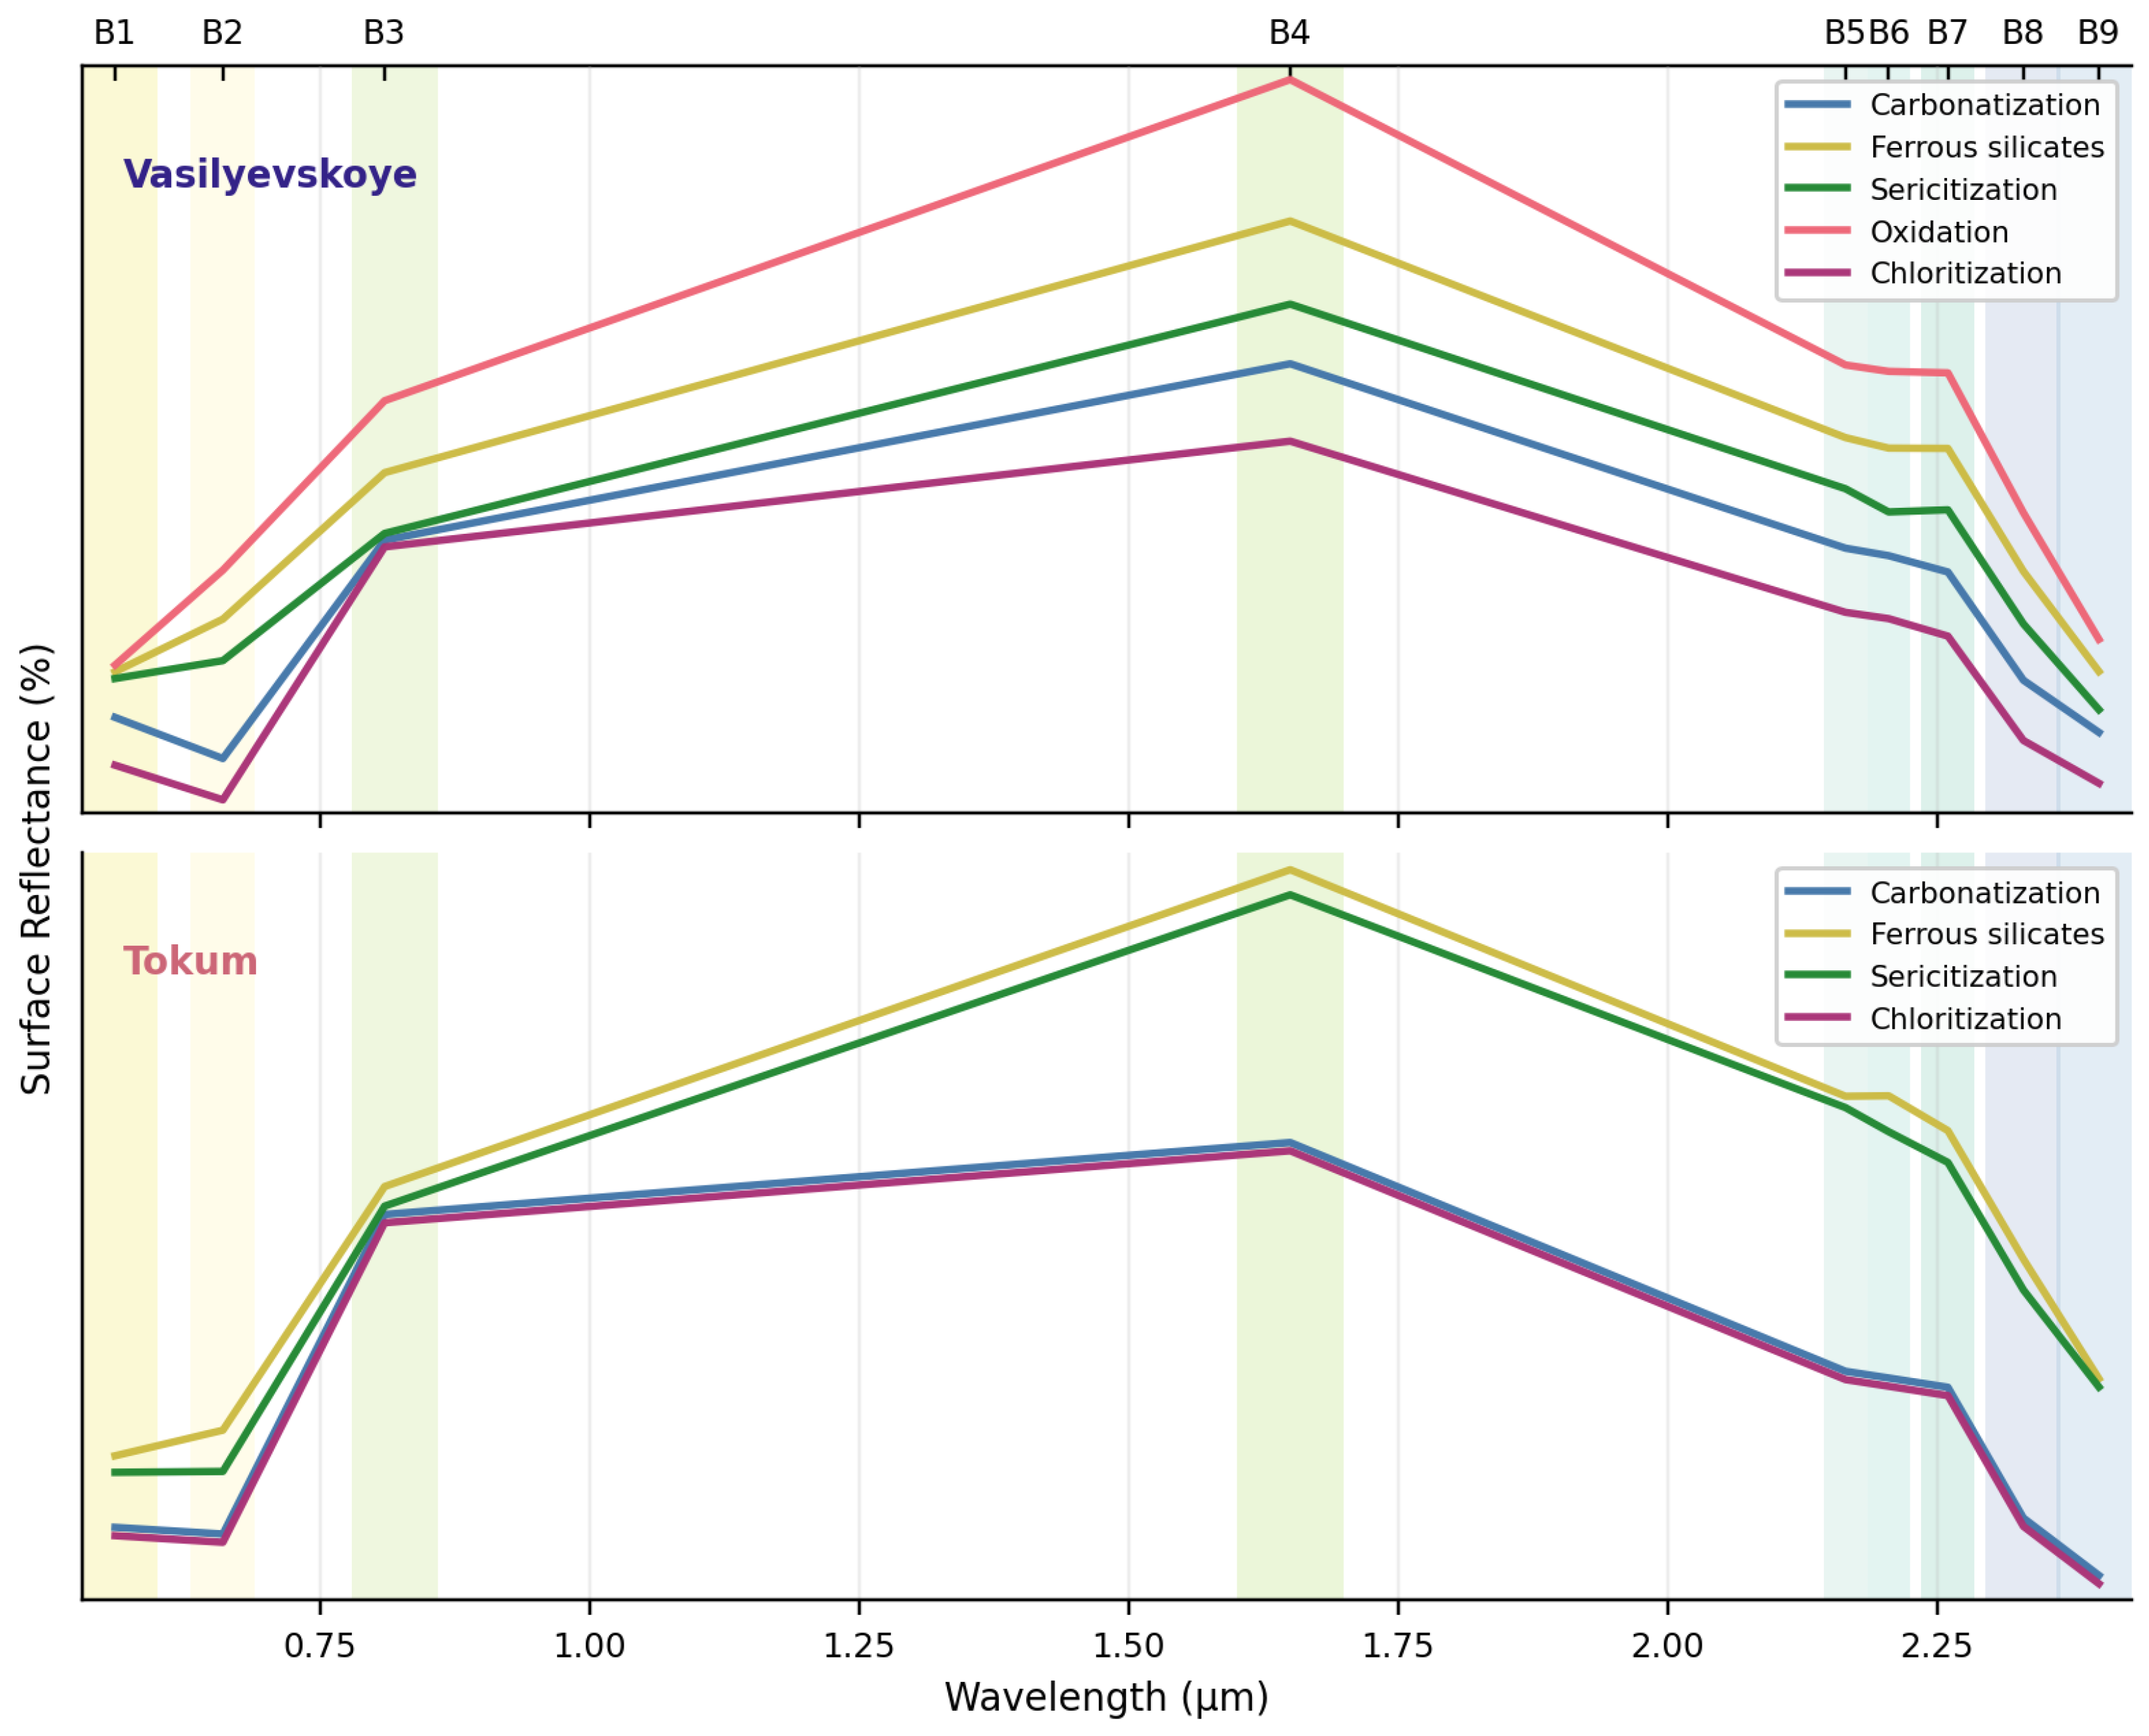
Figure 6. Mean ASTER reflectance spectra by deposit (Vasilyevskoye, Tokum) and alteration type, averaged over band-ratio training polygons (Section 4.4). Colors identify alteration proxies from Figure 4 and Figure 5; pale vertical bands mark B1–B9 centres. Curves vertically correspond to normalized surface reflectance (%) with offset within each panel for readability.
Geosciences 16 00266 g006
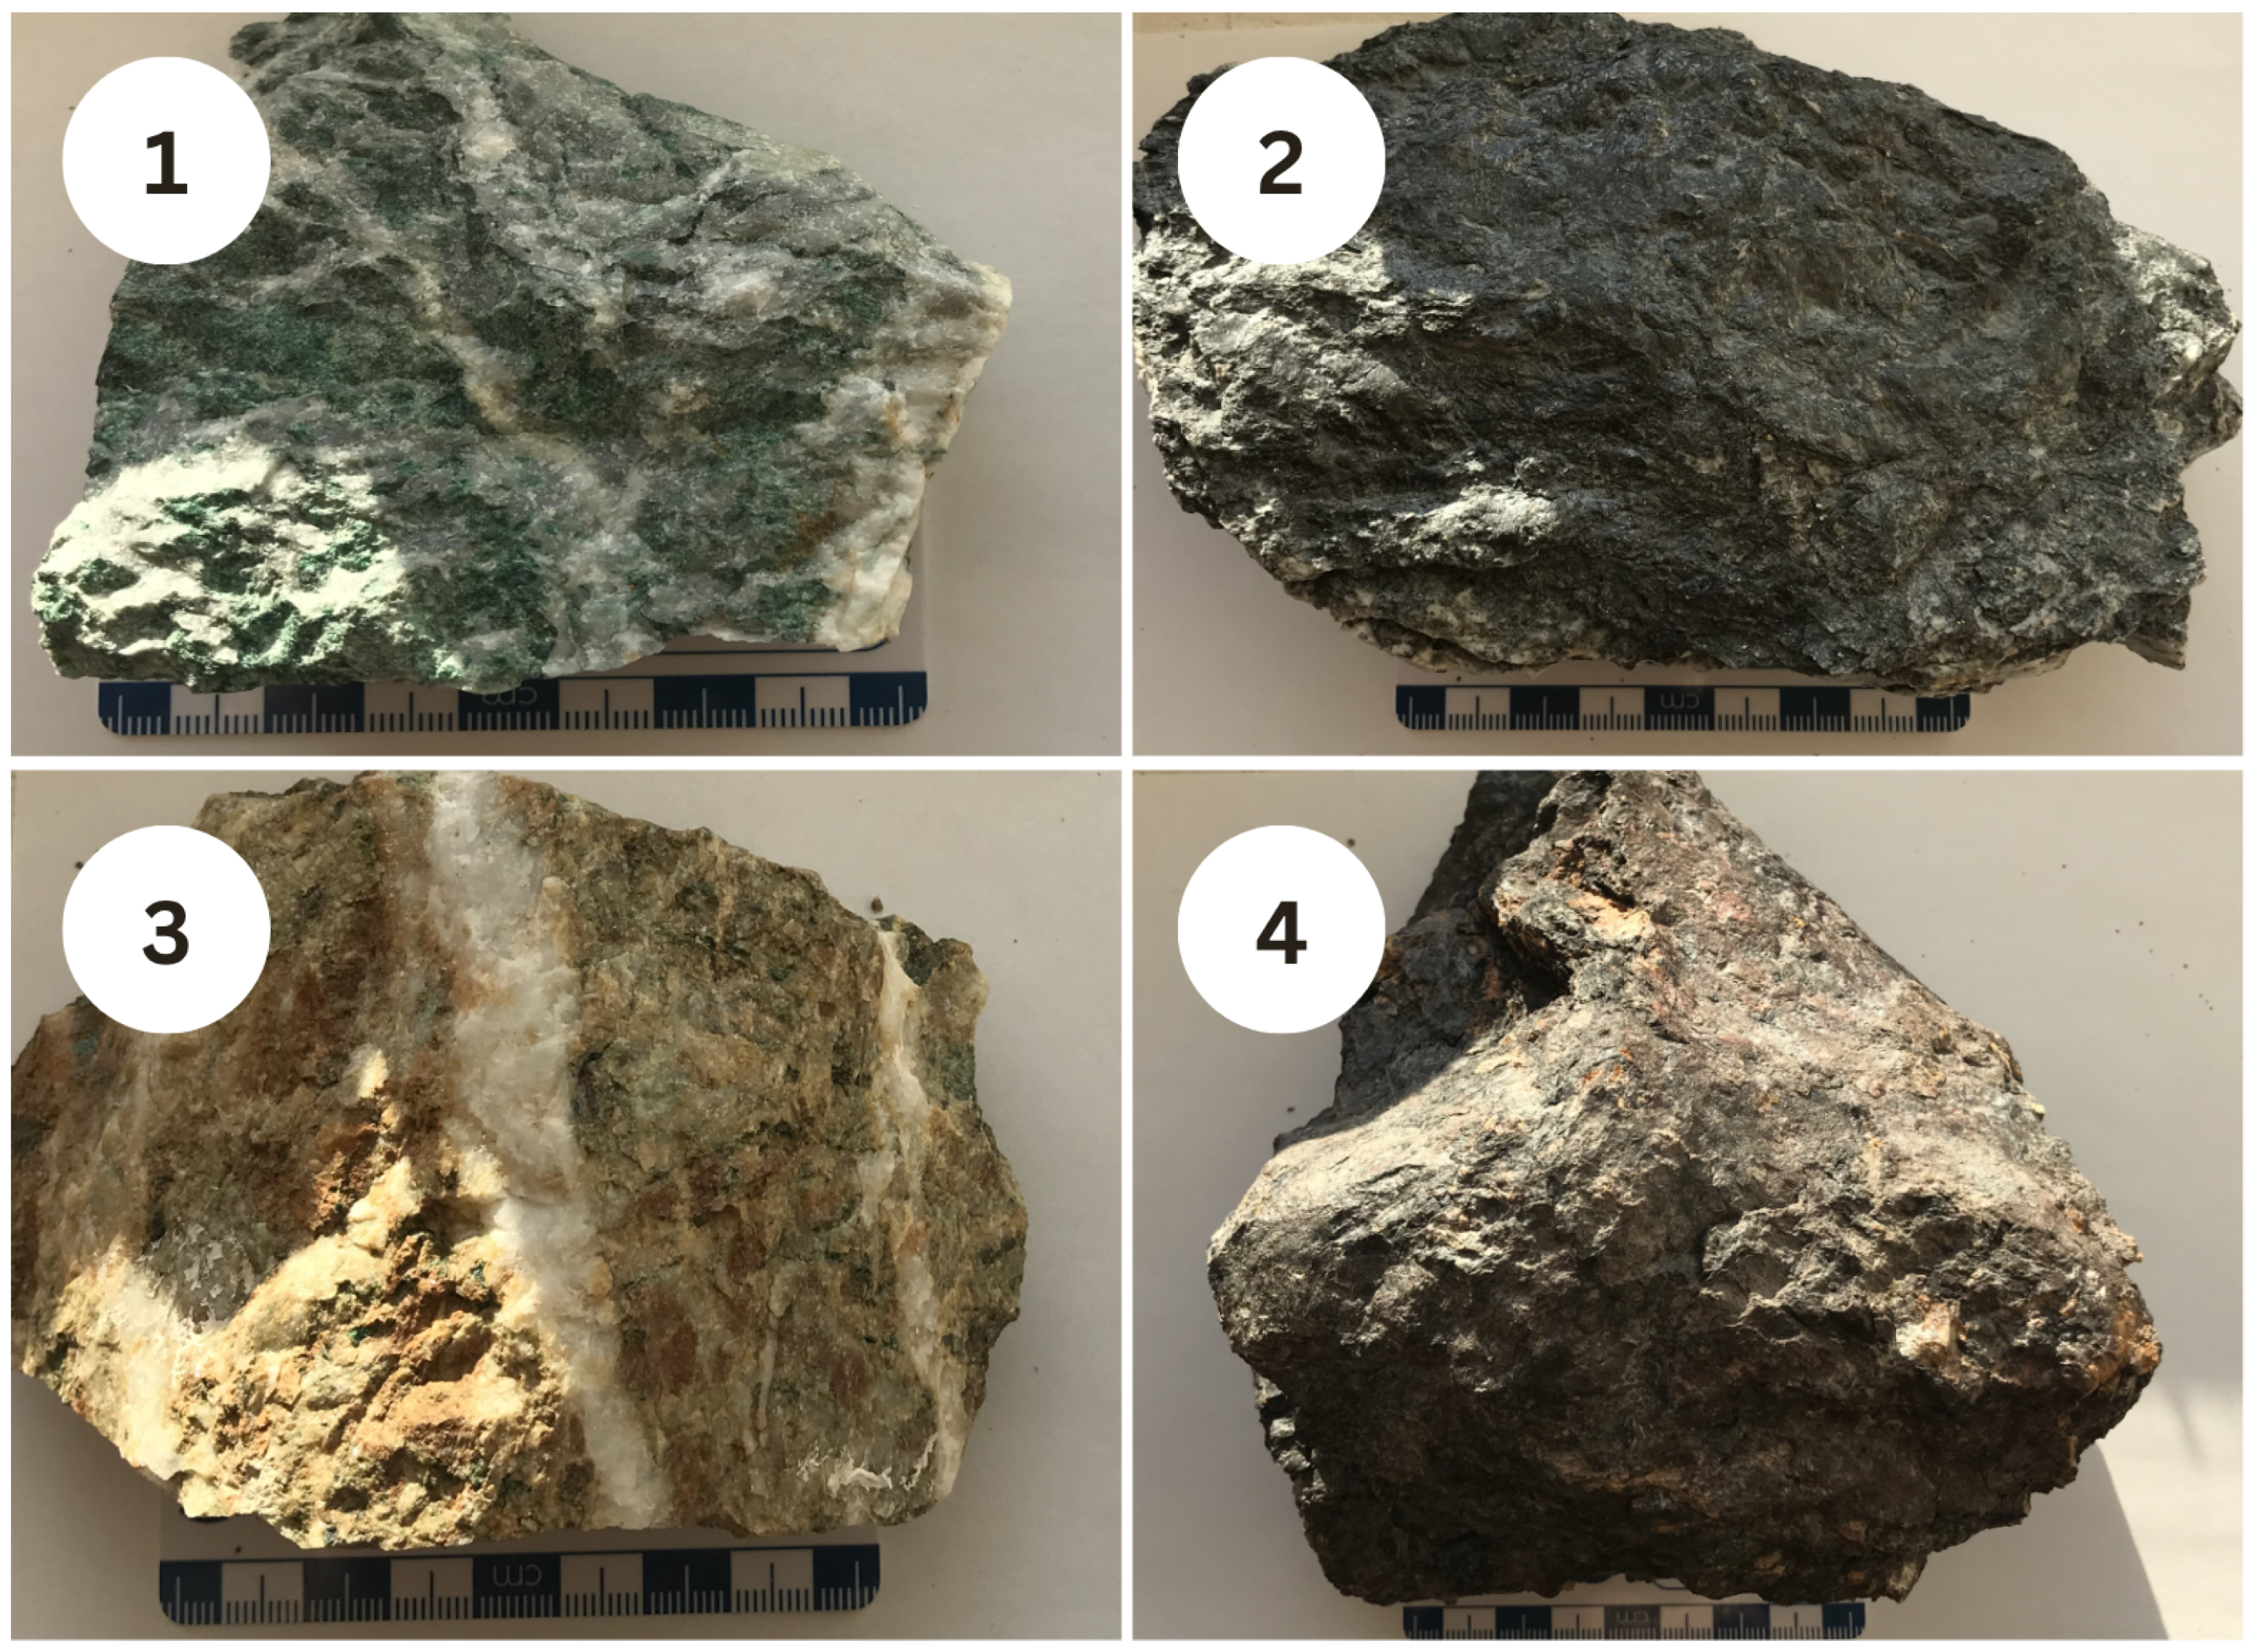
Figure 7. Field samples for validation (Table 4): (1) listvenite, (2) carbonaceous shale, (3) beresite, and (4) other/unclassified.
Geosciences 16 00266 g007
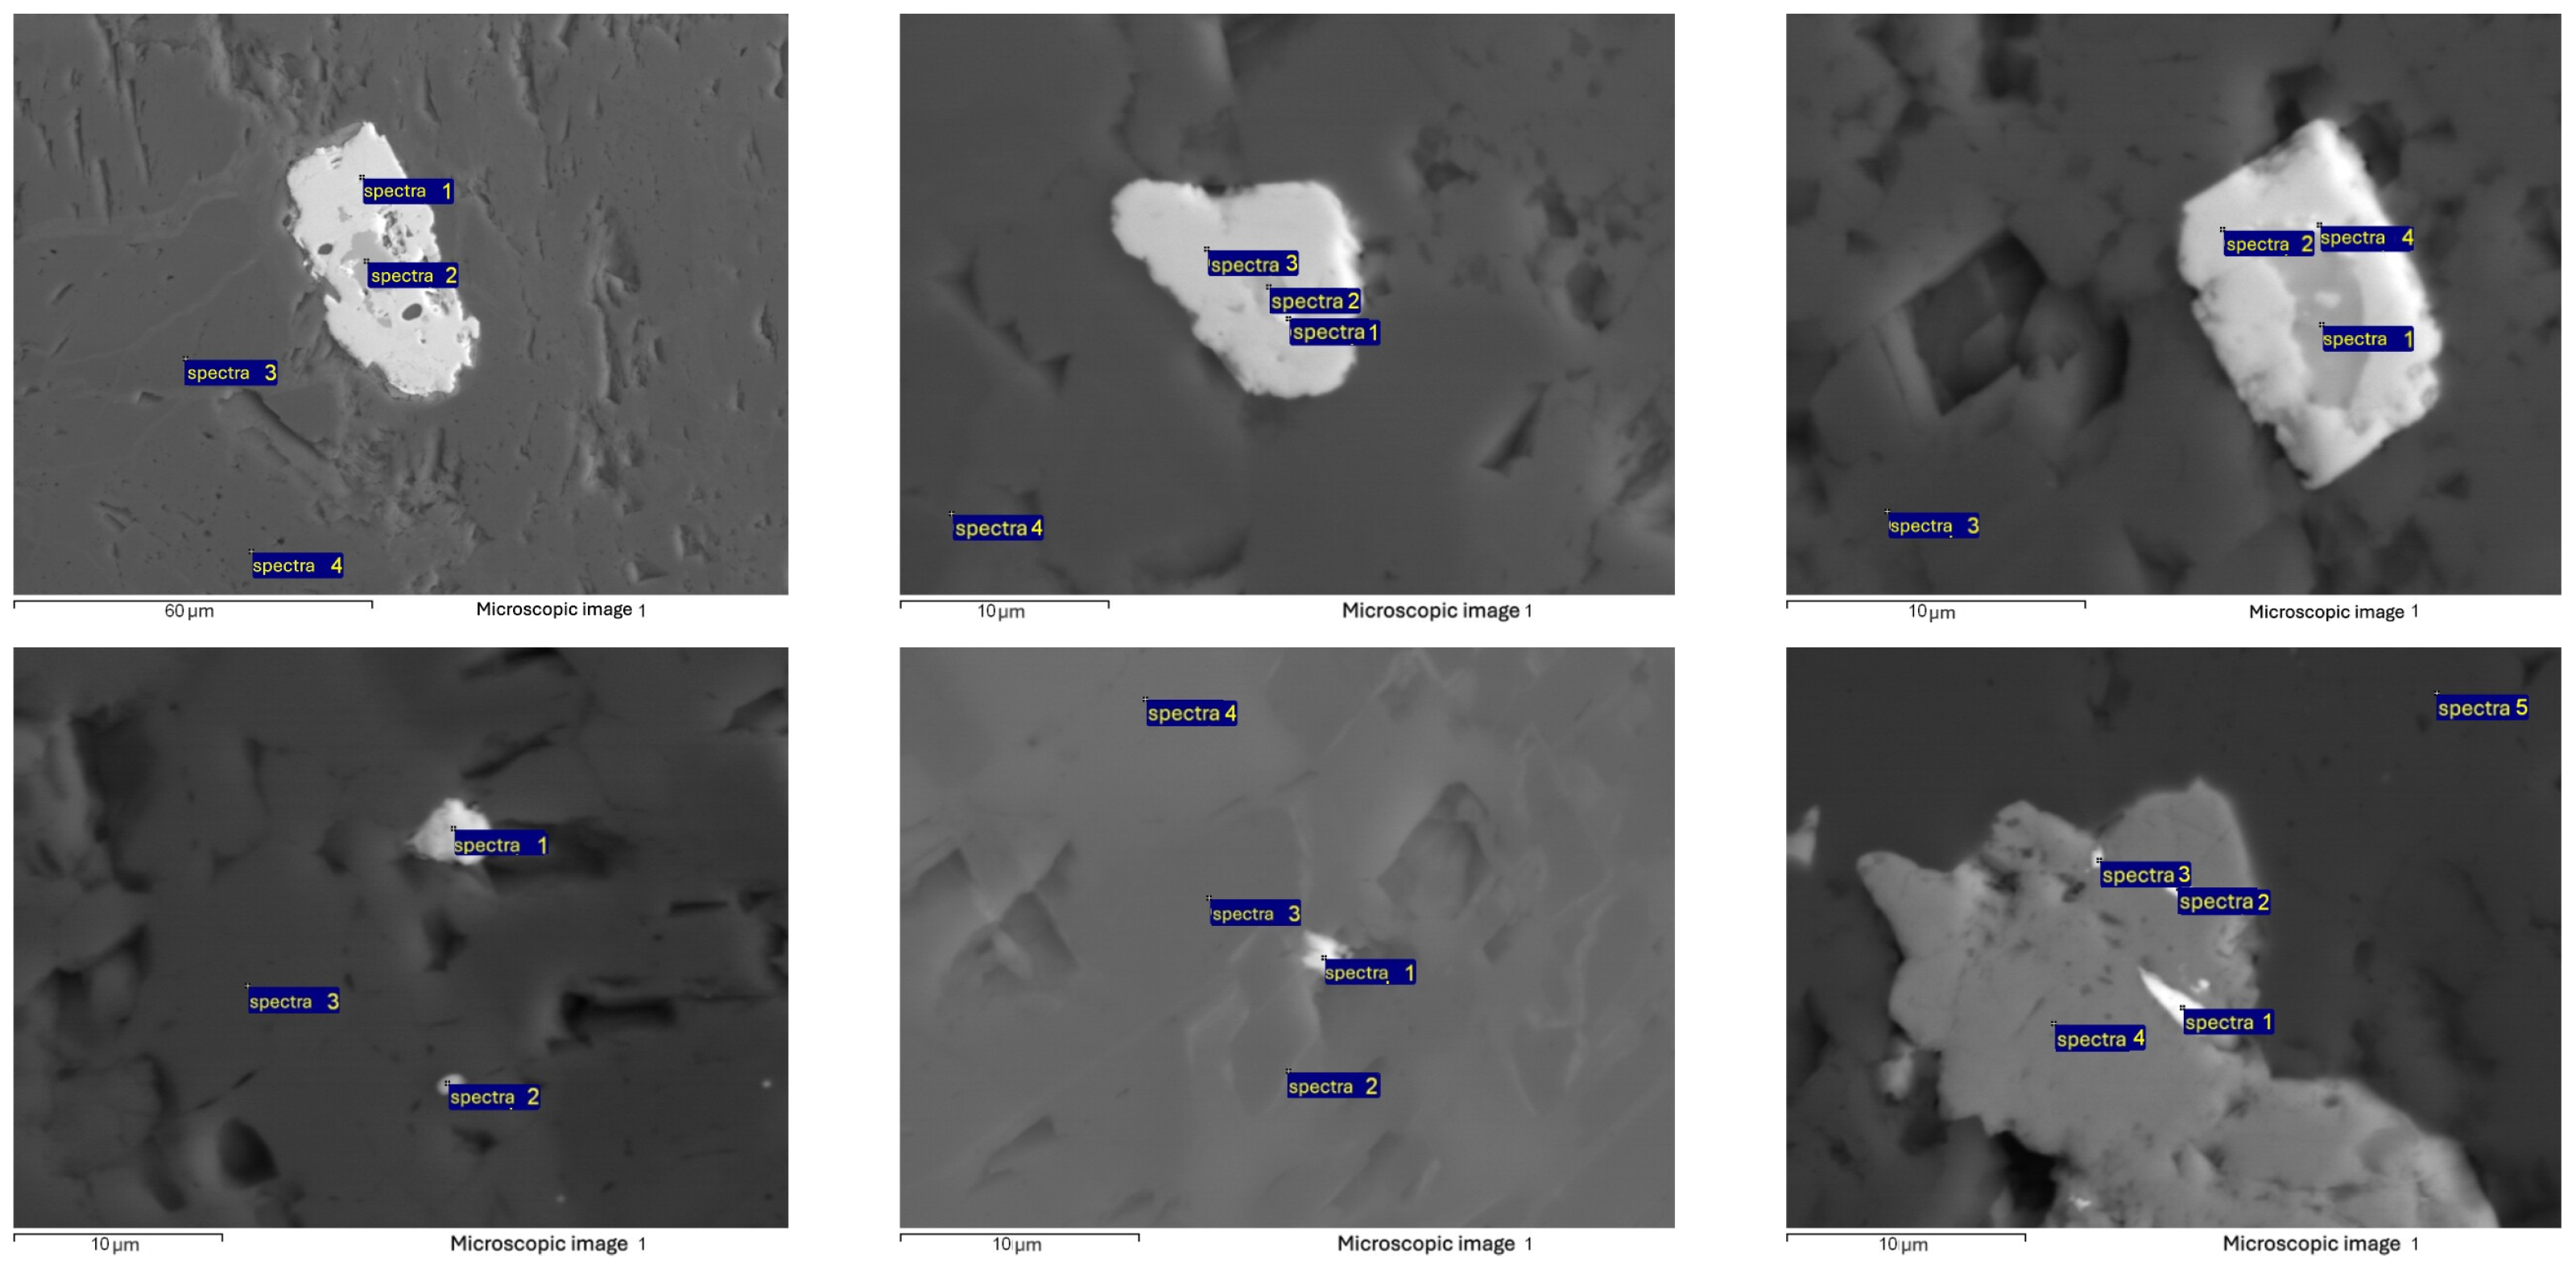
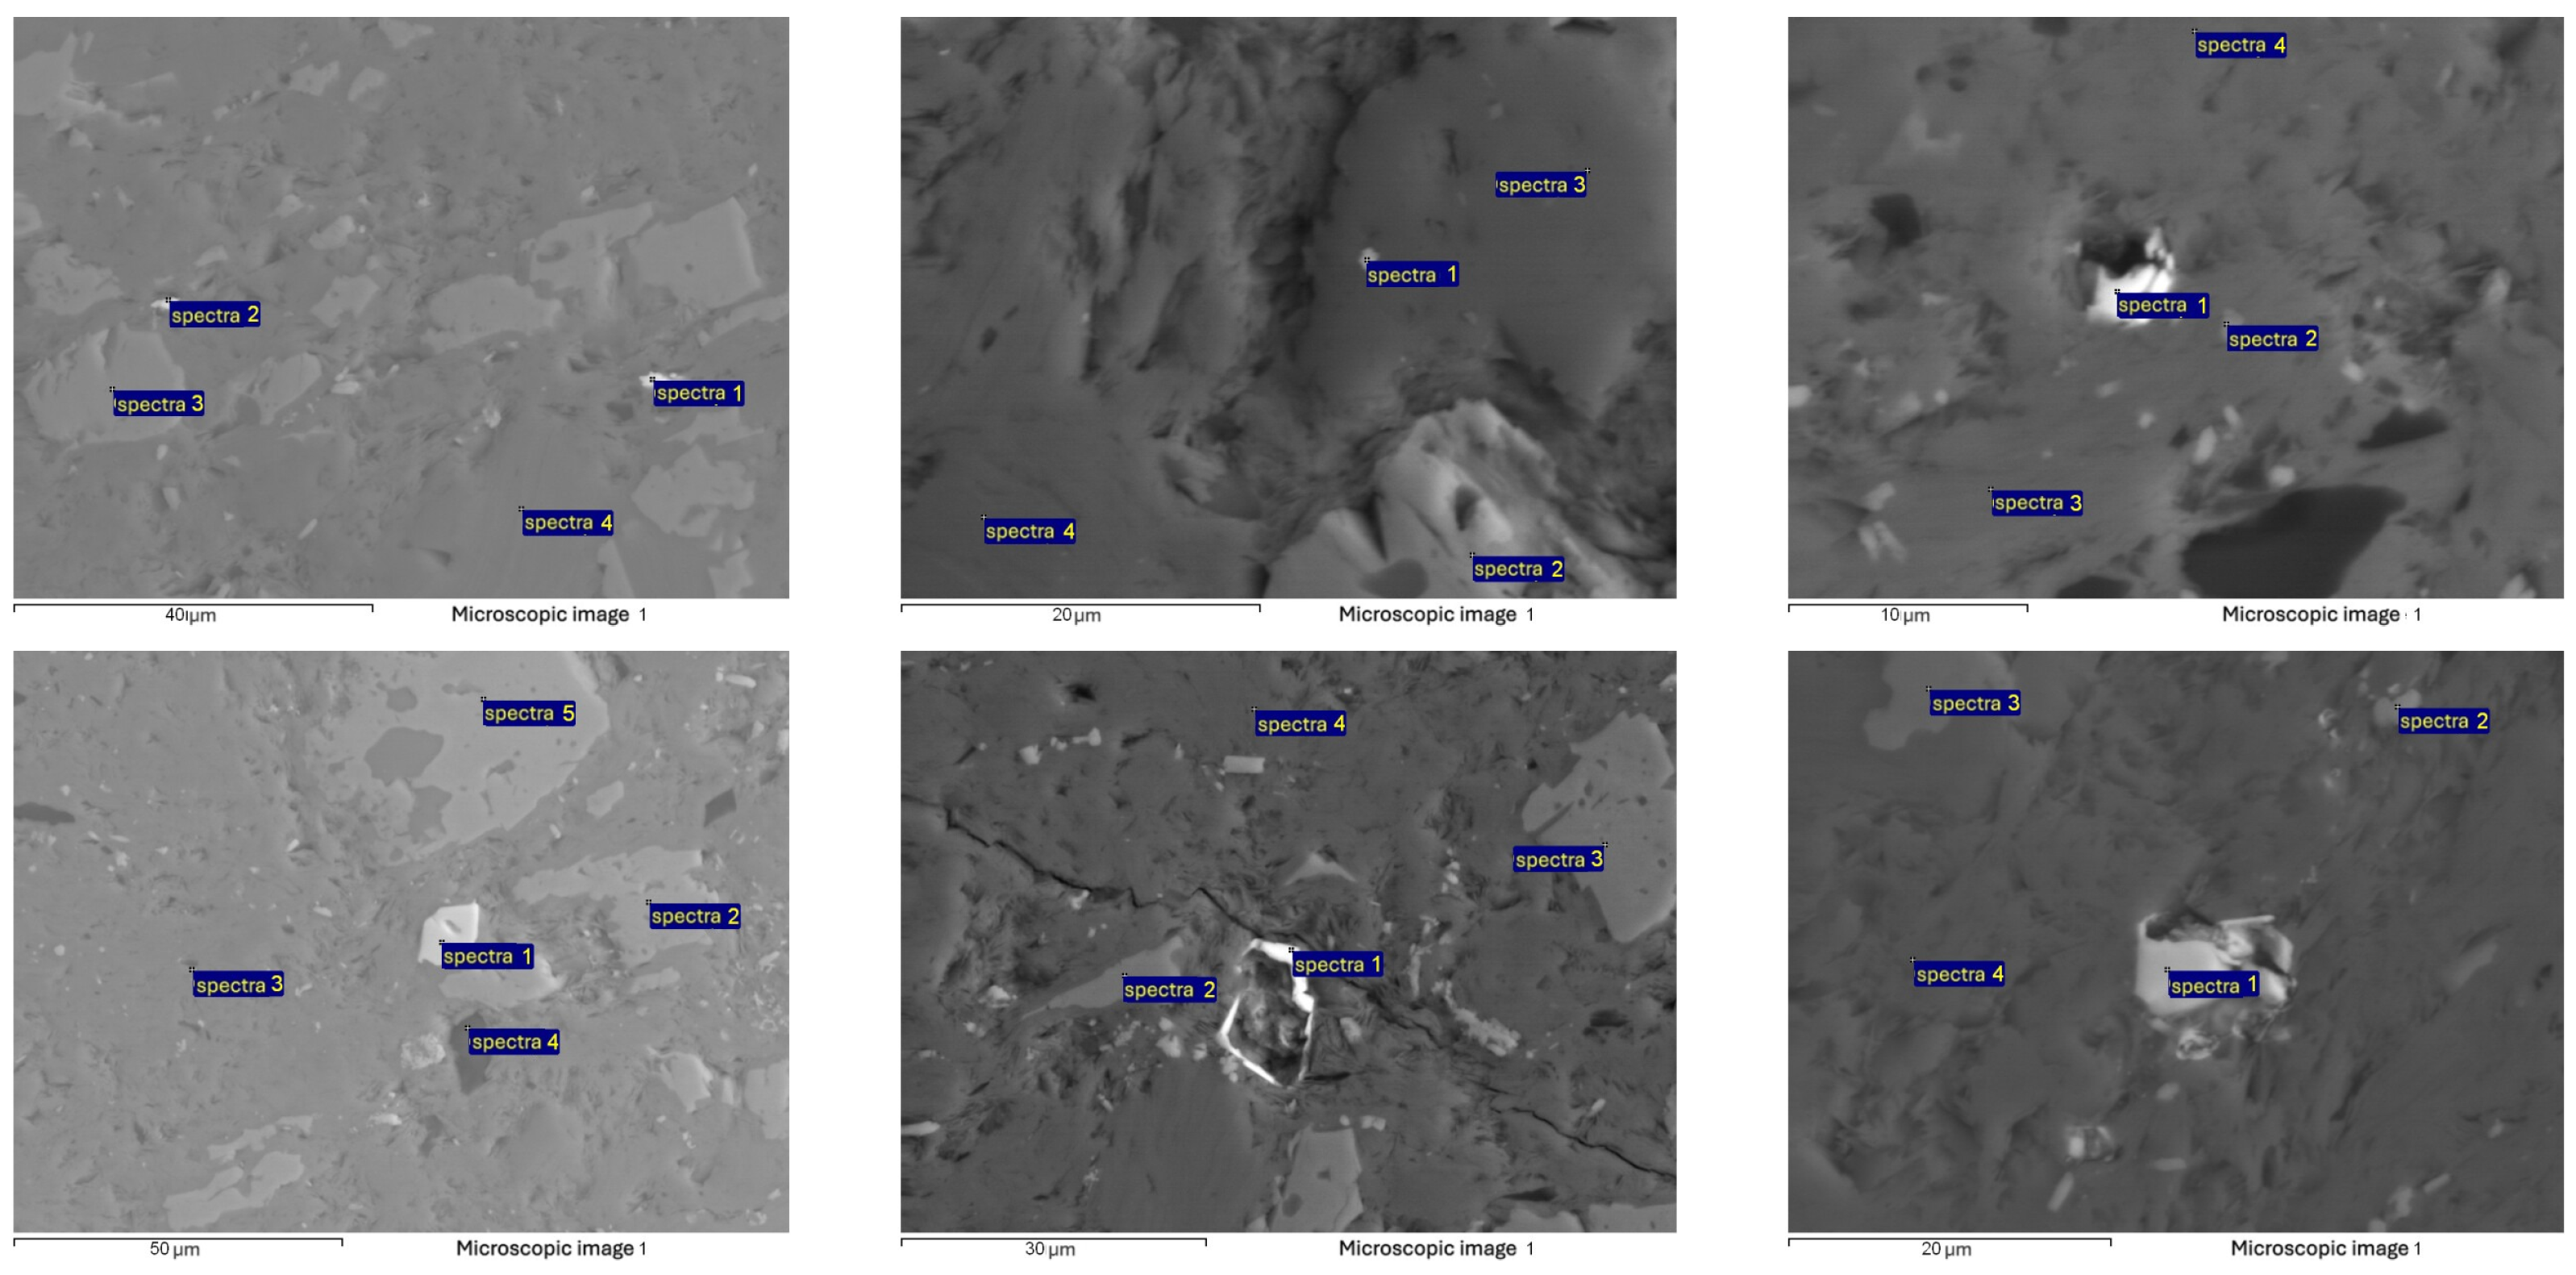
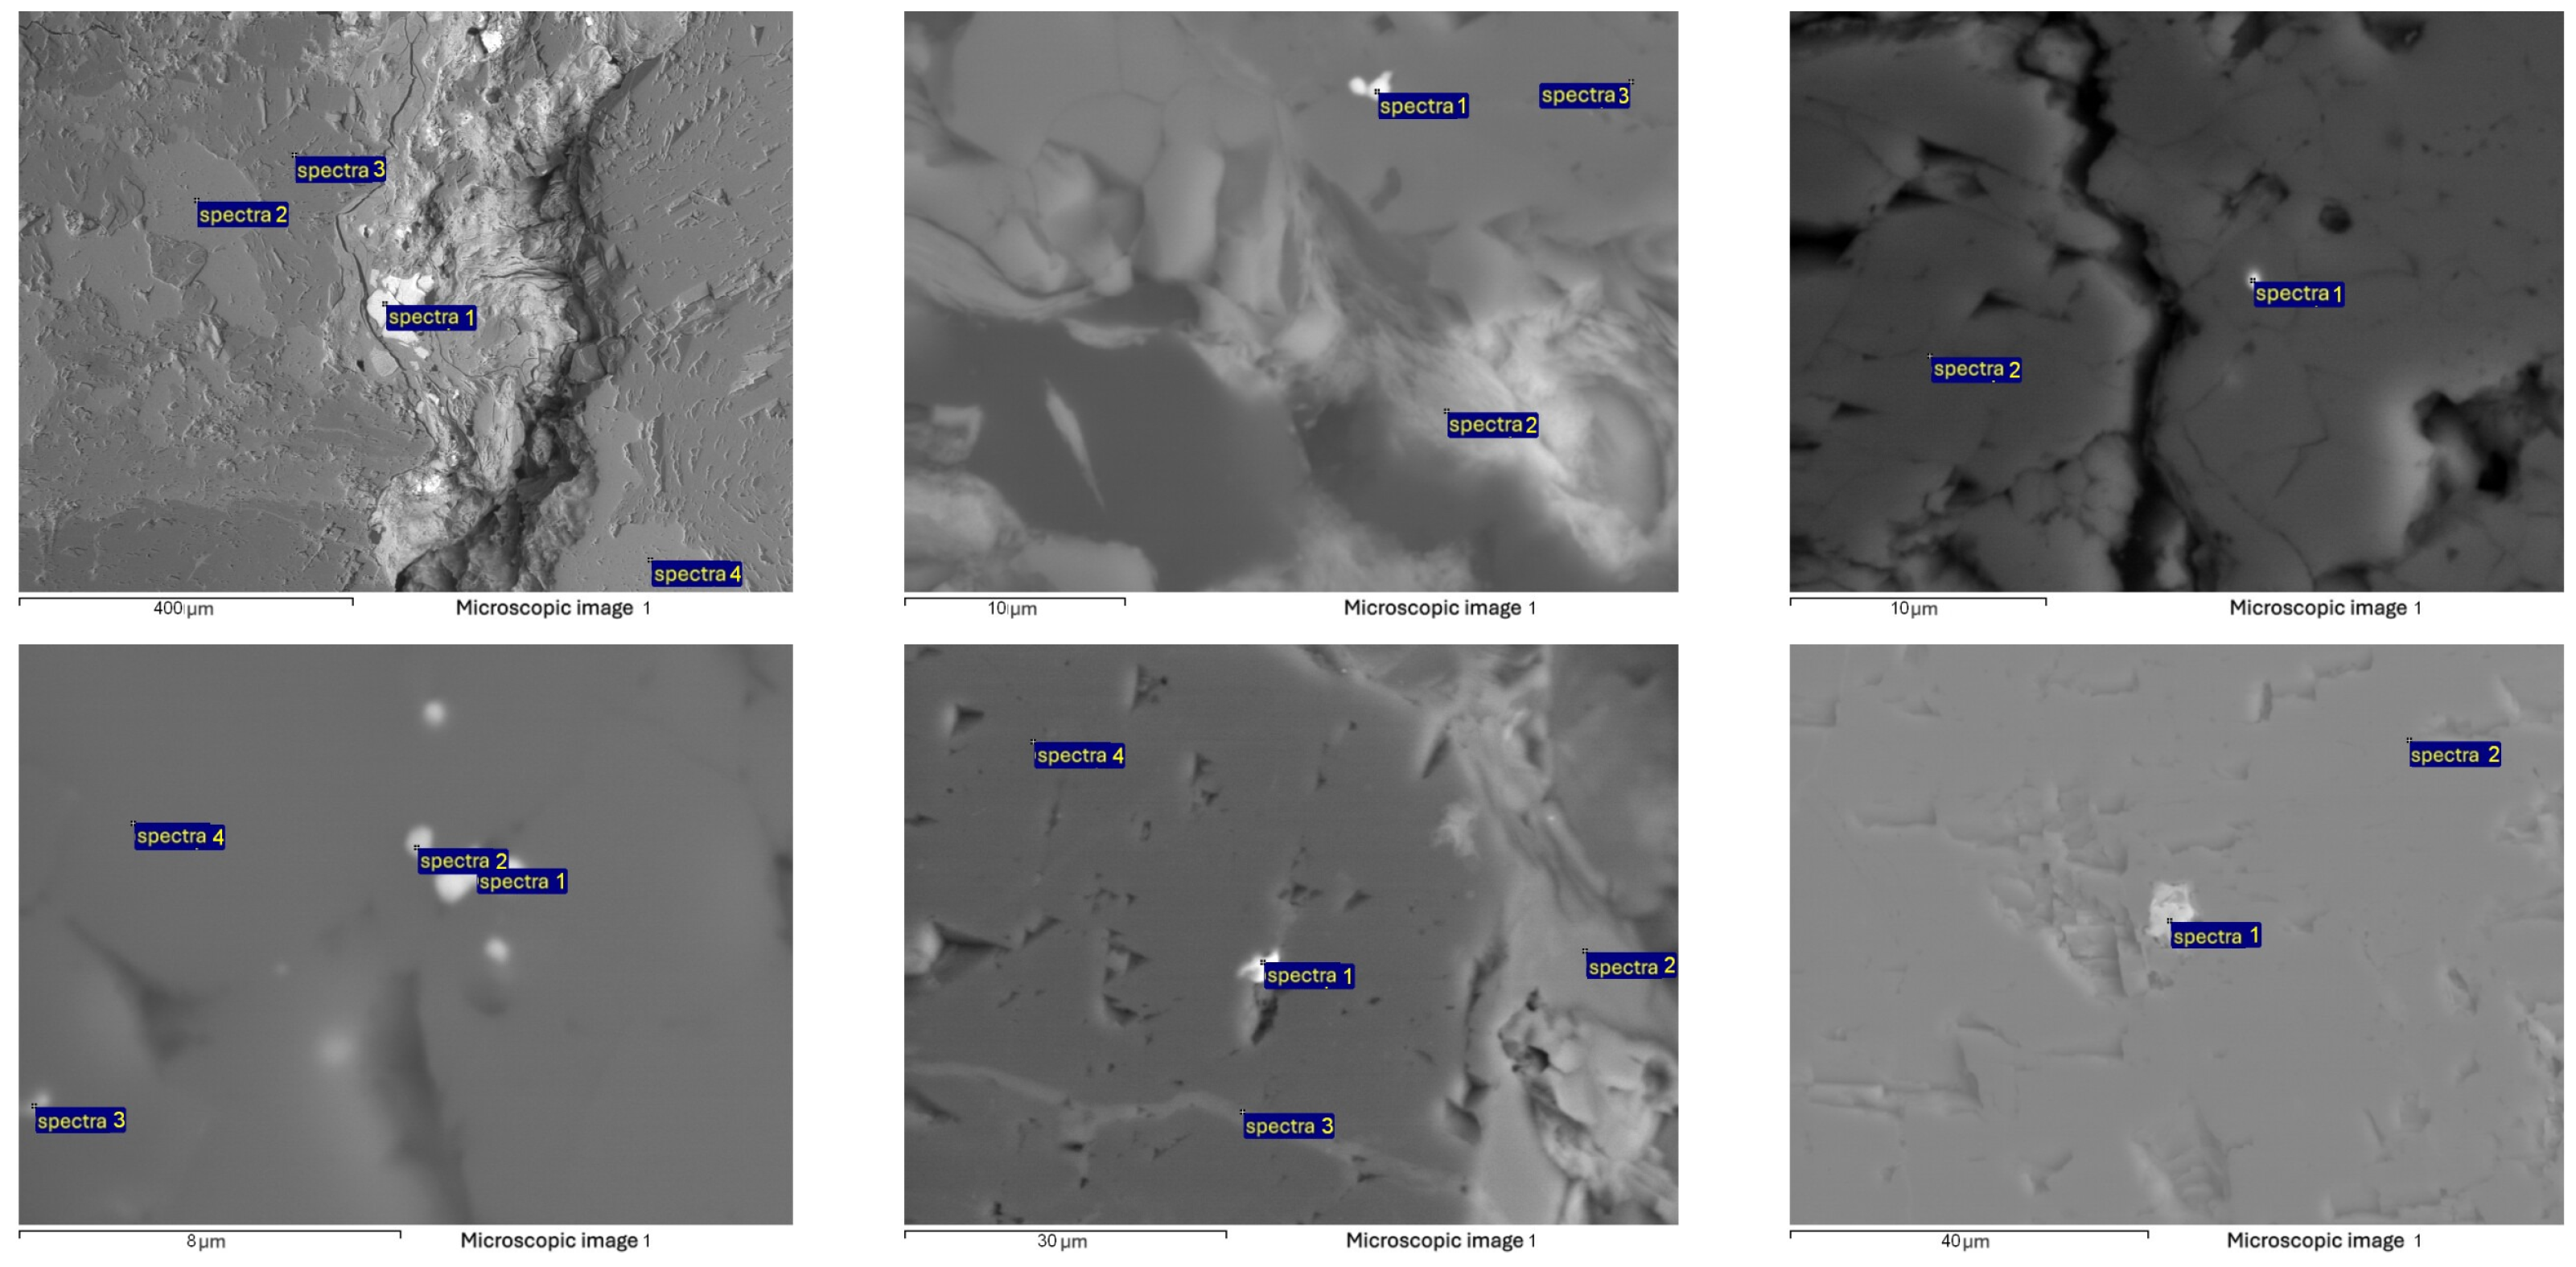
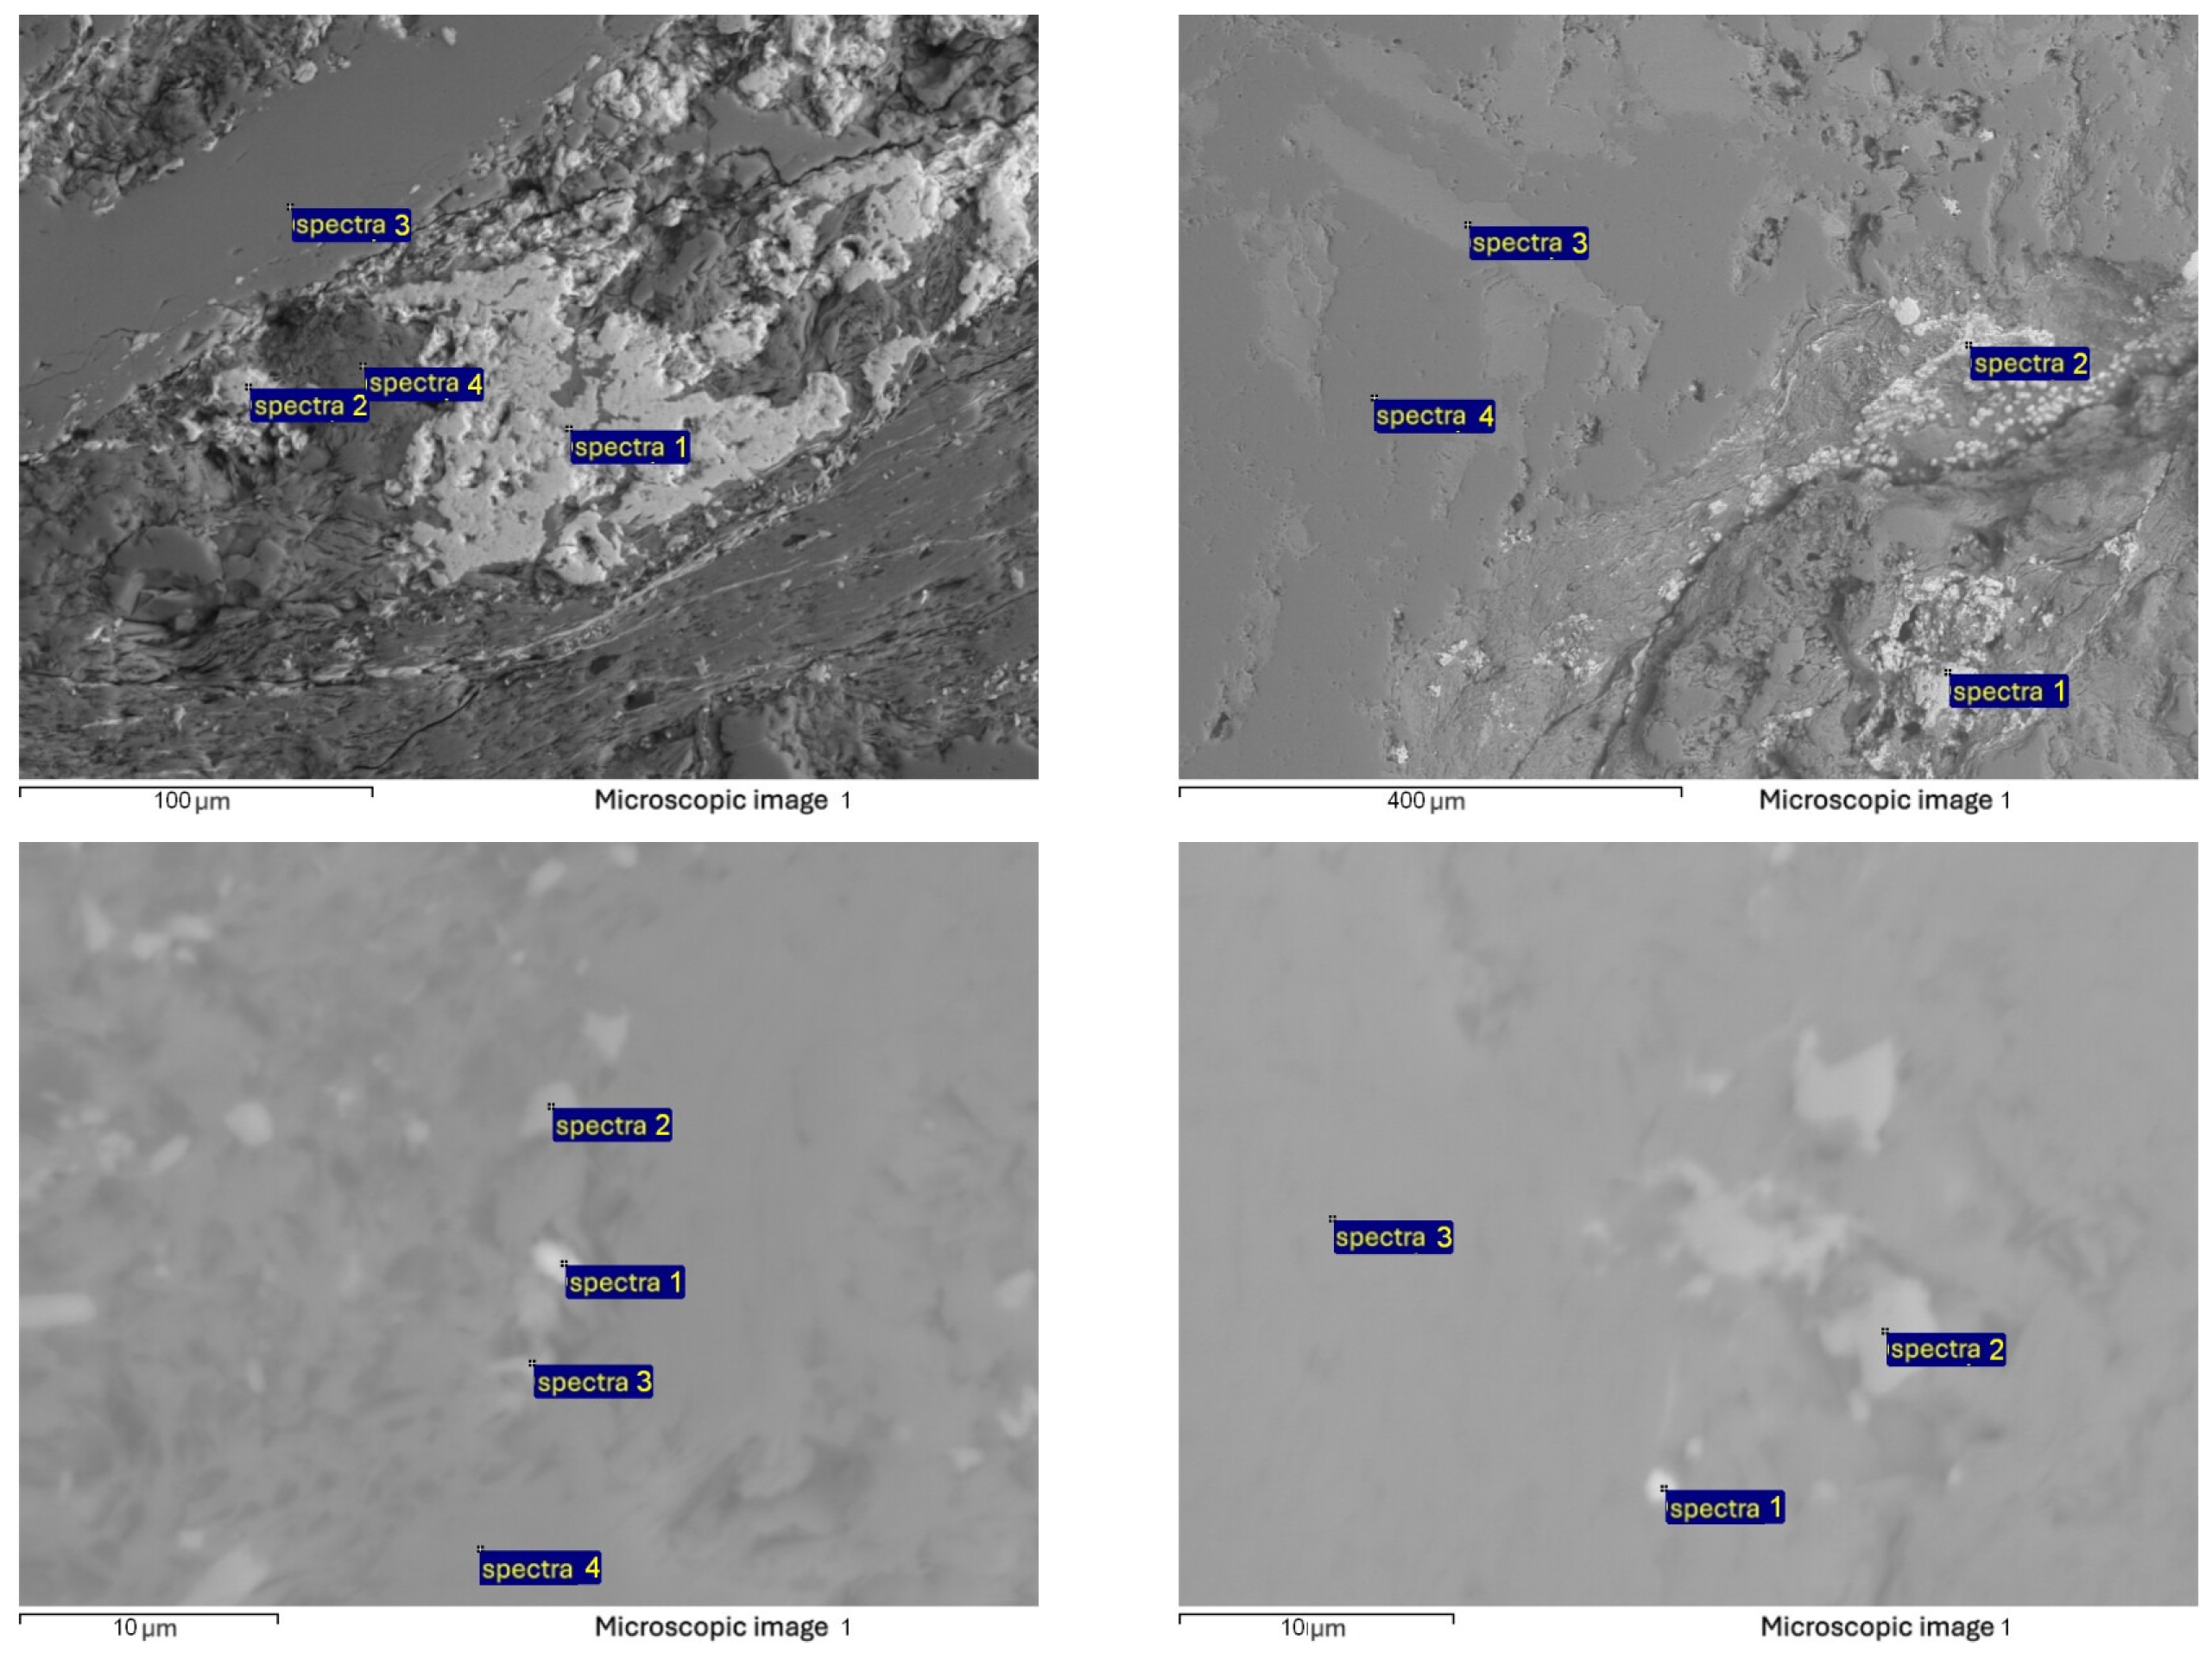
Figure 8. Micrographs; Sample 1. Analysis points 1–6. See Table 4; Figure 12.
Geosciences 16 00266 g008
Figure 9. Micrographs, Sample 2. Analysis points 1–6. See Table 4, Figure 12.
Geosciences 16 00266 g009
Figure 10. Micrographs, Sample 3. Analysis points 1–6. See Table 4, Figure 12.
Geosciences 16 00266 g010
Figure 11. Micrographs, Sample 4. Analysis points 1–4. See Table 4, Figure 12.
Geosciences 16 00266 g011
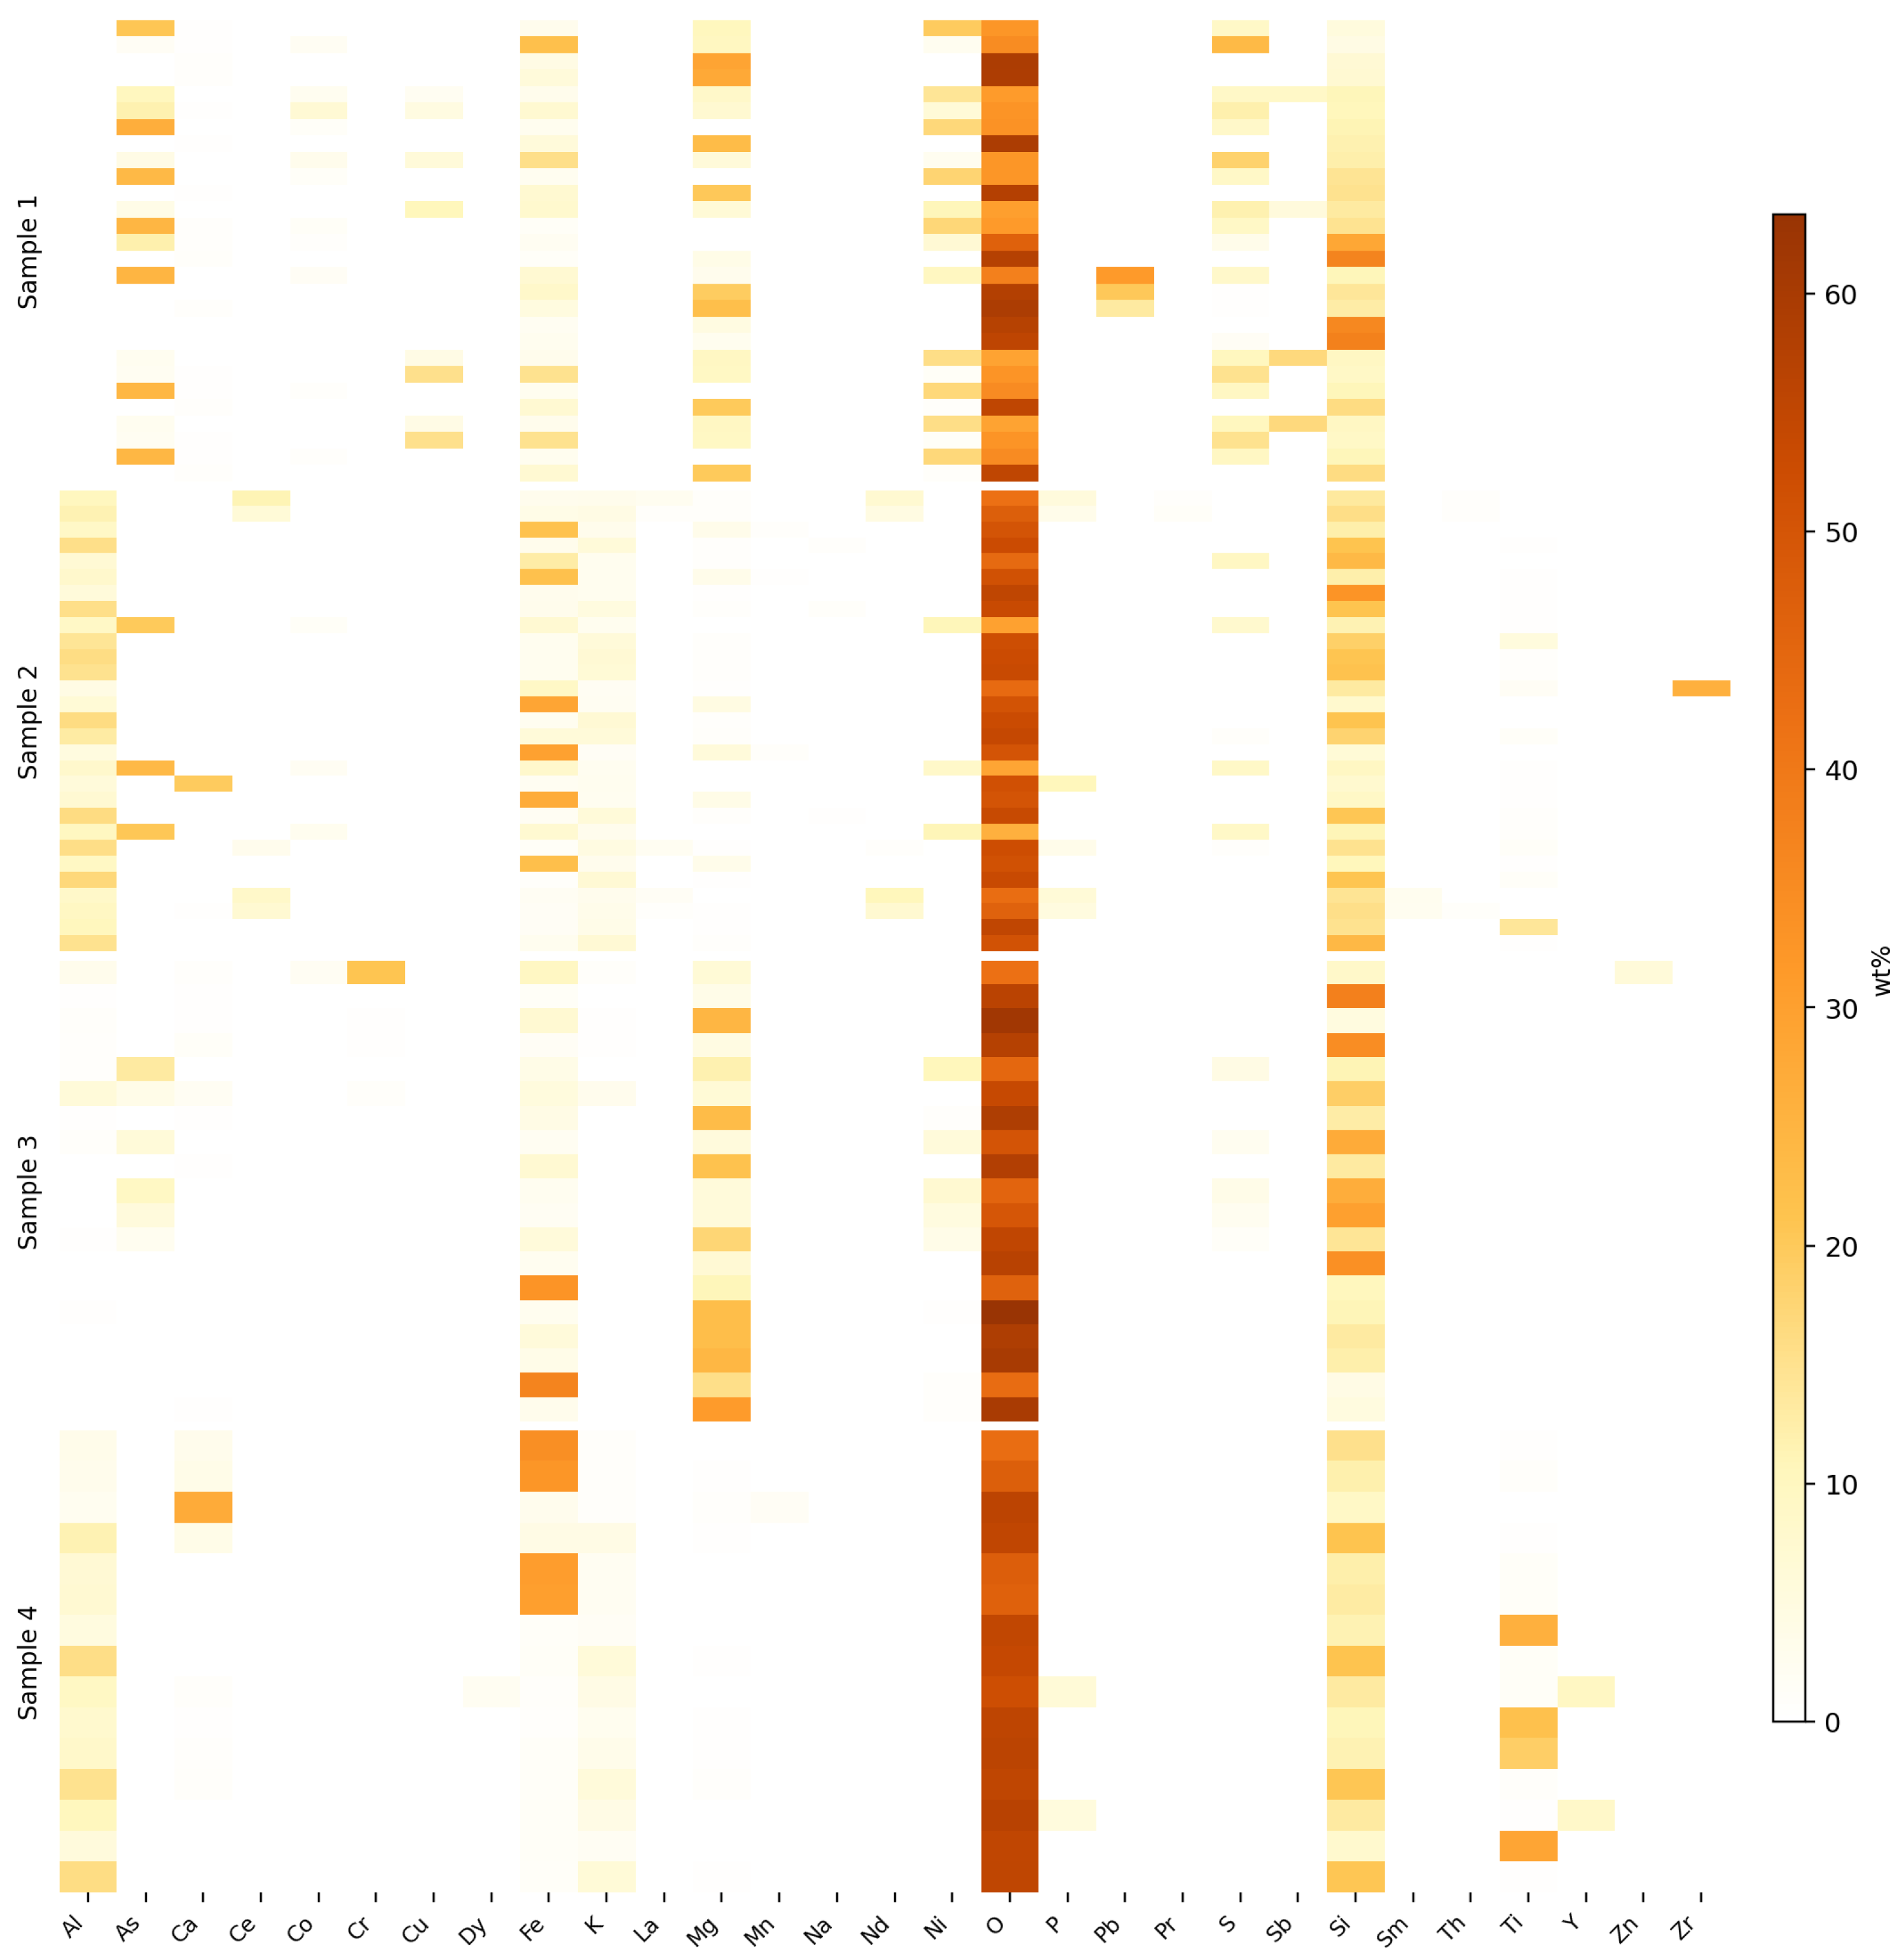
Figure 12. SEM–EDS spot spectra summarized as a wt% heatmap of element abundances for Samples 1–4 stacked vertically. Each row corresponds to one spectrum. Heatmap colors show raw wt% from 0 to maximum.
Geosciences 16 00266 g012

5. Results

5.1. Alteration Mapping Across the District and at Each Deposit

At the district scale, the strongest spectral framework is built from Al–OH (sericitic) ratios nested within Mg–OH and carbonate halos, outlining beresite–listvenite halos around sulfide corridors along faults. Ferric and ferrous-silicate responses are more discontinuous and partly capture mixed pixels where chlorite-bearing wall rocks, sericitized beresite, and oxidative caps co-exist. This architecture is consistent with the structurally hosted, sulfide-related metasomatism described for the belt [1,4].
The chloritization (B07/B09) and carbonatization (B09/B08) proxies are not independent at the ASTER bandwidth. Both ratios respond to absorption features that fall within Band B8 (Mg–OH near ∼2.31–2.33 µm and CO3 near ∼2.30–2.35 µm), so the two maps co-vary and should be read as complementary emphases on the same SWIR composite feature rather than as unique chlorite versus carbonate discriminators.
The regional map (Figure 3) highlights contiguous Al–OH sericitic footprints nested with broader Mg–OH and carbonate halos, with more patchy ferric iron concentrated on exposed surfaces.
Ferrous-silicate anomalies (B05/B04) track Fe2+-bearing phyllosilicate mixtures that bridge sericitic corridors and chloritic halos at 30 m resolution. They complement the B07/B09 Mg–OH map and do not indicate free silica flooding. Silicification and ferrous-silicate enrichment can in fact be antithetic where intense quartz replacement leaches ferromagnesian minerals [43]. Ferric ratios flag weathering rather than direct sulfide detection. Local studies of pyrite–arsenopyrite cores framed by sericitization and chlorite–carbonate halos are consistent with the mapped ASTER architecture [4,26]. Band-ratio masking followed Section 4.3, with additional screening of clouds, surface water, and vegetation. Figure 3, Figure 4 and Figure 5 show anomaly narrowing toward the deposit cores.
At Vasilyevskoye (Figure 4), the strongest spectral anomalies pair inner sericitic ratios with surrounding distal Mg–OH and carbonate halos mapped by the B07/B09 and B09/B08 proxies, outlining beresite cores within listvenite halos [43]. Because these two proxies share Band B8, the chloritization and carbonatization panels emphasize overlapping SWIR composite absorption rather than uniquely resolved chlorite and carbonate phases. This is consistent with published descriptions of quartz veins, pyrite–arsenopyrite ores, and sericite–chlorite–carbonate metasomatism in West Kalba systems [4,26].
At Tokum (Figure 5), the B07/B09 and B09/B08 proxies extend farther outward from the ore shell than the tight sericite–quartz cores. The chloritization and carbonatization maps are not read as independent mineral discriminators here, because both track the same Band B8 composite feature and co-vary accordingly. The imagery maps this wider footprint directly. Earlier deposit descriptions report the same pattern, with stronger distal chlorite–carbonate and carbonate flooding at Tokum than at Vasilyevskoye [1,4]. This agreement is corroboration, not independent proof, because no ground sampling is available at Tokum. Variability in host lithology and fluid–rock buffering is a known source of similar proximal–distal halo shifts in orogenic gold systems [43].

5.2. Spectral Signatures by Deposit and Alteration Type

Figure 6 compares mean ASTER reflectance spectra by deposit and alteration type, averaged for each band across training polygons tied to each ratio map (Section 4.4). Line colors follow a qualitative color palette. The underlying exports summarize masked-pixel means over 276 pixels in nine spectral subsets at Vasilyevskoye and 237 pixels in four subsets at Tokum. A small cluster of ∼312 distal pixels with lower continuum response is omitted there for clarity.
In both footprints the mean spectrum rises from the visible into the SWIR, peaks at Band B4 (Vasilyevskoye ∼259.8; Tokum ∼243.1; AST_07XT values as exported from QGIS), and then declines toward Bands B8–B9 (Vasilyevskoye: B7  = 184.8 , B8  = 147.3 , and B9  = 115.8 ; Tokum: B7  = 174.7 , B8  = 140.1 , and B9  = 112.8 ). Oxidative contrast in Bands B2–B3 is modest relative to the SWIR response at Bands B7–B9, so the ferric caps act only as secondary modifiers behind the SWIR phyllosilicate signal. Across Bands B4–B6, Vasilyevskoye shows a broader drawdown than Tokum, in line with the sharper Al–OH absorption targeted by the sericitization proxy (B05/B06; Table 3). At the same time, the B6/B5 ratio stays close to unity for both deposits (∼1.01), so the polygon means do not resolve a narrow absorption at Band B6 at the ASTER bandwidth. The B05/B06 sericitization map should therefore be read as a relative spatial ranking of the Al–OH response across the scene rather than as evidence of an absolute, fully resolved 2.20 µm absorption in every polygon. The strongest curvature falls in the longer SWIR bands (B7–B9), where B8/B7 and B9/B8 lie in the 0.79 0.81 range for both deposits, indicating a broad drop through the 2.30–2.40 µm region from mixed carbonate, Mg–OH, and Fe–Mg silicate influence rather than from a single absorber. This mixed-absorber behavior is consistent with the non-independence of the B07/B09 and B09/B08 chloritization and carbonatization proxies (Section 5.1). Tokum shows slightly higher plateau values across Bands B6–B7 before falling toward Band B9, matching the wider chloritic–carbonate halos mapped at that deposit [4].
Spread between bands is moderate and larger in VNIR than in SWIR. At Vasilyevskoye, the coefficient of variation (CV) across polygons reaches 15.9% (B1), 19.0% (B2), and 11.4% (B3), while SWIR B5–B9 remains 7.7–9.8%. Tokum shows the same pattern (VNIR 9.3–12.3%; SWIR 7.4–9.2%). The SWIR alteration shape is therefore stable across masked anomaly pixels. Higher VNIR variability mainly reflects oxidation, illumination, and mixed-pixel effects. Polygons and pixels are not statistically independent samples of a defined population. This contrast is therefore reported descriptively rather than as a formal significance test. Quantitative separation across deposits would require denser field sampling at Tokum.

5.3. Field Validation: Sampling, Microscopy, and SEM–EDS

To validate the remote sensing interpretations, samples were collected at Vasilyevskoye in 2022 (campaign VS_2022_vasil). Because this campaign predated the ratio mapping, sites were chosen from field accessibility and visible alteration rather than from the anomaly maps. On the maps, the sampled exposures fall within the sericitic core and the surrounding Mg–OH/carbonate halo at the deposit (Figure 4). Samples 1, 2, and 4 are different lithotypes from one outcrop within ∼4 m of one another and fall within one 30 m ASTER pixel, whereas Sample 3 (beresite) lies ∼125 m to the NNW at a separate exposure. Four lithological/mineralogical sample groups were targeted (Table 4). Sample 1 (listvenite) and Sample 3 (beresite) anchor the listvenite chlorite–carbonate and sericitic beresitic families targeted by Mg–OH/carbonate versus sericitic proxies. Sample 2 (carbonaceous shale) and Sample 4 (other) provide context from the host sequence. Figure 7 shows representative hand specimens for each sample.
Figure 8, Figure 9, Figure 10 and Figure 11 show micrographs by sample using SEM block labels i _ j , where i denotes the polishing block or micrograph set, and j denotes the spectrum index within it. Those labels follow the field catalog in Table 4, which aligns manuscript Samples 1–4 with lithotype and specimen IDs for the Vasilyevskoye campaign.
Eighty-three spot spectra from 22 polished-section blocks form the basis of the SEM–EDS summary. Spectra from polishing block 4_3 are excluded because that block has no micrograph counterpart in Figure 11. Figure 12 stacks all retained spots after clustering within each manuscript sample, so that phase-scale scatter is visible rather than masked by whole-rock averages that would smear mixed sulfide, phyllosilicate, and oxide analyses. Sample 1 (listvenite) keeps high Mg–Si values with variable Fe–As–S, compatible with Mg-silicates and sulfide-bearing volumes. Sample 2 (carbonaceous shale) concentrates REE and Th–Zr together with P, Mn, and Fe trends expected from dispersed phosphates, clays, and accessory oxides in a carbonaceous matrix. Sample 3 (beresite) shows Al–Si–K fields with ancillary Cr tied to chromite-rich grains and a Mg–Zn spread between sulfide-associated and carbonate-rich spots. Sample 4 is dominated by aluminosilicate and Fe phases but hosts intermittent Ti highs and Mn–P–Dy–Y in isolated spots, pointing to heterogeneous accessories. Appendix A tabulates the wt% spectra linked to Figure 8, Figure 9, Figure 10 and Figure 11, and element columns with no quantitative entry for a given table are dropped. Trace-element associations involving REE, Th, Zr, Dy, Y, and Ti come from semi-quantitative SEM–EDS spot data and are treated as tentative. They are discussed with their detection-limit and peak-overlap caveats in Section 6.5.

6. Discussion

6.1. Alteration Mapping from Band Ratios

Gold mineralization in the district is hosted within quartz veins and pyrite–arsenopyrite ores [1,4]. These sulfides rarely produce diagnostic absorption features in multispectral imagery [44]. The workflow therefore targets enclosing metasomatism: sericitization, distal chloritization and carbonatization, ferrous-silicate phyllosilicate mixtures, and oxidative caps [8,10]. The five diagnostic ratios reproduce expected zoning along beresitic corridors nested within broader listvenitic halos. Sericitic footprints sit inside Mg–OH and carbonate halos with only dispersed ferric pixels. The maps are therefore interpreted as sulfide-associated metasomatic footprints rather than as direct ore detection.
The principal limitation is that key ore minerals and accessory phases (pyrite, arsenopyrite, galena, sphalerite, chalcopyrite, native gold, scheelite, rutile, zircon, and monazite) cannot be mapped reliably or uniquely using these ASTER ratios. These phases are spectrally weak at the ASTER bandwidth, commonly fine-grained or volumetrically minor, and are typically masked by host rock and alteration signals in mixed pixels. The workflow is therefore designed to delineate alteration and metasomatic halos that accompany mineralization.

6.2. Value of a Simple Threshold Workflow

A second outcome is that elementary band-ratio maps with ranked anomaly masks reproduced zonation across the district and at each deposit that matches field and petrographic expectations. Compared with spectral unmixing, similarity metrics, or machine learning classifiers, these ratios are mathematically simple [10,45]. They remain in routine use because they are transparent, stable on surface reflectance inputs, and effective where vegetation and atmosphere are controlled. Simple ratio methods informed by local geology can still deliver useful exploration insight when screened with conservative thresholds.

6.3. Metasomatic Zoning and Contrast Between Deposits

The conceptual model of distal chloritic–carbonate halos grading inward to sericitic beresitic cores [4,46] links spectral anomalies to sulfide-related fluid corridors. In the ratio maps, Al–OH sericitization lies inside Mg–OH and carbonate halos mapped by the B07/B09 and B09/B08 proxies. Because both ratios share Band B8, the maps do not uniquely separate chlorite from carbonate at the ASTER bandwidth (Section 5.1). Distal Mg–OH and carbonate halo footprints widen at Tokum relative to the tighter beresitic corridors at Vasilyevskoye, a contrast in halo width within the same metallogenic province [1,4]. Describing these footprints as proximal and distal metasomatic positions of a fault-hosted sulfide system fits local geology better than porphyry copper alteration terminology. Ferric composites remain ancillary markers of oxidative exposure.

6.4. Polygon Spectra Versus Ratio Proxies

The polygon mean spectra in Section 5.2 and Figure 6 complement the ratio maps with behavior for each band. The higher Band B4 continuum and broader Band B5–B6 drawdown at Vasilyevskoye match the sericitization proxy (B05/B06). The Tokum plateau across Bands B6–B7 and steeper fall toward Band B9 align with the combined Mg–OH/carbonate signal captured by the B07/B09 and B09/B08 proxies, which co-vary through Band B8, and with wider distal halos at Tokum. Modest oxidative contrast in Bands B2–B3 places ferric caps (B02/B01) as secondary modifiers behind the SWIR hydrate and carbonate signal. Ferrous-silicate anomalies (B05/B04) bridge sericitic and chloritic shells without implying silica flooding or direct sulfide detection [38]. Together, these shapes support treating ASTER outputs as alteration halos and mineral-group proxies rather than unique mineral identifications [8].

6.5. Accessory REE and Ti Signals Across Samples and Outlook

The major-element patterns for Samples 1–4 are summarized in Section 5.3 and Figure 12. For Samples 2 and 4 we also record accessory REE, Th, Zr, Dy, Y, and Ti, but treat these only as tentative qualitative associations. Energy-dispersive analysis has high detection limits and strong peak overlaps in the REE L-line region and around Ti, so the individual trace-element weight percents should not be read as quantitative [41]. A few values in Appendix A are not physically credible—for instance, isolated Th of several weight percent in K–Al–Si spots that contain no REE or phosphorus—which points to peak misidentification or overlap rather than to a real Th phase. Any REE, Th, or Ti enrichment would need a quantitative method such as WDS-EPMA or LA-ICP-MS to confirm. These tentative REE and Ti signals fall outside the gold exploration aim of the present ratio set, but they do suggest that, where the hosts are carbonaceous or polymineralic, alteration mapping is worth pairing with targeted SEM–EDS or ion-probe transects [12].

6.6. Practical Applicability and Future Integration

Given the order-of-magnitude difference between Vasilyevskoye’s inventoried metal totals and Tokum’s smaller provisional framing (Section 3), the anomaly maps shown here are positioned as halo and flank reconnaissance for corridors that remain incompletely drilled, not as substitutes for reserve auditing. Because ASTER alteration maps are rapid, low-cost, and repeatable, they can support evaluation of operating and conserved deposits by prioritizing alteration footprints for follow-up mapping and sampling. The approach extends naturally by pairing remote sensing with magnetic, gravity, gamma-ray (radiometric), and structural data [18]. Such a combination supplies a digital geophysical layer that is particularly informative over gold systems. Ground-truthing would be strengthened in parallel by handheld field reflectance spectrometers of the PIMA type, which record the redox state, lithology, and pathfinder-mineral content of individual exposures and resolve mineral species that ASTER cannot separate. A more detailed mineralogical treatment of the alteration suite is also warranted, in particular the Cr-bearing phyllosilicates (fuchsite), smectite, and disseminated or fault-related ferroan saponite that can accompany the quartz–sericite–ankerite–dolomite assemblage and the intermediate wall volcanics around Tokum, where intrusive units grade into more andesitic compositions. The Cr association already detected by SEM–EDS in the beresite sample (Figure 12) is a first indication of this. Planned next steps include acquisition of hyperspectral data over the main alteration zones [47], testing SAM and machine learning classifiers [48], and a SEM–EDS validation campaign at Tokum.

7. Conclusions

ASTER surface reflectance ratios and high-percentile anomaly masks were used to map metasomatic footprints around Vasilyevskoye and Tokum in the Akzhal–Vasilyevskoye district (West Kalba), Kazakhstan, with ground validation by polished-section microscopy and SEM–EDS at Vasilyevskoye from the 2022 VS_2022_vasil campaign. Tokum was mapped from imagery alone, without a field campaign to match the Vasilyevskoye sampling. The clearest outcome is the structural and metasomatic zoning resolved across the district and at each deposit: Al–OH sericitic footprints lie inside Mg–OH chlorite and carbonate halos, outlining beresite cores within listvenitic halos at both deposits (Figure 3, Figure 4 and Figure 5) [1,4]. Relative to established ASTER mineral-index practices [8,10] and prior Kazakhstan multispectral applications, the main contribution is this joint zoning architecture across the district together with SEM–EDS paragenesis at Vasilyevskoye in a beresite–listvenite gold setting, rather than a new spectral index.
A further, supporting observation is the descriptive spectral contrast between the two deposits. Mean ASTER reflectance spectra for masked high-ratio pixels share a Band B4 maximum and a broad decline toward Bands B8–B9 in both deposits. Vasilyevskoye shows a sharper drawdown across Bands B5–B6, whereas Tokum keeps higher plateau values across Bands B6–B7 (Section 5.2, Figure 6). The longer SWIR bands (B7–B9) are compatible with mixed carbonate, Mg–OH, and Fe–Mg silicate influence (Section 6.4). SEM–EDS on four lithotype groups at Vasilyevskoye (83 spot spectra and 22 polished-section blocks; Figure 12; Appendix A) supports alteration assemblages consistent with those proxies.
Because the ratios trace the alteration halos that accompany mineralization rather than the ore minerals themselves [8], the maps are most reliable over exposed, sparsely vegetated ground. The obvious next steps are a SEM–EDS validation campaign at Tokum, integration of ASTER with geophysical and structural data, and hyperspectral coverage of the main alteration corridors [12,47].

Supplementary Materials

The following supporting information can be downloaded at: https://www.mdpi.com/article/10.3390/geosciences16070266/s1. Table S1, band_ratios.csv with ASTER band-ratio definitions and 95th–99th percentile anomaly thresholds; Dataset S1, data/spectras_aster/ represents per-polygon reflectance CSV exports for Vasilyevskoye and Tokum training polygons; Script S1, plot_spectral_signatures.py is data visualized in Figure 6; Script S2, plot_usgs_aster_  comparison.py corresponds to Figure 2; and README.txt summarises the provided data and scripts, as well as required software and package versions.

Author Contributions

Conceptualization, Y.Y., M.R. and R.S.; Methodology, Y.Y., R.S., K.P. and M.S.; Validation, M.R.; Investigation, A.A.; Data curation, Y.Y. and A.A.; Writing—original draft, Y.Y., M.R., R.S., A.A., K.P. and M.S.; Writing—review and editing, Y.Y., M.R., R.S., K.P. and M.S.; Visualization, Y.Y., K.P. and M.S.; Supervision, M.R. All authors have read and agreed to the published version of the manuscript.

Funding

This research was supported by the Ministry of Science and Higher Education of the Republic of Kazakhstan (Grant No. AP25795761 “Development of a combined method for forecasting gold mineral deposits based on satellite technology, GIS and deep learning AI”).

Data Availability Statement

ASTER Level-2 surface reflectance scenes (AST_07XT) are publicly available from the NASA LP DAAC, and the scene IDs are listed in Table 2. SEM–EDS tables (Appendix A) and micrographs (Figure 8, Figure 9, Figure 10 and Figure 11) are reported in this manuscript. Data is contained within the article and Supplementary Materials.

Acknowledgments

The authors thank the staff of VERITAS Engineering Laboratory (EKTU) for providing the equipment and facilities for the field work and SEM–EDS laboratory analyses. We also thank the anonymous reviewers for their constructive comments and suggestions, which have become impactful for our paper.

Conflicts of Interest

The authors declare no conflicts of interest.

Appendix A. EDS Spectra by Sample

Full EDS analyses (wt%) for each sample, corresponding to Figure 8, Figure 9, Figure 10, Figure 11 and Figure 12. Reported values are the normalized weight percent; for each analysis point, the tabulated element columns sum to exactly 100 % as the total. Sample identifiers follow Table 4. Pt = analysis point within a polishing block.
Table A1. EDS analyses (wt%) for Sample 1 (listvenite). Sample IDs match Figure 8.
SamplePtOAsCaCoCuFeMgNiPbSSbSi
1_1132.2520.570.372.8610.2519.748.665.3
1_1234.741.620.341.7921.89.692.4323.34.3
1_1359.340.544.4528.886.8
1_1458.910.645.9227.497.04
1_2131.159.922.462.143.138.5614.248.888.8210.7
1_2232.6911.830.326.824.767.297.366.2212.110.6
1_2333.2526.271.182.5217.058.5811.15
1_2459.30.445.8222.7611.68
1_3132.343.993.215.9515.546.162.4518.1612.2
1_3232.3523.521.022.3417.678.6814.42
1_3357.410.287.320.1214.9
1_3430.043.8810.397.796.6410.6911.75.5513.32
1_4131.3724.340.631.41.3117.189.114.67
1_4246.3712.090.520.62.156.773.3428.17
1_4357.260.751.053.9337.01
1_5134.7924.611.728.122.759.731.2110.6611.44
1_5244.7411.6711.2420.238.9613.27
1_5345.80.6211.6512.7113.1910.0912.85
1_5443.9614.054.113.4824.39
1_5555.52.492.611.6837.73
1_6128.952.274.093.29.5615.6210.0416.79.57
1_6232.741.980.3515.2114.919.321.4114.969.12
1_6335.0324.220.260.662.5316.999.4410.88
1_6455.190.726.9919.910.9116.28
Table A2. EDS analyses (wt%) for Sample 2 (carbonaceous shale). Sample IDs 2_1–2_6 match Figure 9.
SamplePtOAlAsCaCeCoFeKLaMgMnNaNdNiPPrSSiSmThTiZr
2_1142.149.9711.142.93.142.260.787.235.50.6913.520.73
2_1247.0411.526.233.954.240.760.914.683.31.2115.630.52
2_1350.188.8621.513.063.460.7412.18
2_1452.8415.4835.960.590.6821.060.38
2_2143.946.7412.772.690.589.5423.72
2_2251.158.0221.732.593.420.4412.220.43
2_2355.335.782.772.550.4432.810.33
2_2453.2415.423.145.160.510.9721.240.33
2_3129.639.1519.831.36.982.6910.757.7211.510.43
2_3252.1714.272.576.150.6818.775.39
2_3352.8315.872.526.780.5120.890.61
2_3453.3214.872.556.440.7421.410.66
2_4143.594.369.031.820.4113.241.625.95
2_4250.66.4828.591.984.587.77
2_4353.0416.282.376.690.5421.08
2_4454.1112.9666.010.880.9117.981.16
2_4550.455.1929.481.595.890.86.6
2_5128.677.9623.661.838.112.388.658.789.550.4
2_5251.325.819.582.112.6410.527.570.45
2_5350.327.1226.952.33.928.940.44
2_5453.4716.171.976.140.550.3520.680.68
2_6125.739.7720.412.627.32.9110.998.6911.030.53
2_6252.2515.662.921.314.832.10.370.643.370.6514.881.02
2_6351.149.3722.252.863.4210.530.42
2_6453.2716.820.776.820.3320.971.01
Table A3. EDS analyses (wt%) for Sample 3 (beresite). Sample IDs 3_1–3_6 match Figure 10.
SamplePtOAlAsCaCoCrFeKMgNiSSiZn
3_1141.923.030.641.9220.849.50.876.668.476.13
3_1256.30.340.271.360.183.4938.07
3_1361.460.850.410.287.050.3624.425.17
3_1457.210.51.040.31.570.354.6334.42
3_2144.590.5913.193.9411.7310.54.2711.19
3_2253.916.143.51.750.935.392.896.5518.95
3_2358.760.440.434.1322.820.6312.8
3_3150.060.776.072.25.575.762.4427.13
3_3258.090.266.9321.3713.35
3_4145.399.272.245.777.223.4726.64
3_4249.55.561.935.775.072.2829.89
3_43550.372.455.9217.553.51.0614.14
3_4456.750.212.316.933.83
3_5146.0232.8410.8810.27
3_5263.310.382.6722.280.4210.93
3_5358.745.8522.2813.14
3_5459.983.6124.212.21
3_6143.0636.8715.360.524.19
3_6259.830.253.2131.10.555.05
Table A4. EDS analyses (wt%) for Sample 4 (other). Microscopy sets 4_1, 4_2, 4_3, and 4_4 match Figure 11.
SamplePtOAlCaDyFeKMgMnPSiTiY
4_1142.963.443.234.020.9315.090.35
4_1247.213.143.5632.20.760.4311.890.81
4_1355.692.33272.810.830.741.499.12
4_1454.9911.453.614.133.970.4121.030.42
4_2147.326.7230.521.9812.251.22
4_2246.497.1530.172.1412.881.17
4_2354.815.061.171.6711.5325.77
4_2454.0415.741.416.020.4121.081.3
4_3152.179.270.92.10.974.026.3413.161.439.64
4_3255.67.850.490.662.690.3410.6821.69
4_3355.938.210.731.053.370.3111.5218.88
4_3455.2515.020.91.075.90.5320.550.79
4_4156.8410.181.324.035.313.30.498.54
4_4255.045.461.31.917.7828.51
4_4355.215.831.076.240.4920.70.48

References

  1. D’yachkov, B.A.; Mizernaya, M.A.; Khromykh, S.V.; Bissatova, A.Y.; Oitseva, T.A.; Miroshnikova, A.P.; Frolova, O.V.; Kuzmina, O.N.; Zimanovskaya, N.A.; Pyatkova, A.P.; et al. Geological History of the Great Altai: Implications for Mineral Exploration. Minerals 2022, 12, 744. [Google Scholar] [CrossRef]
  2. Groves, D.I.; Goldfarb, R.J.; Gebre-Mariam, M.; Hagemann, S.G.; Robert, F. Orogenic gold deposits: A proposed classification in the context of their crustal distribution and relationship to other gold deposit types. Ore Geol. Rev. 1998, 13, 7–27. [Google Scholar] [CrossRef]
  3. Goldfarb, R.J.; Groves, D.I.; Gardoll, S. Orogenic gold and geologic time: A global synthesis. Ore Geol. Rev. 2001, 18, 1–75. [Google Scholar] [CrossRef]
  4. Mizernaya, M.A.; Miroshnikova, A.P.; Pyatkova, A.P.; Akilbaeva, A.T. The main geological-industrial types of gold deposits in East Kazakhstan. Nauk. Visnyk Natsionalnoho Hirnychoho Universytetu 2019, 5, 5–11. [Google Scholar] [CrossRef]
  5. Akilbaeva, A.T.; Zikirova, K.T.; Mizernaya, M.A.; Kuzmina, O.N.; Miroshnikova, A.P. Problemy vospolneniya mineral’no-syr’evoi bazy na zoloto v Vostochnom Kazakhstane. Tr. Univ. 2021, 4, 99–103. [Google Scholar] [CrossRef]
  6. Konopelko, D.L.; Zhdanova, V.S.; Stepanov, S.Y.; Sidorova, E.S.; Petrov, S.V.; Kozin, A.K.; Aliyev, E.S.; Saltanov, V.A.; Kalinin, M.A.; Korneev, A.V.; et al. Mineralization Styles in the Orogenic (Quartz Vein) Gold Deposits of the Eastern Kazakhstan Gold Belt: Implications for Regional Prospecting. Minerals 2025, 15, 885. [Google Scholar] [CrossRef]
  7. Dyachkov, B.A.; Chernenko, Z.I.; Petrov, S.F.; Maiorova, N.P.; Zimanovskaya, N.A.; Kuzmina, O.N. Morfologicheskie osobennosti zolota na rudoproyavlenii Baibura (Zapadnaya Kalba). Vestn. VKGTU 2012, 2, 5–10. [Google Scholar]
  8. Rowan, L.C.; Mars, J.C. Lithologic mapping in the Mountain Pass, California area using Advanced Spaceborne Thermal Emission and Reflection Radiometer (ASTER) data. Remote Sens. Environ. 2003, 84, 350–366. [Google Scholar] [CrossRef]
  9. Zhu, Y.; An, F.; Tan, J. Geochemistry of hydrothermal gold deposits: A review. Geosci. Front. 2011, 2, 367–374. [Google Scholar] [CrossRef]
  10. Kalinowski, A.; Oliver, S. ASTER Mineral Index Processing Manual; Remote Sensing Applications, Geoscience Australia: Canberra, Australia, 2004. Available online: https://www.ga.gov.au/bigobj/GA7833.pdf (accessed on 20 December 2025).
  11. Crosta, A.P.; de Souza Filho, C.R.; Azevedo, F.; Brodie, C. Targeting key alteration minerals in epithermal deposits in Patagonia, Argentina, using ASTER imagery and principal component analysis. Int. J. Remote Sens. 2003, 24, 4233–4240. [Google Scholar] [CrossRef]
  12. van der Meer, F.D.; van der Werff, H.M.A.; van Ruitenbeek, F.J.A.; Hecker, C.A.; Bakker, W.H.; Noomen, M.F.; van der Meijde, M.; Carranza, E.J.M.; de Smeth, J.B.; Woldai, T. Multi- and hyperspectral geologic remote sensing: A review. Int. J. Appl. Earth Obs. Geoinf. 2012, 14, 112–128. [Google Scholar] [CrossRef]
  13. Pour, A.B.; Hashim, M. The application of ASTER remote sensing data to porphyry copper and epithermal gold deposits. Ore Geol. Rev. 2012, 44, 1–9. [Google Scholar] [CrossRef]
  14. Sheikhrahimi, A.; Beiranvand Pour, A.; Pradhan, B.; Zoheir, B. Mapping hydrothermal alteration zones and lineaments associated with orogenic gold mineralization using ASTER data: A case study from the Sanandaj-Sirjan Zone, Iran. Adv. Space Res. 2019, 63, 3315–3332. [Google Scholar] [CrossRef]
  15. Salehi, S.; Olsen, S.D.; Pedersen, C.B.; Thorning, L. ASTER Data Analysis Applied to Mineral and Geological Mapping in North East Greenland: Documentation of the NEG ASTER Project; Geological Survey of Denmark and Greenland (GEUS) Report 2019/7; Geological Survey of Denmark and Greenland (GEUS): København, Denmark, 2019. [Google Scholar]
  16. Kouzelia, E.; Nikolakopoulos, K.G.; Kyriou, A.; Pantelidis, I.; Tsikos, H.; Paliatsas, D.; Asadzadeh, S.; Koerting, F.; Schläpfer, D. Mineral mapping using the Spectral Angle Mapper on multisensor remote sensing data. In Proceedings of the Earth Resources and Environmental Remote Sensing/GIS Applications XVI, Madrid, Spain, 15–18 September 2025; SPIE: Bellingham, WA, USA, 2025; p. 1367104. [Google Scholar] [CrossRef]
  17. Thompson, D.R.; Braverman, A.; Brodrick, P.G.; Candela, A.; Carmon, N.; Clark, R.N.; Connelly, D.; Green, R.O.; Kokaly, R.F.; Li, L.; et al. Quantifying uncertainty for remote spectroscopy of surface composition. Remote Sens. Environ. 2020, 247, 111898. [Google Scholar] [CrossRef]
  18. Mohamed Taha, A.M.; Xi, Y.; He, Q.; Hu, A.; Wang, S.; Liu, X. Investigating the Capabilities of Various Multispectral Remote Sensors Data to Map Mineral Prospectivity Based on Random Forest Predictive Model: A Case Study for Gold Deposits in Hamissana Area, NE Sudan. Minerals 2023, 13, 49. [Google Scholar] [CrossRef]
  19. El-Raouf, A.A.; Doğru, F.; Azab, I.; Jiang, L.; Abdelrahman, K.; Fnais, M.S.; Amer, O. Utilizing Remote Sensing and Satellite-Based Bouguer Gravity data to Predict Potential Sites of Hydrothermal Minerals and Gold Deposits in Central Saudi Arabia. Minerals 2023, 13, 1092. [Google Scholar] [CrossRef]
  20. Mizernaya, M.A.; Miroshnikova, A.P.; Yeskaliyev, Y.; Oitseva, T.A.; Kuzmina, O.N. Structural Position, Magmatism and Mineralisation of Bakyrchik Ore Field (Kazakhstan). In Proceedings of the 22nd International Multidisciplinary Scientific GeoConference SGEM 2022, Albena, Bulgaria, 4–10 July 2022. [Google Scholar] [CrossRef]
  21. Mizernaya, M.A.; D’yachkov, B.A.; Miroshnikova, A.P.; Zikirova, K.T.; Yeskaliyev, Y.T. Osobennosti geologicheskogo stroeniya, magmatizma i rudoobrazovaniya mestorozhdenii Bakyrchikskogo rudnogo polya. Tr. Univ. 2021, 3, 94–99. [Google Scholar] [CrossRef]
  22. Serikbayeva, E.; Togizov, K.; Talgarbayeva, D.; Orynbassarova, E.; Sydyk, N.; Bermukhanova, A. Application of Multispectral Data in Detecting Porphyry Copper Deposits: The Case of Aidarly Deposit, Eastern Kazakhstan. Minerals 2025, 15, 938. [Google Scholar] [CrossRef]
  23. Orynbassarova, E.; Ahmadi, H.; Adebiyet, B.; Beiranvand Pour, A.; Bekbotayeva, A.; Sydyk, N. High-Resolution UAV-Based Fuzzy Logic Mapping of Iron Oxide Alteration for Porphyry Copper Exploration: A Case Study from the Kyzylkiya Copper Prospect in Eastern Kazakhstan. Mining 2025, 5, 52. [Google Scholar] [CrossRef]
  24. Orynbassarova, E.; Ahmadi, H.; Adebiyet, B.; Bekbotayeva, A.; Abdullayeva, T.; Beiranvand Pour, A.; Ilyassova, A.; Serikbayeva, E.; Talgarbayeva, D.; Bermukhanova, A. Mapping Alteration Minerals Associated with Aktogay Porphyry Copper Mineralization in Eastern Kazakhstan Using Landsat-8 and ASTER Satellite Sensors. Minerals 2025, 15, 277. [Google Scholar] [CrossRef]
  25. Talgarbayeva, D.; Vilayev, A.; Serikbayeva, E.; Orynbassarova, E.; Ahmadi, H.; Saurykov, Z.; Sydyk, N.; Bermukhanova, A.; Iskakov, B. Integrated Prospectivity Mapping for Copper Mineralization in the Koldar Massif, Kazakhstan. Minerals 2025, 15, 805. [Google Scholar] [CrossRef]
  26. Kovalev, K.R.; Kalinin, Y.A.; Naumov, E.A.; Kolesnikova, M.K.; Korolyuk, V.N. Gold-bearing arsenopyrite in eastern Kazakhstan gold-sulfide deposits. Russ. Geol. Geofiz. 2011, 52, 178–192. [Google Scholar]
  27. Soloviev, S.G.; Kryazhev, S.G.; Dvurechenskaya, S.S.; Trushin, S.I. The large Bakyrchik orogenic gold deposit, eastern Kazakhstan: Geology, mineralization, fluid inclusion, and stable isotope characteristics. Ore Geol. Rev. 2020, 127, 103863. [Google Scholar] [CrossRef]
  28. Mizerny, A.I.; Rafailovich, M.S. Zapadno-Kalbinskaya metallogenicheskaya zona: Potentsial zolota, tipy mestorozhdenii. Vestn. VKGTU 2012, 2, 10–16. [Google Scholar]
  29. D’yachkov, B.A.; Bissatova, A.Y.; Mizernaya, M.A.; Khromykh, S.V.; Oitseva, T.A.; Kuzmina, O.N.; Zimanovskaya, N.A.; Aitbayeva, S.S. Mineralogical Tracers of Gold and Rare-Metal Mineralization in Eastern Kazakhstan. Minerals 2021, 11, 253. [Google Scholar] [CrossRef]
  30. Mizernaya, M.A.; Aitbayeva, S.S.; Kotler, P.D.; Dolgopolova, A.V.; Seltmann, R.; Bekishev, Y.; Kuzmina, O.N.; Oitseva, T.A.; Shayakhmetova, Z.A.; Akbarov, Y.Y.; et al. Pegmatites of the Kalba–Narym Batholith (East Kazakhstan): Origin and Classification. Minerals 2026, 16, 187. [Google Scholar] [CrossRef]
  31. Kokaly, R.F.; Clark, R.N.; Swayze, G.A.; Livo, K.E.; Hoefen, T.M.; Pearson, N.C.; Wise, R.A.; Benzel, W.M.; Lowers, H.A.; Driscoll, R.L.; et al. USGS Spectral Library Version 7; U.S. Geological Survey Data Series 1035; U.S. Geological Survey: Reston, VA, USA, 2017. [Google Scholar] [CrossRef]
  32. Salisbury, J.W.; Walter, L.S.; Vergo, N. Mid-Infrared (2.1–25 µm) Spectra of Minerals: First Edition; U.S. Geological Survey Open-File Report 87-263; U.S. Geological Survey: Reston, VA, USA, 1987. [Google Scholar]
  33. Rockwell, B.W. Description and Validation of an Automated Methodology for Mapping Mineralogy, Vegetation, and Hydrothermal Alteration Type from ASTER Satellite Imagery with Examples from the San Juan Mountains, Colorado; U.S. Geological Survey Scientific Investigations Map 3190; U.S. Geological Survey: Reston, VA, USA, 2012. [Google Scholar]
  34. Sarkar, D.; Vyas, T.V.; Pankaj, P.; Babu, P.; Pande, R.J. Characterization of ASTER spectral bands for mapping of Pyrophyllite of hydrothermal alteration zones in and around Tikamgarh, Madhya Pradesh. Arab. J. Geosci. 2023, 16, 439. [Google Scholar] [CrossRef]
  35. Abrams, M.; Tsubo, H.; Hulley, G.; Iwao, K.; Pieri, D.; Cudahy, T.; Kargel, J. The Advanced Spaceborne Thermal Emission and Reflection Radiometer (ASTER) after fifteen years: Review of global products. Int. J. Appl. Earth Obs. Geoinf. 2015, 38, 292–301. [Google Scholar] [CrossRef]
  36. Jiménez-Muñoz, J.C.; Sobrino, J.A.; Gillespie, A.; Sabol, D.; Gustafson, W.T. Improved land surface emissivities over agricultural areas using ASTER NDVI. Remote Sens. Environ. 2006, 103, 474–487. [Google Scholar] [CrossRef]
  37. Mahmoud, H.A.; Karelina, E.V.; Markov, V.E.; Diakonov, V.V.; Vikentyev, I.V. Image processing for ASTER remote sensing data to map hydrothermal alteration zones in East Kazakhstan. RUDN J. Eng. Res. 2023, 24, 95–104. [Google Scholar] [CrossRef]
  38. Ninomiya, Y. Mapping quartz, carbonate minerals, and mafic–ultramafic rocks using remotely sensed multispectral thermal infrared ASTER data. In Proceedings of the Thermosense XXIV, Orlando, FL, USA, 1–4 April 2002; SPIE: Bellingham, WA, USA, 2002; Volume 4710, pp. 191–202. [Google Scholar] [CrossRef]
  39. Goldstein, J.; Newbury, D.; Joy, D.; Lyman, C.; Echlin, P.; Lifshin, E.; Sawyer, L.; Michael, J. Scanning Electron Microscopy and X-Ray Microanalysis, 3rd ed.; Springer: New York, NY, USA, 2003. [Google Scholar] [CrossRef]
  40. Kostryzhev, A.; Murphy, T. Phase characterisation in minerals and metals using an SEM-EDS based automated mineralogy system. Methods Microsc. 2024, 1, 163–175. [Google Scholar] [CrossRef]
  41. Newbury, D.E.; Ritchie, N.W.M. Is scanning electron microscopy/energy dispersive X-ray spectrometry (SEM/EDS) quantitative? Scanning 2013, 35, 141–168. [Google Scholar] [CrossRef] [PubMed]
  42. Newbury, D.E.; Ritchie, N.W.M. Performing elemental microanalysis with high accuracy and high precision by scanning electron microscopy/silicon drift detector energy-dispersive X-ray spectrometry (SEM/SDD-EDS). J. Mater. Sci. 2015, 50, 493–518. [Google Scholar] [CrossRef] [PubMed]
  43. Li, H.; Wang, Q.; Yang, L.; Dong, C.; Weng, W.; Deng, J. Alteration and mineralization patterns in orogenic gold deposits: Constraints from deposit observation and thermodynamic modeling. Chem. Geol. 2022, 607, 121012. [Google Scholar] [CrossRef]
  44. Benzaazoua, M.; Marion, P.; Robaut, F.; Pinto, A. Gold-bearing arsenopyrite and pyrite in refractory ores: Analytical refinements and new understanding of gold mineralogy. Mineral. Mag. 2007, 71, 123–142. [Google Scholar] [CrossRef]
  45. Ninomiya, Y. Lithologic mapping with multispectral ASTER TIR and SWIR data. In Sensors, Systems, and Next-Generation Satellites VII, (Proceedings SPIE 5234), Barcelona, Spain, 8–12 September 2003; SPIE: Bellingham, WA, USA, 2004; pp. 180–190. [Google Scholar] [CrossRef]
  46. Zhang, T.; Chen, Z.-L.; Zhou, Z.-J.; Pan, J.-Y.; Xia, F.; Zhang, W.-G.; Sun, Y.; Feng, H.-Y. Hydrothermal Alteration, Mass Transfer and Genesis of the Ashawayi Gold Deposit, Southwestern Tianshan Orogen, China. Geol. J. 2026, 61, 1–17. [Google Scholar] [CrossRef]
  47. Kruse, F.A.; Boardman, J.W.; Huntington, J.F. Comparison of airborne hyperspectral data and EO-1 Hyperion for mineral mapping. IEEE Trans. Geosci. Remote Sens. 2003, 41, 1388–1400. [Google Scholar] [CrossRef]
  48. Zhang, X.; Zhang, Y.; Wang, S.; Liu, Y. Application and evaluation of deep neural networks for airborne hyperspectral remote sensing mineral mapping: A case study of the Baiyanghe uranium deposit in northwestern Xinjiang, China. Remote Sens. 2022, 14, 5122. [Google Scholar] [CrossRef]
Figure 1. Location of the study area in the West Kalba belt. Top: (A) geological map of Kazakhstan with segmented West Kalba and Zharma–Saur belts (base from https://www.geoportal-kz.org); (B) study area (base from Google Maps). Bottom: numbers in circles indicate faults: 1 = Gornostaevka, 2 = Char, 3 = West Kalba, 4 = Znamensky, 5 = Terekta, 6 = Sardzhal, and 7 = Baiguzin–Bulak. Numbers next to circles indicate deposits: 1 = Zherek, 2 = Kedey, 3 = Bakyrchik, 4 = Sentash, 5 = Jumba, 6 = Kuludzhun, 7 = Layly, 8 = Suzdali, 9 = Akzhal, 10 = Boko, 11 = Ashaly, and 12 = Zhanan. Arrow points north.
Geosciences 16 00266 g001
Figure 2. USGS reference spectra (solid) and normalized ASTER overlap (dashed) for minerals used as priors for ratio selection in this study. ASTER bands highlighted in transparent vertical colors. USGS spectrum IDs used: muscovite (GDS116), sericite (GDS31), illite (IMt-1), chlorite (GDS157), phlogopite (HS325), calcite (WS272), dolomite (JB1146), ankerite (JB659), hematite (GDS69), and goethite (WS218).
Geosciences 16 00266 g002
Table 1. Target minerals for spectral mapping in the Akzhal–Vasilyevskoye district. Minerals are grouped by diagnostic spectral features and the metasomatic process they most commonly record in beresite–listvenite style systems.
MineralFormulaDistinctive FeaturesAlteration
Phyllosilicates
SericiteFine muscoviteAl–OH band at 2200 nmSericitization (beresite halo)
MuscoviteKAl2(AlSi3O10)(OH)2Al–OH at 2200 and 2350 nmSericitization
IlliteK0.65Al2.0[Al0.65Si3.35O10](OH)2Al–OH at 2200 nmSericitization
Mg-Fe silicates
Chlorite(Mg,Fe)3(Si,Al)4O10(OH)2Mg–OH at 2320 nm,
Fe–OH near 2250 nm
Chloritization, Fe2+ proxy
TalcMg3Si4O10(OH)2Mg–OH at 2320 nmListvenite Mg silicate
Carbonates
CalciteCaCO3CO3 at 2330 nmCarbonatization
Dolomite, AnkeriteCaMg(CO3)2CO3 at 2320–2330 nmCarbonatization
Iron oxides
HematiteFe2O3Fe3+ ∼650 nmOxidation
Goethite, LimoniteFeOOHFe3+ ∼900 nmOxidation
Table 2. ASTER data acquisition summary. All granules were processed to surface reflectance (AST_07XT) and mosaicked for mapping. Spatial extents are granule bounding boxes (GRING coordinates) from NASA LP DAAC metadata. Reference system UTM Zone 44N.
Scene IDAcquisition (UTC)Spatial ExtentBands
051520030549152003-05-15 05:49:1549.41–50.12° N, 80.87–82.09° EVNIR + SWIR
051520030549242003-05-15 05:49:2448.89–49.60° N, 80.64–81.85° EVNIR + SWIR
061120040542472004-06-11 05:42:4748.96–49.68° N, 81.72–82.92° EVNIR + SWIR
061120040542562004-06-11 05:42:5648.44–49.15° N, 81.50–82.69° EVNIR + SWIR
Disclaimer/Publisher’s Note: The statements, opinions and data contained in all publications are solely those of the individual author(s) and contributor(s) and not of MDPI and/or the editor(s). MDPI and/or the editor(s) disclaim responsibility for any injury to people or property resulting from any ideas, methods, instructions or products referred to in the content.