


Abstract
Reliable prediction of reservoir properties and internal reservoir architecture is critical for the exploration and appraisal of hydrocarbon accumulations characterized by complex geological structure and high uncertainty in the spatial distribution of reservoir rocks. This study presents a hybrid event-process algorithm for sedimentary-process modeling of deep-water turbidite systems and demonstrates its applicability to the Achimov Formation in Western Siberia. The proposed methodology combines a regular-grid representation of reconstructed paleotopography with a Lagrangian description of sediment particles and Eulerian reconstruction of flow fields. The terrigenous material is represented by four grain-size fractions: coarse-grained sand, medium-grained sand, silt, and clay. Application of the algorithm made it possible to reproduce the internal architecture of deep-water submarine fans. The modeling results reflect the main principles of lithological differentiation in turbidite bodies: sandy fractions are deposited predominantly in the proximal part of the system, whereas the pelitic component is transported toward more distal areas. The resulting distributions of total thickness and net-to-gross ratio make it possible to delineate areas characterized by increased reservoir development. Comparison of the modeled results with well data showed reliable agreement: for total thickness, the coefficient of determination was R2 = 0.83 with an RMSE of 4.5 m, while for the net-to-gross ratio, it was R2 = 0.81 with an RMSE of 0.08. The model shows that the internal architecture is controlled by morphodynamic feedback between paleorelief inheritance, depocenter filling, and subsequent flow diversion, which leads to compensational lobe stacking. These results indicate that the developed algorithm can be applied to the modeling of deep-water submarine fans. The proposed approach contributes to reducing geological uncertainty and can be used to provide a more reliable basis for identifying prospective zones when planning exploration programs.
1. Introduction
The reliability of predicting reservoir properties and internal architecture of a reservoir directly affects the efficiency of geological exploration. The study of Achimov Formation targets, which are characterized by a complex geological structure, high lithofacies heterogeneity, and significant spatial variability of reservoir quality both laterally and vertically, requires the improvement of methodological approaches to geological modeling and the implementation of new technologies capable of reproducing the lithological and sedimentological features of reservoirs. This necessitates the integrated use of a wide range of geological and geophysical data, together with modern modeling methods, to support more reliable decision-making in the exploration and appraisal of hydrocarbon accumulations [1,2,3,4,5].
The complexity of studying the Achimov deposits is determined not only by their limited degree of investigation but, above all, by the nature of their depositional processes. Deep-water submarine fans were formed under conditions of unsteady gravity flows that were sensitive to basin topography, the volume of supplied material, the grain-size composition of sediments, and the hydrodynamic parameters of the transporting flow [6]. From a hydrodynamic perspective, turbidity currents differ fundamentally from sustained near-bed traction currents. Whereas traction currents transport sediment mainly due to bed shear stress and relatively steady, directed motion of the water mass, turbidity currents are sediment-laden density flows driven by the excess density of the water–sediment suspension relative to the ambient water [7]. As a result, the reservoir architecture acquires a complex multilevel character, while the distribution of sandy and clayey lithologies becomes highly irregular. For such objects, traditional approaches to three-dimensional geological modeling, based primarily on geostatistical interpolation, are often insufficient, as they allow reservoir properties to be reproduced within a predefined geometric volume but only weakly account for the genetic mechanisms responsible for the formation of clastic deposits [8,9,10].
The need for reliable reproduction of the spatial distribution of geological parameters promotes the development of both methods that complement existing approaches to geological modeling and fundamentally new methodologies [11]. One promising tool for addressing predictive tasks is the use of process-based sedimentary modeling. This approach is based on modified algorithms that employ empirical equations of fluid flow and the laws of conservation of mass and energy, enabling the formation of geological bodies to be reproduced through time [12,13,14].
In contrast to geostatistical methods, this methodology describes the temporal evolution of a depositional system and thereby makes it possible to reconstruct the internal architecture of a reservoir as the result of successive natural processes. For deep-water turbidite systems, this approach is particularly important, because the dynamics of density currents largely determine the spatial differentiation of sedimentary lithologies [15,16].
Despite significant progress in forward stratigraphy modeling, existing algorithmic solutions for simulating turbidity currents do not always provide the required degree of physical reliability when reproducing the morphology of deep-water sandy bodies. A number of grid-based and diffusion-based schemes are characterized by excessive smoothing of transport pathways and accumulation zones, which may lead to the blurring of facies boundaries, reduced contrast between architectural elements, and distortion of the internal structure of submarine fans. For reservoir prediction, this is critical, because such numerical effects directly affect the estimation of net pay thicknesses, the connectivity of sandy bodies, and the spatial position of potential traps [8].
At the same time, existing basin-scale stratigraphic models often use averaged descriptions of multiple events and considerable simplifications when modeling deep-water sediment transport [17]. For large-scale regional studies, such an approach may be justified. However, when studying the Achimov deposits, where the event-driven nature of the turbidite process, fractional sediment sorting, bypass, erosion, and reworking of previously deposited material are of decisive importance, this level of simplification is insufficient. Therefore, predicting the internal structure of Achimov bodies requires an algorithm that, on the one hand, preserves the process-based nature of modeling and, on the other hand, is adapted to the specific features of sedimentation in Western Siberia [1]. The key methodological gap lies in the insufficient integration, within a single computationally efficient framework, of several elements that are critical for Achimov reservoirs: the event-driven nature of sediment supply; the influence of reconstructed paleotopography on sediment-transport pathways; fraction-dependent sorting of sandy, silty, and clayey components; bypass and erosion processes; and subsequent calibration of the results against well-derived data on total thickness and net-to-gross ratio [1].
Thus, the development of a computational approach that combines algorithmic stability, acceptable computational efficiency, and the ability to reproduce the key patterns of turbidite-body formation represents an important scientific and practical task. Such an approach should enable the modeling of unsteady density currents; account for the influence of reconstructed paleotopography, sediment source parameters, and the grain-size composition of the supplied sedimentary material; and also allow subsequent calibration against geological and geophysical data.
The aim of this study is to develop and test a sedimentary modeling algorithm designed to reproduce the depositional processes responsible for the formation of deep-water turbidite deposits. The article considers the principles underlying the construction of an algorithm focused on modeling sediment transport and deposition under conditions of unsteady gravity flows, and analyzes its applicability to predicting the spatial distribution of grain-size characteristics and reservoir properties. The proposed approach is intended to generate a geologically plausible architecture of deep-water submarine fans and may serve as a basis for the subsequent integration of modeling results into lithofacies and three-dimensional geological modeling workflows for the assessment of complex reservoir targets. With respect to the Achimov Formation, the algorithm is applied to address three interrelated tasks: reproducing the geometry and spatial position of turbidite bodies; predicting the fraction-dependent distribution of sandy, silty, and clayey components; and assessing the consistency of the resulting total-thickness and net-to-gross maps with well-control data and geological–geophysical interpretation. The expected outcome is a process-based model of the internal architecture of Achimov deep-water submarine fans that can be further used in lithofacies and three-dimensional geological modeling of complexly structured reservoirs.
2. Materials and Methods
2.1. Stratigraphic Forward Modeling of Turbidite Systems
Modeling turbidite systems remains one of the most challenging tasks in forward stratigraphic modeling, because the object of description is not only the final geometry of a sedimentary body but also the set of unsteady hydrodynamic, depositional, and erosional processes that form the internal architecture of a reservoir. An additional difficulty arises from the fact that direct observations of modern turbidity currents are rare, while their measurement under natural conditions is complicated by the high velocity, destructive nature, and episodic occurrence of such events. Under these conditions, numerical sedimentary modeling is not merely an auxiliary tool but, in fact, a primary means of linking the observed architecture of turbidite bodies with the physics of their formation [16,18,19,20,21,22].
Existing approaches to sedimentary modeling of turbidite systems differ in the balance they provide between computational efficiency and physical detail. Geometric, heuristic, and diffusion-based schemes are suitable for regional-scale modeling; however, they have limited ability to reproduce the discrete event-driven nature of turbidity currents, fractional sorting, erosion, and sharp facies transitions [12,23,24,25,26,27,28,29]. More physically based hydraulic models allow the dynamics of density flows to be described in detail, but they require substantial computational resources and are sensitive to the parameterization of erosion [12,13,30]. Therefore, multi-event modeling of Achimov sand–silt bodies requires an intermediate approach that combines process interpretability, computational stability, and the possibility of calibration against actual geological and geophysical data [1,7].
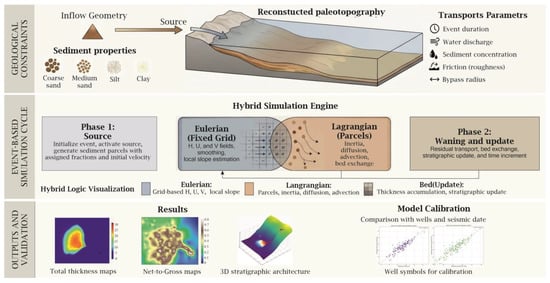
Taking these limitations into account, this study proposes a hybrid event–process algorithm that occupies an intermediate position between rapid event-based models and computationally intensive hydrodynamic solvers [31,32]. In this algorithm, the computational domain is defined by a regular grid that stores topography and accumulated stratigraphy, whereas sediment transport is implemented using a set of Lagrangian particle parcels. A key feature of the algorithm is the strict phase organization of each event: the calculation is divided into an active sediment-supply phase and a flow-decay phase, after which the residual suspended load is converted into deposit [33,34] (Figure 1).
Figure 1.
Workflow of the hybrid event–process sedimentation algorithm used to model Achimov deep-water turbidite systems. The scheme summarizes geological constraints, input sediment properties, source geometry, reconstructed paleotopography, transport parameters, the hybrid Eulerian–Lagrangian simulation engine, bed updating, and model calibration against well and seismic data.
2.2. Concept and Structure of the Proposed Algorithm
Considering these limitations, this study proposes a hybrid event-process algorithm that occupies an intermediate position between fast event-based models and computationally intensive hydrodynamic solvers. The computational domain is represented by a regular grid that stores initial topography, current bathymetry, event thickness maps, cumulative thickness maps, and a multilayer stratigraphic record. Sediment transport is implemented by a set of Lagrangian particles or sediment portions, whereas hydrodynamic fields are reconstructed on the Eulerian grid at each time step [13,31].
For each grid cell, if the total particle-related volume of water and sediment is Vij and the cell area is Ac = ΔxΔy, the effective flow thickness and cell-averaged velocities are reconstructed as follows:
where up, vp, and Vp are the longitudinal velocity, transverse velocity, and volume of the particle, respectively. After reconstruction, the thickness field may be smoothed by a spatial Tetzlaff-type filter to reduce high-frequency numerical artifacts while preserving large-scale transport pathways [30,31].
Local morphodynamics are controlled by gradients of the current bed surface together with the effective flow thickness. In discrete form, the longitudinal and transverse components of the driving slope can be written as [13,30,33]:
Thus, both the direction and intensity of particle movement depend not only on the original paleorelief but also on sediment already accumulated during preceding events. This mechanism allows self-organization of transport pathways during multi-event evolution of the system.
The sediment mixture is represented by four grain-size classes: coarse-grained sand, medium-grained sand, silt, and clay. For each fraction the model defines characteristic grain size, density, frictional decay, turbulent diffusion, and transport radius. This discretization simplifies the real granulometric spectrum but preserves the essential distinction between the sandy and fine-grained components of a density flow [30,31,33].
For every fraction, a characteristic settling velocity is calculated. In the current implementation, the following Stokes settling approximation is used for the first-order hydraulic separation of coarse and fine particles [35]:
where d is grain diameter, ρs and ρf are grain and fluid density, respectively, ν is kinematic viscosity, and g is gravitational acceleration. This relation explicitly differentiates the hydraulic behavior of coarse sandy material and fine suspended sediment [35,36].
Dynamic exchange between flow and bed is controlled by deposition, entrainment, and erosion. For sandy fractions, entrainment is evaluated using a García-Parker-type criterion. First, the dimensionless particle and entrainment parameters are calculated [35,36]:
where R = (ρs − ρf)/ρf is submerged relative density and u* is shear velocity. The entrainment coefficient is then represented as [37,38]:
For fine-grained fractions, a wash-load regime is implemented. Its stability is controlled by an analogue of the Rouse number [39]:
This separation of mechanisms allows the model to form sandy axial bodies in proximal and medial positions while transporting silt and clay farther into distal parts of the system, where they form more laterally extensive drapes and background deposits [13,15,32,35,36,37,38,39,40].
The temporal structure of an individual event is organized as a two-stage cycle. During the first stage, new particles are continuously introduced into the computational domain from the source area. Once the specified temporal threshold is reached, particle generation ceases, and the system enters a waning phase, during which gravitational spreading and energy dissipation of the already introduced suspension volume occur. After completion of the cycle, the residual suspended load is forcibly converted into deposits, and the resulting depositional lens is added to the cumulative stratigraphic record. This approach combines event-based geological logic with intra-event morphodynamic feedback [41,42].
An important applied component of the algorithm is the automated calibration module based on well-control data. The quality of agreement is assessed using total thickness and the net-to-gross ratio. The resulting statistical indicators characterize the quality of calibration rather than a fully independent test of the predictive capability of the model. In addition, the geological plausibility of the result was evaluated by assessing the consistency of the simulated lobe architecture, the position of sand-prone zones, and sediment-transport directions with core, well-log, and seismic-facies data [43].
Parameter optimization is performed stochastically, using simulated annealing, through multiple runs of the forward model and the sequential acceptance or rejection of new parameter sets.
The parameters used in the model can be divided into four groups: geologically constrained, calculated, scenario-based, and calibrated parameters. This approach is required because, for ancient deep-water turbidite systems, most hydrodynamic characteristics of individual events cannot be directly measured [1].
The geologically constrained parameters included the reconstructed paleosurface, the position of the sediment-source area, the overall geometry of the computational domain, and well-derived values of total thickness and net-to-gross ratio. The calculated parameters included the settling velocity of individual fractions, entrainment criteria, and conditions controlling the transport of fine-grained suspended load. Settling velocity was determined using an empirical relationship. For sandy fractions, sediment entrainment was evaluated using the García–Parker criterion, whereas for the silty–clayey component, a background suspended-load regime controlled by an analogue of the Rouse number was applied [35,37]. These parameters were not adjusted arbitrarily but were calculated on the basis of selected physical and empirical relationships. Scenario-based and calibrated parameters included event duration, the volume of the supplied water–sediment mixture, suspended-sediment concentration, and the coefficients of frictional attenuation and turbulent diffusion. Their initial ranges were defined on the basis of the sedimentological concept, geological analogues, and the expected morphology of deep-water submarine fans, and were subsequently refined by comparing the modeling results with observed total-thickness and net-to-gross values at well-control points.
3. Geological Setting and Input Data
3.1. Geological Characterization of the Study Area
To test the developed algorithm, a study area within Western Siberia was selected. This area is characterized by the widespread occurrence of Achimov deposits and a sufficient degree of investigation based on well, core, geophysical logging, and seismic data [44].
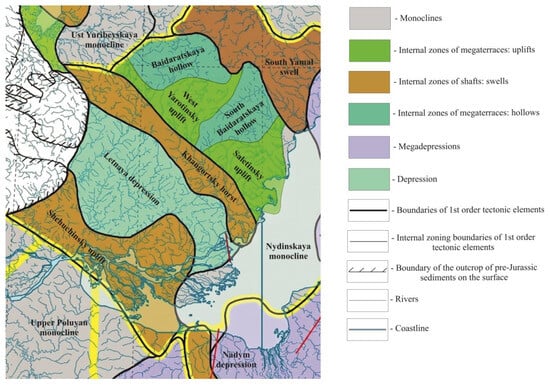
The study area is located in the northern part of the West Siberian Plate, in the southern part of the Yamal Peninsula, within the junction zone between the Nadym–Taz Syneclise and the South Yamal Monocline. This tectono-stratigraphic setting controlled the development of the Lower Cretaceous clinoform complex and the associated sand–silt bodies of the Achimov Formation [45] (Figure 2).
Figure 2.
Tectonic position of the study area within the northern West Siberian Plate, showing the main first-order tectonic elements, monoclines, megaterraces, shafts, depressions, rivers and coastline. Modified after [45].
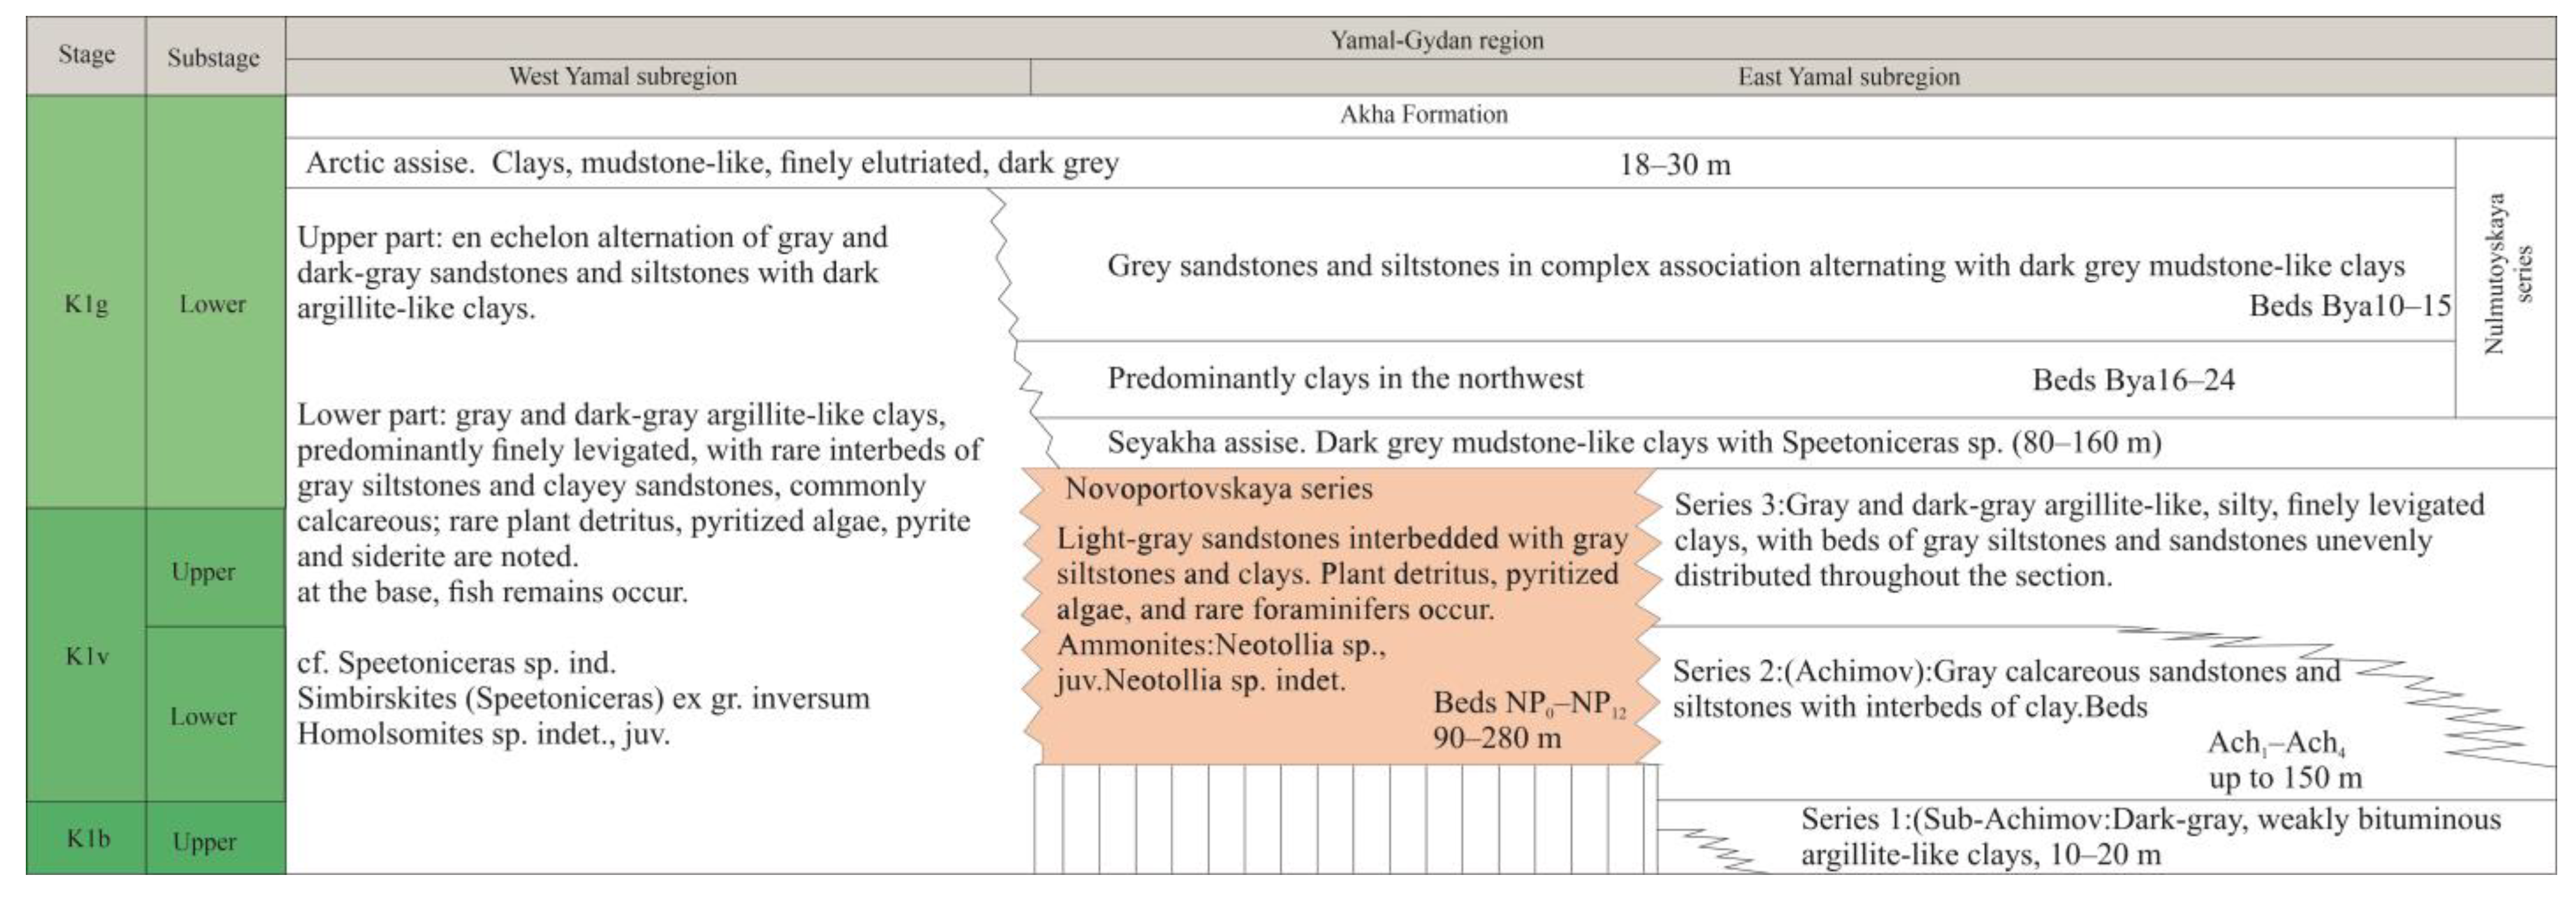
Stratigraphically, the modeled interval belongs to the Lower Cretaceous Neocomian clinoform complex. The modeling target comprises the NP group reservoirs, which are associated with deep-water sand–silt bodies of the Achimov Formation. The formation of these bodies is interpreted as the result of clastic sediment supply from the slope part of the clinoform system into deeper-water parts of the basin [1,7,44] (Figure 3).
Figure 3.
Stratigraphic position of the Achimov Formation and the modeled NP group beds within the Lower Cretaceous Neocomian succession of the Yamal–Gydan region, Western Siberia. Modified after [46].
3.2. Conceptual Sedimentological Model
The key mechanism responsible for the formation of the modeled object is represented by unsteady turbidity currents—density flows driven by the excess density of a water–sediment suspension relative to the ambient water mass. The initiation of such flows may be associated with gravitational instability of sediments near the shelf edge, reworking of previously accumulated material, and its subsequent directed transport downslope along the paleoslope. As the flow propagates, its dynamics are controlled by the interaction of several factors, including the gradient of the underlying surface, basin depth, flow discharge, grain-size composition of the sediment, erosion intensity, energy losses due to friction and internal deformation, and entrainment of ambient water [47,48,49,50].
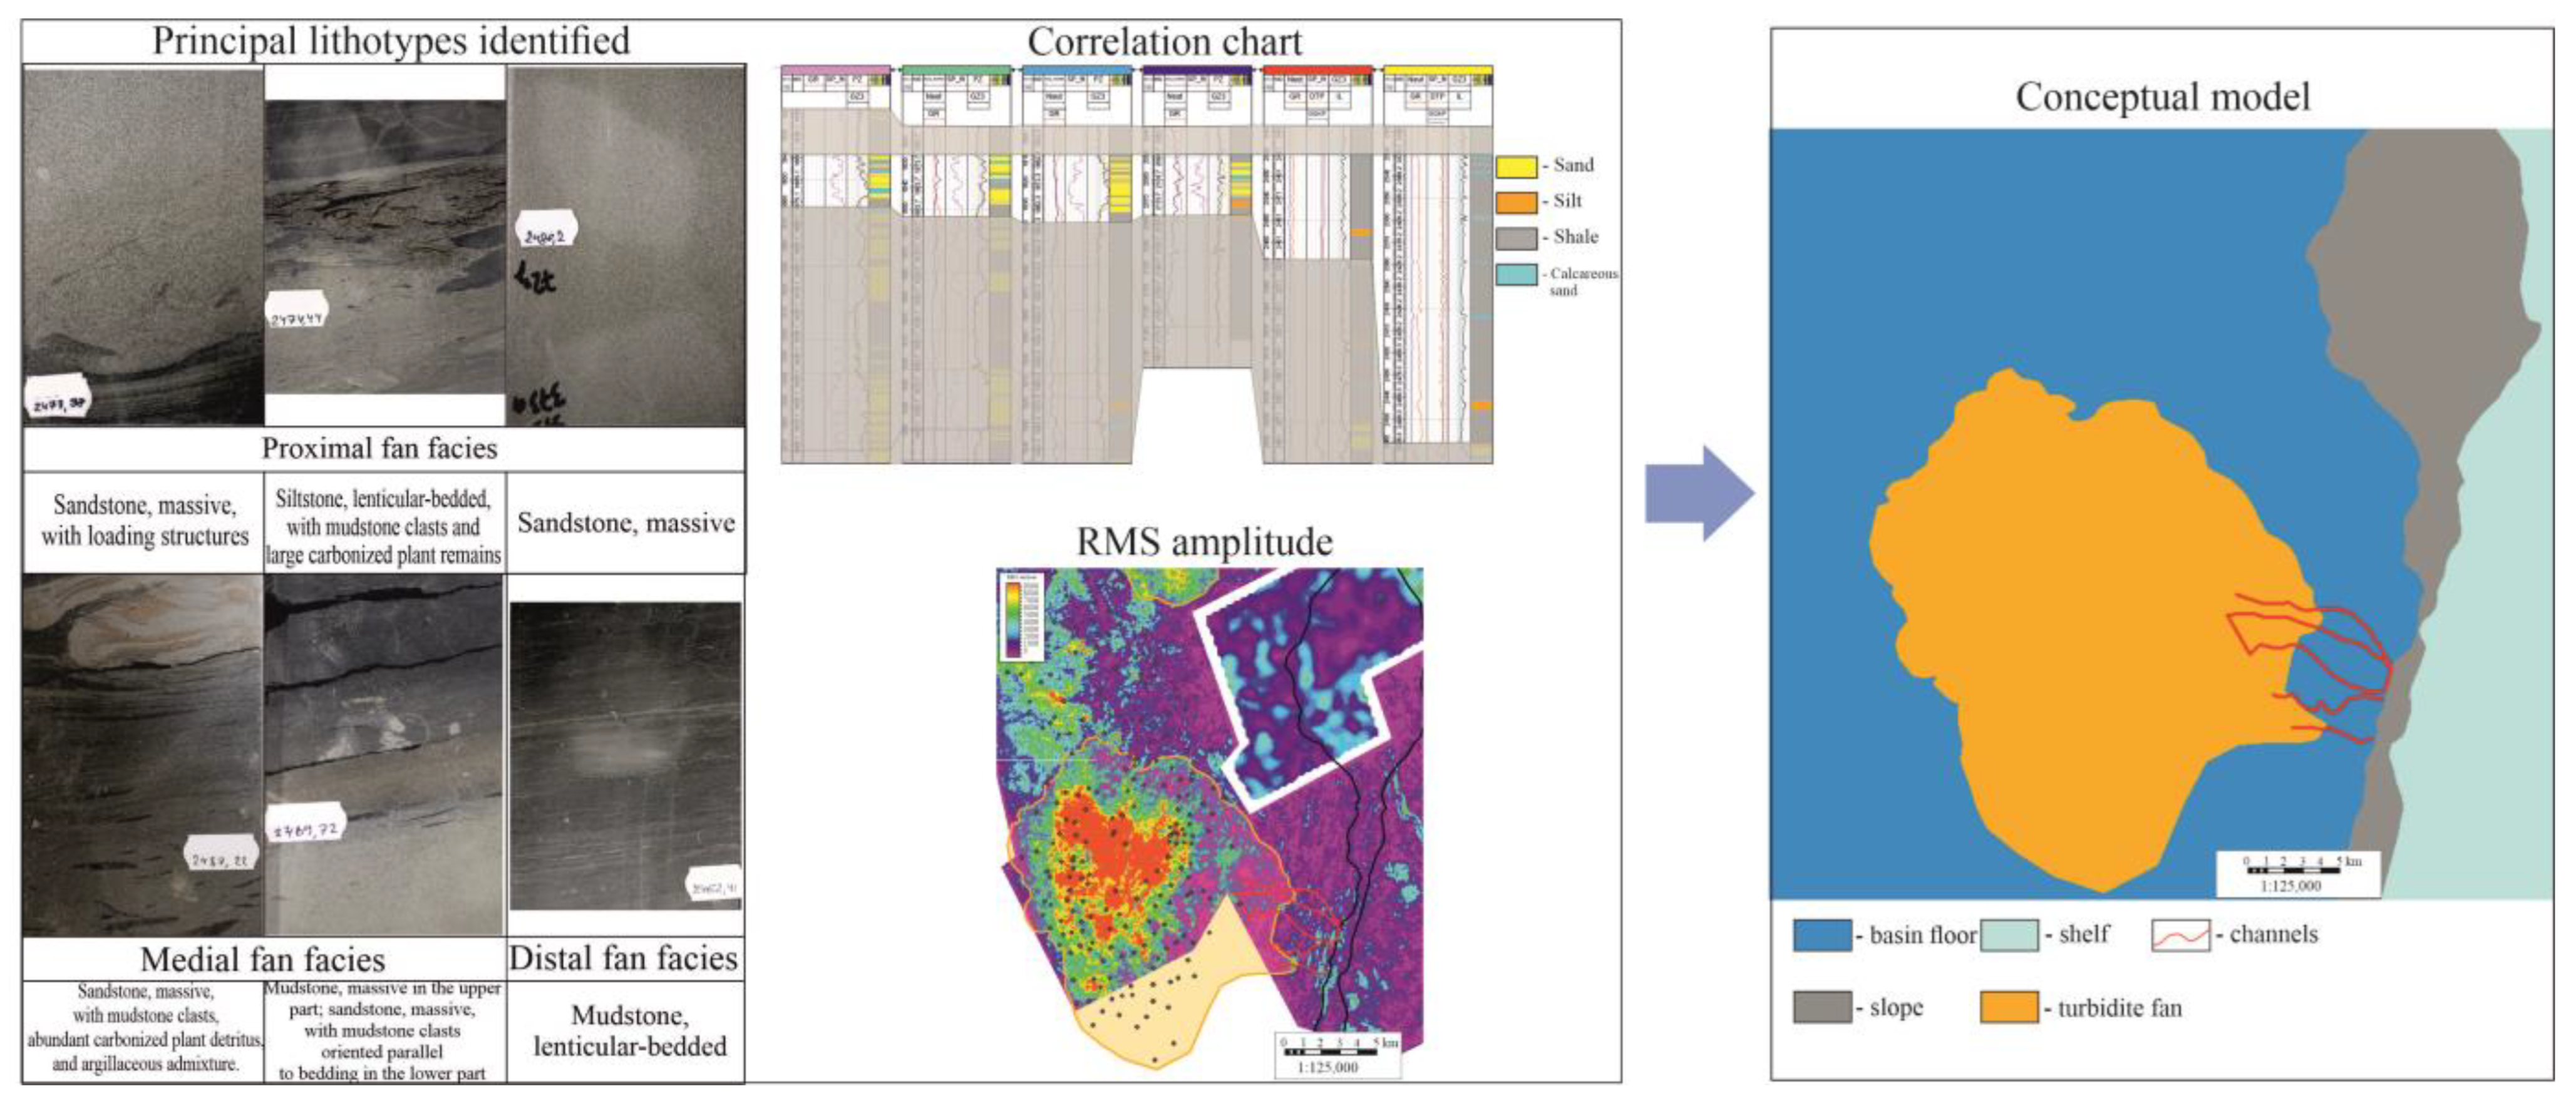
The sedimentary organization of the NP group beds is determined by the combined influence of several processes: primary turbidity-current transport, subsequent reworking of sediment by bottom currents, and local remobilization of previously accumulated material. To construct the conceptual geological model and identify prospective targets within the Novoportovskaya Formation interval, an integrated analysis of geological and geophysical data was performed, including time-thickness maps, seismic-facies interpretations based on 2D and 3D seismic surveys, attribute maps, and the results of well and core studies. Integration of these data made it possible to develop lithofacies concepts for the architecture of the target interval and to define the key constraints for subsequent forward stratigraphic modeling [1] (Figure 4).
Figure 4.
Conceptual sedimentological model of the Achimov Formation interval based on core descriptions, well-log correlation, seismic attributes and lithofacies interpretation. The model defines the assumed sediment source area, transport pathways and probable accumulation zone used as constraints for forward stratigraphic modeling.
3.3. Input Data and Model Configuration
In process-oriented models of this type, the key input data include the reconstructed paleosurface, the position and characteristics of sediment source areas, the parameters of the supplied sedimentary material, and the data used for subsequent validation and calibration [51,52,53].
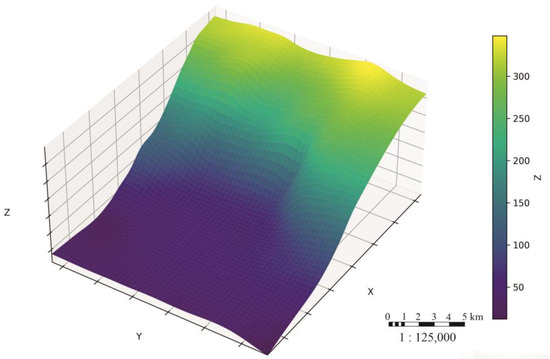
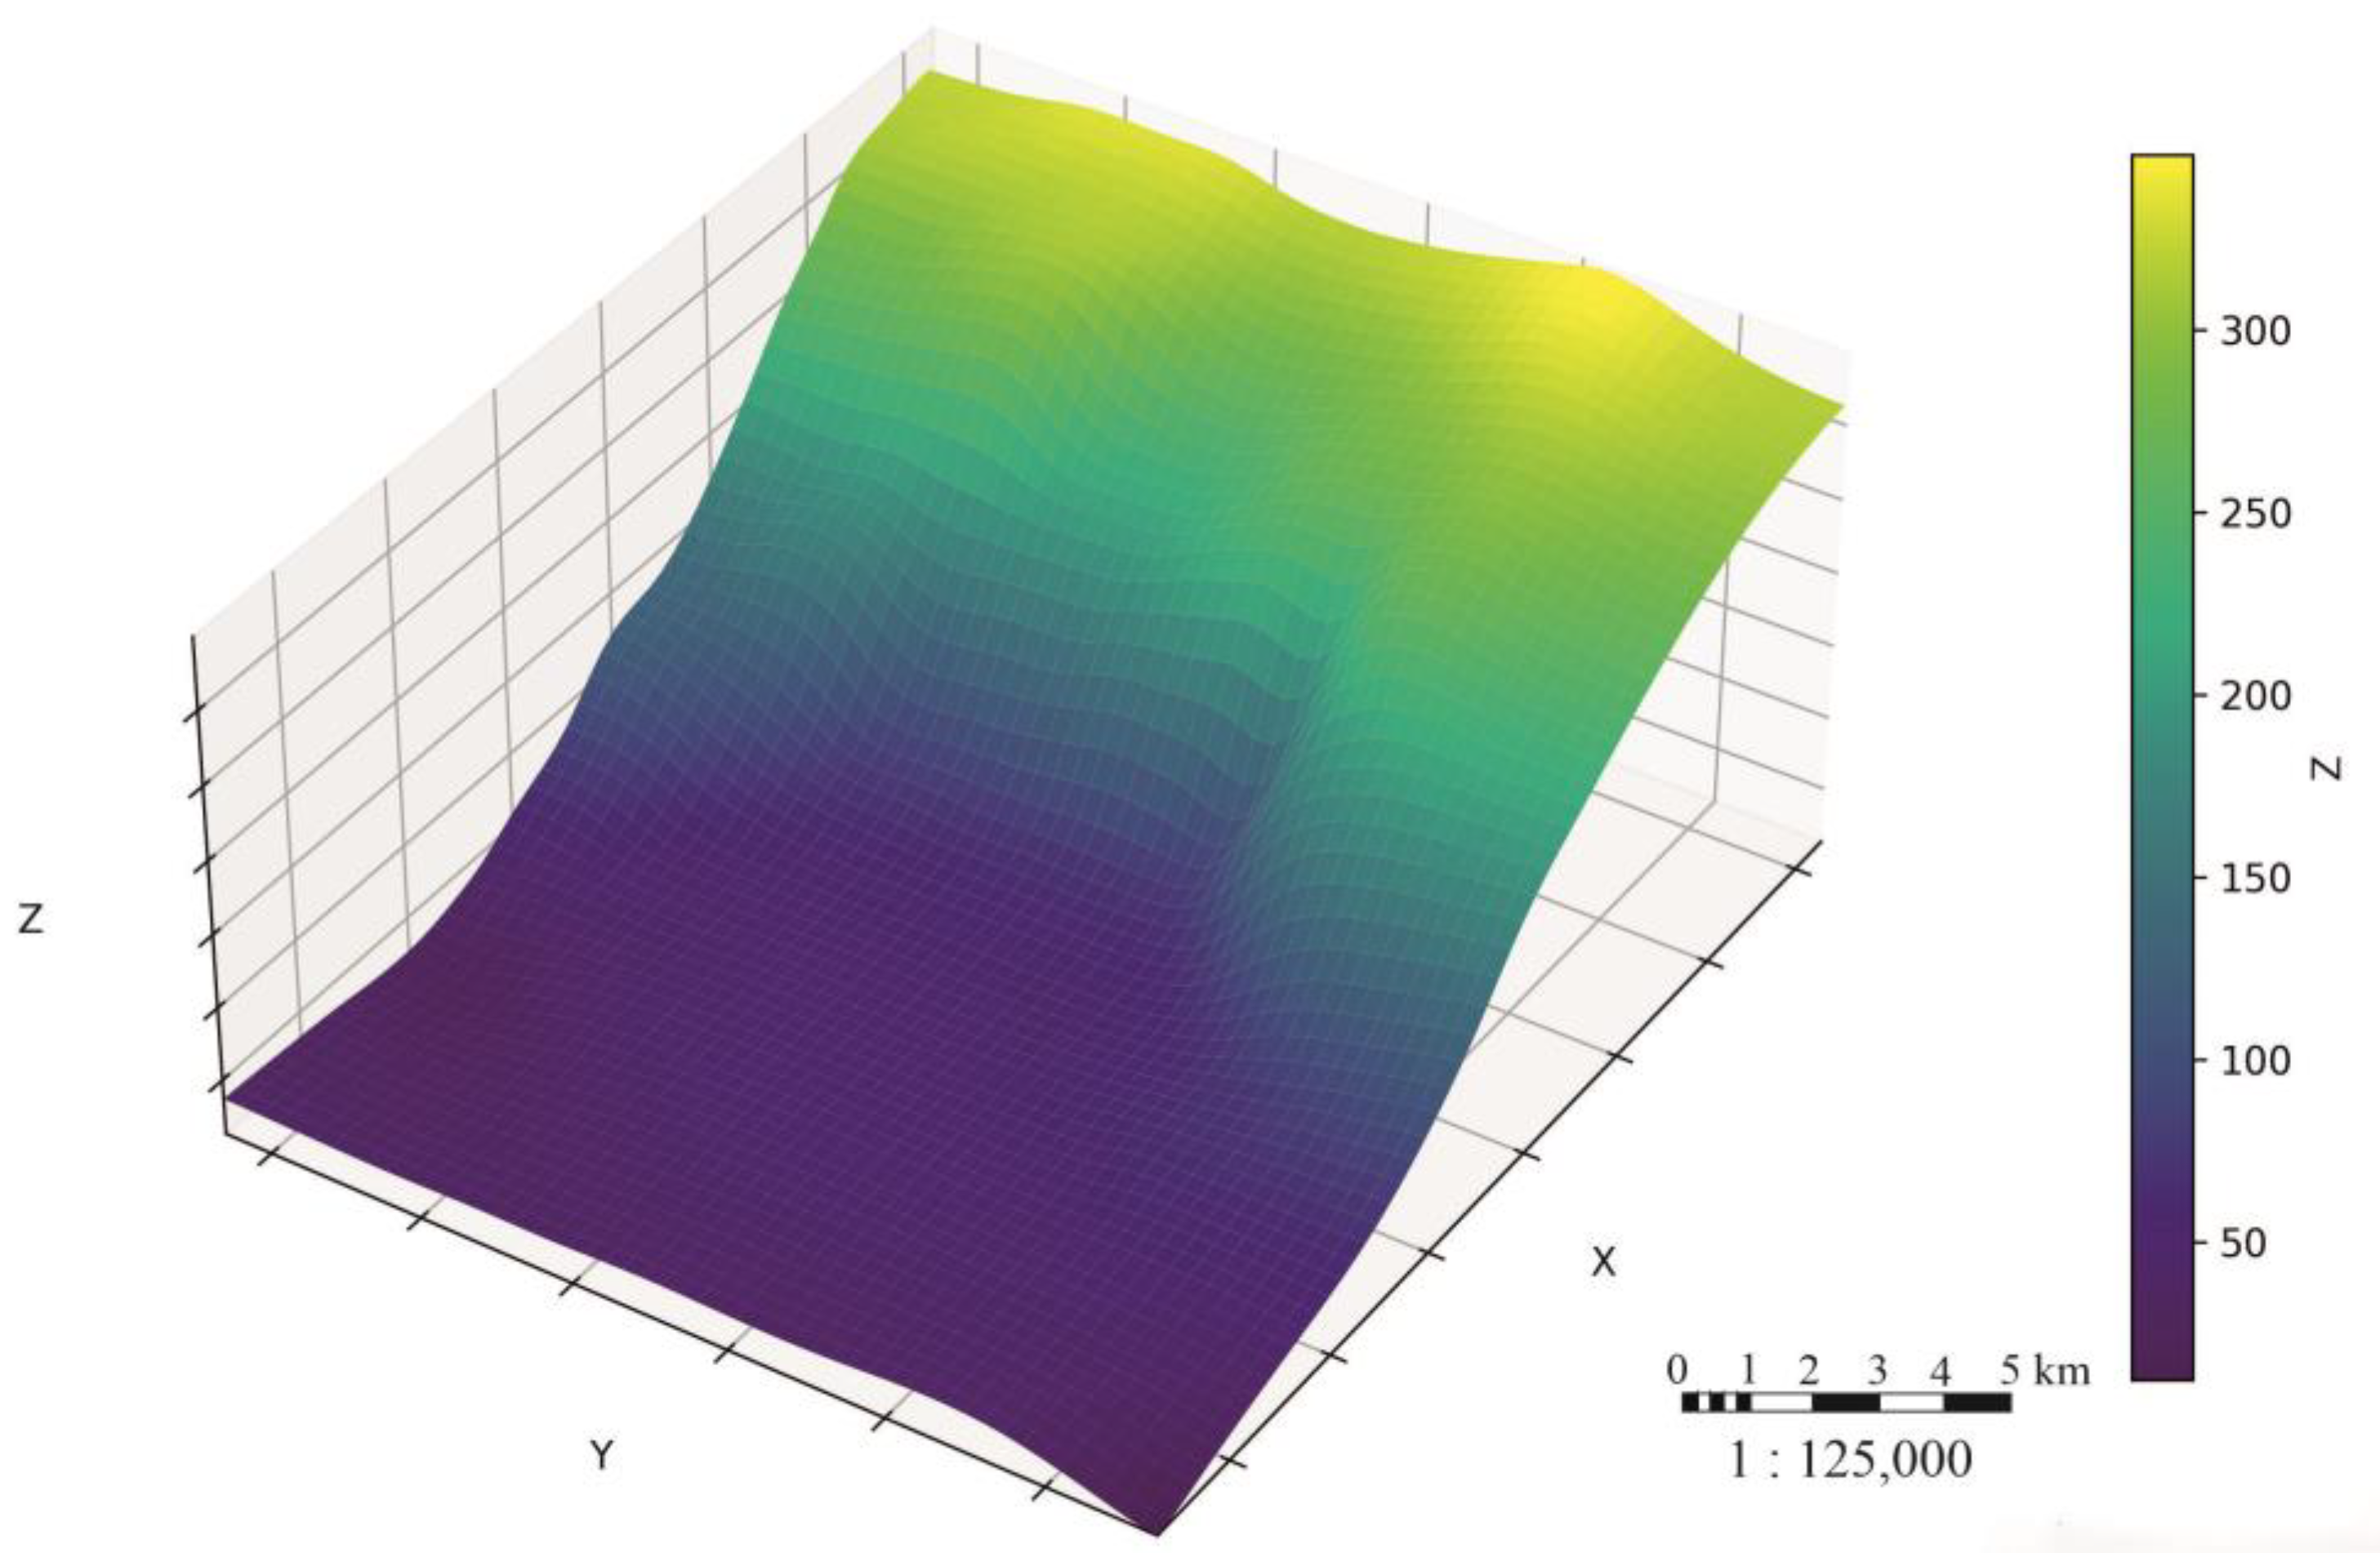
As a first step, the computational paleosurface corresponding to the onset of formation of the target interval was reconstructed. The importance of correctly reconstructing the hypsometry of the paleosurface, covering both the sediment source area and the accommodation space at the beginning of formation of the modeled sedimentary complex, is difficult to overestimate. The conditional paleosurface was constructed from structural surfaces obtained through seismic interpretation using a “reference horizon from above” approach, in which sediment thicknesses are analyzed relative to an overlying marker bed. The hypsometry of the paleosurface plays a decisive role in the model. However, in all modern approaches, paleorelief reconstruction involves a number of assumptions [54,55]; therefore, a relatively high degree of uncertainty is introduced into the final result at the very first stage of preparing the basis for sedimentary modeling [1,56,57] (Figure 5).
Figure 5.
Reconstructed input paleosurface used as the initial topographic surface for modeling.
After preparation of the paleosurface, the sediment source was specified. In the algorithm, it is defined as the area from which terrigenous material transport begins within the perimeter of the modeled domain [58]. The position of the sediment source was assigned based on analysis of the paleosurface for characteristic isometric negative relief forms along the shelf-edge line, as well as on seismic-facies analysis, which allows sediment transport pathways to be identified [1,59].
Lithological and grain-size preparation of the input data was performed through integration of core data, well-log data, and seismic-facies interpretation. For the study area, the sedimentary material was represented using a four-fraction scheme: coarse sand, medium sand, silt, and clay. For each fraction, the model specifies a characteristic grain size and density, as well as derived transport parameters [1,13,30].
4. Results
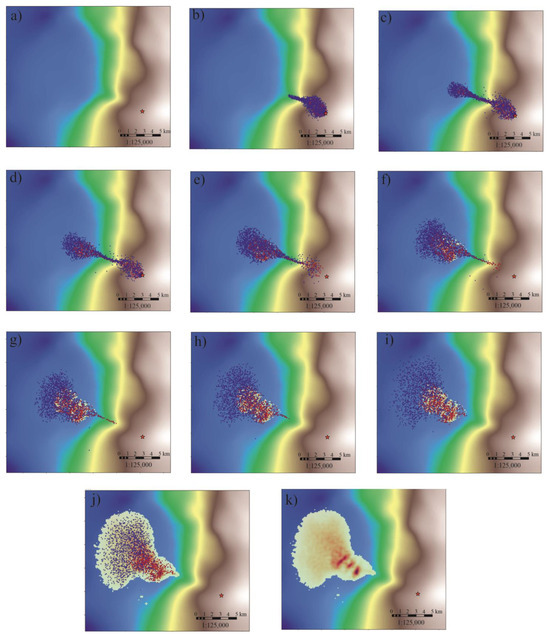
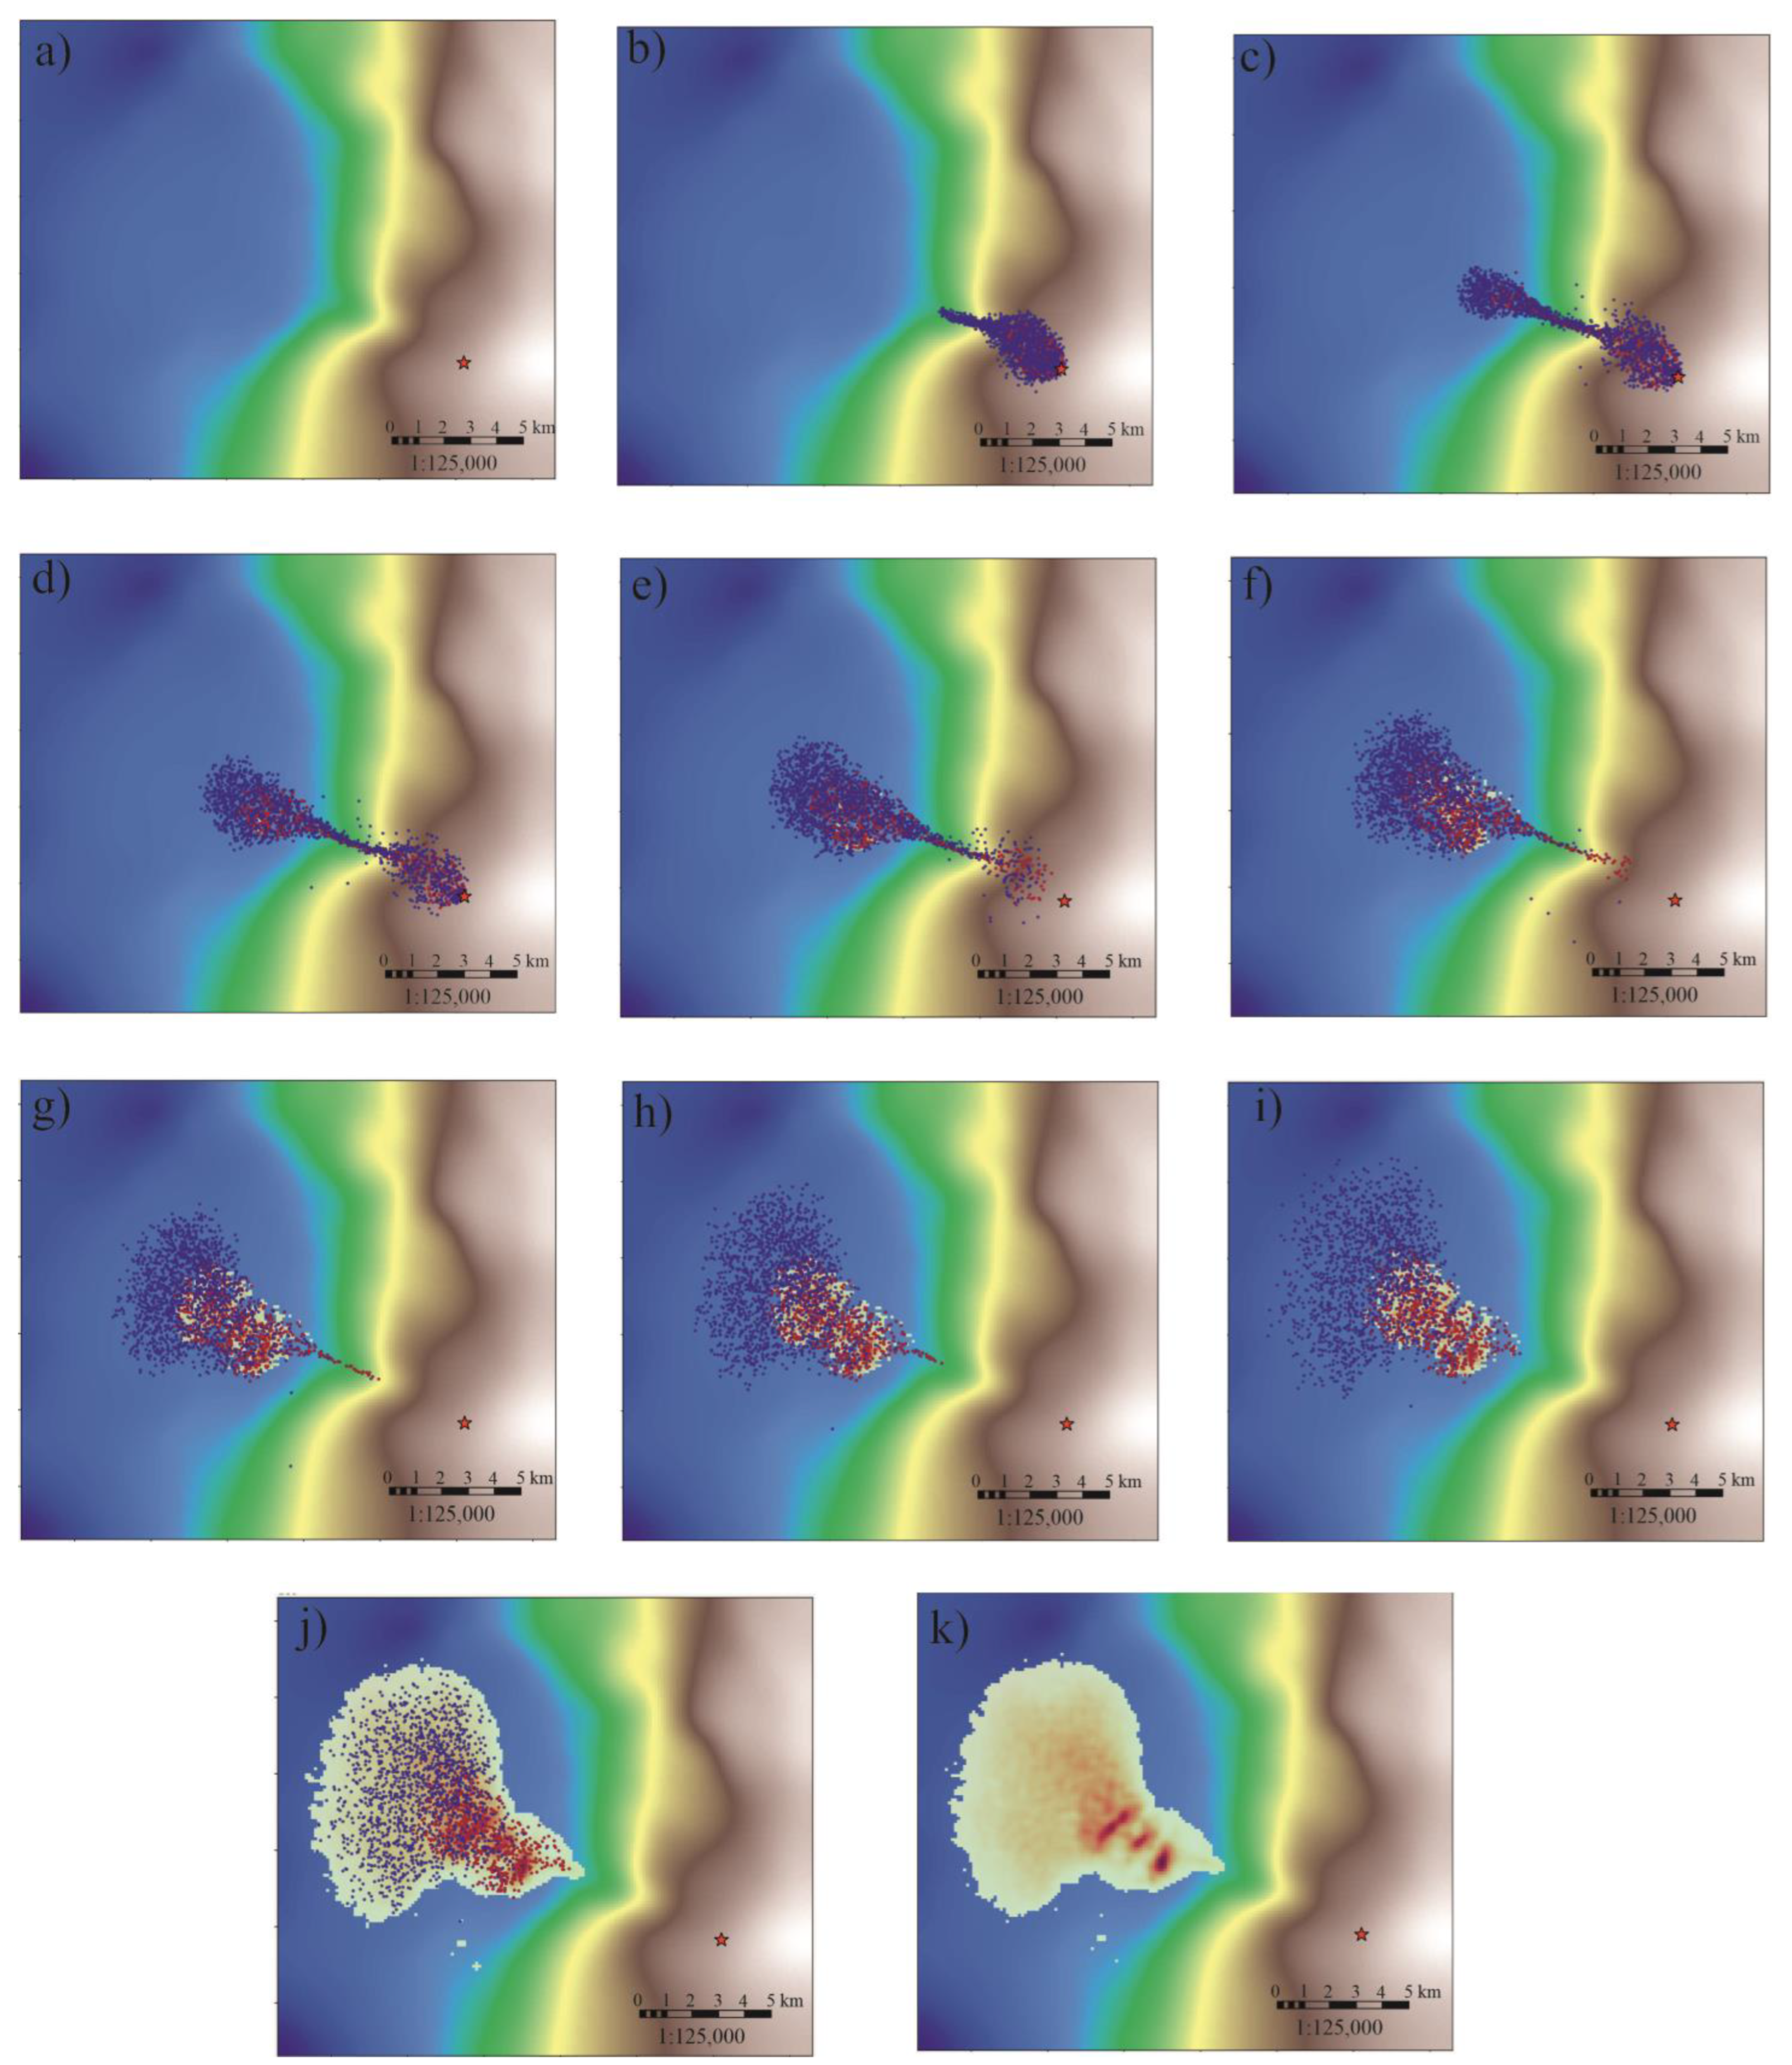
The numerical experiment made it possible to reproduce the sequential formation of deep-water submarine fans controlled by the reconstructed paleobathymetry and the position of the sediment supply source. The sequence of calculated states shows that, during the early stages of a single event, a narrowly focused transport flow forms along a local bathymetric depression (Figure 6a–c). As the flow energy decreases, sediment deposition begins and a primary depositional lobe forms in the deep-water part of the basin (Figure 6d–f). Further development of the event is accompanied by lateral expansion of the depositional area, fractional differentiation of the sediment, and formation of a more complex body morphology due to flow redistribution over the updated basin-floor surface (Figure 6g–k).
Figure 6.
Sequential snapshots of a single modeled turbidity-current event. Panels (a–c) show the active sediment-supply phase and focused transport along a bathymetric depression; panels (d–f) show flow waning and initial lobe formation; panels (g–k) show lateral spreading, fractional differentiation and final deposition. Background colors indicate the reconstructed paleotopography, whereas particle colors reflect the modeled sediment fractions and depositional evolution during the event. The star marks the sediment source location.
Multi-event modeling showed that the resulting architecture of the Achimov sand–silt body is formed not by instantaneous filling of the computational domain, but by the cumulative stacking of successive elementary events. The earliest events primarily follow the most pronounced negative forms of the paleorelief, within which sediment-transport pathways are concentrated and initial accumulation zones are formed. As local depressions are progressively filled, the bed surface becomes more even, which leads to partial diversion of subsequent flows into adjacent depocentral areas.
The distribution of lithotypes in the model also follows the hydrodynamic zonation of deposition. Coarser sandy fractions, characterized by higher settling velocities and shorter transport distances, are mainly accumulated on the slope, at the slope toe, and in the proximal to medial parts of the submarine fan. Finer-grained material remains in suspension for a longer time and is transported over greater distances, forming distal and lateral zones of silt–clay deposition. As a result, a series of elementary events forms a composite submarine-fan body whose final architecture reflects not an instantaneous facies distribution, but the cumulative effect of repeated turbidity currents, paleorelief updating, and fractional differentiation of sedimentary material over geological time.
Between successive modeled events, the zones of maximum thickness shifted laterally, and elementary lobes were displaced relative to previously deposited bodies. The most pronounced lateral offset was observed in the medial part of the modeled system.
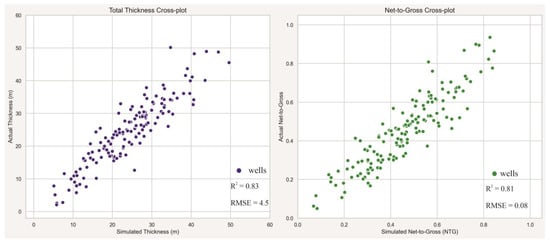
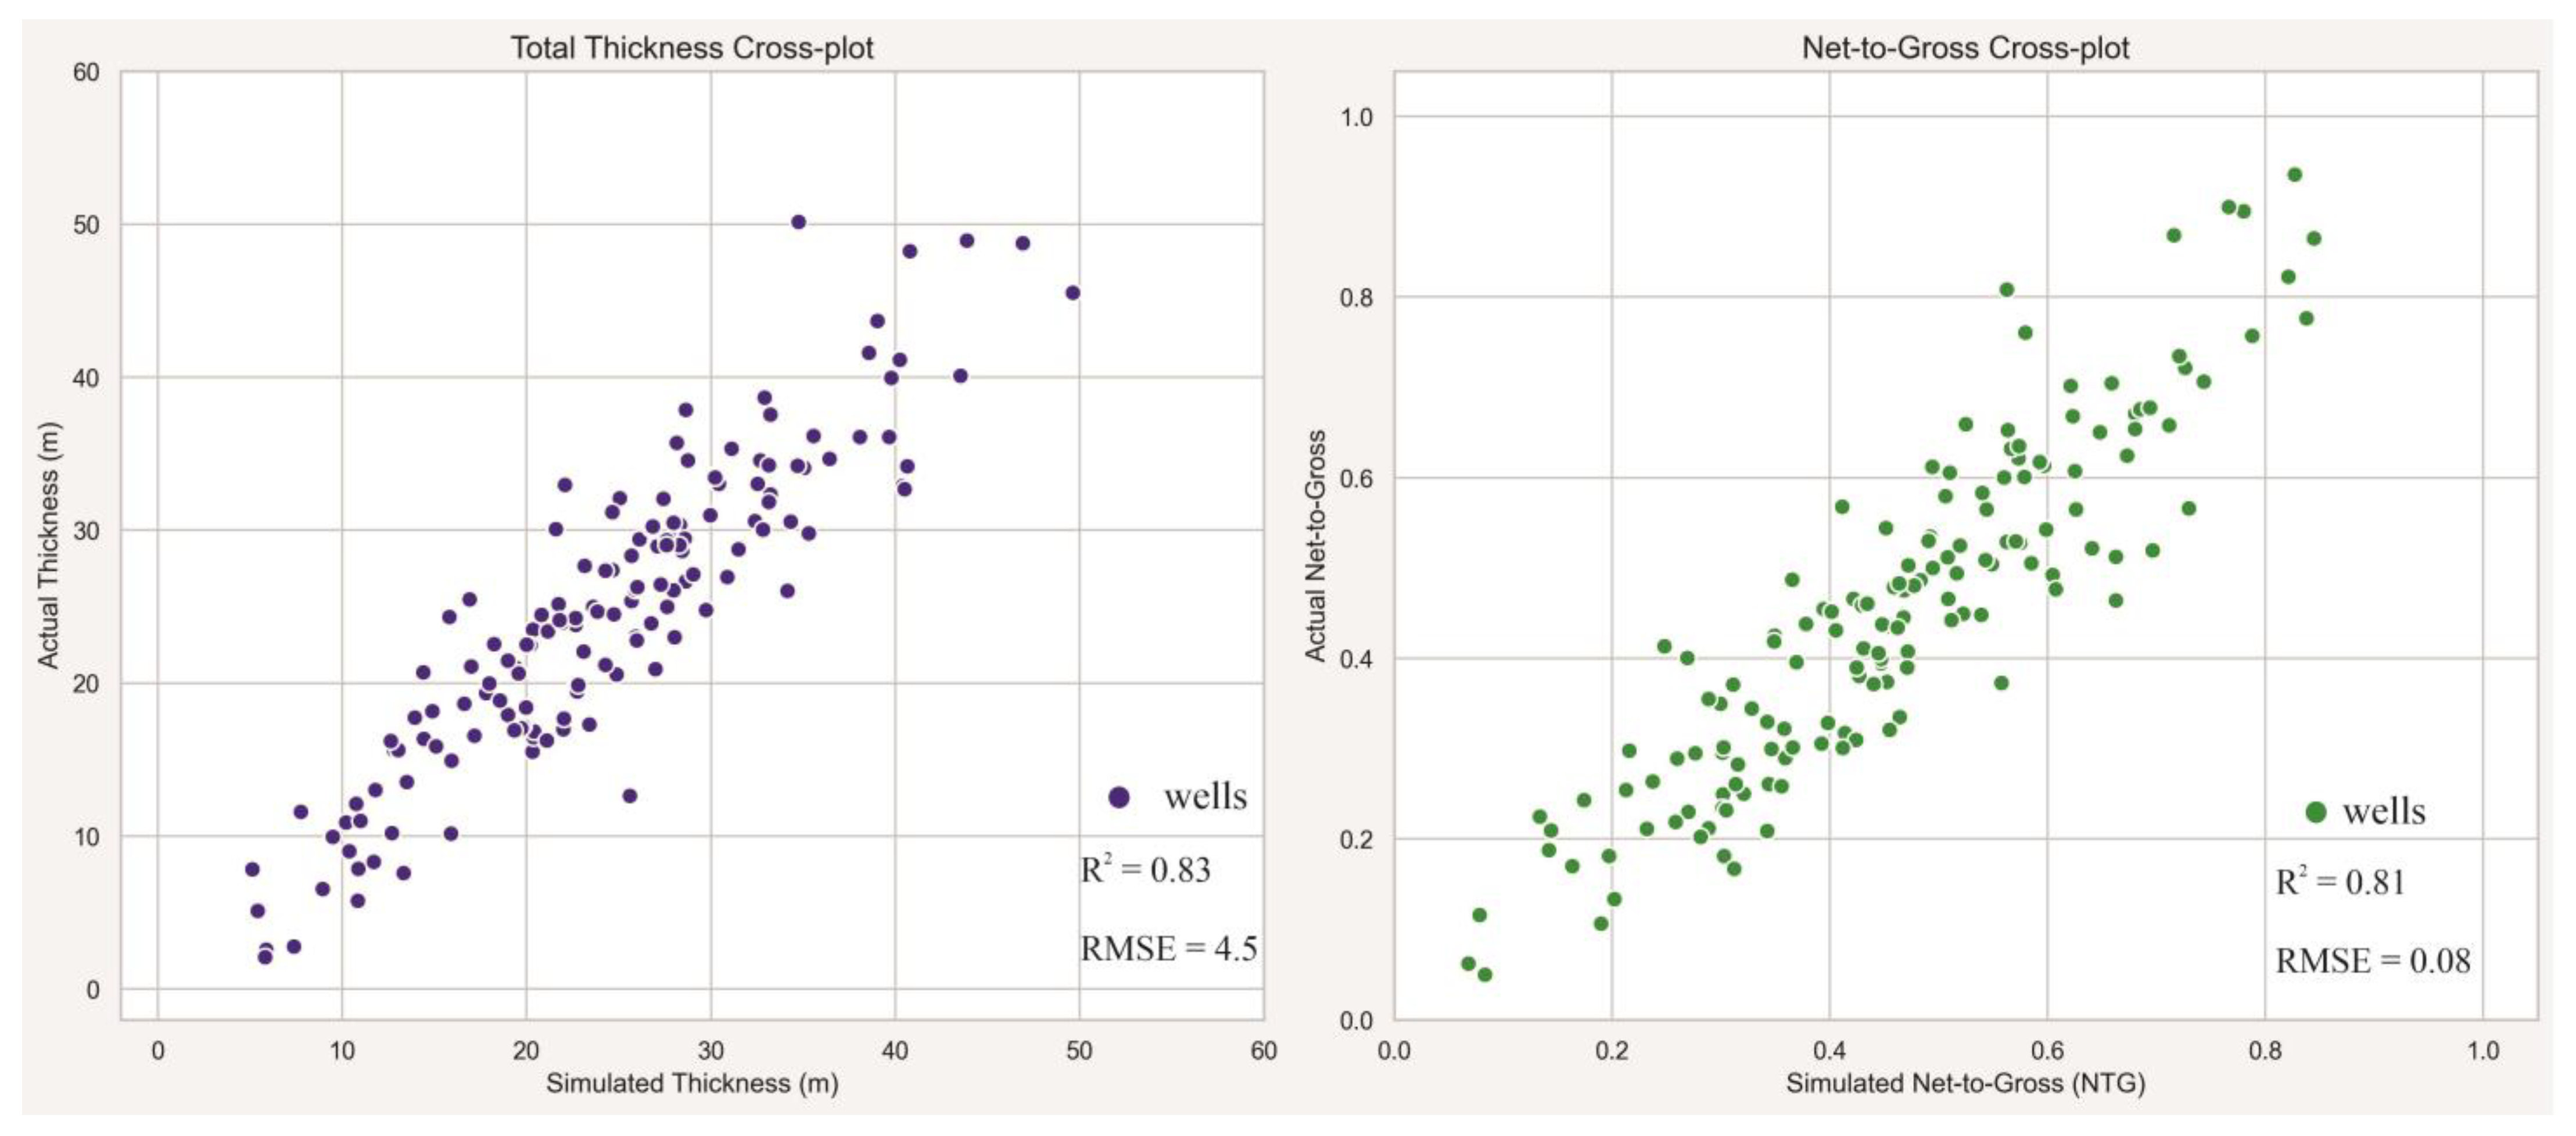
The calibration stage was performed by comparing modeled parameters with well-derived values of total thickness and sandiness. In the implemented workflow, modeled total thickness values and the proportion of sandy fractions were extracted at well locations and compared with the corresponding observed values. The mismatch was evaluated using the root mean square error for total thickness and net-to-gross, while correlation coefficients were used to assess the consistency of spatial trends between modeled and observed parameters (Figure 7)
Figure 7.
Calibration cross-plots comparing simulated and observed well-derived parameters: total thickness, m (left), and net-to-gross ratio, NTG (right).
The calibration results showed that the model reproduces the main trend of thickness variation and the spatial differentiation of sand-prone intervals. For total thickness, the coefficient of determination (R2) was 0.83, and the root mean square error (RMSE) was 4.5 m. For the net-to-gross ratio (NTG), the coefficient of determination (R2) was 0.81, and the RMSE was 0.08.
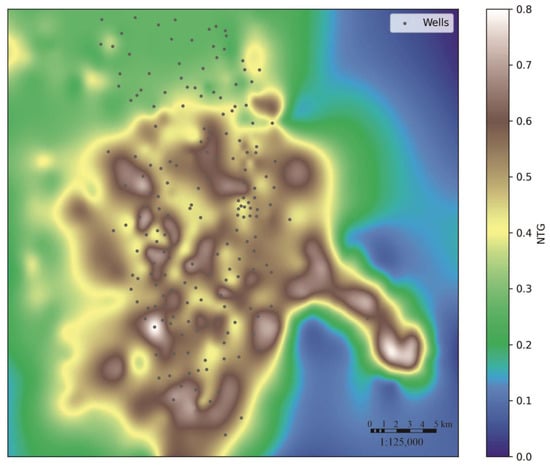
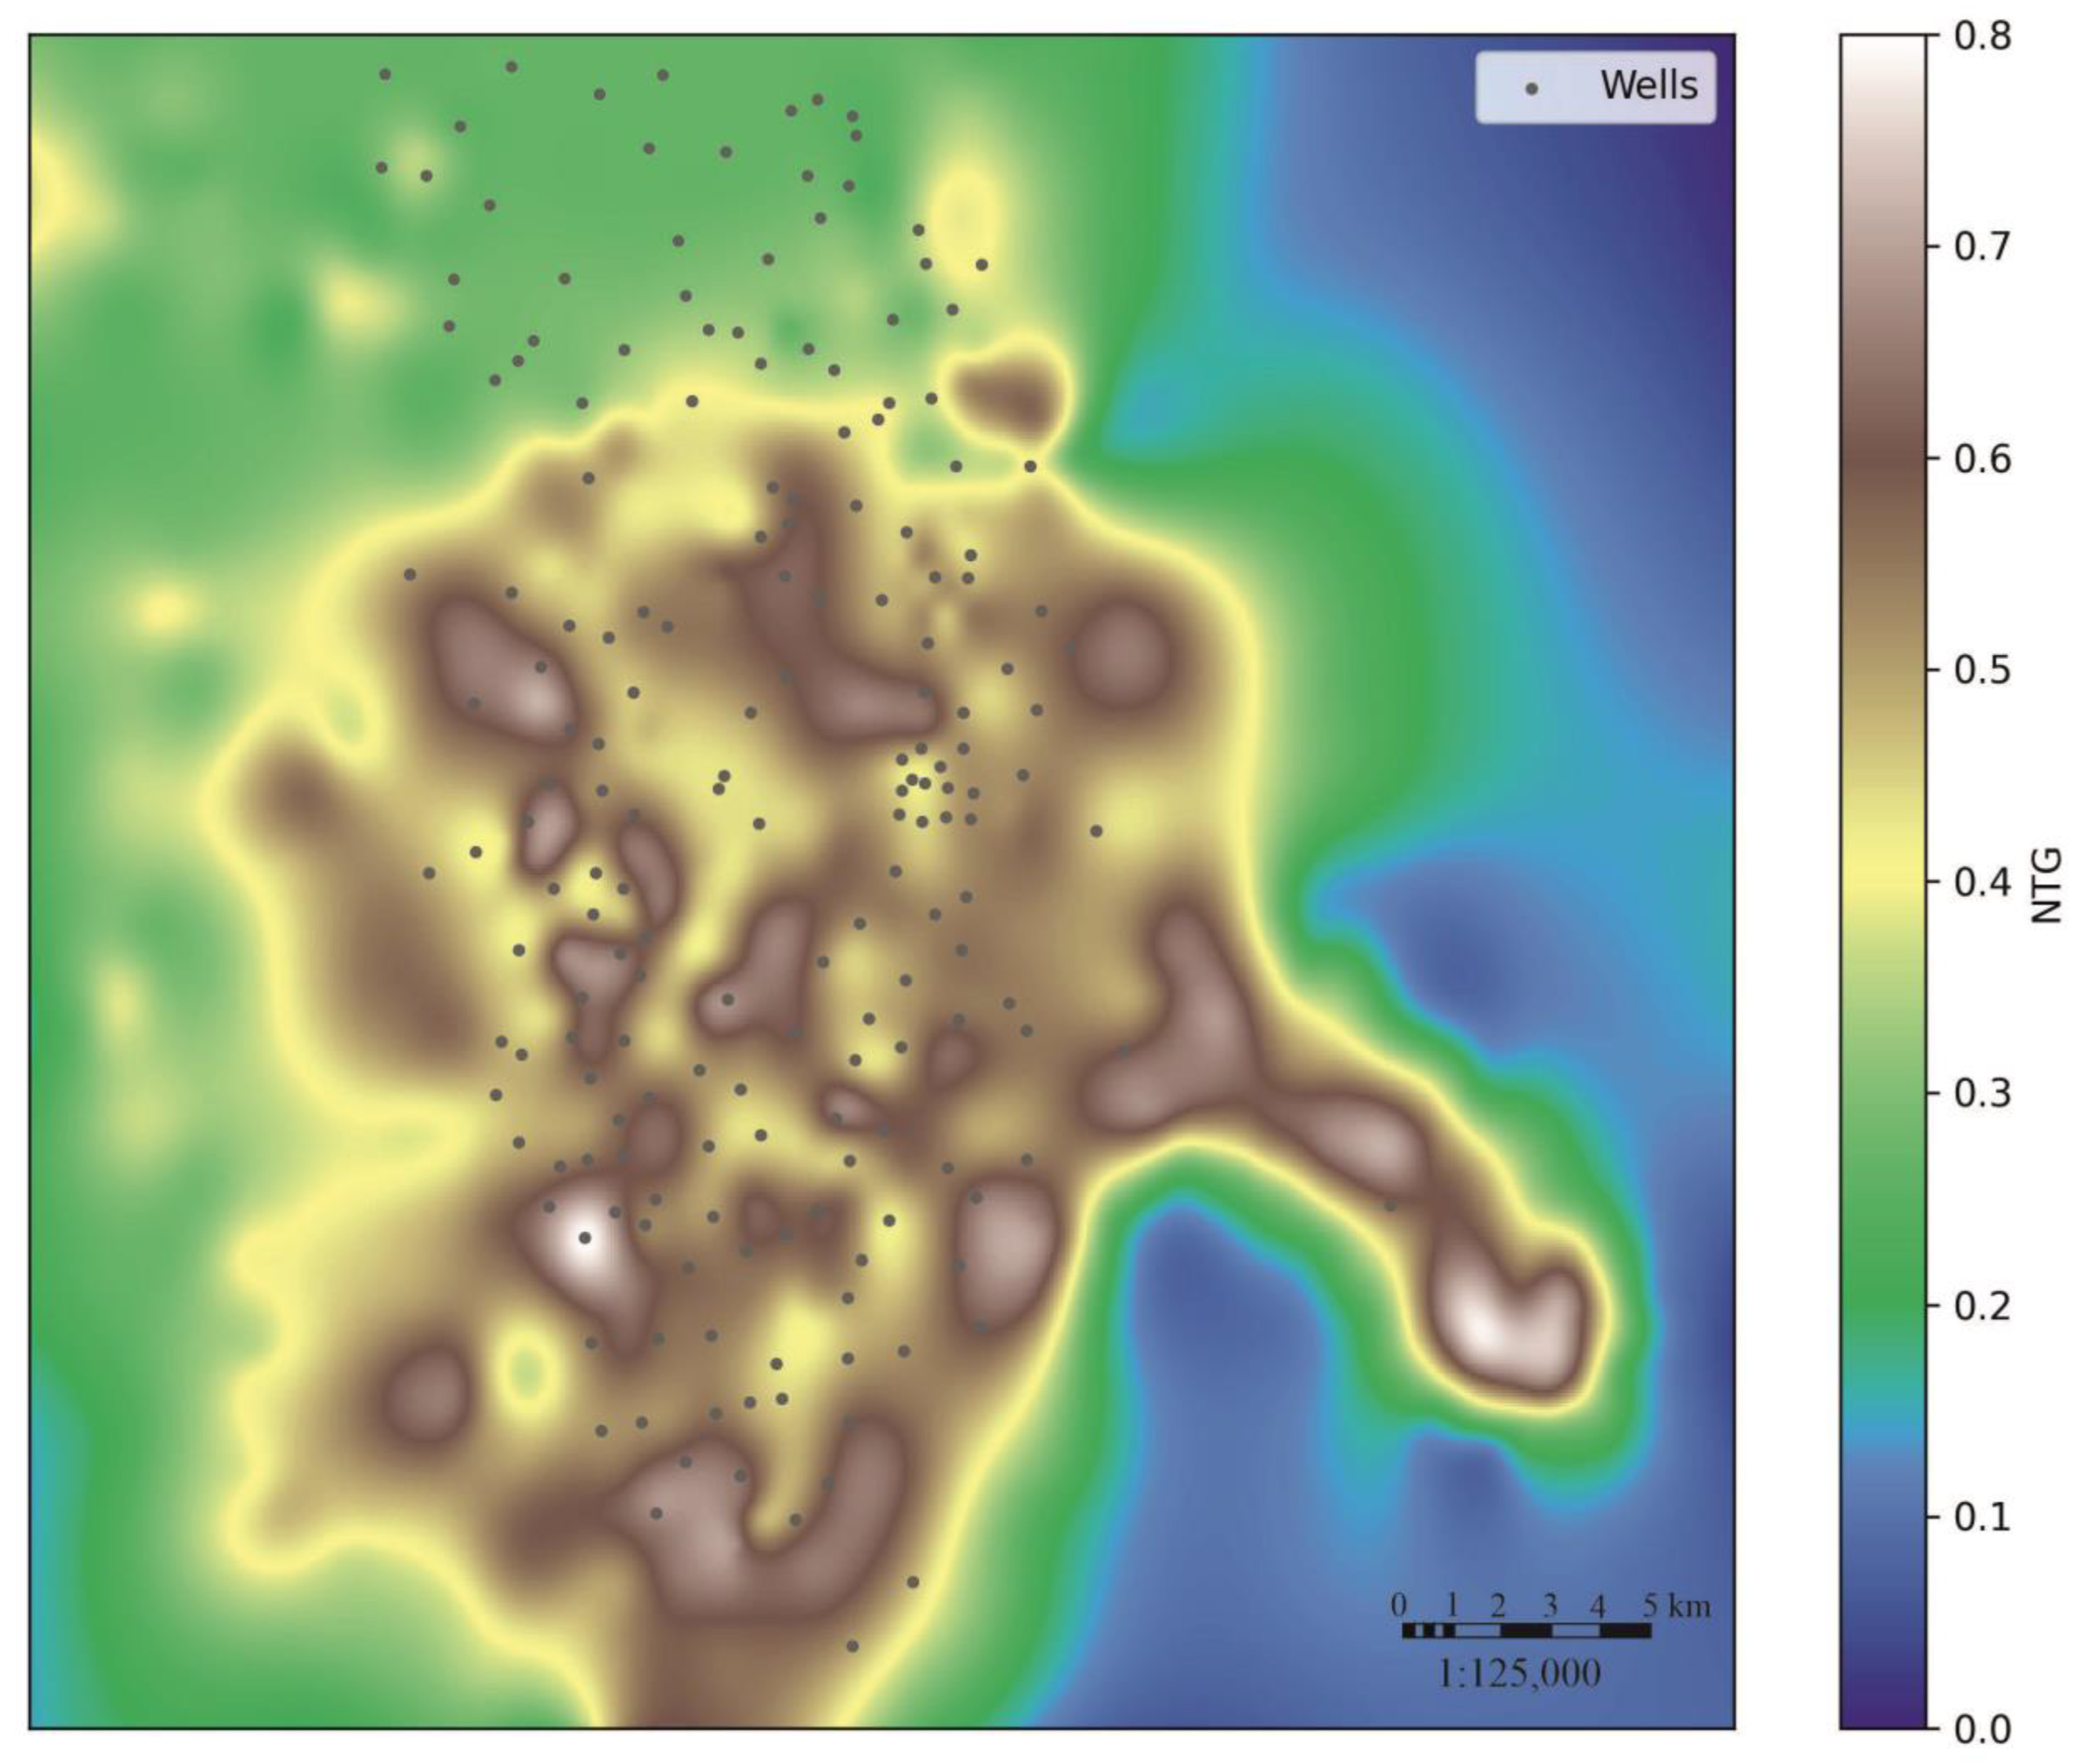
The best agreement between modeled and observed values was established for wells located within the axial and medial parts of the simulated system, where elevated modeled NTG values correspond to an increased proportion of sandy intervals according to well-control data. More pronounced deviations are observed in peripheral areas and in zones of abrupt lateral variability in lithological composition. These deviations are reflected in the increased magnitude of residuals and in local discrepancies between modeled and observed values of thickness and sandiness (Figure 8).
Figure 8.
Simulated net-to-gross distribution map for the modeled Achimov submarine-fan system. Black points indicate wells used for calibration; the color scale shows NTG values.
5. Discussion
The obtained results show that the internal architecture of the studied object is formed through the interaction of three interrelated factors: reconstructed paleorelief, successive sediment supply, and morphodynamic updating of the basin-floor surface after each depositional event. In contrast to geostatistical approaches, in which the geometry of sedimentary bodies is defined on the basis of existing data, the proposed algorithm generates the spatial distribution of terrigenous material as a result of directed transport, fraction-dependent deposition, and changes in accommodation space during successive events.
One of the most important modeling results is the reproduction of the architecture of deep-water submarine fans. The obtained model is important for areal reservoir prediction. During the earliest depositional events, sediment-transport pathways are controlled mainly by negative forms of the initial paleotopography. As the local depocenter is progressively filled, its relative accommodation capacity decreases, local surface gradients change, and part of the subsequent flow is diverted toward adjacent topographic lows. As a result, the zones of maximum accumulation shift laterally, and compensational stacking of elementary lobes is formed. Thus, the compensational character of the architecture is not only a geometric result of modeling but also a consequence of the morphodynamic feedback implemented in the algorithm between sediment accumulation and subsequent sediment transport.
The simulated compensational stacking of lobes explains why zones of increased sandiness, areas of reduced thickness, and fine-grained drapes may occur within the same stratigraphic interval. Repeated stacking of depositional events within a stable axial zone promotes the formation of thicker and potentially more connected sandy bodies. In contrast, lateral shifting of subsequent lobes increases the likelihood that sandy intervals are separated by silty–clayey interbeds, resulting in a more internally compartmentalized reservoir. Therefore, reservoir connectivity is controlled not only by the total volume of sandy material but also by the spatial stability of sediment-transport pathways and the stacking pattern of successive depositional events.
Fractional differentiation also controls the internal heterogeneity of the modeled system. As the transport capacity of the flow decreases, coarser sandy fractions accumulate predominantly in the axial and proximal-to-medial parts of the lobes, whereas the silty–clayey component remains in suspension over longer transport distances and forms extensive distal drapes. Therefore, the patchy distribution of increased NTG values is related not only to distance from the sediment source but also to the recurrence of transport pathways, local paleorelief features, and the stacking of individual lobes. This explains why, even within the general area of submarine-fan development, reservoir intervals may differ in thickness, connectivity, and degree of internal compartmentalization.
Model calibration is a key element in evaluating the applicability of the proposed algorithm to a real geological object. The obtained values of the target metrics indicate that the model reproduces the main spatial trend of thickness and NTG variation, although it does not completely eliminate local discrepancies between modeled and observed values. This is an expected result for forward stratigraphic modeling, because actual well-derived values reflect local depositional conditions and post-depositional modifications, whereas the model describes the process-based architecture at the scale of the computational grid.
Despite the geological consistency of the obtained results, the model should not be regarded as a single deterministic reconstruction of the sedimentary system. Rather, it represents one geologically plausible, calibrated, process-based scenario of system development within the adopted boundary conditions. Therefore, several sources of uncertainty should be considered when interpreting the modeling results.
The first group of uncertainties is related to the reconstruction of the initial paleosurface. Since the modeled flows are highly sensitive to local relief gradients, even relatively small errors in paleosurface reconstruction may affect the position of transport pathways, depocenters, and lobe boundaries. This uncertainty is especially important in the transition zone from the slope to the deep-water basin floor, where the direction of gravity flows may change in response to minor topographic variations.
The second group of uncertainties is associated with the parameters of the sediment source. These include the position of the sediment entry area, the volume of supplied sediment, the duration and frequency of individual events, water discharge, flow velocity, sediment concentration, and grain-size composition. Different combinations of these parameters may lead to similar final distributions of thickness or sandiness, reflecting the non-uniqueness of solutions in forward stratigraphic modeling. Therefore, model calibration should be considered a way to constrain the range of geologically admissible scenarios rather than a means of obtaining a single exact solution.
The third source of uncertainty is related to the parameterization of sediment transport and deposition processes. The settling velocity of individual fractions, erosion intensity, bypass distance, turbulent diffusion, and sediment entrainment coefficients control the final distribution of lithotypes. These parameters are physically meaningful; however, they are often specified on the basis of analogues, data from adjacent areas, experimental studies, or empirical relationships. As a result, their values may not fully reflect the local depositional conditions of the studied interval.
An additional limitation is the resolution of the computational grid. The current model makes it possible to reproduce the first-order morphology of the fan, the main sedimentation trends, and large-scale lithological differentiation. However, smaller architectural elements, such as thin channel fills, local erosional surfaces, small lateral splays, and fine-scale heterogeneities within individual lobes, may remain below the effective resolution of the model. This limitation should be considered when using the results for detailed reservoir characterization.
Model calibration also depends on the quantity and quality of the available well and seismic data. Where well control is sparse, the agreement between modeled and observed values of thickness or net-to-gross may characterize only the general sedimentation trend. For this reason, the results should be used together with seismic attributes, lithofacies interpretation, regional geological concepts, and, where available, core and well-log data. The most reliable interpretation is achieved when independent data sources confirm the same sediment transport pathways and accumulation zones.
The proposed approach forms a link between the sedimentological concept and static reservoir modeling. The modeling results can be transformed into maps and three-dimensional trends that constrain the spatial distribution of lithofacies and net-to-gross ratio. In contrast to purely geostatistical methods, such trends are based not only on mathematical interpolation between wells but also on a physically interpretable reconstruction of sediment transport and deposition processes.
At the same time, the model does not replace traditional geological modeling; rather, it represents an additional and necessary component of the workflow. Its most appropriate application is the definition of process-based constraints for facies modeling, the testing of alternative geological scenarios, and the ranking of prospective areas according to the probability of sand-body development. In this sense, forward stratigraphic modeling should be considered an additional stage in the integrated interpretation workflow, linking seismic interpretation, well data, regional geological concepts, and three-dimensional reservoir modeling.
An important advantage of the proposed approach is the possibility of testing alternative geological hypotheses. For the same study area, scenarios can be generated with different sediment-source positions, durations of depositional events, sediment grain-size compositions, and intensities of turbidity-current transport. Comparison of these scenarios with observed data makes it possible to narrow the range of geologically admissible interpretations and thereby reduce predictive uncertainty during the early stages of exploration.
The calibrated parameters obtained in this study can be used as a reference framework for modeling new poorly studied areas of the Achimov Formation and other comparable deep-water terrigenous systems. This is particularly relevant for areas where direct well control is limited or absent, but regional seismic data and a general stratigraphic understanding of the area are available. Under such conditions, the calibrated model provides initial parameter ranges for sedimentation processes, event duration, flow characteristics, grain-size proportions, erosion intensity, and sediment accumulation rates.
6. Conclusions
In this study, an original event-based sedimentation modeling algorithm was developed and tested to reproduce the processes responsible for the formation of deep-water turbidite deposits. In contrast to standard interpolation-based approaches, the proposed algorithm describes the formation of a sedimentary body as the result of a sequence of individual depositional events, each corresponding to a single episode of gravity-flow activity. This formulation makes it possible to model not only the final distribution of lithotypes, but also the temporal history of submarine fan formation.
The practical testing of the algorithm was performed using real geological and geophysical data from the Achimov Formation. The modeling results were compared with well data on total thickness and sandiness. This made it possible not only to assess the geological consistency of the resulting model, but also to calibrate it against observed data. The obtained results show that the model reproduces the main patterns of spatial distribution of sandy and fine-grained deposits and reflects the influence of paleorelief on depocenter localization and sediment transport pathways. The model reproduces the proximal-to-distal lithological differentiation of the Achimov submarine fan: sandy fractions are mainly concentrated in the axial and medial parts of the system, whereas silty–clayey material exhibits broader lateral and distal distribution. The spatial distribution of the net-to-gross ratio reflects the position of the main sediment-transport pathways and zones of repeated stacking of elementary lobes, allowing areas with enhanced development of prospective zones to be identified.
The main result of this study is the generation of process-based maps of total thickness, sandiness, and lithological differentiation, which can subsequently be used as geological trends in the construction of three-dimensional facies and static models. The proposed approach reduces uncertainty in predicting reservoir bodies within structurally complex Achimov deposits, especially in areas with limited well control and insufficient seismic resolution.
The results obtained for the studied Achimov interval demonstrate that the proposed algorithm can provide process-based constraints for reservoir characterization under limited well control. Further application to other areas requires additional calibration to local geological and geophysical data. Thus, the proposed event-based sedimentation modeling technology represents an effective tool for integrating sedimentological concepts, seismic interpretation, and well data in the prediction of complex Achimov reservoirs.
Author Contributions
Conceptualization, D.A.G. and Y.V.N.; methodology, D.A.G. and A.M.Z.; software, D.A.G.; validation, D.A.G., Y.V.N.; formal analysis, D.A.G., Y.V.N., O.V.S. and A.M.Z.; investigation, Y.V.N. and O.V.S.; resources, O.V.S. and A.M.Z., data curation, D.A.G. and Y.V.N.; writing—original draft preparation, D.A.G., Y.V.N., O.V.S. and A.M.Z.; writing—review and editing, D.A.G., Y.V.N., O.V.S. and A.M.Z.; visualization, D.A.G. and A.M.Z.; supervision, Y.V.N.; project administration, D.A.G. and Y.V.N.; funding acquisition, D.A.G. and Y.V.N. All authors have read and agreed to the published version of the manuscript.
Funding
This research received no external funding.
Data Availability Statement
The original contributions presented in the study are included in the article; further inquiries can be directed to the corresponding author.
Conflicts of Interest
The authors declare no conflicts of interest.
References
- Olneva, T.V.; Zhukovskaya, E.A. Sedimentation Modeling in the Petrel Software Package; MAI: Moscow, Russia, 2022; 216p. (In Russian) [Google Scholar]
- Bukatov, M.V.; Peskova, D.N.; Nenasheva, M.G.; Pogrebnuk, S.A.; Timoshenko, G.M.; Solodov, D.V.; Zhukov, V.V.; Bochkov, A.S.; Volkov, G.V.; Vashkevich, A.A. Key problems of Achimov deposits development on the different scales of studying. PROneft Prof. Oil 2018, 2, 16–21. (In Russian) [Google Scholar] [CrossRef] [Scilit]
- Gribanov, D.A.; Antonchik, V.I.; Rozmaityi, D.A.; Nefedov, Y.V.; Konovalenko, A.A. Prediction of reservoir architecture in the Achimov deposits using forward stratigraphic modeling. PROneft Prof. Oil 2025, 10, 35–43. (In Russian) [Google Scholar]
- Prischepa, O.M.; Gribanov, M.A. Integrated methodological approach to assessing petroleum systems of complex geological objects in West Siberian oil and gas province. Int. J. Eng. 2026, 39, 2749–2758. [Google Scholar] [CrossRef] [Scilit]
- Zharkov, A.M.; Peskov, D.V.; Martynov, A.V. Identification of hydrocarbon accumulation zones on ancient platforms in the northern part of Eurasian lithospheric plate. Int. J. Eng. 2025, 38, 2713–2727. [Google Scholar] [CrossRef] [Scilit]
- Nezhdanov, A.A. Geology and Oil and Gas Potential of the Achimov Formation in Western Siberia; Publishing House of the Academy of Mining Sciences: Moscow, Russia, 2000; 247p. (In Russian) [Google Scholar]
- Dalrymple, R.W.; Choi, K. Morphologic and facies trends through the fluvial–marine transition in tide-dominated depositional systems: A schematic framework for environmental and sequence-stratigraphic interpretation. Earth-Sci. Rev. 2007, 3, 135–174. [Google Scholar] [CrossRef] [Scilit]
- Otoo, D.; Hodgetts, D. Applying Forward Stratigraphic Modeling Approach to Enhance Facies Characterization and Fluid Mobility Prediction in Geological Models of Basin Floor Fans; Basin Analysis and Petroleum Geoscience Group, School of Earth and Environmental Sciences, University of Manchester: Manchester, UK, 2018. [Google Scholar]
- Harris, A.D.; Covault, J.A.; Madof, A.S.; Sun, T.; Sylvester, Z.; Granjeon, D. Three-dimensional numerical modeling of eustatic control on continental-margin sand distribution. J. Sediment. Res. 2016, 86, 1434–1443. [Google Scholar] [CrossRef] [Scilit]
- Zakrevsky, K.E.; Nassonova, N.V. Geological Modeling of Neocomian Clinoforms in Western Siberia; GERS: Tver, Russia, 2012; 80p. (In Russian) [Google Scholar]
- Pszonka, J.; Schulz, B.; Sala, D. Application of mineral liberation analysis (MLA) for investigations of grain size distribution in submarine density flow deposits. Mar. Pet. Geol. 2021, 129, 105109. [Google Scholar] [CrossRef] [Scilit]
- Huang, X.; Griffiths, C.M.; Liu, J. Recent development in stratigraphic forward modelling and its application in petroleum exploration. Aust. J. Earth Sci. 2015, 62, 903–919. [Google Scholar] [CrossRef] [Scilit]
- Tetzlaff, D.M.; Harbaugh, J.W. Simulating Clastic Sedimentation; Computer Methods in the Geosciences; Van Nostrand Reinhold: New York, NY, USA, 1989; 202p. [Google Scholar]
- Burgess, P.M.; Masiero, I.; Toby, S.C.; Duller, R.A. A big fan of signals? Exploring autogenic and allogenic process and product in a numerical stratigraphic forward model of submarine-fan development. J. Sediment. Res. 2019, 89, 1–12. [Google Scholar] [CrossRef] [Scilit]
- Meiburg, E.; Kneller, B. Turbidity currents and their deposits. Annu. Rev. Fluid Mech. 2010, 42, 135–156. [Google Scholar] [CrossRef] [Scilit]
- Syngaevsky, P.E.; Khafizov, S.F. Deep-Sea Fans and Turbidites: Models, Cyclostratigraphy, and Applications of the Extended Framework; Institute of Computer Research: Moscow, Russia, 2015; 479p. (In Russian) [Google Scholar]
- Granjeon, D.; Joseph, P. Concepts and applications of a 3D multiple lithology, diffusive model in stratigraphic modeling. In Numerical Experiments in Stratigraphy: Recent Advances in Stratigraphic and Sedimentological Computer Simulations; Harbaugh, J.W., Watney, W.L., Rankey, E.C., Slingerland, R., Goldstein, R.H., Franseen, E.K., Eds.; SEPM Special Publication 62; SEPM: Tulsa, OK, USA, 1999; pp. 197–210. [Google Scholar]
- Wan, L.; Bianchi, V.; Hurter, S.; Salles, T.; Zhang, Z.; Yuan, X. Morphological controls on delta-canyon-fan systems: Insights from stratigraphic forward models. Sedimentology 2022, 69, 864–890. [Google Scholar] [CrossRef] [Scilit]
- Blanchette, F.; Strauss, M.; Meiburg, E.; Kneller, B.; Glinsky, M.E. High-resolution numerical simulations of resuspending gravity currents: Conditions for self-sustainment. J. Geophys. Res. 2005, 110, C12022. [Google Scholar]
- Prischepa, O.M.; Sinitsa, N.V. Prospects for oil and gas bearing potential of Paleozoic basement of West Siberian sedimentary basin. Int. J. Eng. Trans. B Appl. 2025, 38, 1098–1107. [Google Scholar] [CrossRef] [Scilit]
- Normandeau, A.; Lajeunesse, P.; Ghienne, J.-F.; Dietrich, P. Detailed Seafloor Imagery of Turbidity Current Bedforms Reveals New Insight Into Fine-Scale Near-Bed Processes. Geophys. Res. Lett. 2022, 49, e2021GL097389. [Google Scholar] [CrossRef] [Scilit]
- Wahab, A.; Hoyal, D.C.; Shringarpure, M.; Straub, K.M. A Dimensionless Framework for Predicting Submarine Fan Morphology. Nat. Commun. 2022, 13, 7563. [Google Scholar] [CrossRef] [Scilit] [PubMed]
- Dhote, P.; Bhan, U. Advances in simulation of stratigraphic-structural evolution of basin fill: A retrospective to guide future progress. Int. J. Geophys. 2025, 2025, 2790962. [Google Scholar] [CrossRef] [Scilit]
- Strobel, J.; Cannon, R.; Kendall, C.G.S.C.; Biswas, G.; Bezdek, J. Interactive (SEDPAK) simulation of clastic and carbonate sediments in shelf-to-basin settings. Comput. Geosci. 1989, 15, 1279–1290. [Google Scholar]
- Liu, K.Y.; Liang, T.C.K.; Paterson, L.; Kendall, C.G.S.C. Computer simulation of the influence of basin physiography on condensed section deposition and maximum flooding. Sediment. Geol. 1998, 122, 181–191. [Google Scholar] [CrossRef] [Scilit]
- Hutton, E.W.H.; Syvitski, J.P.M. Sedflux 2.0: An advanced process-response model that generates three-dimensional stratigraphy. Comput. Geosci. 2008, 34, 1319–1337. [Google Scholar] [CrossRef] [Scilit]
- Gratacós, O.; Bitzer, K.; Cabrera, L.; Roca, E. SIMSAFADIM-CLASTIC: A new approach to 3D forward mathematical simulation for clastic and carbonate sedimentation. Geol. Acta 2009, 7, 311–322. [Google Scholar] [CrossRef] [Scilit]
- Quiquerez, A.; Allemand, P.; Dromart, G. DIBAFILL: A 3-D two-lithology diffusive model for basin infilling. Comput. Geosci. 2000, 26, 1029–1042. [Google Scholar] [CrossRef] [Scilit]
- Gvirtzman, Z.; Csato, I.; Granjeon, D. Constraining sediment transport to deep marine basins through submarine channels: The Levant margin in the Late Cenozoic. Mar. Geol. 2014, 347, 12–26. [Google Scholar] [CrossRef] [Scilit]
- Groenenberg, R.M. Process-Based Modelling of Turbidity-Current Hydrodynamics and Sedimentation. Ph.D. Thesis, Delft University of Technology, Delft, The Netherlands, 2007. [Google Scholar]
- Harlow, F.H.; Welch, J.E. Numerical calculation of time-dependent viscous incompressible flow of fluid with free surface. Phys. Fluids 1965, 8, 2182–2189. [Google Scholar] [CrossRef] [Scilit]
- Kneller, B.; Buckee, C. The structure and fluid mechanics of turbidity currents: A review of some recent studies and their geological implications. Sedimentology 2000, 47, 62–94. [Google Scholar] [CrossRef] [Scilit]
- Ferguson, R.I.; Church, M. A simple universal equation for grain settling velocity. J. Sediment. Res. 2004, 74, 933–937. [Google Scholar] [CrossRef] [Scilit]
- Richardson, J.F.; Zaki, W.N. Sedimentation and fluidisation: Part I. Trans. Inst. Chem. Eng. 1954, 32, 35–53. [Google Scholar]
- Garcia, M.; Parker, G. Entrainment of bed sediment into suspension. J. Hydraul. Eng. 1991, 117, 414–435. [Google Scholar] [CrossRef] [Scilit]
- Garcia, M.; Parker, G. Experiments on the entrainment of sediment into suspension by a dense bottom current. J. Geophys. Res. 1993, 98, 4793–4807. [Google Scholar] [CrossRef] [Scilit]
- Rouse, H. Modern conceptions of the mechanics of fluid turbulence. Trans. Am. Soc. Civ. Eng. 1937, 102, 463–543. [Google Scholar] [CrossRef] [Scilit]
- Kirkpatrick, S.; Gelatt, C.D., Jr.; Vecchi, M.P. Optimization by simulated annealing. Science 1983, 220, 671–680. [Google Scholar] [CrossRef] [Scilit] [PubMed]
- Metropolis, N.; Rosenbluth, A.W.; Rosenbluth, M.N.; Teller, A.H.; Teller, E. Equation of state calculations by fast computing machines. J. Chem. Phys. 1953, 21, 1087–1092. [Google Scholar] [CrossRef] [Scilit]
- Tetzlaff, D.; Tveiten, J.; Salomonsen, P.; Christ, A.; Athmer, W.; Borgos, H.G.; Sonneland, L.; Martinez, C.; Raggio, M.F. Geologic process modeling. In Proceedings of the IX Conference of Hydrocarbon Exploration and Development, Mendoza, Argentina, 3–7 November 2014; Available online: https://www.researchgate.net/publication/320183844_GEOLOGIC_PROCESS_MODELING (accessed on 16 May 2026).
- Ulmishek, G.F. Petroleum Geology and Resources of the West Siberian Basin, Russia; U.S. Geological Survey Bulletin 2201-G; U.S. Geological Survey: Reston, VA, USA, 2003; 49p. [CrossRef] [Scilit]
- Nefedov, Y.; Gribanov, D.; Gasimov, E.; Peskov, D.; Han, G.; Vostrikov, N.; Pashayeva, S. Development of Achimov deposits sedimentation model of one of the West Siberian oil and gas province fields. Reliab. Theory Appl. 2023, 18, 441–448. [Google Scholar]
- Olneva, T.V.; Ovechkina, V.Y.; Zhukovskaia, E.A. Computer modeling of terrigenous sedimentation as a new tool for prediction of hydrocarbon reservoir architecture. PROneft Prof. Oil 2020, 2, 12–17. (In Russian) [Google Scholar] [CrossRef] [Scilit]
- Kontorovich, V.A. Tectonics and Oil and Gas Potential of Mesozoic–Cenozoic Deposits in the Southeastern Regions of Western Siberia; GEO: Novosibirsk, Russia, 2002; 253p. (In Russian) [Google Scholar]
- Bochkarev, V.S.; Brekhuntsov, A.M.; Lukomskaya, K.G. Folded basement of the Yamal Peninsula. Gorn. Vedom. 2010, 8, 6–35. (In Russian) [Google Scholar]
- Dzyuba, O.S.; Mogucheva, N.K.; Salyanik, V.V. Resolution of the 6th Interdepartmental Stratigraphic Meeting on the Review and Adoption of Revised Stratigraphic Schemes of Mesozoic Deposits of Western Siberia, Novosibirsk, 2003; SNIIGGiMS: Novosibirsk, Russia, 2004. (In Russian) [Google Scholar]
- Brekhuntsov, A.M.; Taninskaya, N.V.; Shimansky, V.V.; Khafizov, S.F. Lithofacies criteria for forecasting reservoirs of the Achimov deposits of the East Urengoy zone. Pet. Geol. 2003, 4, 2–10. (In Russian) [Google Scholar]
- Gervais, V.; Ducros, M.; Granjeon, D. Probability maps of reservoir presence and sensitivity analysis in stratigraphic forward modeling. AAPG Bull. 2018, 102, 613–628. [Google Scholar] [CrossRef] [Scilit]
- Waltham, D.; Jaffey, N.; MacLean, S.; Zampetti, V. Stratigraphic modelling of turbidite prospects to reduce exploration risk. Pet. Geosci. 2008, 14, 273–280. [Google Scholar] [CrossRef] [Scilit]
- Bouma, A.H. Sedimentology of Some Flysch Deposits: A Graphic Approach to Facies Interpretation; Elsevier: Amsterdam, The Netherlands, 1962; 168p. [Google Scholar]
- Salles, T.; Lopez, S.; Eschard, R.; Lerat, O.; Mulder, T.; Cacas, M.C. Turbidity current modelling on geological time scales. Mar. Geol. 2008, 248, 127–150. [Google Scholar] [CrossRef] [Scilit]
- Ross, W.C.; Watts, D.E.; May, J.A. Insights from stratigraphic modeling: Mud-limited versus sand-limited depositional systems. AAPG Bull. 1995, 79, 231–258. [Google Scholar]
- Huang, X.; Dyt, C.; Griffiths, C.; Salles, T. Numerical forward modelling of ‘fluxoturbidite’ flume experiments using Sedsim. Mar. Pet. Geol. 2012, 35, 190–200. [Google Scholar] [CrossRef] [Scilit]
- Soutter, E.L.; Bell, D.; Cumberpatch, Z.A.; Ferguson, R.A.; Spychala, Y.T.; Kane, I.A.; Eggenhuisen, J.T. The Influence of Confining Topography Orientation on Experimental Turbidity Currents and Geological Implications. Front. Earth Sci. 2021, 8, 540633. [Google Scholar] [CrossRef] [Scilit]
- Chen, M.; Wu, S.-H.; Wang, R.-F.; Zhang, J.-J.; Xie, P.-F.; Wang, M.; Wang, X.-F.; Yu, J.-T.; Xiong, Q.-C. Sedimentary Architecture of Submarine Channel-Lobe Systems under Different Seafloor Topography: Insights from the Rovuma Basin Offshore East Africa. Pet. Sci. 2024, 21, 125–142. [Google Scholar] [CrossRef] [Scilit]
- Rivenæs, J.C. Impact of sediment transport efficiency on large-scale sequence architecture: Results from stratigraphic computer simulation. Basin Res. 1997, 9, 91–105. [Google Scholar] [CrossRef] [Scilit]
- Swift, D.J.P.; Oertel, G.F.; Tillman, R.W.; Thorne, J.A. (Eds.) Shelf Sand and Sandstone Bodies: Geometry, Facies and Sequence Stratigraphy; Wiley: Hoboken, NJ, USA, 2009. [Google Scholar]
- Salles, T.; Marchès, E.; Dyt, C.; Griffiths, C.; Hanquiez, V.; Mulder, T. Simulation of the interactions between gravity processes and contour currents on the Algarve margin (South Portugal) using the stratigraphic forward model Sedsim. Sediment. Geol. 2010, 229, 95–109. [Google Scholar] [CrossRef] [Scilit]
- Spychala, Y.T.; Eggenhuisen, J.T.; Tilston, M.; Pohl, F. The Influence of Basin Setting and Turbidity Current Properties on the Dimensions of Submarine Lobe Elements. Sedimentology 2020, 67, 3471–3491. [Google Scholar] [CrossRef] [Scilit]
Disclaimer/Publisher’s Note: The statements, opinions and data contained in all publications are solely those of the individual author(s) and contributor(s) and not of MDPI and/or the editor(s). MDPI and/or the editor(s) disclaim responsibility for any injury to people or property resulting from any ideas, methods, instructions or products referred to in the content. |
© 2026 by the authors. Licensee MDPI, Basel, Switzerland. This article is an open access article distributed under the terms and conditions of the Creative Commons Attribution (CC BY) license.