


Abstract
Polyurethane cement (PUC) is a high-performance composite that combines the high toughness of polymers with the durability of cementitious materials, showing potential in the field of structural strengthening. However, when used alone, its crack confinement capability is limited. To investigate the strengthening effect of wire mesh–polyurethane cement (WM-PUC) composite on the shear performance of damaged reinforced concrete (RC) beams, static loading tests were conducted on four RC beams. All strengthened beams were preloaded to induce initial damage and subsequently retrofitted on the sides using the two composite materials. Their shear performance was evaluated through single-point monotonic loading. The failure modes, load–displacement curves, shear capacity, and crack development patterns of the strengthened beams were analyzed in detail. The experimental results indicated that after strengthening with PUC and WM-PUC, the shear capacity of the damaged beams was effectively enhanced. The ultimate loads of the damaged beams strengthened with PUC and WM-PUC were 360 kN and 390 kN, respectively, representing increases of 12.5% and 21.88% compared to the unstrengthened beam. Compared to the PUC-strengthened beam, the ultimate load of the WM-PUC-strengthened beam increased by 8.3%, indicating that the incorporation of wire mesh further enhanced the strengthening effectiveness of the polyurethane cement composite. In terms of crack control, WM-PUC strengthening was more effective than PUC strengthening in restraining the initiation and propagation of diagonal cracks. The findings demonstrate that WM-PUC composite exhibits favorable applicability for the shear strengthening of damaged RC beams, with overall performance superior to that of PUC-only strengthening, thereby providing a technical reference for high-performance shear strengthening of existing concrete structures.
1. Introduction
In the inspection and evaluation of existing concrete bridge structures, it has been observed that the shear capacity of many structures has significantly decreased, and the load-bearing capacity of the structures is insufficient to meet practical demands, leading to frequent cracking of concrete [1]. To maintain adequate shear performance, existing structures require strengthening to comply with current structural codes [2]. If a simple and effective method can be used for structural strengthening rather than reconstruction, it would be a more favorable option both economically and environmentally.
To systematically evaluate the applicability and limitations of existing strengthening techniques for reinforced concrete (RC) beams and to clarify the technical positioning of this study, Table 1 summarized the representative literature and key performance indicators of seven mainstream strengthening methods.
Table 1.
Summary of Strengthening Methods.
Over the past few decades, the most common methods for strengthening bridges have involved the use of fiber-reinforced polymer (FRP) [3,4,5,6,7,8,9,10,11,12,13,14,15,16,17]. Although this strengthening approach offers advantages such as light weight, high strength, and corrosion resistance, it is prone to interfacial debonding failure, and its adaptability to pre-damaged beams requires further validation. Moreover, most of the materials used in such strengthening techniques rely on some type of adhesive. In the case of FRP strengthening, the performance of the adhesive deteriorates over time and under exposure to environmental conditions, leading to a reduction in strengthening effectiveness. Additionally, these strengthening materials are often combustible, resulting in poor fire resistance of the structure and introducing additional instability factors.
Steel plate strengthening [18,19,20,21,22] is a mature technique that significantly improves structural stiffness; however, it suffers from issues such as self-weight, susceptibility to corrosion, and stress lag. The section enlargement method [23,24,25] achieves the most pronounced enhancement in beam load-bearing capacity but increases structural self-weight and reduces clearance, imposing significant limitations on existing structures. Engineered cementitious composite/ultra-high toughness cementitious composite (ECC/UHTCC) strengthening [26,27,28,29] offers excellent crack control capability and high ductility, yet its high material cost limits large-scale application. Prestressed strengthening [30,31,32,33] can actively restore structural deformation but involves complex construction, high equipment requirements, and prestress loss.
Polyurethane cement (PUC), as a novel polymer-modified material [34,35,36], combines high toughness with good bonding performance and exhibits favorable compatibility with concrete. However, when used alone, the crack confinement capability of PUC is limited, and the growth of crack width lacks controllability under higher load levels. Researchers [37] introduced wire mesh into PUC to form a WM-PUC composite and validated its effectiveness in the flexural strengthening of intact beams. The study demonstrated that the incorporation of wire mesh significantly enhanced the overall mechanical performance of the composite strengthening layer.
Analysis of the above strengthening methods reveals that several critical gaps remain in existing research: (1) Most studies have focused on the strengthening of intact beams, whereas systematic investigations on pre-damaged beams (i.e., structures that have already sustained service loads and developed initial cracks) are severely lacking; (2) Research on the application of WM-PUC in shear strengthening is almost nonexistent, despite shear failure being one of the most common brittle failure modes of RC beams; (3) The differences in crack control mechanisms between PUC and WM-PUC have not yet been elucidated.
To address these gaps, this study employed PUC composites and WM-PUC composites to strengthen damaged RC beams in shear. A total of four test beams—including a reference beam, a control beam for determining residual load-bearing capacity, and two beams strengthened using the two respective methods—were designed and subjected to static loading tests. The failure modes, shear capacity, and deformation behavior of the damaged beams under different strengthening methods were systematically analyzed. The findings aim to clarify the applicability and strengthening effects of PUC and WM-PUC composites in the shear strengthening of damaged beams, thereby providing a theoretical basis and technical support for high-performance shear strengthening of existing reinforced concrete structures.
2. Materials and Experimental Program
2.1. Materials
2.1.1. Concrete
In this experiment, concrete with a design strength grade of C30 was prepared. Ordinary Portland cement was used as the binder, crushed limestone as the coarse aggregate, river sand as the fine aggregate, and municipal tap water as the mixing water. The final mix proportion by weight was cement: sand: gravel: water = 1:2.1:3.4:0.55. Cube specimens with dimensions of 150 mm × 150 mm × 150 mm were prepared. The measured compressive strength of the concrete was 31.5 MPa, and the elastic modulus of the concrete was determined in accordance with the relevant code [38].
2.1.2. Steel Reinforcement
A total of five types of steel reinforcement were used in the test beams. The longitudinal reinforcement consisted of deformed steel bars with diameters of 10 mm, 20 mm, 22 mm, and 25 mm, while plain round steel bars with a diameter of 8 mm were used as stirrups. According to the test specifications in the relevant code [39], the yield strength of the stirrups was 335 MPa and the ultimate tensile strength was 510 MPa. For the longitudinal reinforcement, the yield strength was 400 MPa and the ultimate tensile strength was 600 MPa. The elastic modulus of all reinforcement was 200 GPa, and Poisson’s ratio was 0.3.
2.1.3. Wire Mesh
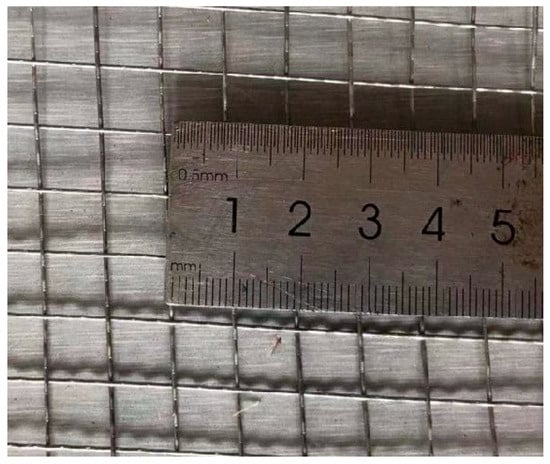
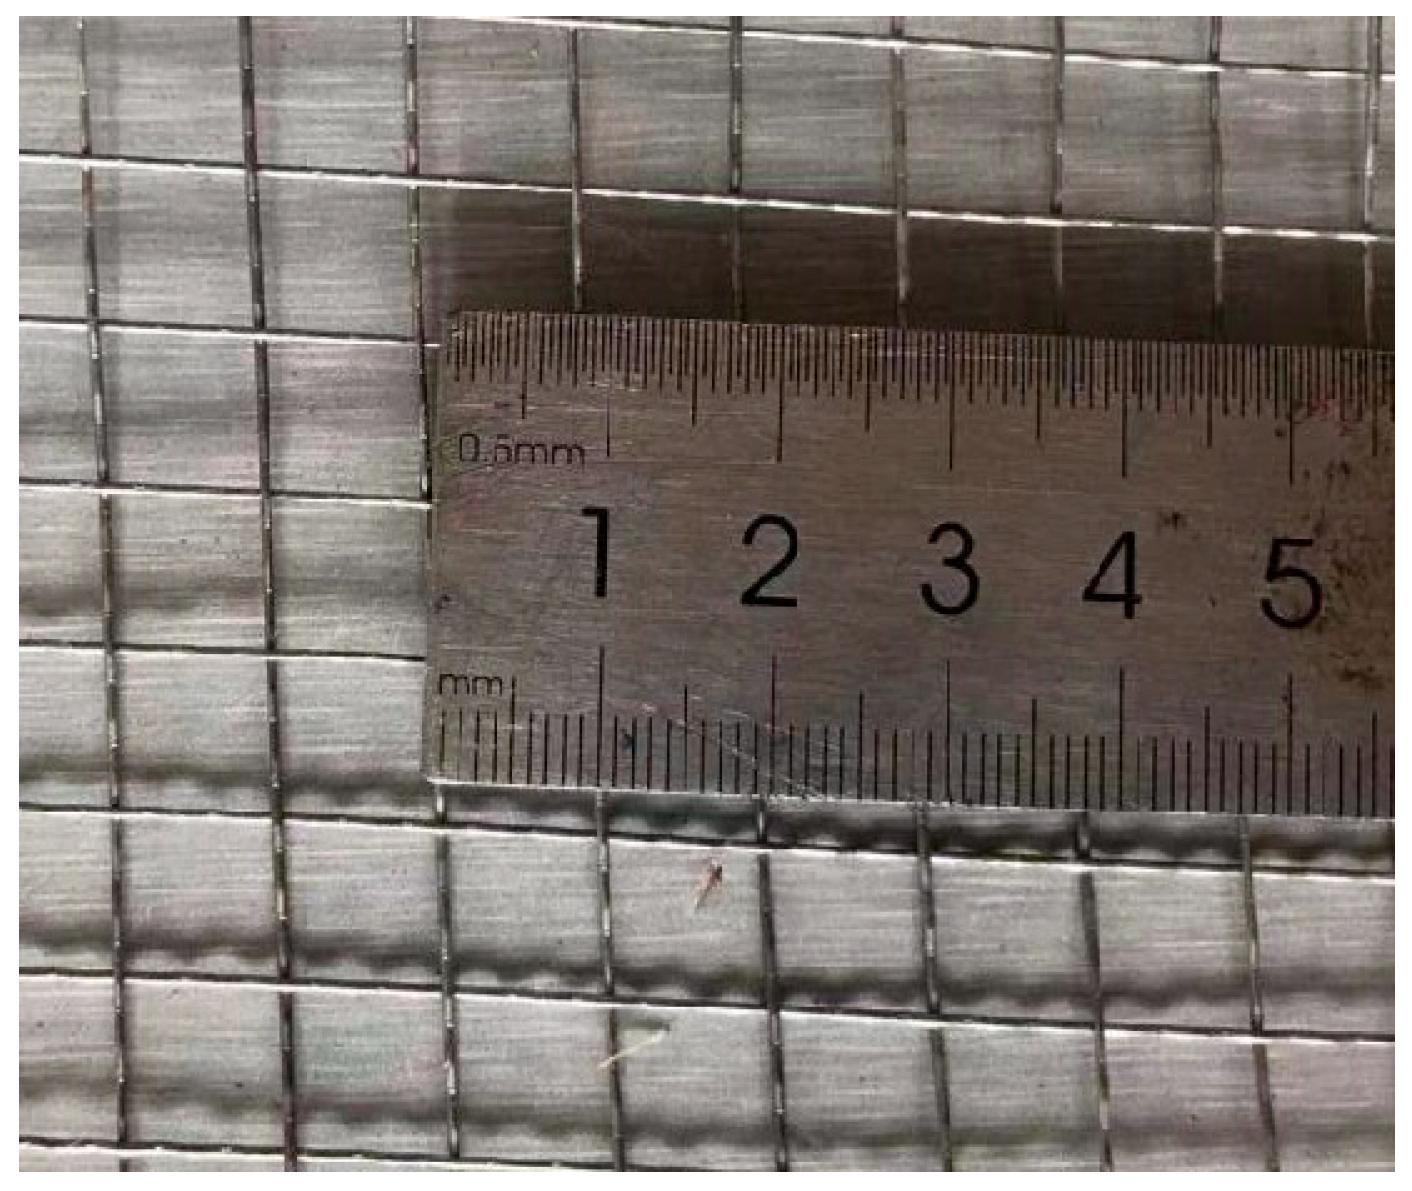
A square-opening wire mesh was used in this study. The wire diameter was 1.2 mm, and the spacing between adjacent wires was 9.5 mm. The mechanical properties of the wire mesh were determined in accordance with the standard [40] and are presented in Table 2. The specific configuration and dimensions of the wire mesh are shown in Figure 1.
Table 2.
Performance Parameters of Wire Mesh.
Figure 1.
Shape and Dimensions of Wire Mesh.
2.1.4. Polyurethane Cement Composite
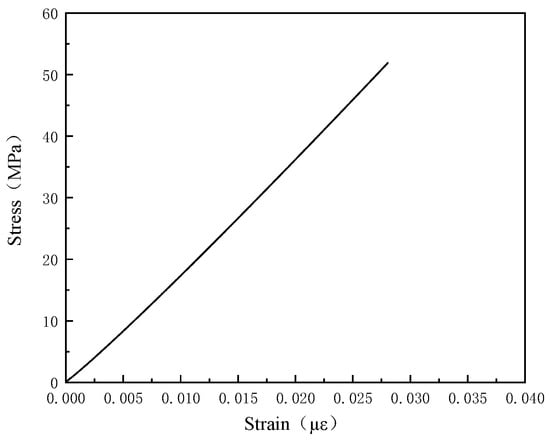
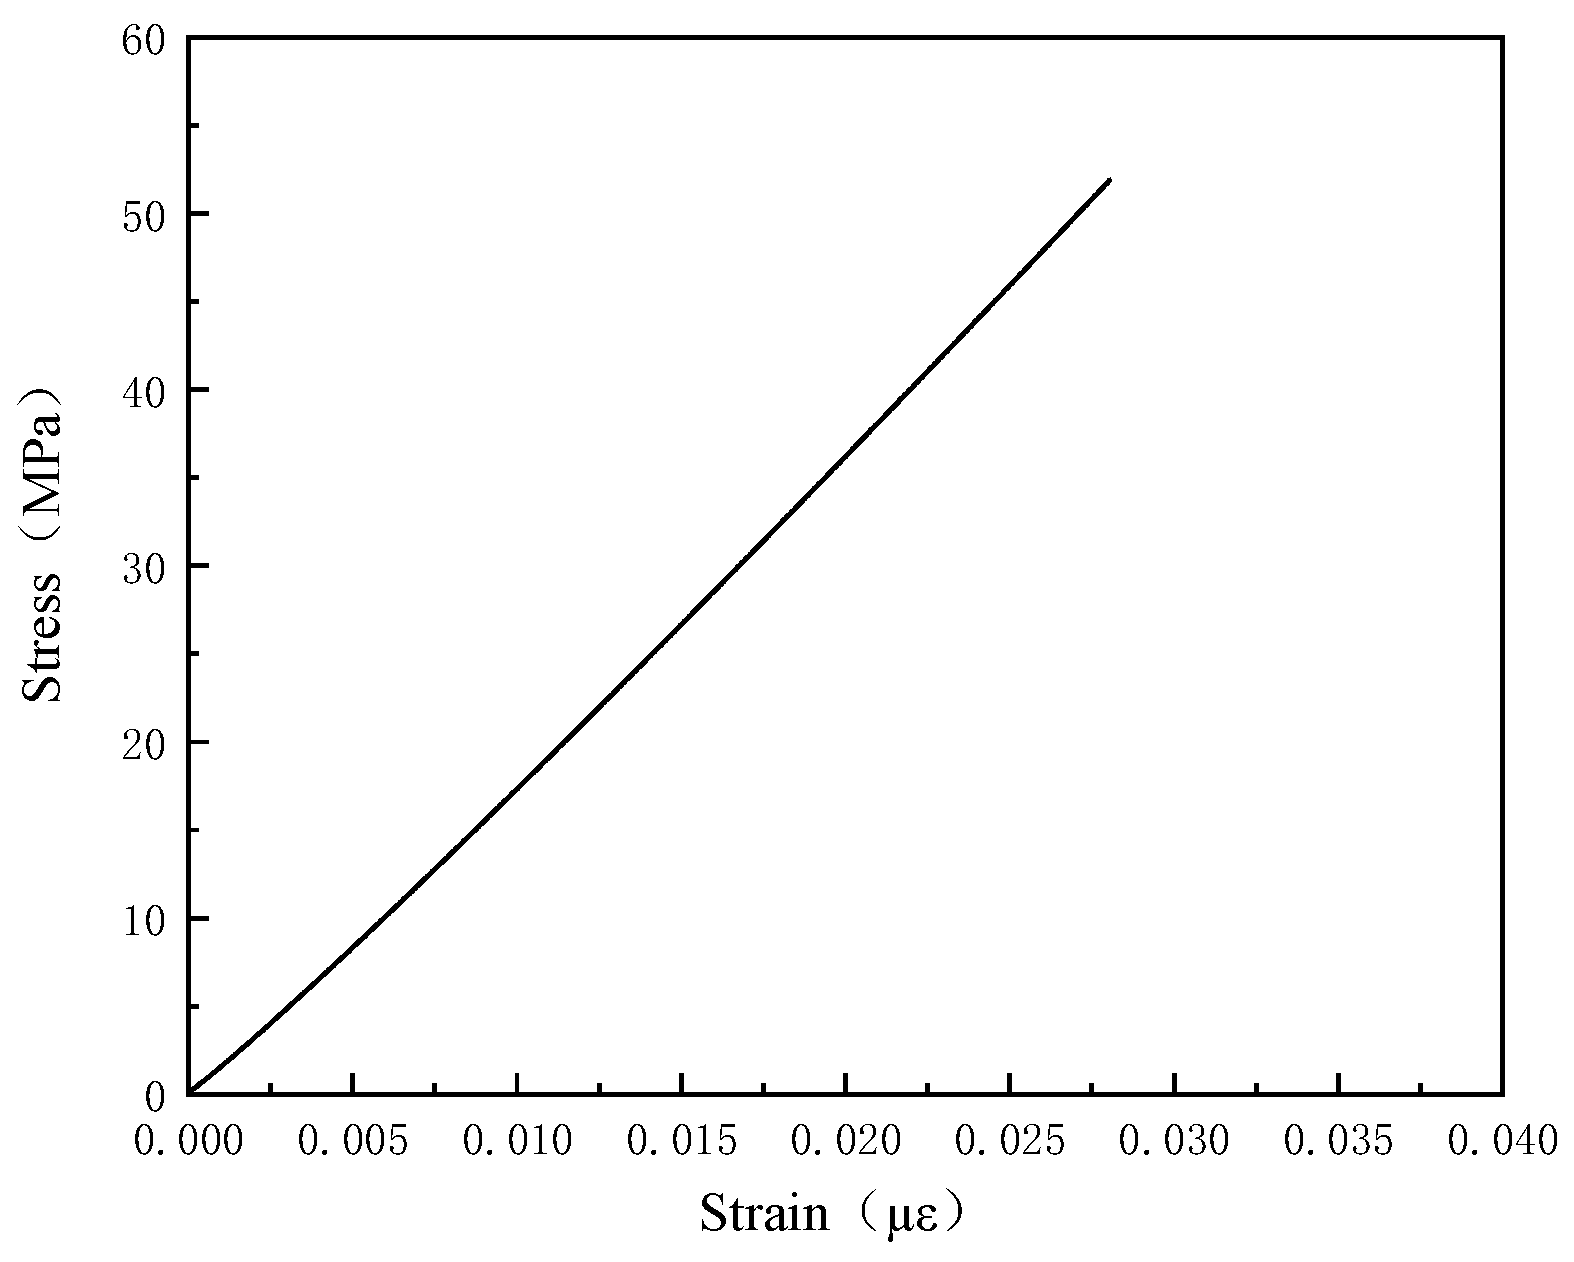
The mix proportion of the PUC composite was polyol:isocyanate:cement = 1.25:1:2 by weight, and the density of the PUC composite was 1550 kg/m3. The tensile and compressive properties of the PUC material are presented in Table 3. According to the standard JTG 3420-2020 [41], the compressive strain-stress curve of the PUC composite obtained from testing is shown in Figure 2. The flexural modulus of elasticity of the PUC composite was calculated based on the stress–strain relationship under a load corresponding to two-thirds of the ultimate strength of the material [42].
Table 3.
Mechanical Properties of PUC Composite Materials.
Figure 2.
Compressive stress–strain curve of PUC.
2.2. Experimental Design
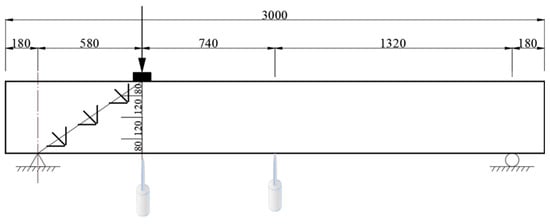
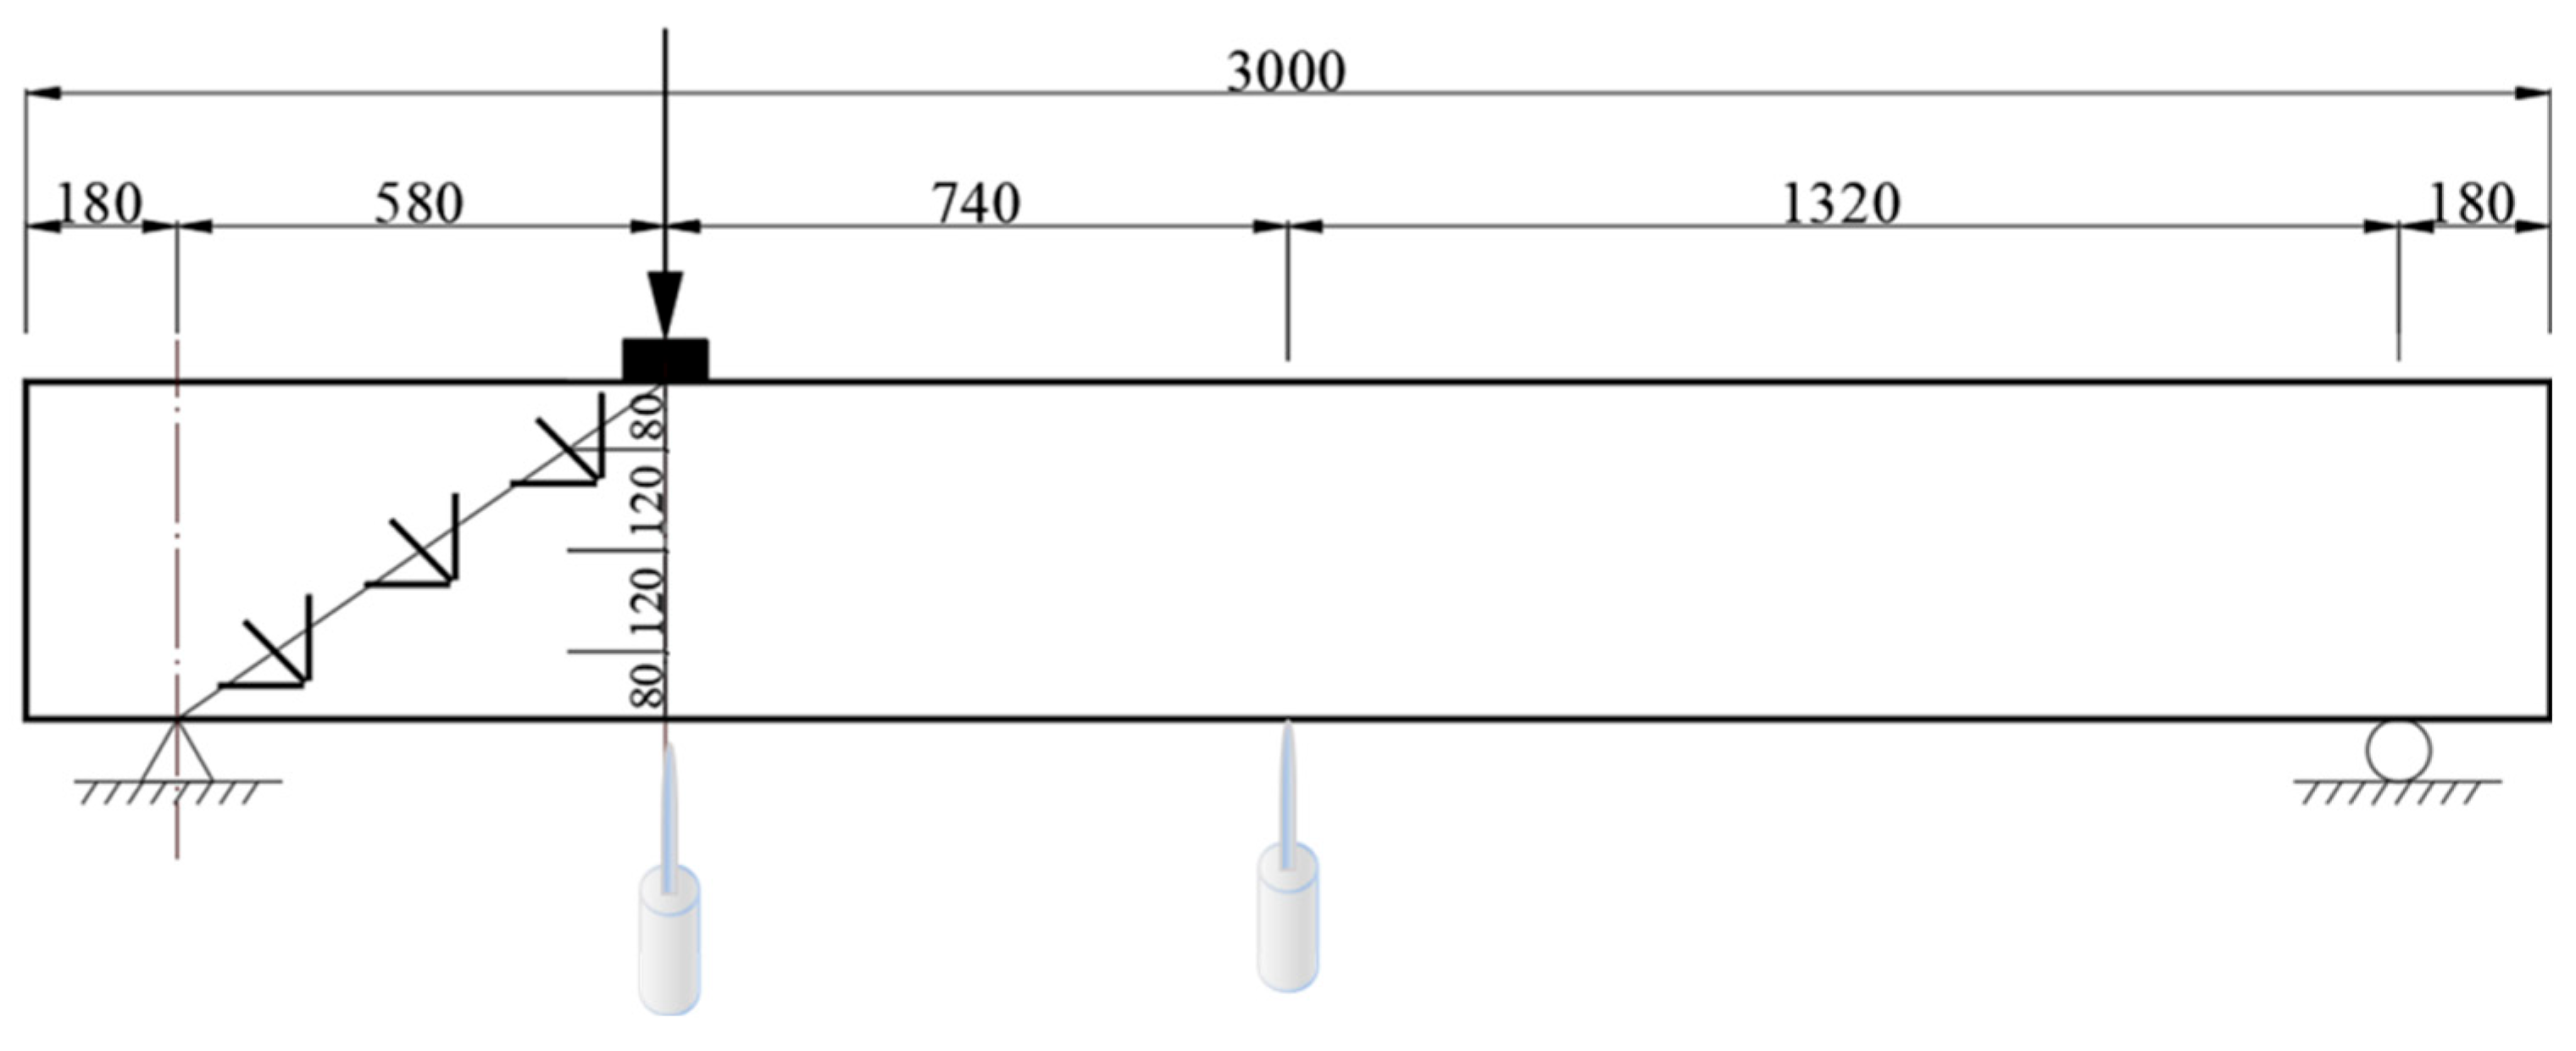
A total of four reinforced concrete beams were tested in this study. All test beams had uniform dimensions, with a total length of 3000 mm, a calculated span of 2640 mm, a shear span length of 580 mm, and a cross-sectional dimension of b × h = 200 mm × 400 mm.
The beam designations and experimental details are presented in Table 4. Among them, beam CB served as the reference beam for comparative analysis, beam A1 was used as the control beam to determine the residual load-carrying capacity, and the remaining two beams were test beams for shear strengthening experiments.
Table 4.
Overview of Test Beams.
2.2.1. Longitudinal and Cross-Sectional Details of Test Beams
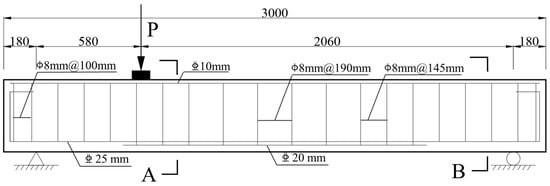
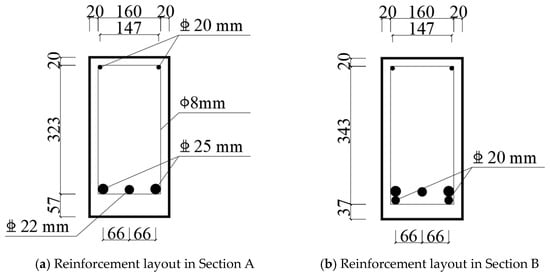
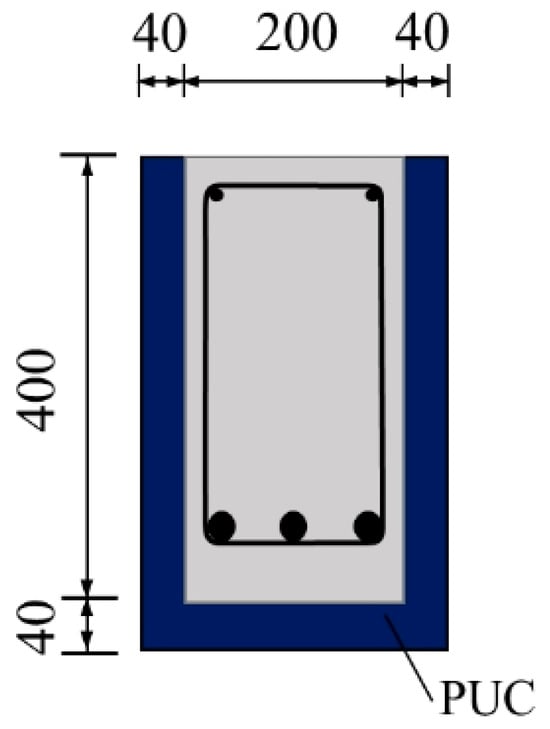
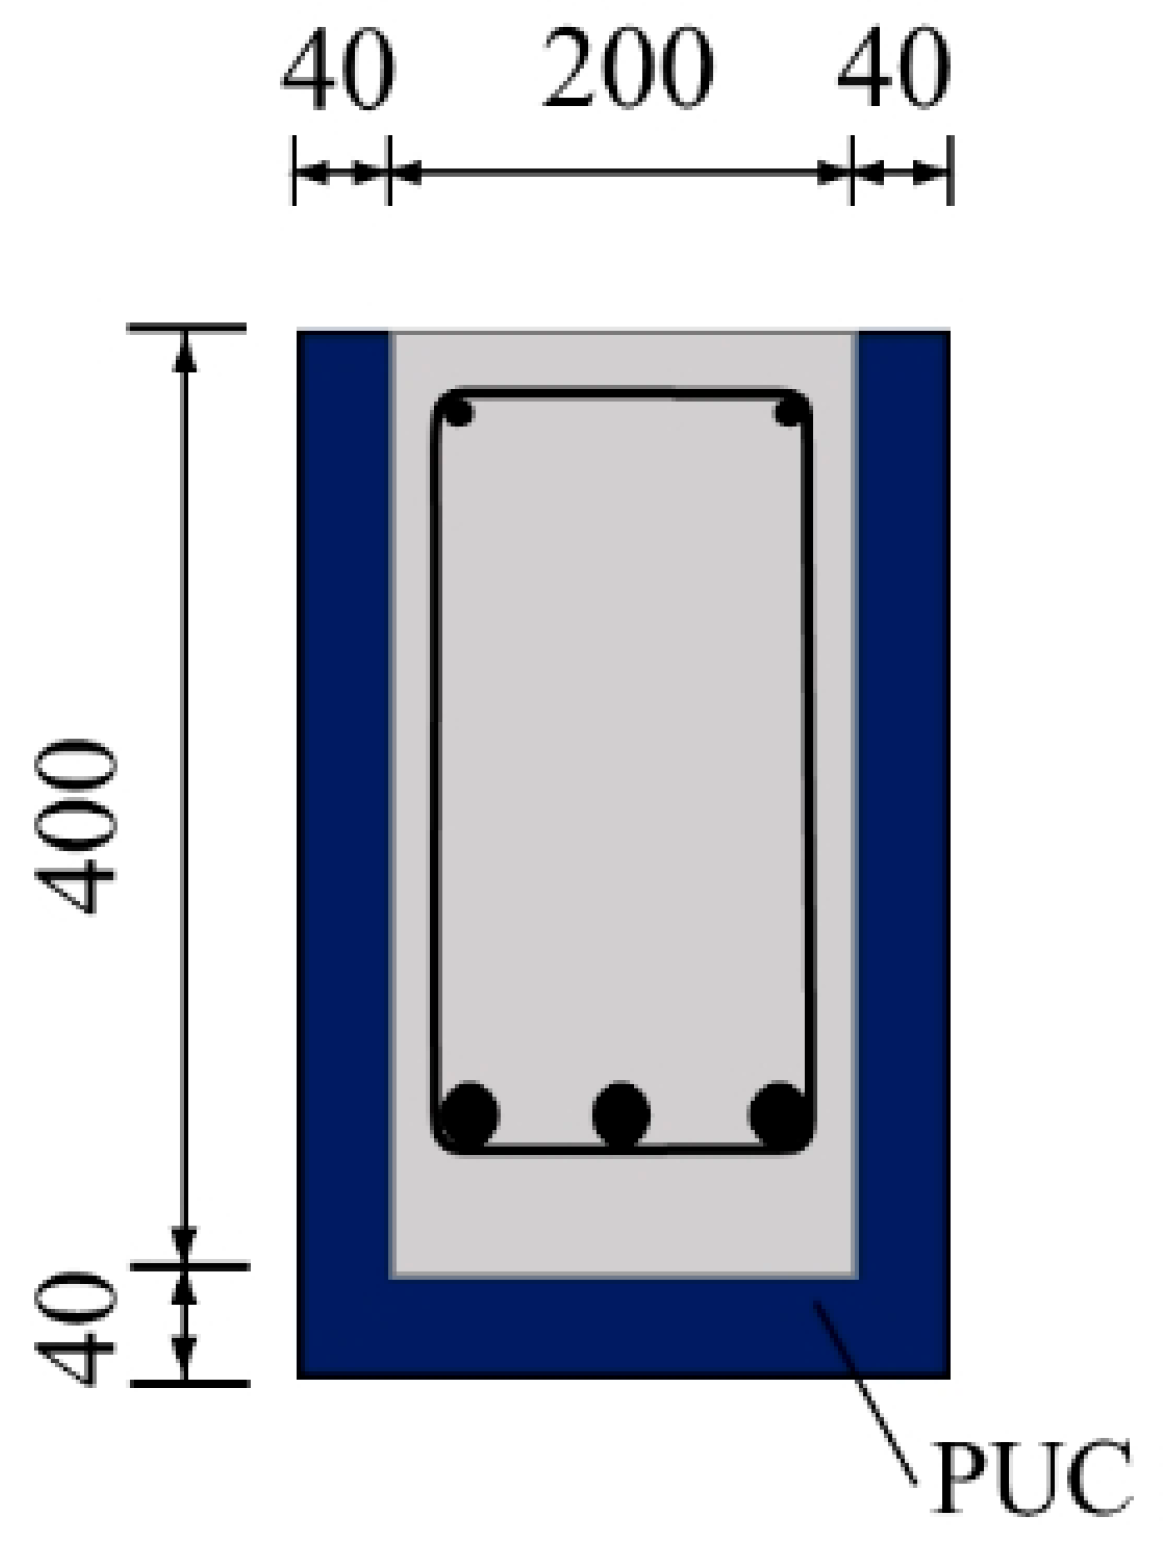
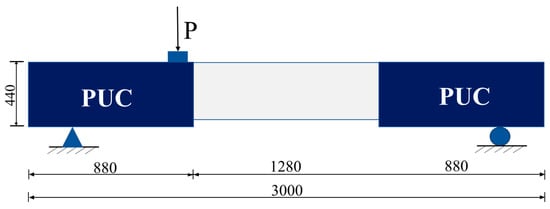
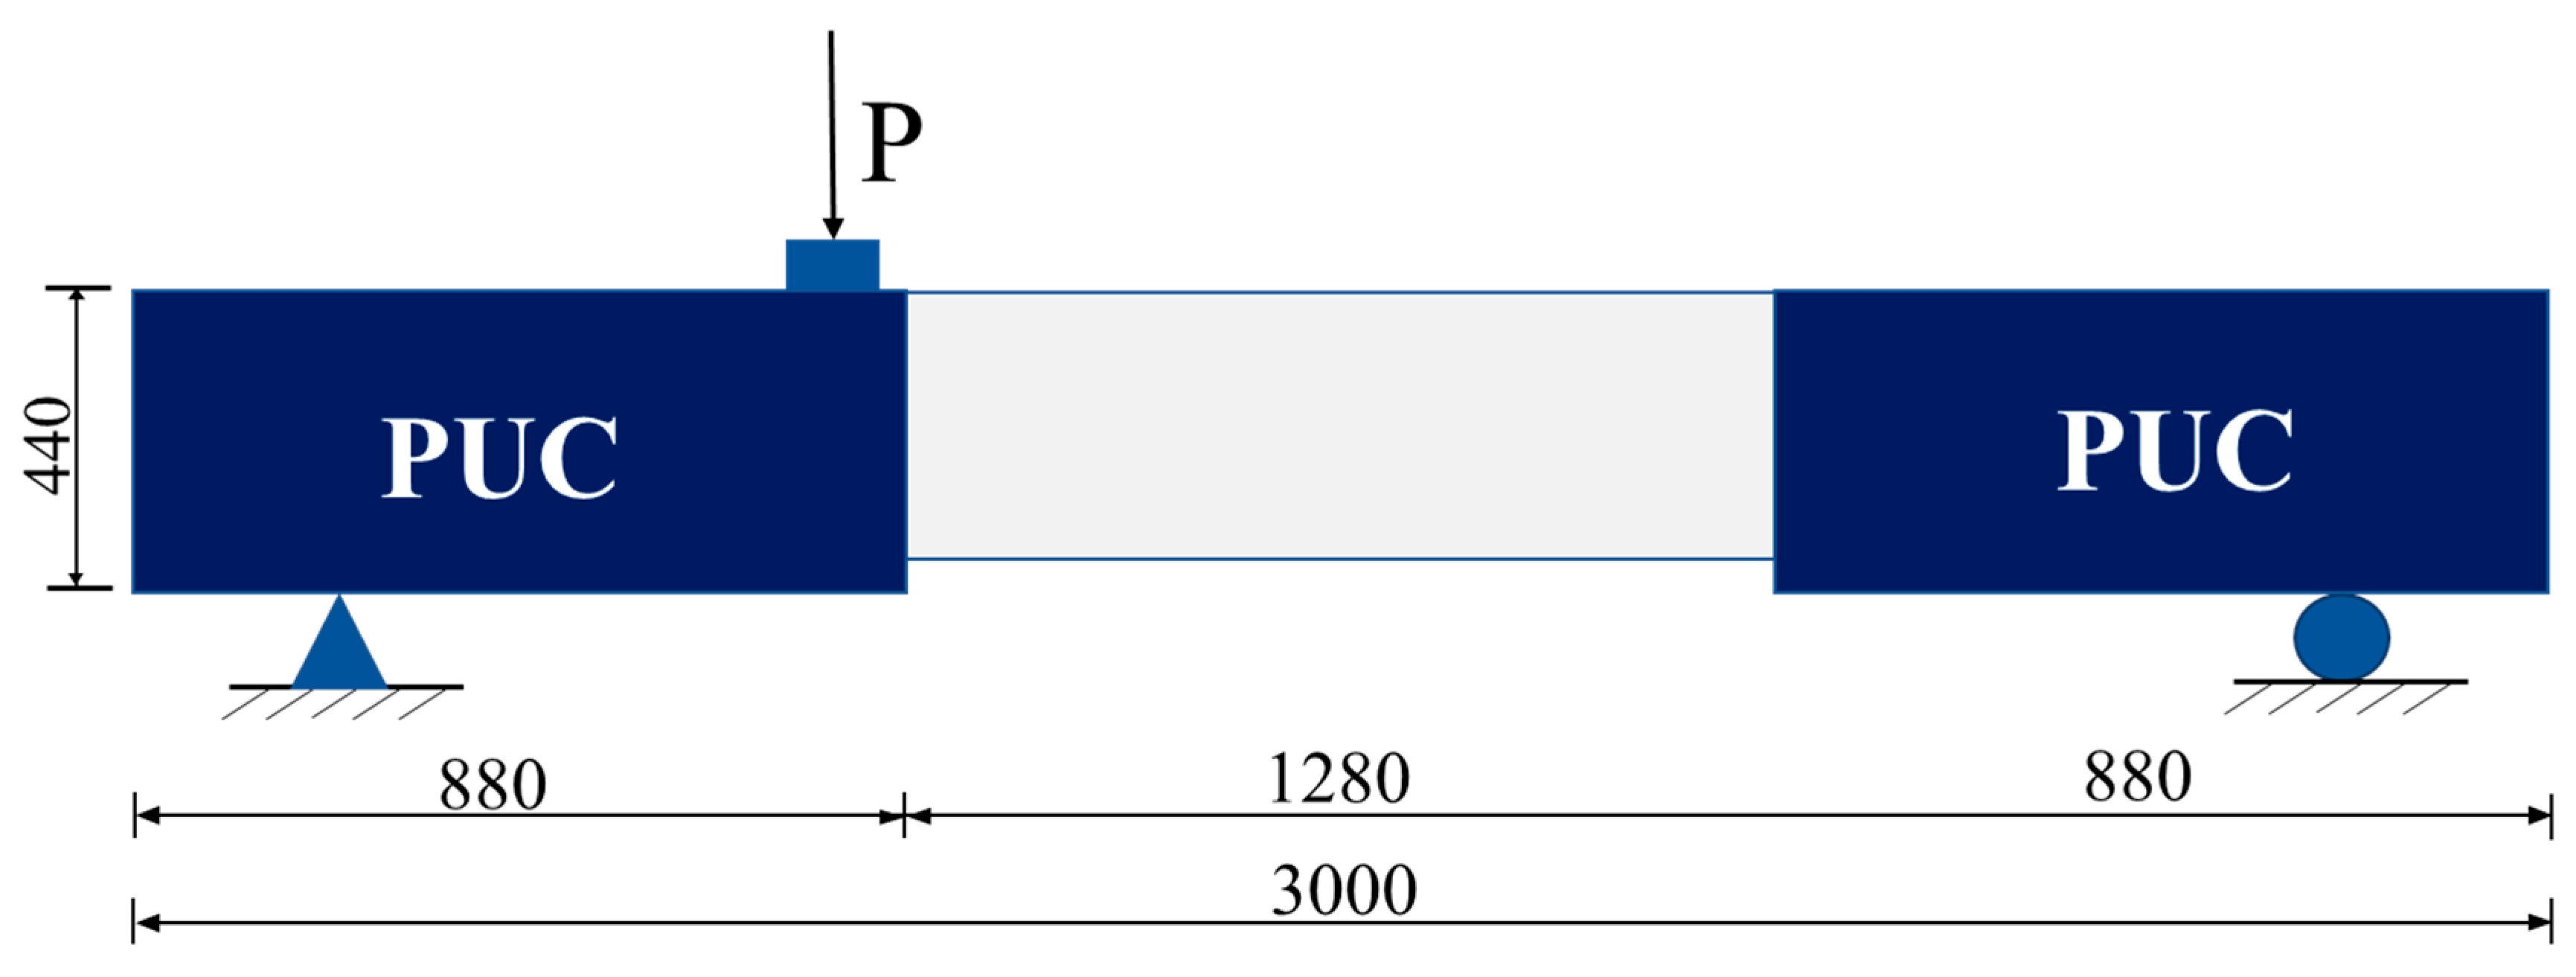
The design details of the test beams are shown in Figure 3 and Figure 4. Three longitudinal steel bars were placed in the tensile zone at the bottom of each beam, all of which were HRB400 grade reinforcement, consisting of two bars with a diameter of 25 mm and one bar with a diameter of 22 mm. The longitudinal reinforcement in the compression zone at the top of the beam consisted of two HRB400 grade bars, each with a diameter of 10 mm. The reinforcement ratio in the shear-compression zone was 2.06%. Stirrups were fabricated from HPB300 grade steel bars with a diameter of 8 mm, and the stirrup reinforcement ratio was 0.35%. Considering the shear span-to-depth ratio and the cross-sectional reinforcement configuration, the stirrup spacing in the shear-compression zone, which had a length of 580 mm, was reduced to 145 mm, while the stirrup spacing in the remaining regions was set at 190 mm. To prevent premature flexural failure during loading tests, two additional HRB400 deformed bars with a diameter of 20 mm were added to the longitudinal tensile reinforcement in the beam regions outside the shear-compression zone, resulting in a reinforcement ratio of 2.06%. The concrete cover thickness was 20 mm.
Figure 3.
Longitudinal cross-section of the shear test beam (mm).
Figure 4.
Cross-sectional design of the shear test beam (mm).
2.2.2. Casting and Curing of Test Beams
- (1)
- Embedment of strain gauges
The surface of the longitudinal reinforcement and stirrups at the corresponding measurement points was first smoothed using an angle grinder. After smoothing, the reinforcement was tied, and 10 mm strain gauges were affixed to the smoothed areas. The strain gauges were applied smoothly to ensure the accuracy of the measured strain data.
- (2)
- Tying of reinforcement cage and concrete casting
The longitudinal reinforcement and stirrups were positioned according to the experimental scheme. The tied reinforcement cage was placed into a steel formwork, and the position of the cage was adjusted and fixed to ensure that the test beams achieved a concrete cover thickness of 30 mm. Customized steel formwork was used for the concrete test beams. While casting the concrete, a vibrating rod was used to compact the mixture within the formwork. Vibration was stopped when the concrete no longer exhibited significant subsidence, no air bubbles emerged, and the surface began to show cement paste.
- (3)
- Curing of test beams
The test beams were placed in a beam yard and cured outdoors for 28 days. Plastic sheeting was placed over the beams to prevent acidic components in rainwater from affecting the hardening of the concrete. Since concrete requires appropriate humidity and temperature conditions during hardening to promote cement hydration, prevent cracking, and ensure the strength and durability of the concrete, the test beams were periodically watered to meet these conditions.
2.2.3. Strengthening Scheme for Test Beams
- (1)
- Concrete Surface Treatment
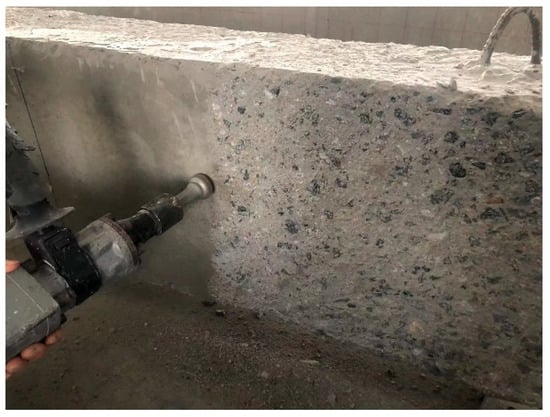
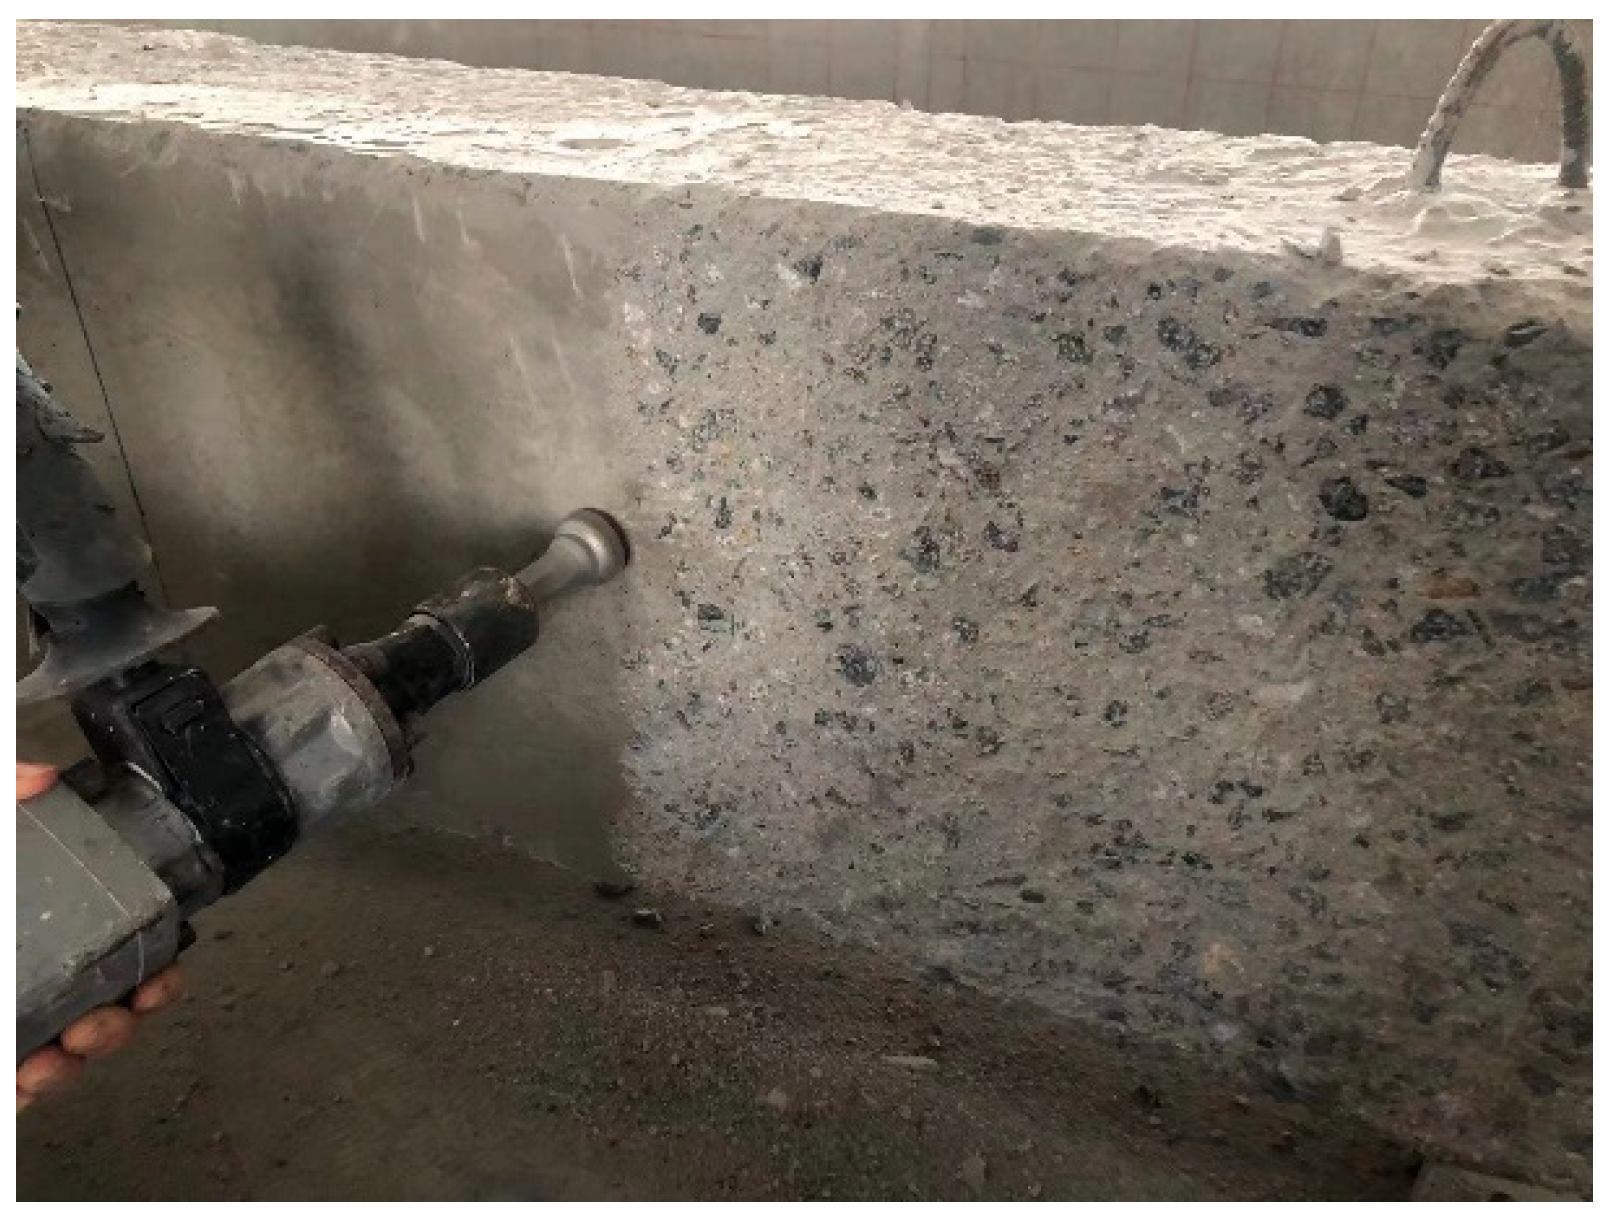
To ensure effective bonding between the concrete surface of the test beams and the PUC composite, the concrete surface in the shear-compression zone of the pre-cracked beams was subjected to chiseling and anchoring treatment. Prior to casting the polyurethane composite, a rotary hammer equipped with a hexagonal chisel was used to roughen the sides and bottom surfaces of the shear span region of the test beams. This process removed the mortar layer from the concrete surface and exposed the coarse aggregate. After roughening, the rough concrete surface was cleaned. Figure 5 shows the condition of the concrete surface after roughening.
Figure 5.
Condition of the concrete surface after roughening.
- (2)
- Placement of Wire Mesh
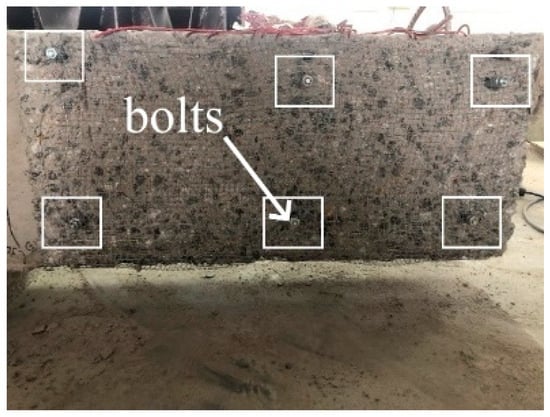
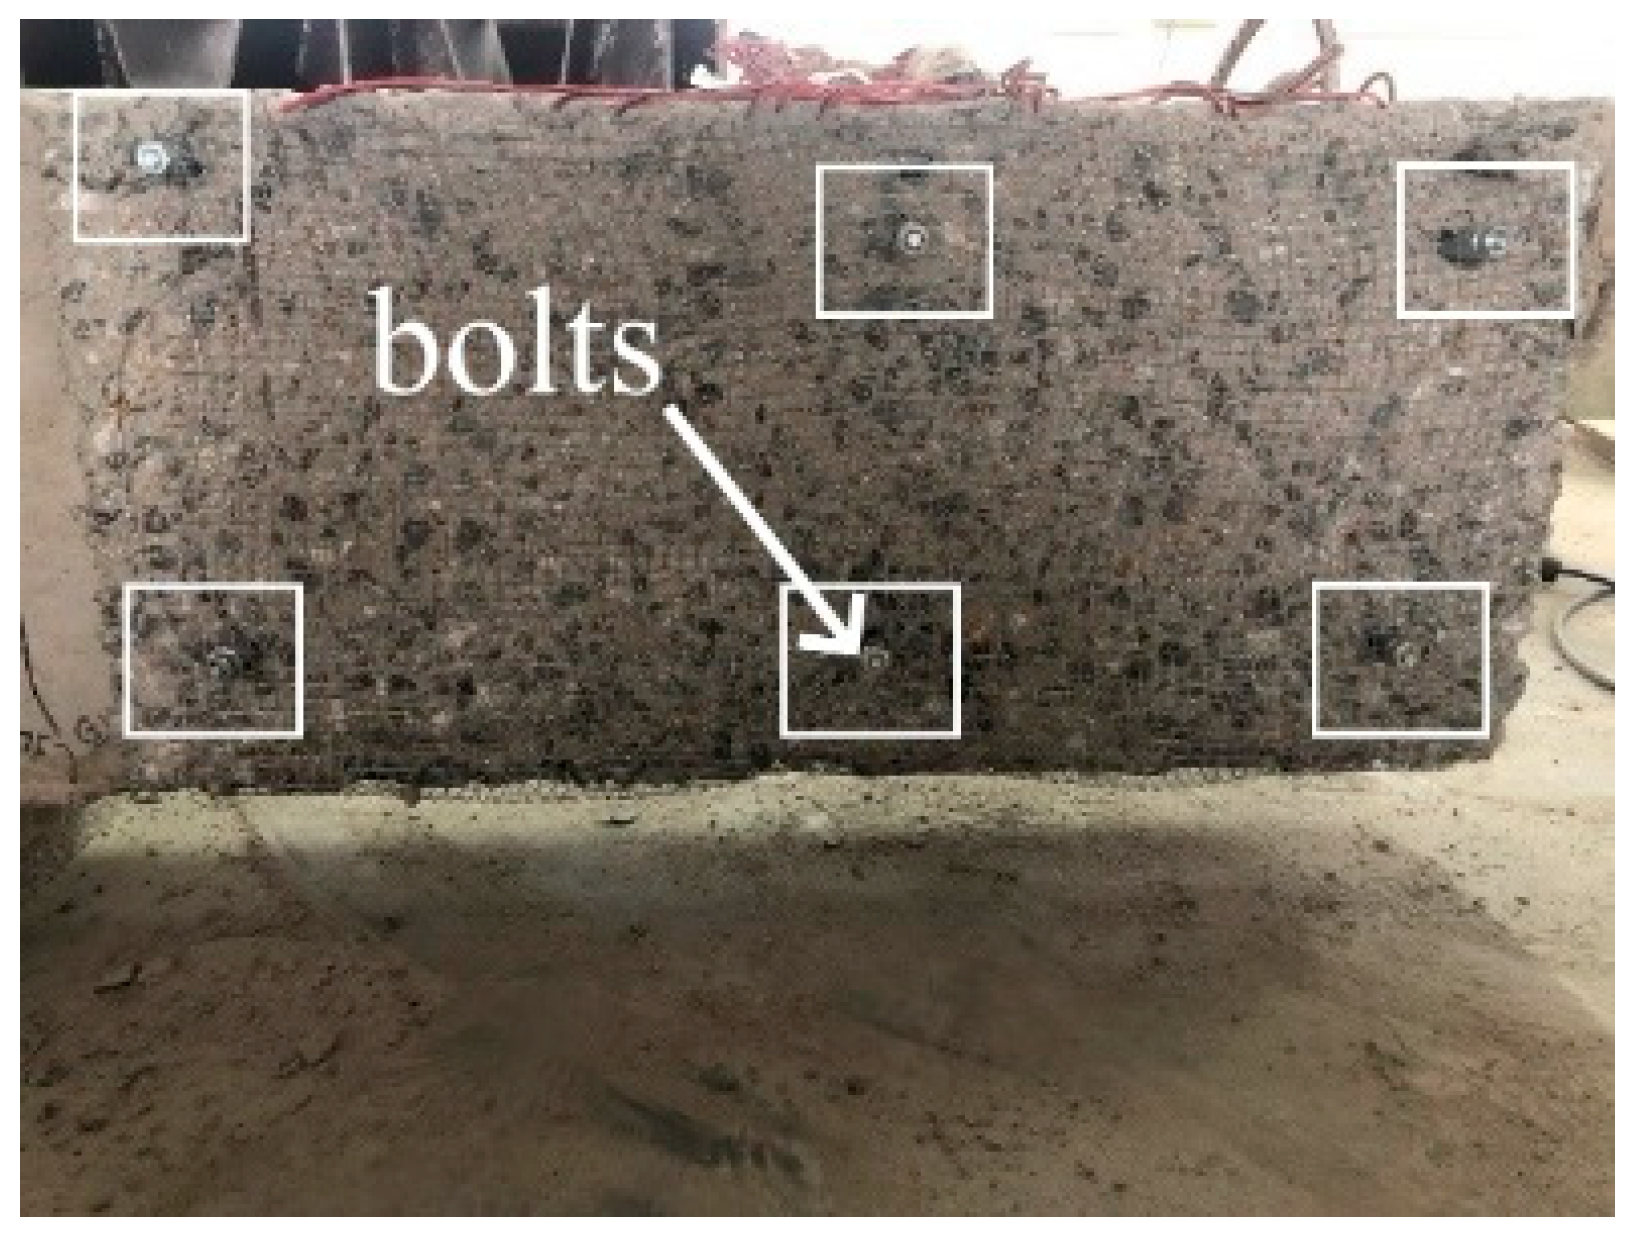
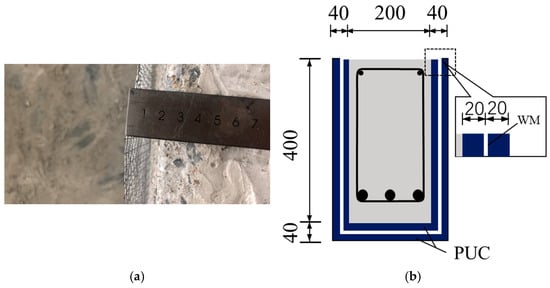
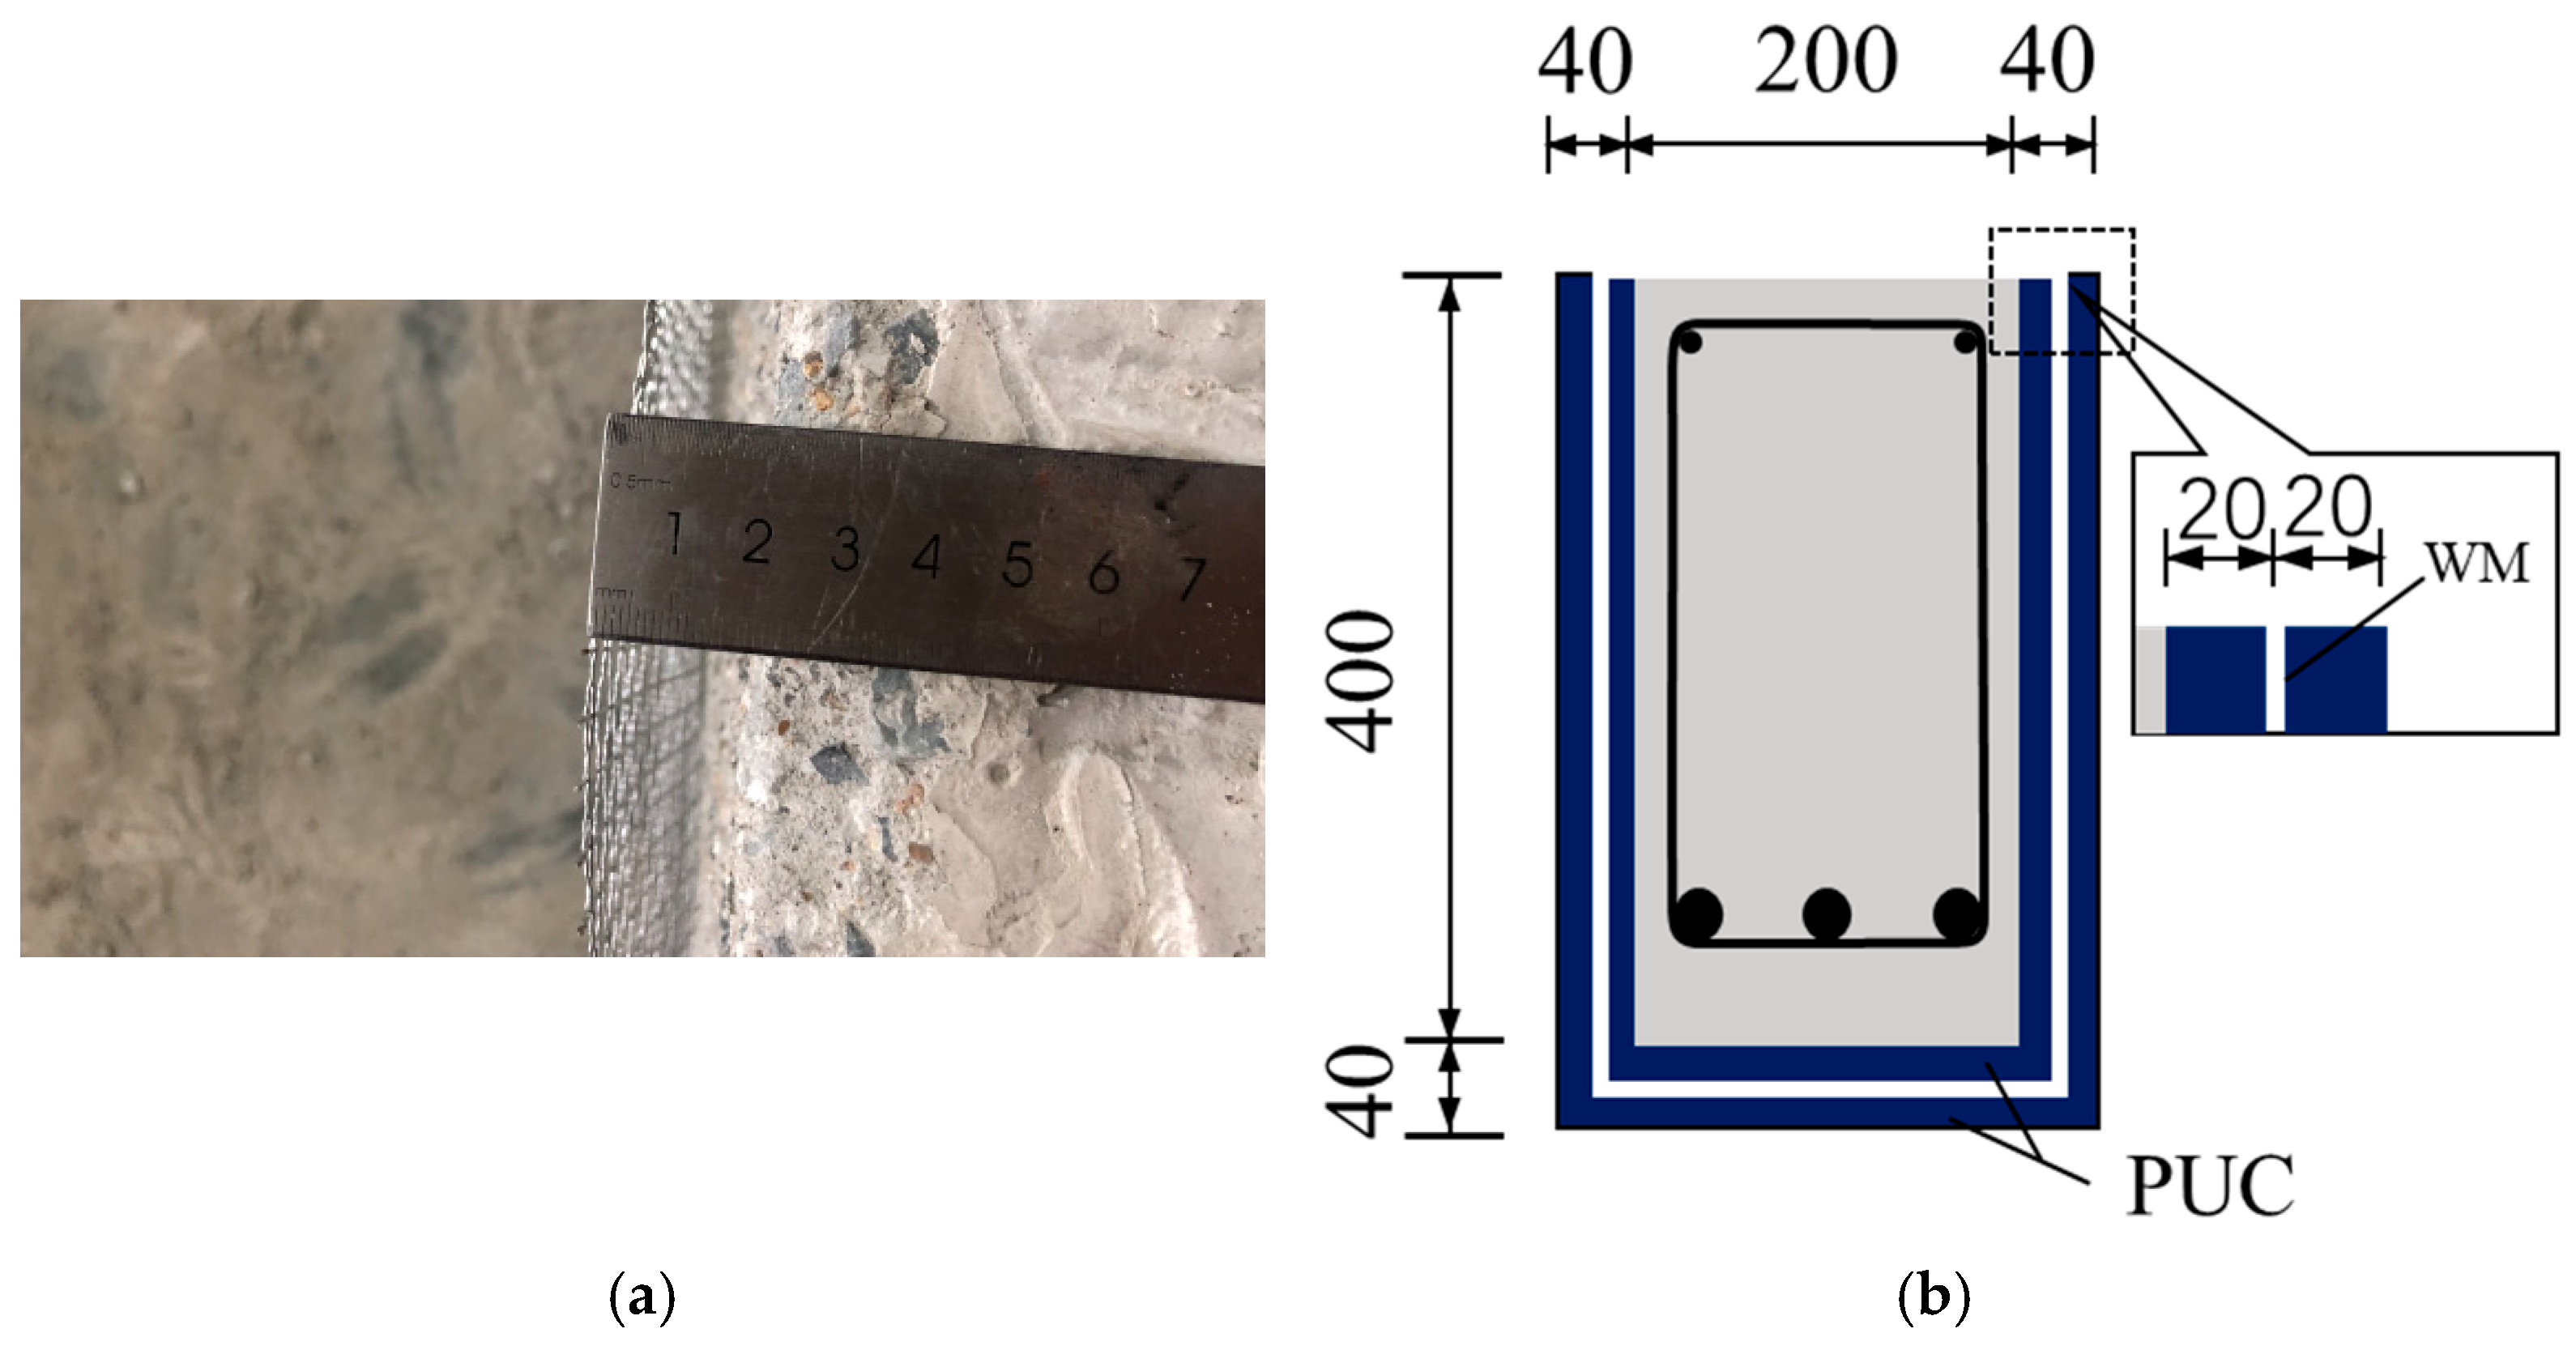
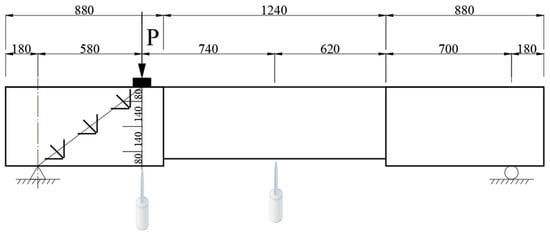
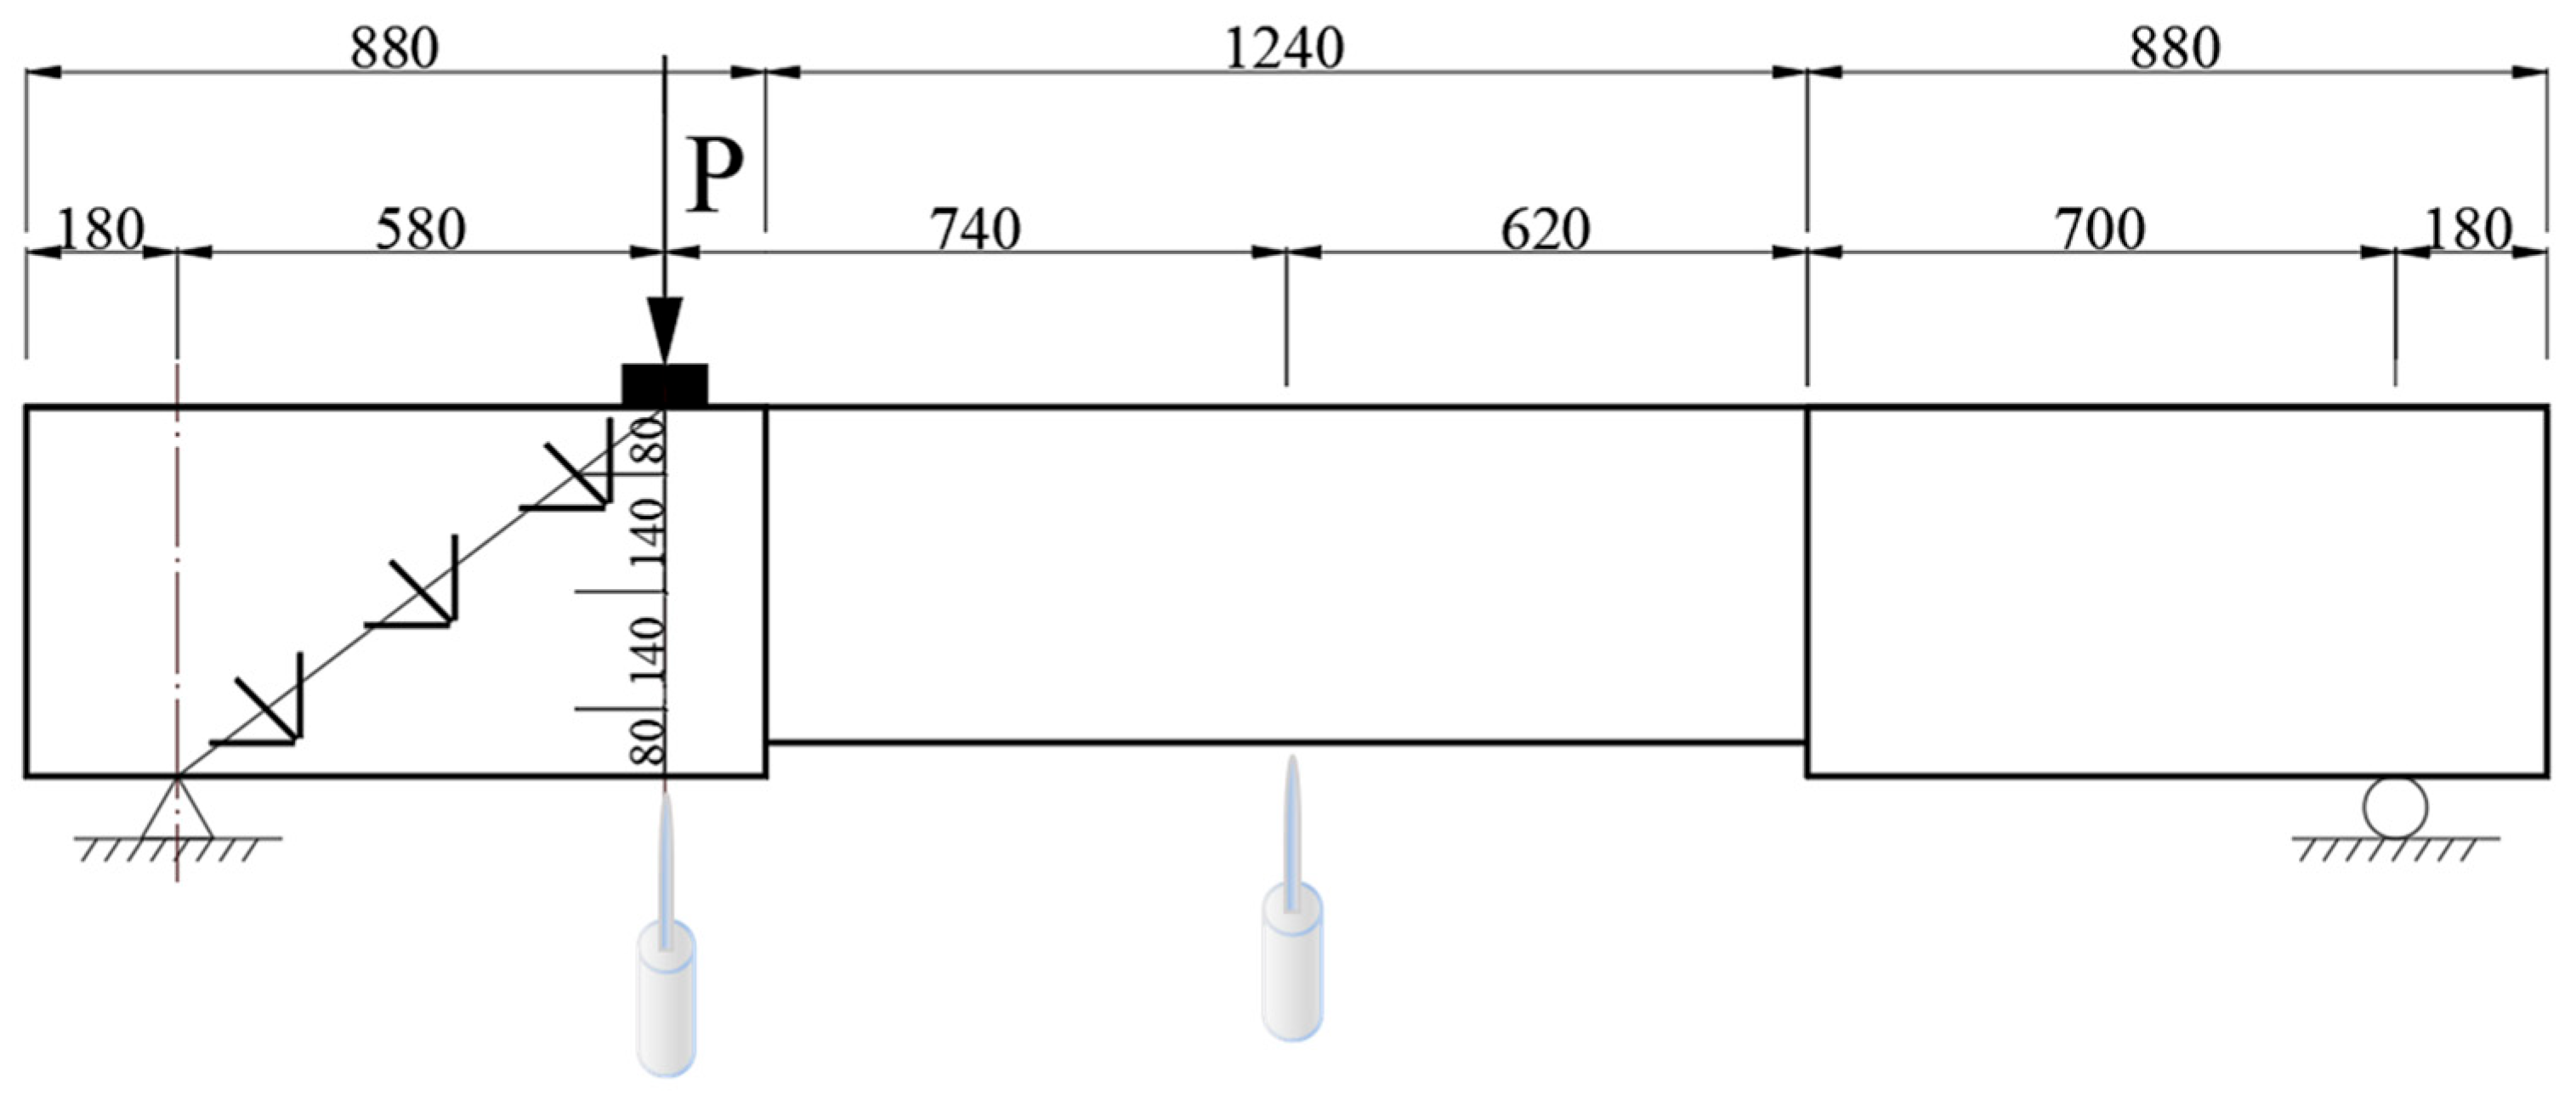
The WM was cut into specified dimensions and bent into a U-shape, with a bottom width of 440 mm, to facilitate installation. The WM layers were arranged on both sides and the bottom of the beams and were fixed using embedded bolts. A total of six pairs of bolts were installed, distributed on both sides of the shear-compression zone, with their positions as shown in Figure 6. Beam B1 was strengthened using pure PUC without WM reinforcement, and the configuration of the strengthening layer is illustrated in Figure 7. For Beam B2, the distance between the WM and the concrete surface, as well as the distance between the WM and the formwork, was set to 20 mm, as shown in Figure 8. To maintain a consistent layer thickness after PUC application, metal strips of a fixed thickness—equal to the spacing of the WM—were inserted between the layers near the bolts.
Figure 6.
WM and Bolt Layout.
Figure 7.
Design of the PUC Reinforcement Layer.
Figure 8.
Distance between the WM and the concrete in Beam B2. (a) Clearance between the WM and the concrete surface. (b) Design of the WM–PUC reinforcement layer.
- (3)
- Fabrication of Formwork for the Strengthening Layer
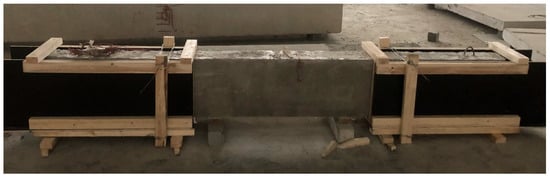
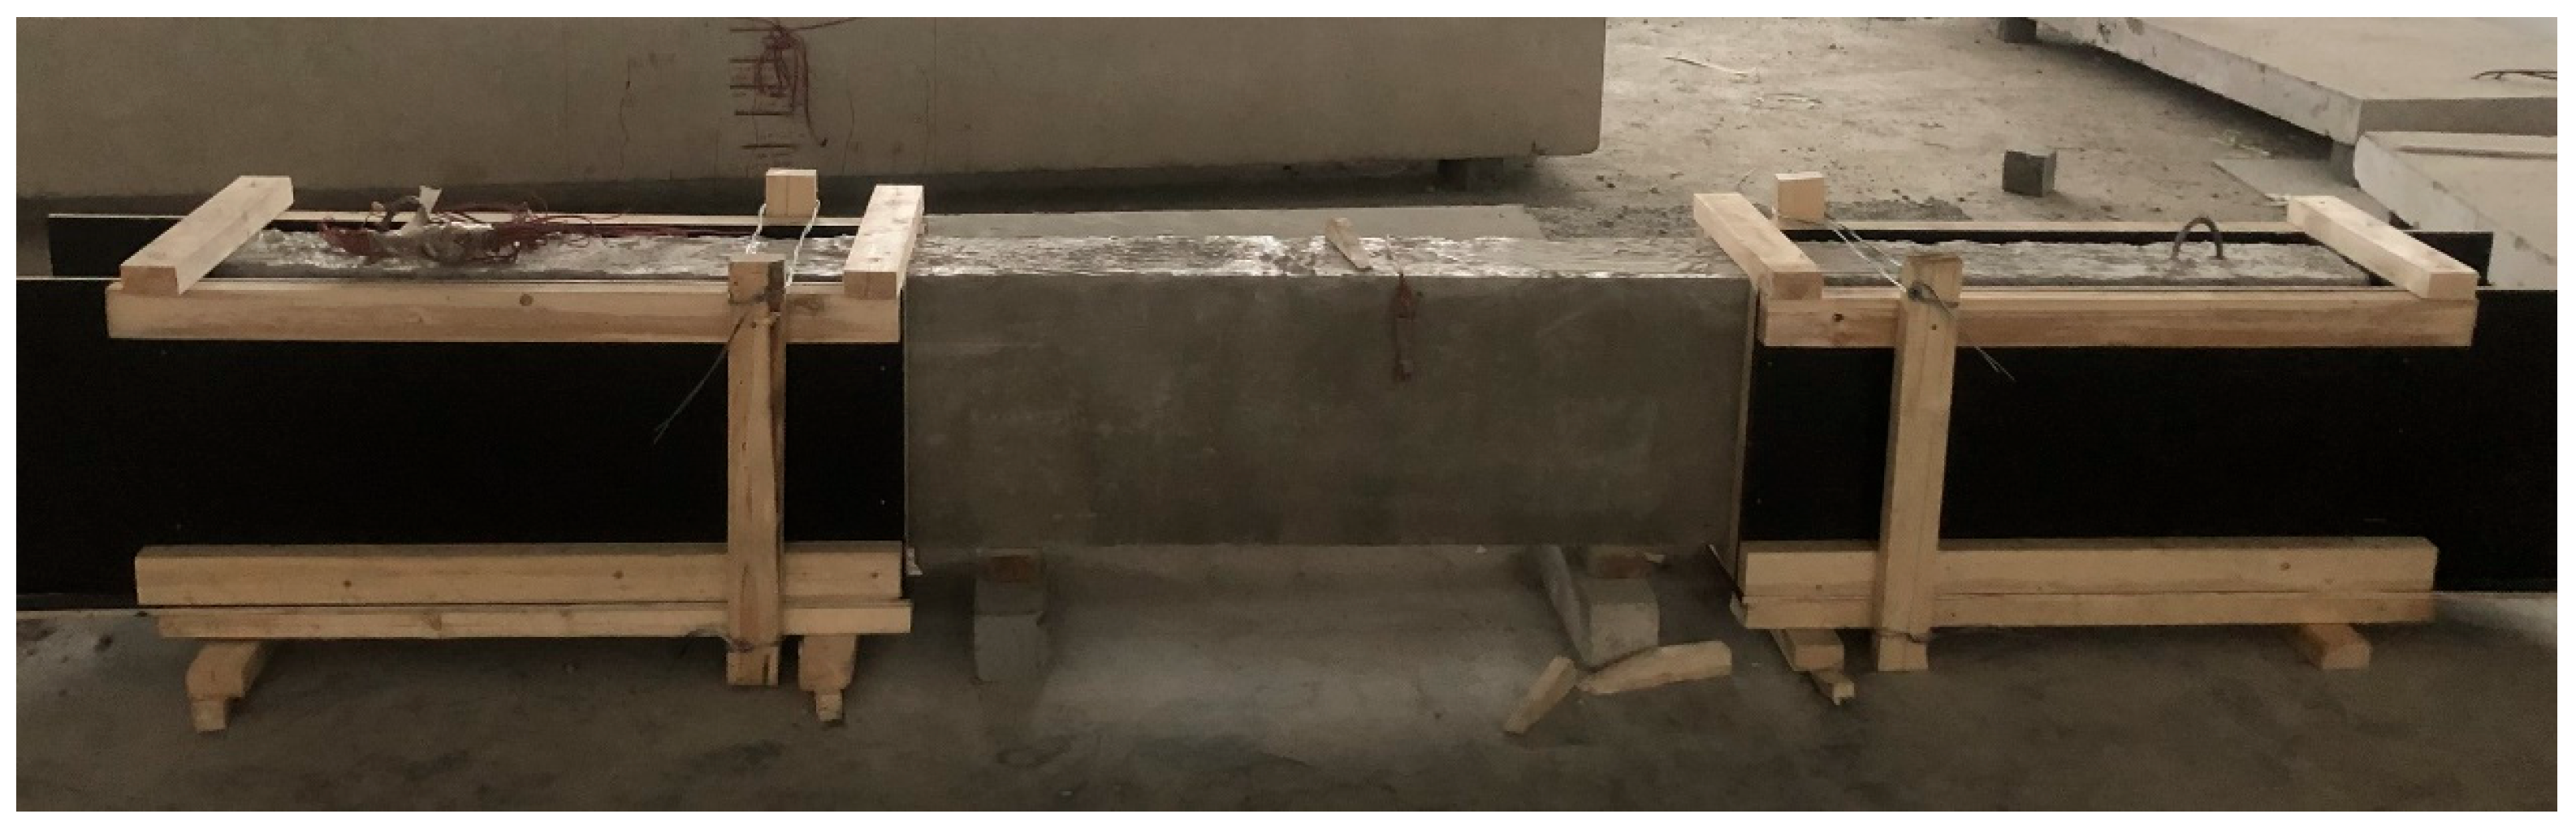
A U-shaped wooden formwork was prepared and fixed in the shear-compression zone for each of the two strengthened beams, with identical formwork fixed on the opposite side. The ends of each face of the formwork were sealed with double-sided foam tape to prevent leakage of the PUC during pouring. A specialized release agent was uniformly applied to the inner surface of the formwork to prevent adhesion of the PUC to the formwork. The arrangement of the formwork is shown in Figure 9.
Figure 9.
Layout and Installation of Formwork.
- (4)
- Preparation, Pouring, and Formwork Removal of PUC
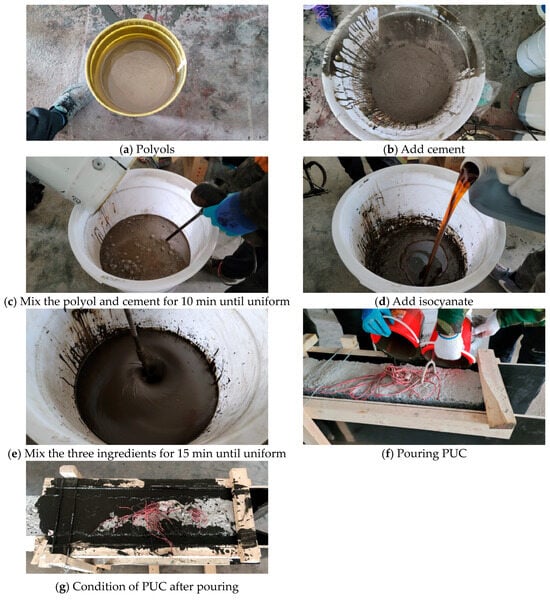
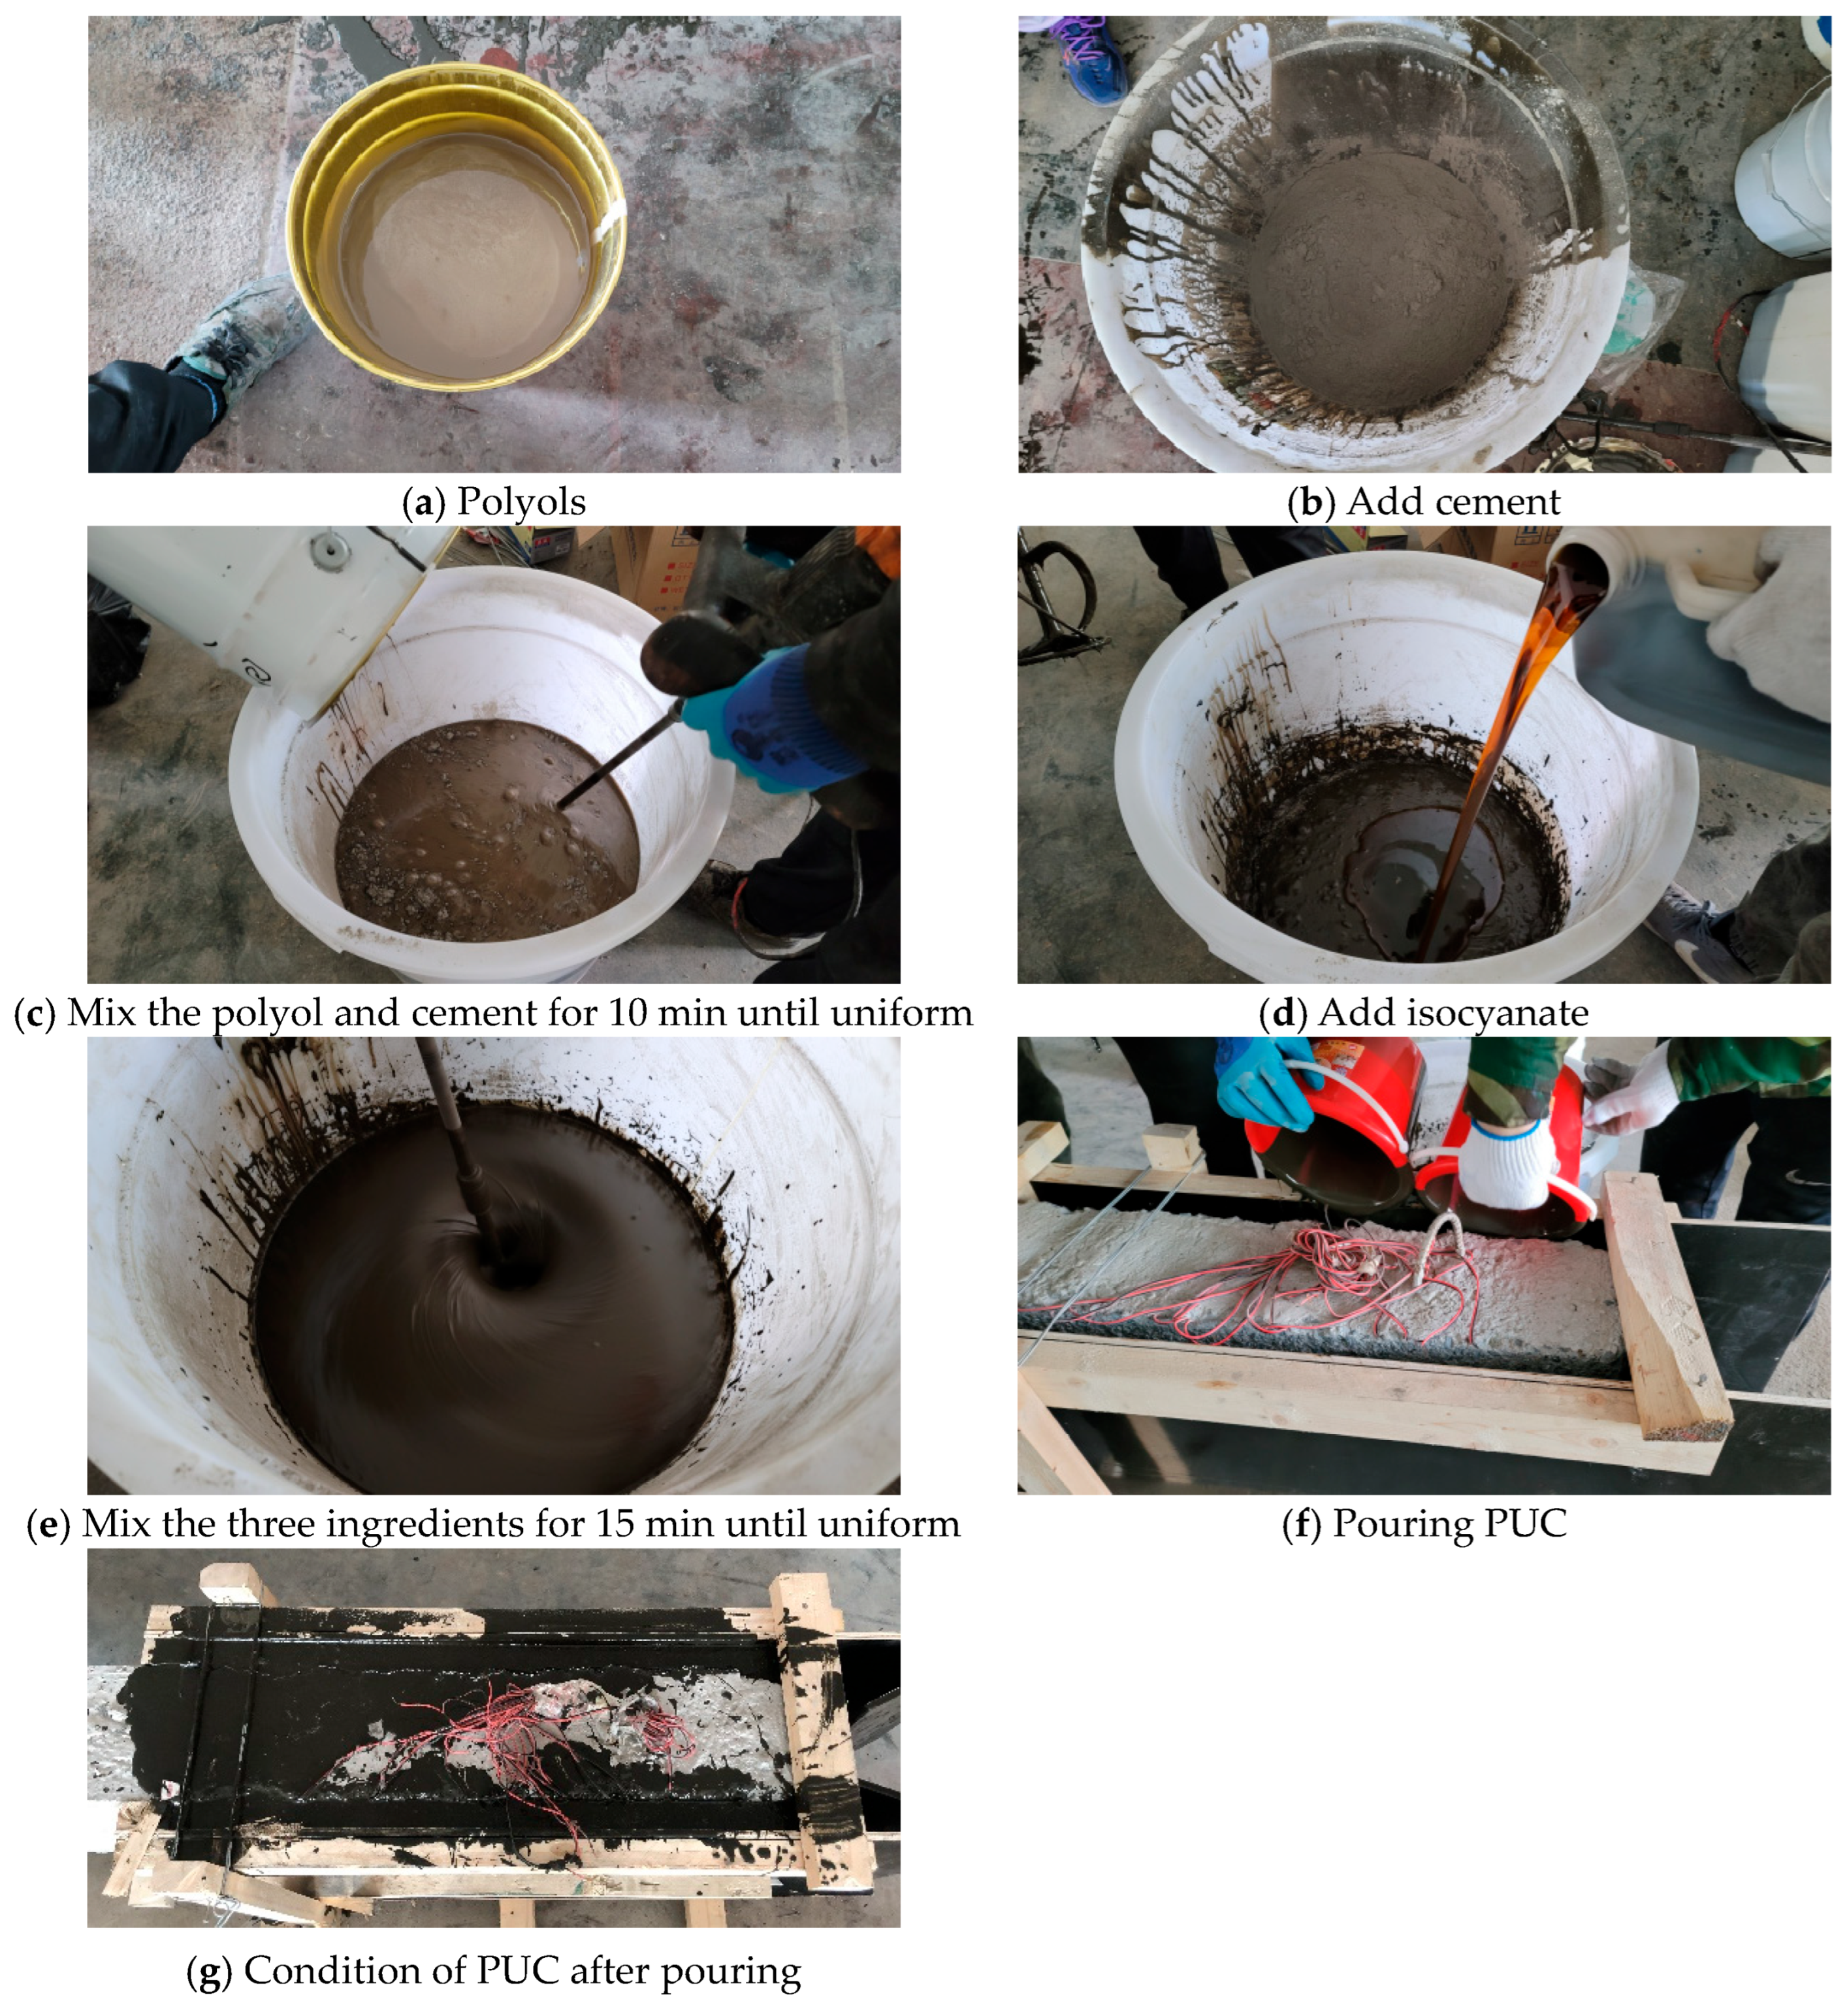
The preparation and pouring process of PUC is illustrated in Figure 10. First, polyol (Figure 10a) was added to a container and stirred evenly to prevent sedimentation at the bottom. Cement was then introduced into the mixing container (Figure 10b) and stirred until a uniform, particle-free mixture was achieved (Figure 10c). Subsequently, polyisocyanate was poured into the mixture (Figure 10d), and the mixture was stirred again until homogenous (Figure 10e). In its early stage, PUC exhibited a certain degree of fluidity, similar to self-compacting concrete. The PUC must be injected into the formwork before hardening occurs (Figure 10f). After 24 h, the PUC material fully hardened (Figure 10g), and the wooden formwork was removed. The dimensions of the strengthening layer are shown in Figure 7, Figure 8b and Figure 11.
Figure 10.
The preparation and casting process of PUC.
Figure 11.
Design Scheme for the PUC Reinforcement Layer.
2.2.4. Loading Scheme
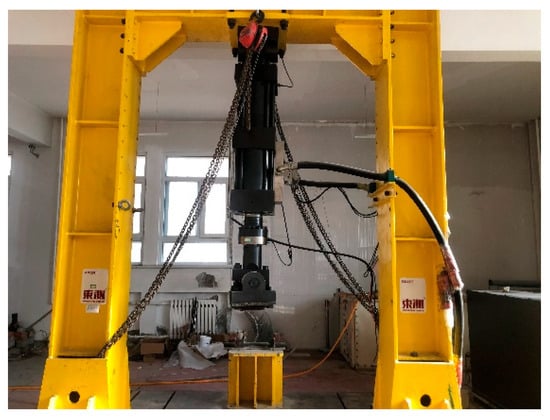
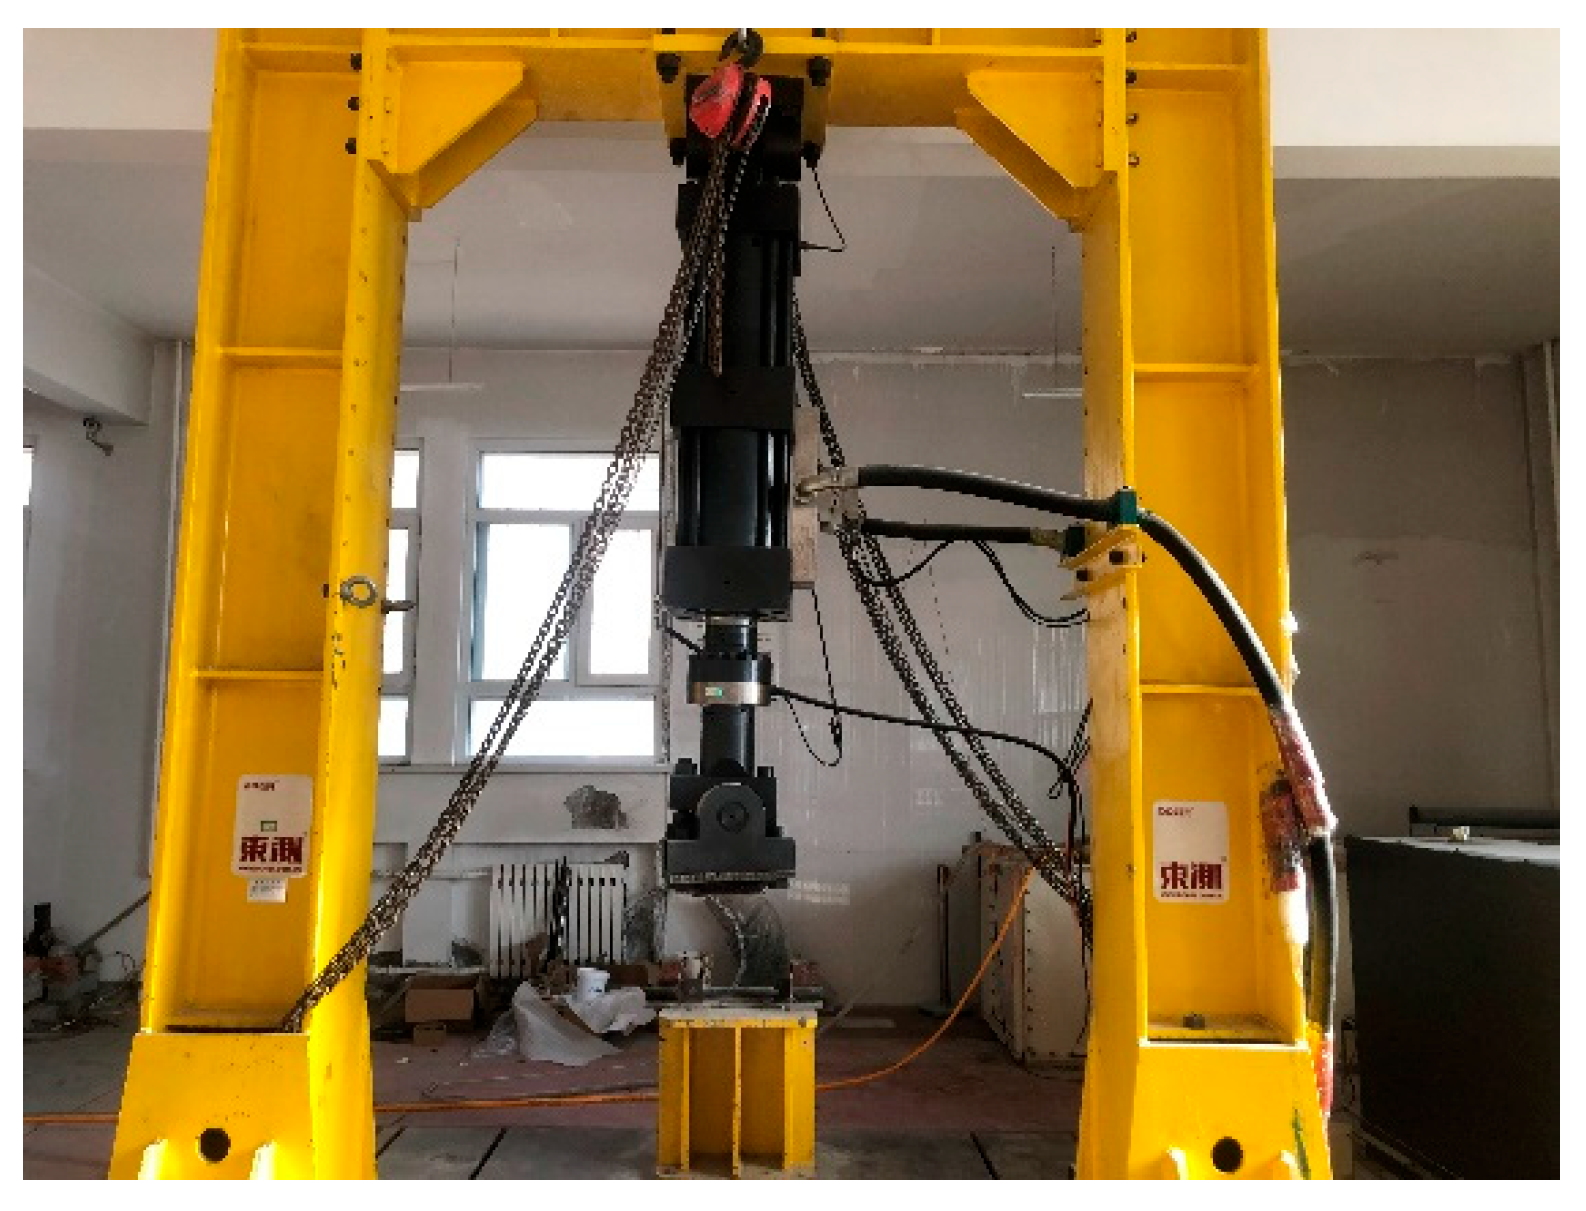
A single-point loading scheme was adopted in the test, with the loading point located 580 mm from the support. The loading configuration is shown in Figure 3. A steel bearing plate was placed on the surface of the test beam at the concentrated loading point, with the bottom of the steel plate leveled against the beam surface to ensure stable support and uniform load distribution. The loading device employed was a PLS-500 electro-hydraulic servo testing machine manufactured by Jinan Dongtest Testing Machine Technology Co., Ltd., Jinan, China as shown in Figure 12.
Figure 12.
Loading Device.
All tests were conducted using load-controlled incremental loading. Specifically, within the load range of 0–200 kN, the load was increased in increments of 25 kN per stage; within the range of 200–280 kN, the load was increased in increments of 20 kN per stage; beyond 280 kN, the load was increased in increments of 10 kN per stage until failure of the test beam. After each load increment, the load was maintained for 5 min.
Failure criteria: The test beam was considered to have failed when any of the following conditions was met:
A. Concrete crushing at the loading point;
B. Yielding of reinforcement in the shear-compression zone;
C. Crack width reaching 1 mm at the intersection of a diagonal crack with the stirrup within the concrete or PUC strengthening layer.
3. Experimental Procedure
3.1. Instrumentation and Test Setup
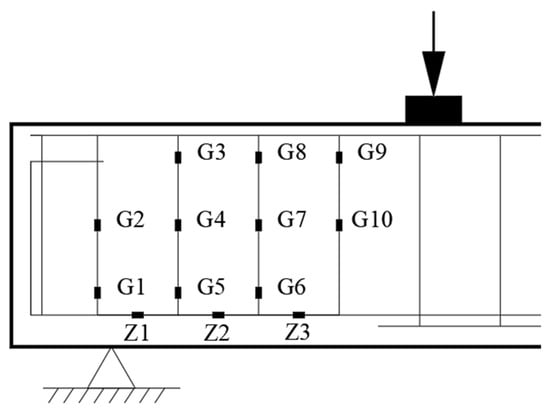
The data to be collected during the test included deflection of the test beam, reinforcement strain, concrete strain, and crack width in the concrete or PUC. Two vertical displacement transducers with a range of 100 mm were placed at the loading point and at midspan to measure deflection. The arrangement of the displacement transducers is shown in Figure 13 and Figure 14. Embedded resistance strain gauges were used to measure the strain in the reinforcement, and the specific layout of the main reinforcement and stirrups in the shear-compression zone is shown in Figure 15. Prior to loading, 100 mm resistance strain gauges were attached to the concrete surface or PUC surface in the shear-compression zone to measure the tensile and compressive strains of the concrete or PUC. The distribution of the strain gauges is shown in Figure 13 and Figure 14. During the loading process, crack initiation and propagation with increasing load were observed. After each load increment, once the measured load and displacement had stabilized, a KC-CK101 crack observation instrument was used to observe and record the location, length, and width of the developed cracks.
Figure 13.
Distribution of measurement points on the CB and A1 beams.
Figure 14.
Distribution of measurement points on Beams B1 and B2.
Figure 15.
Distribution of measurement points for rebar strain.
3.2. Determination of Ultimate Load-Carrying Capacity of Test Beams and Pre-Cracking Damage Setup
Test beam CB was used to determine the ultimate load-carrying capacity. During the test, the crack width at the intersection of diagonal cracks and stirrups in the shear-compression zone was monitored, and the strain values of the stirrups and main reinforcement were recorded to determine whether yielding had occurred. When either of these exceeded the limit, the test was stopped immediately, and the corresponding load value was recorded as the ultimate load-carrying capacity of the beam.
The preload value was determined according to the measured ultimate load-carrying capacity. According to references [43,44,45,46], a damage degree of 0.7 was adopted, as shown in Table 4. The preload value was set at 70% of the ultimate load-carrying capacity. Preloading was applied to beams A1, B1, and B2 accordingly.
3.3. Determination of Residual Load-Carrying Capacity and Ultimate Load-Carrying Capacity of Strengthened Beams
After preloading of beam A1 was completed, its residual load-carrying capacity was determined. Beams B1 and B2, after strengthening, were tested to determine their ultimate load-carrying capacity. The test was terminated when the specified failure criteria were met, indicating failure of the test beam. The test results were recorded, and the three sets of results were analyzed.
4. Results and Analysis
4.1. Analysis of the Pre-Cracking Process of Strengthened Beams
Reference beam CB was loaded. When the load reached 100 kN, the concrete in the shear span region of beam CB remained in the elastic stage without cracking, while plastic cracking occurred in the concrete of the flexural region, with two vertical cracks appearing at the midspan and the bottom edge of the shear span. As the load gradually increased, both the number and width of cracks in the flexural region increased. When the load reached 150 kN, the concrete in the shear span region entered the plastic stage, and multiple diagonal cracks appeared, oriented from the support toward the loading point. The maximum diagonal crack width was 0.22 mm. When the load reached 300 kN, the deflection at the loading point decreased considerably, and the diagonal crack width increased by 0.2 mm, while the crack width in the flexural region at midspan increased only slightly, indicating that the test beam had reached a yielding state. When the load reached 320 kN, the deflection at the loading point of beam CB continued to decrease, while the maximum width of the diagonal cracks in the shear span region exceeded 1.5 mm, and concrete crushing occurred at the loading point on the top surface, meeting the failure criteria for the test beam. It was thus determined that beam CB had undergone shear failure. After unloading, both the deformation and diagonal cracks of beam CB could no longer be restored. Based on the calculated results and experimental observations, the ultimate load-carrying capacity of the test beam was determined to be 320 kN.
The initial loading behavior of beams A1, B1, and B2 was similar to that of beam CB. When the pre-cracking load reached 100 kN, the concrete in the shear span region remained elastic without diagonal cracking, while vertical flexural cracks appeared at the bottom edges of the loading point and midspan. When the load reached 125 kN, diagonal cracks appeared in the shear span region, oriented from the support toward the loading point. When the load reached 175 kN, the diagonal cracks in the shear span region grew significantly, reaching a length of 52.8 mm, and the crack width also increased to 0.6 mm. The number, length, and width of vertical cracks in the flexural region at midspan all increased. Finally, when the load reached 224 kN, i.e., 0.7 times the ultimate load of beam CB, the diagonal crack width of all three beams reached 0.8 mm, while the crack length showed no significant increase compared to that at 175 kN. After unloading, the damaged beams exhibited no obvious deformation, and the diagonal cracks closed, with the crack width significantly reduced to nearly zero compared to the loaded state. It was thus determined that beams A1, B1, and B2 had not reached a yielding state.
4.2. Analysis of Failure Process of Strengthened Beams
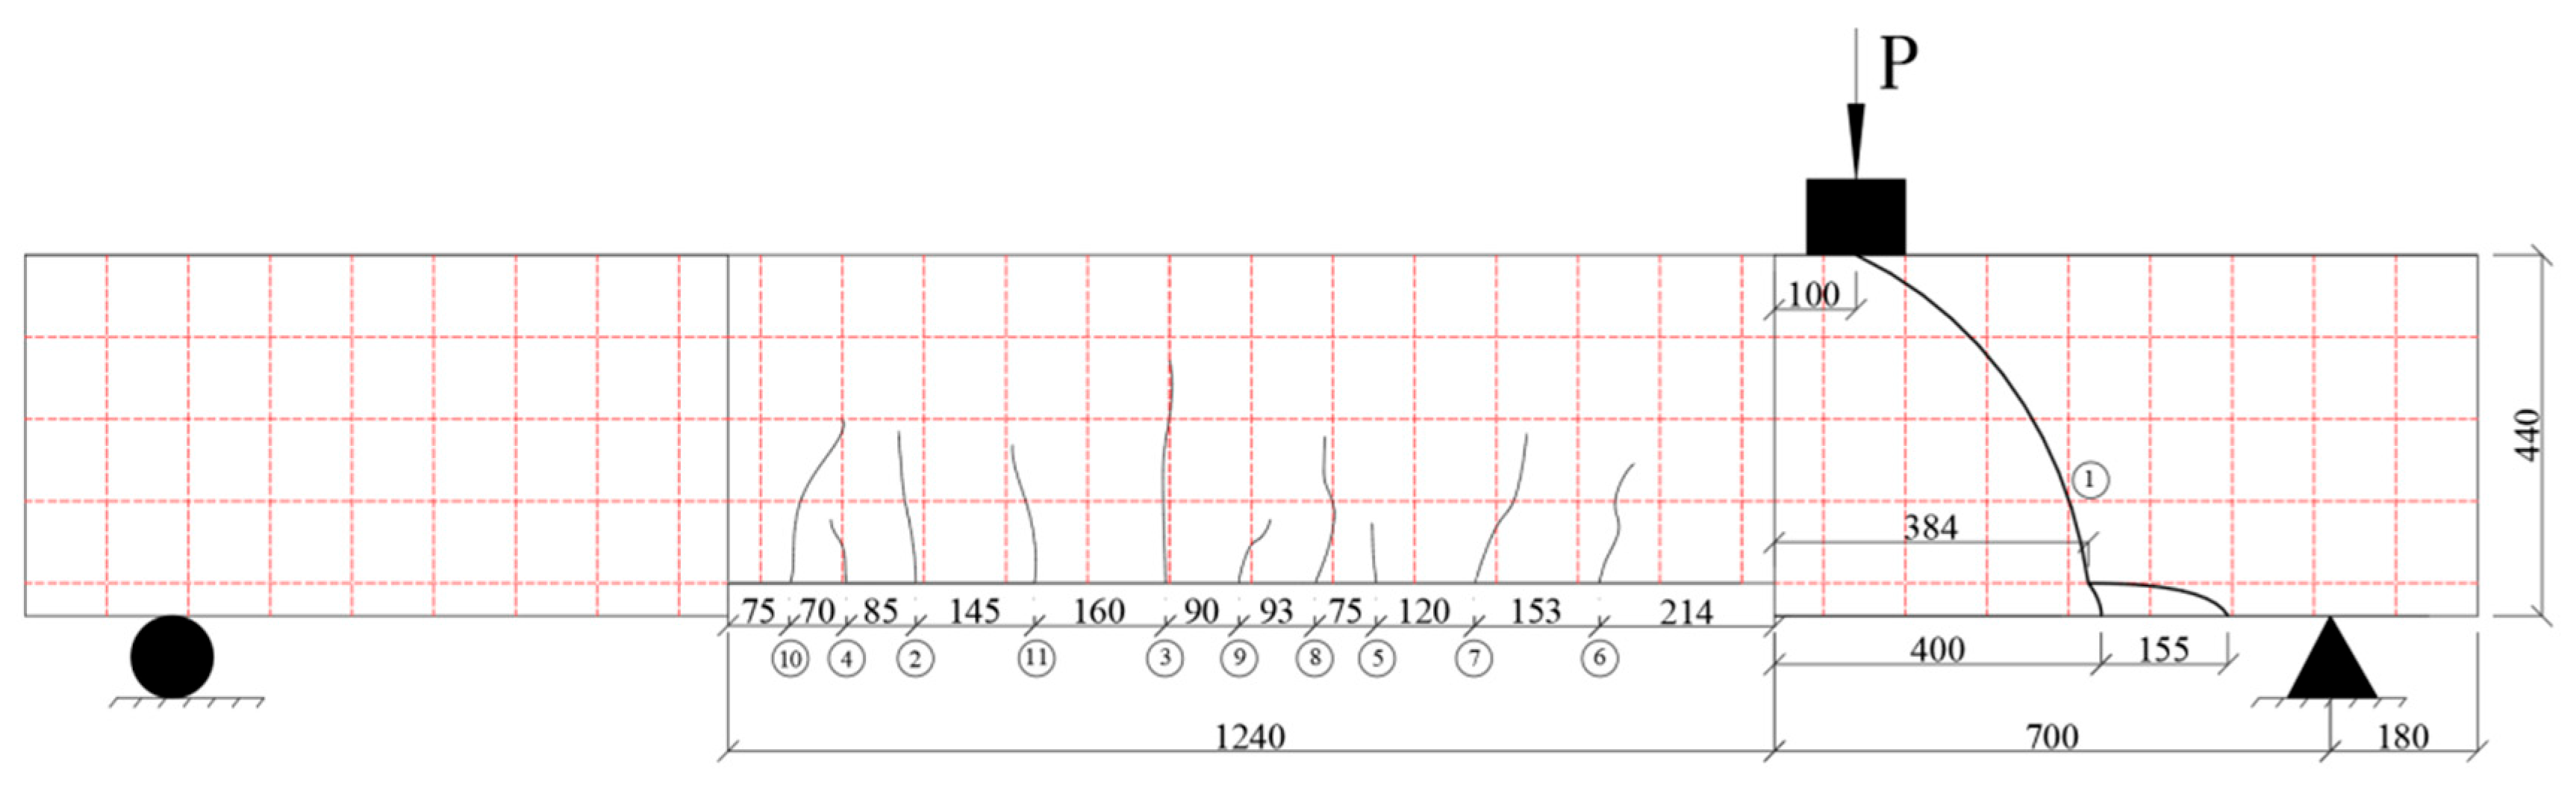
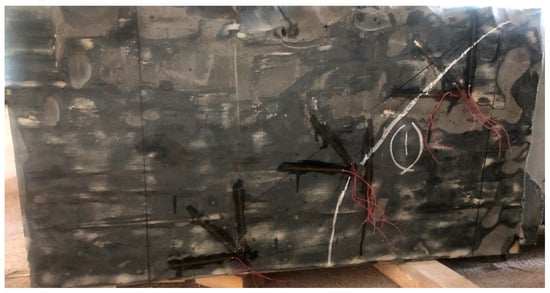
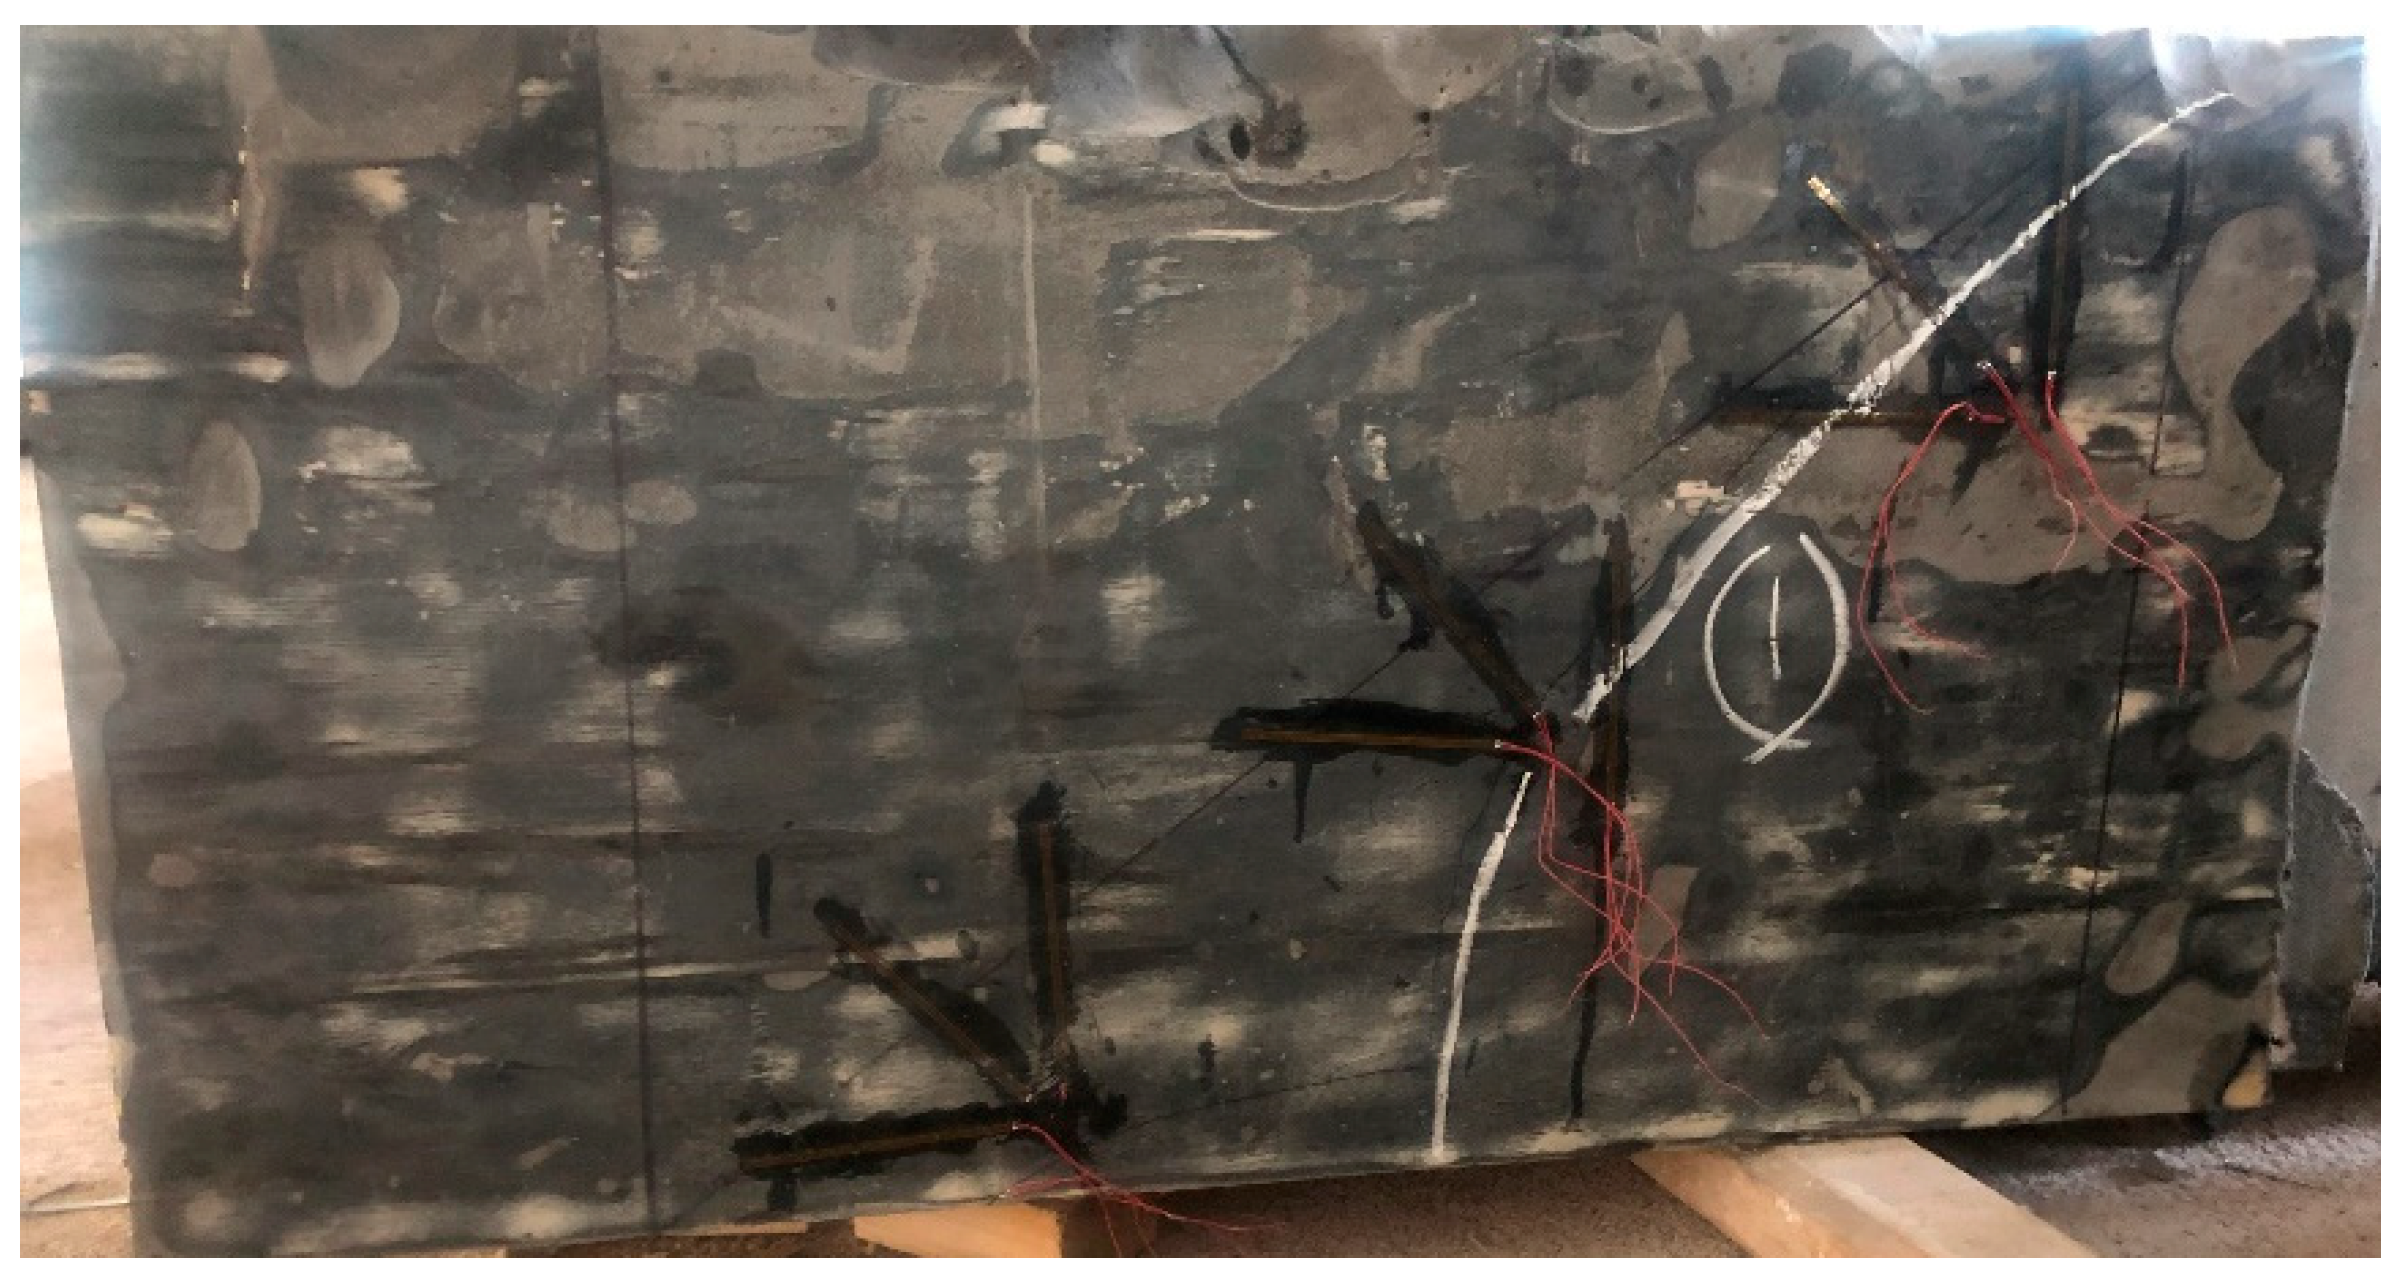
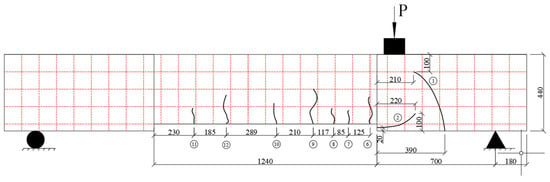
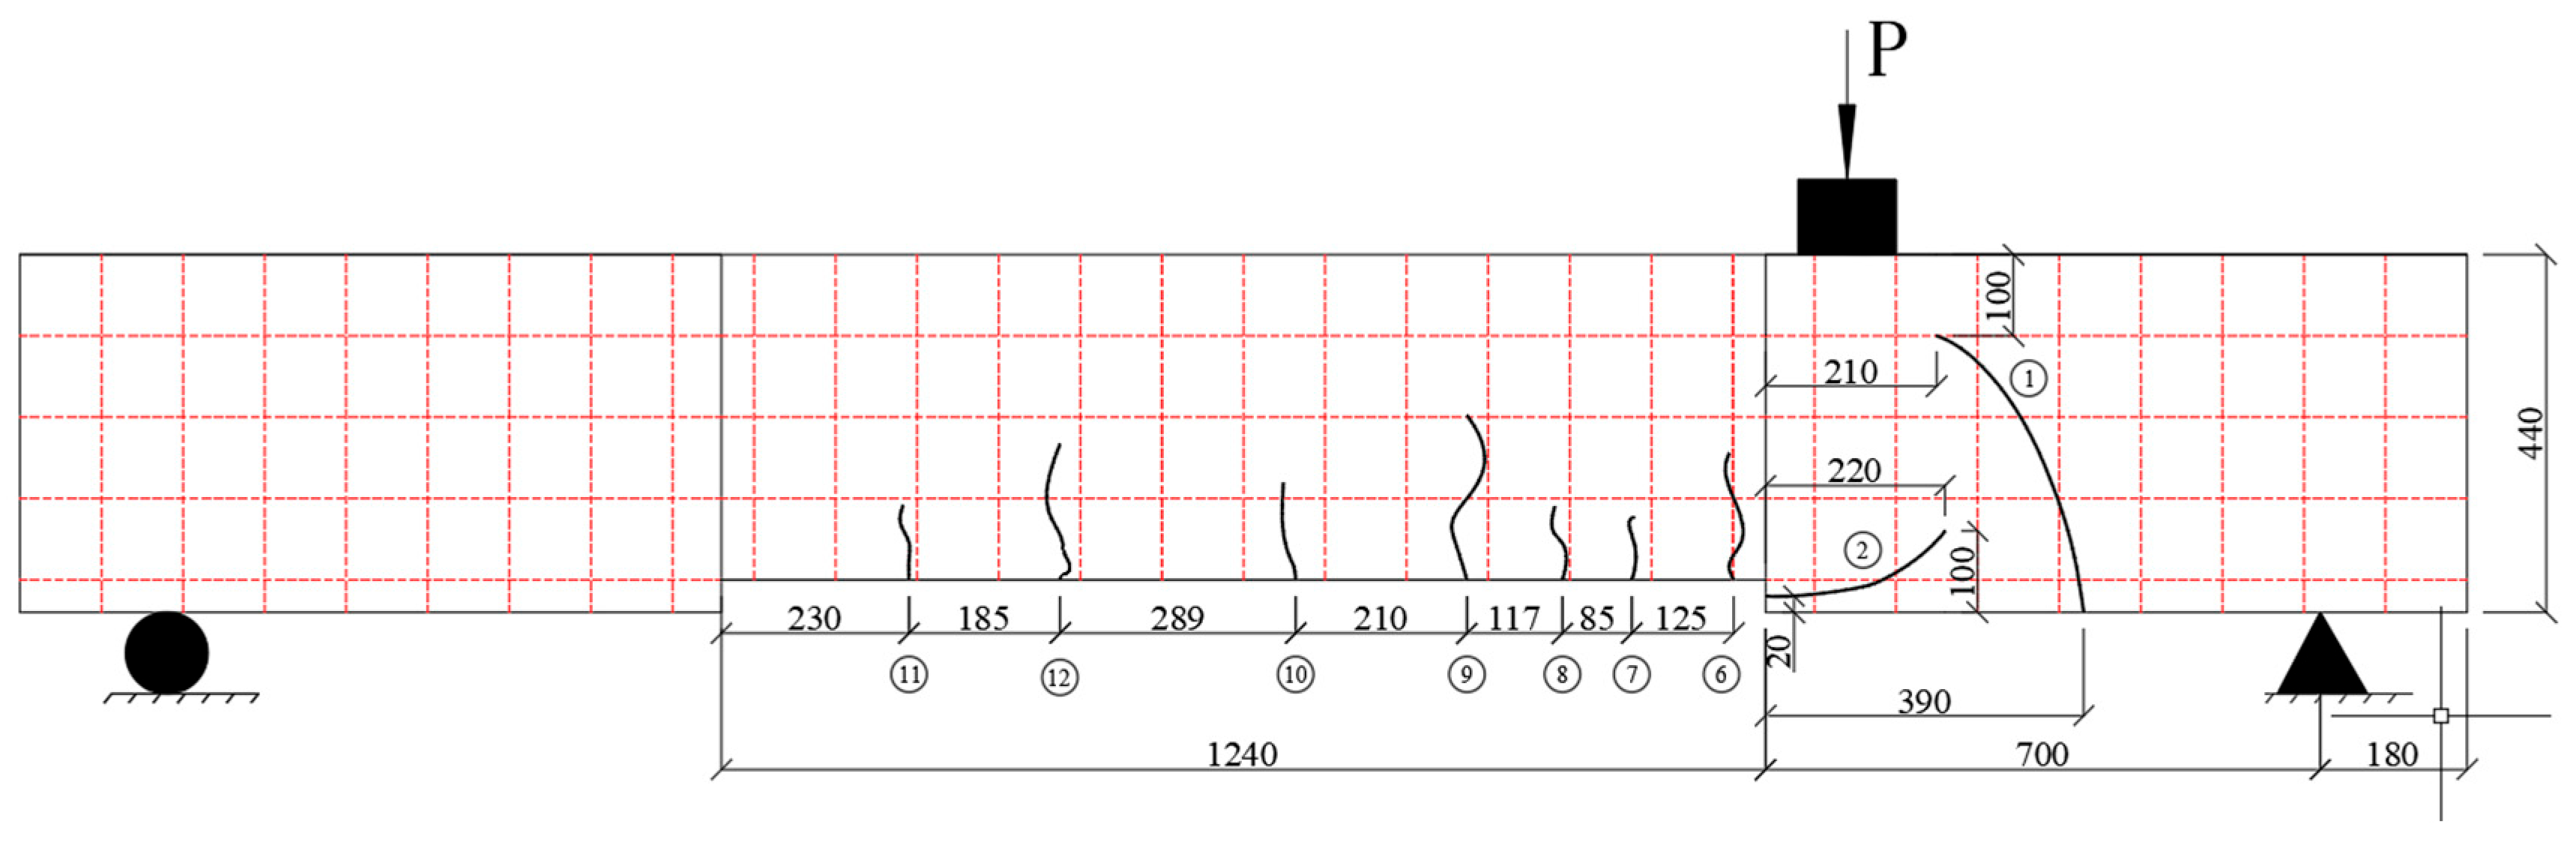
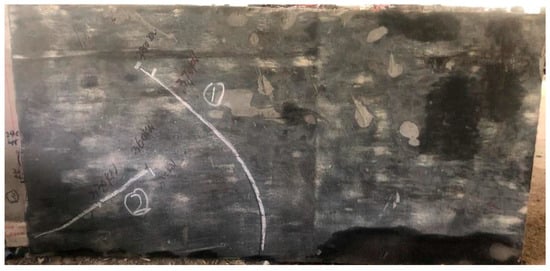
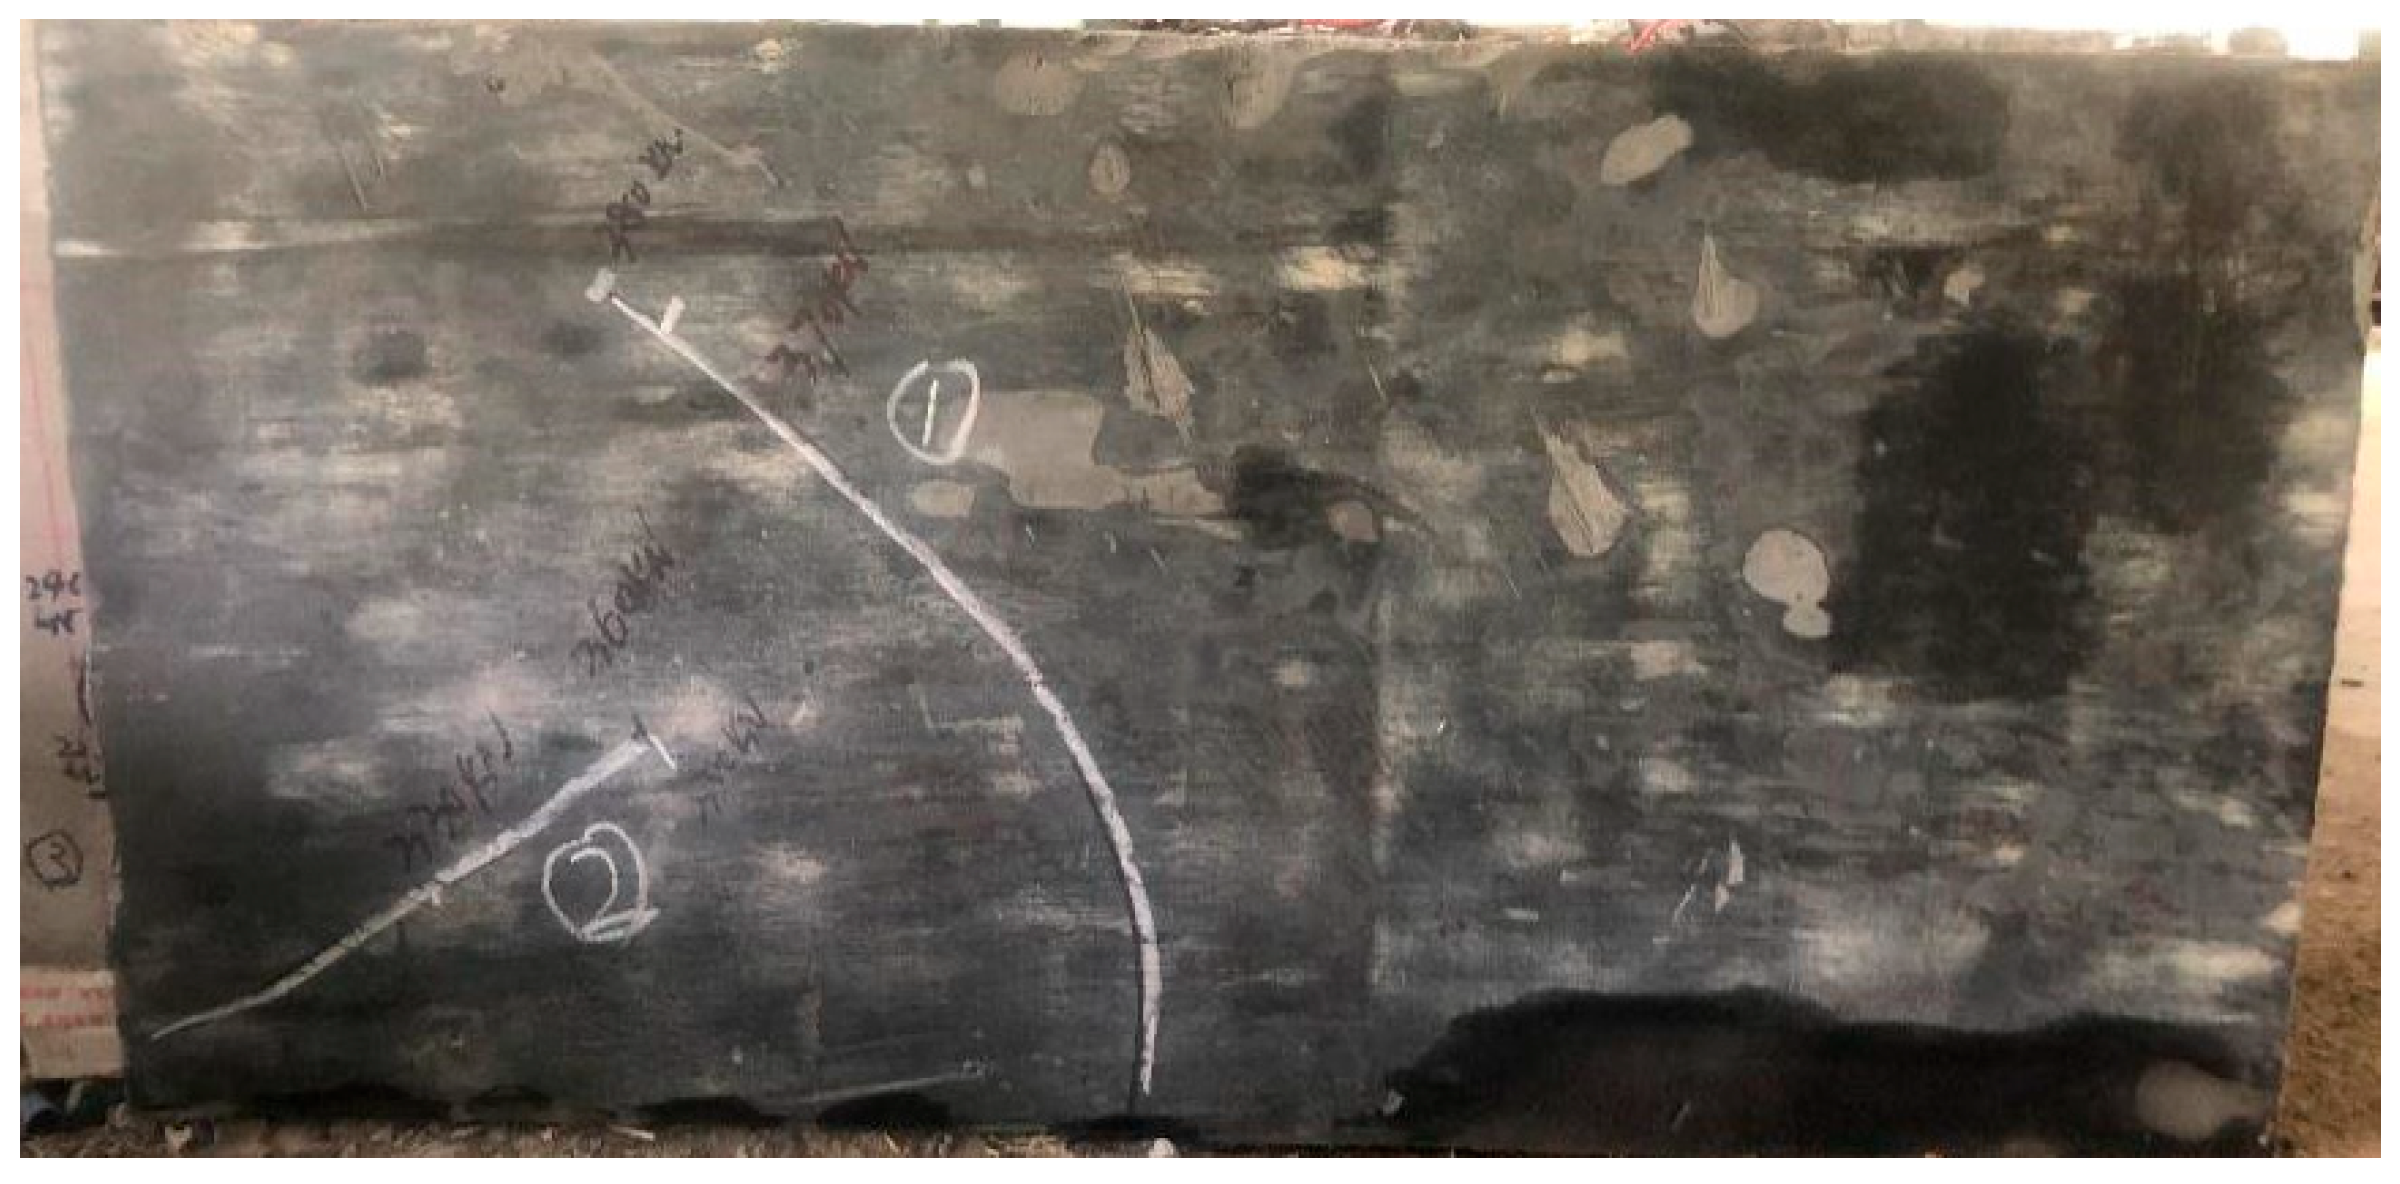
Cracks in beam CB and the strengthened beams were mainly distributed in the shear-compression zone (diagonal cracks connecting the loading point to the support) and in the vertical cracks between the midspan and the loading point. A comparison of the two crack types is presented in Table 5. Figure 16 and Figure 17 show the crack patterns of beam B1, while Figure 18 and Figure 19 show those of beam B2. According to the experimental measurements, diagonal cracks appeared in the strengthening layer when the maximum crack width at midspan exceeded 0.3 mm.
Table 5.
Initial cracking load, ultimate load, and deflection of test beams after loading.
Figure 16.
Schematic diagram of crack distribution in Beam B1.
Figure 17.
Crack distribution in the PUC of Beam B1.
Figure 18.
Schematic diagram of crack distribution in Beam B2.
Figure 19.
Crack distribution in the PUC of Beam B2.
The first cracking loads of all test beams are presented in Table 5. Owing to the improved composite action of the strengthening materials, the crack resistance of both strengthened beams was enhanced to varying degrees. The diagonal cracking load of the unstrengthened beam CB was 160 kN, while the first cracking loads of the strengthened beams B1 and B2 were 310 kN and 330 kN, respectively, representing increases of 93.75% and 106.25% compared with beam CB. When WM was embedded into the PUC, the first diagonal cracking load increased by approximately 6.5%. The ultimate load of the unstrengthened beam CB was 320 kN, while the ultimate loads of the strengthened beams B1 and B2 were 360 kN and 390 kN, respectively, corresponding to increases of 12.5% and 21.88% compared to beam CB. Compared with the PUC-strengthened beam, the ultimate load of the WM-PUC-strengthened beam was increased by 8.3%. In summary, due to the excellent ductility of the PUC material, both PUC and WM-PUC strengthening effectively increase the initial cracking load of the test beams under shear. WM-PUC strengthening outperformed PUC strengthening, primarily because the WM embedded in the PUC material provided a reinforcing effect.
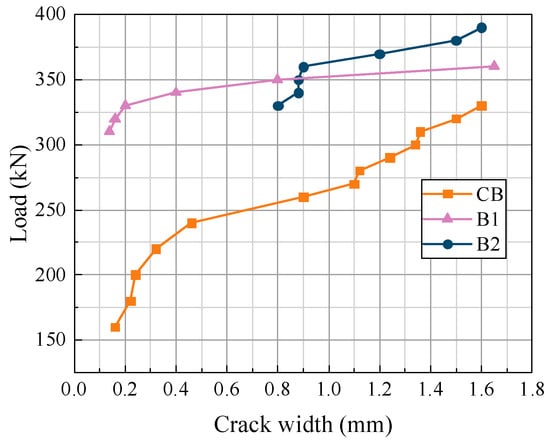
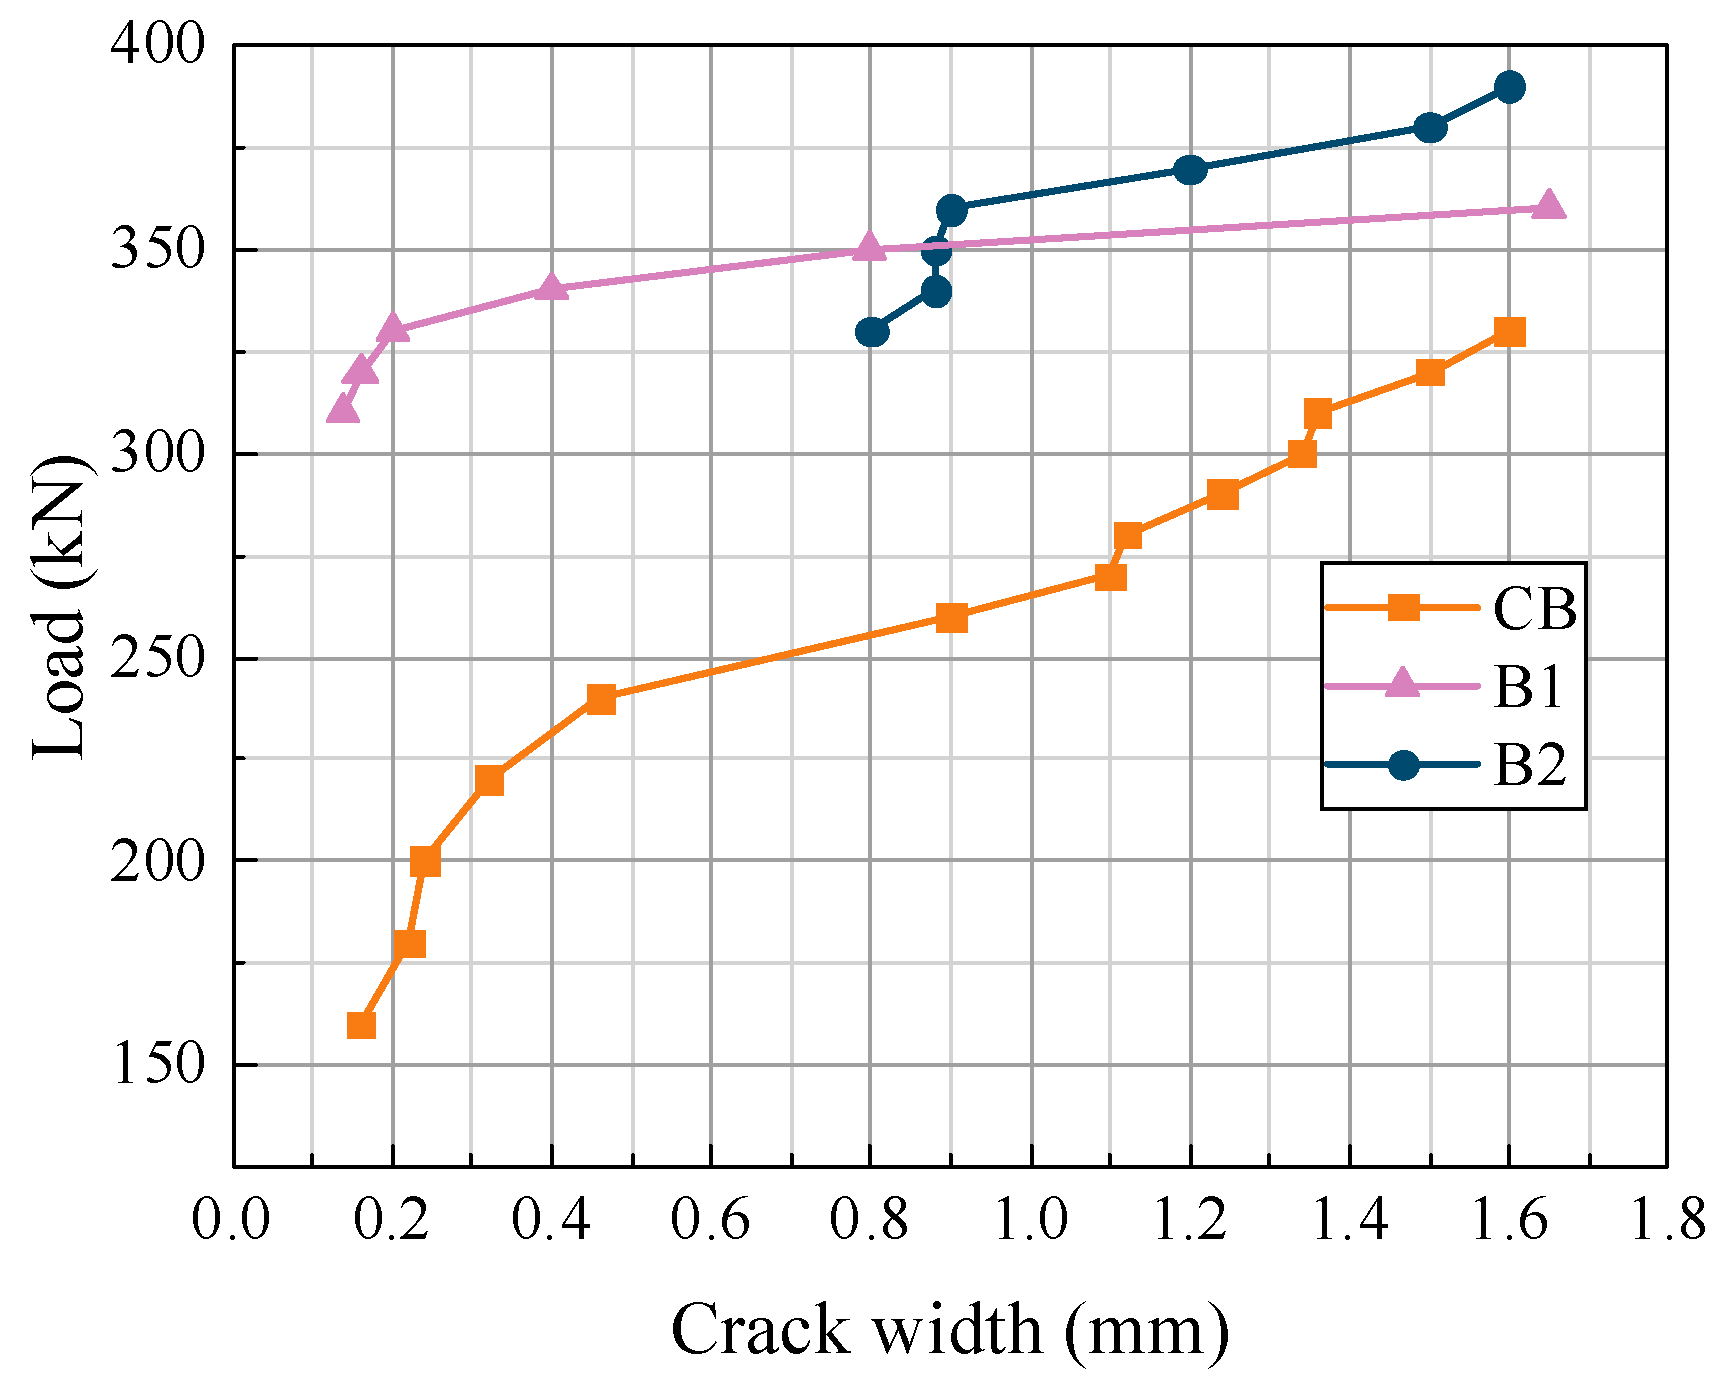
The variation curves of load with crack width in the strengthening material are shown in Figure 20. The crack width presented here corresponded to the maximum width at the intersection of the primary diagonal crack and the stirrup. Comparing the crack width development of beams CB, B1 and B2 revealed a significant difference in crack width at the initial cracking stage, with crack widths gradually increasing as the load increased during the later cracking stage. In the later loading stage, PUC strengthening exhibited a smaller initial cracking load compared to WM-PUC strengthening, and the increase in crack width became uncontrollable as the load increased. WM-PUC strengthening exhibited a larger initial cracking load, and the increase in crack width with increasing load was relatively controllable, without sudden exceedance of the crack width limit. Thus, embedding WM into PUC effectively restricted crack development.
Figure 20.
Load-crack width curves for the shear-compression zones of beams CB, B1, and B2.
4.3. Analysis of Load–Displacement Curves
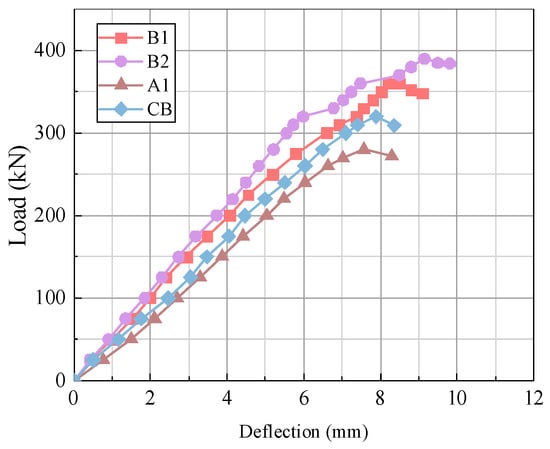
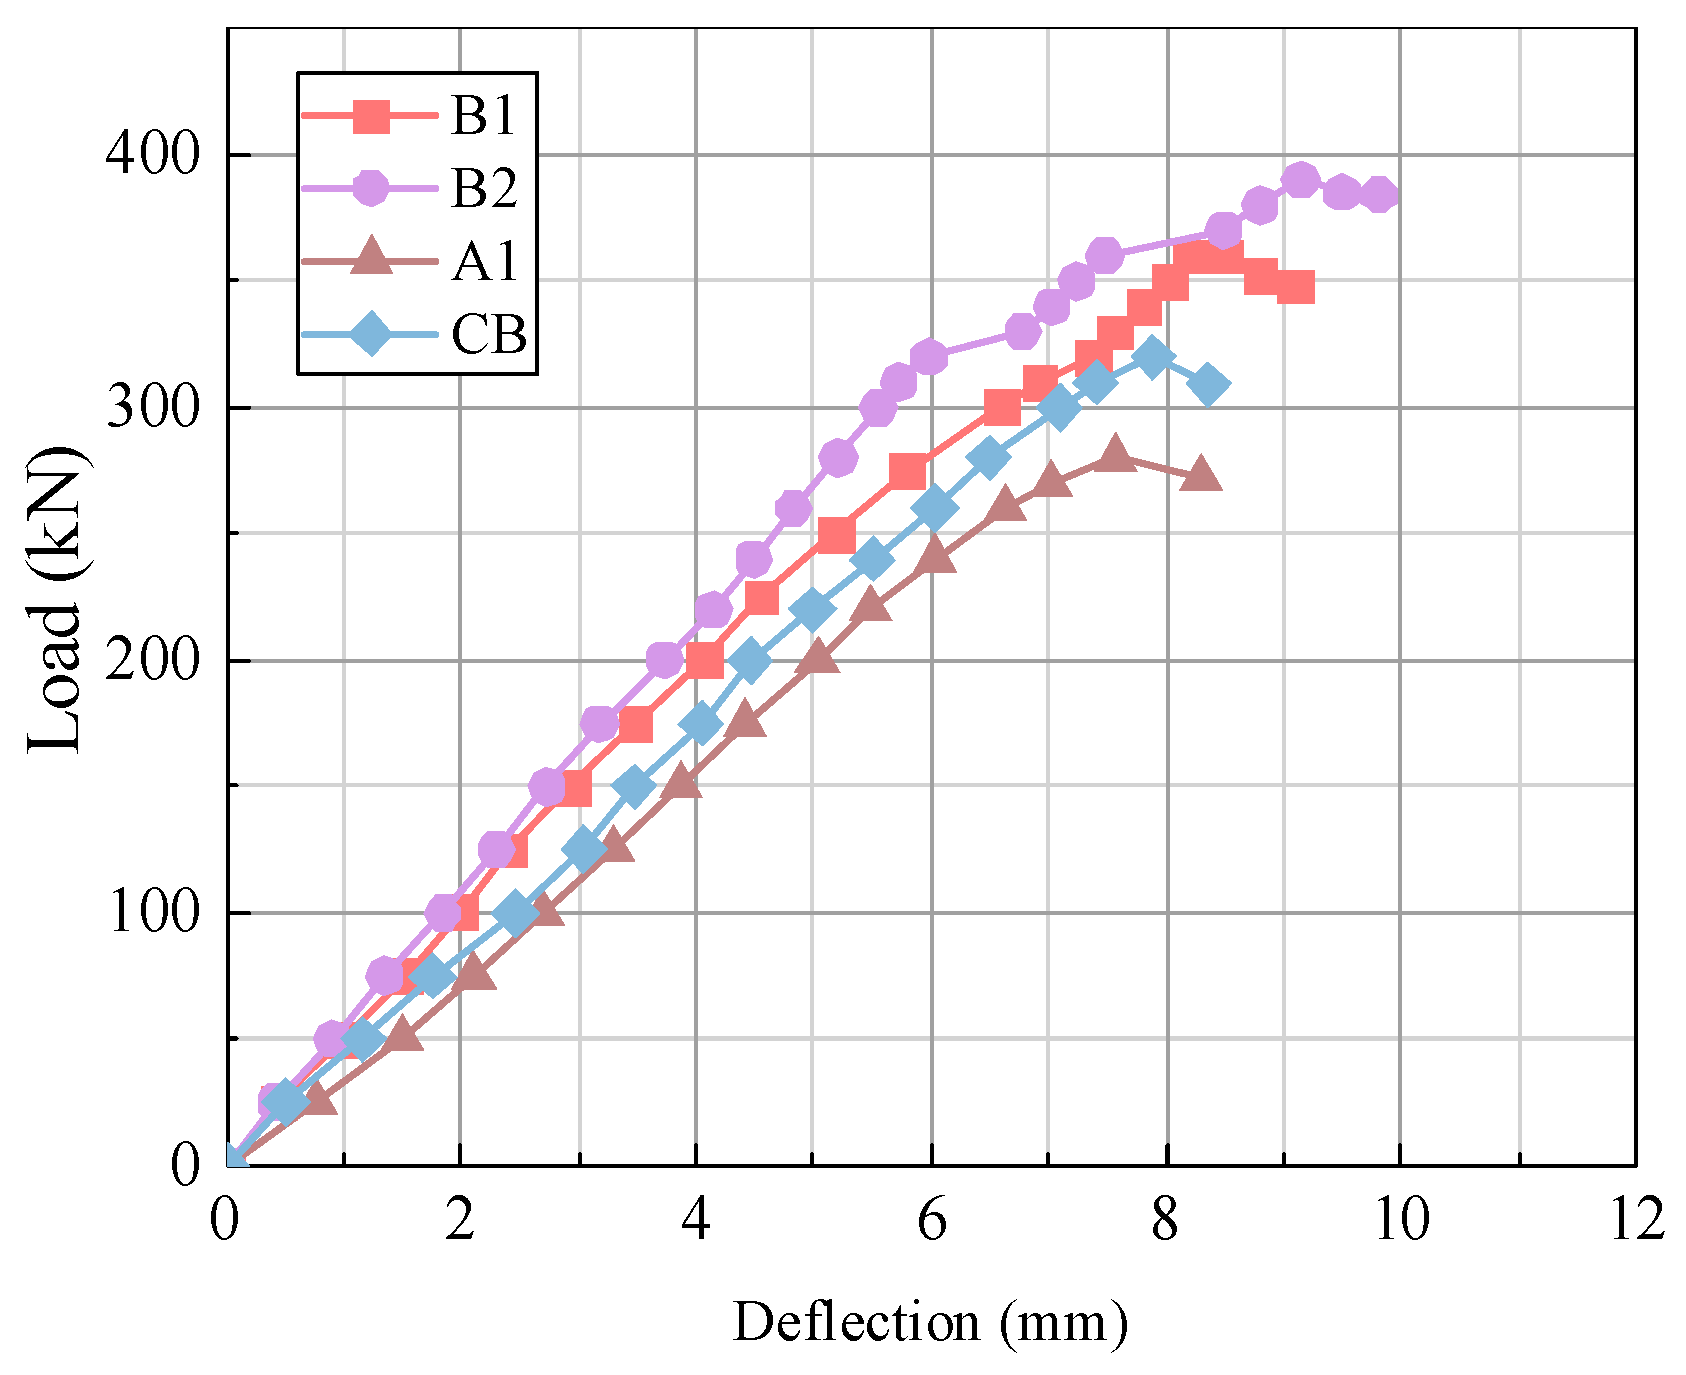
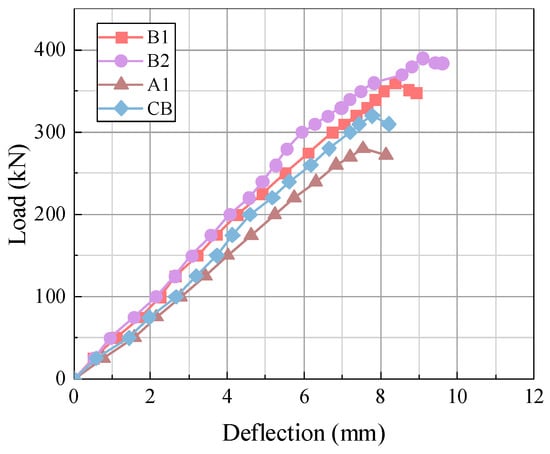
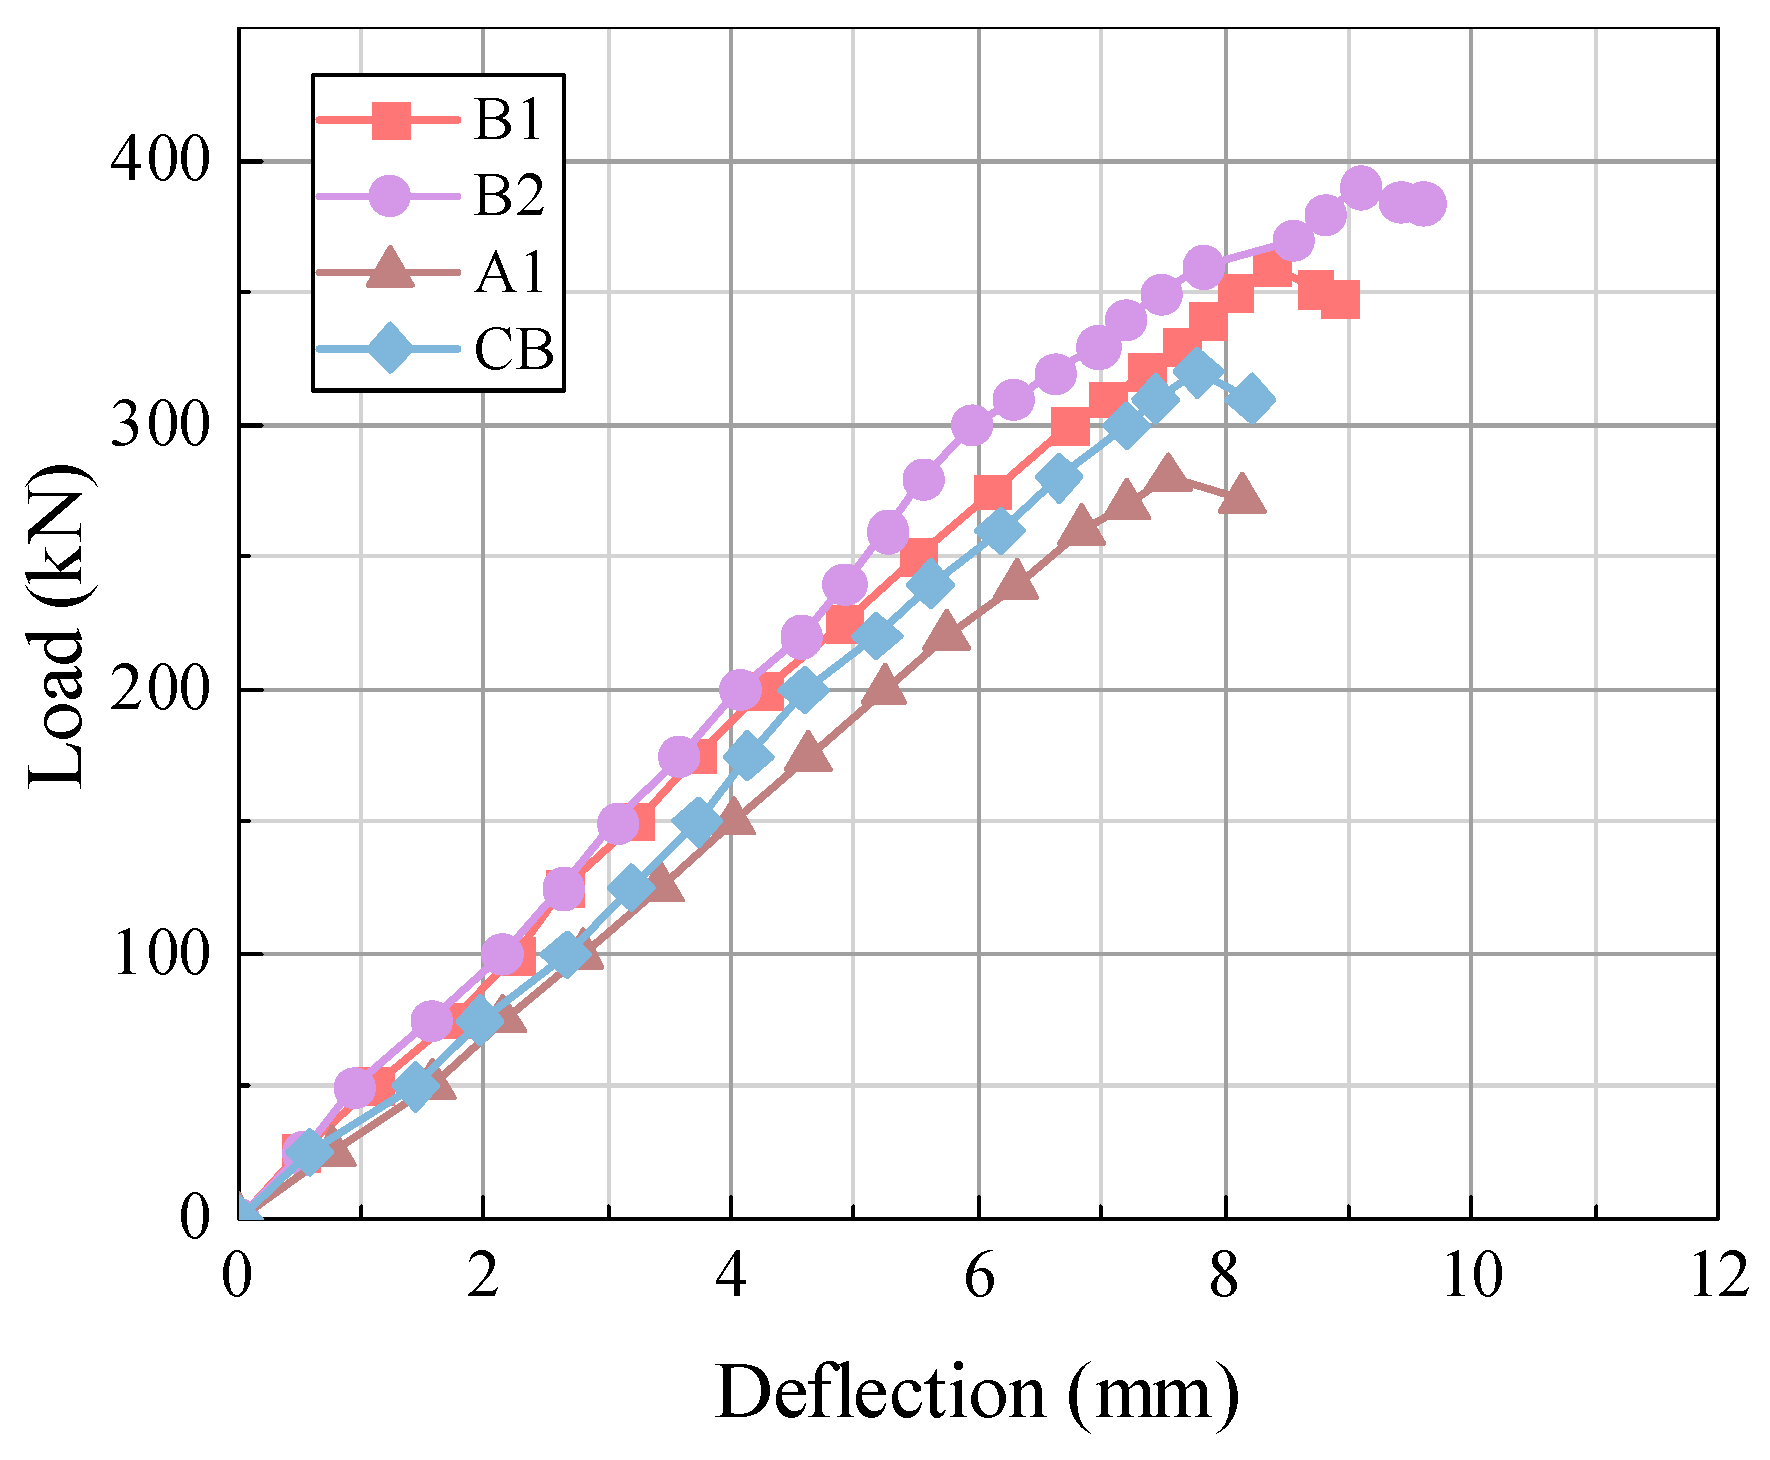
Figure 21 and Figure 22 present the load–deflection curves at the loading point and at midspan for beams CB, A1, B1, and B2. Table 5 summarizes the failure deflections of all beams. It can be observed that the deflections of the WM-PUC-strengthened beams were smaller than those of the control beam, attributed to the increased stiffness provided by the presence of the WM-PUC strengthening layer. The load–deflection curves of beams CB and A1 exhibited similar trends, while those of beams B1 and B2 also displayed comparable behavior.
Figure 21.
Deflection at the loading point of the test beam.
Figure 22.
Deflection at the midspan of the test beam.
The loading stages for beams CB and A1 are as follows: The first stage corresponded to the elastic phase, during which cracks appeared at the bottom of the concrete flexural zone, but no diagonal cracks developed in the shear-compression zone; deflection increased linearly with load. In the second stage, diagonal cracks emerged, and the slope of the load–deflection curve decreased. In the final stage, deflection continued to increase until failure, even without a further increase in load.
For beams B1 and B2, which were strengthened with PUC and WM-PUC, respectively, no debonding between the strengthening material and the concrete was observed during the test. The loading stages for beams B1 and B2 are as follows: The first stage was characterized by elastic behavior; cracks appeared at the bottom of the concrete flexural zone, while no diagonal cracks developed in the strengthening layer within the shear-compression zone, and deflection increased linearly with load. In the second stage, diagonal cracks appeared, accompanied by a sudden increase in deflection at the loading point. In the final stage, deflection continued to increase until failure without further load increase.
4.4. Load–Strain Analysis
Strain gauge sensors were attached to the outer surface of the PUC material in the shear-compression zone. The measurement points from the loading point to the support were numbered 1 to 9, as shown in Figure 14. The reinforcement strains, including those of the tensile main reinforcement and stirrups in the shear-compression zone, were measured at 14 points, as illustrated in Figure 15. Due to damage to the strain gauges caused by yielding of the reinforcement or cracking of the PUC surface, it was not possible to continuously record the failure strains of the reinforcement and PUC during the test.
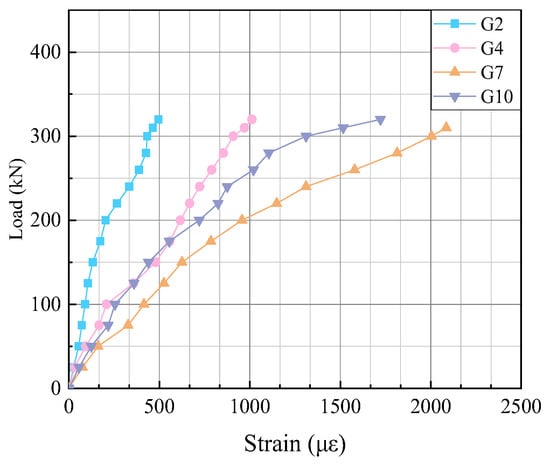
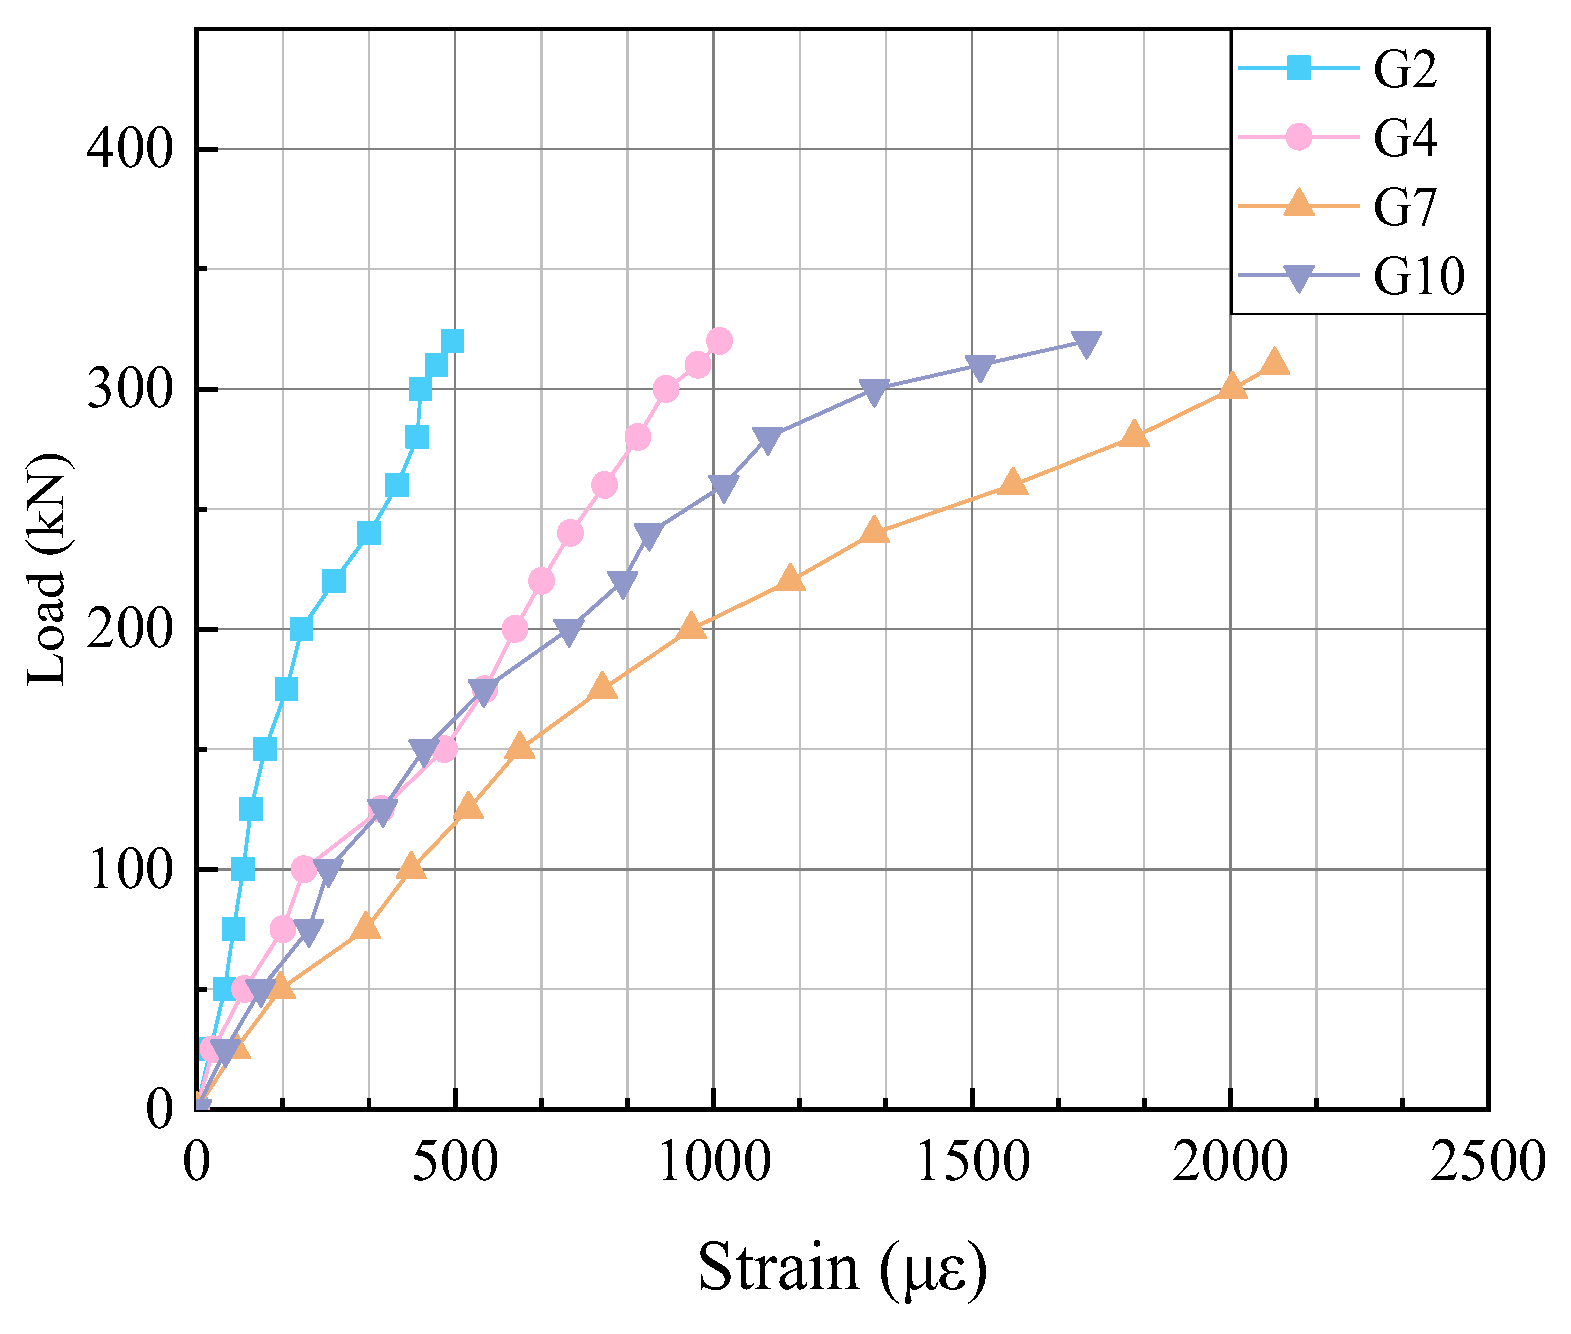
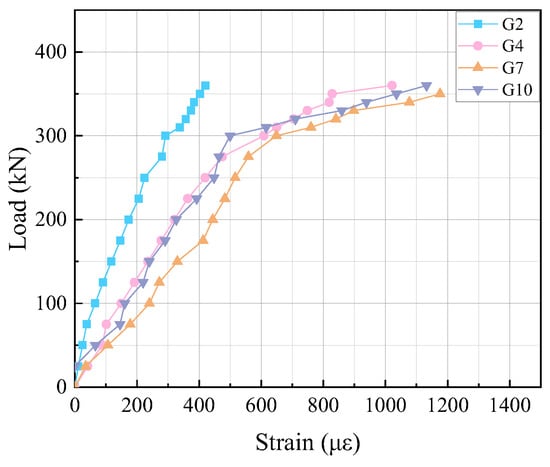
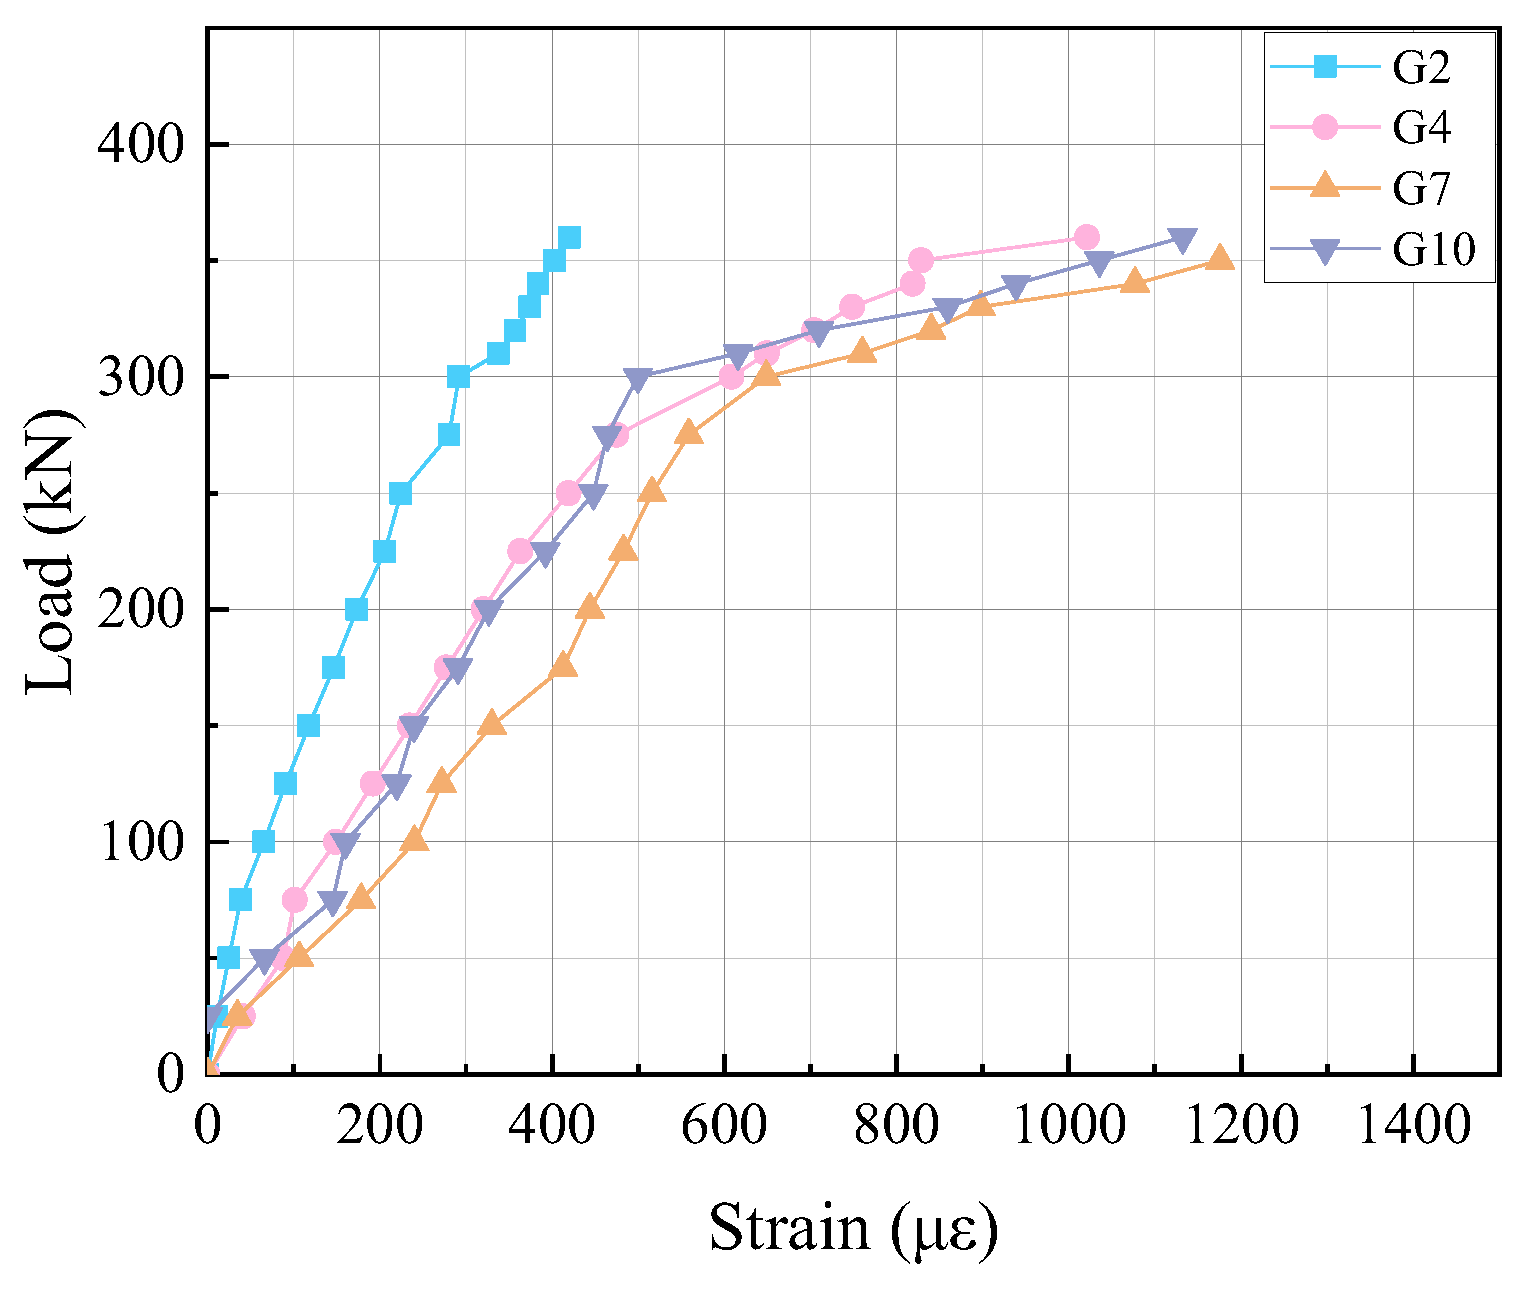
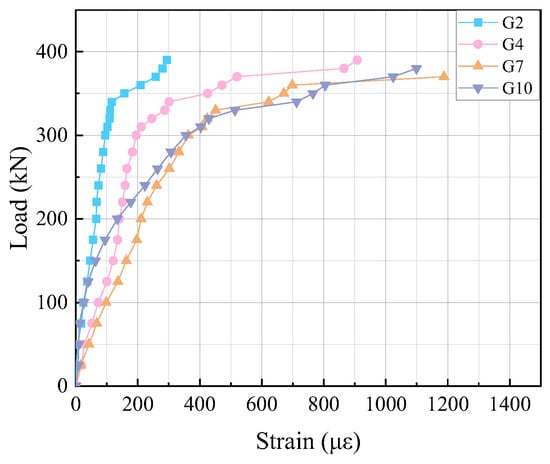
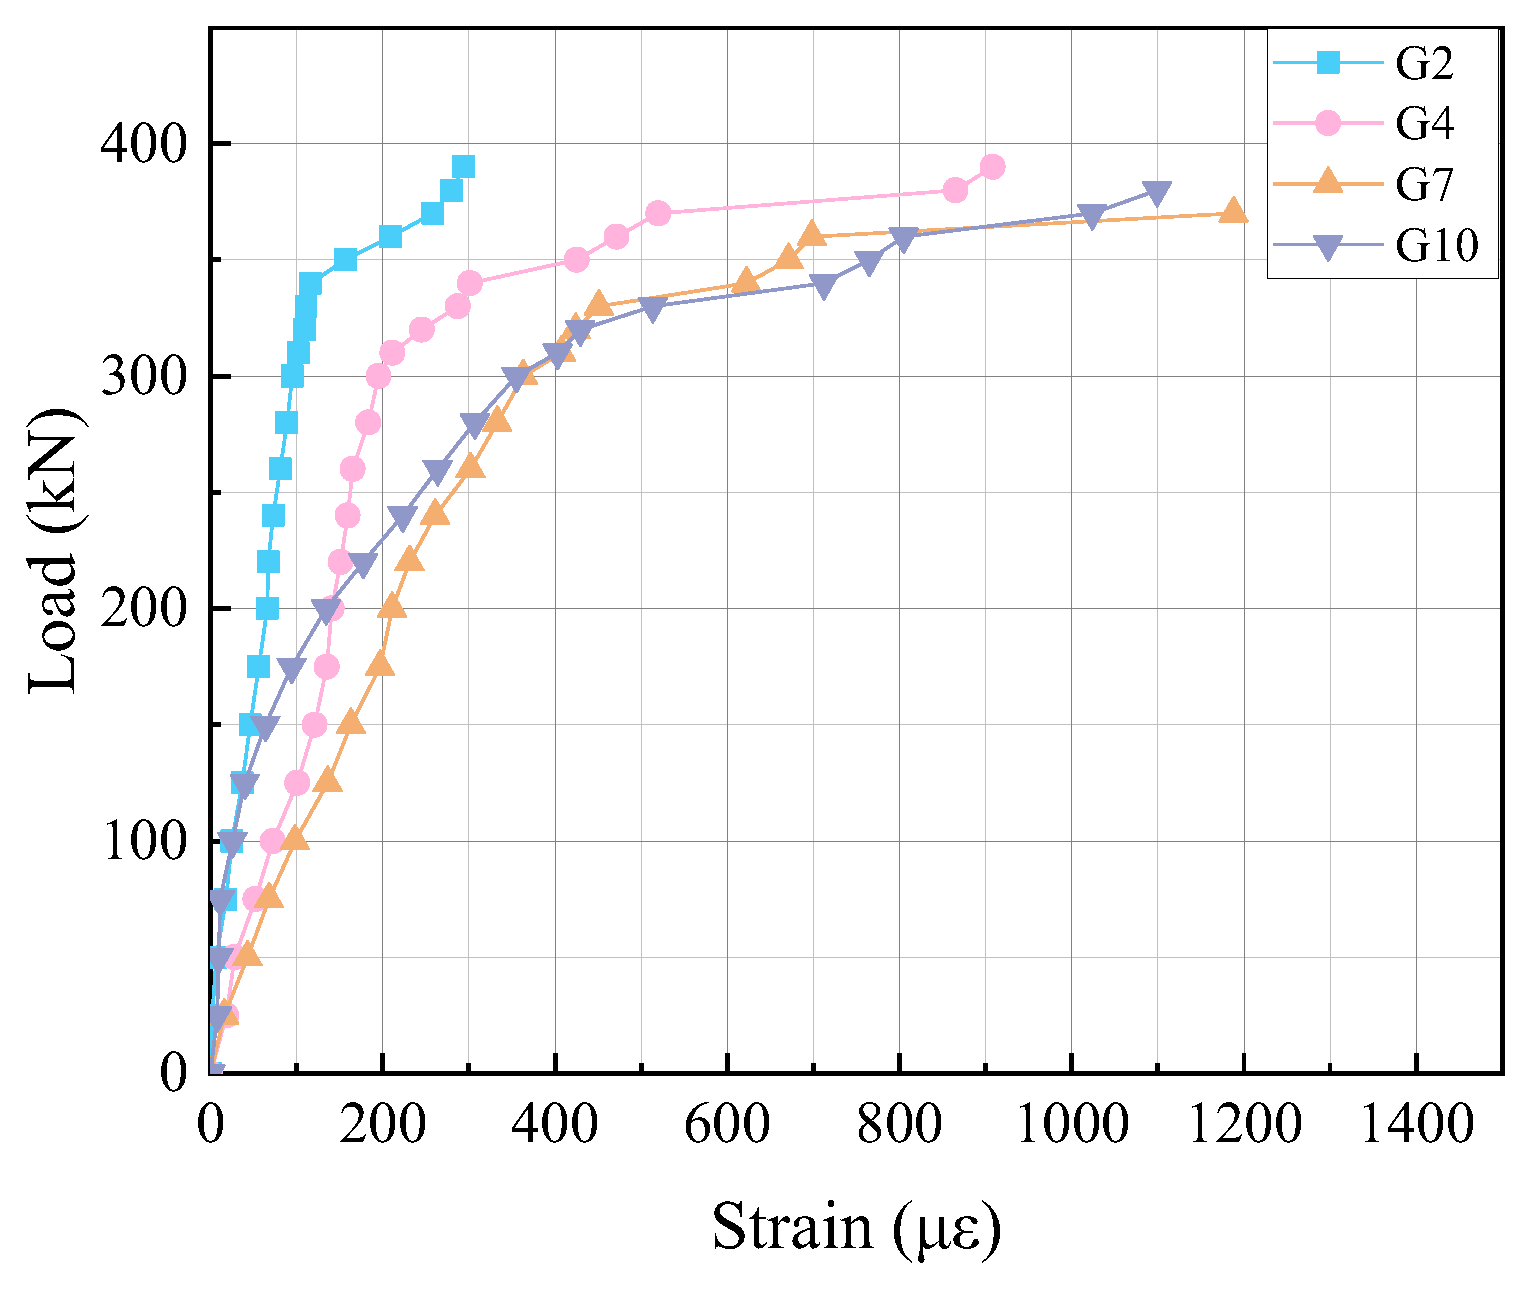
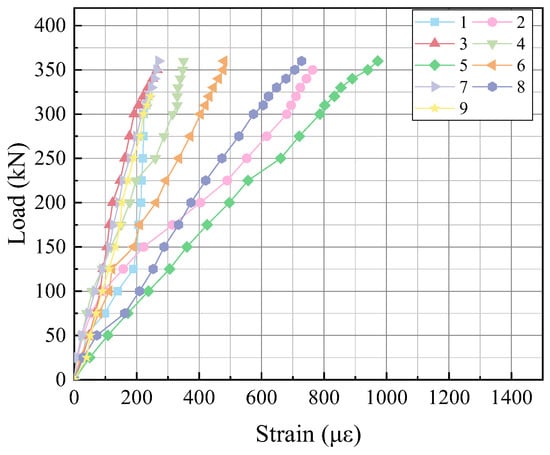
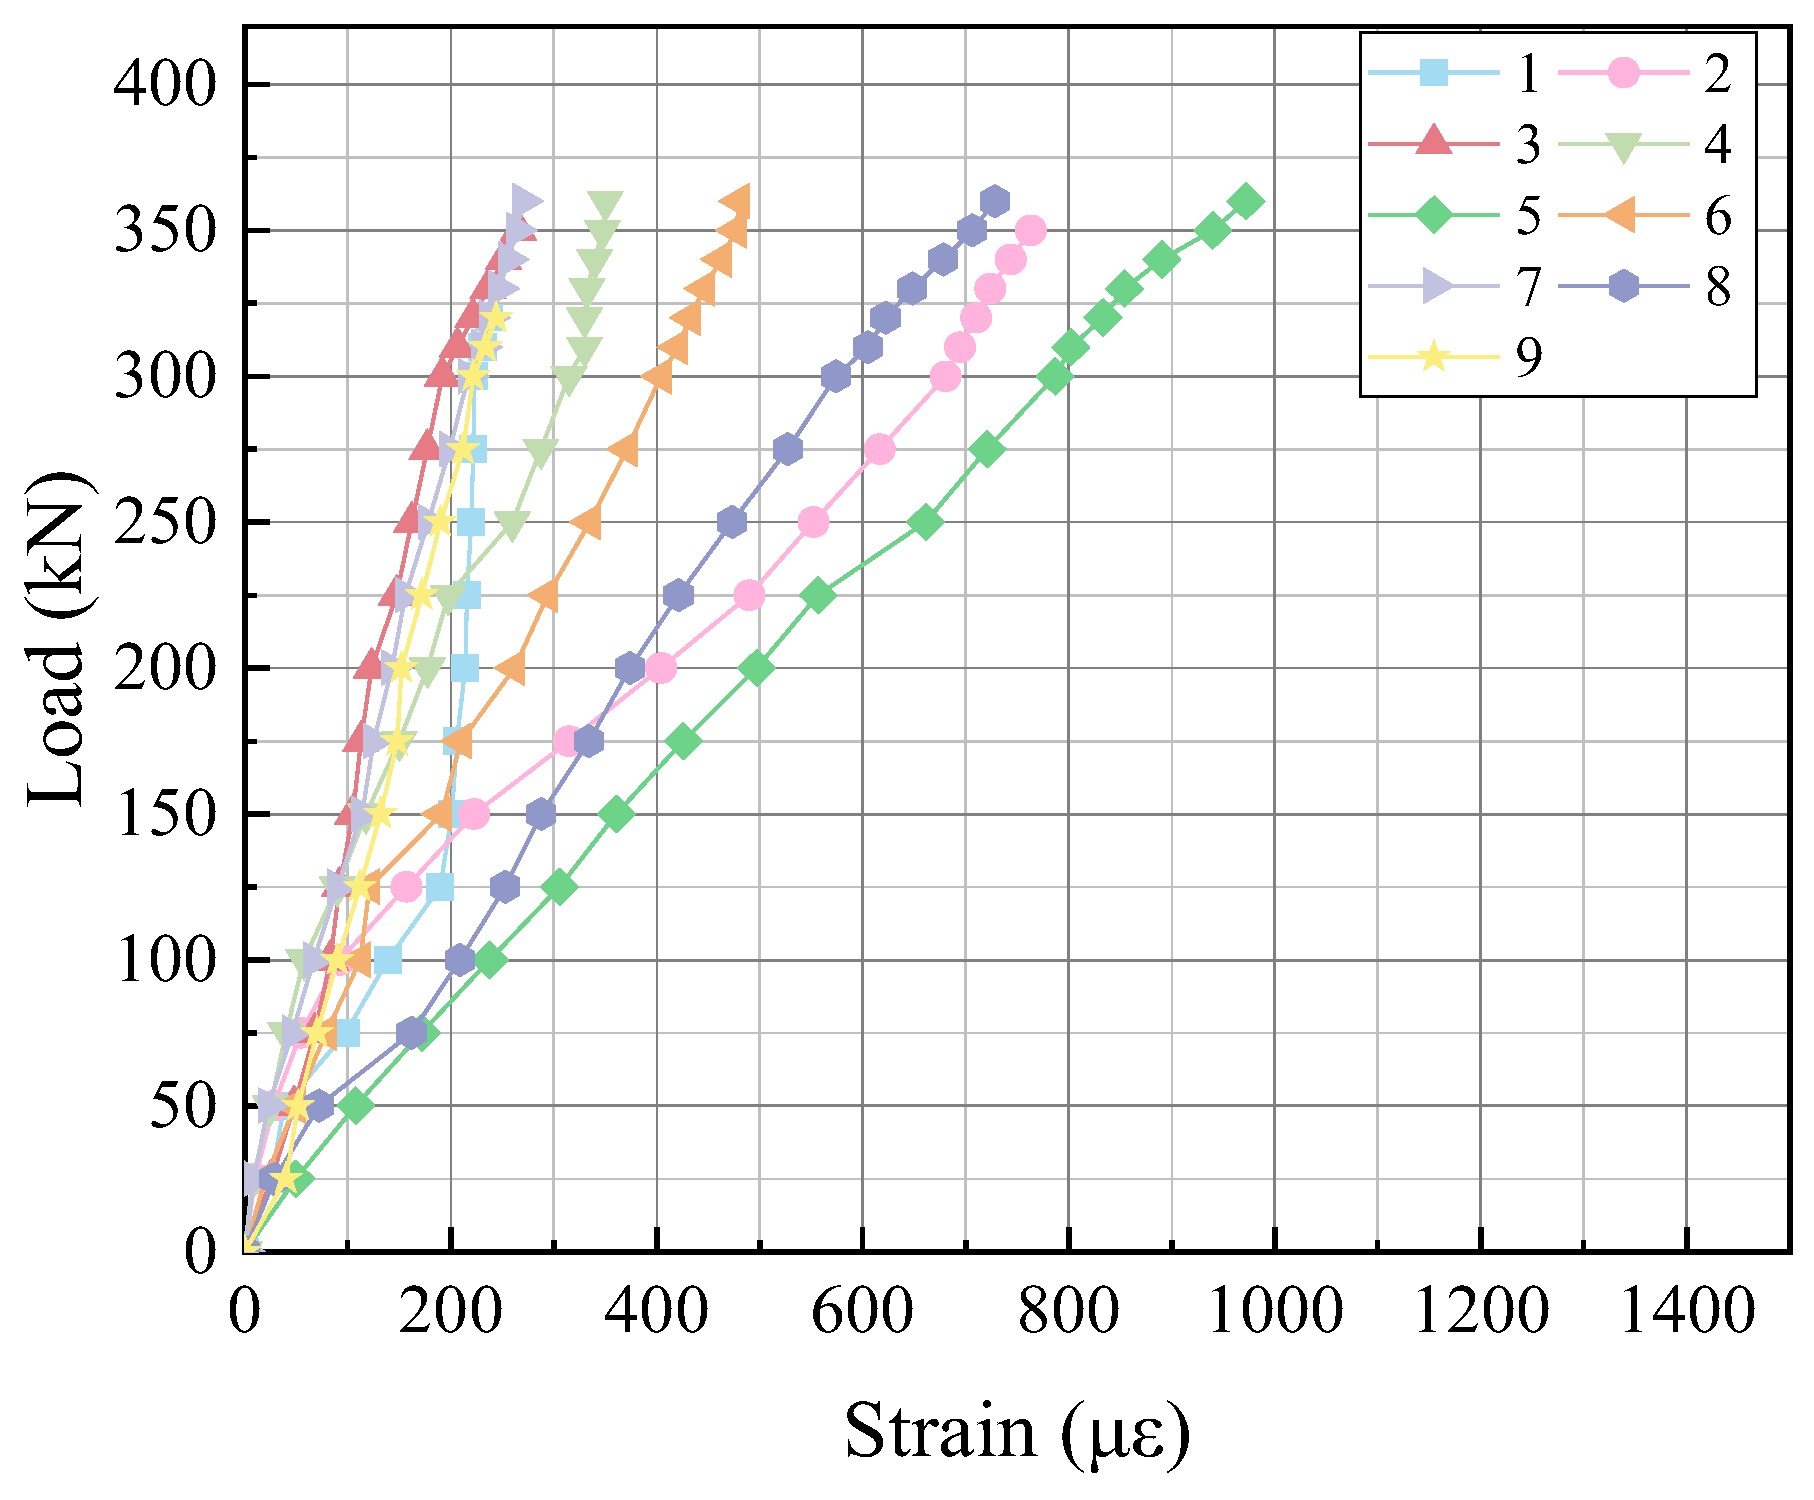
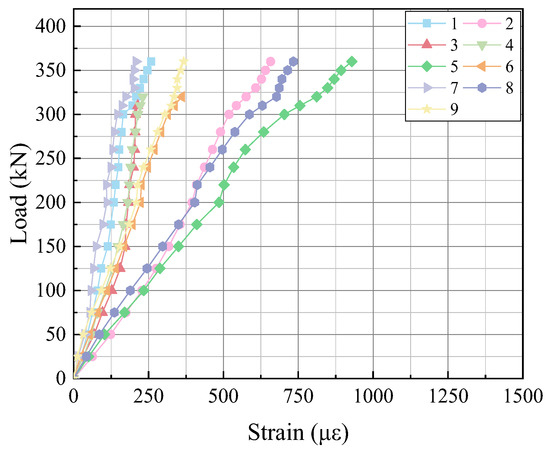
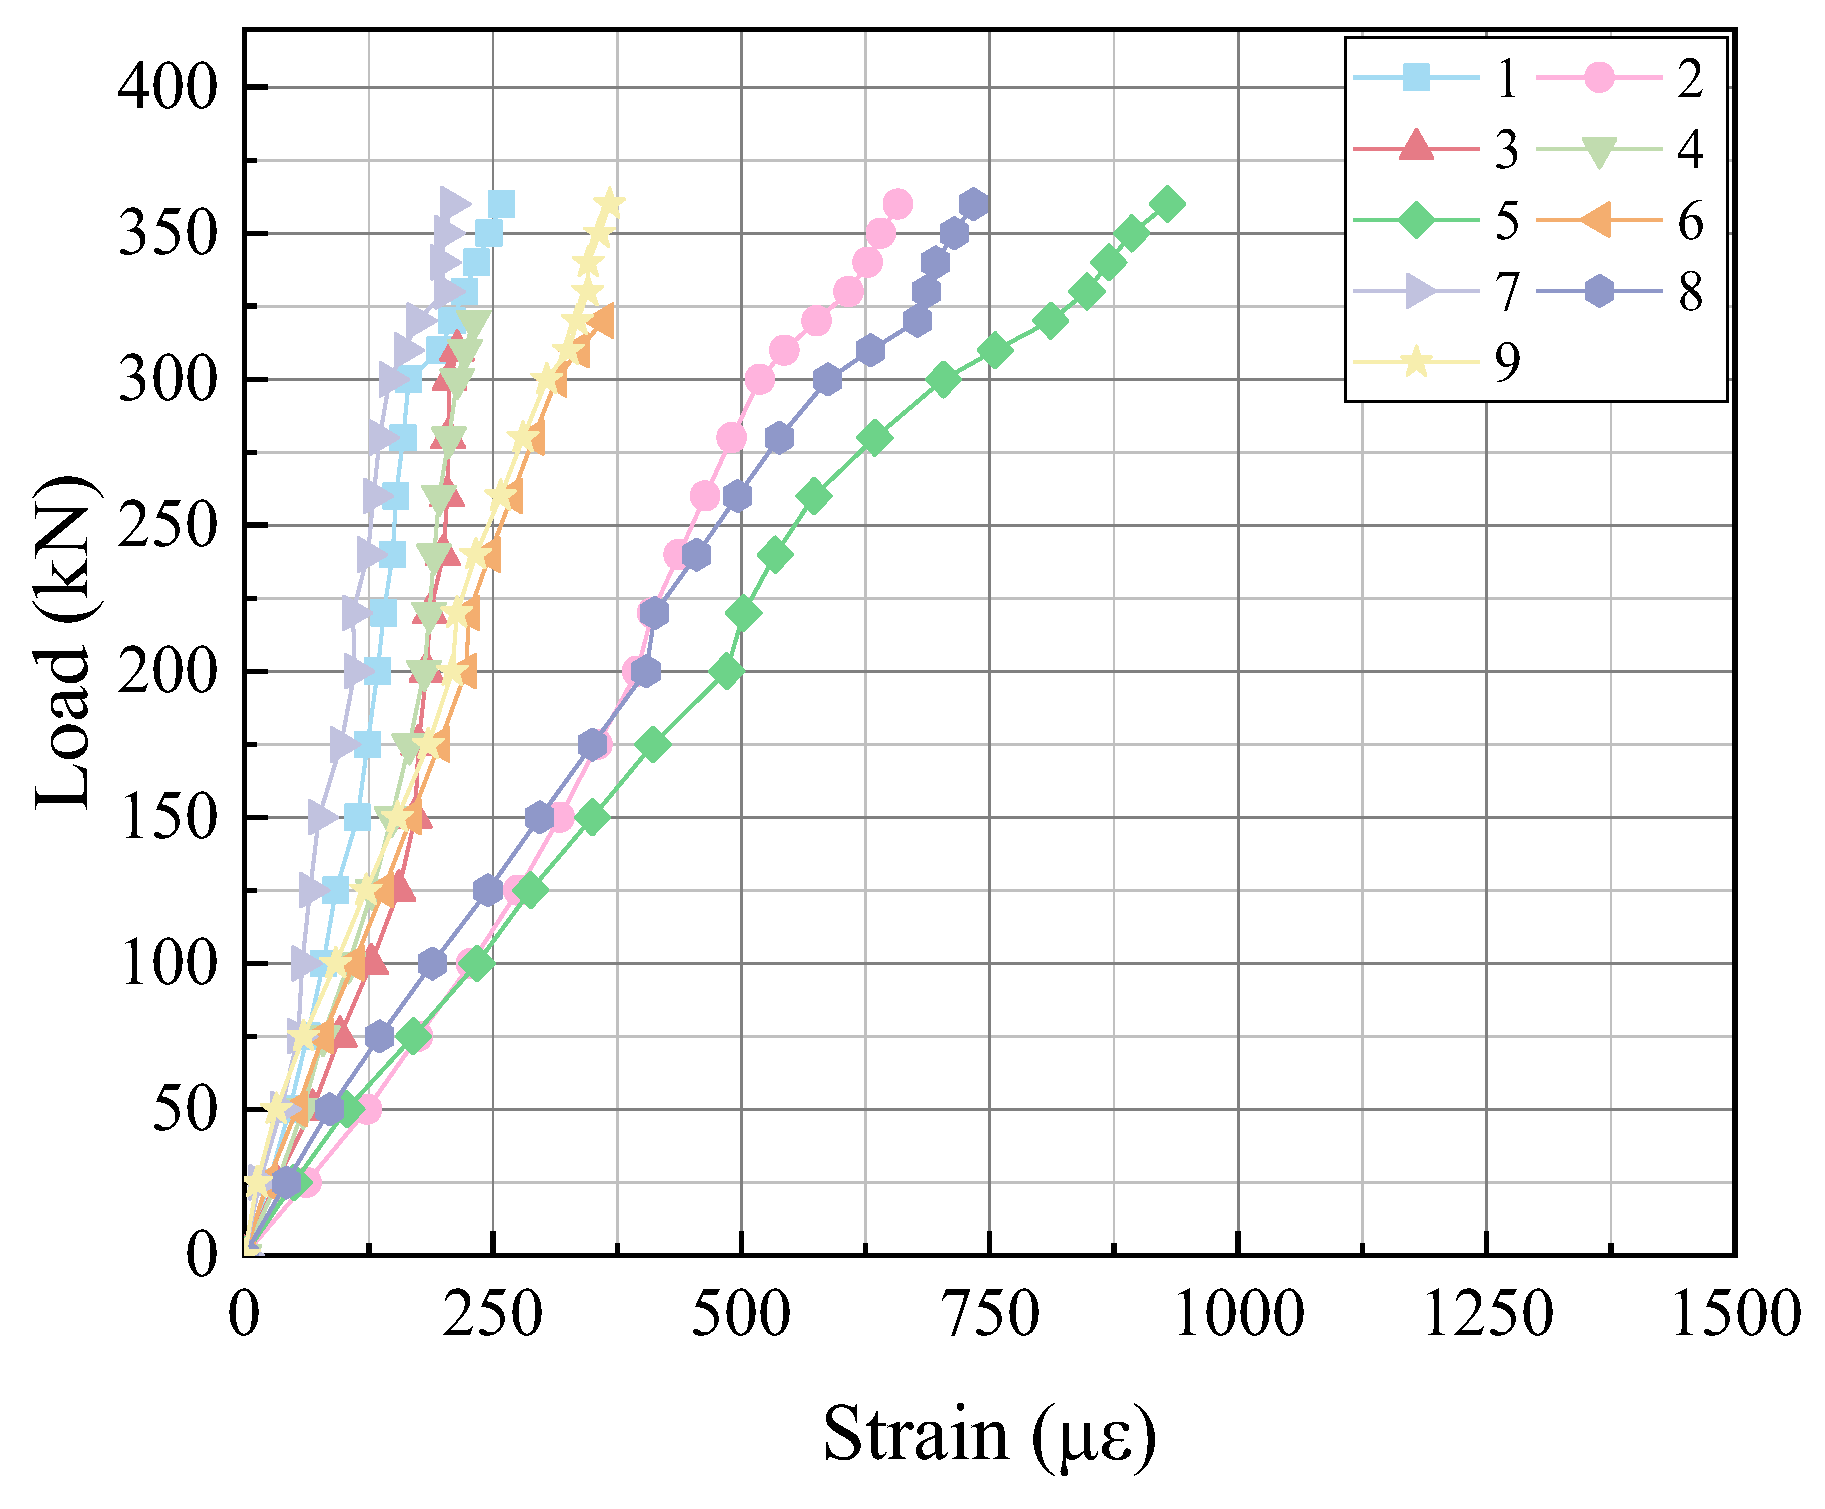
Figure 23, Figure 24 and Figure 25 show the strains at measurement points G2, G4, G7, and G10 for beams CB, B1, and B2, respectively. These four points correspond to four different stirrups in the shear-compression zone. By comparing the stirrup strains in the shear-compression zone of beams CB, B1, and B2, it is evident that the stirrup strains in the strengthened beams were significantly lower than those in beam CB. This is mainly because the PUC strengthening layer provided a reinforcing effect to the concrete in the shear-compression zone, sharing a portion of the shear force, thereby reducing the shear force carried by the stirrups and consequently lowering their strains. However, as diagonal cracks developed and propagated in the strengthening layer, the growth rate of stirrup strain gradually increased. Under the same load level, the stirrup strains in beam B2 were also lower than those in beam B1, indicating that the embedding of the WM had a restraining effect on the stirrup strain in the shear-compression zone.
Figure 23.
Load–strain relationship of the stirrups in a CB beam.
Figure 24.
Load–strain relationship of the stirrups in the B1 beam.
Figure 25.
Load–strain relationship of the stirrups in the B2 beam.
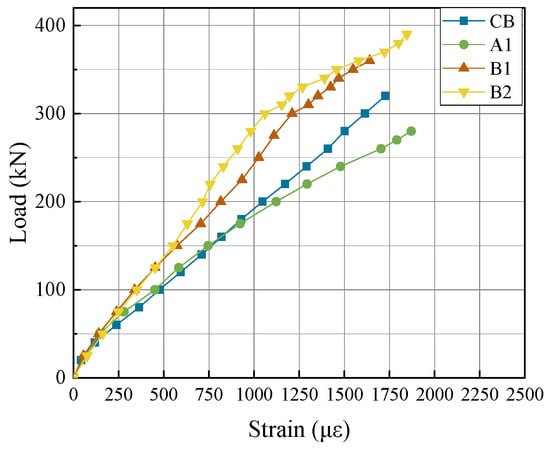
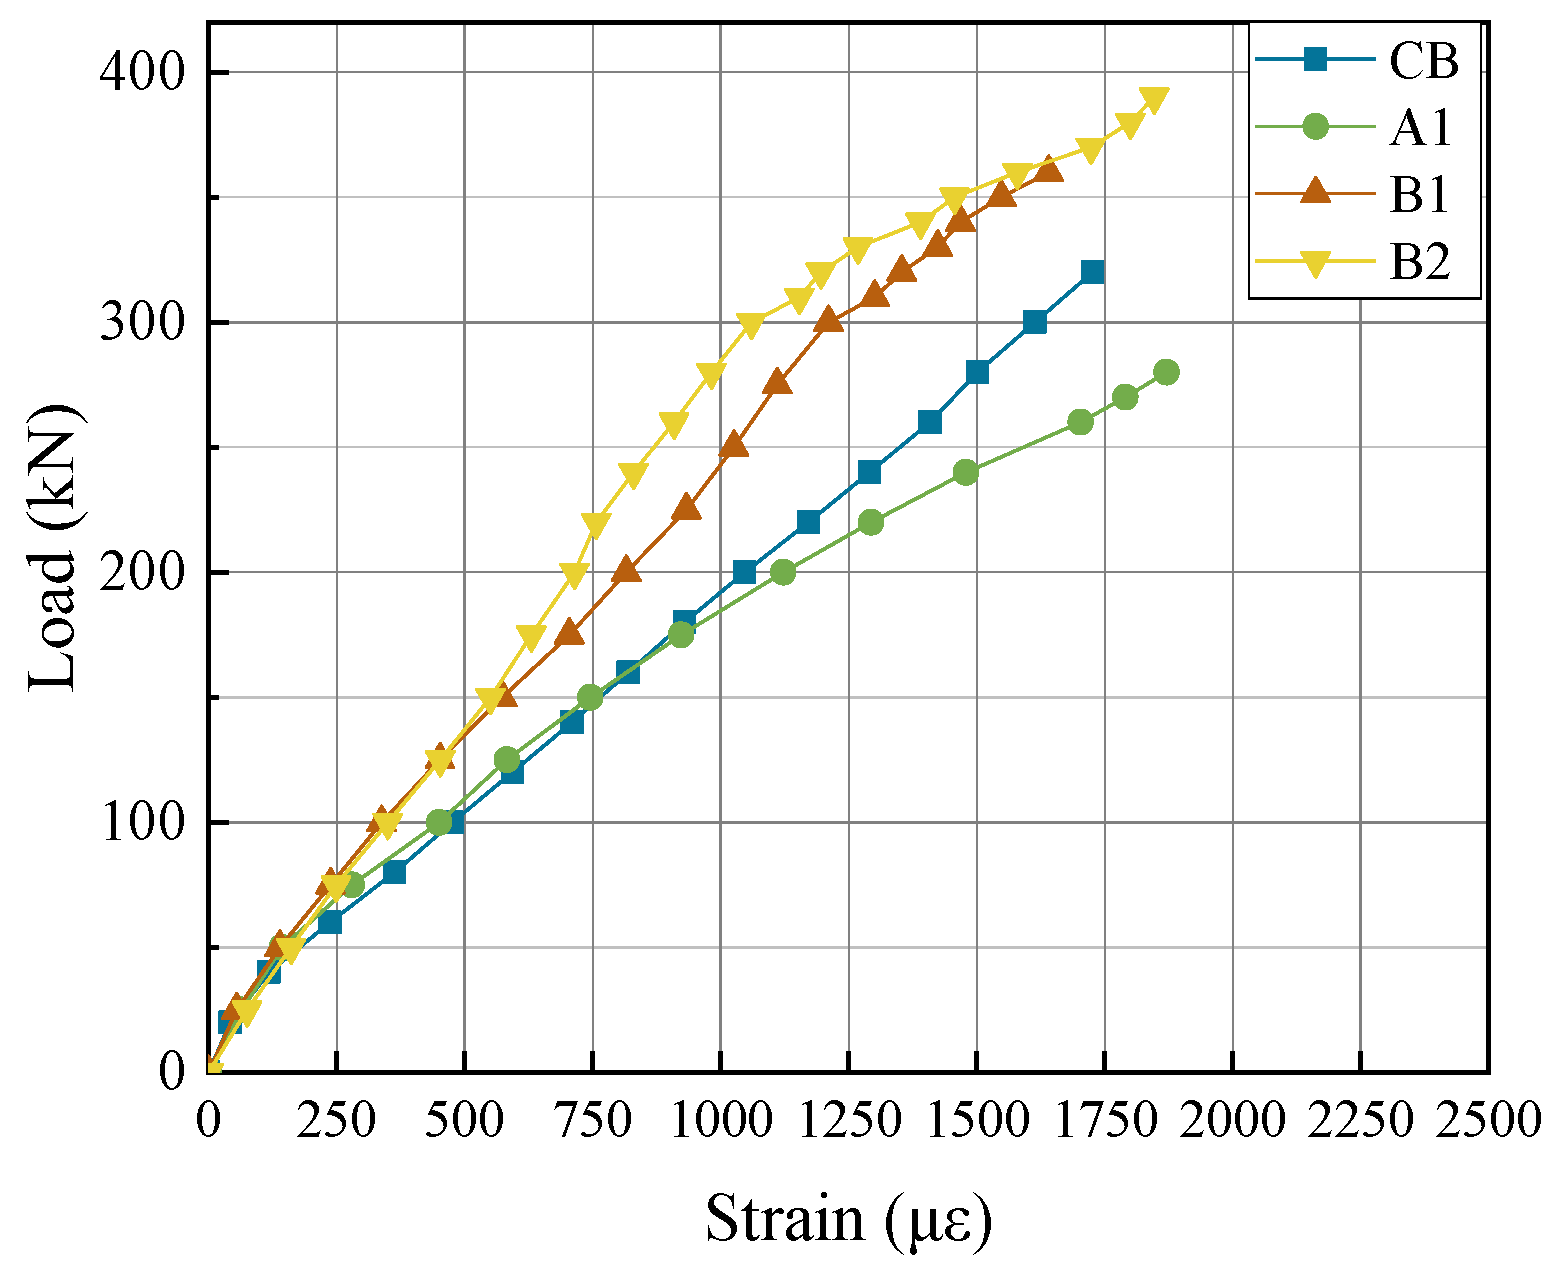
After comparing the strains at the four measurement points on the longitudinal tensile reinforcement, the location with the maximum strain, point Z3, was selected for further analysis. Figure 26 compares the strains at point Z3 for the four specimens. It can be observed that the strain in the main reinforcement of the unstrengthened beam was almost linear, indicating that after damage, the concrete contributed little to the longitudinal tensile stress, with the majority of the tensile stress being concentrated in the main reinforcement. In contrast, for the beams strengthened with PUC and WM-PUC, the strain curves were linear before cracking of the PUC material; after cracking, the strain growth rate gradually accelerated. This suggests that the PUC material, owing to its good ductility, shared a portion of the longitudinal tensile stress. Comparing the main reinforcement strains of the beams strengthened with PUC and WM-PUC, it can be seen that the embedding of the WM did not significantly affect the strain in the main reinforcement.
Figure 26.
Load–strain relationship at measurement point Z3 of the longitudinal reinforcement.
Figure 27 and Figure 28 present the surface strains of the PUC material for beams B1 and B2, respectively. From the load–strain curves, it can be observed that the strain variations at measurement points 2, 5, and 8 are pronounced. These three points were all arranged perpendicular to the diagonal direction of the shear-compression zone, indicating that the principal strain direction is perpendicular to the diagonal of the shear-compression zone. Moreover, under the same load level, the principal surface strains of the PUC material in beam B1 were greater than those in beam B2, suggesting that embedding the WM into the PUC effectively reduced the surface strain of the PUC material.
Figure 27.
Surface strain of the PUC in the B1 beam.
Figure 28.
Surface strain measured by PUC on the B2 beam.
5. Finite Element Analysis
5.1. Constitutive Models of Materials
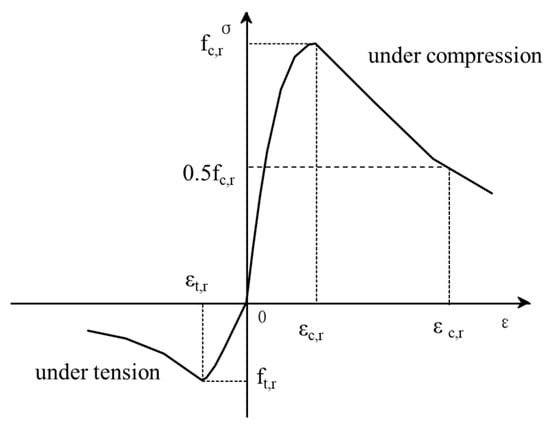
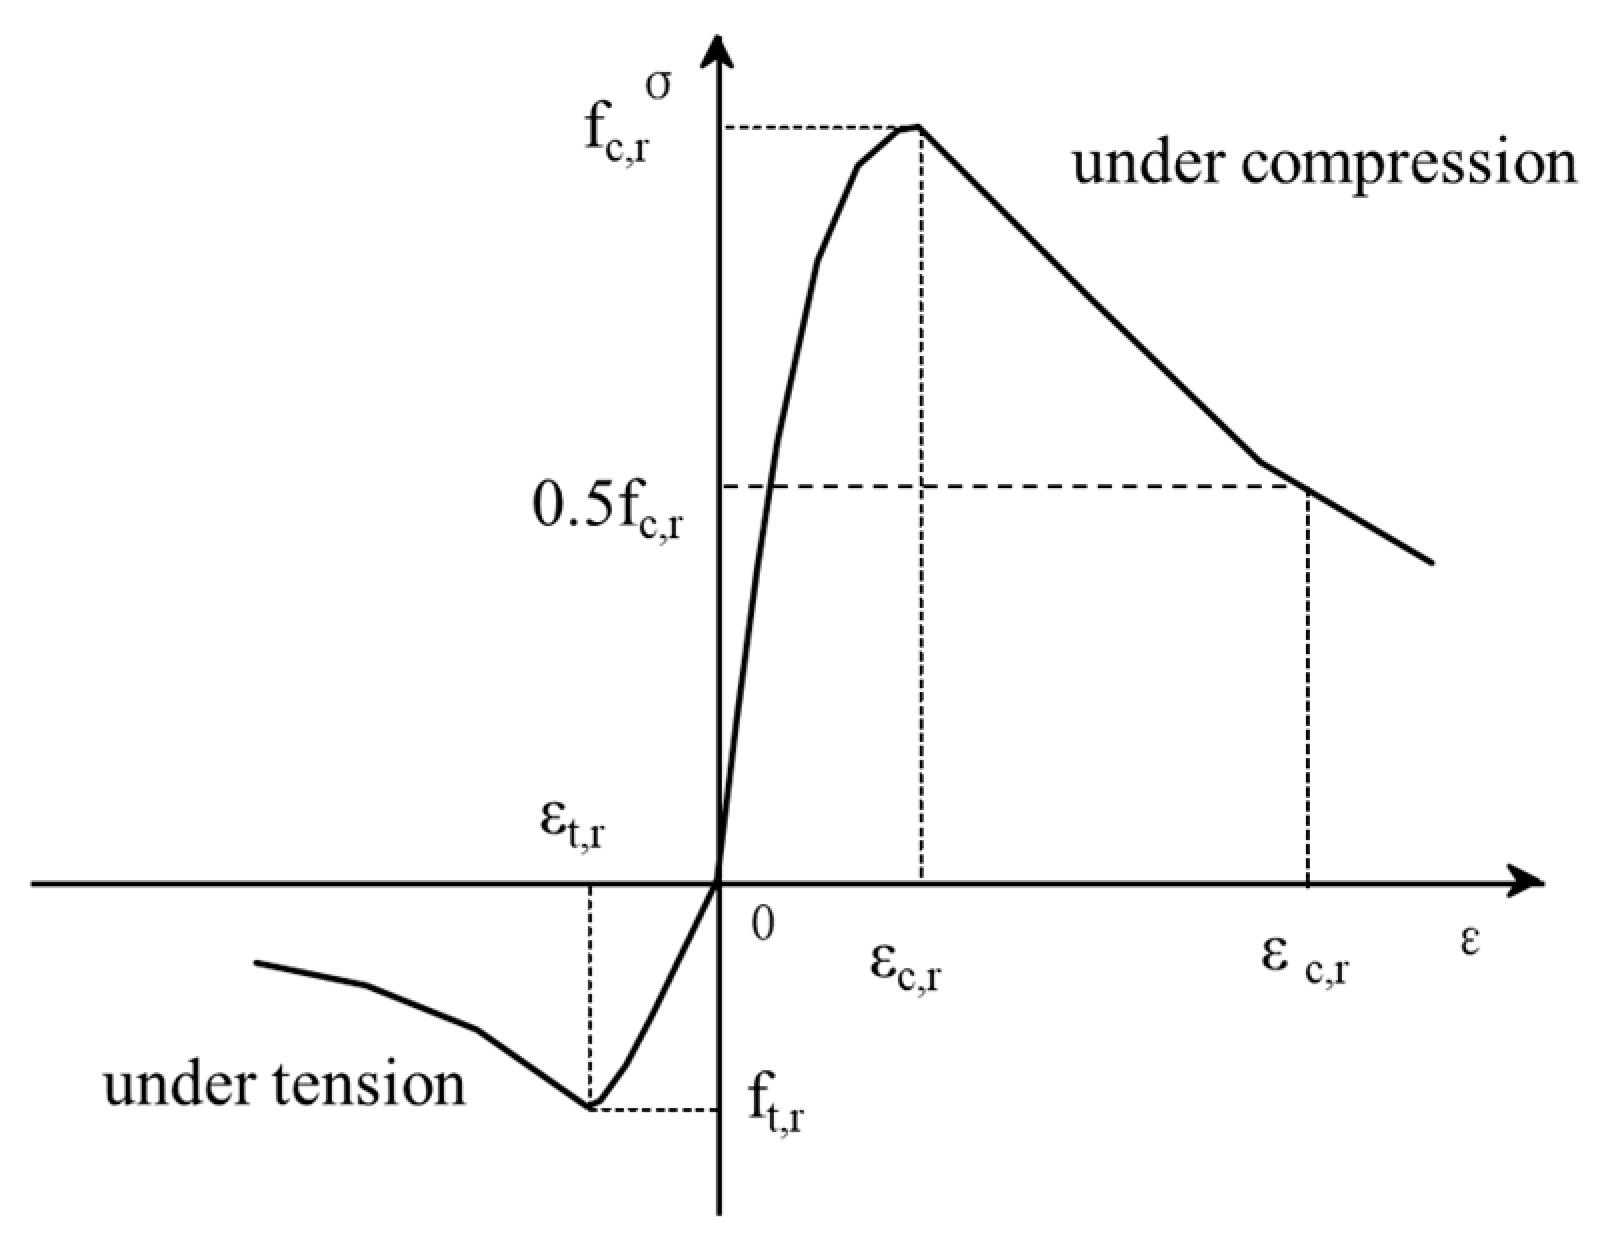
The constitutive model for concrete was based on the experimental results. The stress–strain relationship specified in the code GB 50010-2010 [47] was adopted as the stress–strain relationship for the plastic damage model [48], as shown in Figure 29. The values of Poisson’s ratio ν, elastic modulus, flow potential eccentricity ε, dilation angle φ, ratio of biaxial to uniaxial ultimate compressive strength σb0/σc0, viscosity coefficient μ, and Kc are presented in Table 6.
Figure 29.
Stress–strain model for concrete under tension and compression.
Table 6.
Correlation coefficients for concrete damage models.
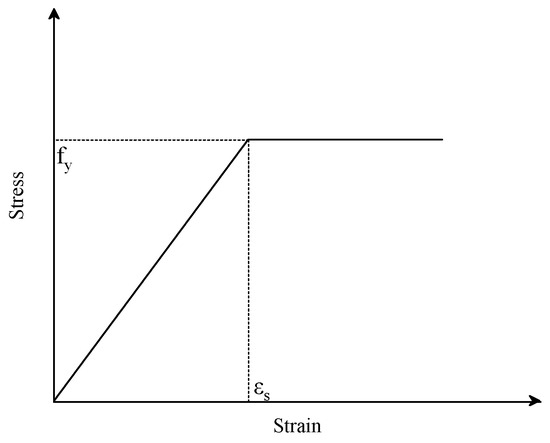
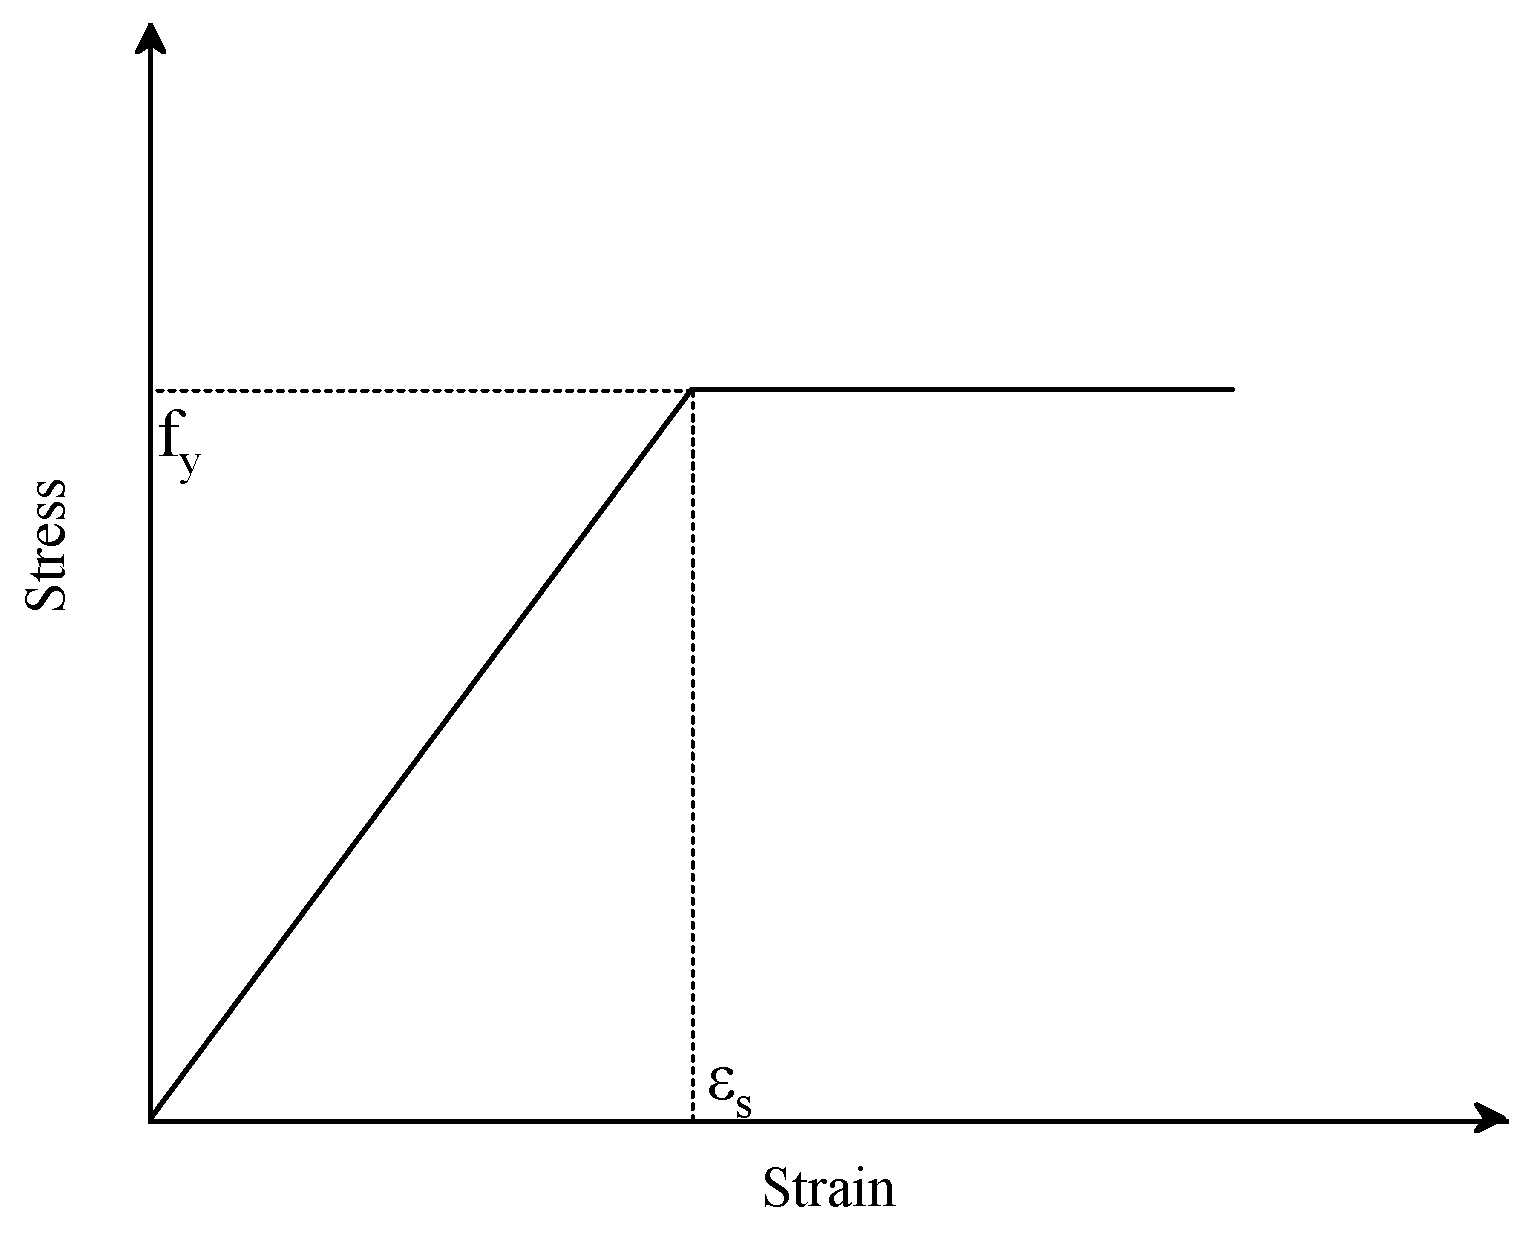
An idealized constitutive model was adopted for the steel reinforcement. The model was defined by the elastic modulus Es, yield stress fy, and Poisson’s ratio ν of the reinforcement. The reinforcement was assumed to exhibit ideal elastic–plastic behavior, as shown in Figure 30, with linear elastic parameters determined based on experimental results. The relevant parameters of the reinforcement used in the model are presented in Table 7. The properties of the WM model were defined by its elastic modulus EWM and yield stress fyWM, as listed in Table 2. Perfect bonding was assumed between the WM and the PUC, with no slip occurring. The WM was assumed to follow an ideal linear model, as shown in Figure 30, with linear elastic parameters derived from experimental results.
Figure 30.
Tensile constitutive model for reinforcing bars and WM.
Table 7.
Parameters and mechanical properties of reinforcement.
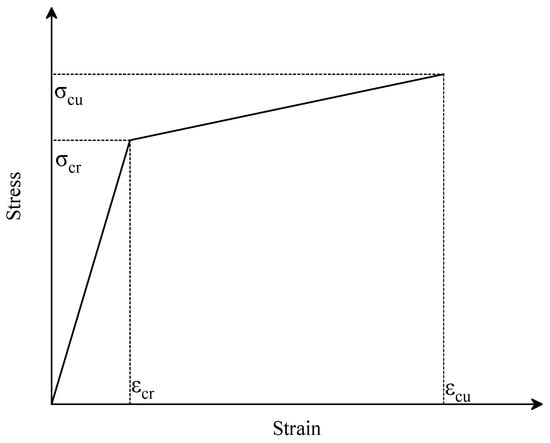
Based on the experimental results of the PUC material, a compressive constitutive model similar to that of concrete was adopted for the compressive stress–strain relationship, while a two-stage model was employed to simulate the tensile constitutive relationship [49], as shown in Figure 31. The elastic modulus was taken as EPUC = 5500 MPa. Poisson’s ratio was taken as ν = 0.27.
Figure 31.
Tensile constitutive relationship of PUC.
5.2. Finite Element Model of Reinforced Concrete Beam
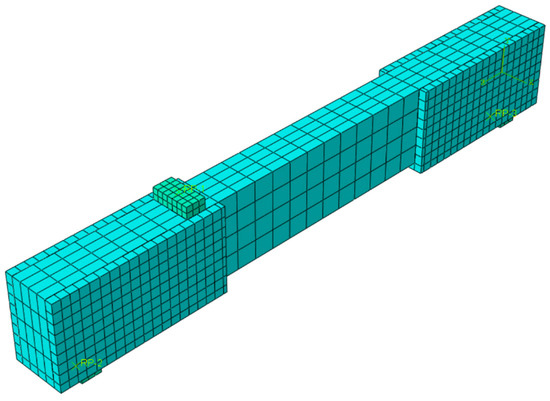
Solid elements were used to represent the concrete material and the PUC material, while the reinforcement and WM layers were modeled using three-dimensional truss elements. An embedded region constraint was employed between the reinforcement cage and the concrete. Since debonding between the PUC layer and the concrete was not observed in the experiments, the effect of relative slip between them was not considered, and a tie constraint was adopted to connect the two. The WM embedded in the PUC was assumed to be perfectly integrated and was therefore represented using an embedded region constraint in the finite element software. The finite element model was configured as a simply supported beam, with the model of beam B2 shown in Figure 31. The load was applied automatically with the smallest feasible time increments to ensure both accuracy and convergence of the solution [50].
The boundary conditions for the simply supported beam were applied to the preset reference points RP1 and RP2. At the left support, translations in the X, Y, and Z directions were constrained, rotations about the URz and URy axes were fixed, and rotation about the URx axis was released. At the right support, translations in the Y and Z directions were constrained, and rotations about the URz and URy axes were fixed, while translation in the Z direction and rotation about the URx axis were released. The specific boundary conditions applied are shown in Figure 32.
Figure 32.
Detailed simulation of the WM-PUC reinforced beam.
Mesh discretization influences the simulation results. An improperly chosen mesh size not only increases computational effort and extends simulation time but also affects the accuracy of the results. In the meshing of the reference beam, a mesh size of 40 mm was adopted for both the concrete component and the reinforcement cage. For the strengthened beams, to enable precise analysis of the strengthening materials, a mesh size of 80 mm was used for the concrete component, while a mesh size of 40 mm was adopted for the WM-PUC strengthening layer and the reinforcement cage. The mesh configurations are shown in Figure 32.
6. Finite Element Results Analysis
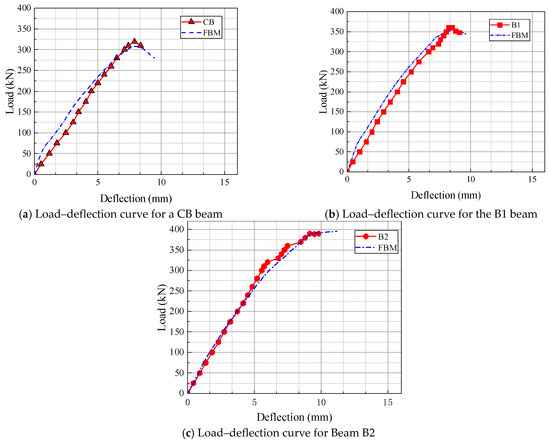
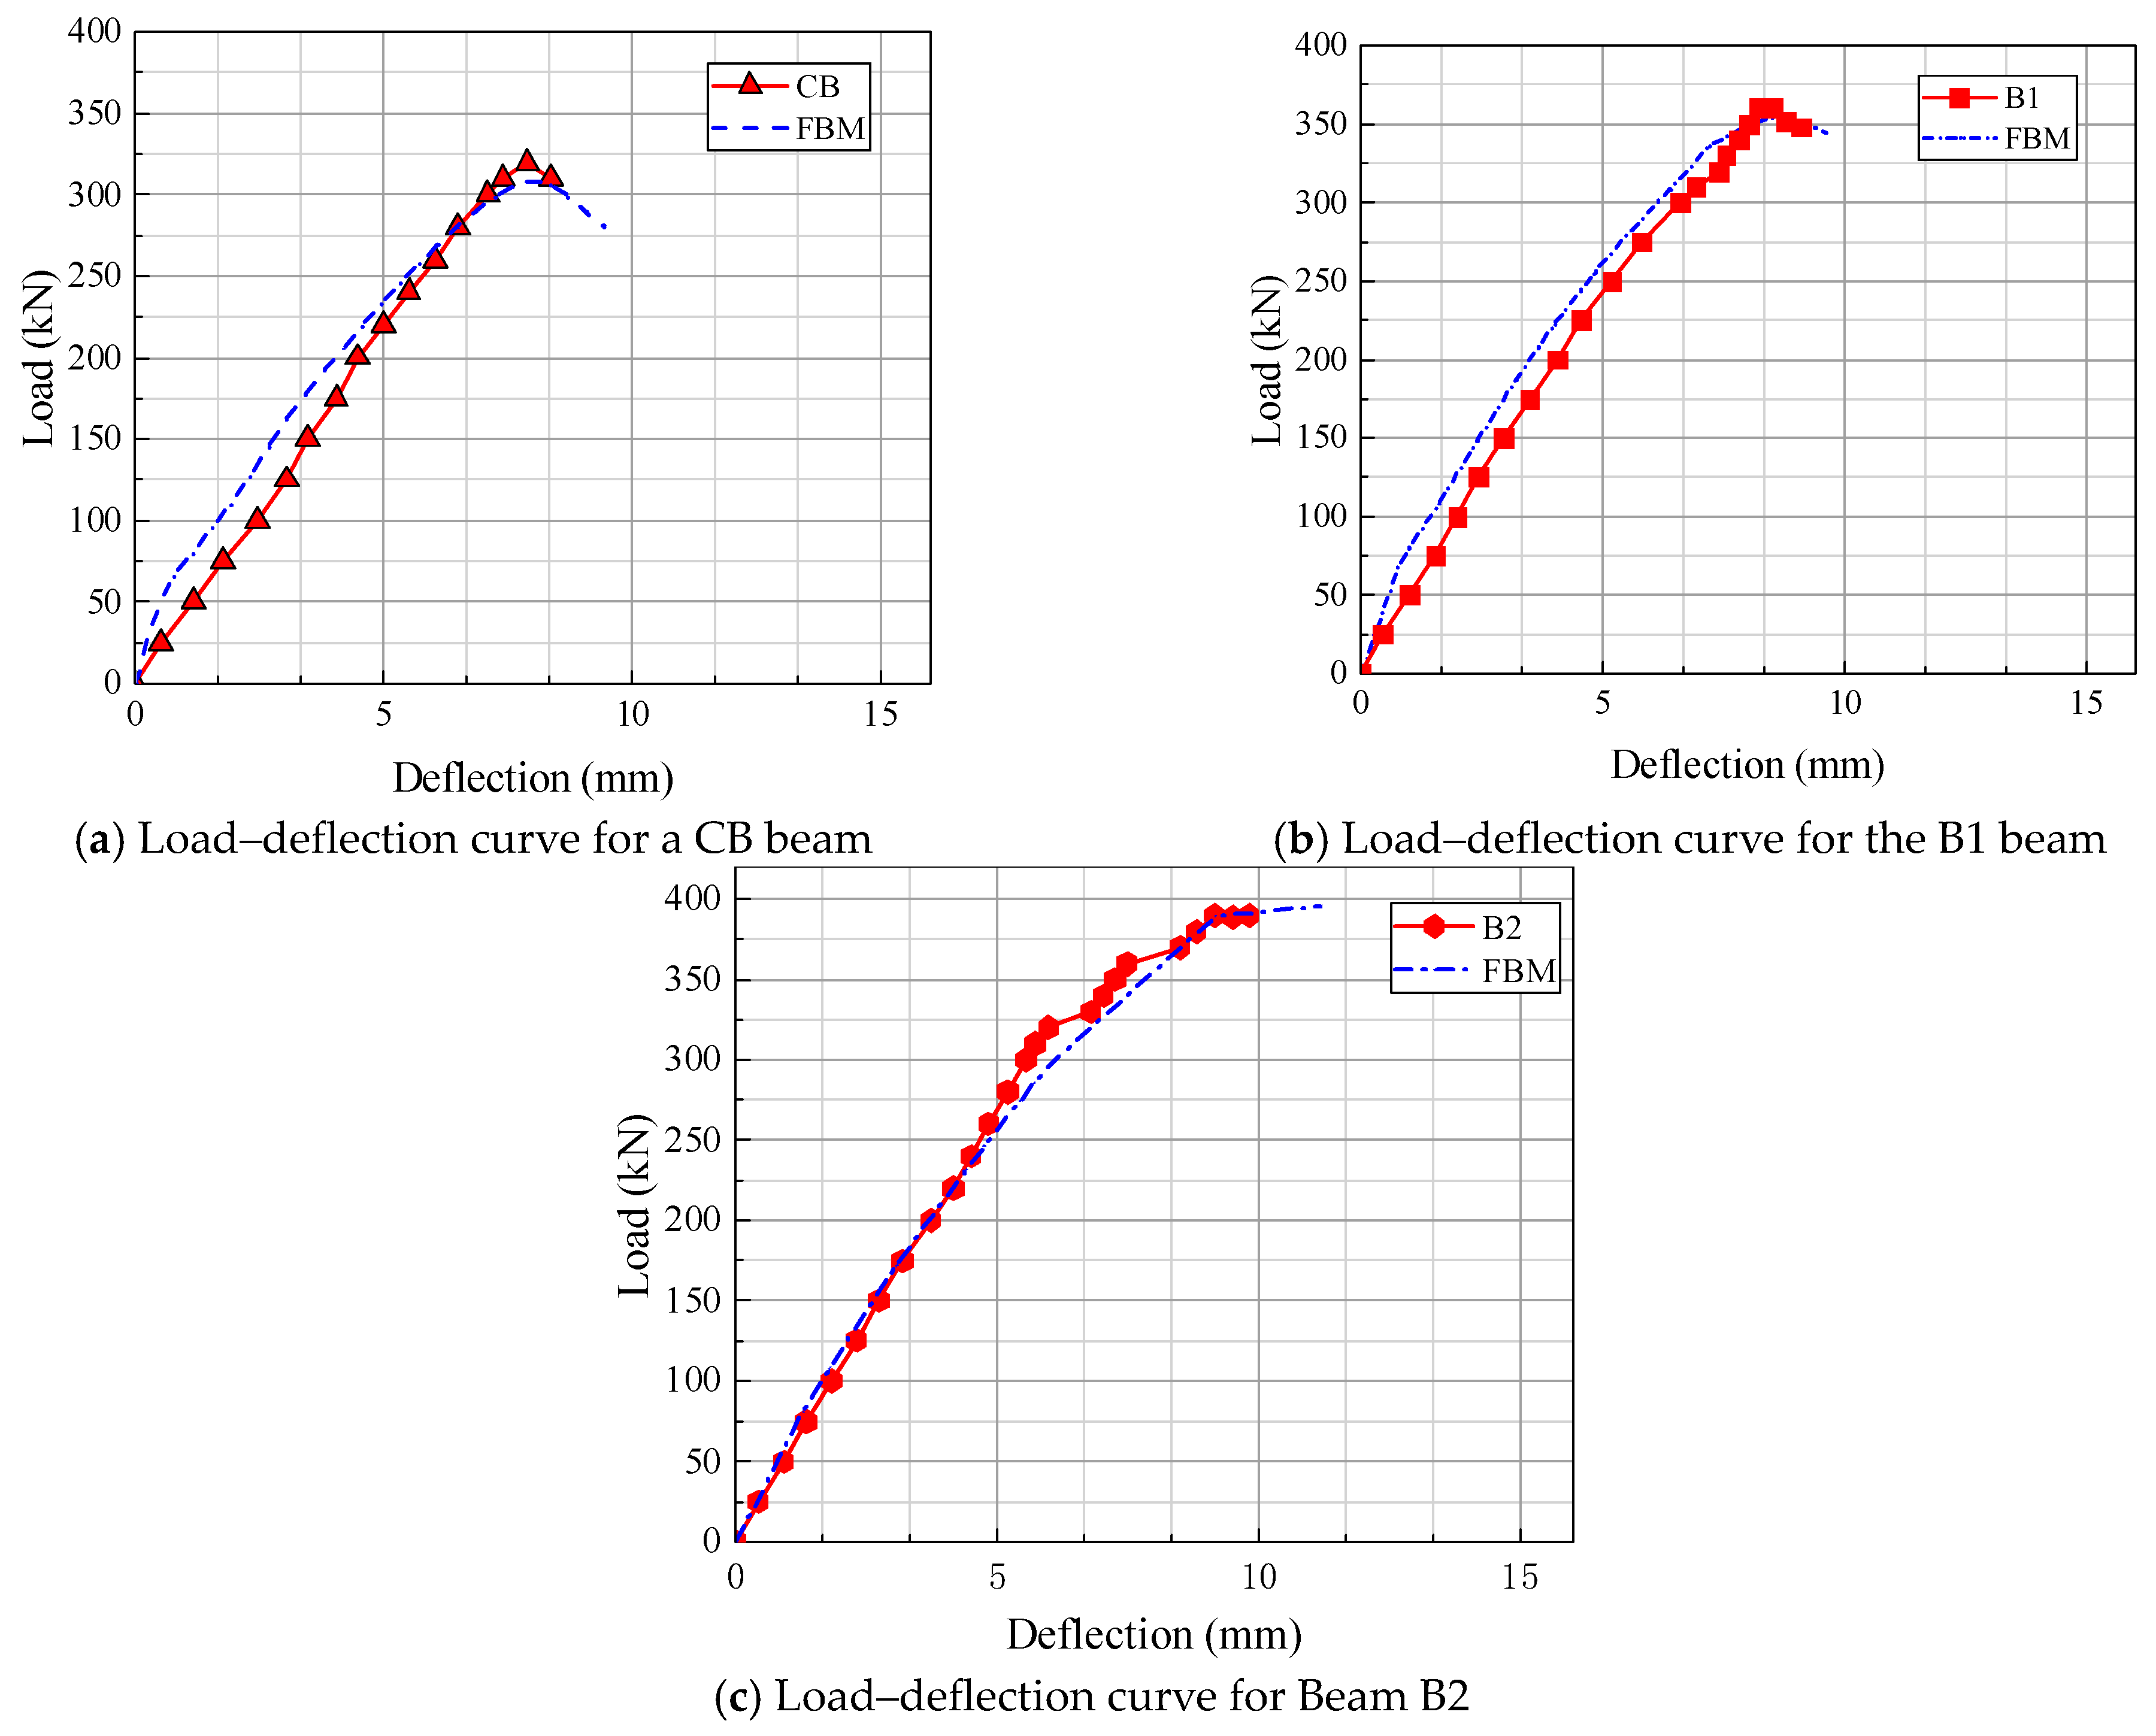
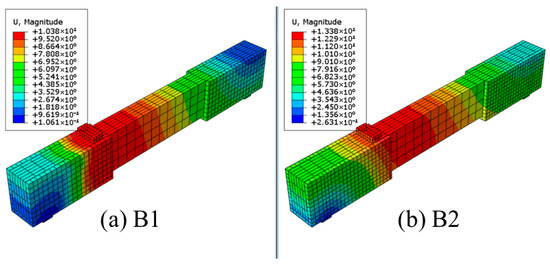
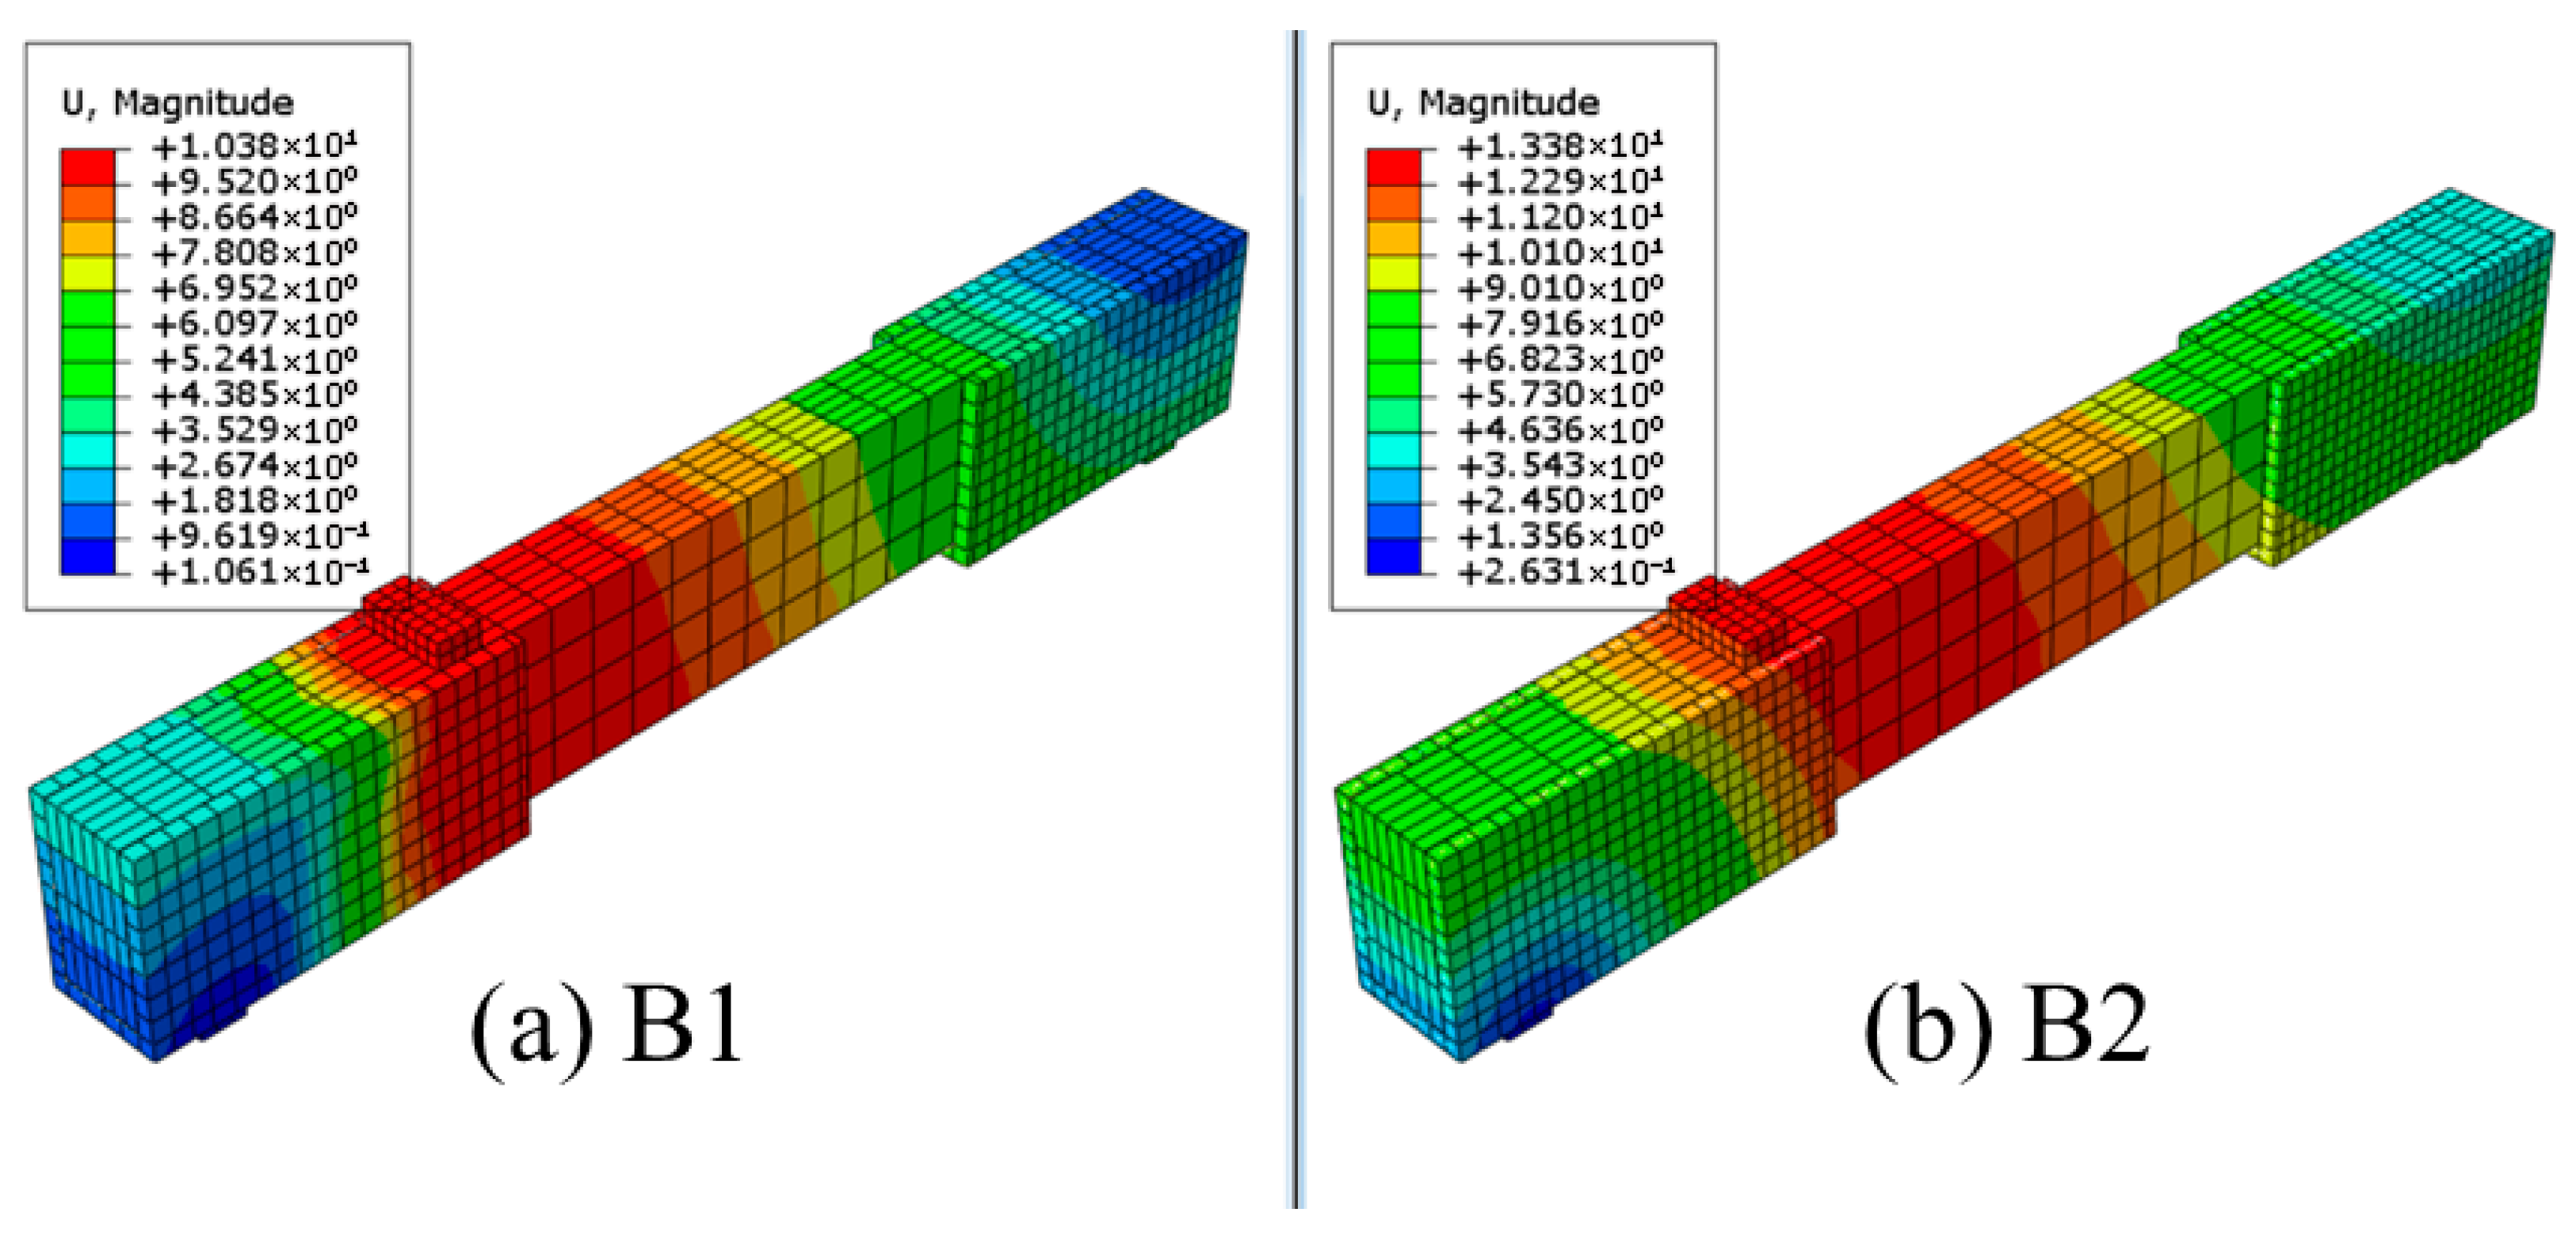
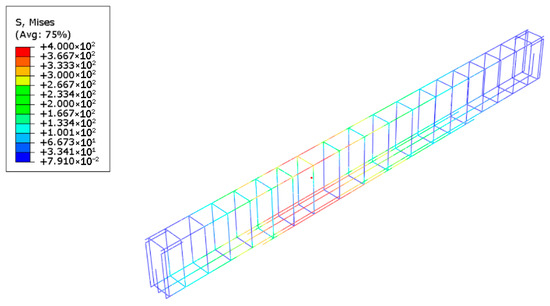
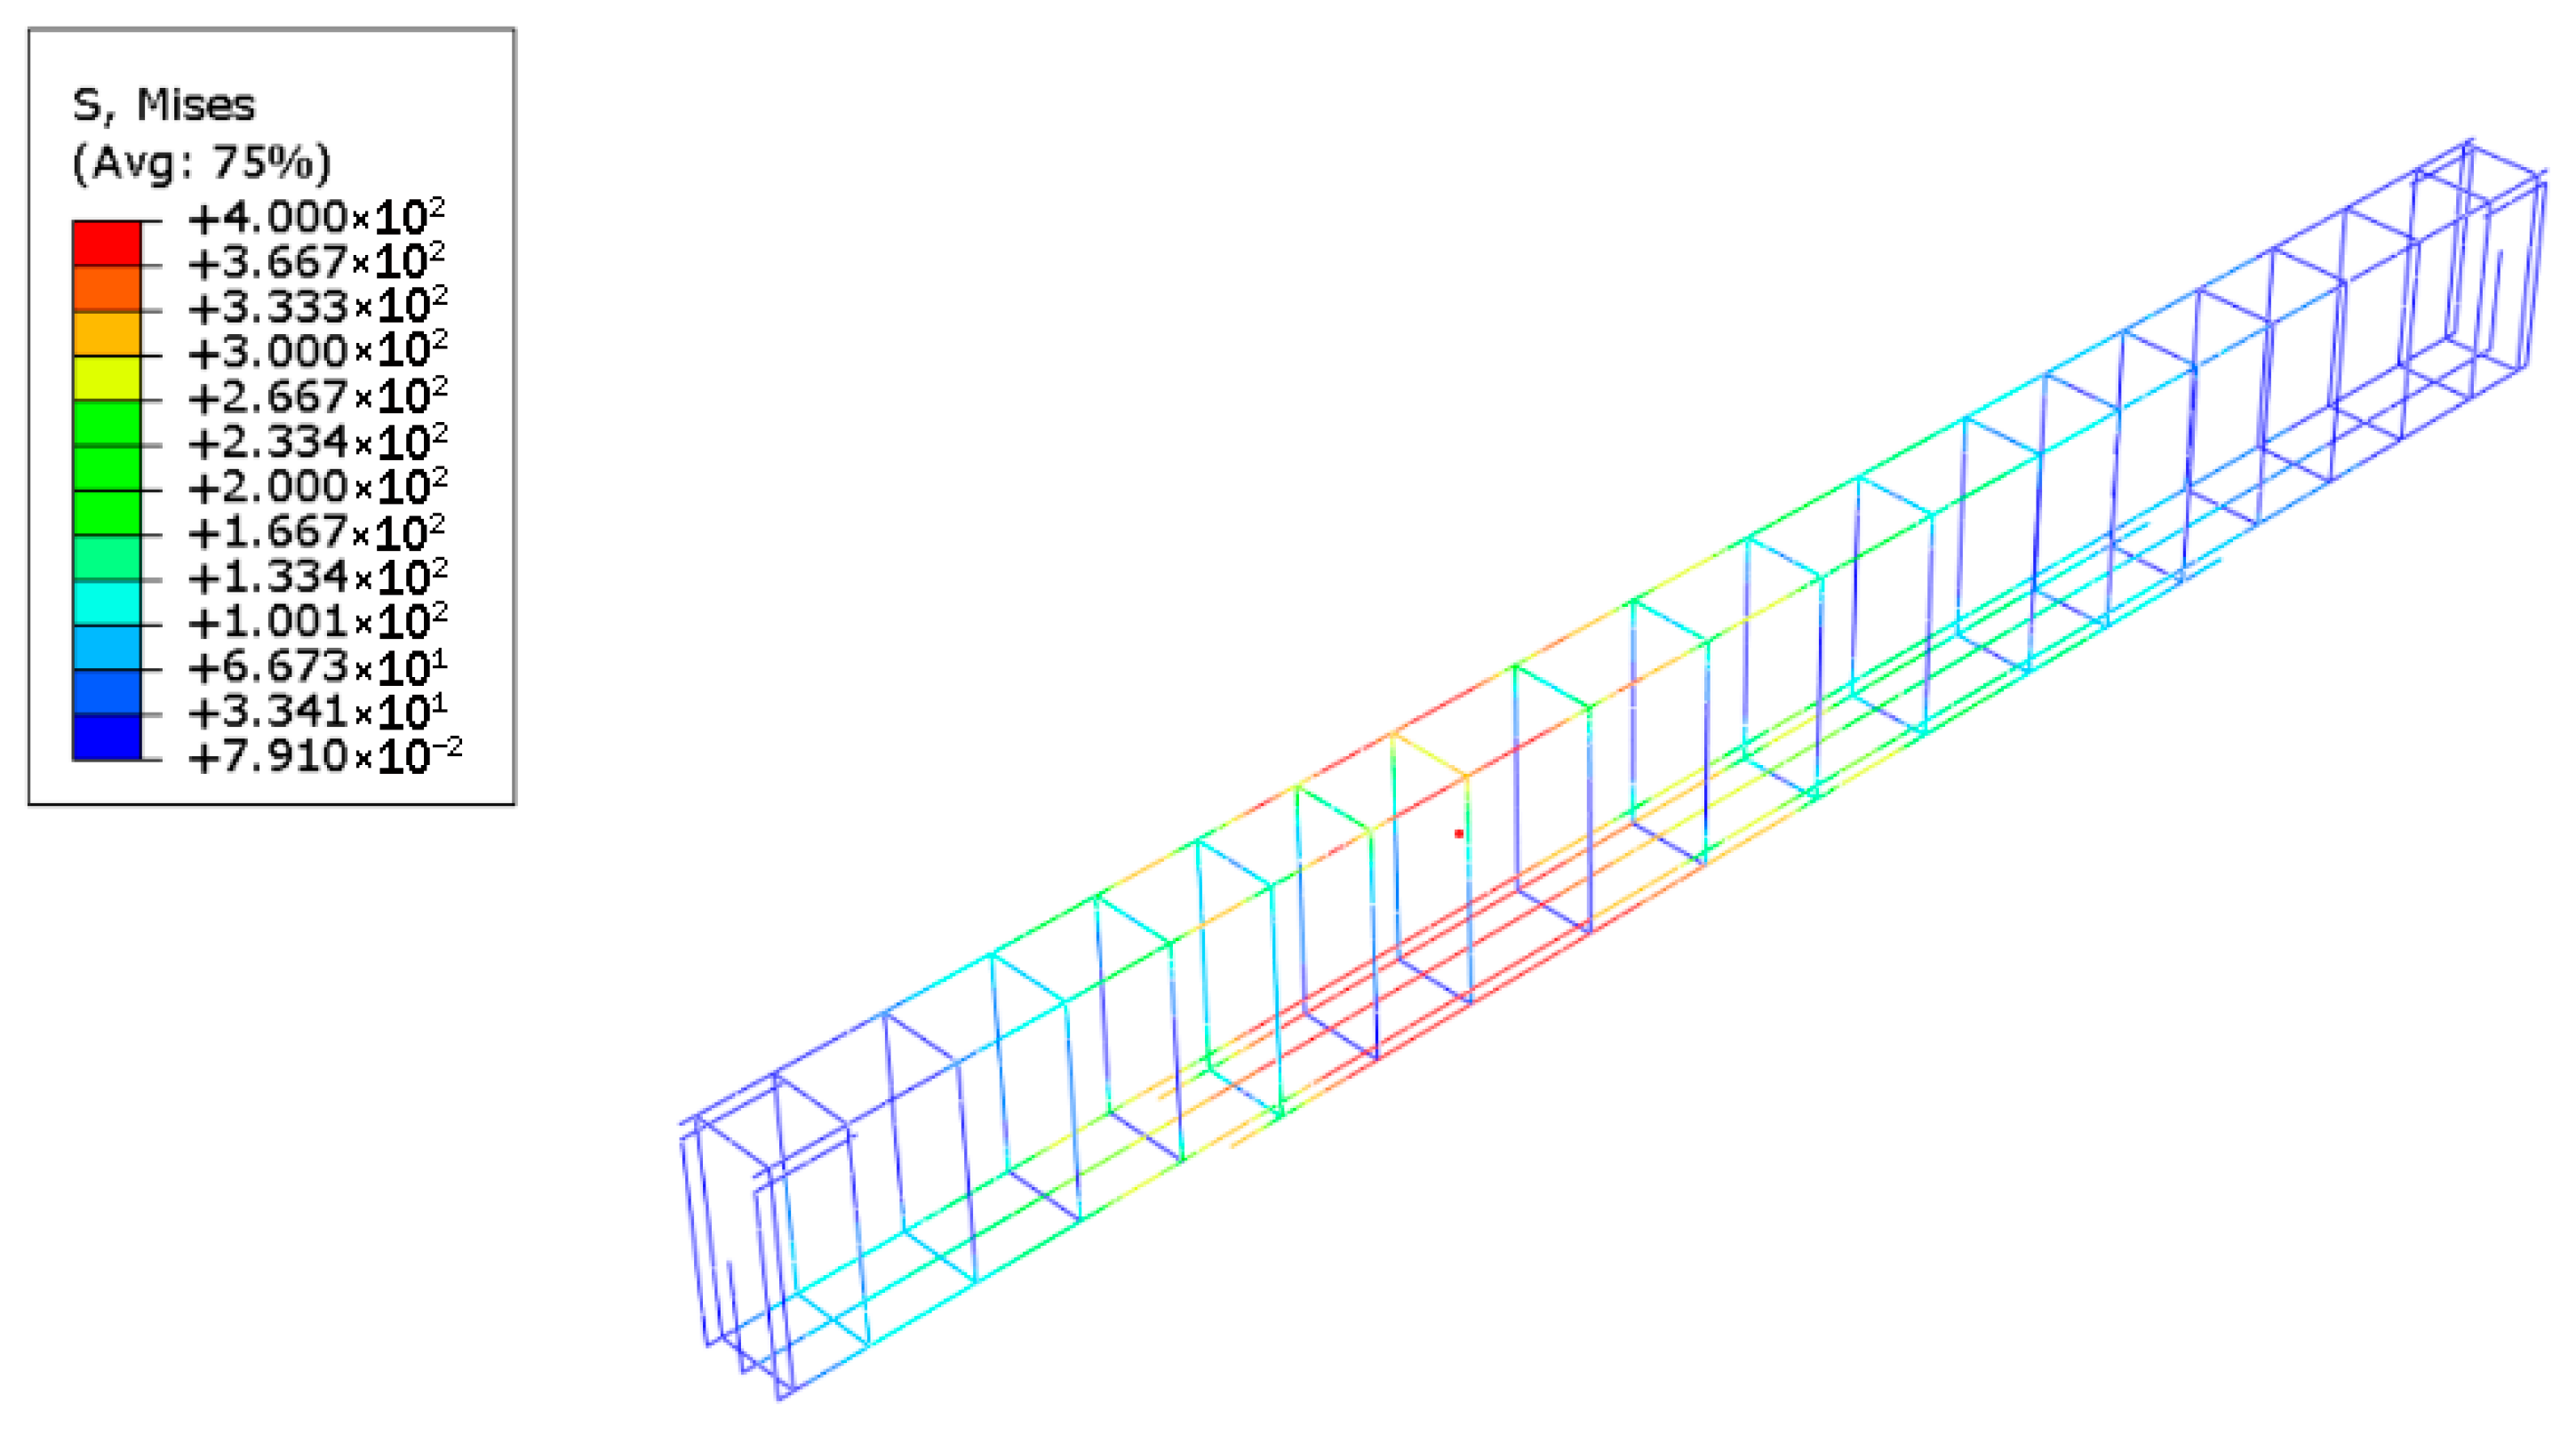
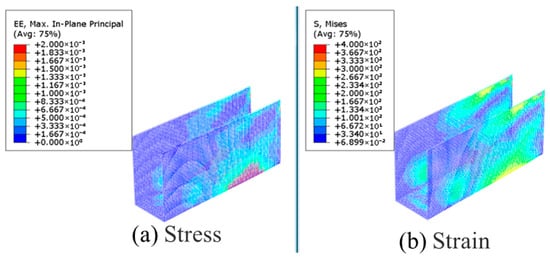
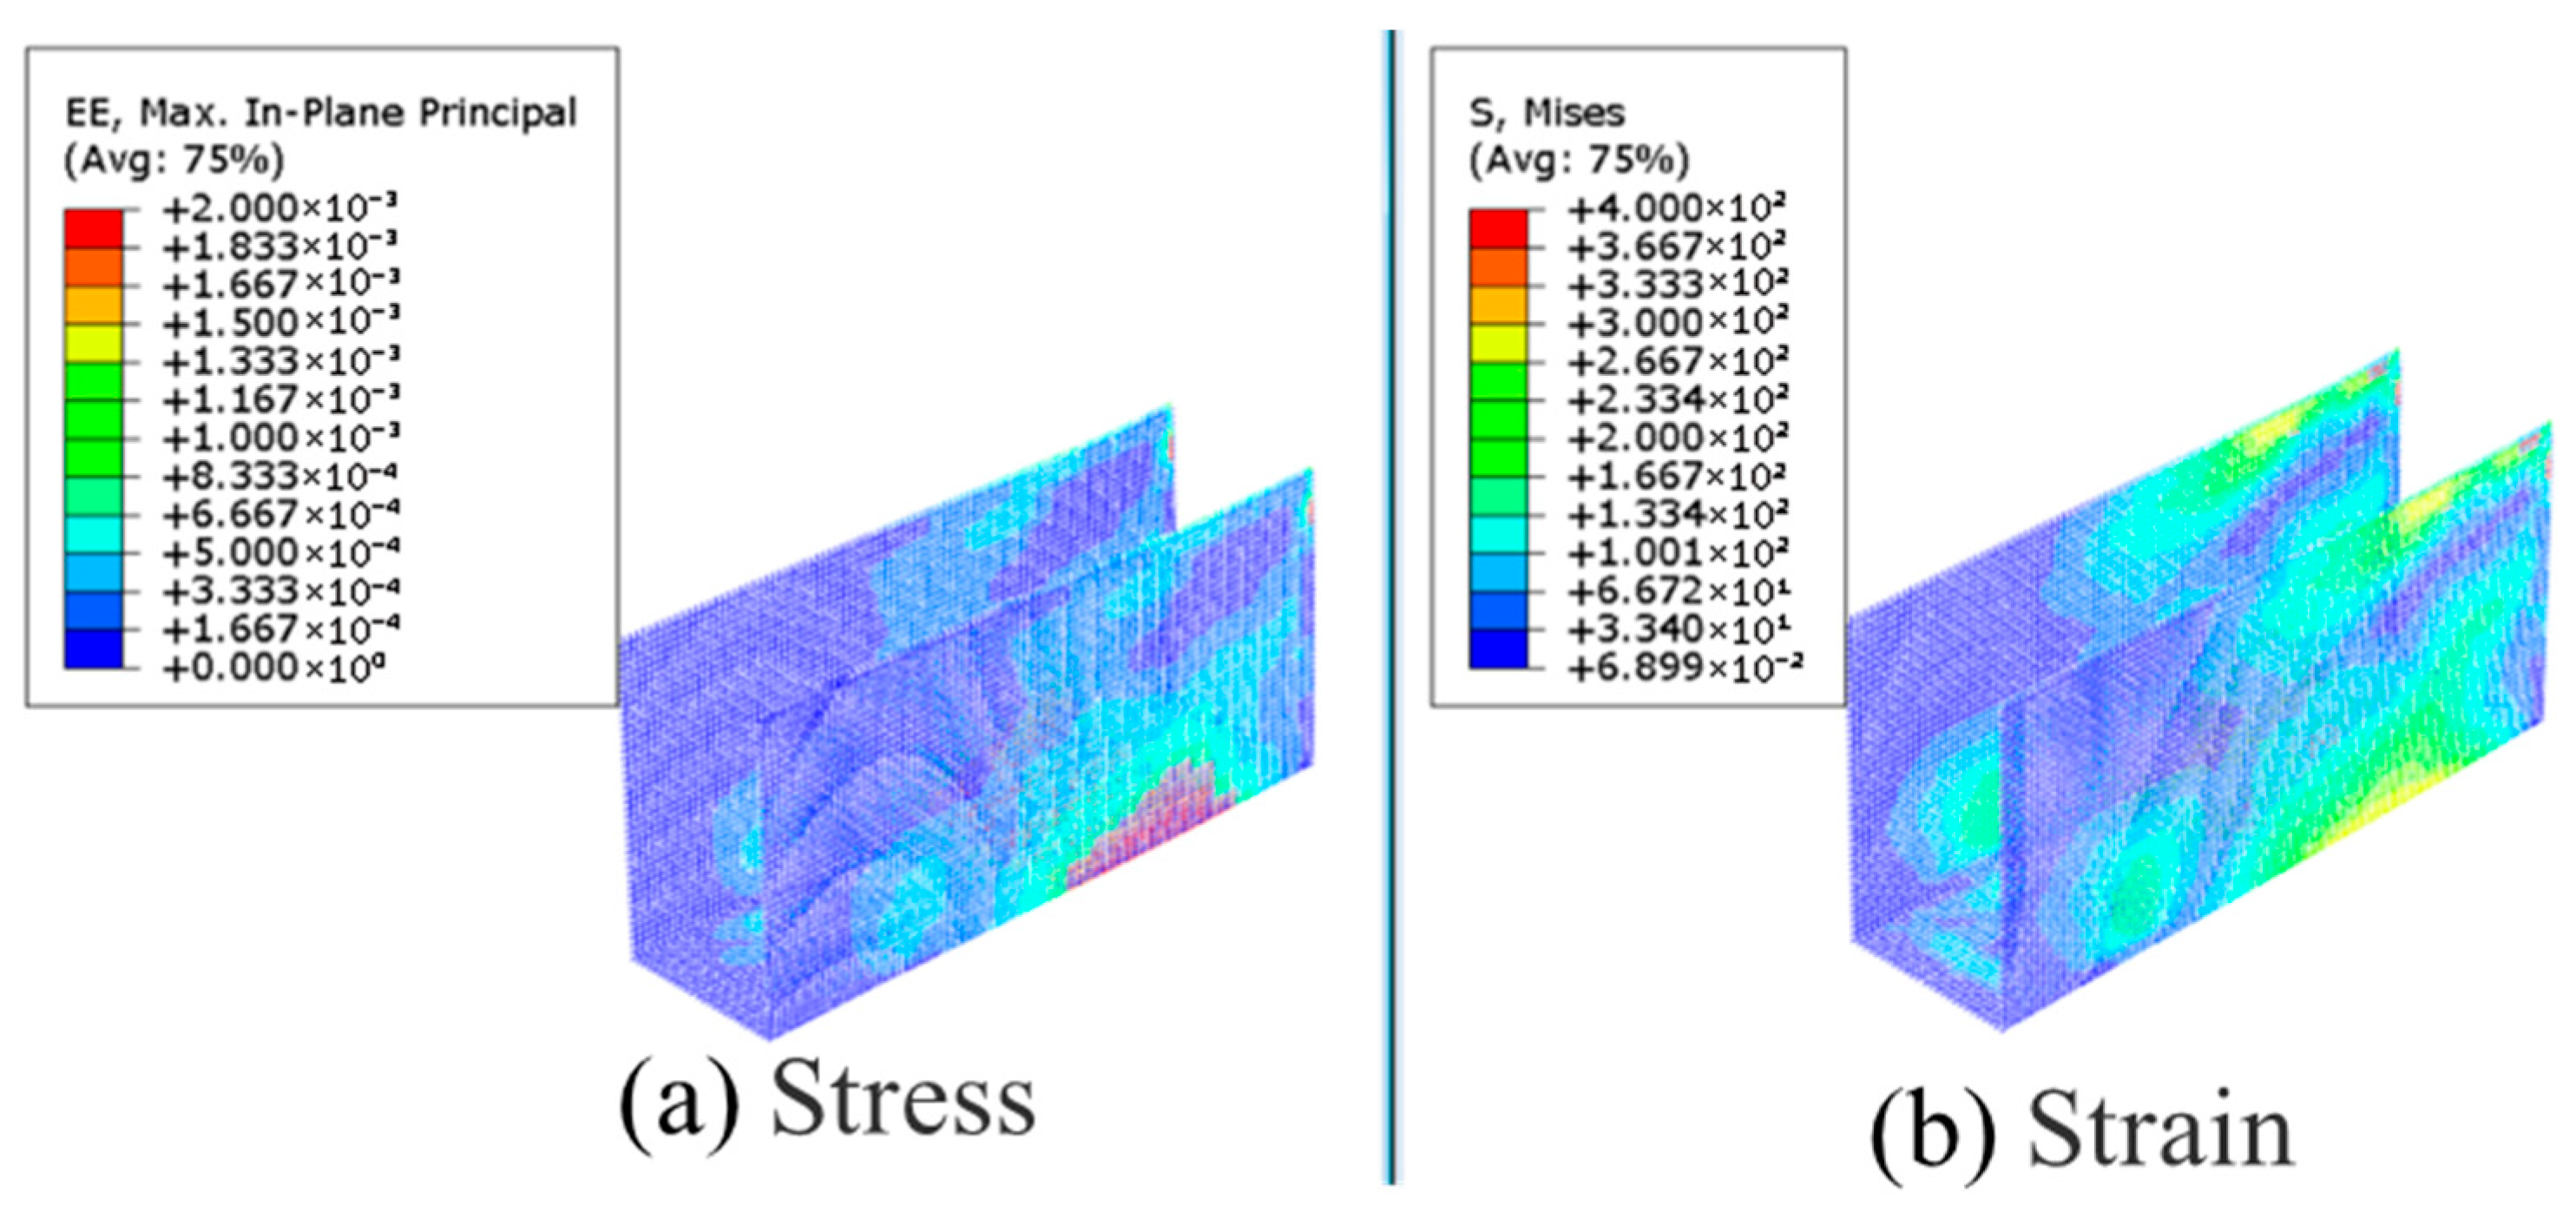
The load–deflection curves at the loading point for beams CB, B1, and B2 are shown in Figure 33, and the deflection contours for beams B1 and B2 are presented in Figure 34. The finite element results are in good agreement with the experimental results. However, some discrepancies exist due to the difference in loading protocols: the actual tests employed load-controlled loading, whereas the finite element simulations used displacement-controlled loading. Figure 35 shows the stress contour of the reinforcement in beam B2. Slight differences between the simulated reinforcement stresses and the experimentally measured strains may be attributed to the assumption in the model that no relative slip occurs between the concrete and the reinforcement, as well as between the concrete and the PUC. Figure 36 presents the stress and strain contours of the WM in beam B2. The finite element analysis results for the strain in the shear-compression zone of the PUC material are in good agreement with the experimental measurements.
Figure 33.
Load–deflection curves for the beam based on measured data and finite element simulation.
Figure 34.
Comparison of deflection contour plots for Beams B1 and B2.
Figure 35.
Stress contour plot of the reinforcement in Beam B2.
Figure 36.
Steel mesh of Beam B2: (a) Stress contour plot; (b) Strain contour plot.
7. Conclusions
This study addresses the shear strengthening of damaged RC beams by proposing a strengthening method using WM-PUC composites. Through static loading tests, the shear performance of damaged beams strengthened with PUC alone and with WM-PUC composites was comparatively analyzed. The following main conclusions are drawn:
(1) WM-PUC strengthening significantly enhanced the shear capacity of damaged RC beams. Compared with the unstrengthened original beam, the ultimate load of the WM-PUC-strengthened beam increased by 21.88%. Compared with the PUC-strengthened beam, the ultimate load of the WM-PUC-strengthened beam increased by 8.3%. This indicated that the incorporation of WM effectively improved the overall mechanical performance of the composite strengthening layer.
(2) In terms of crack control, the PUC material exhibited good ductility, and diagonal cracks in the PUC strengthening layer developed relatively slowly. In contrast, WM-PUC strengthening demonstrated superior crack confinement capability. Under the same load level, the diagonal crack width in the WM-PUC-strengthened beam was significantly smaller than that in the PUC-strengthened beam, and crack propagation exhibited a more regular pattern. By comparison, the crack width in the PUC-strengthened beam showed a sudden increase, indicating less predictable crack development.
(3) Both strengthening methods effectively share the stress carried by the steel reinforcement, with WM-PUC exhibiting a more pronounced stress-sharing effect. At the initial loading stage, stress was mainly concentrated in the strengthening layer, and the strains in the stirrups and longitudinal reinforcement were significantly lower than those in the original beam. However, as cracks fully developed, a sudden increase in the strains of the stirrups and longitudinal reinforcement was still observed, indicating that the reinforcement still bears a non-negligible load near the ultimate state, contributing to a certain degree of structural instability.
(4) The WM-PUC composite strengthening method combined the excellent durability of PUC material with the reinforcing effect of WM, exhibiting favorable durability and promising prospects for engineering applications. However, quantitative characterization of its long-term performance requires further investigation.
Limitations: The number of test beams in this study was four, representing a relatively small sample size. However, all four test beams were prepared under identical conditions, and material variability was controlled to the greatest extent possible through the experimental procedures. Future studies will employ statistical analyses based on multiple specimens to confirm the variability.
Author Contributions
Conceptualization, L.Y., Y.J. and Z.Y.; methodology, L.Y., Y.J. and Z.Y.; software, L.Y. and Z.Y.; validation, L.Y. and Y.J.; formal analysis, L.Y.,Y.J. and Z.Y.; investigation, L.Y., Y.J. and Z.Y.; resources, L.Y.; data curation, L.Y.; writing—original draft preparation, L.Y., Y.J. and Z.Y.; writing—review and editing, L.Y., Y.J. and Z.Y.; visualization, L.Y., Y.J. and Z.Y.; supervision, Y.J.; project administration, L.Y. and Z.Y.; funding acquisition, L.Y. All authors have read and agreed to the published version of the manuscript.
Funding
This work was supported by the Basic Scientific Research Business Expenses of Provincial Universities and Colleges in Heilongjiang Province (2023-KYYWF-1443).
Data Availability Statement
Data is contained within the article, The original contributions presented in this study are included in the article. Further inquiries can be directed to the corresponding author.
Conflicts of Interest
The authors declare that they have no known competing financial interests or personal relationships that could have appeared to influence the work reported in this paper.
References
- Gu, K.; Peng, W. A Study on Diagonal Cracks in the Web of Prestressed Concrete Continuous Box-Girder Bridges. Highway 2004, 7, 35–38. (In Chinese) [Google Scholar]
- Sumitro, S.; Hida, K.; Diouron, T.L. Structural health monitoring paradigm for concrete structures. In Proceedings of the 28th Conference on Our World in Concrete & Structures, Singapore, 27–29 August 2003; Volume XXII. [Google Scholar]
- Pallempati, H.; Beneberu, E.; Yazdani, N.; Patel, S. Condition Assessment of Fiber-Reinforced Polymer Strengthening of Concrete Bridge Components. J. Perform. Constr. Facil. 2016, 30, 04016052. [Google Scholar] [CrossRef] [Scilit]
- Jacobs, R.R.; Williams, C.S. Evaluation of flexural strengthening methods for beams with simulated deterioration using spike-anchored FRP externally bonded sheets and near-surface-mounted strips. Compos. Struct. 2023, 305, 116463. [Google Scholar] [CrossRef] [Scilit]
- Yu, R. Analysis of Shear Mechanical Properties and Bearing Capacity Calculation of RC Beams Reinforced with FRP Mesh-FRCC Composites. Master’s Thesis, Southwest Jiaotong University, Chengdu, China, 2021. (In Chinese) [Google Scholar]
- Kim, T.-K.; Jung, W.-T.; Park, J.-S.; Park, H.-B. Experimental Study on Effects of Additional Prestressing Using Fiber Reinforced Polymers and Strands on Deterioration of PSC Bridge Structure. Polymers 2022, 14, 1115. [Google Scholar] [CrossRef] [Scilit]
- Kim, E.K.; Andrawes, B. Compression behavior of FRP strengthened bridge timber piles subjected to accelerated aging. Constr. Build. Mater. 2016, 124, 177–185. [Google Scholar] [CrossRef] [Scilit]
- Guralnick, A.S.; Gunawan, L. Strengthening of Reinforced Concrete Bridge Columns with FRP Wrap. Pract. Period. Struct. Des. Constr. 2006, 11, 218–228. [Google Scholar] [CrossRef] [Scilit]
- Al-Saidy, A.; Klaiber, F.; Wipf, T.; Al-Jabri, K.; Al-Nuaimi, A. Parametric study on the behavior of short span composite bridge girders strengthened with carbon fiber reinforced polymer plates. Constr. Build. Mater. 2007, 22, 729–737. [Google Scholar] [CrossRef] [Scilit]
- Lv, Y.; Wu, P.; Chou, J.; Han, W.; Su, M.; Peng, H. An experimental study on the interfacial bonding performance of horizontally embedded CFRP strips to concrete. Constr. Build. Mater. 2023, 369, 130514. [Google Scholar] [CrossRef] [Scilit]
- Al-Saidy, H.A.; Klaiber, W.F.; Wipf, J.T. Repair of Steel Composite Beams with Carbon Fiber-Reinforced Polymer Plates. J. Compos. Constr. 2004, 8, 163–172. [Google Scholar] [CrossRef] [Scilit]
- Liu, J.; Jiang, X.; Du, X. Experimental Study on the Shear Behavior of CFRP-Reinforced Reinforced Concrete Beams Without Web Reinforcement. J. Civ. Environ. Eng. 2025, 47, 118–129, (In Chinese and English). [Google Scholar]
- Hegde, S.; Shenoy, S.B.; Chethan, K. Review on carbon fiber reinforced polymer (CFRP) and their mechanical performance. Mater. Today Proc. 2019, 19, 658–662. [Google Scholar] [CrossRef] [Scilit]
- Ali, O.; Bigaud, D.; Ferrier, E. Comparative durability analysis of CFRP-strengthened RC highway bridges. Constr. Build. Mater. 2012, 30, 629–642. [Google Scholar] [CrossRef] [Scilit]
- Al-Saidy, A.; Klaiber, F.; Wipf, T. Strengthening of steel–concrete composite girders using carbon fiber reinforced polymer plates. Constr. Build. Mater. 2005, 21, 295–302. [Google Scholar] [CrossRef] [Scilit]
- Kim, J.Y.; Kang, J.; Park, J.; Jung, W.-T. Prestress Loss of Post-Tensioned Near-Surface-Mounted Carbon Fiber-Reinforced Polymer for Bridge Strengthening. ACI Struct. J. 2018, 115, 1495–1506. [Google Scholar]
- Tian, S.; Jia, H.; Lin, Y. Hybrid simulation of a carbon fibre–reinforced polymer-strengthened continuous reinforced concrete girder bridge. Adv. Struct. Eng. 2017, 20, 1658–1670. [Google Scholar] [CrossRef] [Scilit]
- Xiao, Y.; Zhou, C.; Surahman, R.; Liu, Y.; Wang, Y. Flexural strengthening of reinforced concrete beams with FRP enveloped steel plate. Eng. Struct. 2025, 335, 120409. [Google Scholar] [CrossRef] [Scilit]
- Lin, Y.; Zong, Z.; Chen, H. Experimental Study on the Shear Behavior of Concrete Beams Reinforced with Steel Plates. J. Build. Struct. 2011, 32, 90–98. (In Chinese) [Google Scholar]
- Daouadji, H.T. Analytical analysis of the interfacial stress in damaged reinforced concrete beams strengthened by bonded composite plates. Strength Mater. 2013, 45, 587–597. [Google Scholar] [CrossRef] [Scilit]
- Wang, J.; Liu, J.; Zhang, G.; Han, J. Experimental study on shear behavior of hollow slab beam strengthened with pasting steel plates. Int. J. Struct. Integr. 2020, 12, 419–427. [Google Scholar] [CrossRef] [Scilit]
- Liu, L.; Wang, L.; Xiao, Z. Flexural bearing capacity of RC hollow slab beam strengthened by steel plates of different thicknesses. Int. J. Struct. Integr. 2021, 12, 613–628. [Google Scholar] [CrossRef] [Scilit]
- Huang, J.; Zhu, C.; Gong, Z.; Zhang, F. Experimental Study on the Seismic Performance of Earthquake-Damaged Reinforced Concrete Frames Reinforced by the Section Enlargement Method. J. Civ. Eng. 2012, 45, 9–17. (In Chinese) [Google Scholar]
- Ma, H.; Li, Z.; Zhang, Y.; Xu, H. Research on the Bearing Capacity of the Cross Section of Reinforced Concrete Beams Strengthened with Increasing Section Method Considering the Effect of the Second Loading. Adv. Res. 2015, 5, 1–9. [Google Scholar] [CrossRef] [Scilit] [PubMed]
- Liu, L.; Shi, X.; Guo, Z. Experimental Study on the Reinforcement of High-Temperature-Damaged Concrete Columns Using the Section Enlargement Method. Eng. Mech. 2003, 20, 18–23. (In Chinese) [Google Scholar]
- Qin, F.; Zhang, Z.; Yin, Z.; Di, J.; Xu, L.; Xu, X. Use of high strength, high ductility engineered cementitious composites (ECC) to enhance the flexural performance of reinforced concrete beams. J. Build. Eng. 2020, 32, 101746. [Google Scholar] [CrossRef] [Scilit]
- Shanour, S.A.; Said, M.; Arafa, I.A.; Maher, A. Flexural performance of concrete beams containing engineered cementitious composites. Constr. Build. Mater. 2018, 180, 23–34. [Google Scholar] [CrossRef] [Scilit]
- Hou, L.; Wang, J.; Huang, T.; Shen, C.; Aslani, F.; Chen, D. Flexural behaviour of corroded reinforced concrete beams repaired with ultra-high toughness cementitious composite. Constr. Build. Mater. 2019, 211, 1127–1137. [Google Scholar] [CrossRef] [Scilit]
- Xu, L.S.; Wang, N.; Zhang, F.X. Flexural behavior of plain concrete beams strengthened with ultra high toughness cementitious composites layer. Mater. Struct. 2012, 45, 851–859. [Google Scholar] [CrossRef] [Scilit]
- Xue, W.; Tan, Y.; Peng, F. Experimental Study on Damaged Prestressed Concrete Beams Using External Post-Tensioned Tendons. ACI Struct. J. 2019, 117, 159–168. [Google Scholar]
- Peng, H.; Zhou, J.; Ouyang, B.; Su, M. Experimental study on the flexural performance of reinforced concrete beams strengthened with prestressed near end enhanced embedment CFRP. Eng. Struct. 2026, 348, 121782. [Google Scholar] [CrossRef] [Scilit]
- Choi, J. Comparative study of effective stresses of concrete beams strengthened using carbon-fibre-reinforced polymer and external prestressing tendons. Struct. Infrastruct. Eng. 2014, 10, 753–766. [Google Scholar] [CrossRef] [Scilit]
- Xie, J.; Huang, P.; Guo, Y. Fatigue behavior of reinforced concrete beams strengthened with prestressed fiber reinforced polymer. Constr. Build. Mater. 2011, 27, 149–157. [Google Scholar] [CrossRef] [Scilit]
- Hussain, H.K.; Zhang, L.Z.; Liu, G.W. An experimental study on strengthening reinforced concrete T-beams using new material poly-urethane-cement (PUC). Constr. Build. Mater. 2013, 40, 104–117. [Google Scholar] [CrossRef] [Scilit]
- Zhang, K.; Sun, Q. Strengthening of a Reinforced Concrete Bridge with Polyurethane-cement Composite (PUC). Open Civ. Eng. J. 2016, 10, 768–781. [Google Scholar] [CrossRef] [Scilit]
- Xu, S.; Liu, S.; Huo, C.; Xu, J.; Han, C.; Zhu, Z.; Wu, H.; Ling, M. Laboratory Investigations into Degradation Mechanism of Polyurethane Concrete Properties under Various Immersion Conditions. J. Test. Eval. 2026, 54, 555–576. [Google Scholar] [CrossRef] [Scilit]
- Zhang, K.; Sun, Q. The use of Wire Mesh-Polyurethane Cement (WM-PUC) composite to strengthen RC T-beams under flexure. J. Build. Eng. 2018, 15, 122–136. [Google Scholar] [CrossRef] [Scilit]
- ACI Committee 318. Building Code Requirements for Structural Concrete and Commentary (ACI 318-99); American Concrete Institute: Detroit, MI, USA, 1999. [Google Scholar]
- GB/T 228. 1-2010; Methods for Indoor Tensile Testing of Metallic Materials. Standards Press: Beijing, China, 2010. (In Chinese)
- ACI Committee 549. Guide for the design, construction, and repair of ferrocement. Acids Struct. J. 1988, 85, 325–351. [Google Scholar]
- JTG3420-2020; Test Methods for Cement and Cement Concrete in Highway Engineering. Architecture & Building Press: Beijing, China, 2020. (In Chinese)
- Haleem, K.H.; Liu, G.W.; Yu, W.Y. Experimental study to investigate mechanical properties of new material polyurethane-cement composite (PUC). Constr. Build. Mater. 2014, 50, 200–208. [Google Scholar]
- Murthy, A.R.; Karihaloo, B.; Rani, P.V.; Priya, D.S. Fatigue behaviour of damaged RC beams Strengthened with Ultra high performance fibre Reinforced Concrete. Int. J. Fatigue 2018, 116, 659–668. [Google Scholar] [CrossRef] [Scilit]
- Murthy, A.R.; Aravindan, M.; Ganesh, P. Prediction of flexural behaviour of RC beams strengthened with ultra high performance fiber reinforced concrete. Struct. Eng. Mech. 2018, 65, 315–325. [Google Scholar]
- Saeed, H.B.H.; Abdul, R.M.Q. The effect of different levels of pre-damage loading on the strength and structural behavior of CFRP strengthened R. C. beams: Experimental and analytical investigation. PLoS ONE 2021, 16, e0261290. [Google Scholar]
- Bao, S.; Zhang, Y.; Liu, H.; Duan, L.; Guo, Z.; Yang, X. Crack characteristics and damage degree of pre-damaged RC beams strengthened with CFRP under various multiple impact conditions. J. Build. Eng. 2025, 99, 111531. [Google Scholar] [CrossRef] [Scilit]
- GB 50010-2010; Code for Design of Concrete Structures. Architecture & Building Press: Beijing, China, 2015. (In Chinese)
- Zhang, T. A Study on the Application of Numerical Simulation of Typical Concrete Models Under Monotonic and Cyclic Loads. Master’s Thesis, Kunming University of Science and Technology, Kunming, China, 2020. (In Chinese) [Google Scholar]
- Gao, H. A Study on the Shear Resistance of Reinforced Concrete Beams Reinforced with Prestressed Steel Wire Ropes and Polyurethane Cement. Master’s Thesis, Northeast Forestry University, Harbin, China, 2020. (In Chinese) [Google Scholar] [CrossRef]
- ABAQUS. ABAQUS/Standard Version 6. 10 User’s Manuals; Hibbitt, Karlsson, and Sorenson, Inc.: Pawtucket, RI, USA, 2010; Volume I–III. [Google Scholar]

Disclaimer/Publisher’s Note: The statements, opinions and data contained in all publications are solely those of the individual author(s) and contributor(s) and not of MDPI and/or the editor(s). MDPI and/or the editor(s) disclaim responsibility for any injury to people or property resulting from any ideas, methods, instructions or products referred to in the content. |
© 2026 by the authors. Licensee MDPI, Basel, Switzerland. This article is an open access article distributed under the terms and conditions of the Creative Commons Attribution (CC BY) license.