


Abstract
An experimental investigation was conducted to examine the resistance to sulfate attack and chloride ion diffusion of concrete incorporating multiple industrial wastes (MIWC), including limestone powder (LP), tailings sand, and silica fume (SF). The degradation mechanisms of the MIWC under coupled sulfate wet–dry cycles and chloride ion penetration are systematically revealed. Nine concrete mixtures were designed with variable water-to-binder (w/b) ratios, LP contents, SF dosages, and tailings sand/machine-made sand ratios. The results indicate that reducing the w/b ratio significantly enhances resistance to sulfate attack and chloride penetration. A moderate LP dosage optimizes pore structure and improves long-term sulfate resistance, whereas SF effectively refines the pore matrix and reduces the chloride diffusion coefficient. The coupled action of chloride and sulfate accelerates early-stage pore filling by corrosion products but promotes later-stage cracking because of expansive erosion products. A modified sulfate damage model and a multifactor coupled chloride diffusion model are established, which consider damage evolution, chloride binding, and time-dependent diffusivity. The predicted service life of the MIWC under marine exposure is in reasonable agreement with the experimental trends. This work provides a theoretical basis for durable design and industrial waste utilization in marine concrete structures.
1. Introduction
Marine concrete structures suffer from severe durability degradation dominated by chloride ion penetration and sulfate attack, which jointly induce strength loss, cracking, and reinforcement corrosion. Concrete porosity and pore connectivity dominate ion transport rates; a 1% porosity increase can increase sulfate diffusion coefficients by 2–5 times, especially in high water–binder ratio mixtures [1,2,3]. Clarifying the coupled erosion mechanisms and optimizing material composition are critical for prolonging the service life of marine engineering structures [4,5,6].
Sulfate attack involves reactions between sulfate ions and calcium hydroxide (CH) or calcium aluminate phases in cement hydrates, forming expansive ettringite (AFt) and gypsum [7,8]. Chemomechanical damage models have been developed to describe the damage evolution of concrete under sulfate attack [9,10,11]. Mineral admixtures such as fly ash, slag, and silica fume improve sulfate resistance by filling pores and reducing CH content [12,13]. High-volume fly ash concrete incorporating nanosilica exhibits superior sulfate and acid resistance [14,15]. However, industrial waste utilization in marine concrete remains insufficiently explored, especially under coupled chloride–sulfate conditions.
Natural mineral admixtures such as ground colemanite also increase the durability of concrete under sulfate attack [14,15]. Perlite-based mortar shows favorable mechanical behavior and sulfate resistance [16,17]. Silica fume (SF) enhances concrete strength but may reduce workability and increase shrinkage in low w/b systems [18,19]. Under low water-to-binder (w/b) ratio conditions, the total amount of evaporable free water in the concrete paste decreases, causing the internal relative humidity to drop more rapidly. The rapid decrease in relative humidity intensifies the development of capillary negative pressure, thereby aggravating the drying shrinkage of concrete [20]. Poorly dispersed SF forms agglomerates, which undergo large drying shrinkage during curing and induce microcracks, further exacerbating the drying shrinkage of concrete [21]. Limestone powder (LP) acts as a filler and nucleation site for hydration, improving compactness and chloride binding. LP and fly ash significantly affect the pH stability and sulfate-freeze–thaw resistance of concrete [22]. Tailings sand partially replaces machine-made sand to promote solid waste recycling while modifying aggregate gradation. Sulfate attack and wet-dry cycles also influence the creep behavior of fly ash–slag blended concrete [23,24]. Steel fiber reinforcement can further modify chloride diffusion characteristics [25,26]. Despite these individual benefits, the synergistic effects of LP, SF, and tailings sand on coupled chloride–sulfate resistance lack systematic investigation [27,28]. Most studies focus on single-factor erosion, and few models integrate damage evolution, chloride binding, and time-dependent diffusivity for life prediction [29,30,31,32,33].
In this paper, the degradation behavior of MIWC under coupled sulfate wet–dry cycles and chloride ion penetration is investigated. The effects of the w/b ratio, LP content, SF dosage, and tailings sand ratio are quantified. Sulfate attack frequently occurs in marine littoral zones, saline soil regions, and industrial wastewater environments, where sulfate ions coexist with chloride ions and cause persistent chemical erosion. This coupled condition is more severe than single-factor erosion and requires targeted material design. Predictive models for sulfate damage and chloride service life are developed and validated. These findings support the high-efficiency utilization of industrial waste in durable marine concrete.
2. Experimental Program
2.1. Concrete Mix Design and Specimen Fabrication
The raw materials were purchased from Jiangsu Chengyi Group Co., Ltd. (Xuzhou, China). Cement: P·O 42.5 ordinary Portland cement; Limestone powder (LP): 900 m2/kg specific surface area, CaCO3 > 90%; Silica fume: SiO2 > 95%, bulk density 220 kg/m3; Fly ash and slag: Grade I; Tailings sand: iron ore tailings, fineness modulus 2.4, mud content < 1.0%; Machine-made sand: limestone crushed sand, fineness modulus 2.8; Coarse aggregate: 5–20 mm crushed limestone; Water reducer: polycarboxylate superplasticizer with 30% water reduction rate.
Nine mixtures were designed with three w/b ratios (0.20, 0.25, and 0.30), variable tailings sand/machine-made sand ratios, SF contents (5–15%), and LP contents (0–10%). The goal of the mix design was to decouple the effects of w/b, mineral admixtures, and aggregate gradation, providing a clear basis for parametric analysis. Details are given in Table 1. The strength anomaly of A2 is attributed to minor variations in aggregate gradation and local differences in compaction. This point is marked and discussed in the results analysis section.
Table 1.
Mix proportions of the MIWC (1 m3).
2.2. Test Methods
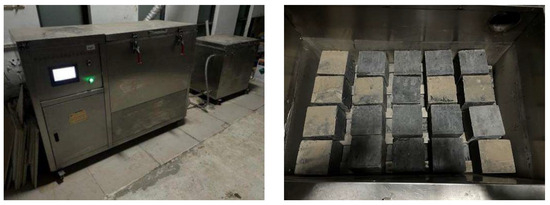
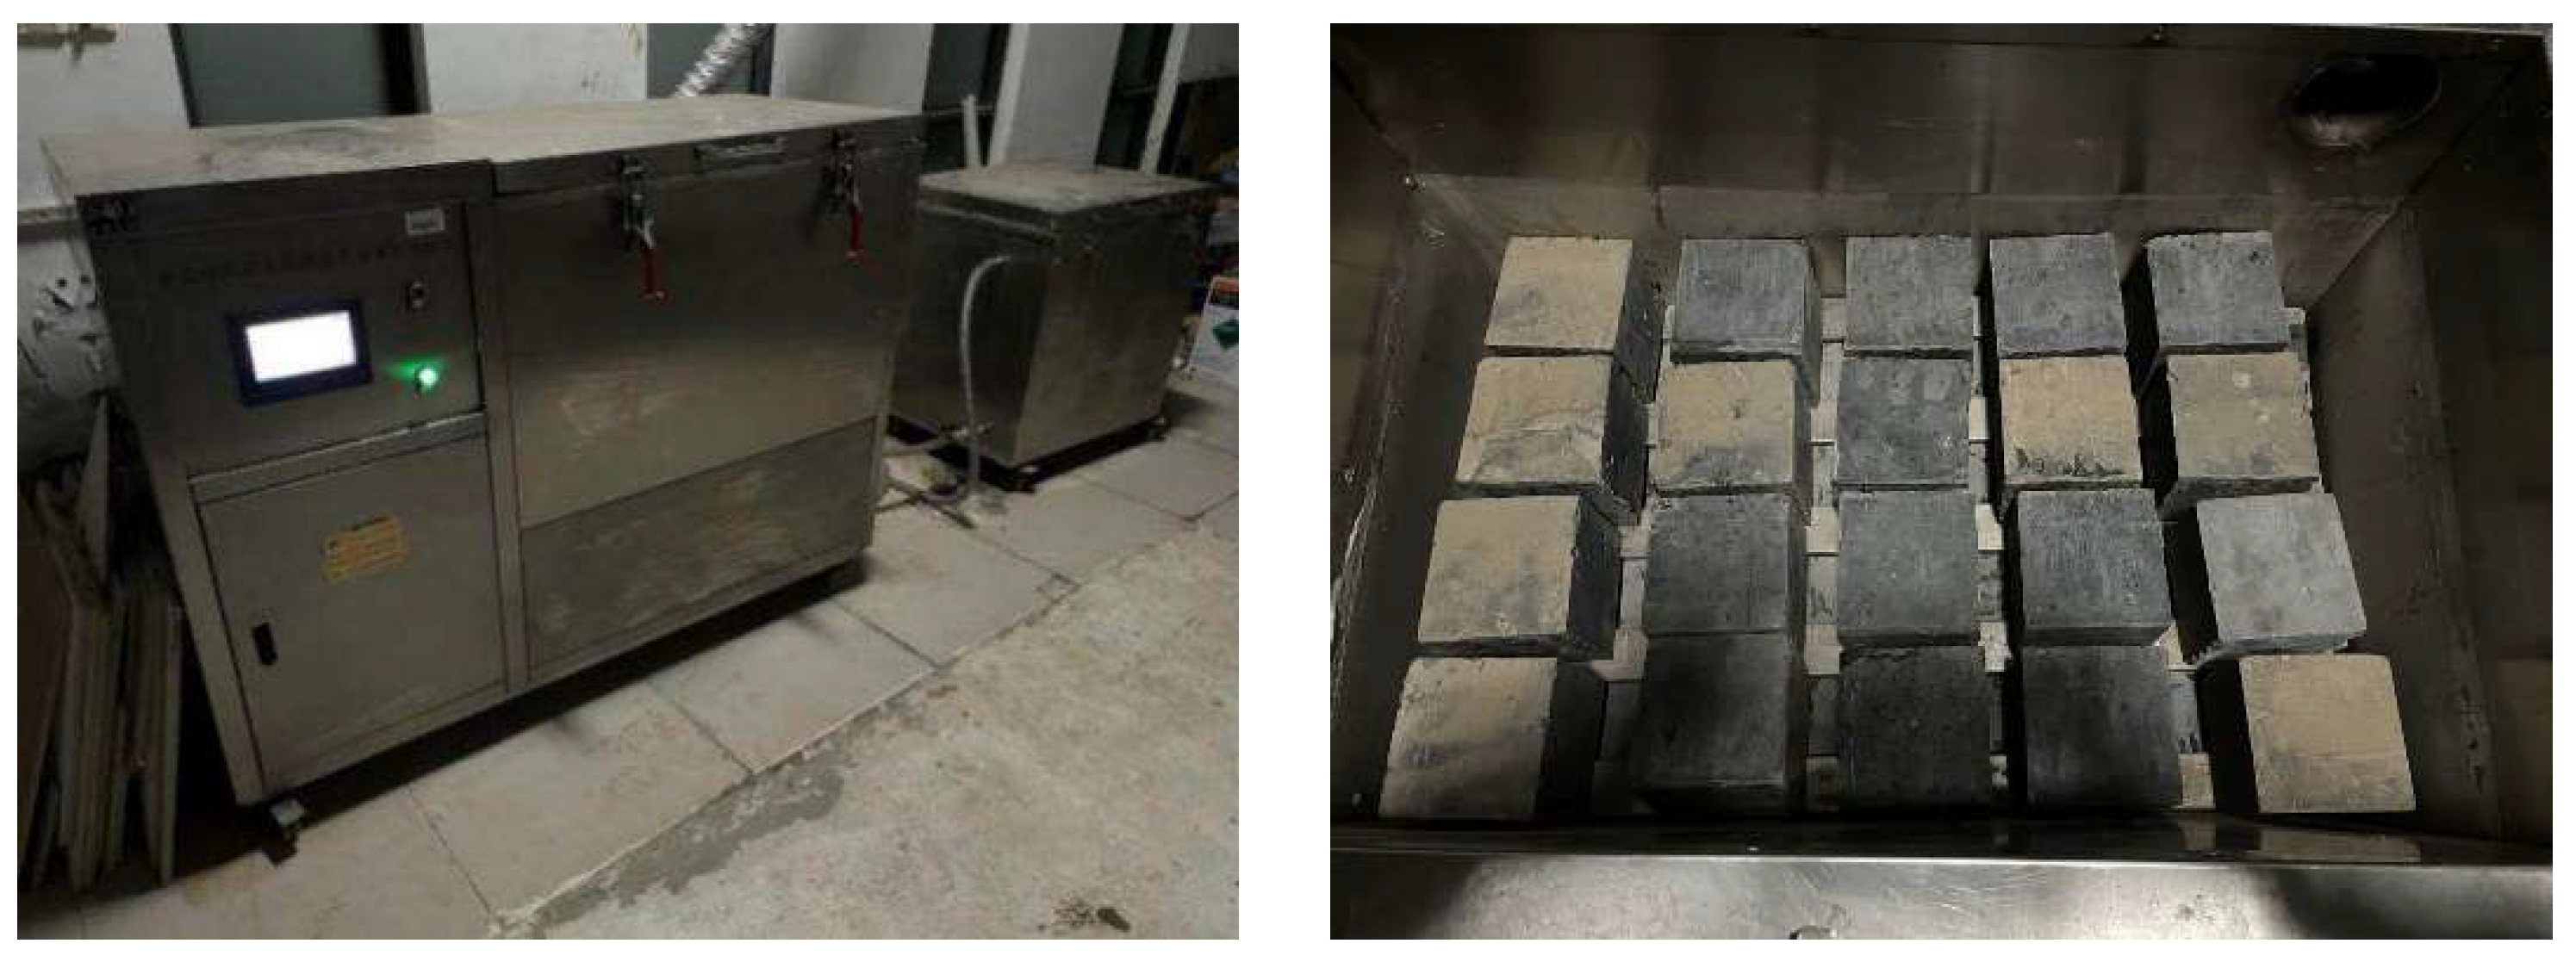
- Sulfate wet-dry cycle test: 100 mm cubic samples, 90 d cycles (5 d immersion + 2 d drying), and 5% Na2SO4 solution. The compressive strength was tested at 15, 30, 45, 60, 75, and 90 d. This equipment is depicted in Figure 1.Figure 1. Sulfate dry–wet cycle test apparatus.
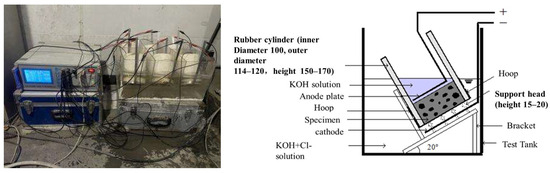
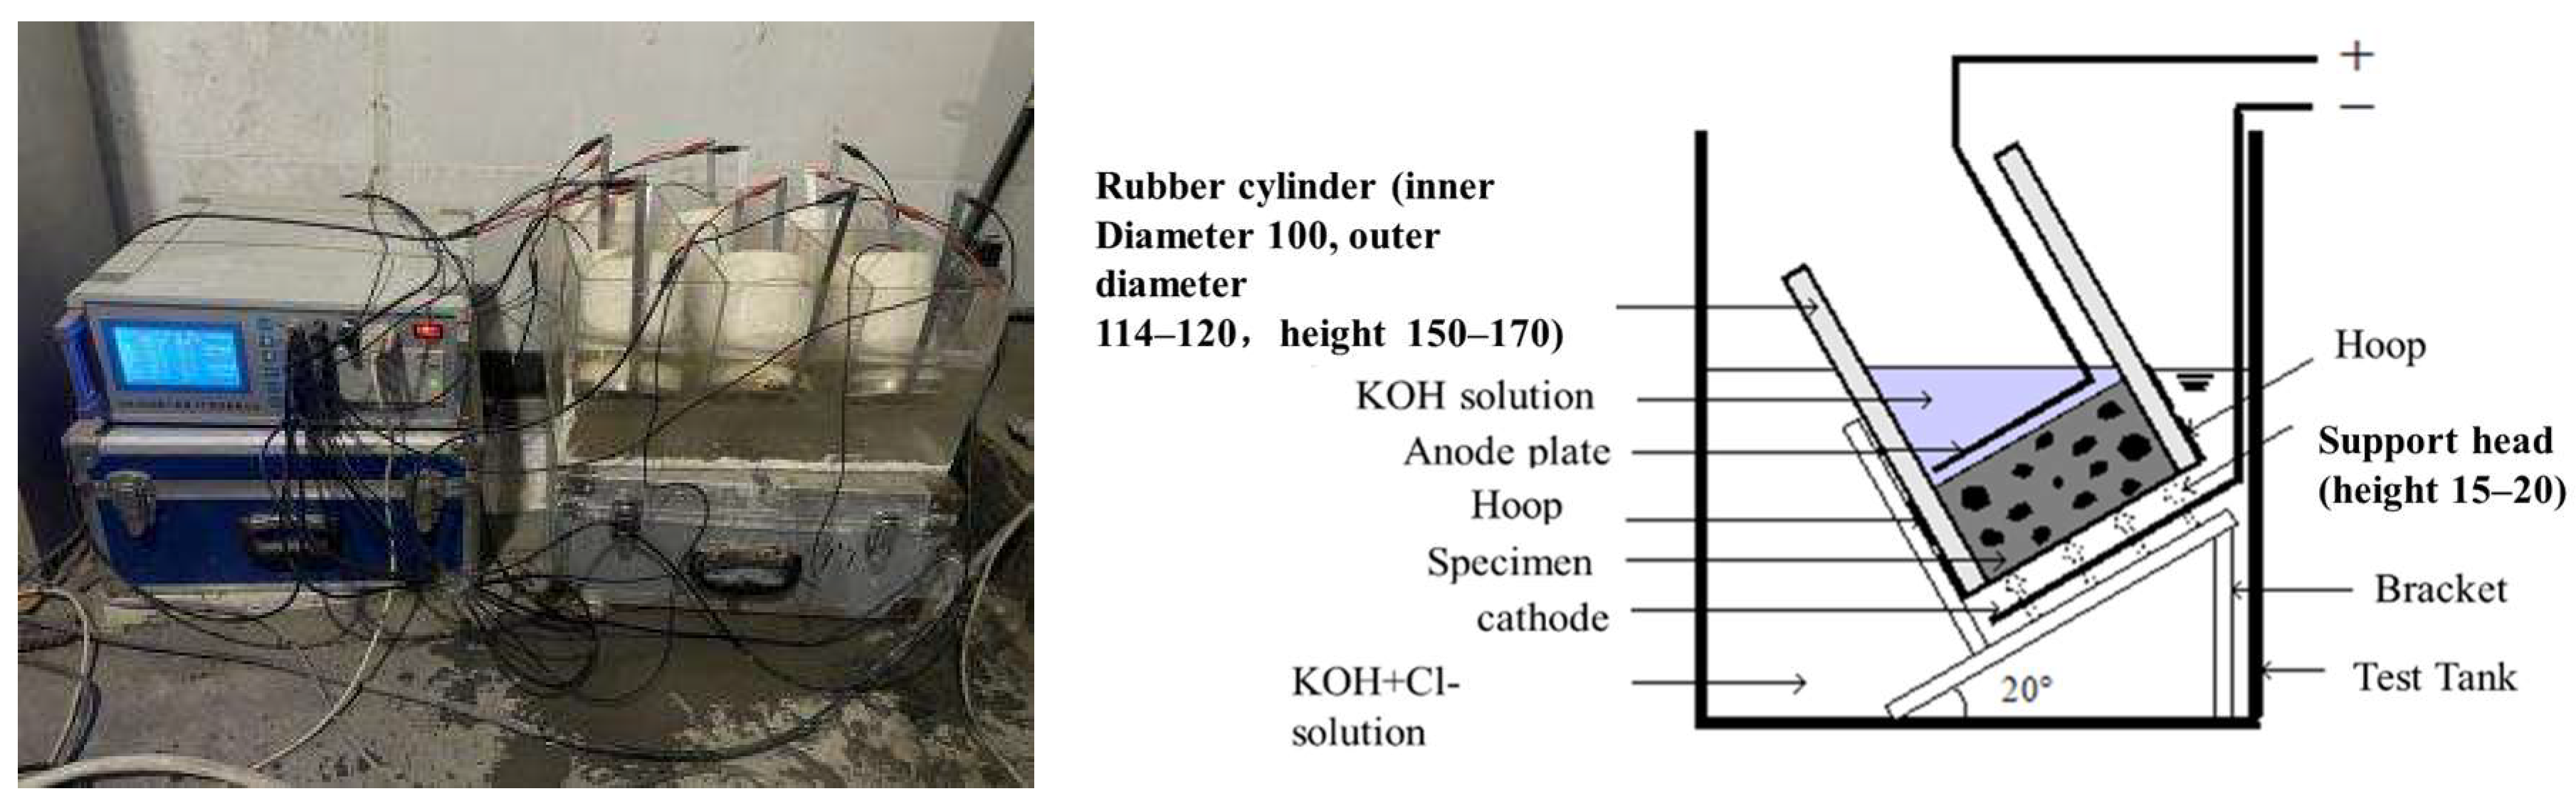
- Rapid chloride ion migration coefficient: Cylindrical specimens Φ100 mm × 50 mm, tested per NT Build 492 [34] (standardized to ensure consistent voltage and current control). The experimental setup is shown in Figure 2.Figure 2. Experimental setup of rapid chloride migration (RCM) test.
- Microstructural characterization: Mercury intrusion porosimetry (MIP) is performed on specimens after 28 days of standard curing to characterize the effects of w/b ratio, mixed sand proportion, and SCM content on pore characteristics. The tests are conducted using an AutoPore IV 9500 (Micromeritics, Norcross, GA, USA) mercury porosimeter, and the measurable pore size ranges from 2 nm to 1000 µm. Meanwhile, scanning electron microscopy (SEM) was employed to observe the morphological characteristics of the interfacial transition zone (ITZ). SEM tests were conducted using a QuantaTM 250 Environmental scanning electron microscopy (FEI Company, Hillsboro, OR, USA) (acceleration voltage: 10–15 kV). Specimens (10 mm × 10 mm × 10 mm) were cut from the centers of 28-day samples, polished, and gold-sprayed for electrical conductivity.
2.3. Results Processing
- (1)
- The method used to determine the compressive strength and corrosion resistance coefficient of the concrete is detailed in Equation (1):where Kf = the corrosion resistance coefficient (%), fcn = the compressive strength after sulfate attack (MPa), and fc0 = the strength of a standard cured sample (MPa).
- (2)
- The formula for calculating the diffusion coefficient of chloride ions in concrete is shown in Equation (2):where U = applied voltage (V), T = average initial-final anode temperature (°C), L = specimen thickness (mm), Xd = chloride penetration depth (mm), and t = test duration (h). Source: NT Build 492.
- (3)
- Definitions and calculations for the characteristic parameters of the microporous structure of concrete
Porosity is defined as the ratio of the cumulative volume of mercury introduced under pressure to the total volume of the sample and is quantified by the following equation:
where Vb = total intruded mercury volume and Vt = sample apparent volume.
Assuming that the pore size of the concrete is cylindrical, the average pore size is calculated as follows:
where is the average pore size, V is the total pore volume, and Ak is the total pore area.
The most likely aperture is the aperture with the highest probability of occurrence.
The term “critical pore size” refers to the pore size that indicates the onset of rapid mercury injection in the cumulative mercury injection curve. This measurement can provide insights into the connectivity between pores and the tortuosity of permeation channels.
3. Results and Discussion
3.1. Morphological Deterioration
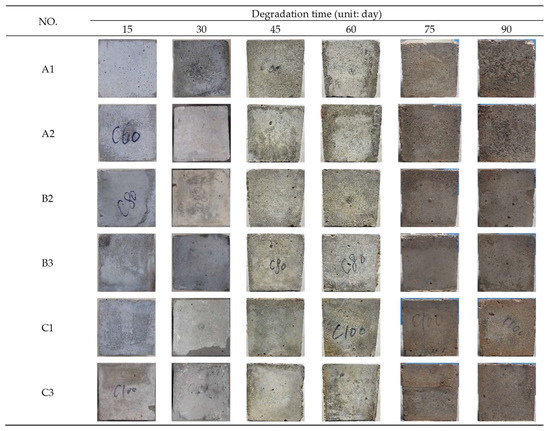
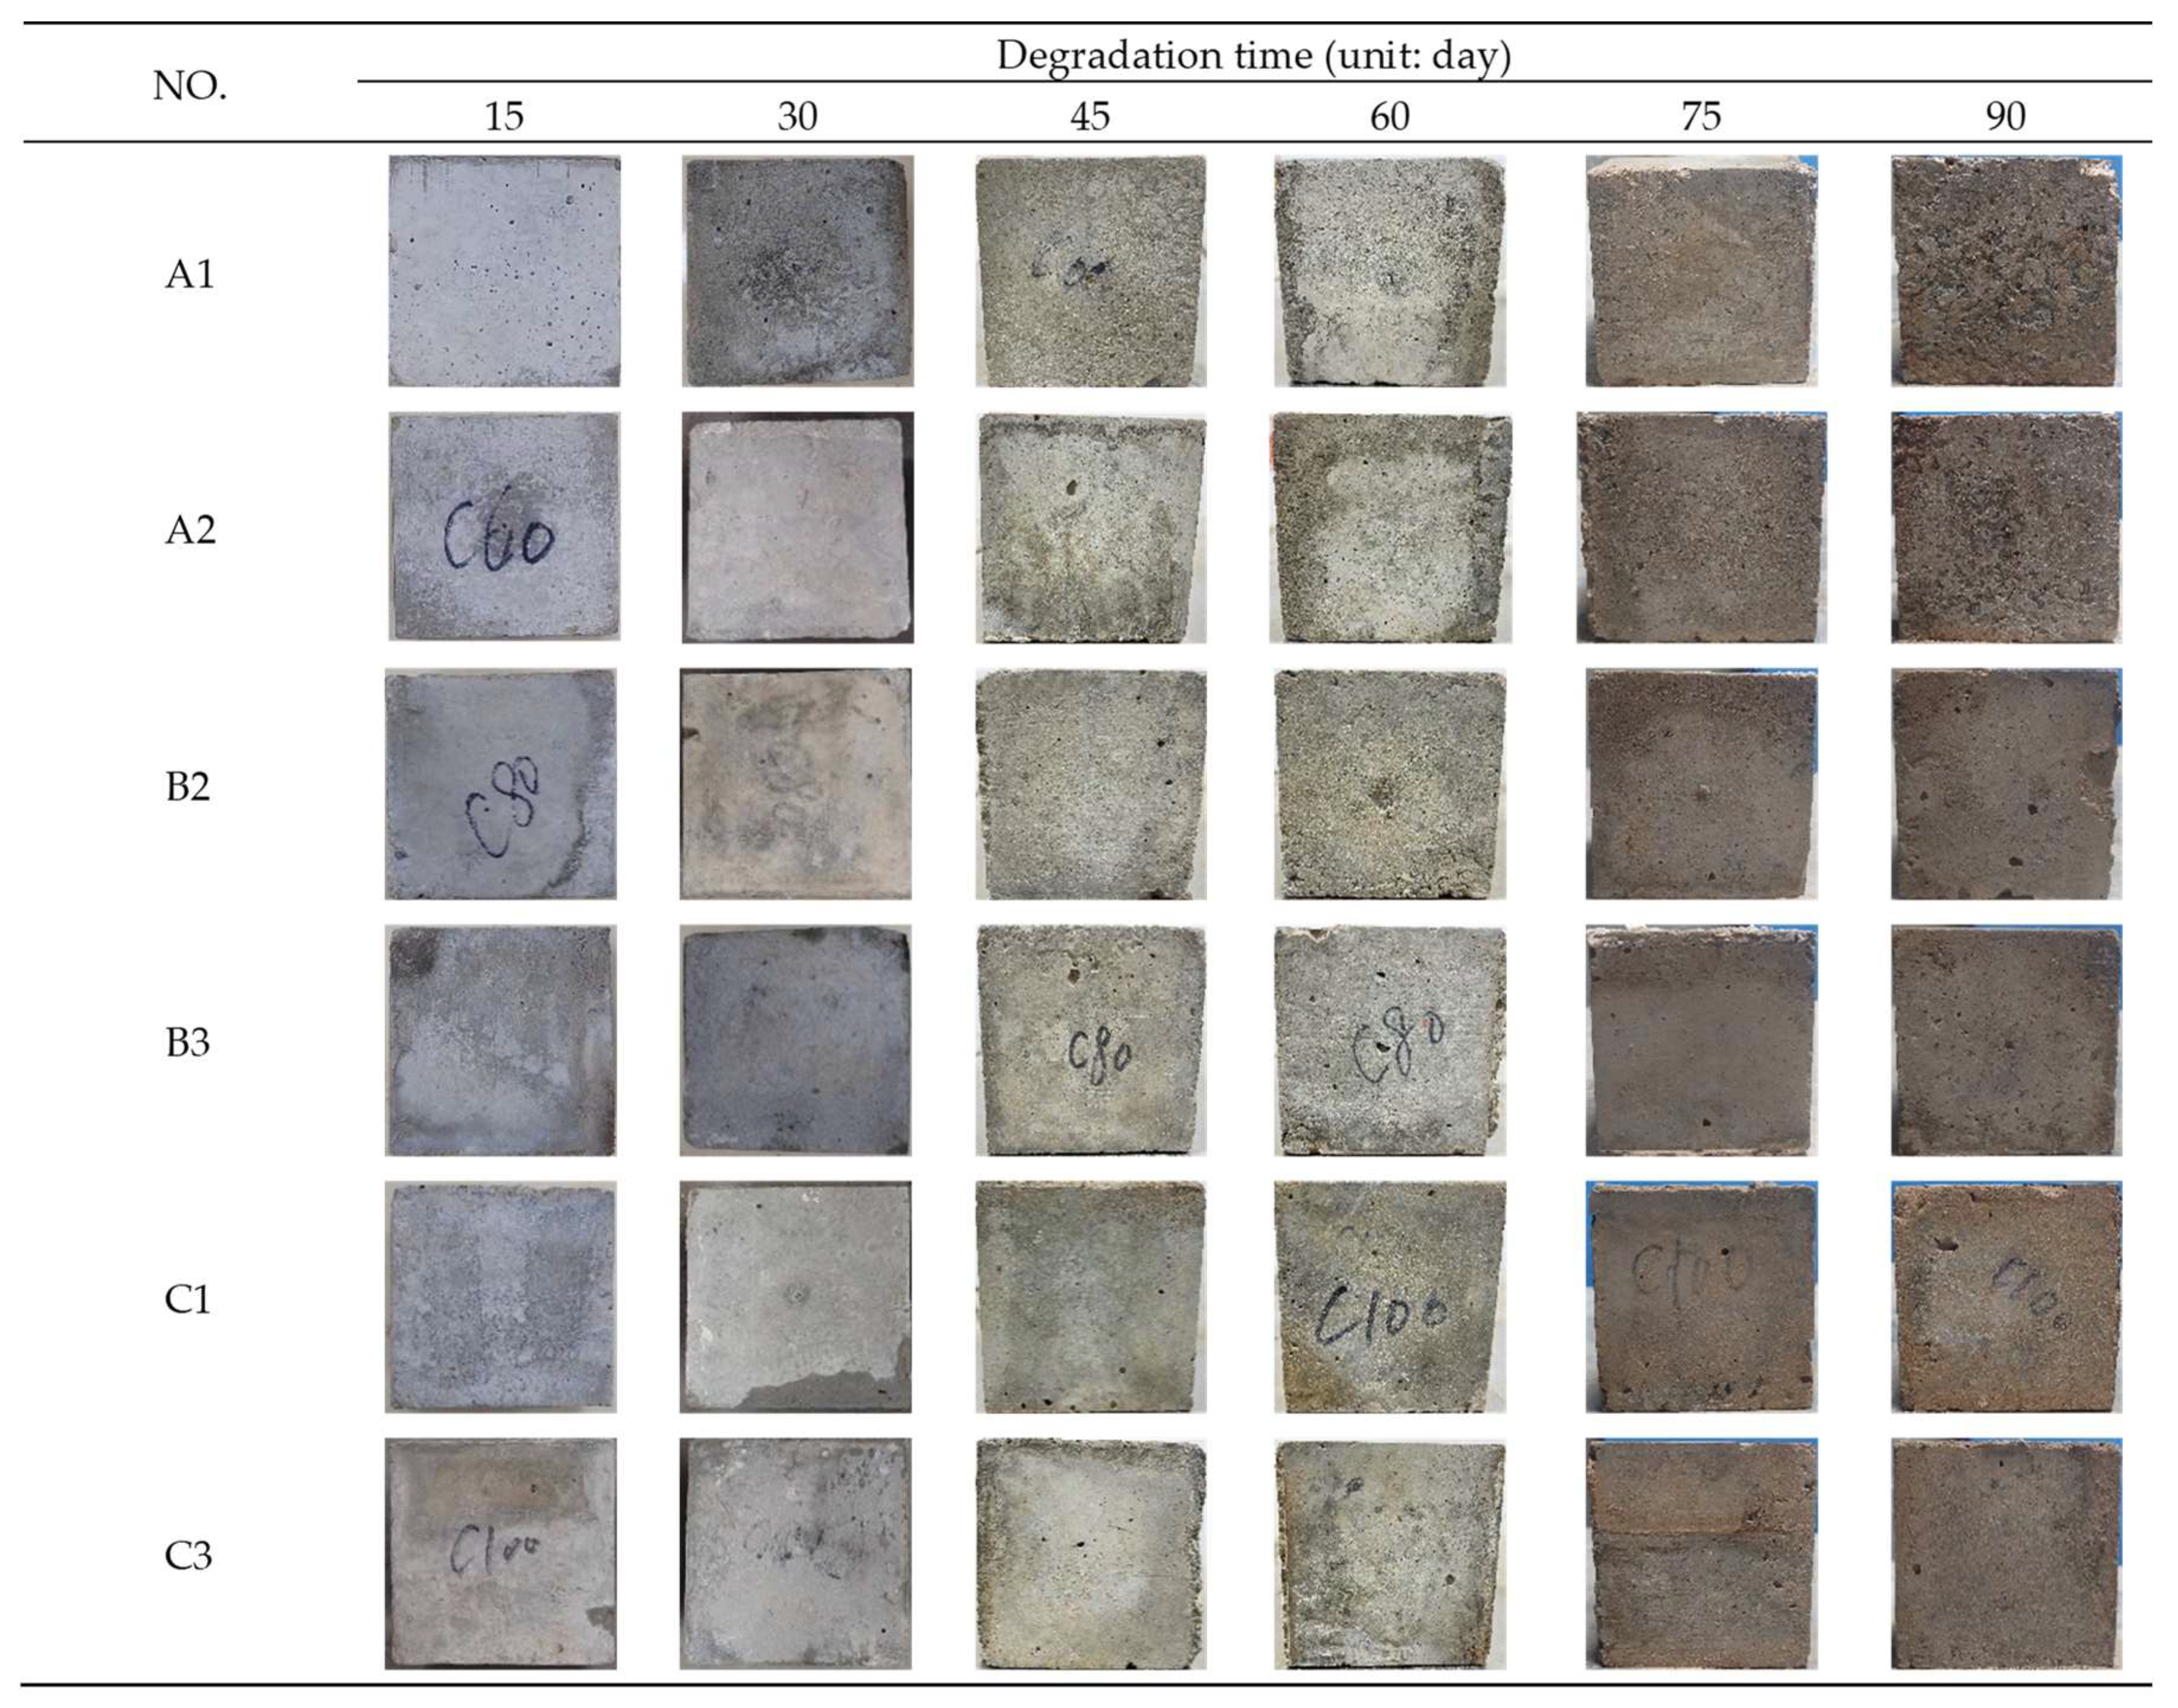
Under sulfate wet–dry cycles, the samples exhibit surface efflorescence, pore enlargement, mortar spalling, and aggregate exposure. Deterioration severity follows the order of Group A (w/b = 0.30) > Group B (0.25) > Group C (0.20). The morphology of representative samples after sulfate erosion is shown in Figure 3. The degradation sequence is consistent with classic sulfate attack mechanisms: surface salt crystallization → pore expansion → mortar cracking → aggregate exposure.
Figure 3.
Surface morphology of the MIWC samples under sulfate wet–dry cycles at different exposure times.
As shown in Figure 3, no obvious deterioration phenomenon was observed on the surface of each sample after sulfate corrosion for 15 days, and only a few pores appeared on the concrete surface, accompanied by salt efflorescence. After 30 days of sulfate attack, the surface of sample A1 deteriorated slightly, presenting a rough concrete surface and many surface pores, whereas the surfaces of the other samples were still smooth, with less obvious deterioration. After 45 days of sulfate attack, the surfaces of the four groups of samples all showed varying degrees of deterioration. The surface deterioration of the concrete with a w/b of 0.30 was more significant, the surface was rougher, and more fine aggregates were exposed. The number of surface pores and surface roughness of the samples with w/b values of 0.25 and 0.20 significantly deteriorated, but no exposed fine aggregates were observed. At 60 days, the degree of deterioration of the concrete increased significantly. The roughness of the surface and the number of pores increased, and more fine aggregates were exposed below the surface. In addition, the cement slurry layer around concrete samples A1 and A2 began to peel off. After 90 days, the surface deterioration of specimens A1 and A2 was the most severe, and the coarse aggregates were exposed on the surface of the concrete. The surface deterioration of the remaining samples was relatively slight, and the cement slurry layer had not yet completely peeled off, resulting in a slightly rough surface. The degree of deterioration was in the order of sample A > sample B > sample C.
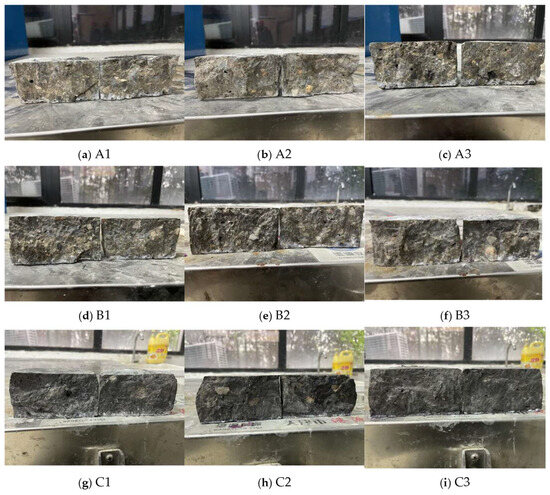
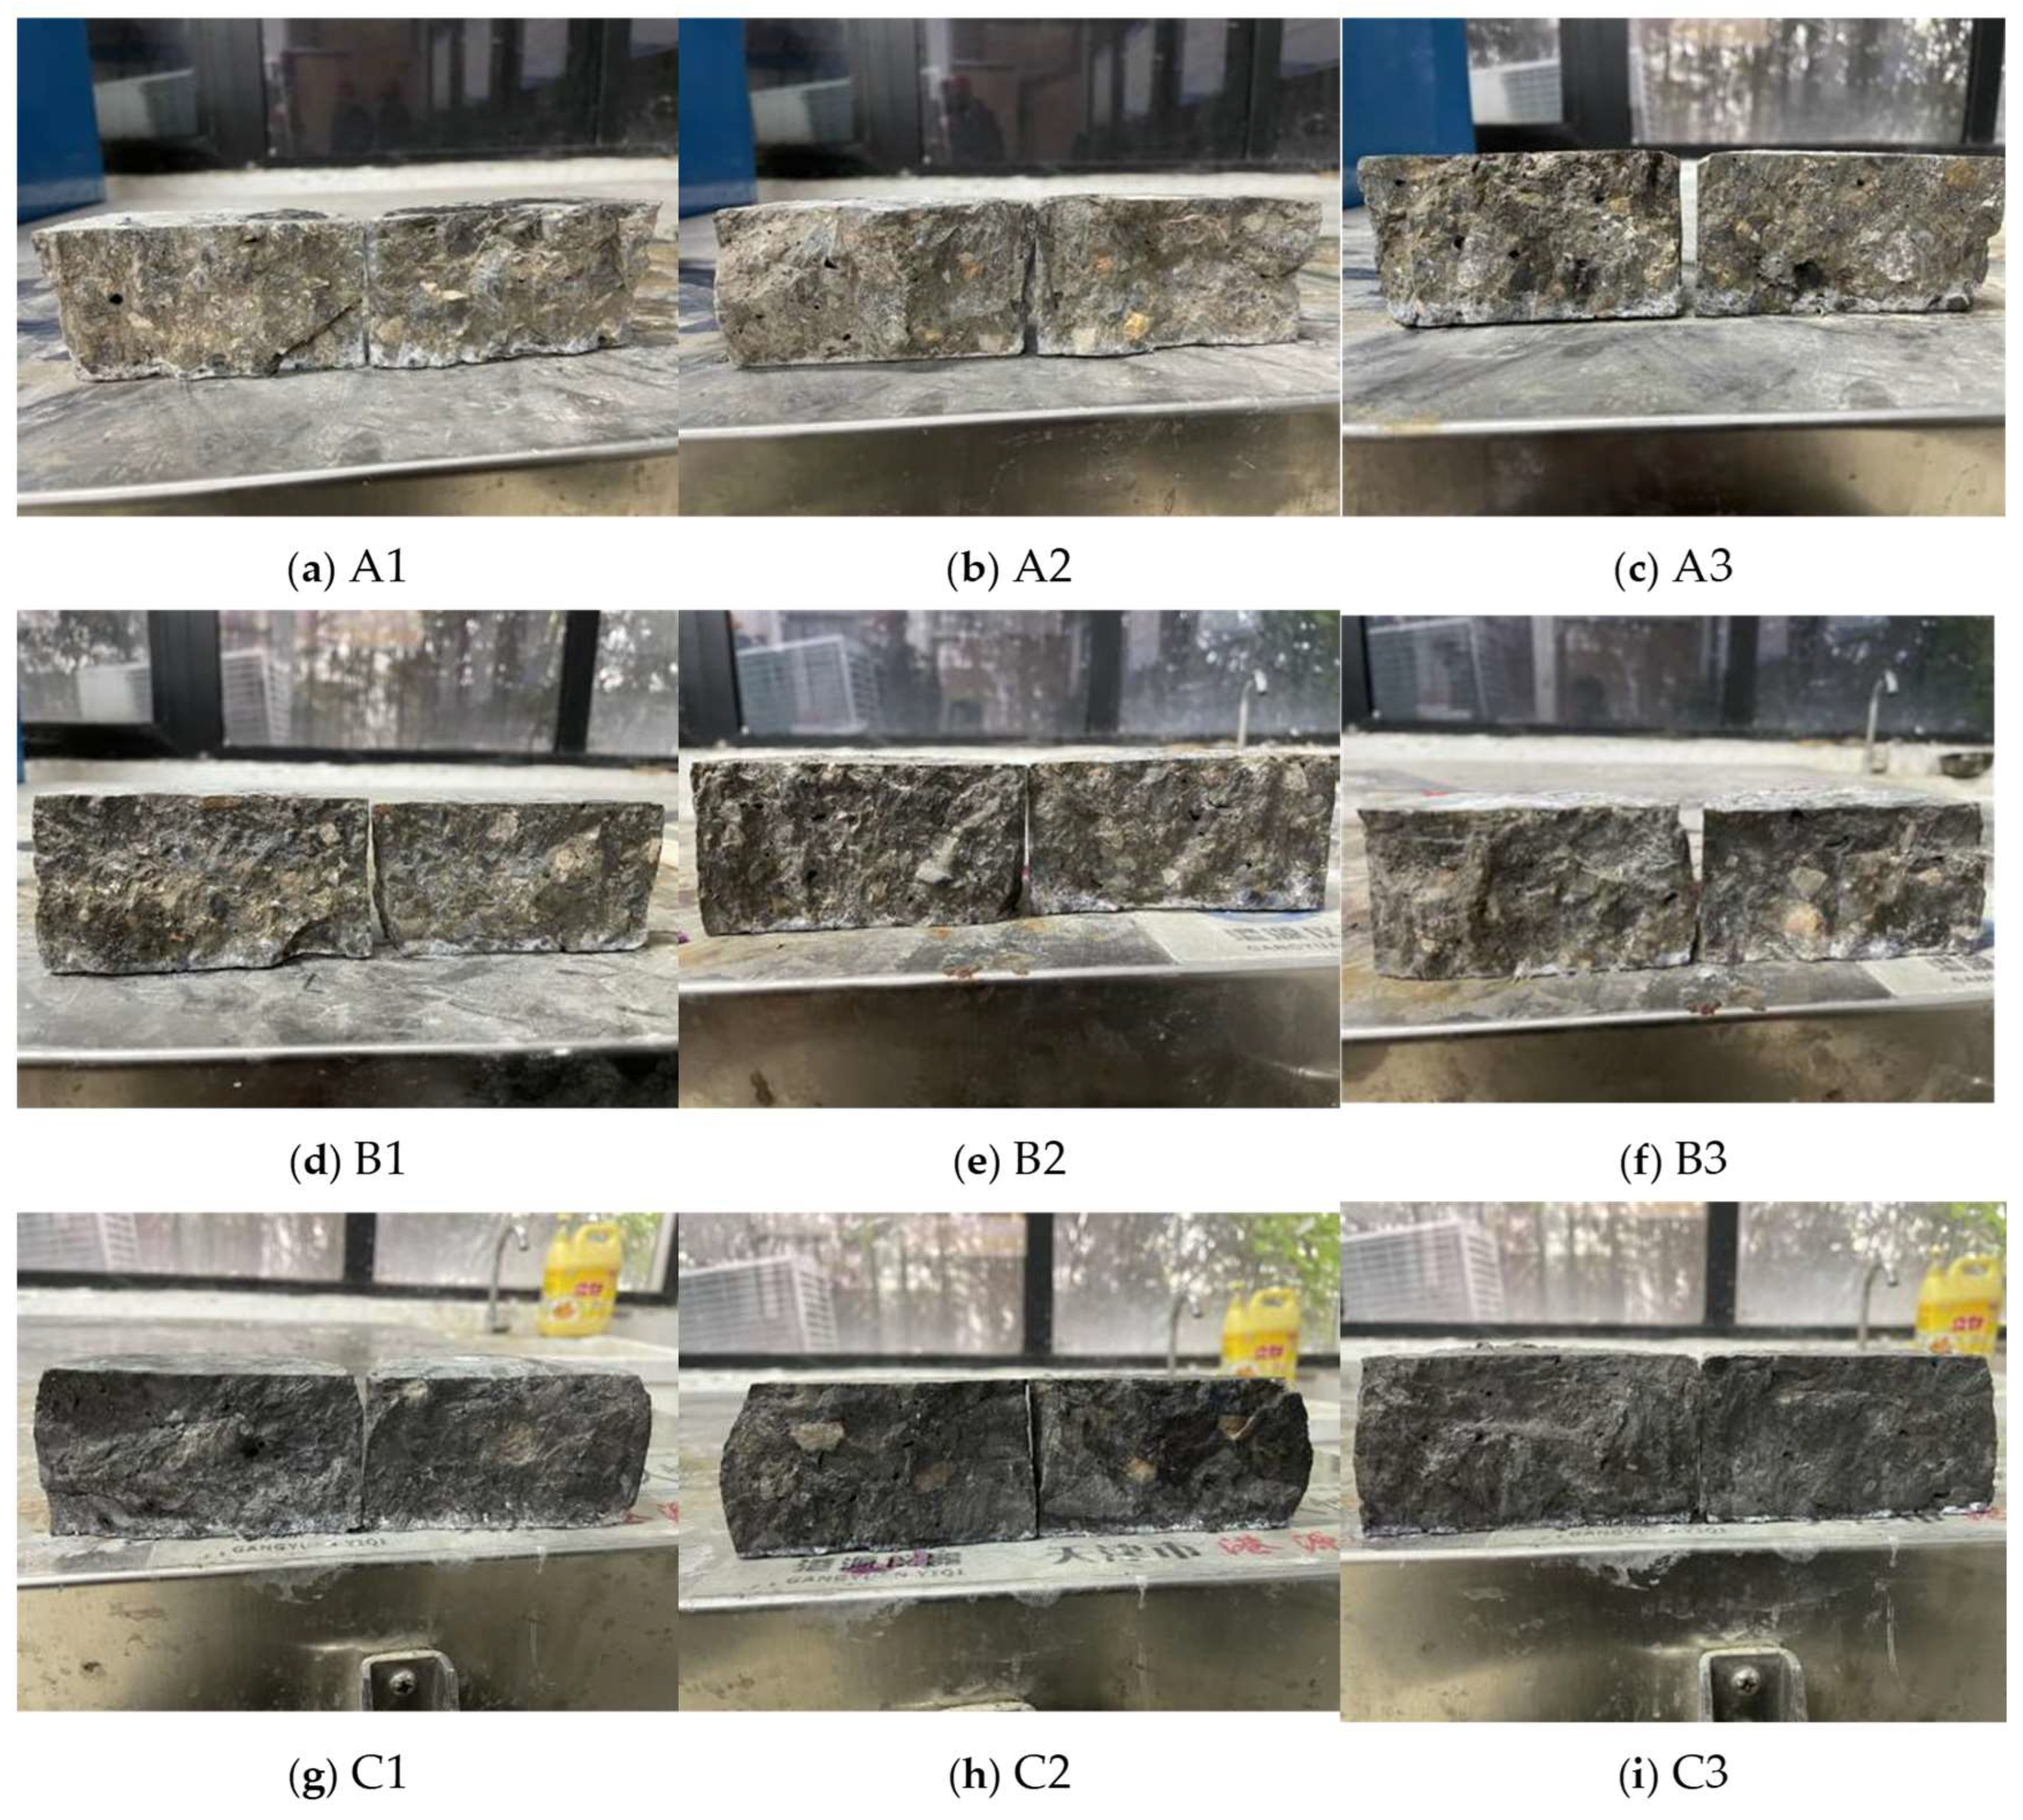
The visual morphology of the chloride ion permeation within the composite LP tailings mixed with sand concrete is illustrated in Figure 4. Analysis of the visible morphology under different w/b ratios reveals a direct correlation between the depth of chloride ion penetration in the concrete and the water–to-cement ratio.
Figure 4.
Chloride ion penetration patterns of MIWC specimens.
3.2. Evolution of the Corrosion Resistance Coefficient (Kf)
Table 2 provides the compressive strength values for each sample after exposure to sulfate. The corrosion resistance coefficient for compressive strength was calculated using Equation (1), where SC represents the concrete with standard curing and DW denotes the concrete after wet-dry cycles.
Table 2.
Compressive strength of the concrete after sulfate attack.
Despite the extent of surface damage, all the samples exhibited an increase in compressive strength within 45 days of sulfate exposure. This can be attributed to the intact concrete slurry core and the continued hydration of the cement, both of which contribute to enhanced compressive strength. Notably, the compressive strength of sample A decreased sharply after 60 days of sulfate exposure. In the advanced stages of sulfate erosion, the decrease in compressive strength is largely attributed to cumulative damage from chemical or physical sulfate erosion coupled with a diminished concrete slurry core.
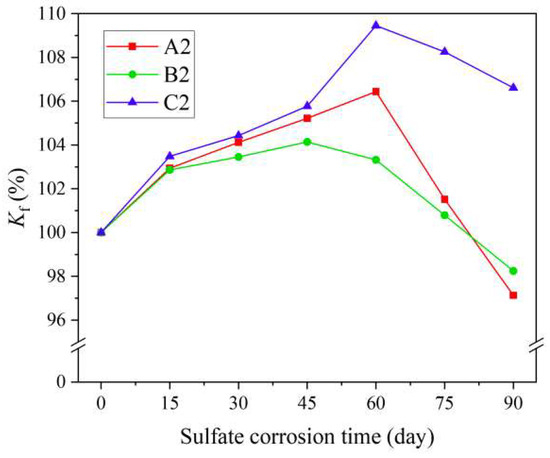
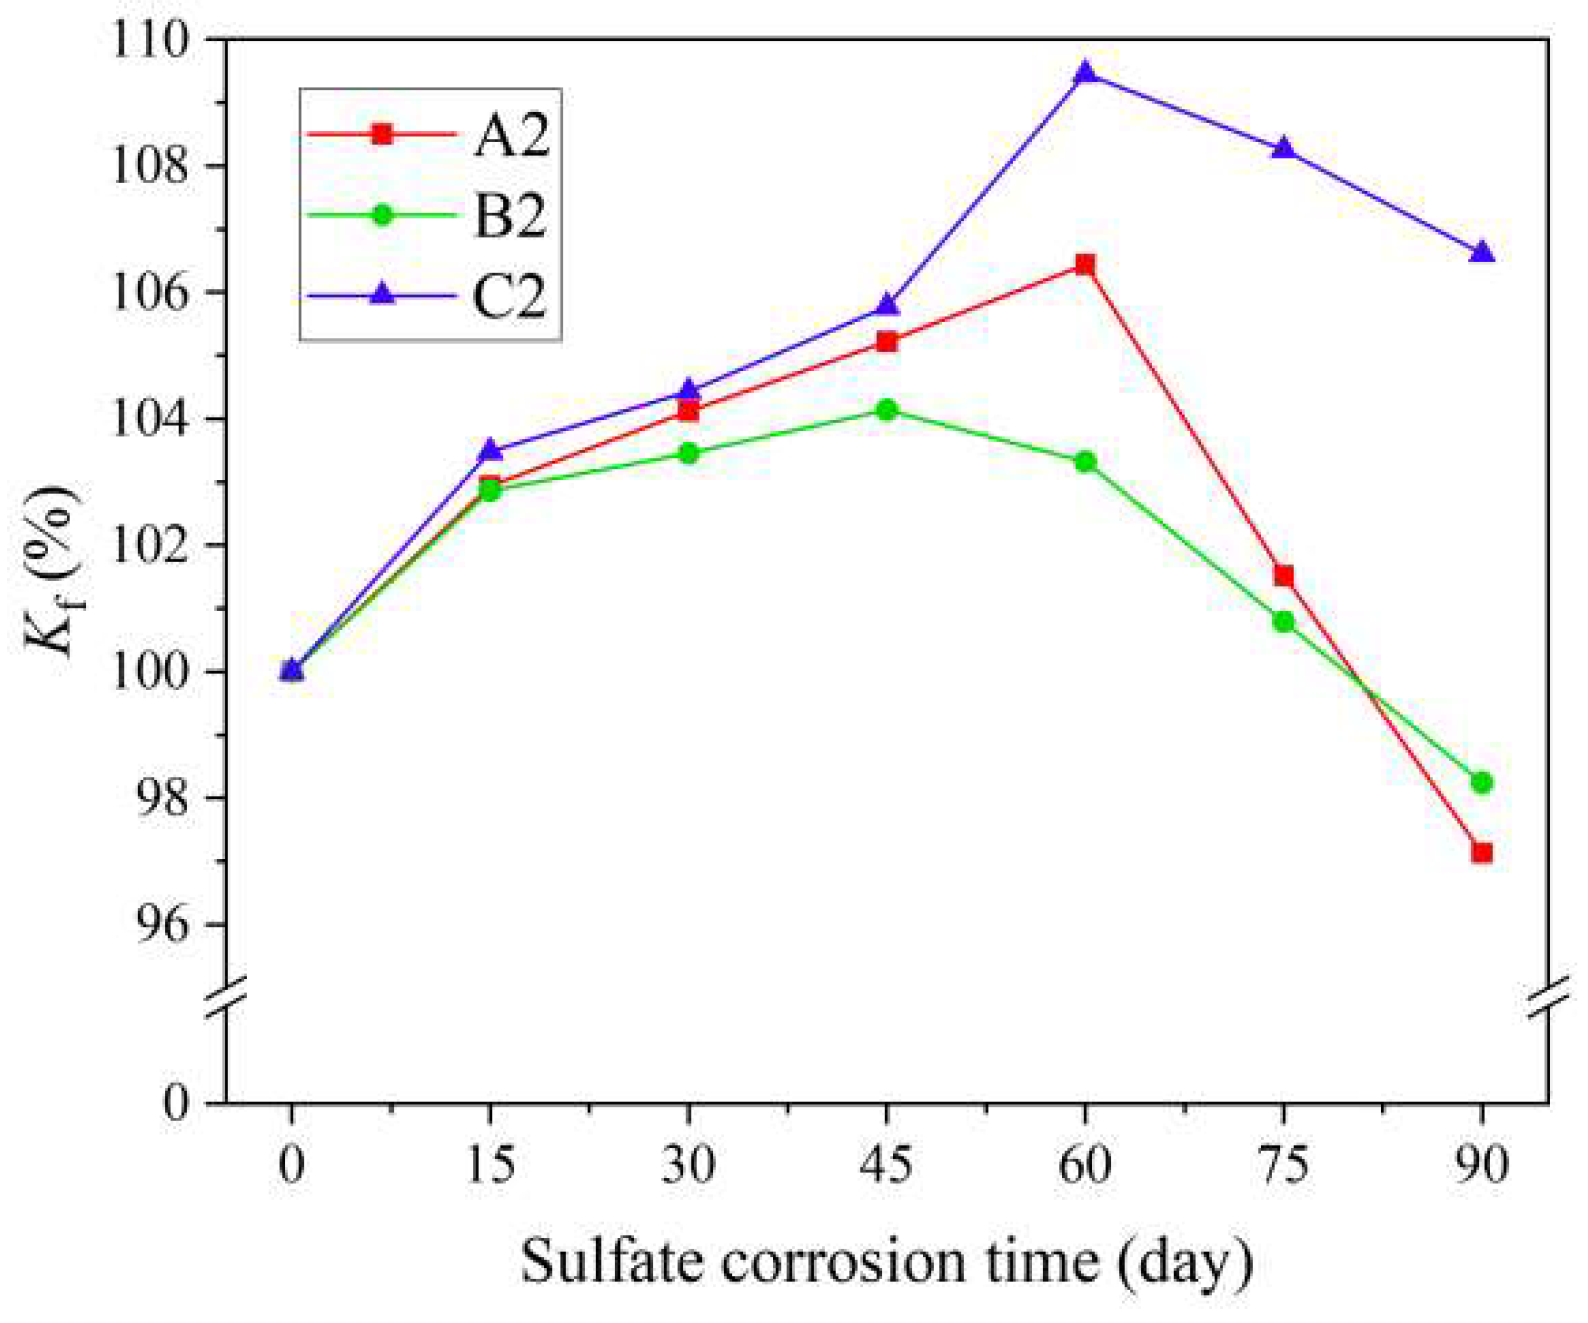
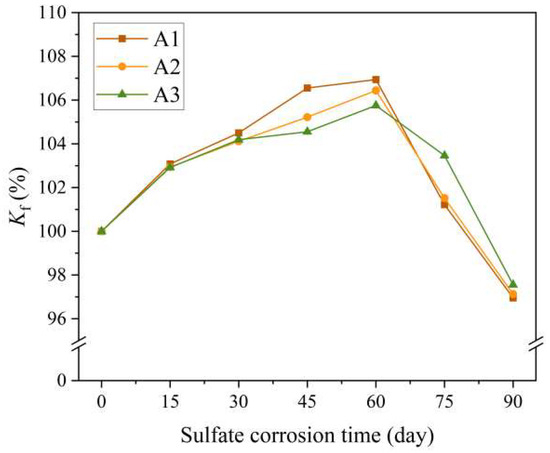
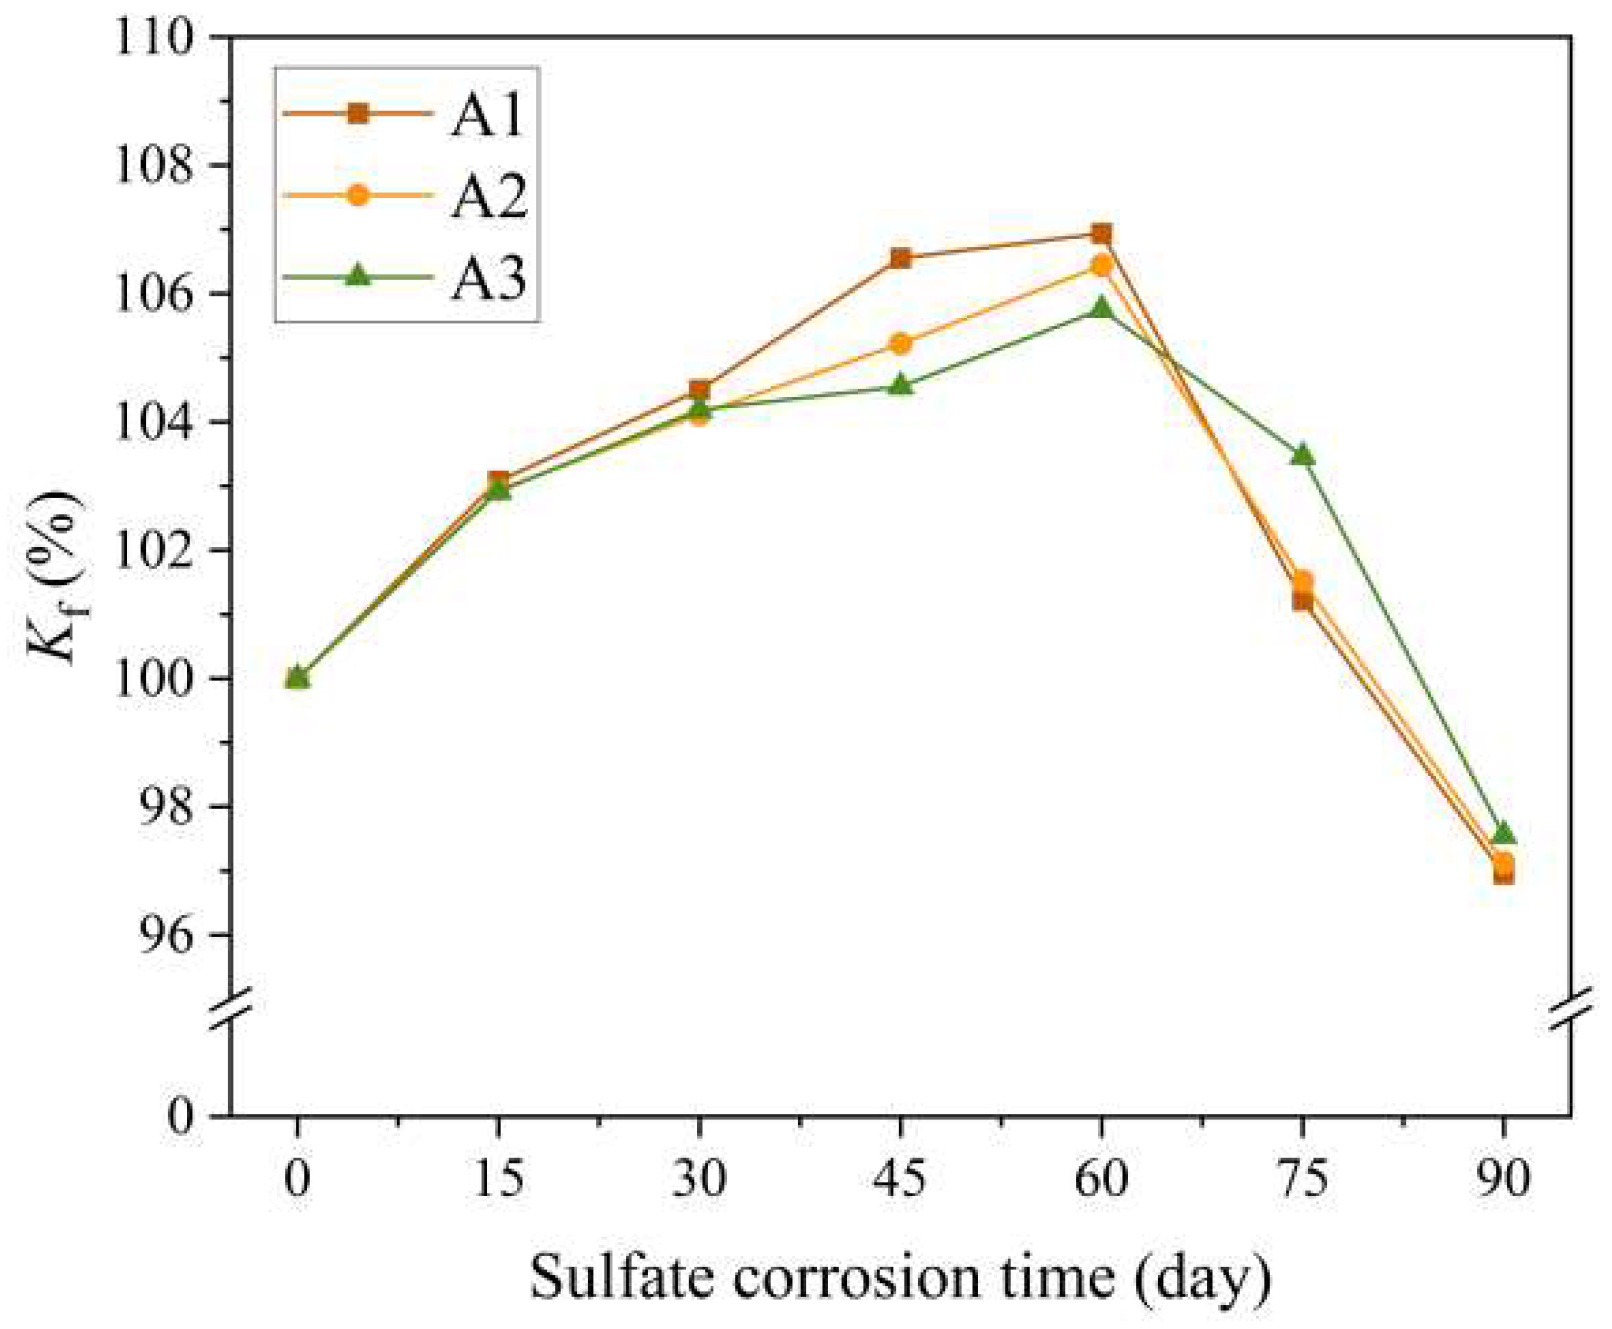
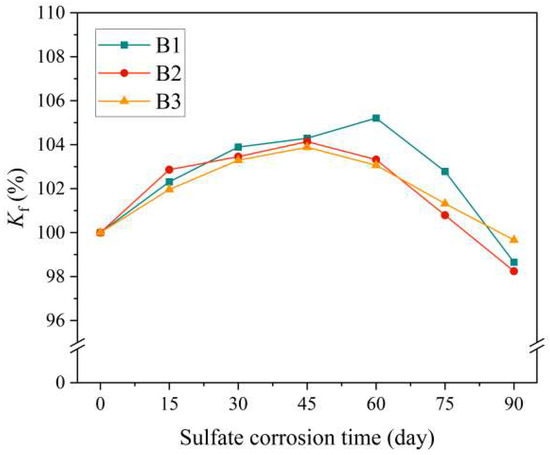
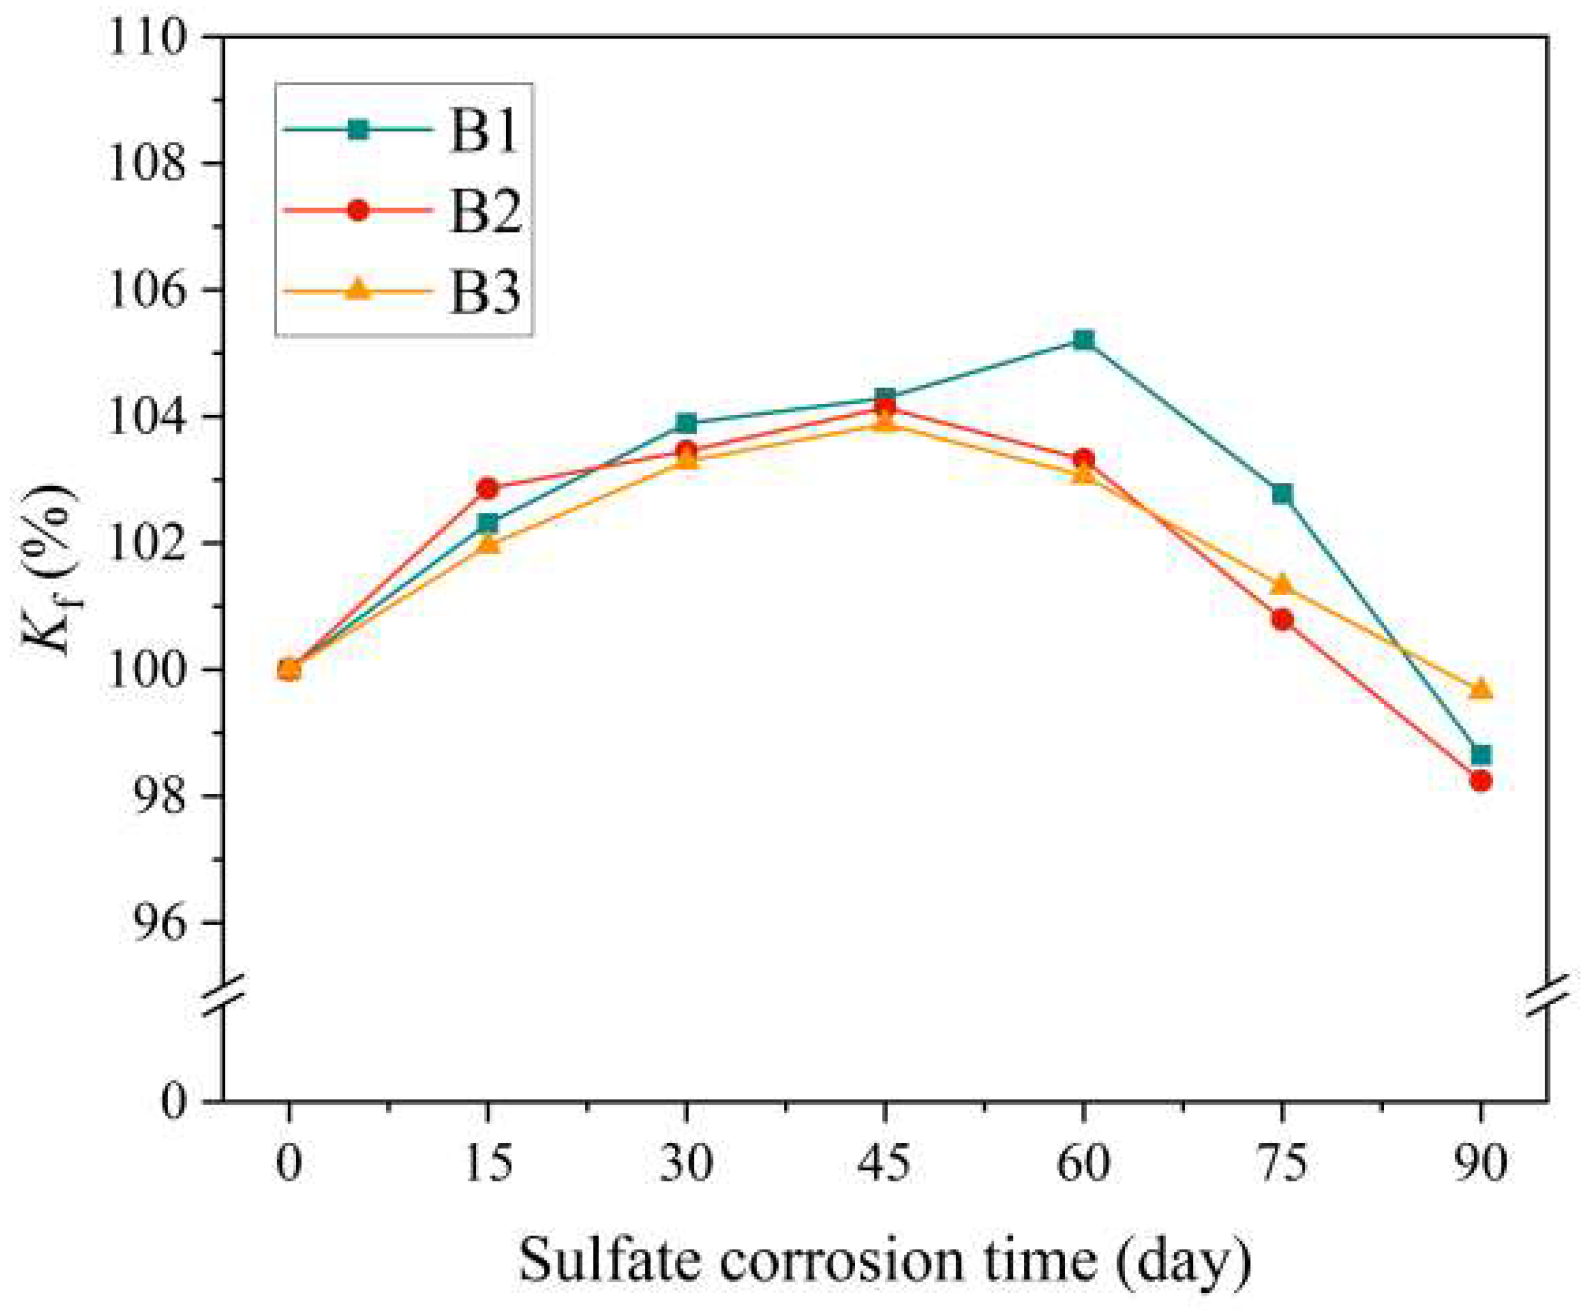
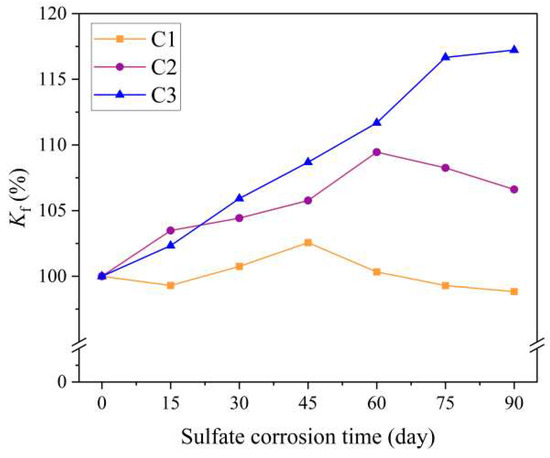
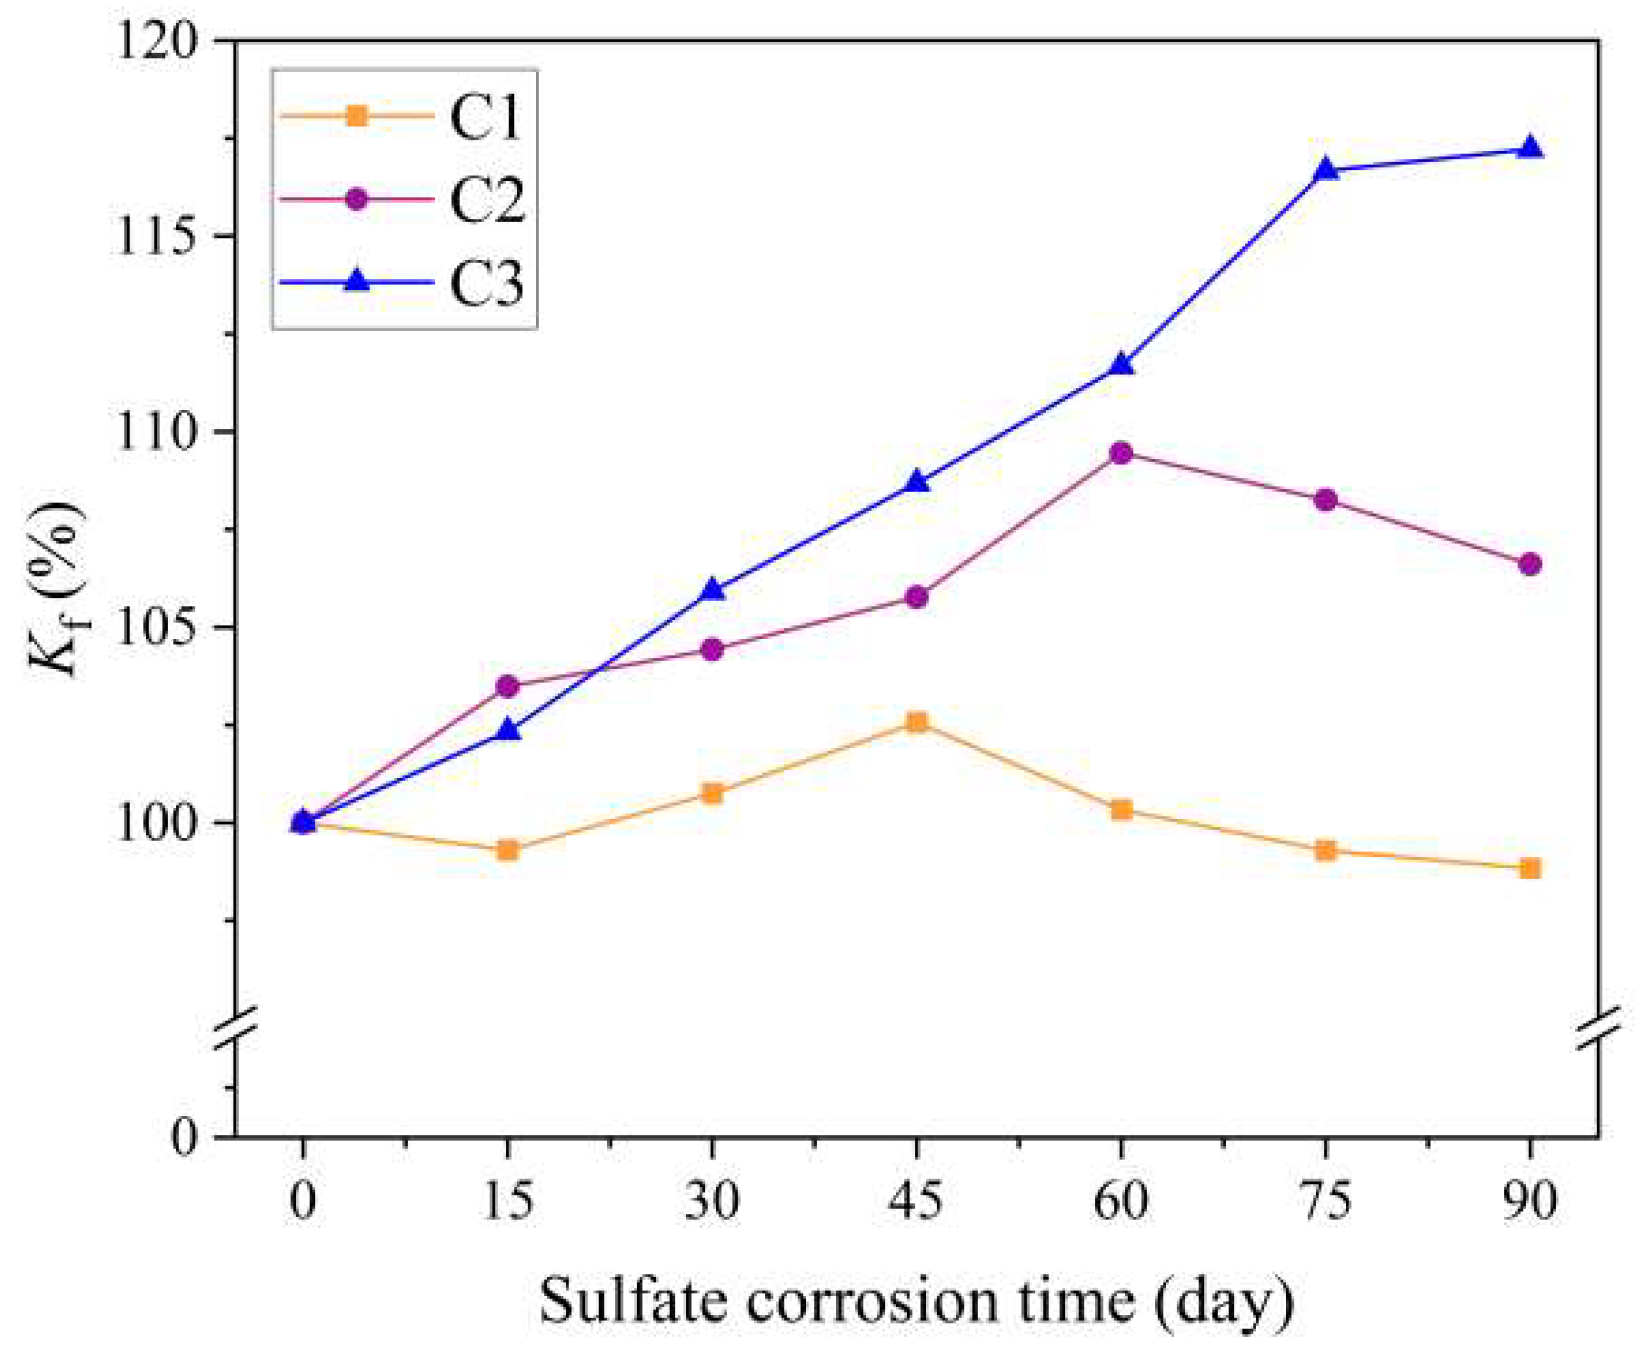
Kf initially increases because of pore filling by AFt and continued hydration but then decreases as expansive cracking becomes predominant. In Figure 5, Figure 6, Figure 7 and Figure 8, a unified Y-axis scale (96–120%) is adopted for direct comparison of variable effects. (1) w/b ratio: A lower w/b delays strength loss; C2 (0.20) maintains Kf > 106% at 90 d. (2) Tailings sand ratio: The effects are minor (<2% difference at 45 d), indicating a limited influence within the tested range. (3) SF content: A higher SF refines pores and stabilizes long-term Kf. (4) LP content: C3 (65 kg LP) shows a continuous Kf increase up to 90 d, likely still in the pore-filling stage; extended cycling (>120 d) is required to capture a later decline.
Figure 5.
Evolution of corrosion resistance coefficient Kf with sulfate corrosion time under different w/b ratios.
Figure 6.
Evolution of corrosion resistance coefficient Kf with sulfate corrosion time under different mix sand proportions.
Figure 7.
Evolution of the corrosion resistance coefficient Kf with respect to the sulfate corrosion time for different SF contents.
Figure 8.
Evolution of the corrosion resistance coefficient Kf with respect to the sulfate corrosion time for different LP contents.
3.2.1. Influence of the w/b Ratio on Kf
The variation in Kf of the concrete with different w/b values is shown in Figure 5.
The Kf value of sample A2 (w/b = 0.30) initially increased and reached 106% at 60 days of sulfate attack but then decreased significantly and reached 97% at 90 days, which can be defined as the “initial increase and sudden drop”. For specimen B2 (w/b = 0.25), Kf increased slowly and reached a peak value of 104% at 45 days of sulfate corrosion, then decreased slowly and reached 98% at later stages, which can be defined as the “slow rise and slow fall” type. For specimen C2 (w/b = 0.20), the Kf value increased rapidly and reached 109% at 60 days of sulfate attack but then decreased slightly and reached 107% at later stages, which can be defined as the “rapid increase and slight decrease” type. A comparison of the changes in the compressive strength Kf of the three types of concrete revealed that the early growth rate of the three types of concrete was C2 > specimen A2 > specimen B2.
3.2.2. Effect of Mechanism-Tailings Mixed Sand on Kf
The variation in Kf of the concrete under the same w/b and different aggregates is shown in Figure 6.
After 60 days of sulfate exposure, the Kf value for sample A1 increased gradually to approximately 107% before subsequently decreasing. This trend is characterized by an initial increase followed by a steady decrease, with a slow increase in the early phase and a consistent decrease in the later phase. For specimen A2, the Kf value initially increased to approximately 106% but then decreased, indicating a “slow rise and slow fall” pattern with minimal overall fluctuation. Conversely, specimen A3 quickly decreased after an initial increase of approximately 105%, representing the least increase in the early stage and the most significant decrease in the later stage. When these patterns were compared, the rate of initial growth followed the order of sample A1 > sample A2 > sample A3, whereas the rate of subsequent decline was sample A3 > sample A2 > sample A1. As the proportion of tailings sand in the mechanism mixed sand increased from 25% to 35%, no significant difference was observed in the corresponding Kf values of the concrete under sulfate erosion at various times, with the maximum difference being 2% at 45 days of erosion.
3.2.3. Effect of SF on Kf
The variations in Kf of concrete with a constant w/b but different amounts of SF are shown in Figure 7.
Under sulfate attack for 0–60 d, the Kf value of sample B1 showed a trend of “a greater increase first and then a greater decrease”, from approximately 105.5% to 98.5%. Under sulfate corrosion for 0–45 d, the Kf value of sample B2 showed a trend of “a moderate increase first and then a moderate decrease”, from 104% to 98%. Under sulfate corrosion for 0–45 d, the Kf value of sample B3 showed a trend of “a smaller increase first and then a smaller decrease”, from 103.5% to 99.5%. The early growth rate was sample B1 > sample B2 > sample B3, and the later decline rate was sample B1 > sample B2 > sample B3. With the increasing proportion of SF, the stability of sample B3 against sulfate corrosion gradually increases, whereas the corrosion resistance of sample B1 is better in the early stage but worse in the later stage. The main reasons for this are the material density, the properties of the anti-corrosion components, and the content of SF. These factors affect the generation rate of corrosion products and the degree of structural damage, resulting in differences in Kf.
3.2.4. Effect of LP Amount on Kf
The variations in Kf of the concrete with a fixed w/b but different amounts of LP are shown in Figure 8.
The Kf value of sample C1 decreased to 99% after sulfate corrosion for 0–15 days, then increased to 102% for 15–45 days, and finally, it decreased again. The whole process showed a trend of “first decreasing, then increasing, and finally decreasing, with significant fluctuations”. For sample C2, the Kf value gradually increased to 109% after sulfate corrosion for 0–60 days but then decreased, showing a trend of “first increasing and then decreasing” in the later stage. The Kf value of sample C3 tended to increase continuously throughout the entire cycle, and no decrease was observed. This may be attributed to the sustained secondary reactions of SCMs in C3 samples during the 90-day sulfate erosion process, with no significant deterioration observed in their internal pore structure. During the whole process, the growth rate of the Kf value of sample C3 was the most significant. The Kf value of sample C2 tended to first increase but then decrease, and the initial increase phase was relatively stable, but the amplitude decrease in the later stage was large. The Kf value of sample C1 fluctuated frequently, and the overall change was complex. With increasing LP content, the sulfate corrosion resistance of sample C3 > sample C2 > sample C1. Owing to the comprehensive influence of material composition, compactness and corrosion products on the structure, different Kf variation laws were formed.
3.3. Coupled Chloride–Sulfate Interactions
The coupled action of chloride ingress and sulfate attack leads to synergistic deterioration in concrete containing multiple industrial wastes, and the degradation effect is significantly more severe than that observed under single-factor erosion. Compared with that under single-chloride penetration, the chloride diffusion coefficient of concrete under coupled exposure increases by 18.3–35.7%. Microcracks generated by sulfate erosion provide preferential transport paths for chloride ions and significantly increase ion transport rates. Moreover, the duration for the corrosion resistance coefficient Kf to decrease to the critical value of 0.75 is shortened by 15–25%, indicating that chloride ions promote the formation and expansion of sulfate corrosion products and accelerate strength attenuation and structural damage.
The deterioration process under coupled conditions clearly shows two-stage characteristics. In the early stage, sulfate ions react with calcium hydroxide and calcium aluminate hydrates to form ettringite and gypsum. These products fill surface pores and improve matrix compactness, temporarily reducing the chloride transport rate. In the later stage, the continuous crystallization pressure induces stable microcrack propagation and connectivity, resulting in the formation of continuous permeation channels. As a result, the chloride penetration rate and penetration depth increase significantly, and the degree of structural degradation further intensifies.
The synergistic deterioration effect is closely related to the compactness of the matrix. Reducing the w/b ratio from 0.30 to 0.20 weakens the synergistic effect by approximately 40%. SF and LP refine the pore structure and increase the binding capacity of the material, which can effectively alleviate coupled damage. Therefore, the interaction of chloride and sulfate is the key factor controlling the durability degradation of multi-industrial waste concrete in marine environments, and its quantitative influence must be considered in durability design and service life prediction.
3.4. Sulfate Damage Prediction Model
The ultimate objective of studying the corrosion resistance coefficient model, denoted as Kf, is to predict the lifespan of concrete in sulfate-rich environments, denoted as tlife. This represents the duration required for Kf to decrease to the critical failure threshold, marked as Kcrit. The calculation of tlife is based on both fractional and exponential models.
- (1)
- The failure threshold Kcrit is usually taken as 0.7–0.8 in engineering, but the exact value should be determined according to the structural safety level, regulation requirements and statistical data.
- (2)
- The fractional model is particularly suitable for scenarios where saturation effects are apparent in erosion damage. This occurs, for instance, when the accumulation of expansion products hinders subsequent reactions.
Let and bring it into the model as follows:
Therefore,
where fcu is the compressive strength of the concrete, a is the rate of sulfate attack on the concrete, and b is the nonlinear exponent. The lifespan of the concrete is directly proportional to fcuc/b, indicating that increased strength can significantly extend the lifespan. Furthermore, the lifespan is inversely proportional to a−1/b, suggesting that a more severe erosion environment (characterized by a larger value of a) results in a shorter lifespan. Additionally, the magnitude of b influences the sensitivity of the time effect; a larger value of b corresponds to greater sensitivity and a more pronounced response of the lifespan to parameter changes.
- (3)
- Exponential model: This model is appropriate for chain reactions in which the rate of damage is proportional to the present state, as observed in phenomena such as accelerated crack propagation.
Let and consider taking the natural logarithm.
Then,
Based on these equations, the calculation results of tlife in the experiment are shown in Table 3.
Table 3.
Predicted service life of MIWC under sulfate attack.
3.5. Chloride Diffusion and Service Life Model
The results of the chloride ion penetration depth in the MIWC with composite tailings mixed sand are shown in Table 4.
Table 4.
Chloride penetration depth and diffusion coefficients of the MIWC.
In the absence of surface cracks in a saturated solution, Fick’s second law is typically employed to estimate the service life of concrete in a Cl- environment. However, within practical engineering applications, the diffusion pattern of chloride ions in concrete structures significantly changes because of factors such as internal damage evolution, the binding effect between chloride ions and concrete, and a time-dependent diffusion coefficient. Consequently, optimizing the fundamental Fick model via a multifactor coupling approach is imperative. The subsequent section presents a derivation of the chloride ion diffusion model, considering these factors. Model parameters α, D0, kd, β, R0, γ, δ, and n are quantified and listed. The x in Table 5 is the designed concrete cover thickness, not the measured penetration depth; this is clearly annotated. Model validation against experimental data yields an RMSE < 8%.
Table 5.
Calculated service life of the MIWC under chloride ion penetration.
- (1)
- Consequences of Internal Concrete Damage
Microcracks or pore damage in concrete, caused by factors such as loading, shrinkage, or corrosion, create an “accelerated channel” for the diffusion of chloride ions. The variable D(t) is employed to measure the extent of this damage, with values ranging from 0 to 1. D = 0 signifies no damage, whereas D = 1 denotes total destruction. The influence of damage on the diffusion coefficient is represented as an amplification effect as follows:
where f(D(t)) is the damage correction function, which is usually in exponential form as follows:
The evolution of the damage variable D(t) can be described by a damage mechanics model as follows:
- (2)
- The binding ability between chloride ions and concrete
The cementitious materials in concrete fix some chloride ions through physical adsorption or chemical bonding (such as by reacting with AFm to generate Friedel salts), and only free chloride ions participate in diffusion. Equation (14) introduces the binding coefficient R (the ratio of total chloride ion concentration Ctotal to free chloride ion concentration Cfree):
The correlation coefficient R with the concrete composition and total chloride ion concentration can be fitted through experiments as follows:
- (3)
- Time dependence of the diffusion coefficient
As the age of the concrete increases (hydration reaction continues and pore refinement occurs), the diffusion coefficient gradually decreases, and a power function decay model is used as follows:
where Dref is the diffusion coefficient at the baseline age tref (such as 28 days) and n is the time decay index (usually 0.2 ≤ n ≤ 0.5; the greater the amount of active solid waste added, the greater n is).
After these factors are considered, the control equation for chloride ion diffusion needs to be modified based on the migration behavior of free chloride ions. In combination with Fick’s second law, the diffusion coefficient of free chloride ions is the time-dependent coefficient Ddam(t) after damage correction, and its diffusion equation is as follows:
The free chloride ion concentration is converted to the total chloride ion concentration Ctotal(x, t) by combining the coefficient R as follows:
After the diffusion equation is substituted, the control equation for the total chloride ion concentration is defined as follows:
- (4)
- Correction of initial and boundary conditions
① Initial conditions
The initial total chloride ion concentration distribution during concrete pouring is as follows:
② Boundary conditions
The total surface chloride ion concentration is influenced by both the environmental chloride salt supply and binding capacity and is a time-dependent function:
where Cs,free(t) is the concentration of surface free chloride ions and Rs(t) is the surface binding coefficient. The initial total chloride ion concentration deep inside the structure (x → ∞) is maintained as follows:
- (5)
- Optimized expression of the chloride ion diffusion model
A diffusion model for the final total chloride ion concentration, which integrates damage evolution, binding ability, and the time-dependent diffusion coefficient, can be constructed as follows:
The residual life is when chloride ions diffuse to the thickness of the protective layer (i.e., the “chloride ion penetration depth” x of the sample) and reach the critical corrosion concentration Ccr. When Ctotal(x, t) = Ccr, the service life of the MIWC against chloride ion erosion is obtained, as shown in Table 5.
As the w/b value decreases, the mean lifespans of samples A, B, and C are 47.0, 60.6, and 94.7 years, respectively. This finding indicates that with every 0.05 reduction in the water–cement ratio, the average lifespan increases by 30% to 56%. In sample Group A, variations in the tailings sand-to-mechanism sand ratios initially increase the lifespan but subsequently decrease, with the optimal ratio being approximately 183:428 (where tailings sand constitutes 29.8%). For sample Group B, a rise of 31 kg in SF content enhances the lifespan by approximately 39.3% to 42.6%. Notably, the lifespan of sample C3 is three times that of sample A3. In Sample Group C, as the LP and dosage gradient vary, the service life increases from 12.5% to 19.4% for each 32 kg increment in dosage. When the dosages of fly ash and slag remain consistent, they predominantly exhibit a synergistic optimization effect.
3.6. Model Advantages and Limitations
Mechanistic links among the microstructure, ion transport, and macroscopic durability are strengthened. The findings are compared with recent studies by Xiong [35] and Yang [36] to highlight consistency and innovation. The coupled model outperforms traditional Fick’s law by including damage and binding effects. Limitations include a short sulfate cycling period (90 d) and a lack of long-term field validation. The 90 d sulfate test cycle is relatively short, and the sulfate erosion resistance of concrete with a w/b ratio of 0.20 may not be effectively evaluated. The accuracy of the model requires further validation through long-term experimental studies.
3.7. Pore Structure and Microscopic Morphology Analysis
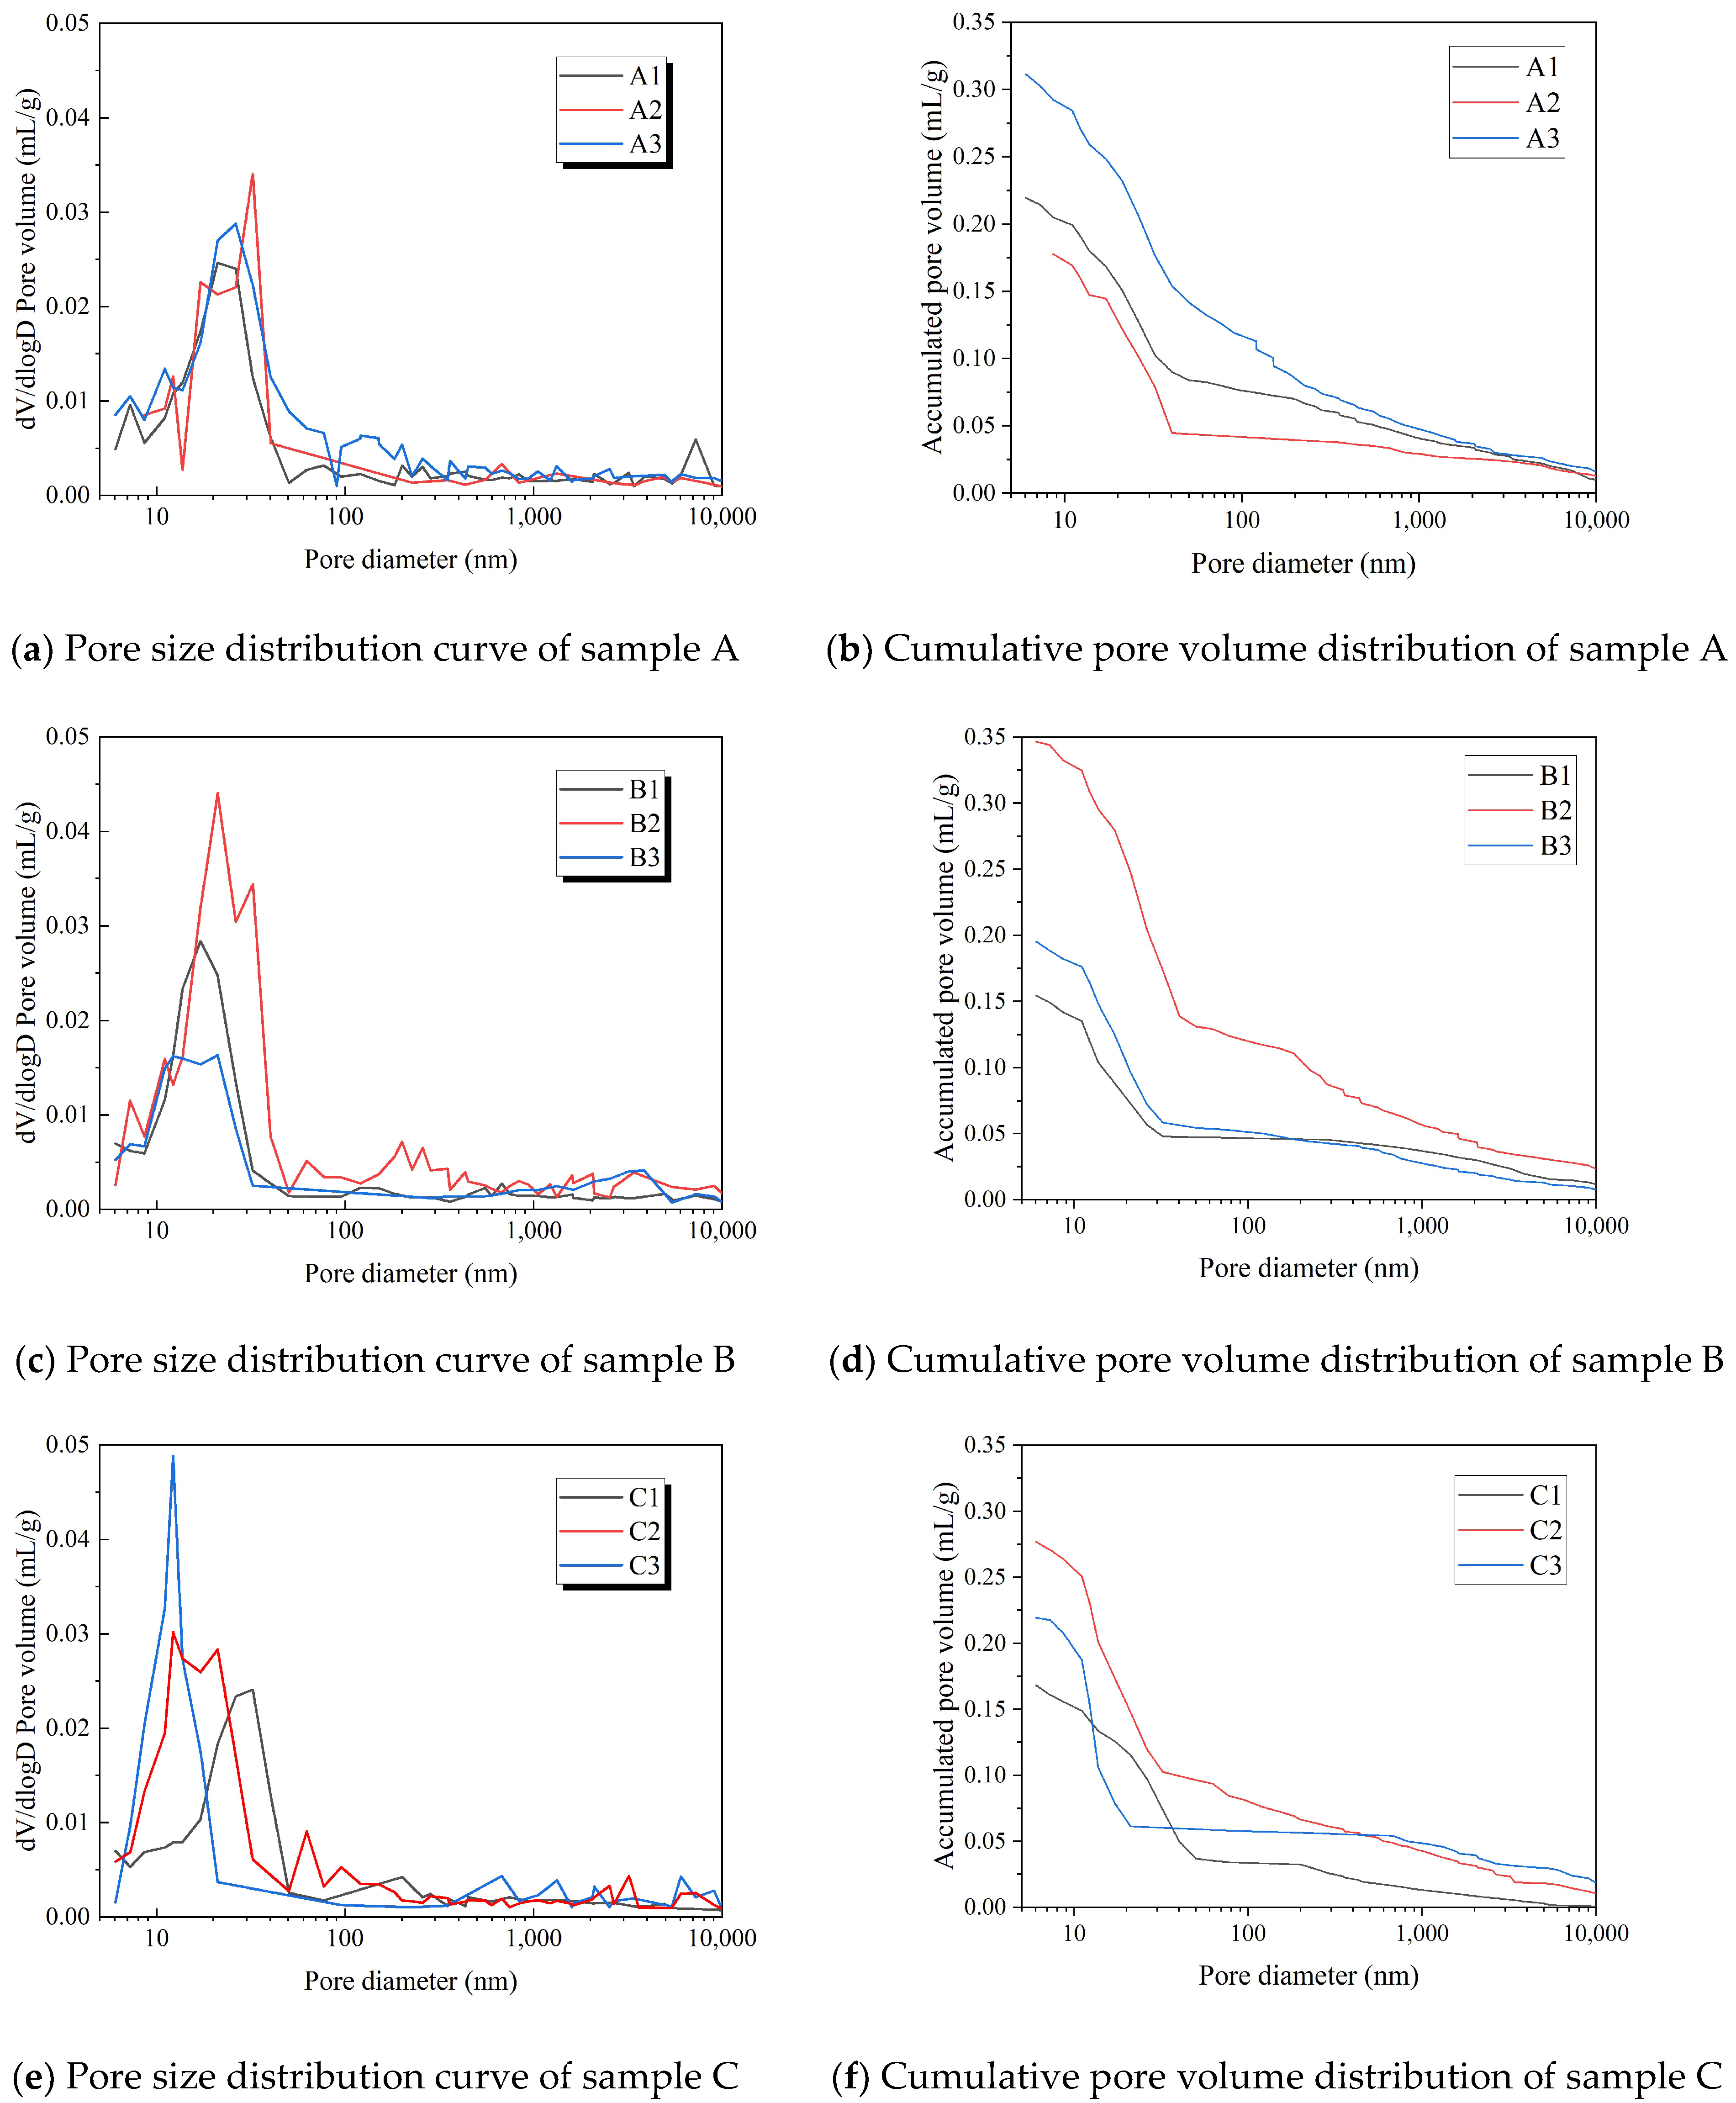
Table 6 presents the characteristic parameters of the pore structure of the high-strength concrete, incorporating composite LP tailings mixed sand, after a standard curing period of 28 days.
Table 6.
Pore structure parameters of the MIWC at 28 d.
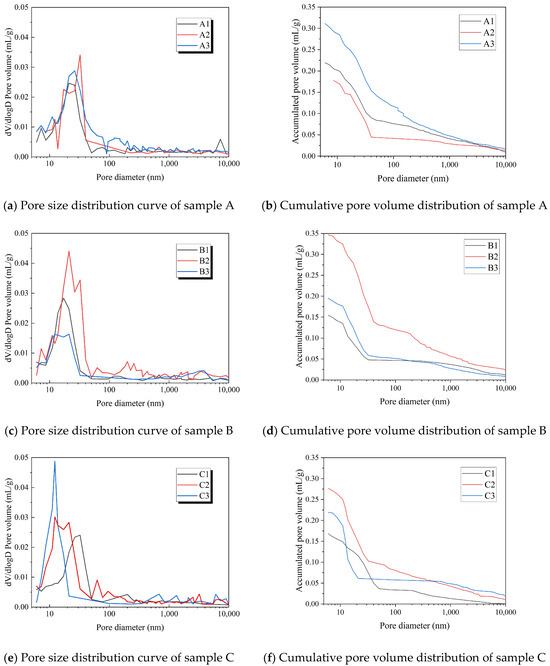
The pore size distribution curve and cumulative pore volume distribution curve for concrete with a range of water–cement ratios are shown in Figure 9.
Figure 9.
Pore size distribution and cumulative pore volume curves of MIWC samples.
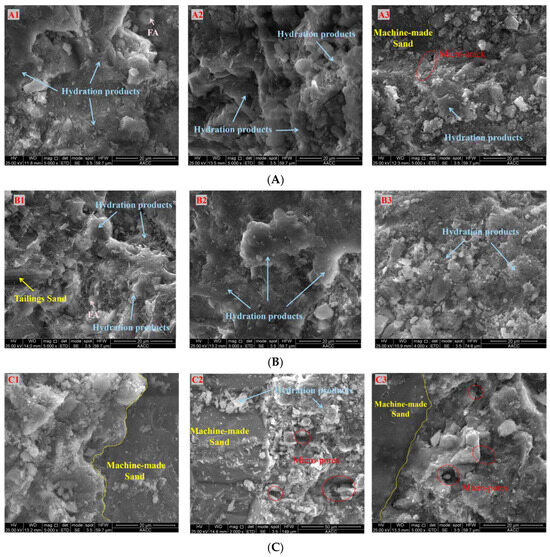
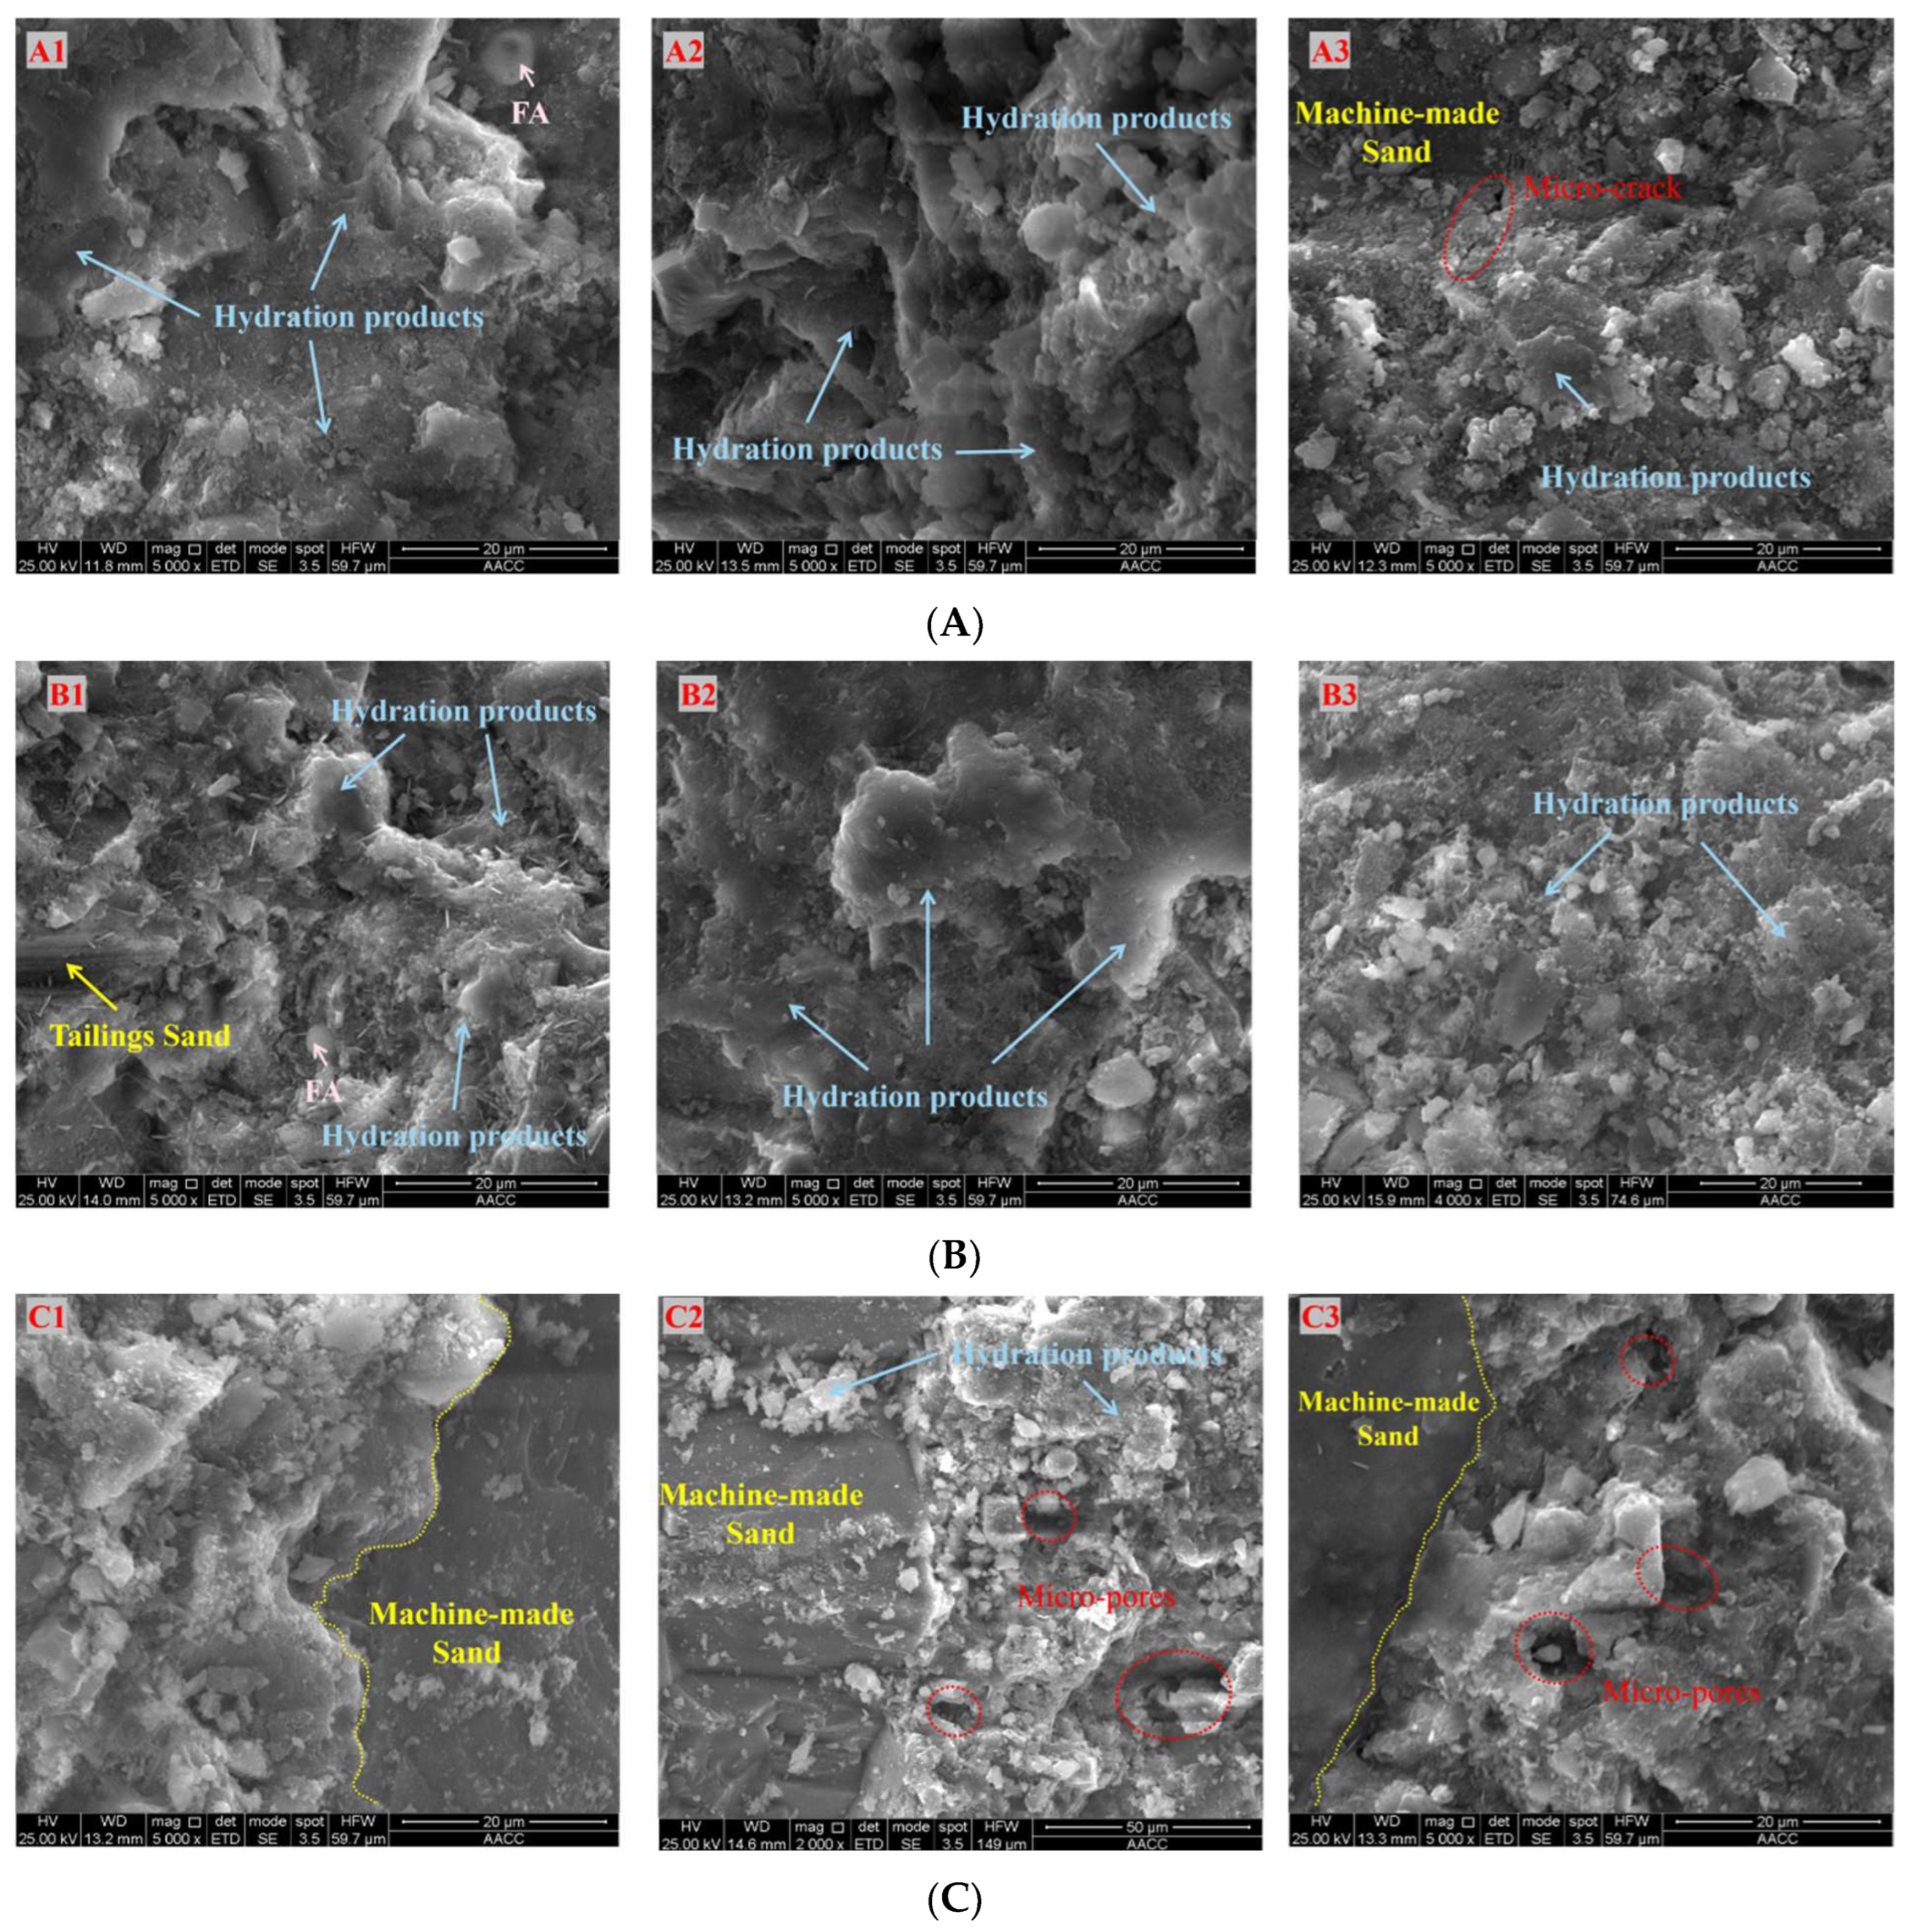
Figure 10 demonstrates the microstructure of the ITZ after 28 days of curing. For the w/b = 0.30 samples (Series A), as the tailings sand proportion increases, the homogeneity of the ITZ gradually decreases, and microcracks are observed in the SEM image of A3. For the w/b = 0.25 samples (Series B), the hydration products in B2 are more uniformly distributed, and C-(A)-S-H effectively fills the micro-pores. When the SF content reaches 95 kg/m3, the morphology of concrete hydration products changes from flaky in sample B2 to clumpy in sample B3, resulting in reduced homogeneity of the microstructure. This also explains why the compressive strength of B3 samples is slightly lower than that of B2 samples. For the w/b = 0.20 samples (Series C), the number and size of micro-pores in the ITZ increases slightly with increasing LP content, which is consistent with the results from MIP analysis.
Figure 10.
Microscopic morphology of ITZ. (A) w/b = 0.30 samples. (B) w/b = 0.25 samples. (C) w/b = 0.20 samples.
3.7.1. Influence of Pore Structure on Resistance to Sulfate Corrosion
The primary cause of sulfate-induced corrosion and damage to concrete is the ingress of SO42−. This ingress interacts with solid components, leading to the formation of volume-expanding substances such as ettringite and gypsum. Initially, these substances accumulate within surface pores or microcracks, exerting pressure on the surrounding pore walls. When this pressure surpasses the ultimate tensile strength of the concrete, it can initiate cracking, expedite solution infiltration, and result in a reduction in strength until failure. Studies have indicated that the smaller the key pore size parameters (including the median pore size, critical pore size, and most likely pore size) within concrete are, the more gradual the decline in the compressive strength and corrosion resistance coefficient following wet–dry cycles. Additionally, such concrete exhibits enhanced resistance to sulfate corrosion. Concurrently, the LP content promotes the formation of C-S-H gels. While this might increase the formation of sulfate reaction products such as gypsum and ettringite, the compressive stress from these products does not surpass the tensile strength limit of concrete. Instead, these products tend to fill surface pores and microcracks, thereby improving the pore structure and overall compactness of the concrete.
3.7.2. Impact of Hydration Products and Pore Structure on the Permeability Properties of Anti-Chlorine Ions
There is clear consistency between the content of the concrete hydration product C-S-H gel and the influence of the pore structure characteristic parameters on the chloride ion permeability. As the content of the C-S-H gel increased, the pore structure characteristic parameters improved. This can be attributed to the fact that a higher proportion of cement in cementitious materials, as well as a higher proportion of LP, can increase the content of C-S-H gel, thereby enhancing the binding capacity of chloride ions. Conversely, when the water–cement ratio decreases, the pore structure characteristic parameters, such as the median pore size, decrease. This results in a greater proportion of harmless or less harmful pores, thereby strengthening the resistance to chloride ions. However, the performance varies among different samples. For instance, in sample A, a decrease in the content of C-S-H gel leads to an increase in the permeability coefficient of chloride ions and a decrease in impermeability as the proportion of tailings increases. On the other hand, as the proportion of SF and LP in the cementitious material increases, the content of C-S-H gel also increases. This results in optimized pore structure parameters and pore size distribution, leading to a decrease in the permeability coefficient of chloride ions and an increase in impermeability.
4. Conclusions
In this study, the durability of concrete with multiple industrial wastes under coupled chloride and sulfate attack was experimentally and numerically investigated. The effects of mix design parameters on deterioration and pore structure were revealed, and high-precision service life prediction models were developed and validated.
- (a)
- Reducing the water–binder ratio considerably enhances resistance to sulfate attack and chloride penetration. The degradation follows a typical pattern of early pore filling and later expansive cracking.
- (b)
- Limestone powder refines pore size and strengthens chloride binding, whereas silica fume optimizes pore structure and improves long-term corrosion stability.
- (c)
- The corrosion resistance coefficient Kf first increases but then decreases with increasing erosion time, whereas the tailings sand ratio has a negligible influence on durability.
- (d)
- The proposed sulfate damage and chloride diffusion models achieve high accuracy, with R2 > 0.92 and RMSE < 8%, enabling reliable service life prediction.
- (e)
- Coupled chloride–sulfate action significantly accelerates ion ingress and structural degradation, which is more severe than single-factor erosion.
Long-term marine exposure tests and advanced microscopic characterization are suggested to validate the models and further clarify the degradation mechanism of MIWC under real service conditions. Moreover, the coupled effect of mechanical loading and environmental erosion should be investigated, and engineering-oriented durability design tools are recommended to promote practical applications.
Author Contributions
Conceptualization, S.Z. and Y.W.; Methodology, Y.W.; Software, B.L.; Validation, Y.W.; Formal analysis, S.Z.; Investigation, B.L. and Z.W.; Data curation, Z.W.; Writing—original draft, B.L.; Writing—review and editing, S.Z. All authors have read and agreed to the published version of the manuscript.
Funding
This research was funded by the Research Funds for JiangSu Collaborative Innovation Centre for Building Energy Saving and Construction Technology (Grant Number: SJXTBS2118) and the Postgraduate Research & Practice Innovation Program of Jiangsu Province (Grant Number: SJCX25_1384).
Data Availability Statement
The original contributions presented in this study are included in the article. Further inquiries can be directed to the corresponding author(s).
Acknowledgments
The experimental work described in this paper was conducted at the Jiangsu Key Laboratory of Environmental Impact and Structural Safety in Civil Engineering at the China University of Mining and Technology. The help received during the testing from staff and students at the laboratory is greatly appreciated.
Conflicts of Interest
We declare that we have no financial or personal relationships with other people or organizations that can inappropriately influence our work; there is no professional or other personal interest of any nature or kind in any product, service or company that could be construed as influencing the position presented in, or the review of, the manuscript.
References
- Wang, Y.; Liu, C.; Wang, Y.; Li, Q.; Liu, H. Time-and-Depth-Dependent Model of Chloride Diffusion Coefficient for Concrete Members Considering the Effect of Coarse Aggregate. J. Mater. Civ. Eng. 2018, 30, 04017302. [Google Scholar] [CrossRef] [Scilit]
- Hamada, H.M.; Abed, F.; Katman, H.Y.B.; Humada, A.M.; Al Jawahery, M.S.; Majdi, A.; Yousif, S.T.; Thomas, B.S. Effect of silica fume on the properties of sustainable cement concrete. J. Mater. Res. Technol. 2023, 24, 8887–8908. [Google Scholar] [CrossRef] [Scilit]
- Luo, D.; Li, F.; Niu, D. Study on the deterioration of concrete performance in saline soil area under the combined effect of high low temperatures, chloride and sulfate salts. Cem. Concr. Compos. 2024, 150, 105531. [Google Scholar] [CrossRef] [Scilit]
- Dousti, A.; Khaksar, H. Impact of simultaneous carbonation and chloride attack on chloride diffusion in portland cement concrete mixtures blended with natural zeolite and silica fume. J. Mater. Civ. Eng. 2023, 35, 04023478. [Google Scholar] [CrossRef] [Scilit]
- Chang, H.; Guo, Z.; Fan, S.; Li, Z.; Guo, F.; Feng, P. Chloride binding capacity of calcium silicate hydrates and Friedel’s salt influenced by fly ash, slag, and silica fume. J. Mater. Civ. Eng. 2024, 36, 04024128. [Google Scholar] [CrossRef] [Scilit]
- Dong, W.; Wang, J. Degradation mechanism and strength prediction of aeolian sand concrete under sulphate dry-wet cycles. Constr. Build. Mater. 2024, 450, 138617. [Google Scholar] [CrossRef] [Scilit]
- Cheng, X.; Tian, W.; Gao, J.; Gao, Y. Performance evaluation and lifetime prediction of steel slag coarse aggregate concrete under sulfate attack. Constr. Build. Mater. 2022, 344, 128203. [Google Scholar] [CrossRef] [Scilit]
- Du, T.; Chen, J.; Qu, F.; Li, C.; Zhao, H.; Xie, B.; Yuan, M.; Li, W. Degradation prediction of recycled aggregate concrete under sulphate wetting–drying cycles using BP neural network. Structures 2022, 46, 1837–1850. [Google Scholar] [CrossRef] [Scilit]
- Chen, J.K.; Qian, C.; Song, H. A new chemo-mechanical model of damage in concrete under sulfate attack. Constr. Build. Mater. 2016, 115, 536–543. [Google Scholar] [CrossRef] [Scilit]
- Nosouhian, F.; Fincan, M.; Shanahan, N.; Stetsko, Y.P.; Riding, K.A.; Zayed, A. Effects of slag characteristics on sulfate durability of portland cement-slag blended systems. Constr. Build. Mater. 2019, 229, 116882. [Google Scholar] [CrossRef] [Scilit]
- Lu, F.; Wang, H.; Wang, L.; Zhao, K.; Zhang, J. Degradation law and service life prediction model of tunnel lining concrete suffered combined effects of sulfate attack and drying-wetting cycles. Materials 2022, 15, 15134435. [Google Scholar] [CrossRef] [Scilit]
- Li, H.; Farzadnia, N.; Shi, C. The role of seawater in interaction of slag and silica fume with cement in low water-to-binder ratio pastes at the early age of hydration. Constr. Build. Mater. 2018, 185, 508–518. [Google Scholar] [CrossRef] [Scilit]
- Saha, A.K. Effect of Class F fly ash on the durability properties of concrete. Sustain. Environ. Res. 2018, 28, 25–31. [Google Scholar] [CrossRef] [Scilit]
- Tang, Z.; Li, W.; Ke, G.; Zhou, J.L.; Tam, V.W. Sulfate attack resistance of sustainable concrete incorporating various industrial solid wastes. J. Clean. Prod. 2019, 218, 810–822. [Google Scholar] [CrossRef] [Scilit]
- Herath, C.; Law, D.W.; Gunasekara, C.; Setunge, S. Sulphate and acid resistance of HVFA concrete incorporating nano silica. Constr. Build. Mater. 2023, 392, 132004. [Google Scholar] [CrossRef] [Scilit]
- Min, H.; Sui, L.; Xing, F.; Tian, H.; Zhou, Y. An effective transport model of sulfate attack in concrete. Constr. Build. Mater. 2019, 216, 365–378. [Google Scholar] [CrossRef] [Scilit]
- Kara, C.; Kutuk, S.; Kutuk-Sert, T. Improvement of the durability of concrete by substitution of raw ground colemanite. Case Stud. Constr. Mater. 2023, 19, e02393. [Google Scholar] [CrossRef] [Scilit]
- Rong, Z.; Sun, W.; Xiao, H.; Wang, W. Effect of silica fume and fly ash on hydration and microstructure evolution of cement based composites at low water-binder ratios. Constr. Build. Mater. 2014, 51, 446–450. [Google Scholar] [CrossRef] [Scilit]
- Reichert, T.A.; Balestra, C.E.T.; Medeiros-Junior, R.A.D. Coupled model on the variation of diffusion coefficient and surface chloride concentration in reinforced concrete structures over time. Constr. Build. Mater. 2024, 411, 134715. [Google Scholar] [CrossRef] [Scilit]
- Chaib, O.; Safer, O.; Dif, F. Mechanical behavior and durability of perlite based mortar exposed to sodium sulfate attack. Mater. Sci. 2024, 30, 34760. [Google Scholar] [CrossRef] [Scilit]
- Liu, D.; Wang, C.; Guo, T.; Gonzalez-Libreros, J.; Ge, Y.; Tu, Y.; Elfgren, L.; Sas, G. Time-depth dependent chloride diffusion coefficient of self-compacting concrete. Mag. Concr. Res. 2024, 76, 600–616. [Google Scholar] [CrossRef] [Scilit]
- Li, S.; You, G.; Yu, G.; Jiang, C.; Xia, X.; Yu, D. Suppression Mechanism of Early-Age Autogenous Shrinkage Cracking in Low Water-to-Binder Ratio Cement-Based Materials Incorporating Ground Granulated Blast-Furnace Slag and Silica Fume. Materials 2026, 19, 131. [Google Scholar] [CrossRef] [Scilit]
- Qin, S.; Zou, D.; Liu, T.; Jivkov, A. A chemo-transport-damage model for concrete under external sulfate attack. Cem. Concr. Res. 2020, 132, 106048. [Google Scholar] [CrossRef] [Scilit]
- Li, L.; Yang, J.; Li, H.; Du, Y. Insights into the microstructure evolution of slag, fly ash and condensed silica fume in blended cement paste. Constr. Build. Mater. 2021, 309, 125044. [Google Scholar] [CrossRef] [Scilit]
- Wang, J.; Ng, P.-L.; Su, H.; Du, J. Influence of the coupled time and concrete stress effects on instantaneous chloride diffusion coefficient. Constr. Build. Mater. 2020, 237, 117645. [Google Scholar] [CrossRef] [Scilit]
- Zeng, H.; Li, Y.; Zhang, J.; Chong, P.; Zhang, K. Effect of limestone powder and fly ash on the pH evolution coefficient of concrete in a sulfate-freeze–thaw environment. J. Mater. Res. Technol. 2022, 16, 1889–1903. [Google Scholar] [CrossRef] [Scilit]
- Yu, B.; Ma, Q.; Huang, H.-C.; Chen, Z. Probabilistic prediction model for chloride diffusion coefficient of concrete in terms of material parameters. Constr. Build. Mater. 2019, 215, 941–957. [Google Scholar] [CrossRef] [Scilit]
- Wu, Q.; Ma, Q.; Huang, X. Mechanical properties and damage evolution of concrete materials considering sulfate attack. Materials 2021, 14, 2343. [Google Scholar] [CrossRef] [Scilit] [PubMed]
- Wang, X.-H.; Hu, D.-G.; Hong, A.K.B.; Shi, D.-D. Prediction of equivalent chloride ion diffusion coefficient in cracked concrete of the in-service RC element. KSCE J. Civ. Eng. 2022, 26, 2369–2380. [Google Scholar] [CrossRef] [Scilit]
- Yan, S.P.; Liang, Y. Fractal derivative model with time dependent diffusion coefficient for chloride diffusion in concrete. J. Build. Eng. 2023, 74, 106897. [Google Scholar] [CrossRef] [Scilit]
- Yu, H.; Li, L.; Ma, H.; Lu, Y.; Hu, D. Study on time range of definite integral in derivation process of chloride ion diffusion theoretical model of concrete. Constr. Build. Mater. 2024, 428, 135876. [Google Scholar] [CrossRef] [Scilit]
- Gong, J.; Cao, J.; Wang, Y. Effects of sulfate attack and dry-wet circulation on creep of fly-ash slag concrete. Constr. Build. Mater. 2016, 125, 12–20. [Google Scholar] [CrossRef] [Scilit]
- Chitakwa, M.; Wang, Q.; Peng, Y.; Gao, Z.; Zhang, W.; Yang, L.; Gu, C. A simple model for the chloride diffusion coefficient of steel fibre reinforced concrete. Cearmics Silik. 2021, 65, 69–76. [Google Scholar] [CrossRef] [Scilit]
- NT BUILD 492; Concrete, Mortar and Cement-Based Repair Materials: Chloride Migration Coefficient from Non-Steady-State Migration Experiments. Nordtest: Espoo, Finland, 2003.
- Xiong, Q.X.; Liu, Q.F.; Zhang, X.J.; Chen, C. Chloride Diffusion Prediction in Concrete through Mathematical Models Based on Time–Dependent Diffusion Coefficient and Surface Chloride Concentration. J. Mater. Civ. Eng. 2022, 34, 04022309. [Google Scholar] [CrossRef] [Scilit]
- Yang, J.; Zhang, R.; Xue, Y.; Wang, X.; Dou, X.; Song, Y. Damage evolution and life prediction of concrete in sulfate corrosion environments in Northwest China. J. Build. Eng. 2024, 97, 110909. [Google Scholar] [CrossRef] [Scilit]

Disclaimer/Publisher’s Note: The statements, opinions and data contained in all publications are solely those of the individual author(s) and contributor(s) and not of MDPI and/or the editor(s). MDPI and/or the editor(s) disclaim responsibility for any injury to people or property resulting from any ideas, methods, instructions or products referred to in the content. |
© 2026 by the authors. Licensee MDPI, Basel, Switzerland. This article is an open access article distributed under the terms and conditions of the Creative Commons Attribution (CC BY) license.