3.1. Design of the Proposed Platform
This study proposes an integrated CPS designed for real-time estimation and continuous monitoring of EC for MiC projects. The methodological design is grounded in two theoretical foundations.
First, the system follows the CPS paradigm, in which physical processes are tightly coupled with computational algorithms through continuous feedback loops. This paradigm is formally expressed as follows:
where P represents the physical processes (manufacturing, transportation, installation), C denotes the computational models (BIM representations, emission algorithms), and
encapsulates the feedback mapping functions governing cyber-physical interactions.
Second, the data processing logic follows the Data-Information-Knowledge-Wisdom (DIKW) hierarchy, a well-established framework in information science for structuring progressive data transformation. Within the DIKW hierarchy, raw sensor signals (Data) are transformed into structured operational metrics (Information) through the Transfer Layer, converted into validated carbon emission records (Knowledge) through BIM-IoT fusion and blockchain verification at the Computing Layer, and ultimately delivered as actionable decision support (Wisdom) at the Application Layer.
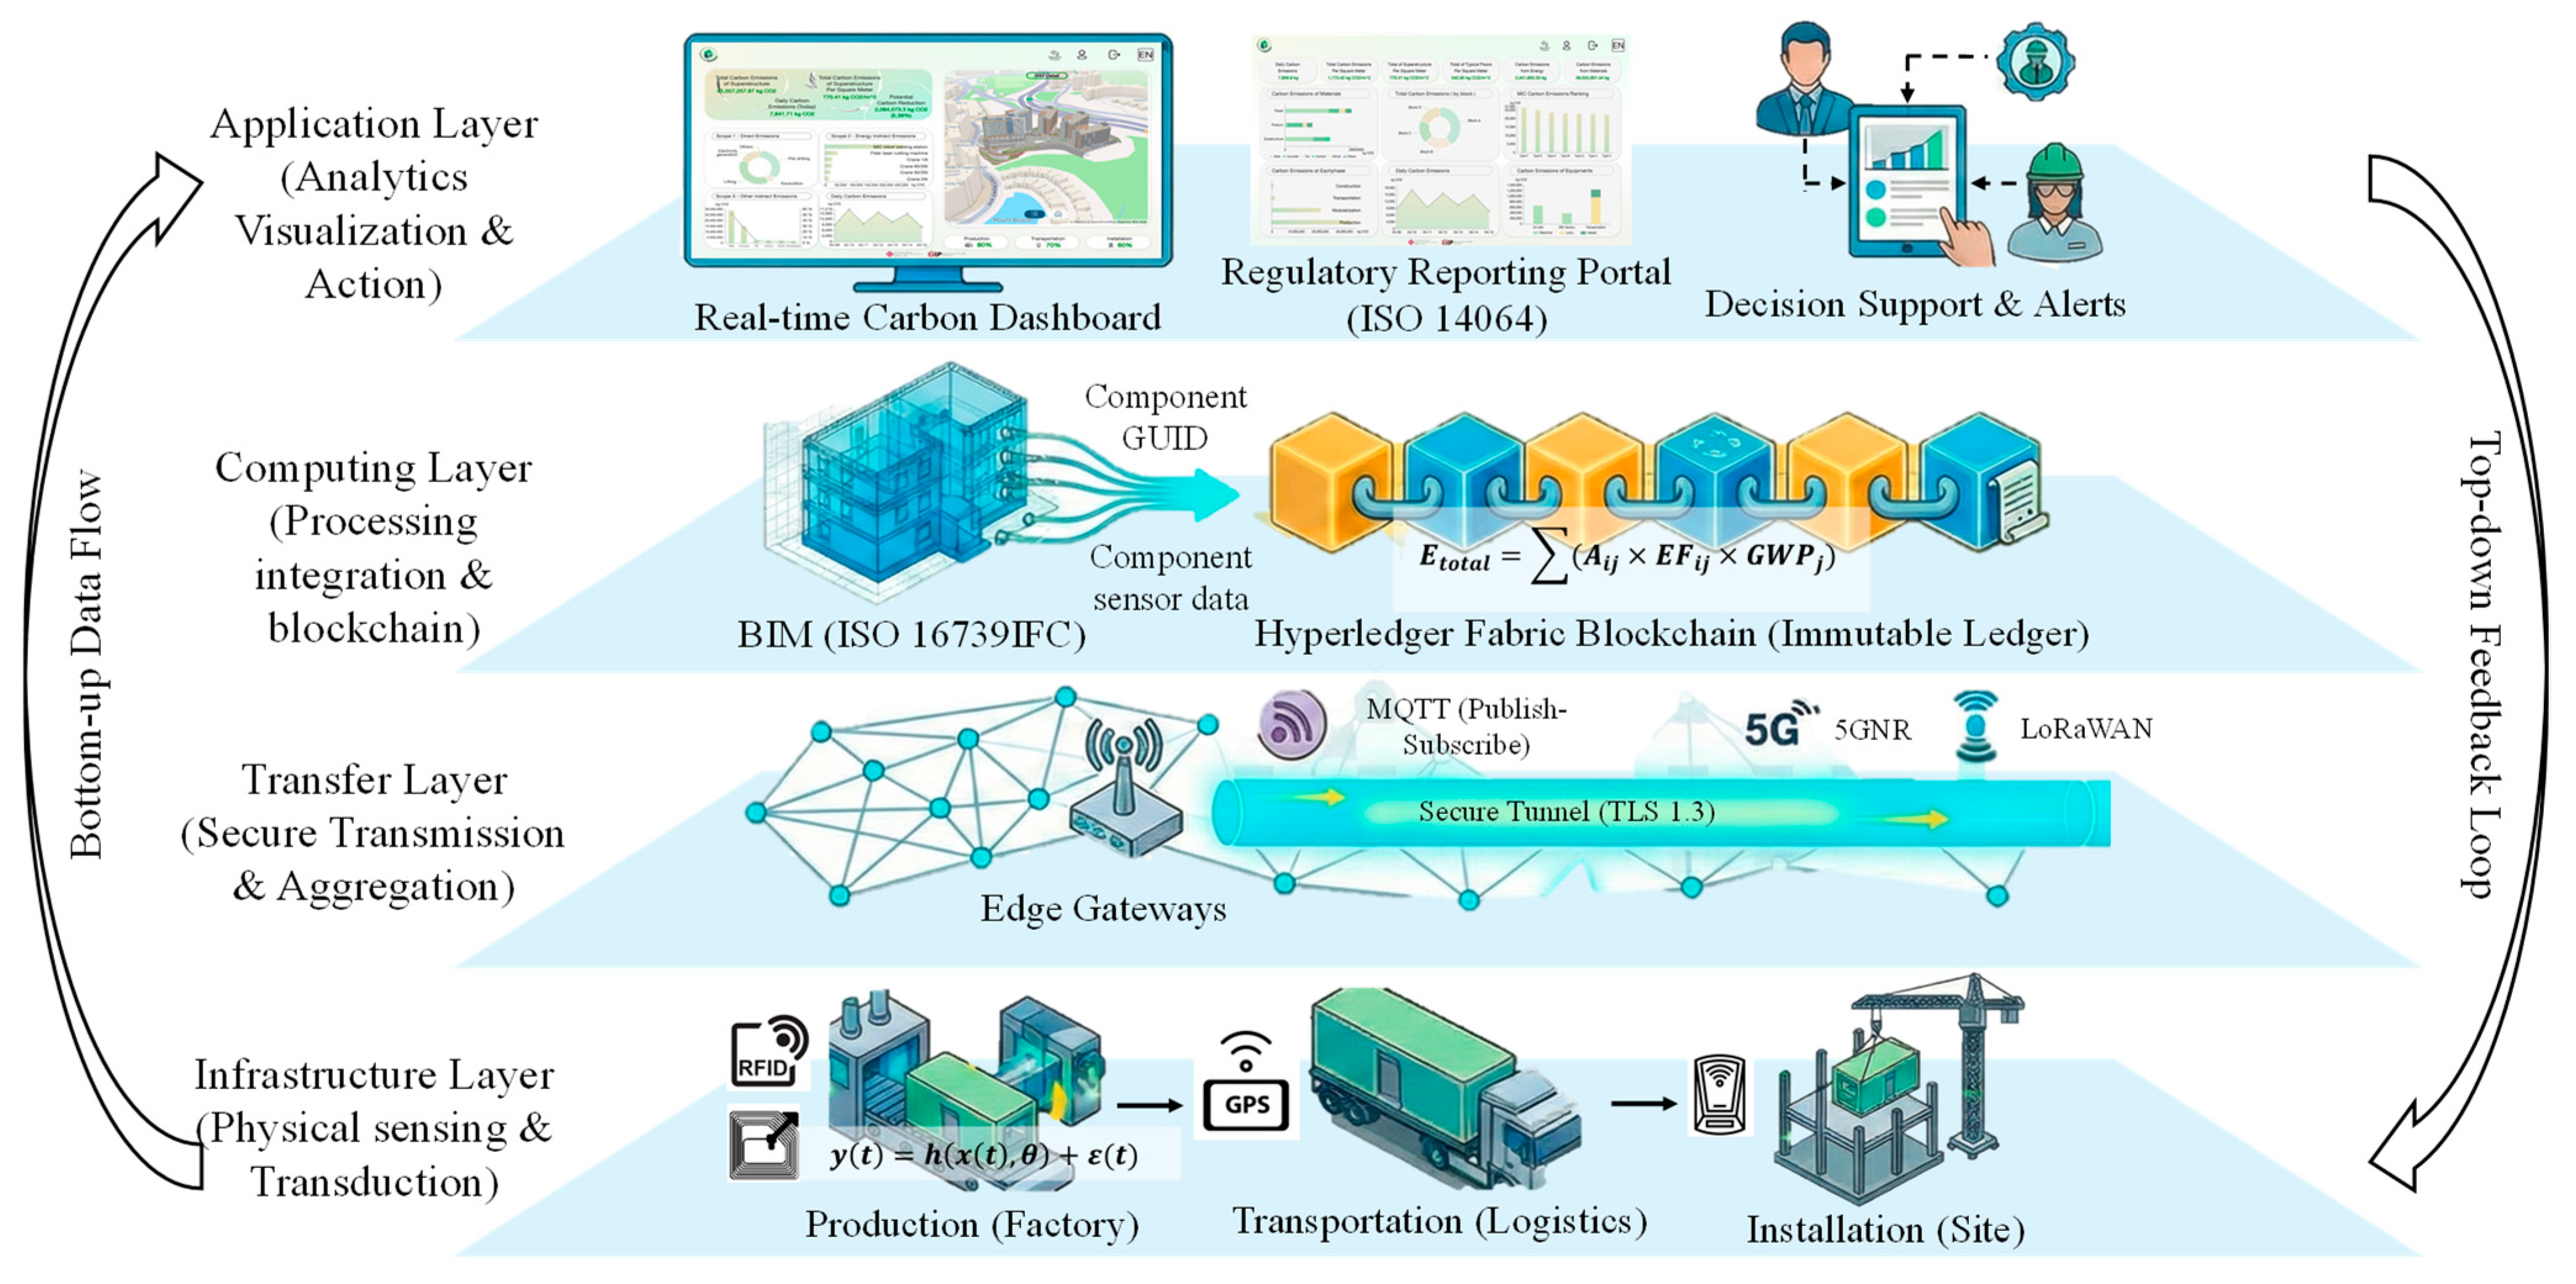
These two theoretical foundations collectively justify the four-tier hierarchical architecture shown in
Figure 1, comprising the Infrastructure Layer, Transfer Layer, Computing Layer, and Application Layer. To clarify the data flow logic, each layer operates with explicitly defined inputs, processes, and outputs. The Infrastructure Layer receives physical construction activities as inputs, performs sensor transduction and edge-level filtering, and outputs validated raw data packets tagged with unique hardware addresses. The Transfer Layer receives these data packets, performs protocol aggregation, MQTT-based routing, and temporal synchronization, and outputs parsed, time-aligned data streams to the Computing Layer. The Computing Layer receives synchronized data streams together with the static BIM model, performs BIM-IoT semantic fusion, phase-specific carbon emission calculation, and three-layer blockchain validation, and outputs verified carbon emission records committed to the Hyperledger Fabric immutable ledger. The Application Layer receives these verified records and delivers real-time carbon monitoring dashboards, ISO 14064-1 [
37]-compliant regulatory reports, and threshold-triggered decision support alerts to end users.
The system boundary is formally defined as cradle-to-end-of-construction, explicitly including production, transportation, and installation phases. This boundary selection follows the lifecycle assessment framework established by ISO 14040 [
38], enabling systematic quantification of EC with traceability to source activities. The architecture incorporates distributed ledger technology to ensure that all carbon data transactions maintain immutability and transparency across stakeholder networks, addressing the fundamental verification challenge identified in
Section 2.1. The modular architecture supports horizontal scalability, enabling integration of additional sensing modalities or construction sites without disrupting core system logic through well-defined application programming interfaces.
3.2. Infrastructure Layer
The Infrastructure Layer performs three sequential functions: (1) physical sensing, in which heterogeneous sensors convert construction activities into digital signals; (2) edge processing, in which embedded microcontrollers filter and compress raw data to reduce bandwidth consumption; and (3) transmission preparation, in which each data packet is tagged with a unique hardware address and validated against predefined quality thresholds before forwarding to the Transfer Layer.
The sensing function is realized through the strategic deployment of heterogeneous sensor networks across the construction supply chain. This layer performs the fundamental transduction function, converting physical phenomena into quantifiable digital signals suitable for downstream processing. The transduction process follows the general measurement model:
where y(t) represents the observed digital signal, x(t) denotes the true physical quantity, h(·) is the sensor transfer function, θ encompasses calibration parameters, and
accounts for measurement noise.
Fixed RFID tags are affixed to each modular unit, providing unique identification throughout the lifecycle. These tags operate in the ultra-high frequency (UHF) band, spanning 860 to 960 MHz, to ensure reliable read rates in metal-rich environments characteristic of steel MiC. The RFID system employs backscatter modulation for reader communication, enabling passive tag operation without internal power sources. Simultaneously, smart meters are integrated with manufacturing equipment to record real-time energy consumption, providing primary inputs for carbon calculation. For logistics tracking, GPS modules monitor the geographical position and traveled distance of transport vehicles. The GPS receivers update position data at 10-s intervals, providing granular route information through trilateration methods based on satellite signal time-of-arrival. The layer additionally incorporates accelerometer sensors to monitor machinery operational states and environmental conditions. These devices function as transaction-monitoring nodes, observing physical states including vibrations, loads, and anomalous conditions. Data generated at this layer undergoes initial edge processing to reduce bandwidth consumption through embedded microcontrollers.
This comprehensive sensing network ensures that all carbon-generating activities are captured at source with quantifiable uncertainty. Infrastructure layer reliability is critical because acquisition errors propagate through subsequent processing stages. Therefore, redundant sensors are deployed for critical equipment using N + 1 redundancy configurations with automatic failover mechanisms. The physical deployment strategy accounts for environmental factors, including particulate contamination, humidity variations, and electromagnetic interference, to maintain sensor integrity throughout the construction period. Each sensor is assigned a unique hardware address, serving as the primary key for data identification in downstream processing layers.
To address the environmental challenges inherent in construction sites, all field-deployed sensors are housed in IP67-rated protective enclosures resistant to dust ingress, water splashing, and mechanical impact from construction activities. RFID tags are encapsulated in industrial-grade thermoplastic housings designed to withstand concrete splatter, paint contamination, and surface abrasion. Smart meters are installed within sealed electrical distribution cabinets that provide a sheltered operating environment. GPS and telematics units on transport vehicles are factory-sealed to automotive-grade standards. Sensor maintenance, including cleaning, inspection, and recalibration, is integrated into the routine site management schedule at monthly intervals. The site contractor’s supervision team is designated as the responsible party for sensor upkeep, with automated maintenance reminders generated by the platform.
The system incorporates a multi-level alert mechanism for sensor health monitoring. Each sensor transmits periodic heartbeat signals to the edge gateway. If a sensor fails to respond within a predefined timeout window, a fault alert is automatically generated and sent to the site management team via the platform’s push notification service. The computing layer implements anomaly detection algorithms that identify data patterns indicative of sensor drift, malfunction, or tampering, such as readings that deviate beyond three standard deviations from the rolling mean. All sensor status changes are logged on the blockchain, creating an immutable audit trail. In the event of confirmed sensor failure, the N + 1 redundant backup sensors are automatically activated through the failover mechanism to maintain data continuity without manual intervention.
3.3. Transfer Layer
The Transfer Layer executes a three-stage data pipeline: (1) protocol aggregation, in which gateways collect data from heterogeneous sensors using LoRaWAN for low-power devices and 5G NR for high-bandwidth streams; (2) standardized transmission, in which the MQTT publish-subscribe protocol routes data to centralized brokers with guaranteed delivery; and (3) backend processing, in which incoming data streams are parsed, validated, and temporally synchronized before forwarding to the Computing Layer.
This layer serves as the communication bridge between physical edge devices and centralized computing resources, operating according to Open Systems Interconnection (OSI) model layers 1 through 4. Gateways supporting multiple communication protocols are strategically deployed to ensure connectivity across diverse operational environments spanning manufacturing facilities and remote construction sites.
For low-power sensors with small data payloads, LoRaWAN is used with chirp spread spectrum modulation. For high-bandwidth applications such as video streaming from site cameras, 5G NR is used with orthogonal frequency-division multiplexing. The system implements the message queuing telemetry transport (MQTT) protocol for data transmission management. This protocol employs a publish-subscribe pattern, ensuring low-latency, energy-efficient communication essential for real-time monitoring in complex construction environments. The MQTT broker manages topic hierarchies for logical data organization using tree-structured naming:
where T represents the complete set of MQTT topic strings,
identifies the project site or factory location,
denotes the construction lifecycle phase (production, transportation, or installation),
specifies the individual sensor or equipment identifier, and
indicates the data type being transmitted (e.g., energy consumption, position, or vibration). The hierarchical slash-delimited structure enables efficient content-based routing and selective data subscription by downstream consumers. Quality of service level 1 is configured to ensure at-least-once delivery through acknowledgment mechanisms, guaranteeing that no carbon data packets are lost during transmission.
Upon data reception, the operating system backend performs parsing and decoding raw data streams to extract operational metrics. This process validates data format against predefined schemas, rejecting malformed packets through syntax analysis based on context-free grammar. The backend additionally performs temporal synchronization across all data streams using network time protocol, ensuring temporal consistency essential for correlative analysis. The complete derivation of the temporal synchronization protocol, including the network time protocol offset computation and quality-of-service configurations, is provided in
Appendix A.
Security mechanisms implement transport layer security (TLS) 1.3 for data-in-transit encryption, preventing unauthorized access or modification during transfer through asymmetric cryptography. The transfer layer additionally implements load balancing to distribute network traffic across servers using weighted round-robin scheduling, ensuring system stability during peak transmission periods.
3.4. Computing Layer
The Computing Layer is responsible for transforming raw sensor data into verified carbon emission records. It integrates three sequential processes: (1) data ingestion and BIM-IoT fusion, (2) carbon emission calculation, and (3) blockchain validation and ledger commitment. The core equations governing BIM-IoT fusion and blockchain verification are presented below, with detailed formulations of the containerization strategy and autoscaling logic provided in
Appendix A.1.
3.4.1. Stage 1: Data Ingestion and BIM-IoT Fusion
Upon receiving parsed data streams from the Transfer Layer, the Computing Layer performs semantic mapping between dynamic sensor data and static BIM component identifiers. This mapping creates a digital twin representation of physical construction processes, enabling spatial visualization of carbon emissions that transcends traditional design-stage assessments. The mapping process adheres to the IFC standard (ISO 16739 [
39]), ensuring cross-platform interoperability. Each sensor data point is assigned to a globally unique identifier (GUID) to ensure data traceability. The digital twin (DT) is formally defined as a triplet:
where
represents the static BIM model containing component geometry, material properties, and spatial relationships;
denotes dynamic sensor data streams including energy consumption readings, GPS coordinates, and machinery operation records; and
encompasses synchronization functions maintaining temporal and spatial alignment between physical activities and their digital representations.
The fusion process operates through composite key structures. Each incoming sensor record is matched to a specific BIM component using a composite key
defined as follows:
where
is the IFC GUID of the building element,
identifies the construction phase (production, transportation, or installation),
specifies the source sensor, and
is the synchronized timestamp. This composite key ensures that every data record is unambiguously linked to a specific building component at a specific time within a specific construction phase.
3.4.2. Stage 2: Carbon Emission Calculation
Following BIM-IoT fusion, the system computes carbon emissions using activity-based formulas derived from the single-issue method ISO 14067 (GWP 100a) [
40]. The calculation is performed separately for each construction phase. The production emission
is calculated based on real-time energy consumption data recorded by smart meters installed on factory assembly lines:
where
is the electricity consumption (kWh) recorded by the smart meter for the
-th manufacturing process,
is the regional electricity grid emission factor (kgCO
2e/kWh),
is the fuel consumption (L or m
3) for auxiliary manufacturing equipment,
is the fuel-specific emission factor (kgCO
2e/L or kgCO
2e/m
3), and
is the total number of monitored manufacturing processes.
The transportation emission
is calculated using GPS-tracked distance and vehicle fuel consumption data:
where
is the GPS-recorded travel distance (km) for the
-th transport trip,
is the fuel consumption rate (L/km) recorded by the vehicle telematics unit,
is the diesel emission factor (kgCO
2e/L), and
is the total number of transport trips. For transport trips where onboard fuel sensors are unavailable, the system applies a default fuel consumption rate derived from the vehicle specification database, flagged as an estimated value in the emission record.
The installation emission
is calculated based on crane operation time and auxiliary equipment energy use:
where
is the active operation time (hours) of the
-th electric equipment recorded by accelerometer-based operation detection,
is the rated power (kW) of the
-th equipment,
is the fuel consumption (L) of the
-th fuel-powered equipment, and
and
are the numbers of electric and fuel-powered equipment, respectively.
The total cradle-to-end-of-construction embodied carbon
is aggregated as follows:
where
represents the material embodied carbon extracted from the BIM model using component volumes multiplied by material-specific emission factors stored in the system database.
3.4.3. Stage 3: Blockchain Validation and Ledger Commitment
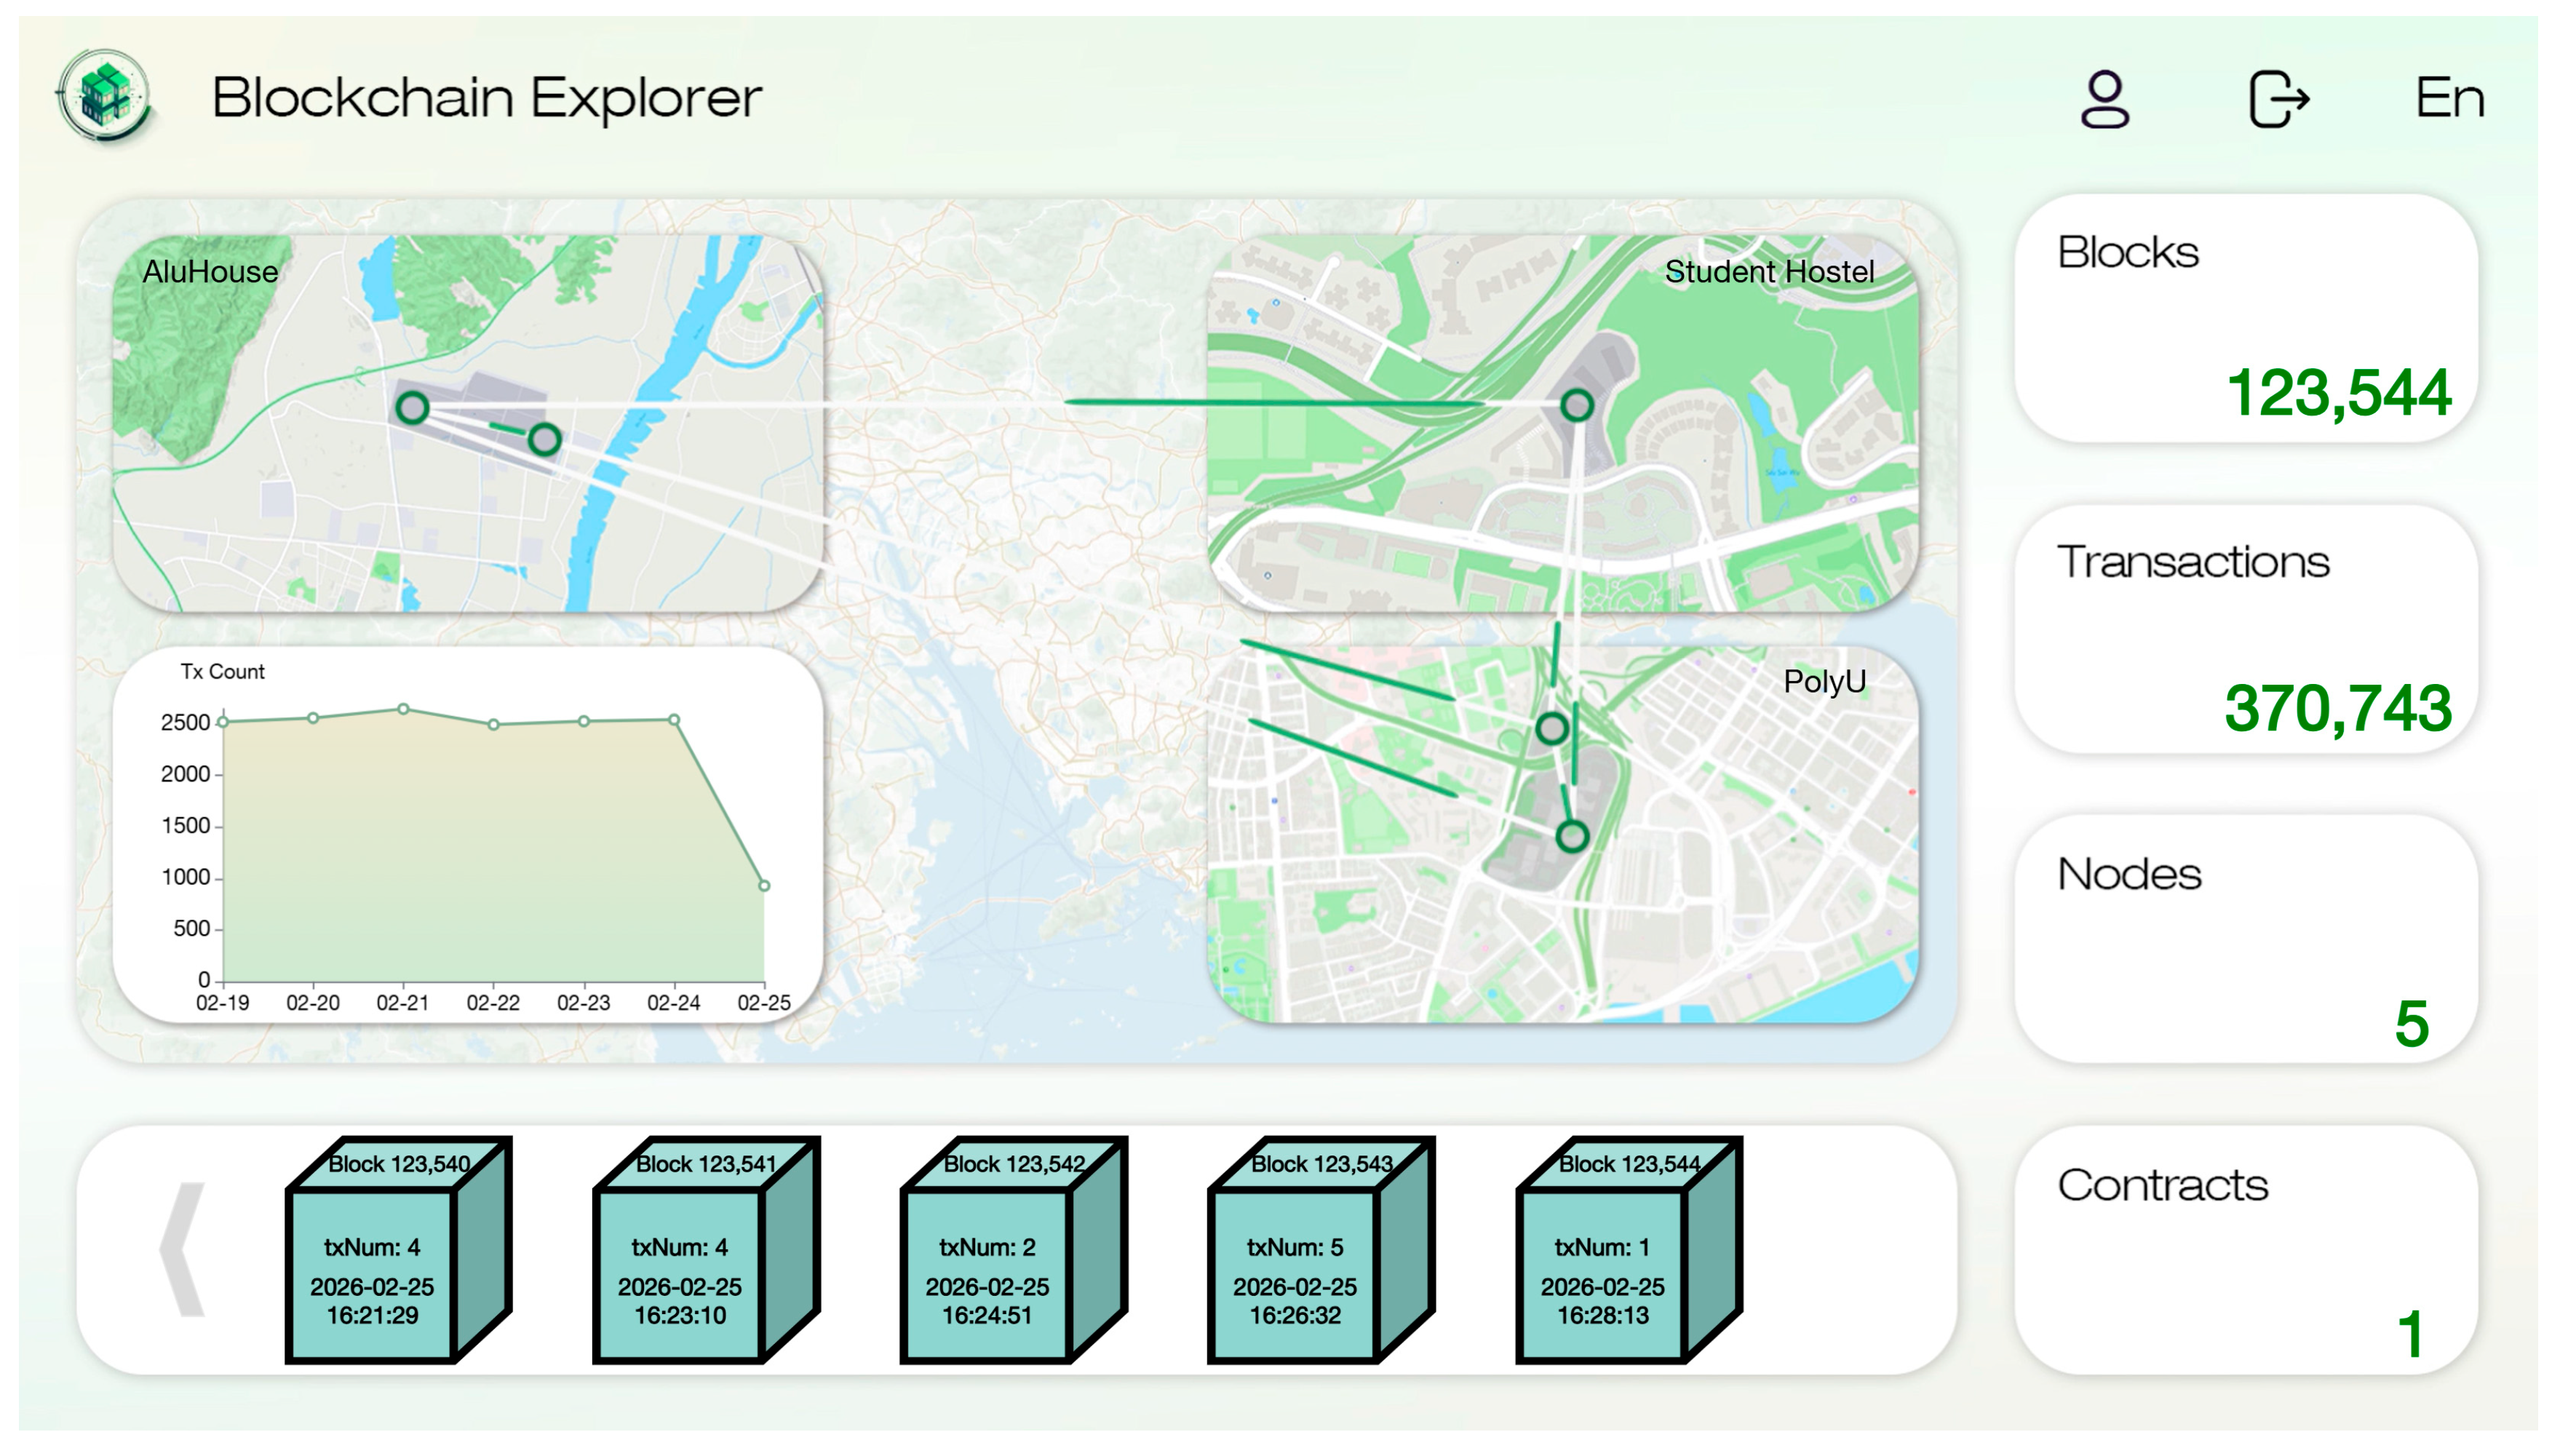
To ensure data trustworthiness, the system employs Hyperledger Fabric to establish a tamper-proof distributed ledger. This permissioned blockchain framework implements defined access controls among supply chain participants through membership service providers based on X.509 certificate authorities.
Before any emission record is committed to the blockchain, it must pass through a sequential three-layer validation protocol. The first layer is sensor-level validation. At the point of data ingestion, the edge gateway performs automated range-checking against predefined physical thresholds. A sensor reading
is accepted only if:
where
is the rolling mean and
is the rolling standard deviation computed from the preceding 24 h window for the same sensor. Readings that fall outside this range are flagged as anomalous and excluded from emission calculations pending manual review.
The second layer is blockchain-level validation. Smart contracts, implemented as Hyperledger Fabric chaincode, execute a second round of automated validation. The chaincode performs the following checks before committing a transaction: (a) cross-referencing the incoming emission value against the historical emission range for the same component and phase; (b) verifying that the composite key matches a valid entry in the BIM model registry; and (c) confirming that the submitting organization holds a valid X.509 certificate issued by the channel’s membership service provider. Transactions that fail any of these checks are rejected and logged with a rejection code for audit purposes.
The third layer is BIM-level validation. Static material data, including emission factors and material quantities, is entered by the project BIM manager. Each data entry is verified through a digital signature process recorded on the blockchain, ensuring accountability and traceability for all static inputs. Any modification to emission factors or material quantities requires a new signed transaction, creating a complete revision history.
Each validated transaction is packaged into blocks containing cryptographic hash links to previous block headers, creating an immutable chain structure. The consensus mechanism employs the Raft protocol for crash fault-tolerant transaction ordering. The consensus configuration
is formally defined as follows:
where Leader manages log replication across Followers using AppendEntries remote procedure calls, and Log maintains ordered transaction sequences. This configuration achieves transaction finality without proof-of-work overhead, suitable for permissioned networks with known participants.
The computing layer additionally hosts the world state database, enabling efficient querying of current carbon metrics without full chain traversal. By combining BIM visualization with blockchain security, the computing layer establishes a single source of truth for carbon performance. The layer implements containerization through Docker for microservice isolation and Kubernetes orchestration for cloud deployment, enabling independent scaling of system components without affecting overall stability. The detailed formulations of the microservice architecture model and horizontal pod autoscaling logic are provided in
Appendix A.
Data accuracy in the proposed system is ensured through a three-layer verification mechanism. At the sensor level, IoT devices undergo factory calibration and periodic on-site recalibration, with automated range-checking at the edge gateway to flag out-of-bound readings before transmission. At the blockchain level, Hyperledger Fabric smart contracts execute automated validation rules that cross-check incoming data against predefined thresholds and historical patterns before committing transactions to the ledger. Transactions that fail validation are rejected and flagged for manual review. At the BIM level, static material data, including emission factors and material quantities, is entered by the project BIM manager and verified through a digital signature process recorded on the blockchain, ensuring accountability and traceability for all data inputs.
The system adopts a hybrid on-chain and off-chain data storage architecture. On-chain data consists of carbon emission transaction records, validation hashes, and smart contract execution logs. These records are stored on the Hyperledger Fabric distributed ledger and maintained collectively by all participating organizations through their respective peer nodes. Off-chain data includes raw sensor streams, BIM model files, and high-volume monitoring data. This information is stored on the project owner’s cloud infrastructure and managed by the main contractor’s IT department. Each organization retains ownership of its generated data. Cryptographic hashes stored on the blockchain verify the integrity of off-chain data. Channel-based data isolation ensures that authorized parties only access sensitive operational information. Data retention periods comply with project contractual requirements and local regulations.
The operation logic of the blockchain system is as shown in Algorithm 1.
| Algorithm 1 Carbon emission blockchain system |
| | Data: Data from the Transfer Layer |
| | Result: Continuously process sensor data with blockchain consensus |
| 1 | Initialize organizations {GC, MF, LP, CL, RB} |
| 2 | Generate cryptographic material for each org and register with CA |
| 3 | Deploy a Raft ordered cluster (5 nodes, fault tolerance 2) and peer nodes |
| 4 | Create channels: prod (GC, MF), log (GC, LP), inst (GC, CL), verif (all orgs) |
| 5 | for each channel do |
| 6 | | Add organizations to channel and join peers |
| 7 | | if channel is prodded then |
| 8 | | | Add private collection “ProdDetails” with endorsement policy OR(‘MF’,‘GC’) |
| 9 | | end |
| 10 | end |
| 11 | Deploy chaincode “carbon_cc” containing emission factors (electricity: 0.85, diesel: 2.68) |
| 12 | while true do |
| 13 | | Receive sensor data (value, phase, module, type) |
| 14 | | Create proposal and sign |
| 15 | | Collect endorsements from peers in the current phase |
| 16 | | if number of endorsements ≤ half of total peers then |
| 17 | | | Skip this data |
| 18 | | end |
| 19 | | Package transaction with endorsements and send to orders for Raft consensus |
| 20 | | Generate new block with hash linking to previous block |
| 21 | | All peers commit block and update world state (CouchDB) |
| 22 | | Compute current TPS |
| 23 | | if TPS > 2000 then |
| 24 | | | Scale peers based on CPU utilization |
| 25 | | end |
| 26 | | if block number % 100 == 0 then |
| 27 | | | Backup world state snapshot |
| 28 | | end |
| 29 | end |
3.5. Application Layer
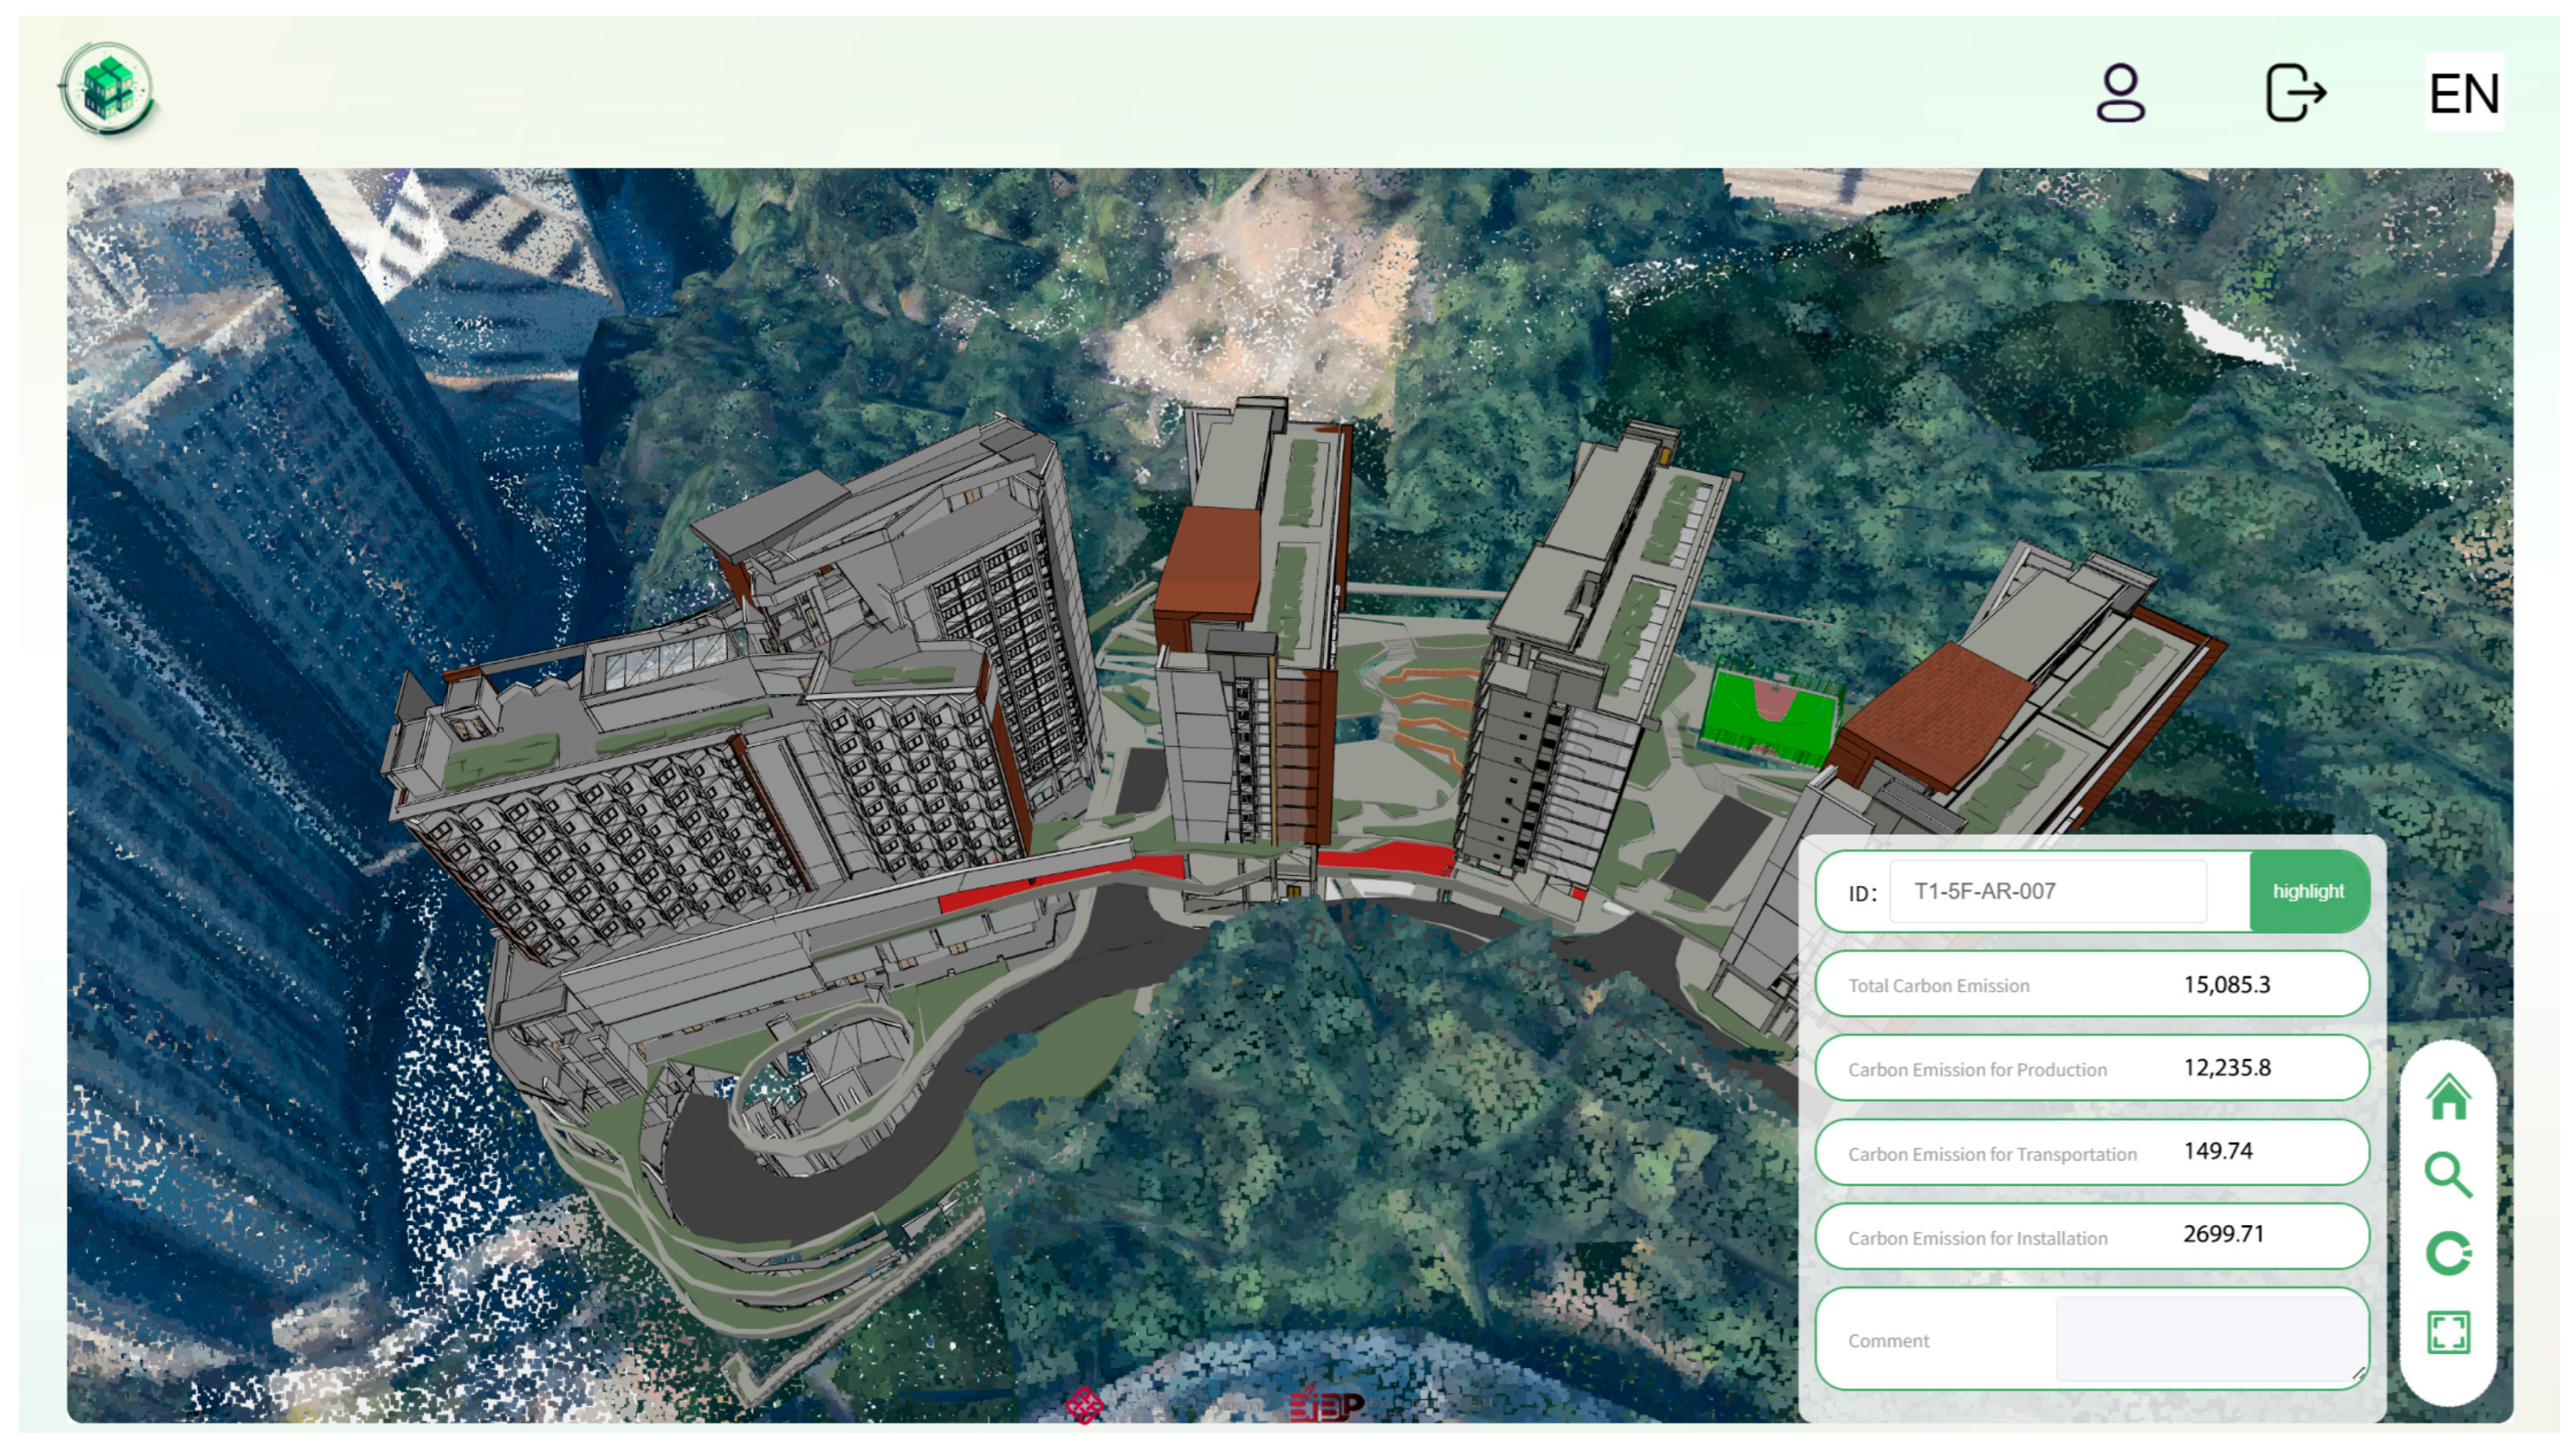
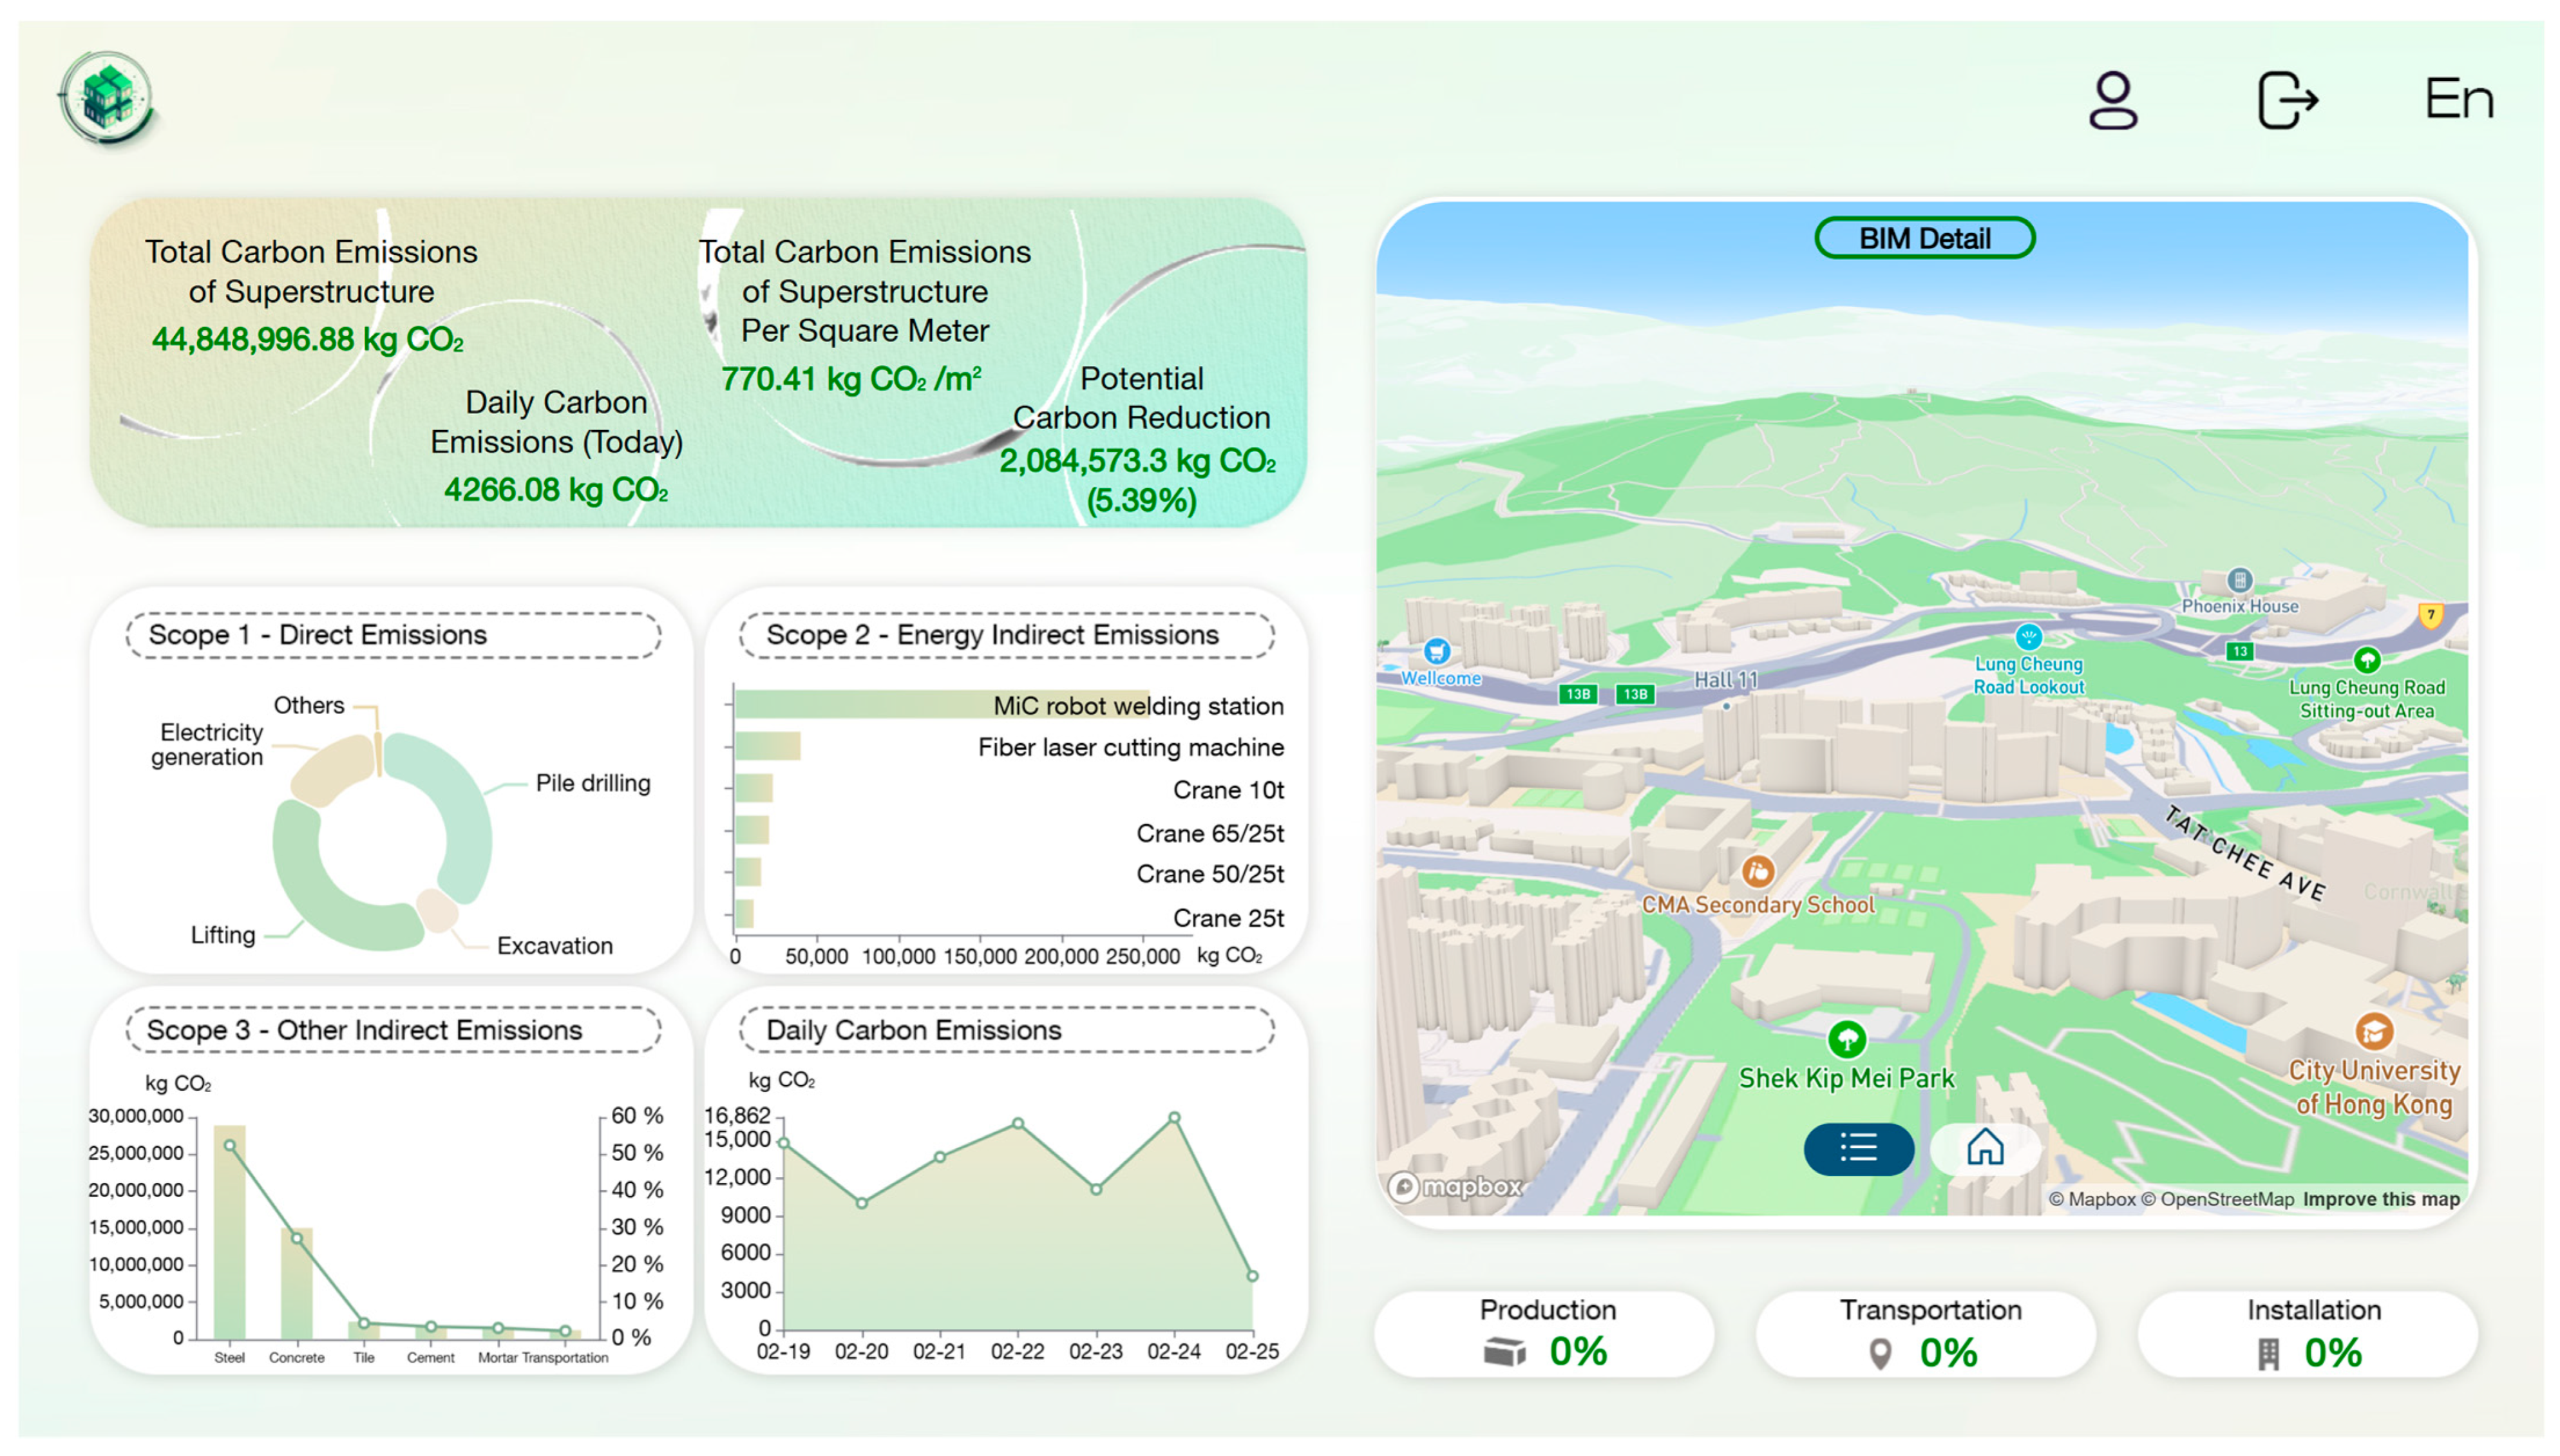
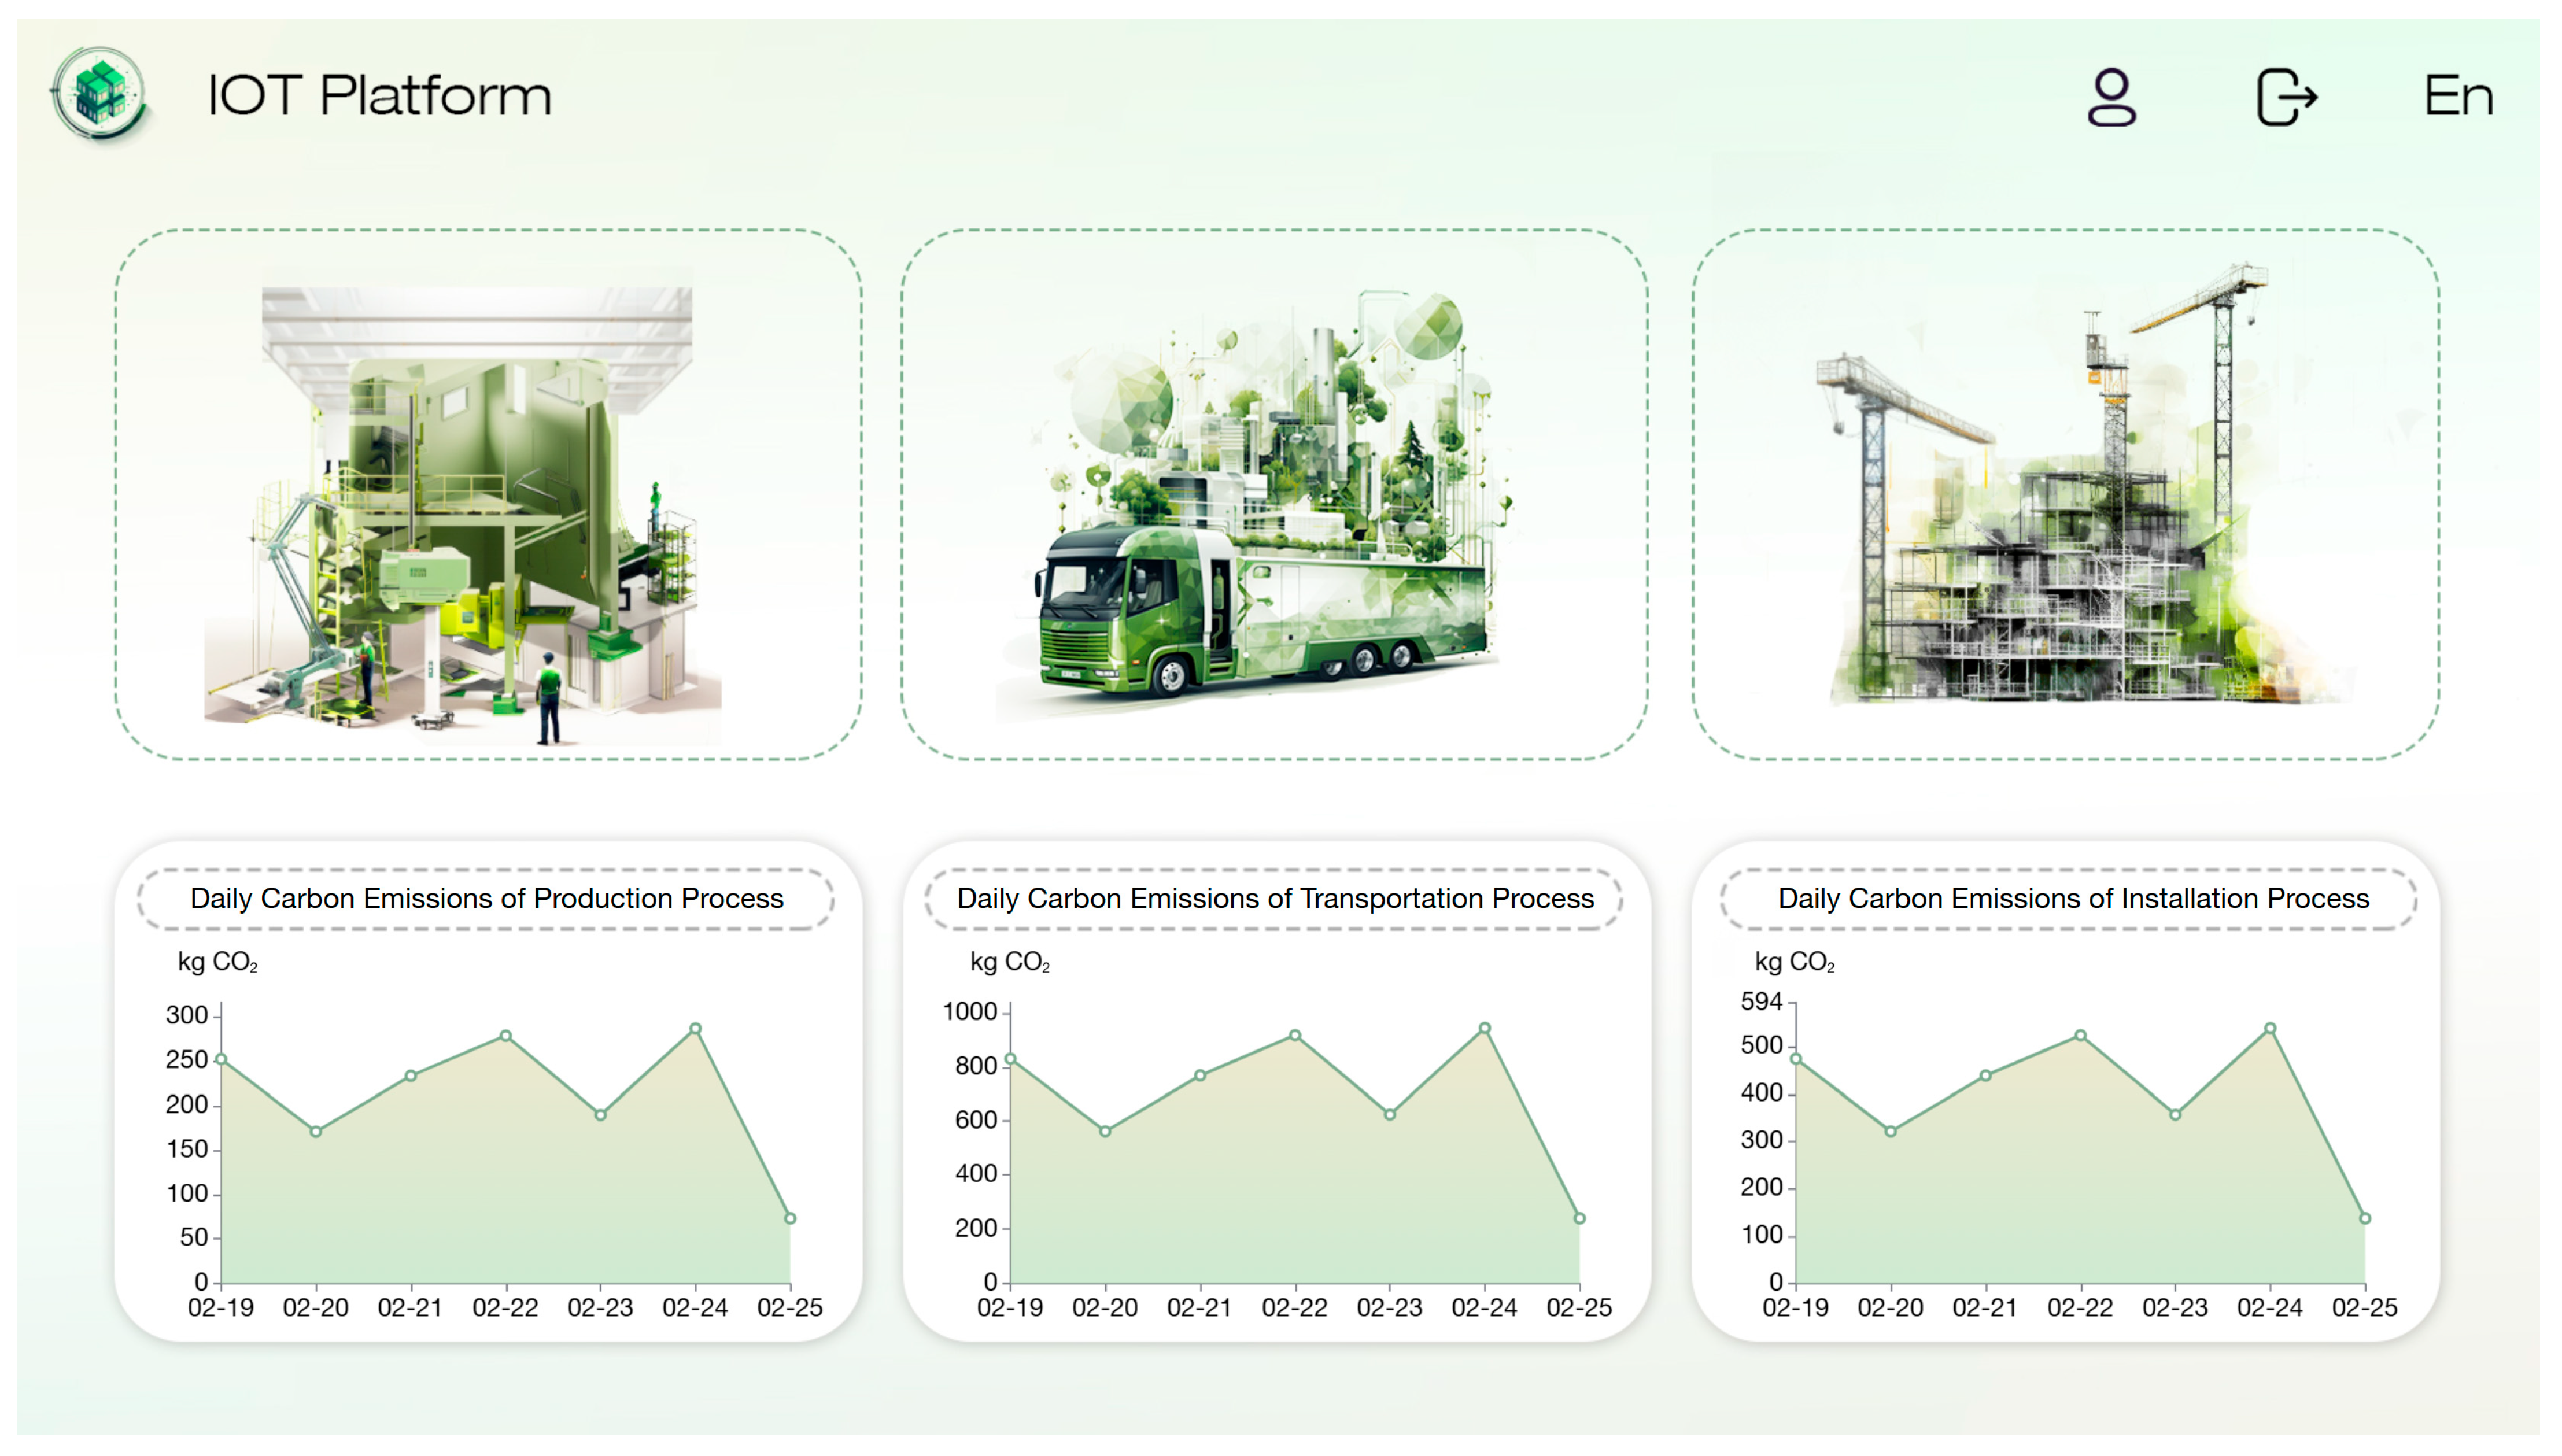
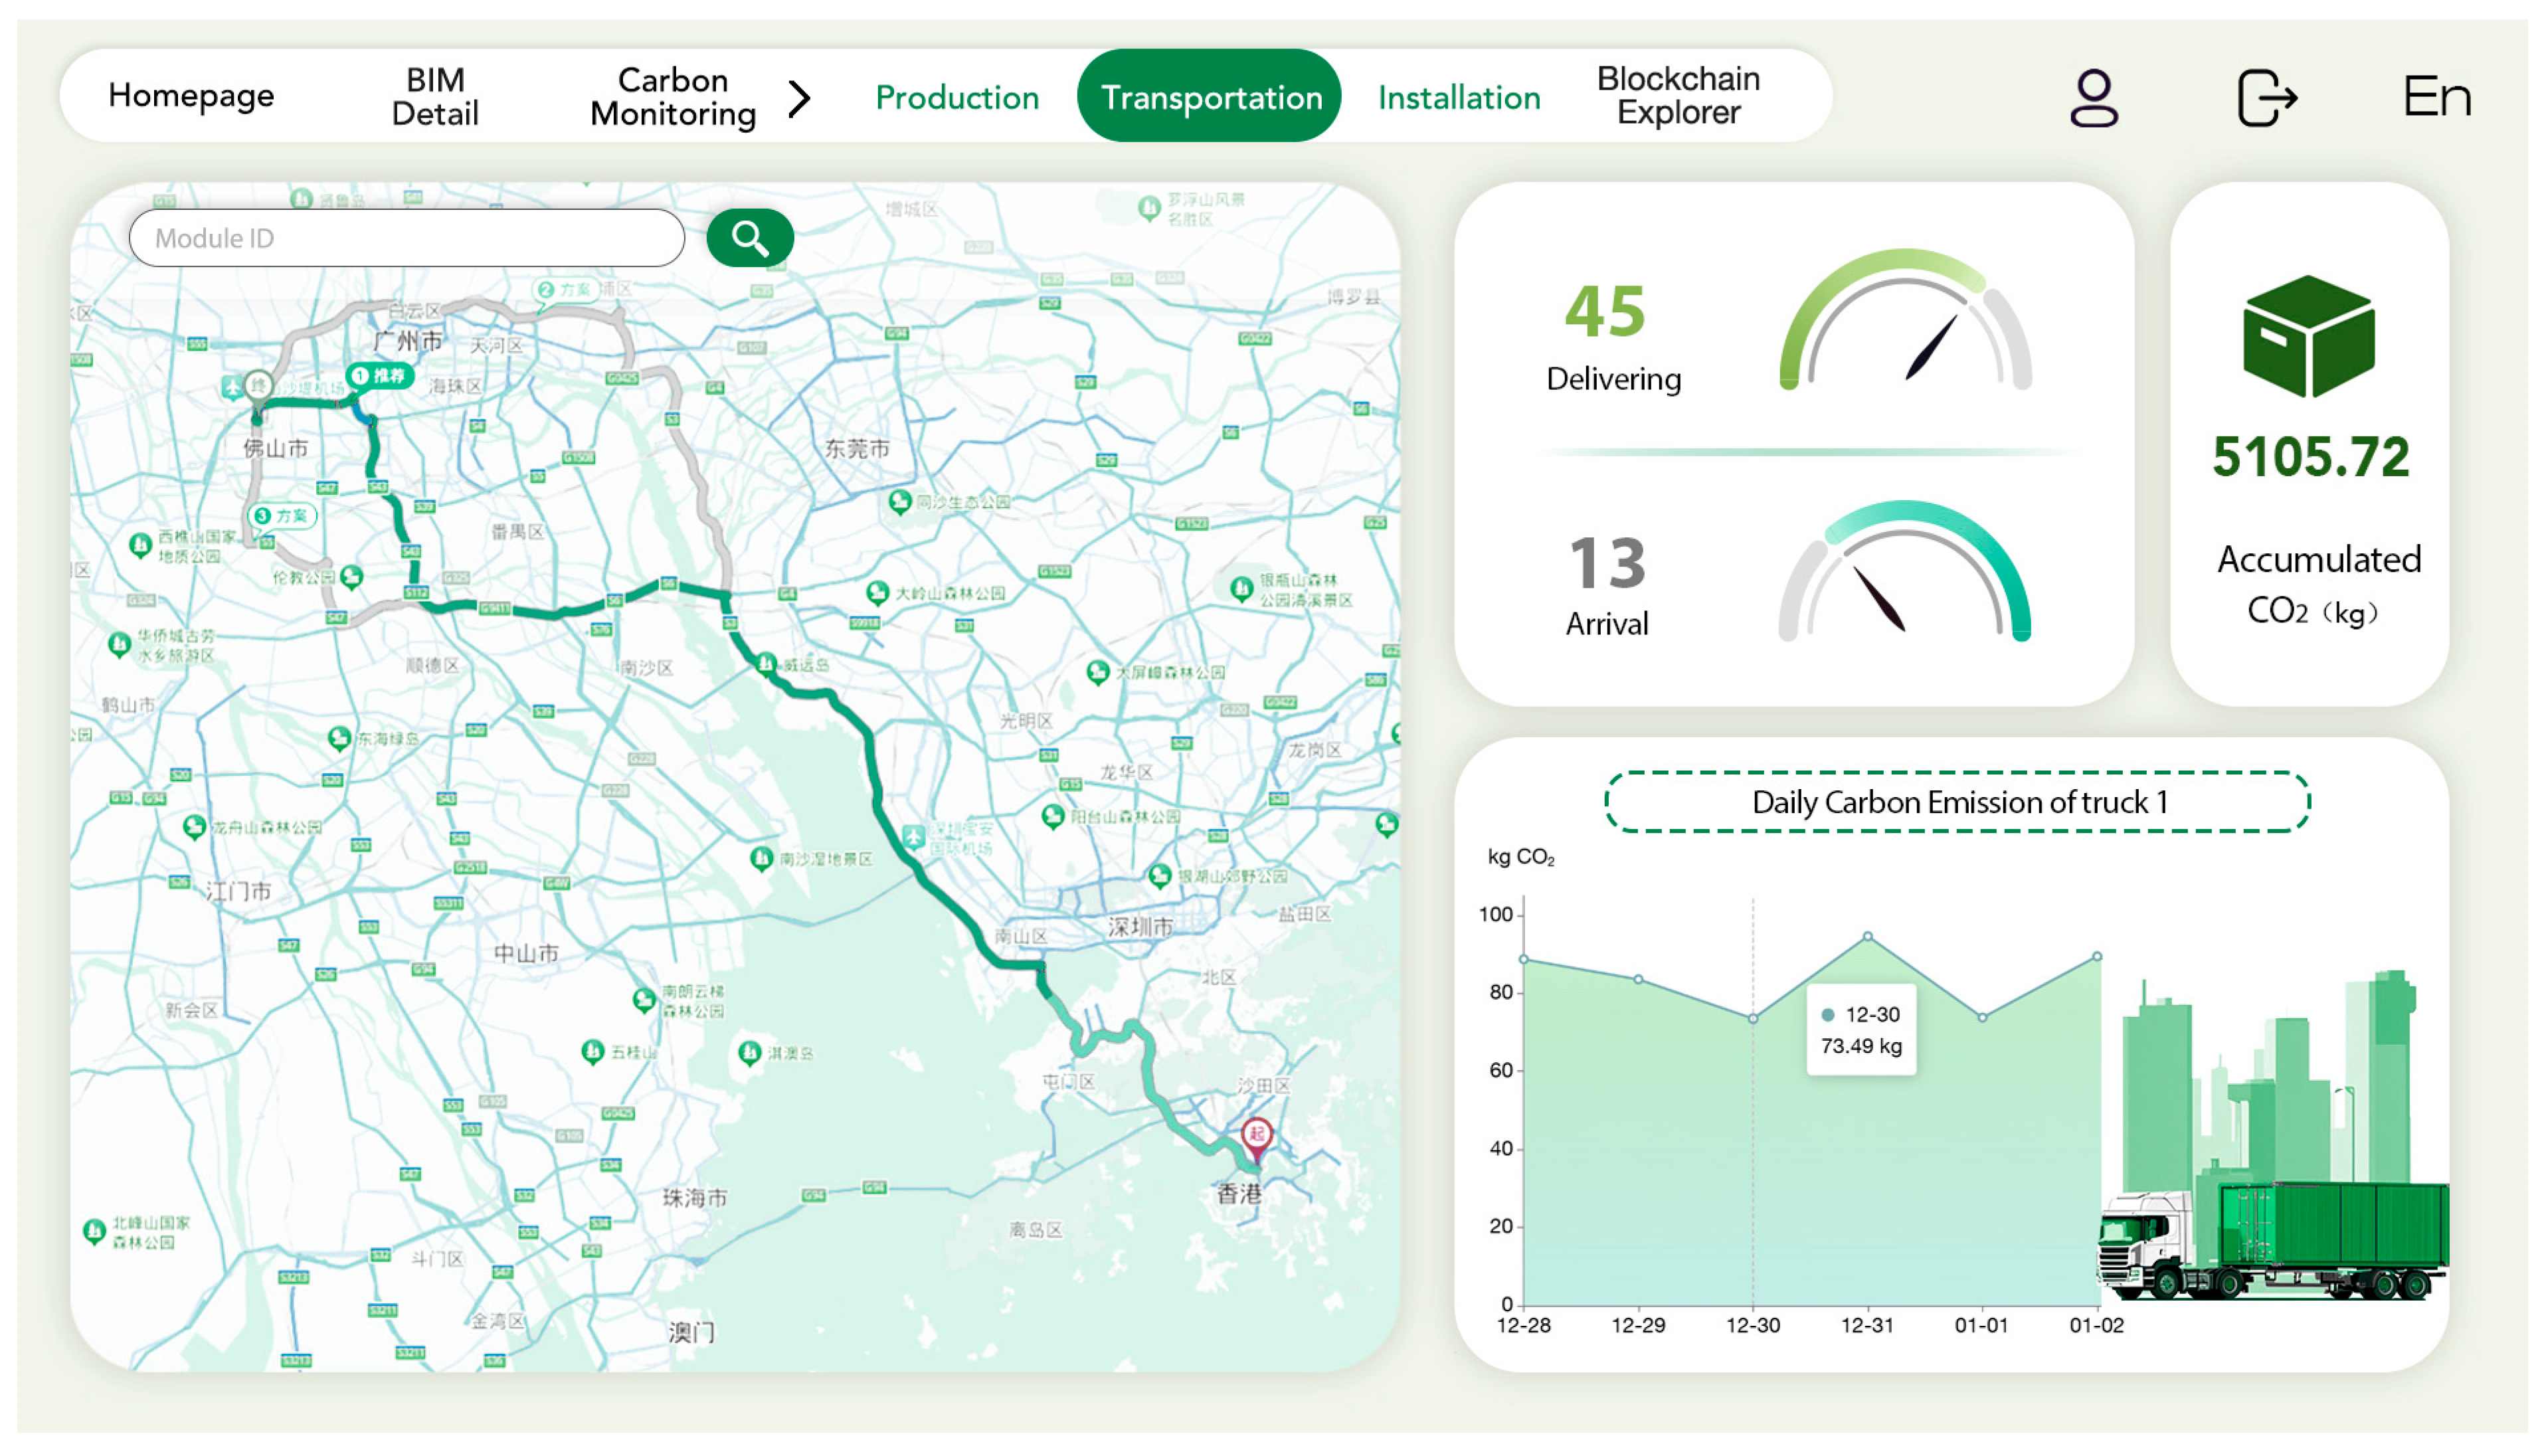
The Application Layer addresses the heterogeneous demands of multiple stakeholders through specialized applications for carbon monitoring, regulatory reporting, and analytical decision support. This layer provides the human–computer interface through which users interact with underlying system complexity, implementing principles of cognitive engineering and information visualization. A comprehensive user interface dashboard enables real-time carbon emissions monitoring, visualizing data through interactive charts and geospatial representations linked to the BIM model via WebGL rendering engines. The three-dimensional BIM geometry, denotes carbon emission data, and include color mapping functions encoding emission intensity. Stakeholders interact with specific building components through event-driven programming models, retrieving associated carbon histories.
All carbon resources and processes are exposed as services within a service-oriented architecture, enabling integration with external systems through standardized interfaces. This architecture supports interoperability with enterprise resource planning platforms and government regulatory portals through RESTful APIs. Role-based access control ensures users access only permission-relevant data through authentication tokens following JSON web token standards. This separation of concerns enhances both usability and data security through the principle of least privilege enforcement. The application layer completes the data lifecycle by transforming verified information into actionable knowledge through decision support systems.
The system incorporates proactive alert mechanisms notifying users when carbon thresholds are exceeded through push notification services. This feature enables immediate corrective action during construction processes, supporting dynamic carbon management rather than retrospective reporting only. The interface implements responsive web design principles, enabling access from desktop and mobile devices through adaptive layouts, ensuring consistent user experience across heterogeneous access platforms.




 ,
,