


Abstract
Leakage identification in district heating networks is challenging because leakage-induced transient pressure waves often overlap with pressure disturbances triggered by routine operations such as valve regulation, pump speed variation, and emergency shut-off. In addition, the scarcity of high-quality labeled leakage samples limits the robustness of data-driven models under small-sample conditions. To address these issues, this study proposes a compact and moderately interpretable framework for multi-condition identification from transient pressure-wave signals, integrating signal preprocessing, handcrafted statistical feature extraction, multiclass ReliefF-based feature selection, and class-wise generative adversarial network augmentation in the selected feature space. A dataset containing four representative conditions, namely leakage, valve regulation, pump speed regulation, and emergency valve shut-off, was constructed using an integrated indoor district heating network testbed. After Hampel-based spike suppression and zero-phase Butterworth band-pass filtering within 0.5 to 300 Hz, time- and frequency-domain statistical features were extracted, and a compact subset was selected by multiclass ReliefF. A class-wise generative adversarial network was then used to augment the training set in feature space, while all evaluations were performed strictly on real samples. The results show that feature-space augmentation improves robustness and generalization under operational disturbances and noise. Using random forest as the representative classifier, Accuracy and Macro-F1 increased from 0.960 to 0.985, while leakage recall improved from 0.920 to 0.980. Further comparisons confirmed that the ReliefF-selected subset outperformed representative alternatives such as LASSO and mRMR. Overall, the proposed framework provides an effective solution for distinguishing leakage events from operational disturbances and offers practical support for online monitoring and intelligent operation of district heating networks.
1. Introduction
As a critical component of urban infrastructure, the safe and stable operation of district heating networks (DHNs) directly affects energy efficiency, public safety, and the quality of life of residents. With the continuous expansion of DHN scale, the increasing complexity of network configurations, and the rising frequency of operational adjustments, heat carrier losses, pressure imbalances, reduced transmission efficiency, and operational risks caused by pipeline leaks have become increasingly prominent. Previous studies have shown that faults such as leaks, abnormal heat losses, and pressure drops significantly impact system reliability and operational economy. Therefore, developing rapid, accurate, and online-applicable leak identification methods is of great engineering significance [1,2,3].
In the field of DHN leak detection, existing methods can be broadly classified into external and internal diagnostic approaches. External methods, such as infrared thermography, acoustic sensing, and fiber-optic sensing, typically locate leaks by detecting changes in temperature, acoustic, or strain fields induced by the leakage event [4,5,6]. However, these techniques are often constrained by environmental conditions, burial methods, and on-site deployment limitations, making it difficult to achieve stable real-time online monitoring. In contrast, internal diagnostic methods rely on operational parameters like pressure and flow, rendering them more suitable for continuous monitoring and online deployment.
Among various internal diagnostic techniques, pressure-wave-based leak detection has gained considerable attention in recent years due to its fast response, online monitoring capability, and relative insensitivity to external environmental variations. These methods can be categorized into passive and active pressure-wave detection. The former utilizes negative pressure waves or acoustic emission signals spontaneously generated by the leak itself, analyzing their propagation characteristics for leak localization and identification [7,8,9]. The latter injects controlled pressure waves into the pipeline via an external excitation device and diagnoses leaks based on the reflection, attenuation, or spectral changes in the waves at the leak point [10,11].
Nevertheless, during actual operation, routine actions such as valve regulation, pump start-up/shutdown, or speed adjustments also induce significant transient pressure fluctuations whose signatures partially overlap with leak signals, posing a serious challenge to the accuracy and robustness of leak identification. Moreover, measurement noise can substantially affect pressure wave assessment and leak localization accuracy [8,9,10,11,12,13]. In parallel, research on DHN fault diagnosis has evolved from physical modeling and simulation-based optimization to data-driven approaches. Existing studies have covered the detection and identification of typical faults such as water leakage, abnormal heat loss, and pressure loss, as well as leakage diagnosis and localization based on sensor measurements [1,2,3,14,15,16]. Overall, DHN fault diagnosis is gradually shifting from purely mechanism-based analysis toward integrated model-driven and data-driven paradigms. However, research on fine-grained multi-class identification of pressure-wave signals under complex operating conditions remains relatively scarce. Hence, stably extracting discriminative leak features from pressure-wave signals under multiple disturbances, strong noise, and complex scenarios has become a critical issue urgently needing resolution.
In practical industrial environments, acquiring leak samples is difficult, and the amount of high-quality labeled data available for model training is typically limited, which has become a major bottleneck restricting the performance improvement of machine-learning methods. To address this small-sample problem, researchers have explored transfer learning and generative modeling. Tang et al. proposed a transfer-learning framework for detecting small-aperture leaks in natural gas pipelines [17], while Shi et al. developed a small-sample diagnostic method for pipe burst detection in water distribution systems [18]. In the area of generative adversarial networks (GANs), Wang et al. alleviated the small-sample problem in oil and gas pipeline leakage detection by improving GAN-based modeling [19]; Rajabi et al. employed conditional deep convolutional GANs for leakage detection and localization, demonstrating the potential of generative approaches for sample augmentation and identification in pipeline networks [20]; Zhang et al. and Shang et al. further improved data generation quality and class adaptability in industrial pipeline fault diagnosis through hybrid generative networks and multi-generator switching mechanisms, respectively [21,22]. These studies indicate that generative approaches can mitigate data scarcity to some extent. However, most existing work focuses on raw signals or other industrial scenarios, while small-sample augmentation tailored to the statistical feature space of DHN pressure waves remains insufficiently explored.
Beyond sample augmentation, feature construction and selection are also crucial for improving identification performance under small-sample conditions. High-dimensional small-sample classification is prone to the curse of dimensionality and overfitting, prompting the development of various feature selection strategies [23]. For instance, mutual-information-based methods entail high computational costs [24]; sparse representation methods such as LASSO suffer from limited stability when the sample size is very small [25]; and embedded evaluations like those in random forests can be influenced by hyperparameters and may retain redundant information [26]. By contrast, ReliefF, as a multi-class extension of the Relief algorithm, updates feature weights by comparing the differences between nearest neighbors from the same class and different classes, thereby effectively capturing local discriminative information that contributes significantly to decision boundaries [27,28,29]. This algorithm offers high computational efficiency, decoupling from the downstream classifier, robustness to noise, and no requirement for feature independence, making it particularly suitable for high-dimensional feature screening in small-sample settings. In the leakage detection field, Liang et al. and related studies have verified the effectiveness of ReliefF-like methods for classifying acoustic emission signals of valve internal leakage and for cross-domain pipeline defect diagnosis [30,31].
In summary, although considerable progress has been made in DHN leak detection, pressure-wave analysis, small-sample learning, and feature selection, notable gaps remain in fine-grained multi-class identification of pressure-wave signals under complex operating conditions. These gaps include the confusion between operational disturbances and leak features, insufficient model generalization with limited samples, limited research on small-sample augmentation in the statistical feature space of DHN pressure waves, and a lack of systematic studies on constructing compact, robust, and interpretable feature subsets. To address these issues, this study develops a compact, robust, and moderately interpretable multi-condition identification framework tailored to pressure-wave signals from DHNs under complex operating conditions, where signal confusion and limited sample sizes hinder model generalization. The proposed framework integrates statistical feature extraction, multiclass ReliefF-based feature selection, and GAN-based feature-space augmentation to enable fine-grained multi-class identification that distinguishes leaks from typical operational disturbances.
2. Experimental System and Dataset
2.1. Experimental System
Leakage events in district heating networks (DHNs) are typically accompanied by transient pressure-wave propagation [7]. Compared with approaches that rely on steady state measurements, leakage identification using transient pressure waves provides fast response and enables online monitoring with reduced sensitivity to external conditions [32]. However, routine operational actions such as valve regulation and pump start/stop can also induce transient disturbances, yielding partially overlapping signatures with leakage-induced pressure-wave responses in the measured signals. This similarity poses stringent requirements on the robustness of identification methods.
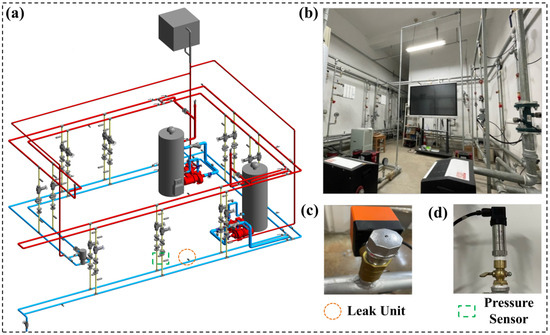
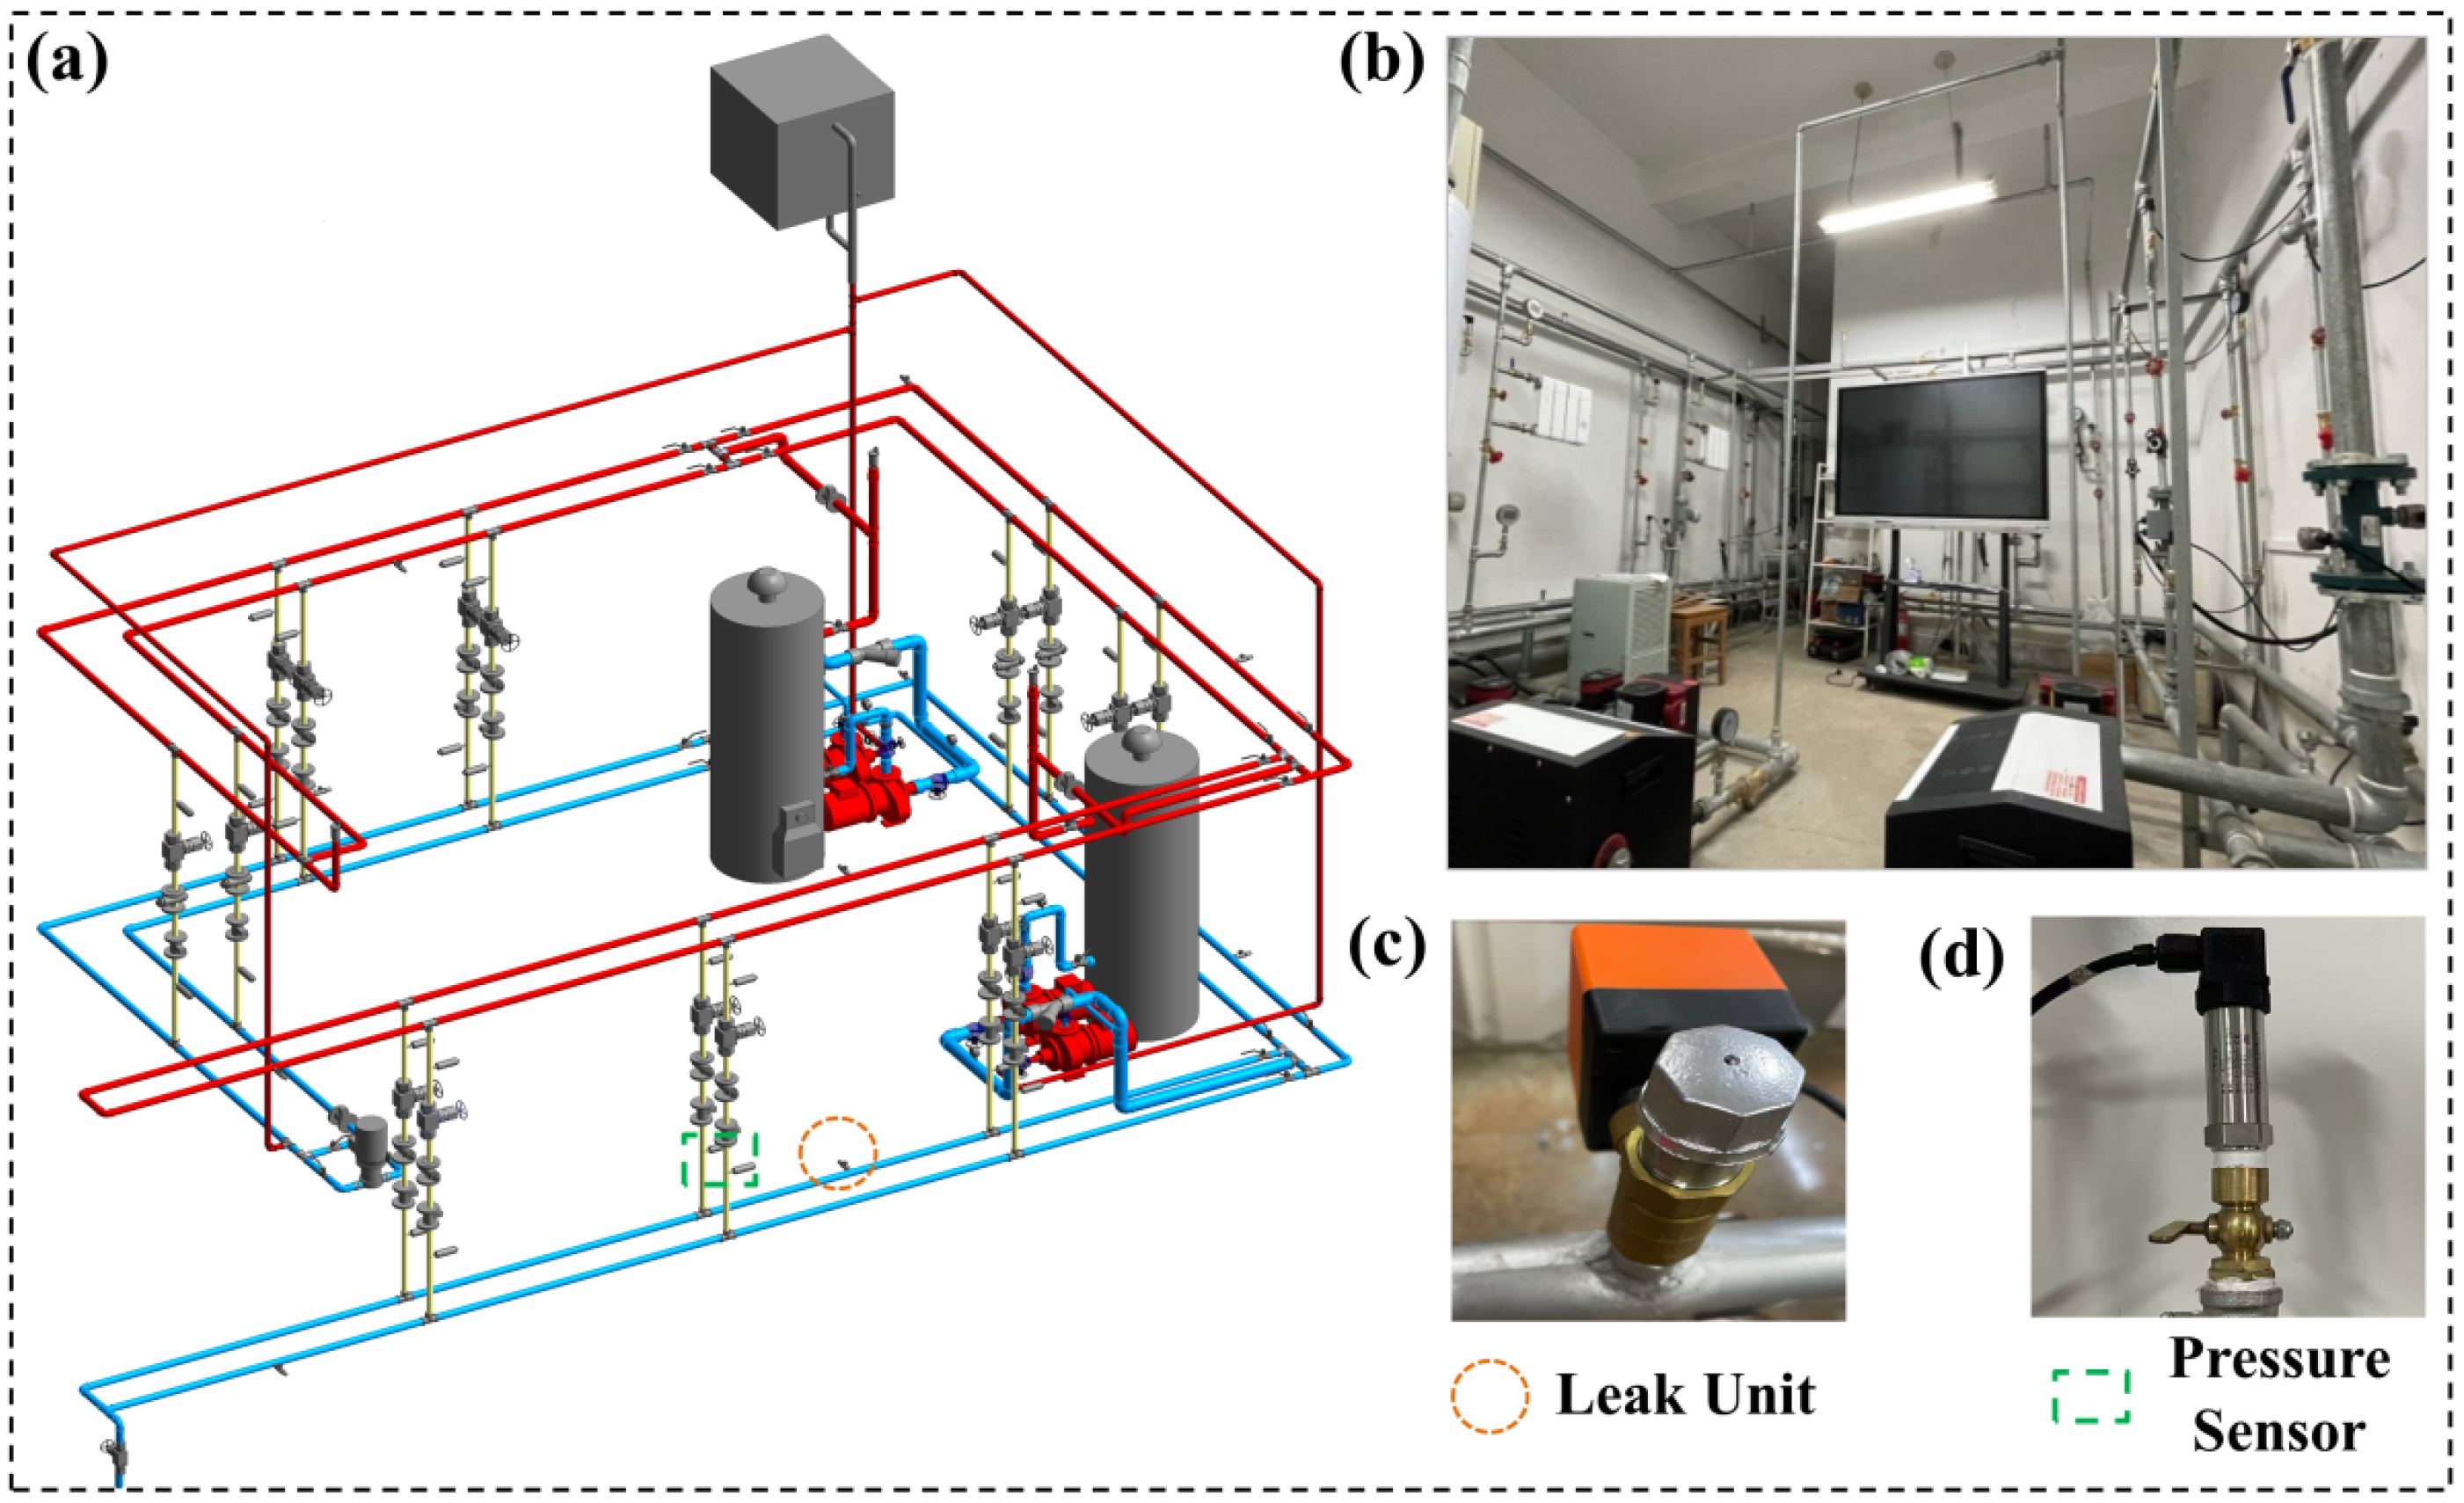
To address this challenge, we developed an integrated DHN experimental testbed that enables controllable indoor experiments under multi-source, multi-loop, and multi-condition scenarios. The testbed was installed in an indoor space of 4.5 m × 5 m × 3 m and configured as a three-dimensional, multi-source ring-type pipeline network (Figure 1). It comprises a heat-source unit, an experimental pipeline network, and an online data-acquisition unit. Two electric boilers operate independently or jointly, while a controllable pump on the return line supports hydraulic balancing and emulates operational variations. Representative hydraulic and thermal conditions (single/multiple heat sources, single/multiple loops, and ring/branched configurations) were reproduced by adjusting heat-source combinations and loop-valve states. Pressure signals were sampled at 2000 Hz for 10 s per trial and used for subsequent preprocessing, feature extraction, and model training and evaluation.
Figure 1.
Experimental platform for integrated heating network. (a) Three-dimensional schematic of the pipeline network; (b) Physical diagram of the experimental platform; (c) Leak unit; (d) Pressure sensor.
2.2. Dataset Construction and Preprocessing
The constructed pressure-wave dataset covers four representative scenarios in district heating networks, including both leakage events and operation-related disturbances: leakage, valve regulation, pump speed regulation, and emergency valve shut-off. For each scenario, 50 samples were collected, yielding a balanced dataset of 200 samples. All samples were acquired under controllable indoor conditions. By adjusting heat-source combinations, loop-valve states, and return-pump operating modes, multi-source, multi-loop, and multi-condition scenarios were systematically reproduced so that the dataset captures both event-related signatures and the disturbance effects associated with varying operating conditions.
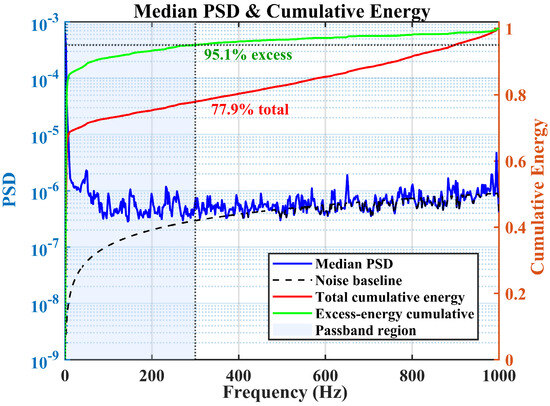
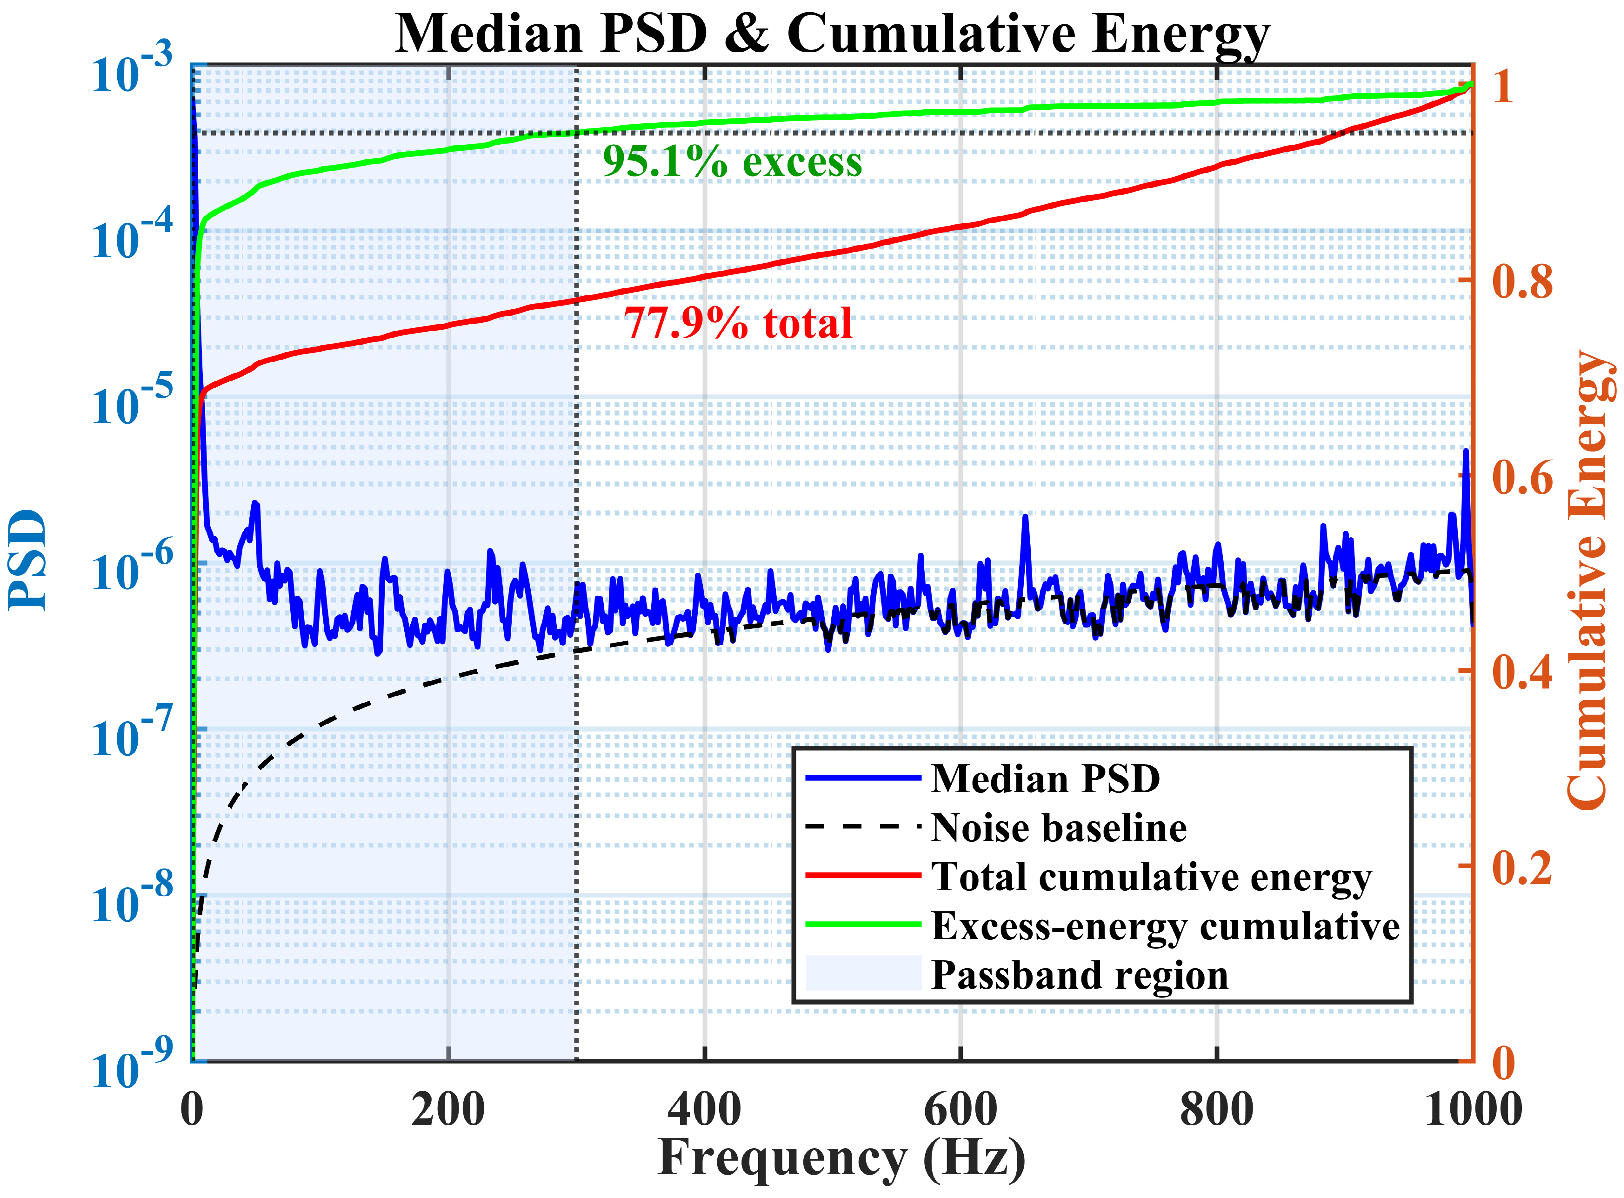
To improve robustness and ensure comparability across trials, the raw pressure records were preprocessed prior to feature extraction. First, a Hampel filter was applied to remove isolated impulsive spikes, reducing the influence of occasional pulse-like artifacts on transient features. Next, to determine an appropriate passband, one-sided power spectral densities (PSDs) were estimated for all records using the Welch method, and the median PSD across trials was used to represent the typical spectrum. A high-frequency noise baseline was then estimated to construct the total cumulative energy curve and the excess-energy cumulative curve (Figure 2). The 0.5–300 Hz band contains approximately 77.9% of the total spectral energy while accounting for about 95.1% of the excess energy above the noise baseline, indicating that the primary informative components are concentrated in this low-frequency range. Accordingly, a fourth-order Butterworth band-pass filter with a passband of 0.5–300 Hz was applied, and zero-phase filtering was implemented via forward–backward filtering (filtfilt) to avoid phase distortion that could affect subsequent feature extraction and identification. The resulting pressure-wave signals were used as the unified inputs for subsequent feature construction and model development.
Figure 2.
Median PSD and cumulative energy curves for passband selection.
3. Methodology
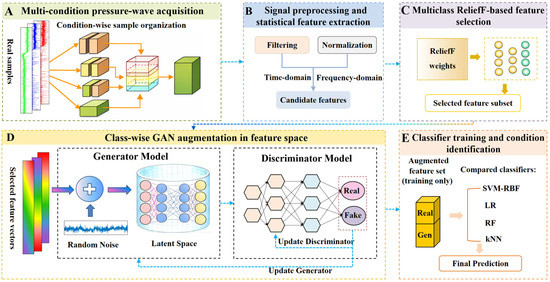
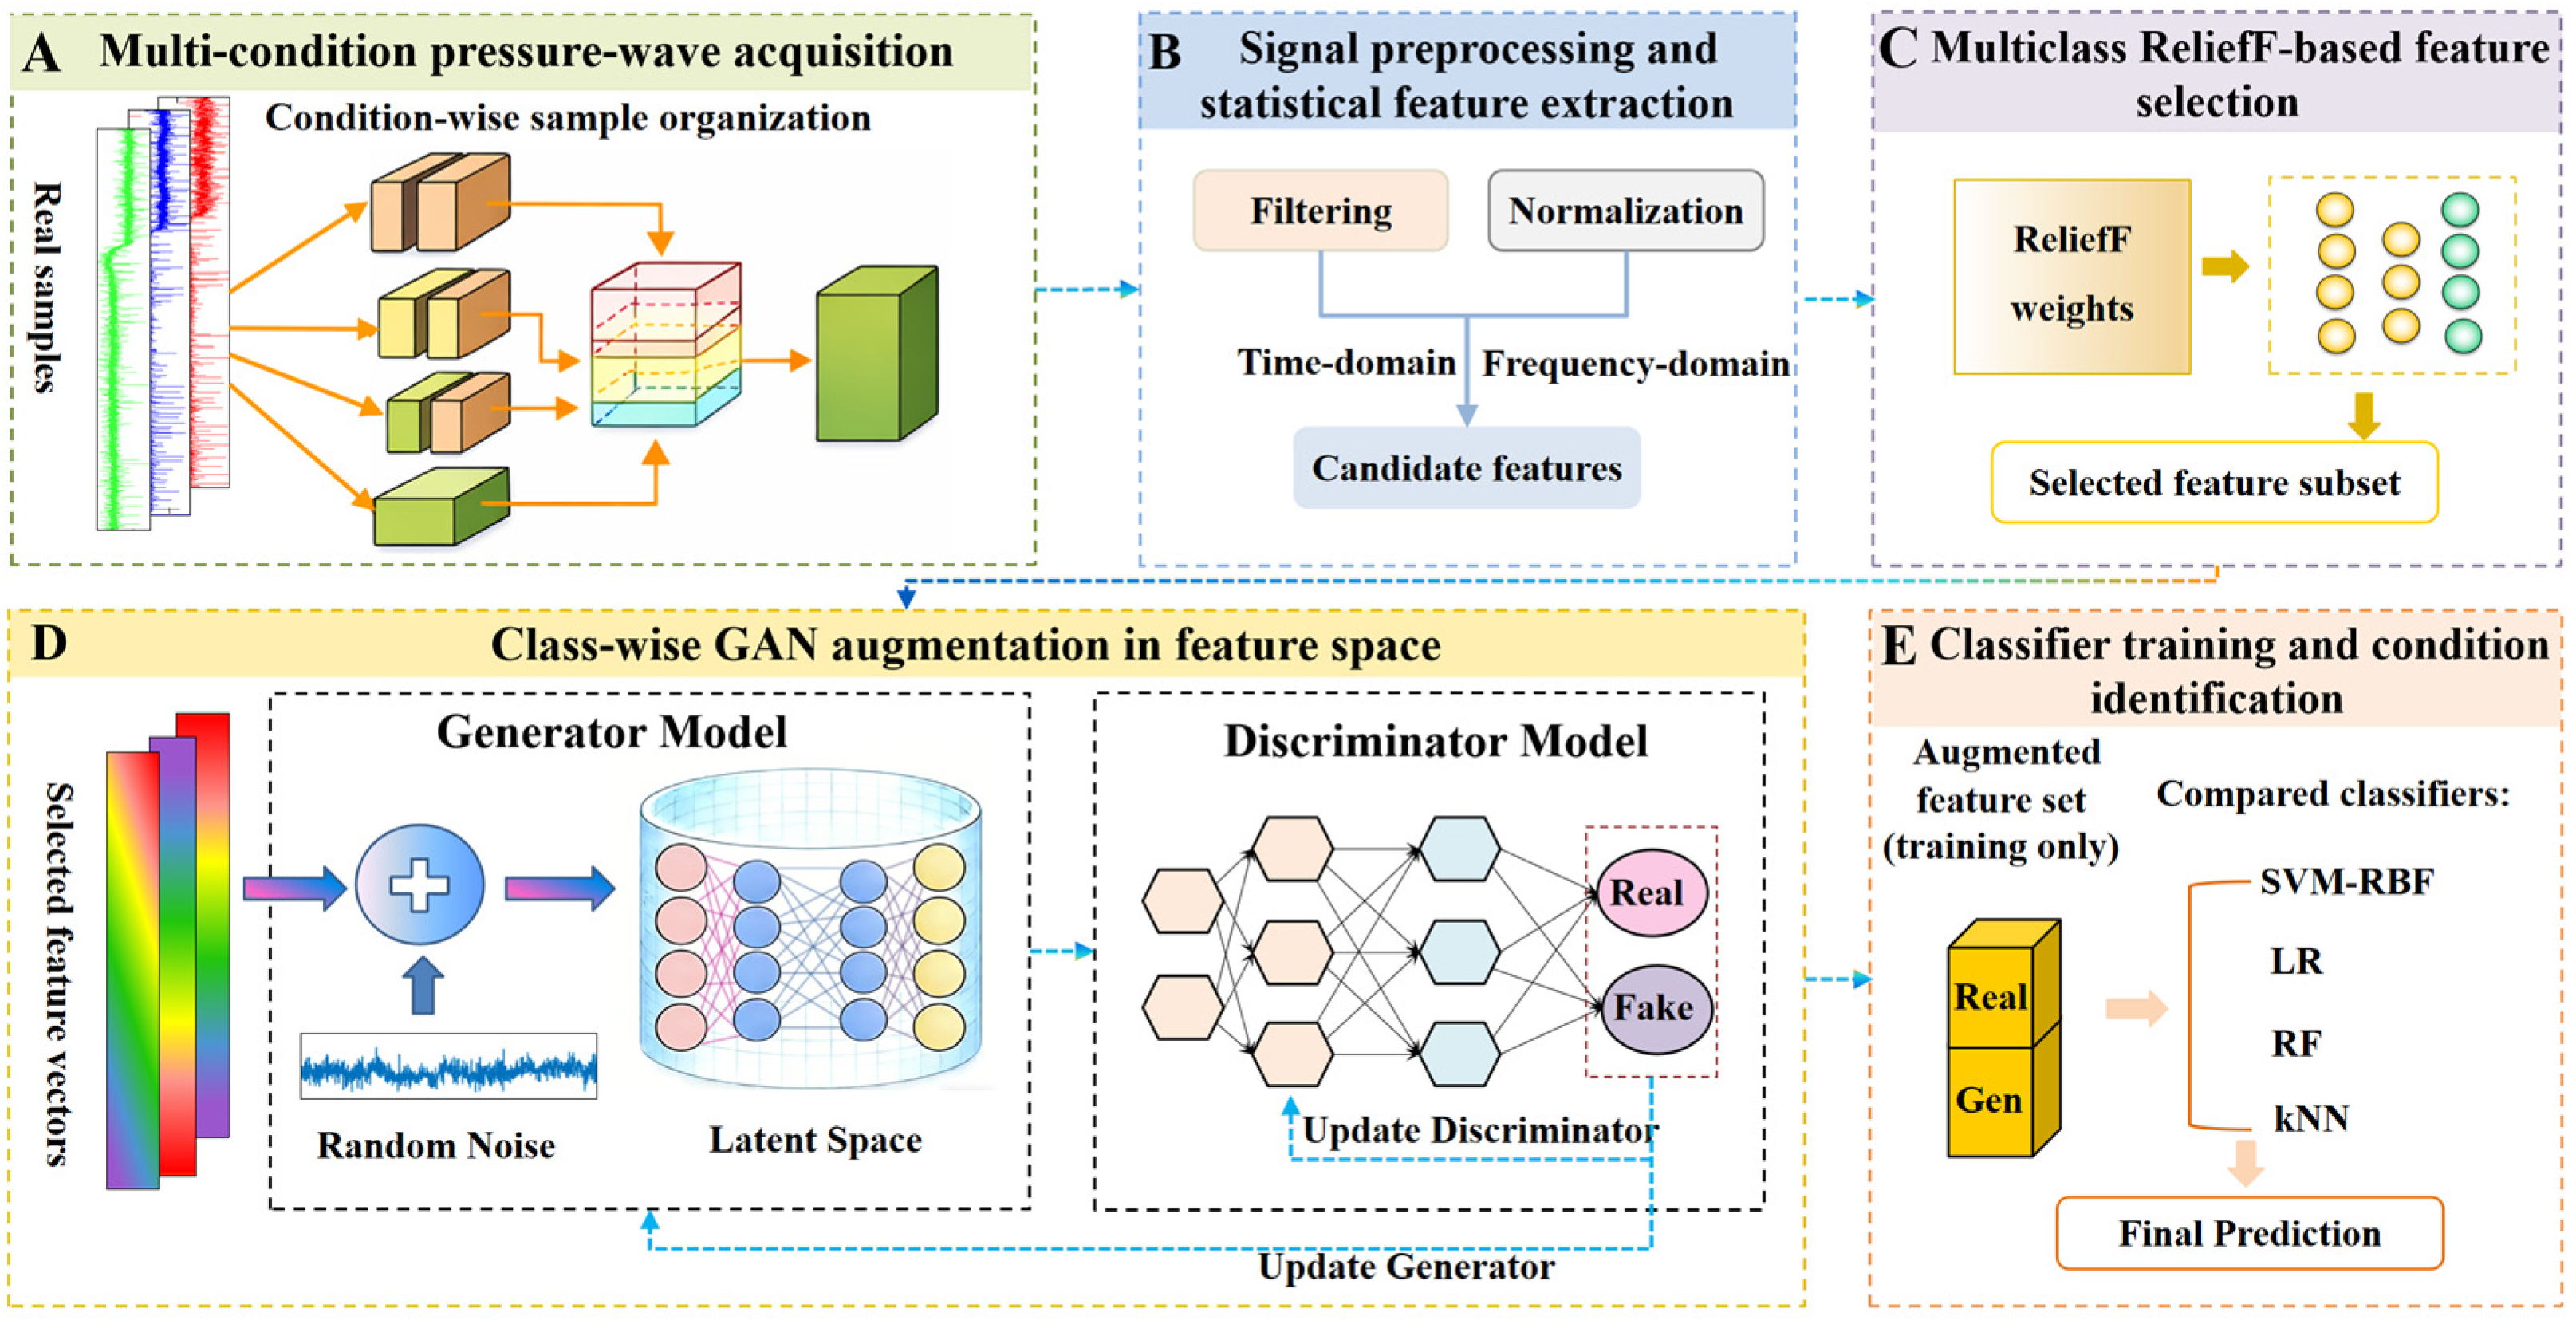
As summarized in Figure 3, the proposed framework starts from multi-condition transient pressure-wave acquisition in an integrated district heating network testbed. The raw pressure signals are first preprocessed to suppress outliers and noise, followed by extracting handcrafted statistical descriptors in both the time and frequency domains to form candidate feature vectors. A multiclass ReliefF scheme is then employed to rank features by their discriminative relevance and to select a compact subset for downstream learning. To mitigate the small-sample limitation under multi-condition settings, a class-wise GAN is trained in the selected feature space to generate synthetic feature vectors, which are used to augment the training set only. Finally, multiple classifiers are trained on the augmented feature set and used to identify operating conditions and leakage-related events on real test samples.
Figure 3.
Overall workflow of the proposed DHN transient pressure-wave based condition identification framework.
3.1. Feature Extraction
To represent transient pressure wave signals under multi-condition operations in a compact and interpretable form, we extract a set of hand-crafted features from each preprocessed segment. Time-domain statistical and shape-related descriptors have been widely adopted in pipeline leak diagnosis to capture amplitude level, dispersion, and impulsiveness, while frequency-domain descriptors summarize spectral energy distribution and characteristic frequencies that are sensitive to leakage-related acoustic or pressure-wave signatures [33,34,35]. For district heating applications, the leakage signature can vary with operating conditions such as temperature and pressure, which further motivates a robust feature representation that remains discriminative under multi-condition transients [36,37]. Accordingly, we construct a candidate feature pool by combining time-domain and frequency-domain descriptors. The complete definitions of the time-domain features (P1–P14) and the frequency-domain features (P15–P21) are provided in Table 1 and Table 2, respectively.
Table 1.
Time-domain features.
Table 2.
Frequency-domain features.
To enhance the physical interpretability of the selected statistical descriptors, the ReliefF-selected subset can be understood in three groups. The first group consists of amplitude- and energy-related features, including P1, P2, P3, P4, and P8, which quantify the overall fluctuation intensity of transient pressure responses. Leakage events involve abrupt local pressure release and stronger transient excursions, so these features tend to show larger variations than routine operational disturbances. The second group consists of shape and impulsiveness-related descriptors, including P9, P10, and P13, which are sensitive to asymmetry, sharp fluctuations, and non-Gaussian transient behavior. These characteristics are more likely to appear in leakage-induced pressure waves than in smoother regulation-induced transients. The third group consists of spectral descriptors, including P16, P17, and P19, which characterize spectral energy redistribution. Since leakage-induced waves often exhibit broader or more irregular frequency content, these features provide additional discriminative information for distinguishing leakage from valve- and pump-related disturbances. Overall, the selected feature subset is therefore not only statistically compact, but also physically meaningful with respect to leakage-induced transient pressure-wave characteristics. It should be emphasized that the selected statistical features are intended to provide robustness to operating-condition variability within the tested range; however, if the operating regime changes substantially beyond the current experimental domain, feature distributions may shift and model recalibration or adaptive updating may be required.
3.2. Multiclass ReliefF-Based Feature Selection
To construct a compact and interpretable discriminative input from multi-condition pressure-wave features, we adopt the multiclass extension of ReliefF to evaluate and rank candidate features. ReliefF is a filter-based feature selection method that updates feature weights by comparing the differences between near-hit (same-class) neighbors and near-miss (different-class) neighbors within a local neighborhood. It is decoupled from the downstream classifier, computationally efficient, and sensitive to local discriminative information, making it suitable for rapid screening and dimensionality reduction in engineering statistical features [27,29,38].
Let the training set contain N samples, each described by P candidate features. The feature vector of the i-th sample is denoted by , with class label . ReliefF initializes the feature-weight vector as , and performs T random iterations (here T = 500). At iteration t, a reference sample pi is randomly selected. Within the same class, the k nearest neighbors of pi (here k = 15) are denoted as Hj(pi) (j = 1,…, k). Meanwhile, for each different class c ≠ class(pi), the k nearest neighbors of pi within class c are denoted as Mc,j(pi) (j = 1,…, k). Feature weights are then updated according to the principle of “penalizing within-class differences and rewarding between-class differences”, with class-prior ratios incorporated for multiclass aggregation. For the r-th feature (r = 1, …, P), let Ar denote the corresponding feature mapping (i.e., Ar(p) = pr). The weight update is given by
where W(t) is the weight vector after th t-th iteration and W(t+1) is the updated weight vector. Pc denotes the prior proportion of class c in the training set (estimated by class frequency), and is the prior proportion of the class to which the reference sample belongs. This update mechanism assigns higher weights to features that are more stable within the same-class neighborhood and more discriminative across different classes, thereby reflecting their local discriminative contribution under multi-condition identification.
For continuous features, a normalized difference metric is adopted:
where and denote any two samples, is the indicator function. To avoid information leakage, max(A) and min(A) are computed using the training set only and are kept fixed during validation/testing. After T iterations, the final weight vector W(T) is obtained. Features are ranked in descending order of , and the Top-q features are retained to form the final feature subset for subsequent classifier training and evaluation. The value of q is determined within the training set (e.g., based on cross-validation performance or an elbow criterion on the weight curve), and the test set is used only for final generalization evaluation.
3.3. Data Augmentation Using GAN
Due to the limited number of controllable experiments, the multi-condition pressure-wave dataset is relatively small, which may restrict the ability of supervised models to learn stable decision boundaries under operation-related transients. To mitigate this issue, we employ generative adversarial networks (GANs) for data augmentation in the feature space. GAN-based augmentation has been increasingly used for small-sample or imbalanced pipeline leakage and fault diagnosis, demonstrating improved robustness and generalization [20,21,22].
Given the four-class identification task, we adopt a class-wise augmentation strategy to ensure label consistency. A separate GAN is trained for each class using the corresponding real feature vectors pi. After training, synthetic feature vectors are generated by sampling latent variables zi∼pz(z) and mapping them through the generator G(⋅) to obtain . In this study, the original dataset contains 200 real samples (50 per class). The dataset size is expanded by a factor of five, increasing the total number of samples from 200 to 1000. To keep the dataset balanced, each class is expanded from 50 to 250 samples, i.e., 200 synthetic samples are generated per class. Importantly, synthetic samples are used only for training-time augmentation, while all evaluations are conducted on real samples to avoid information leakage.
The discriminator D(⋅) is optimized to assign high confidence to real samples and low confidence to generated samples:
where E[⋅] denotes the expectation operator, pi∼pdata(p) denotes a real feature vector sampled from the data distribution, zi∼pz(z) denotes a latent variable sampled from the prior distribution, G(⋅) maps zi to a synthetic feature vector G(zi), and G(⋅) outputs the probability that an input feature vector is real.
With D fixed, the generator G is trained to fool the discriminator by minimizing:
This alternating optimization between D and G is repeated until convergence or until a predefined number of training epochs is reached.
3.4. Training Protocol and Evaluation Metrics
To ensure a fair evaluation of the proposed framework, all experiments were conducted under a strict training/testing separation protocol. The dataset was first divided into training and test sets, and the test set was used exclusively for final performance evaluation. All data-dependent procedures, including feature normalization, feature ranking, and feature subset selection, were performed using the training set only, and the obtained parameters were then applied to the test set. This protocol prevents information leakage and ensures that the reported results reflect the true generalization capability on unseen real samples.
After signal preprocessing and statistical feature extraction, feature selection was performed on the training set. In addition to the proposed multiclass ReliefF method [27,28,29], two representative feature selection methods, namely mRMR [24] and LASSO [25], were introduced for comparison. ReliefF evaluates feature importance according to local discriminative information in the neighborhood space and is particularly suitable for multi-class problems under limited-sample conditions [39]. mRMR aims to obtain a compact feature subset by balancing feature relevance and redundancy [24], whereas LASSO performs embedded feature selection through sparse regularization [40]. To evaluate the influence of the downstream learning model, four representative classifiers were further considered, including support vector machine with radial basis function kernel (SVM-RBF) [41,42], logistic regression (LR) [43], random forest (RF) [28], and k-nearest neighbors (kNN) [44,45]. These models were selected because they represent kernel-based, linear, ensemble-based, and distance-based classification paradigms, respectively, and have been widely used in data-driven fault diagnosis and pattern recognition studies. Detailed mathematical derivations of these methods are beyond the scope of this paper, and interested readers may refer to the corresponding literature for further details.
Because the original dataset is limited in size, GAN-based augmentation in feature space was introduced to enrich the training distribution. Augmentation was applied only to the training set, whereas the test set always consisted of real measured samples. Therefore, any performance gain observed after augmentation can be interpreted as an improvement in model robustness and generalization rather than an artifact of synthetic-sample reuse. The classifier performance before and after augmentation is denoted as Base and Augmented, respectively. To reduce the influence of randomness in feature selection, classifier training, and synthetic sample generation, each experiment was repeated multiple times under different random seeds, and the averaged results were reported. All comparative experiments were conducted under the same protocol to ensure consistency and fairness.
For the multi-condition identification task, the classification performance was evaluated using metrics derived from the confusion matrix [46,47]. For class i, TPi, FPi, FNi, and TNi denote the numbers of true positives, false positives, false negatives, and true negatives, respectively. The overall classification accuracy is defined as
where C is the number of classes and Nts is the total number of test samples.
To assess the balanced performance across all operating conditions, the macro-averaged F1-score was adopted:
The class-wise F1-score is calculated as
with
Since leakage recognition is the primary engineering concern in this study, the performance of the leakage class was further evaluated separately. For the leakage class, TPleak, FPleak, FNleak, and TNleak are defined analogously. The leakage-class precision, recall, specificity, and F1-score, denoted as Leak-Prec, Leak-Rec, Leak-Spec, and Leak-F1, respectively, are given by
In this study, Accuracy and Macro-F1 were used to evaluate the overall identification performance across all operating conditions, whereas Leak-Prec, Leak-Rec, Leak-Spec, and Leak-F1 were used to specifically quantify the distinguishability of leakage events from operation-induced disturbances. For each classifier and feature selection method, the results under both Base and Augmented settings were compared on the same real test set. This evaluation protocol provides a comprehensive assessment of classifier effectiveness, feature selection rationality, and the contribution of GAN-based feature-space augmentation.
4. Results
4.1. Feature Selection Results
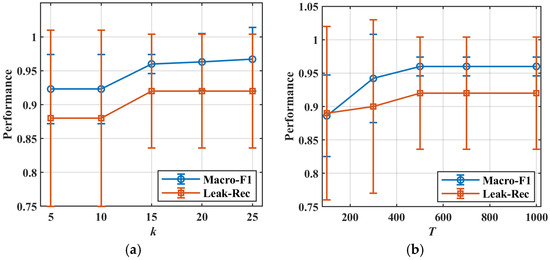
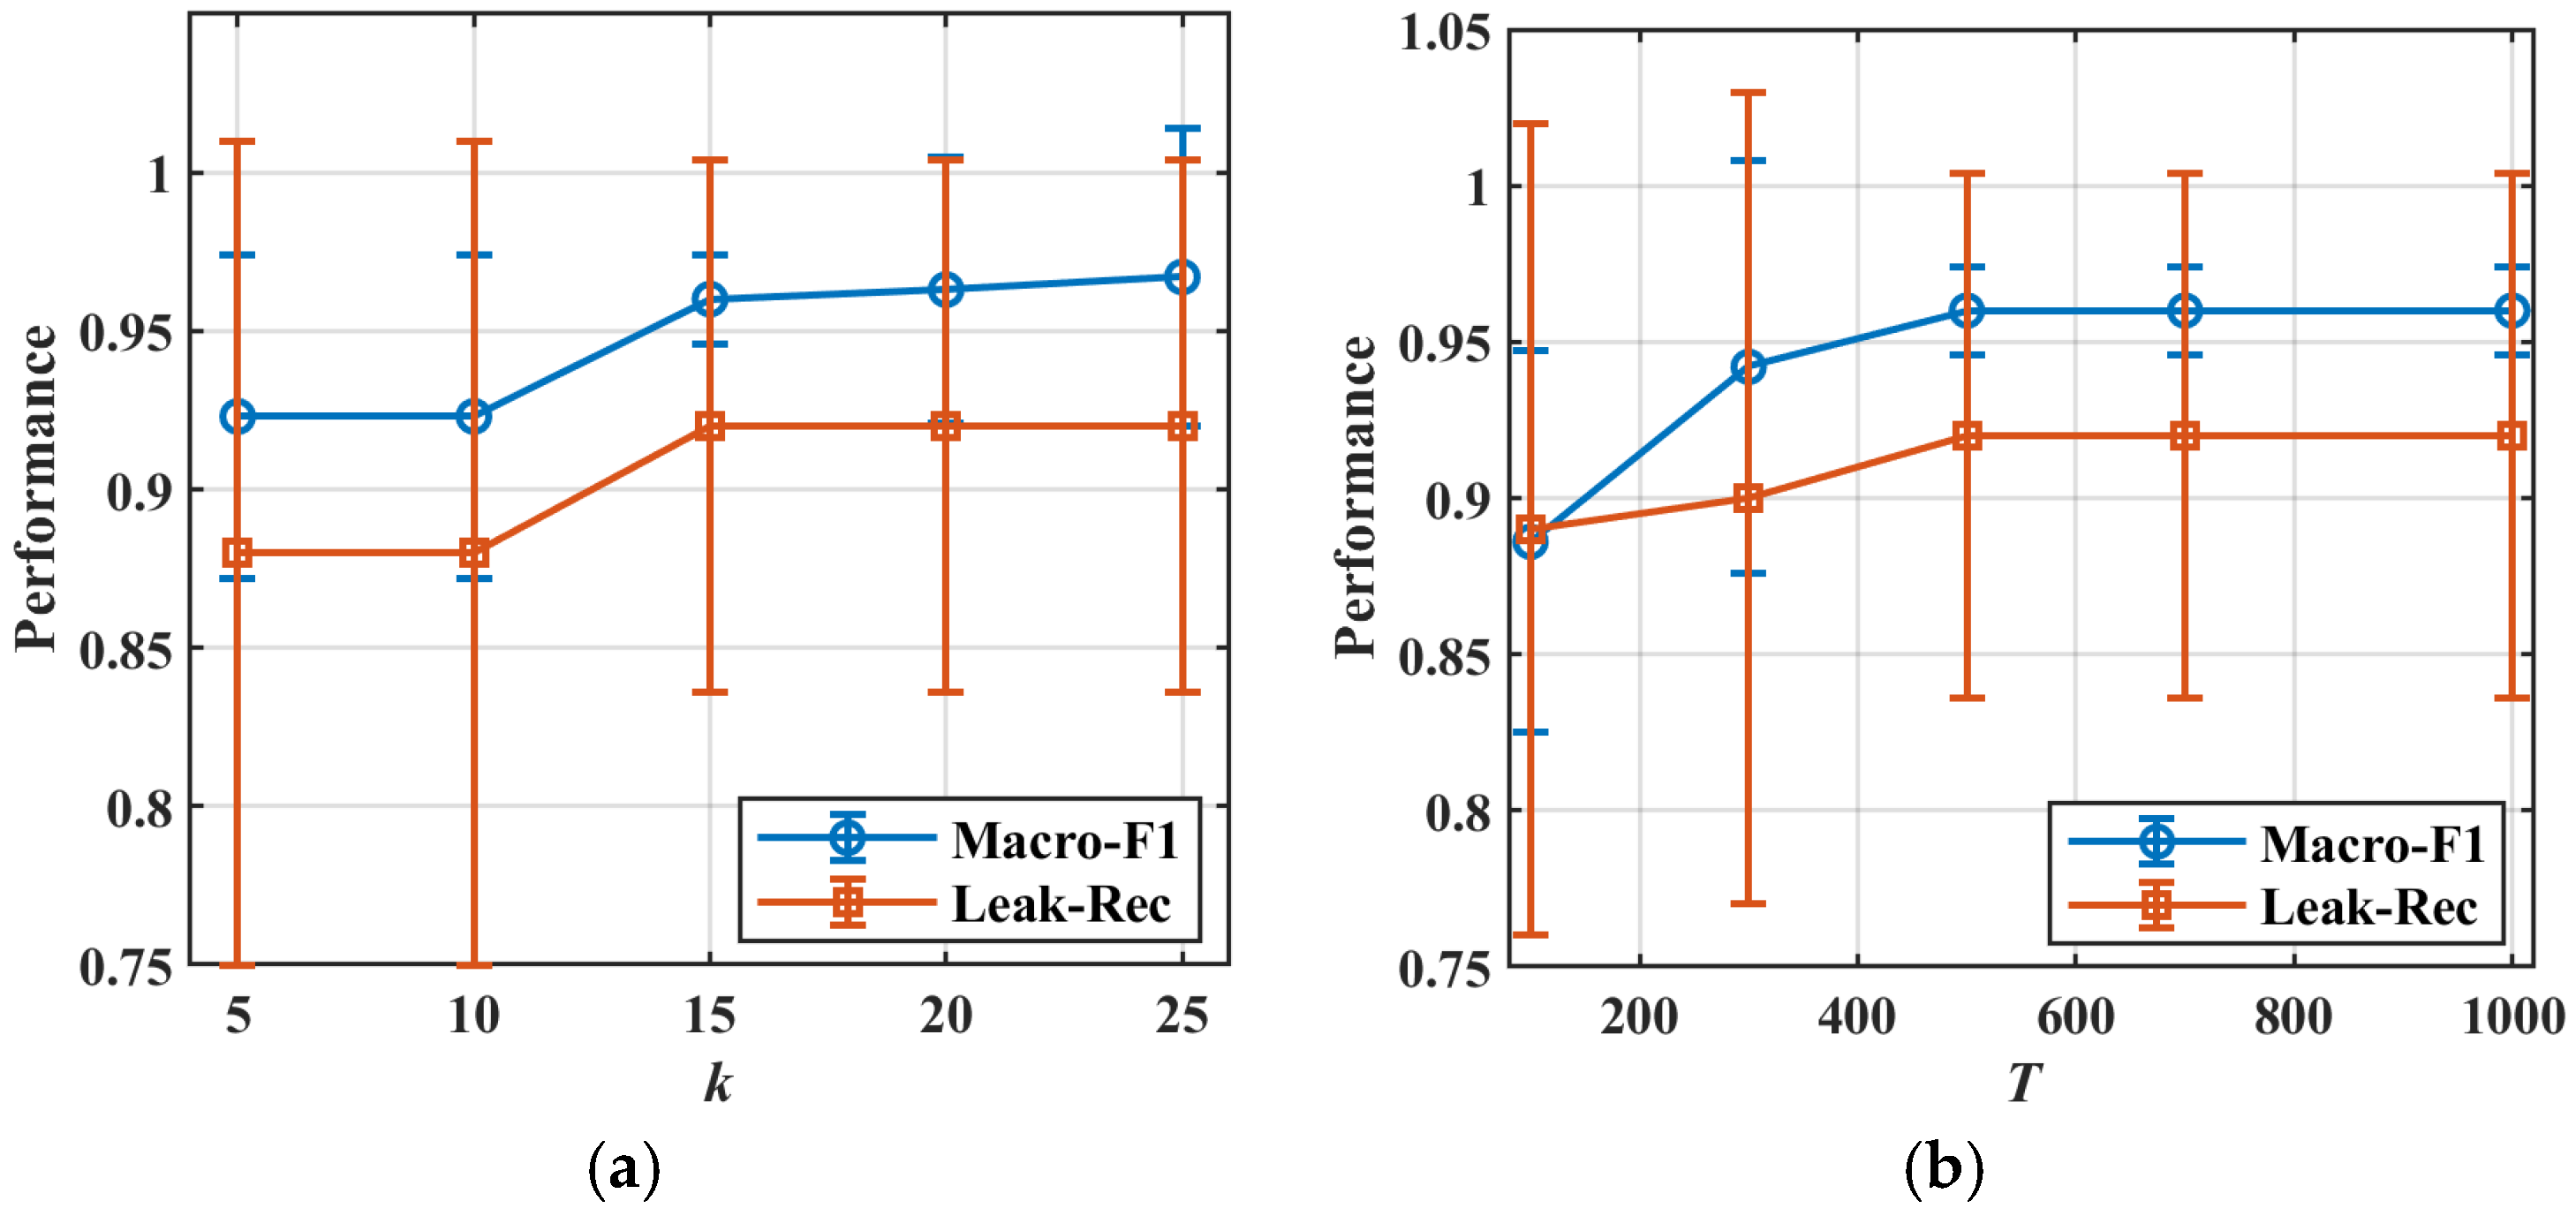
To obtain input features with stronger discriminative capability for multi-condition pressure wave identification, we employ multiclass ReliefF to evaluate the importance of candidate features. To avoid information leakage, both the ReliefF weight estimation and feature selection are performed exclusively on the training set. ReliefF exploits the local neighborhood structure of samples by quantifying feature-wise differences between near-hit (same-class) and near-miss (different-class) neighbors and updating feature weights accordingly; a larger weight indicates a greater contribution to class separability. Since the number of neighbors k affects the stability of neighborhood estimation and the number of iterations T influences the convergence of the weight estimation, additional sensitivity analyses were conducted for both hyperparameters.
As shown in Figure 4, the downstream performance is relatively low and unstable when k is too small but becomes markedly more stable once k reaches a moderate range. Although slightly higher mean Macro-F1 values are observed at larger k values, the corresponding standard deviations also become noticeably larger. Therefore, k = 15 was adopted as a stable and computationally efficient choice. Similarly, the performance improves as T increases from 100 to 500 but remains essentially unchanged for T = 700 and 1000, indicating that the ReliefF ranking has already converged at T = 500. Based on these observations, k = 15 and T = 500 were selected as practical parameter settings balancing robustness and computational cost. The final feature weights are shown in Figure 4, based on which a subset of high-weight features is selected for downstream classification.
Figure 4.
Sensitivity analysis of ReliefF hyperparameters. (a) Sensitivity of ReliefF to the number of neighbors k. (b) Sensitivity of ReliefF to the number of neighbors T.
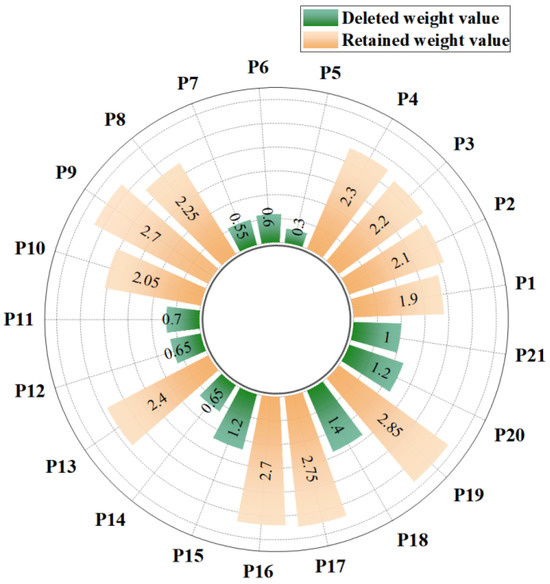
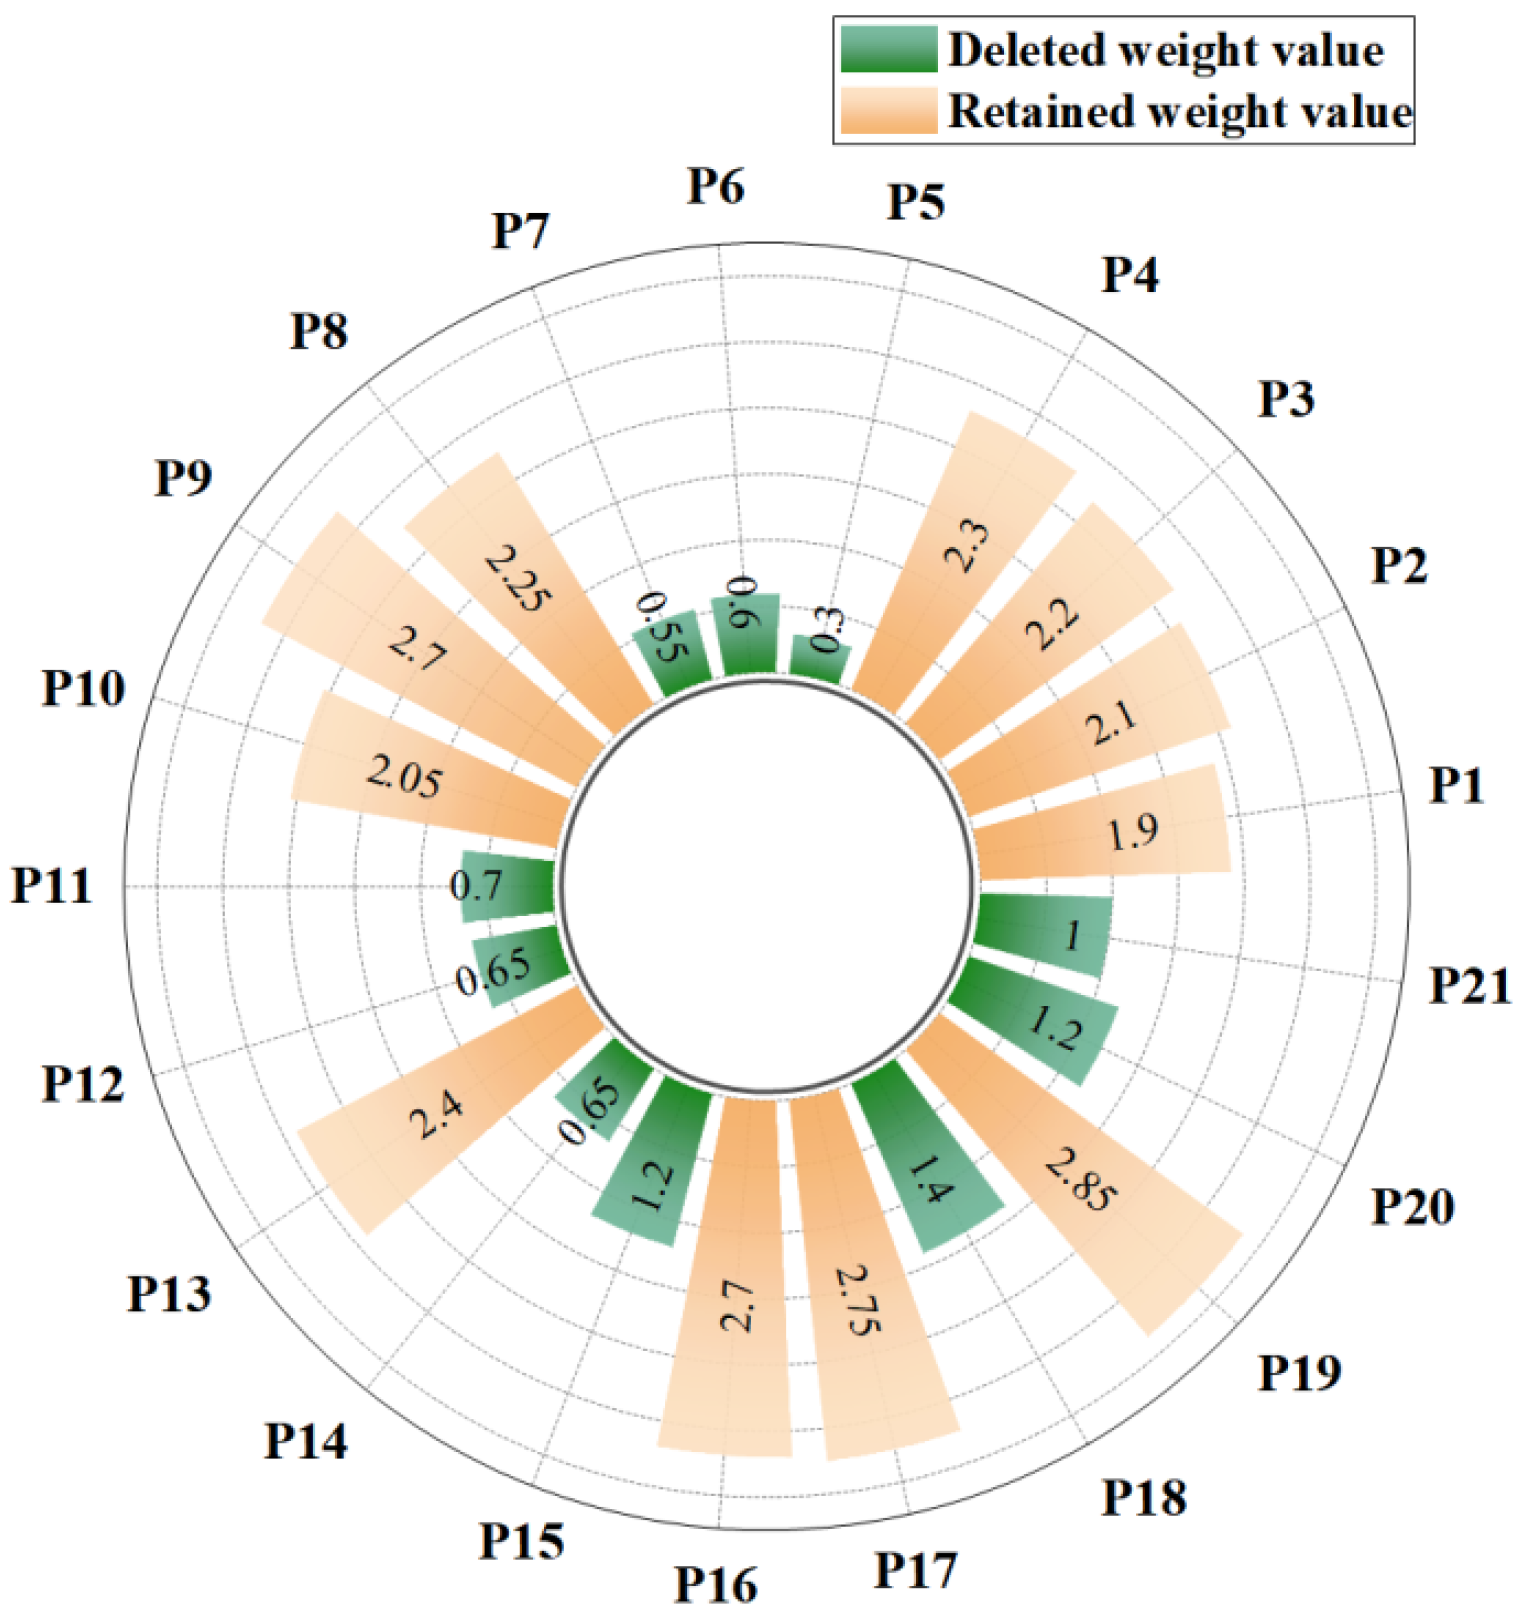
To obtain more discriminative inputs for multi-condition pressure wave identification, multiclass ReliefF was applied to the training set only to rank candidate features. Sensitivity analyses of the two main hyperparameters, k and T, led to the selection of k = 15 and T = 500. The final feature weights are shown in Figure 5, based on which a subset of high-weight features was selected for downstream classification.
Figure 5.
Weight values for all features.
Feature weights quantify the discriminative contribution of each candidate feature to multiclass identification: a larger weight indicates that the feature better separates samples from different classes within local neighborhoods and thus contributes more to the classification decision. As shown in Figure 5, ReliefF assigns importance scores to all candidate features (P1–P21), where the orange sectors denote retained features and the green sectors denote discarded ones. The results indicate that P5–P7, P11, P12, P14, P15, P18, P20, and P21 receive consistently low weights, suggesting limited discriminative power (likely due to redundancy with higher-weight features or insufficient sensitivity to leakage transients under operational disturbances); these features are therefore removed. Consequently, the 11 highest-ranked features (P1–P4, P8–P10, P13, P16, P17, and P19) are retained to form the final feature vector for each signal segment. This compact subset jointly covers key time-domain statistical and frequency-domain spectral characteristics, preserving the principal discriminative information while reducing input dimensionality, thereby providing a robust and interpretable representation for subsequent data augmentation and classifier training.
4.2. Quality Assessment of GAN-Generated Samples
4.2.1. Distributional Similarity and Diversity Analysis
The pressure-wave dataset includes four operating conditions: leakage, valve regulation, pump speed regulation, and emergency valve shut-off. Each class contains 50 samples, yielding 200 samples in total. For each sample, 11 statistical features are extracted, resulting in an original feature matrix . To alleviate the small-sample issue, a generative model is used to synthesize an additional 5N samples during training (N = 200) to augment the training data. To ensure consistent feature scaling, all features are standardized using Z-score normalization before being fed into the generative model/discriminator.
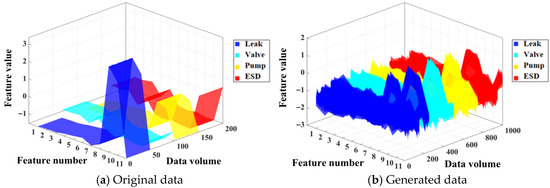
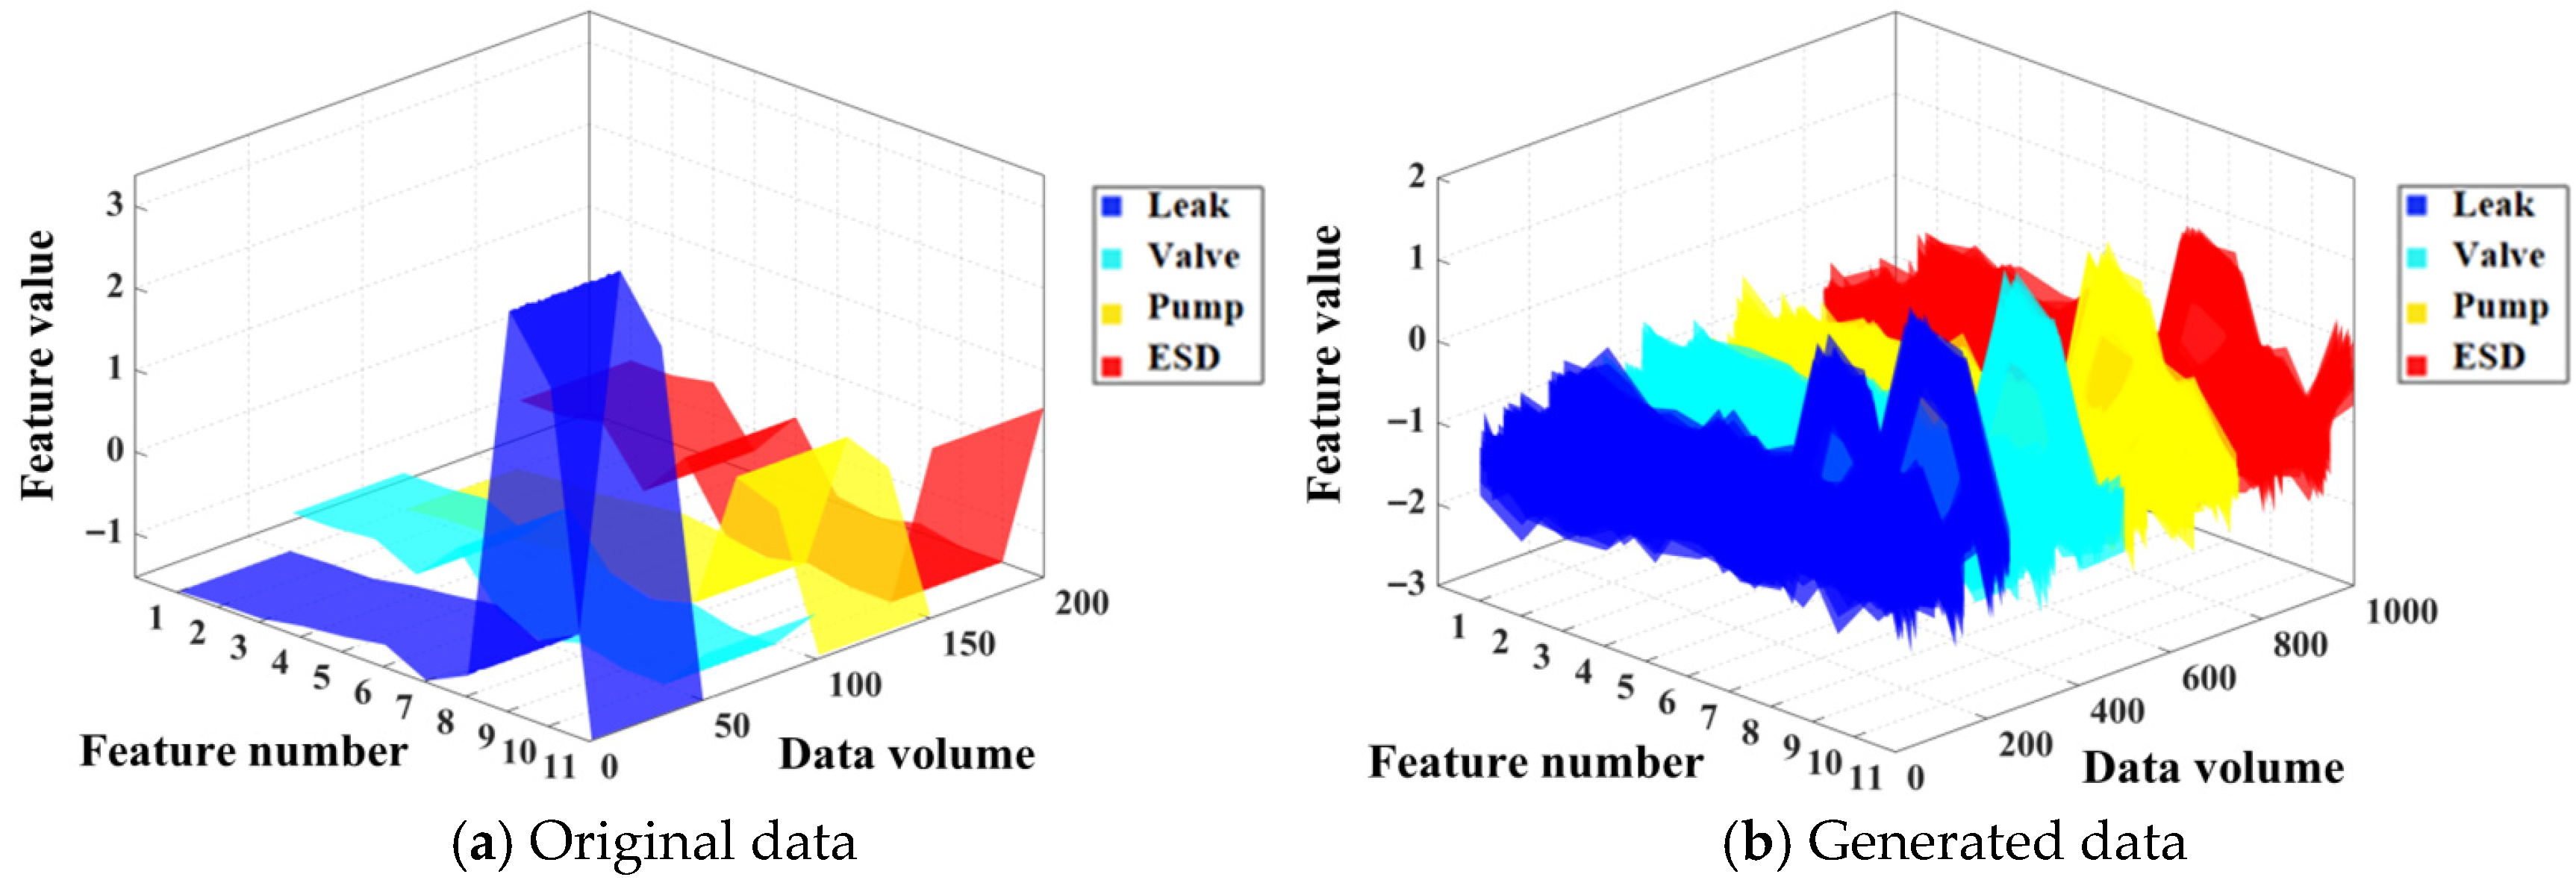
Figure 6 compares the feature-space distributions of the real and GAN-generated samples. Figure 6a shows the standardized distributions of the 200 original samples over the 11 extracted features, whereas Figure 6b displays the corresponding distributions of 1000 synthetic samples generated in the same feature space. For the leakage class, the generated samples exhibit stronger fluctuations in features P9 and P11 (high-frequency-related features), and they also show a wider range of variation in amplitude-related features (e.g., RMS and peak-to-peak value). Since leakage signals typically involve higher amplitude fluctuations and pronounced impulsiveness, these characteristics are amplified in the generated data. Compared with valve regulation and pump speed regulation, leakage samples show more pronounced variations in high-frequency-related features, and the generated data further expands this variation range, which can help the model distinguish leakage more effectively. In addition, the impulsiveness of leakage signals in energy-related features (e.g., margin factor and kurtosis coefficient) is also enhanced, making these features more salient for identifying leakage.
Figure 6.
Three-dimensional distribution of data features.
Overall, the original data occupy a relatively concentrated region in the feature space, whereas the generated data exhibit broader coverage and stronger diversity. By retaining the key characteristics of the original data and increasing the dispersion of leakage samples in extreme feature regions, the augmented set provides more informative examples for learning decision boundaries and improves leakage separability.
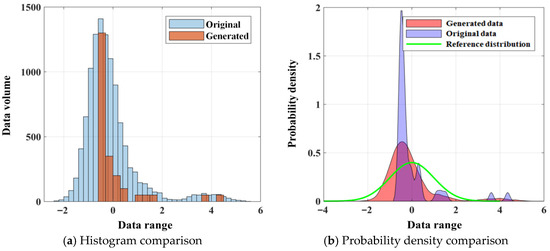
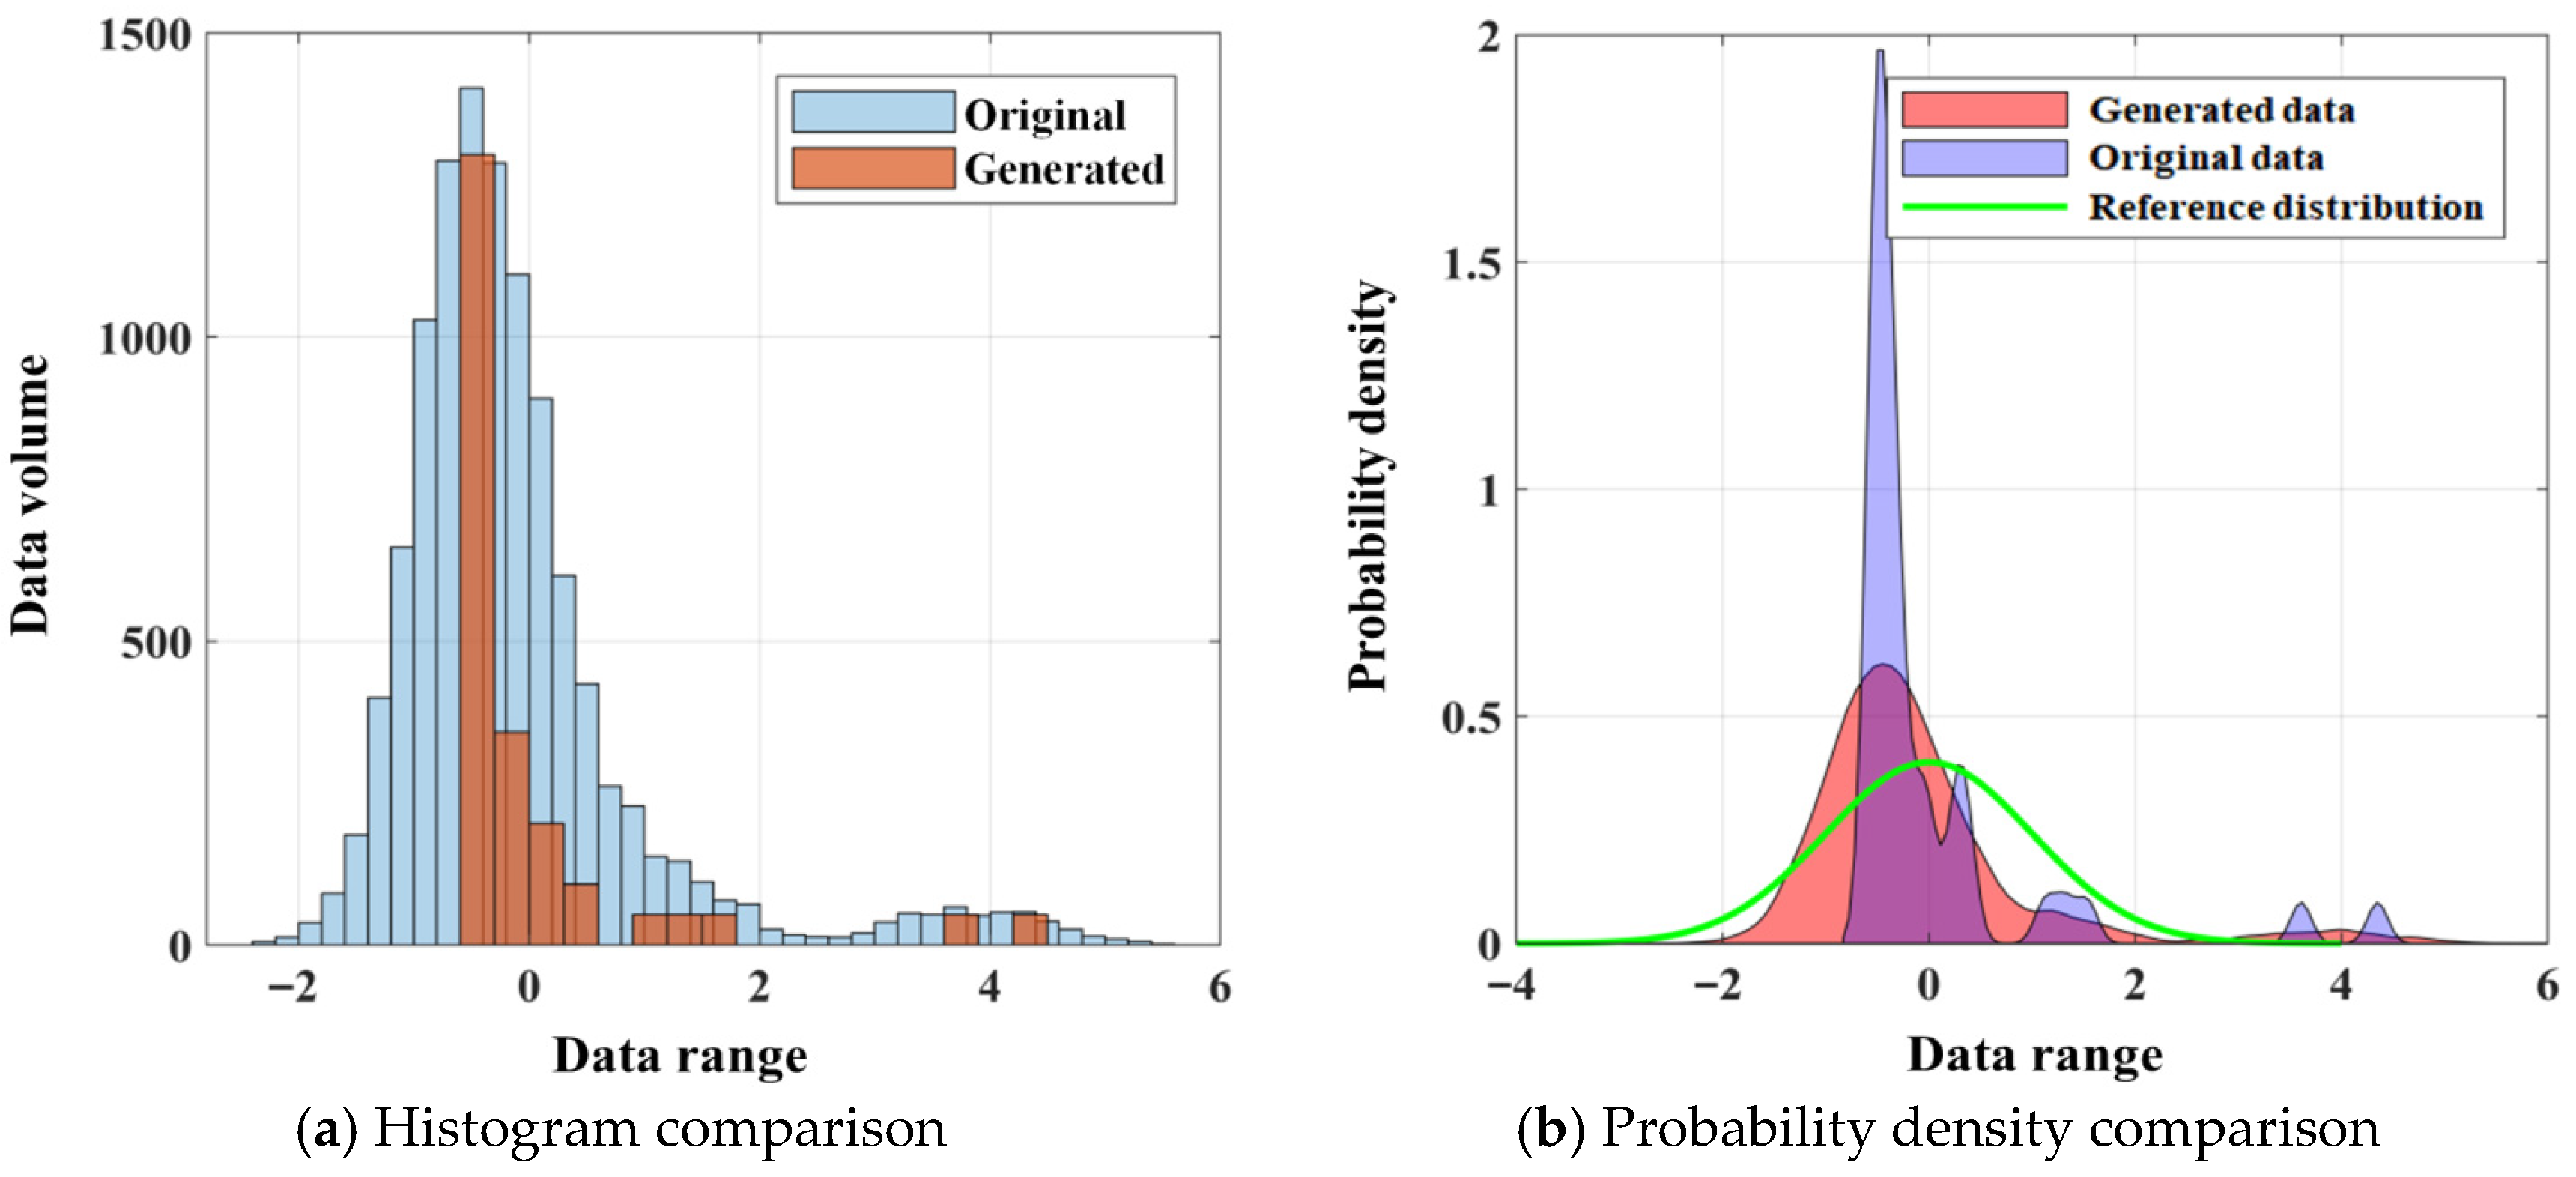
Figure 7 compares the value-range distributions of the GAN-generated data and the original data. As shown in Figure 7a, the generated data follow the original distribution closely within the main interval (e.g., from −2 to 2). Minor discrepancies are observed in the tail regions, where the generated samples provide broader coverage due to the increased sample size, effectively enriching the feature distribution. The probability density comparison in Figure 7b further contrasts the original data, the generated data, and a reference distribution (green curve). The generated data align well with the reference distribution around zero, indicating that the core statistical characteristics of the original data are reproduced effectively. Although deviations remain in the extreme tails, the generated data cover the edge regions more extensively, complementing portions that are sparsely represented in the original dataset. This suggests that the generated data preserve similarity to the original samples while enhancing coverage of extreme cases, which can improve model robustness to rare conditions. In particular, leakage-related descriptors, especially magnitude-related and spectral-related features, typically show larger dispersion and heavier tails than transients caused by routine control actions, which enhances separability in the feature space.
Figure 7.
Distribution comparison of original and generated data.
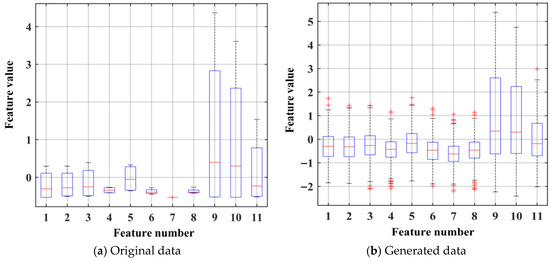
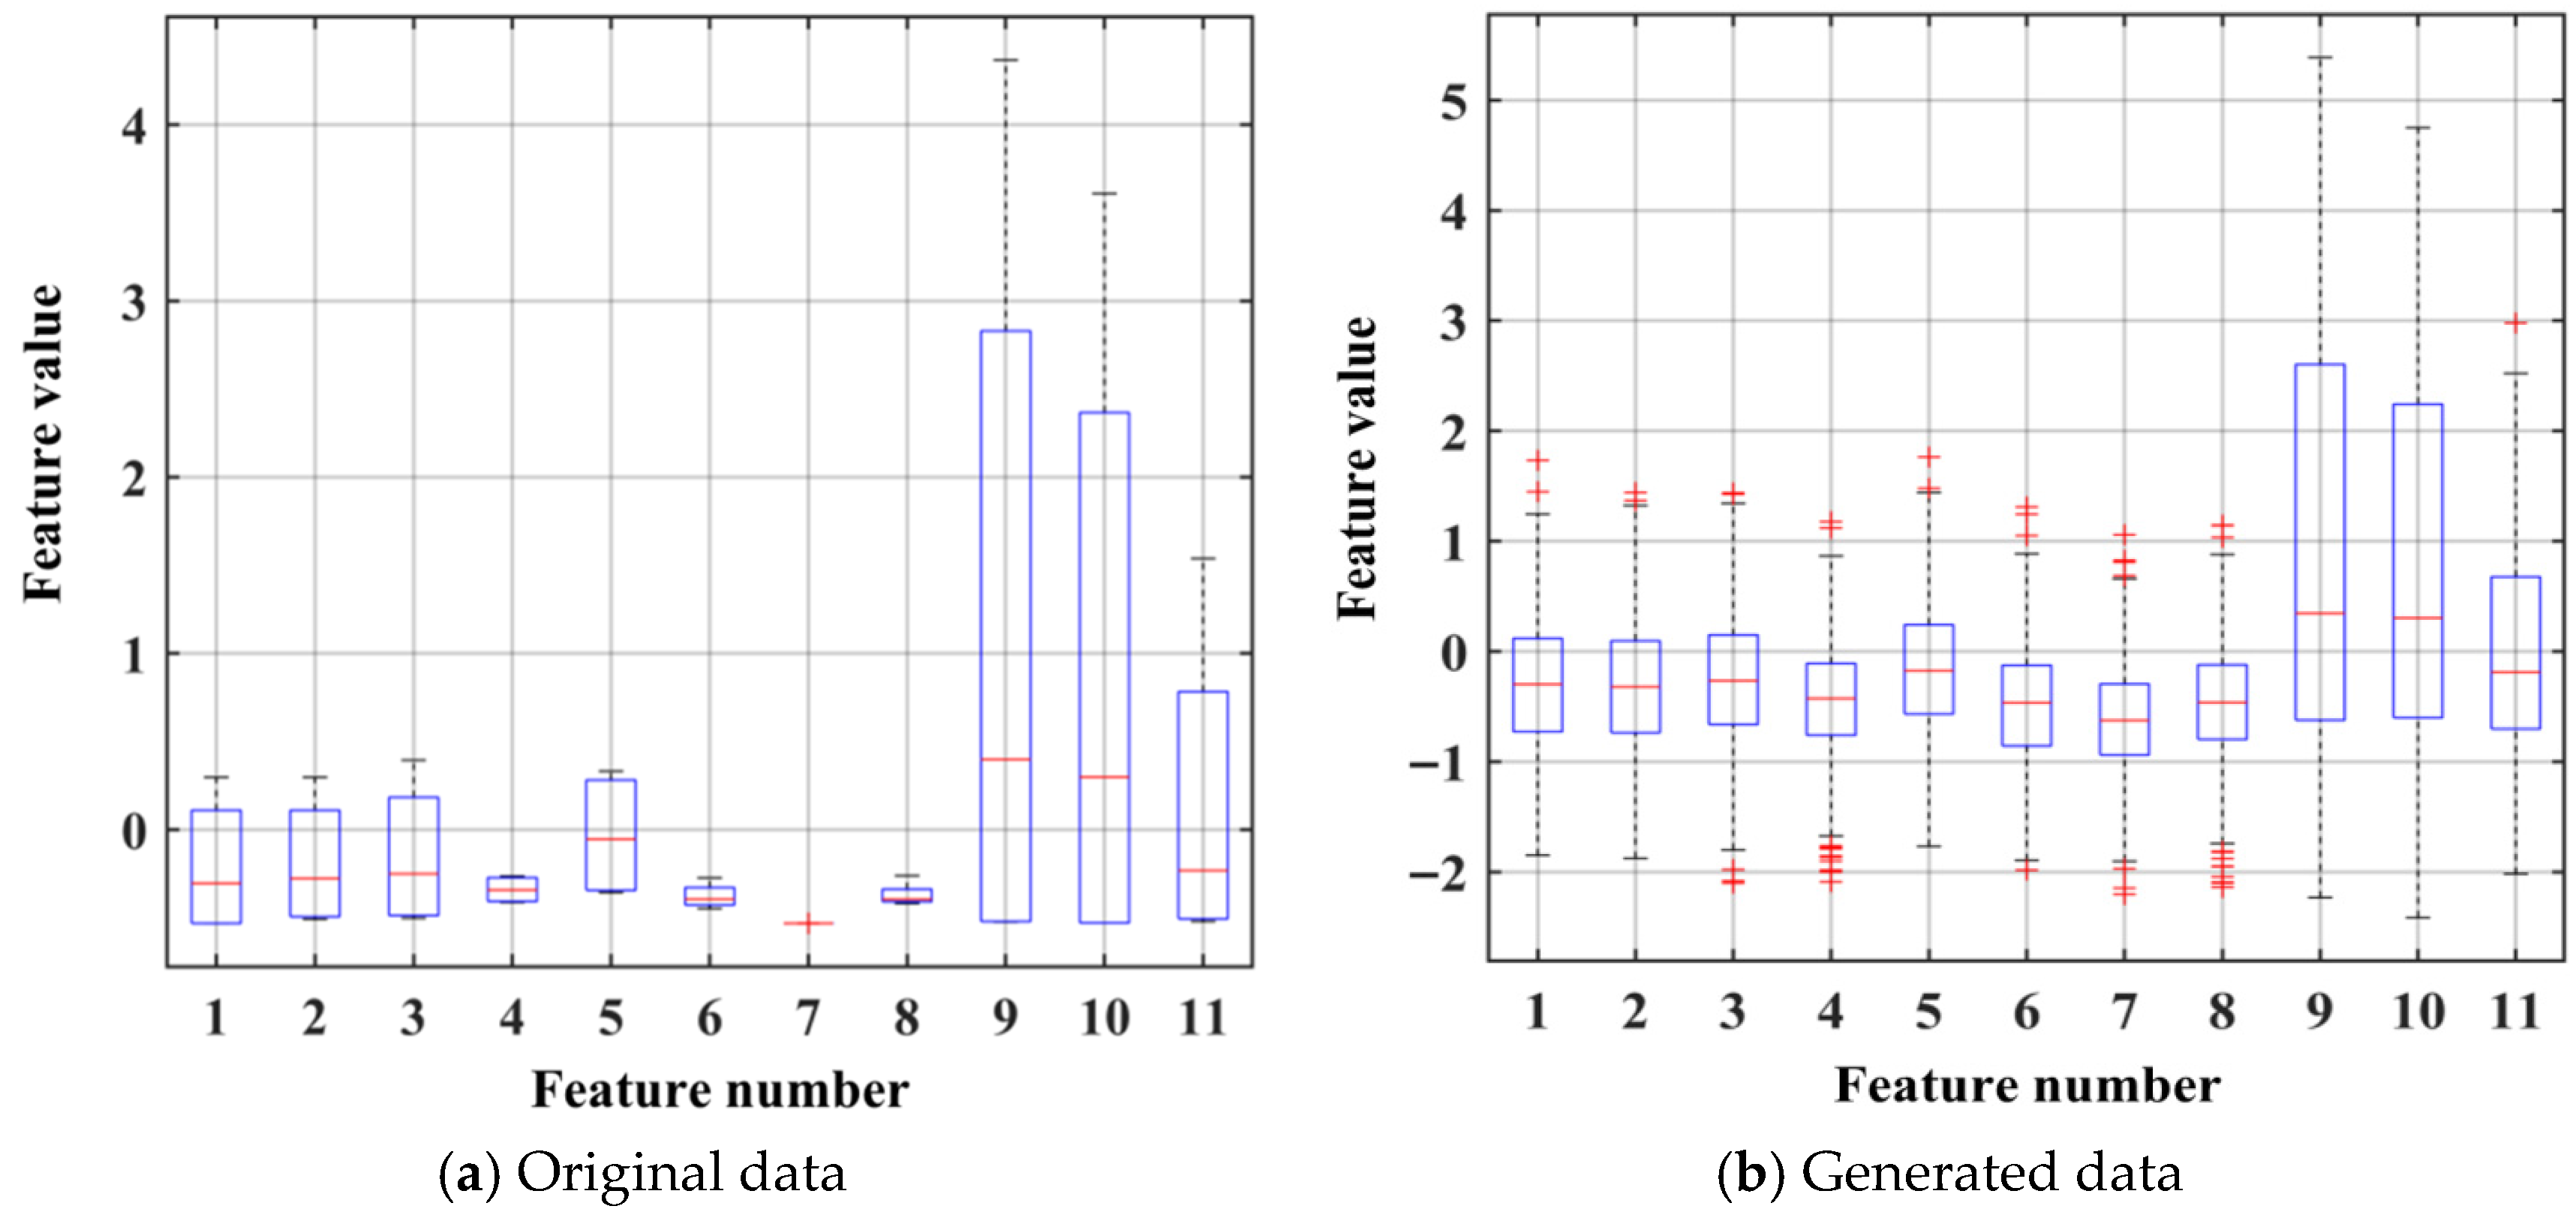
Figure 8 shows the boxplot distributions of the original data and the generated data across the 11 features. Each boxplot displays the interquartile range, maximum and minimum values, and outliers (red plus markers) for a given feature. In Figure 8a, the original data exhibit relatively large fluctuations in some features (e.g., P9 and P10), with feature values spanning roughly from 0 to 4 and including a small number of outliers. Figure 8b presents the distributions of the generated features. Compared with the original data, the generated data not only reproduce the main distribution patterns of the features, but also provide a denser and more complete coverage of the feature space by increasing the sample size. Notably, larger variations are observed in features P8 and P11, indicating that the generated samples capture broader fluctuations in leakage-related characteristics. Overall, the generated data enrich the training set by expanding the feature distribution support, which helps improve the model’s generalization to extreme cases. Leakage signals tend to exhibit wider ranges in the boxplots, particularly for peak-to-peak value, margin factor, and root mean square, showing more prominent dispersion and occasional extreme values, whereas valve-regulation and pump-speed-regulation signals are generally more stable with smaller variability.
Figure 8.
Boxplots of original and generated data.
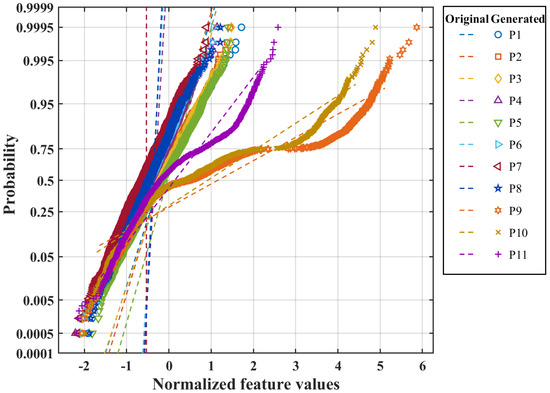
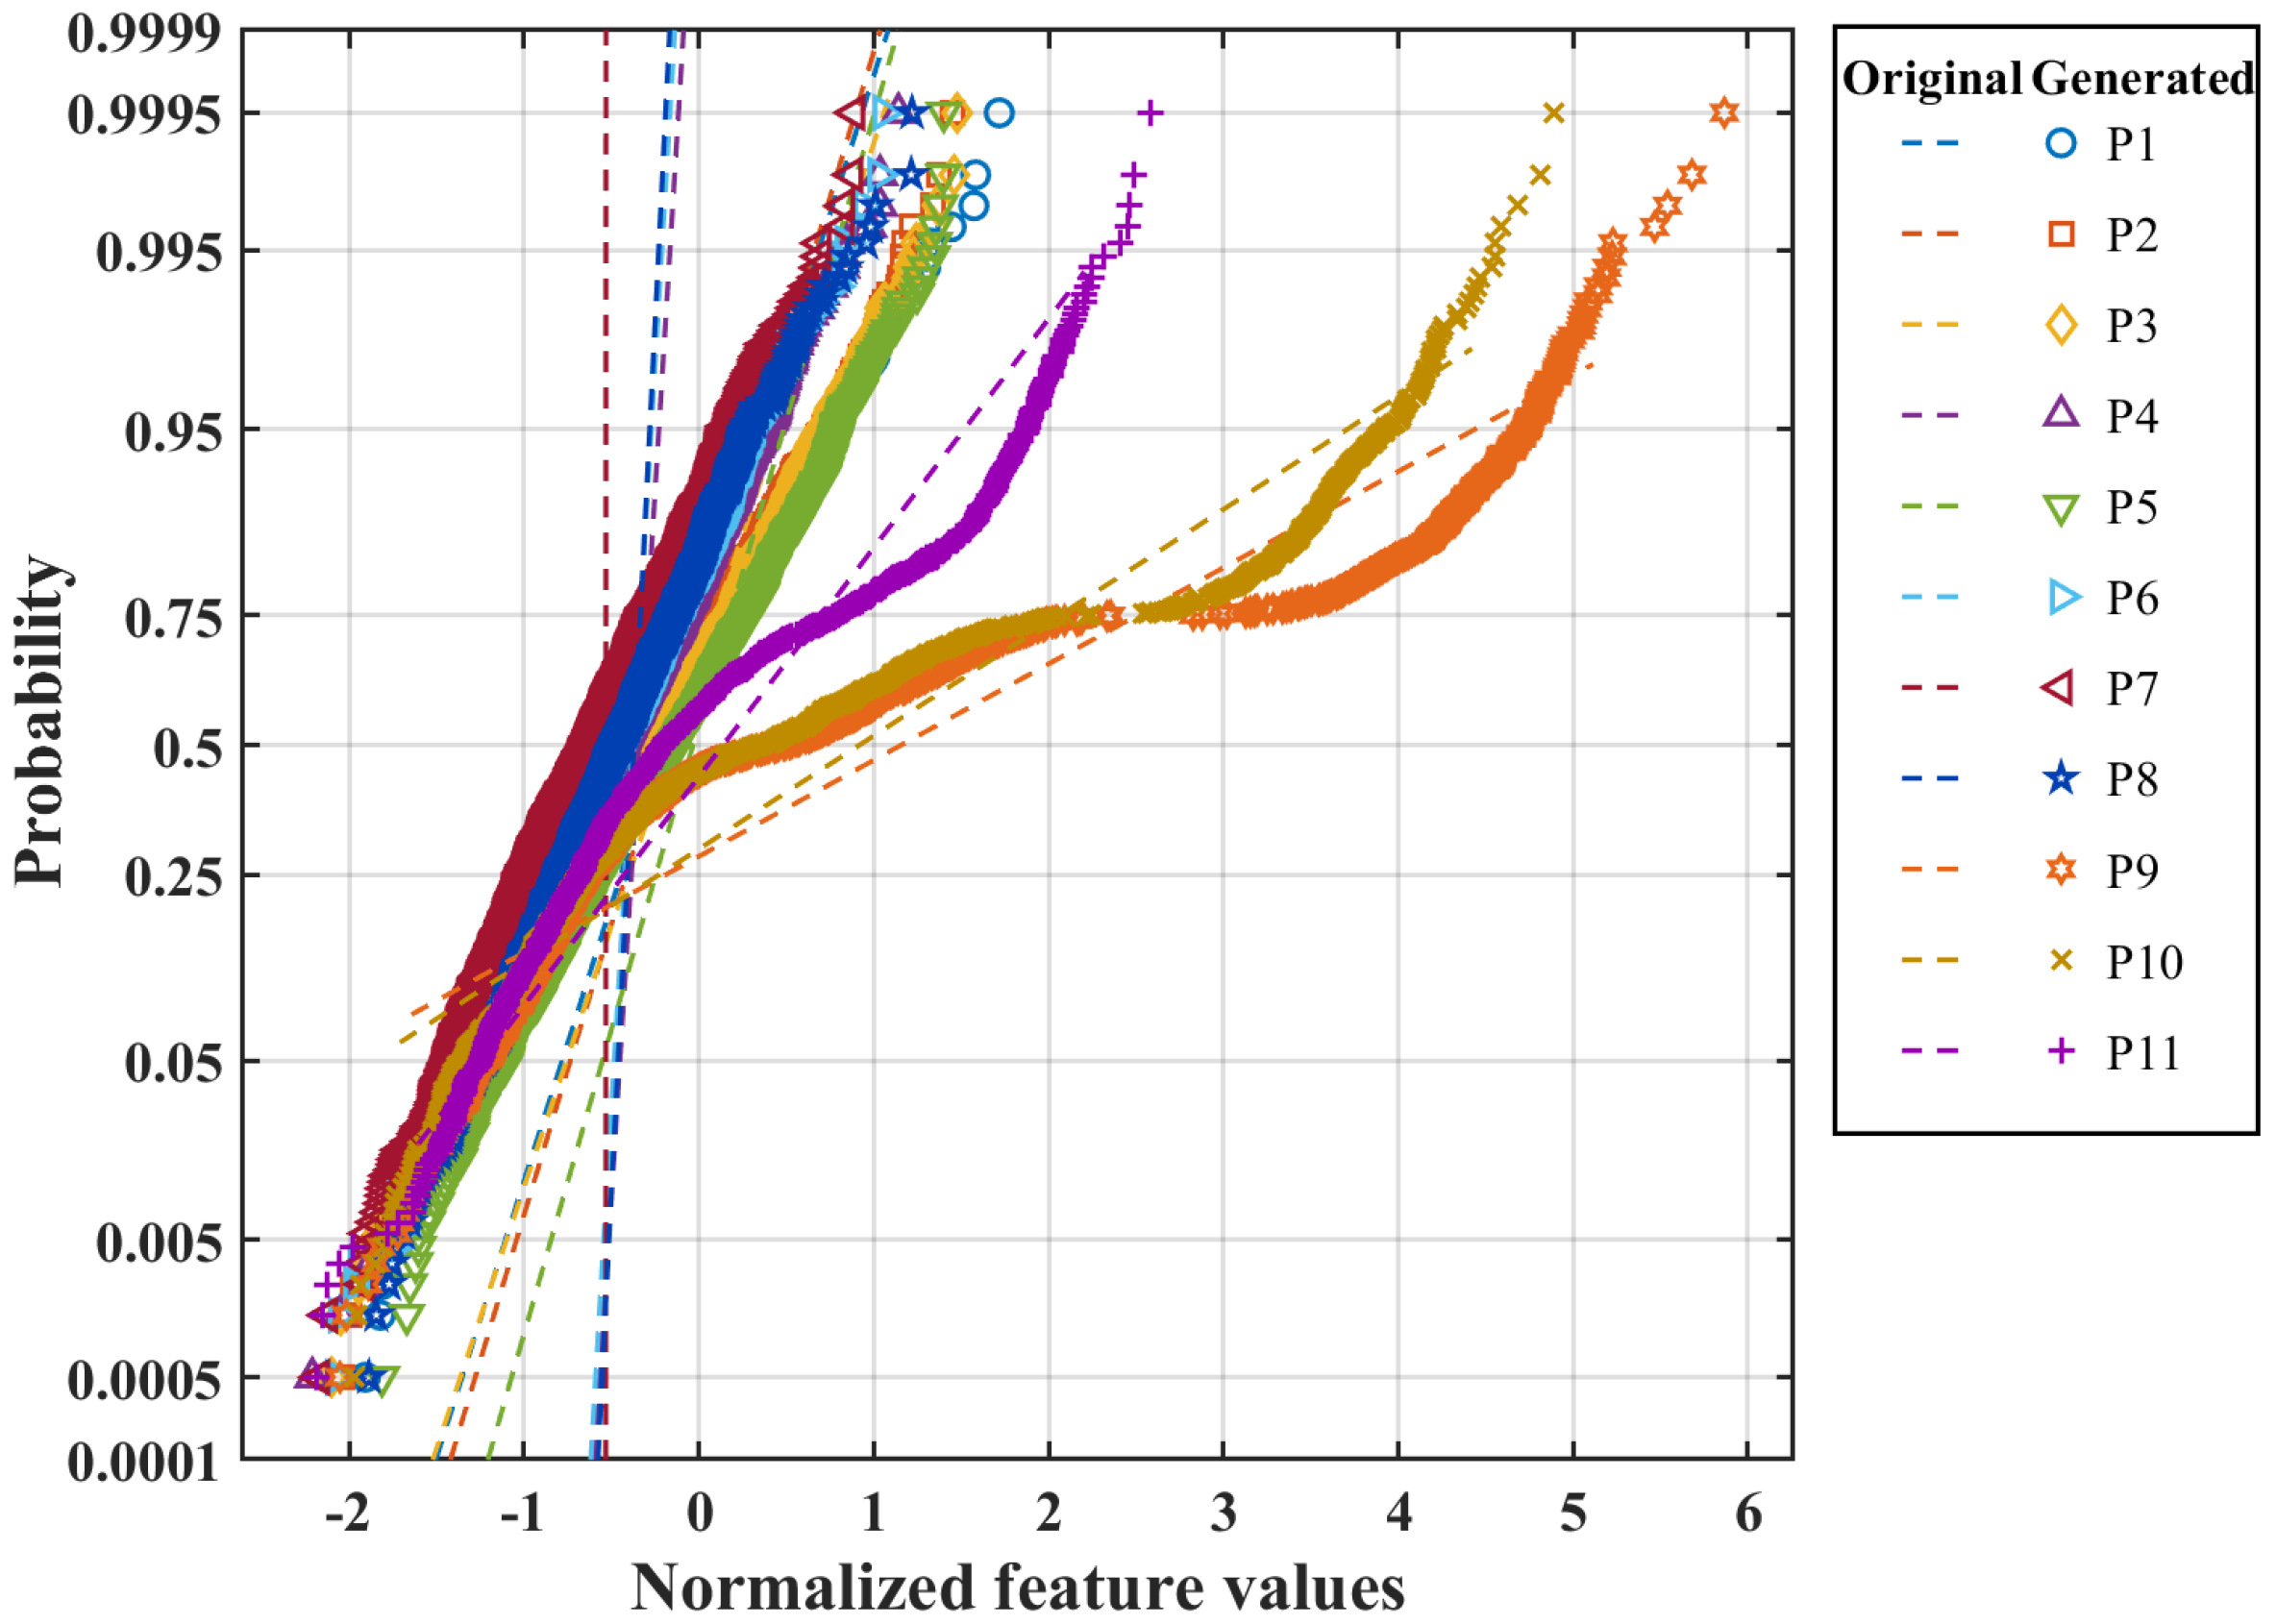
Figure 9 presents probability–probability (P–P) plots that compare the probability14 distributions of the generated data and the original data across different features. The plots are constructed using normalized feature values; the horizontal axis represents the cumulative probability (from 0 to 1), and the vertical axis represents the corresponding quantiles. Eleven curves are shown, each corresponding to one of the 11 features. When a curve lies close to the diagonal line, it indicates that the generated and original data follow similar statistical distributions for that feature.
Figure 9.
Probability–probability (P–P) plots of generated and original data.
Overall, most features exhibit good agreement in the central region (e.g., from approximately −1 to 1), suggesting that the generated data closely match the original data in the main body of the distribution. However, in the extreme regions, noticeable deviations appear for some features, indicating differences in tail behavior and that the generated data may not fully replicate the boundary characteristics of the original data. In particular, leakage-related features show high similarity between the generated and original distributions within the core region, implying that the generated samples preserve the main characteristics of leakage signals. Nevertheless, for leakage-related frequency features, discrepancies in the extreme tails may still exist compared with valve-regulation or pump-speed-regulation signals, especially in the tail segments of the distributions.
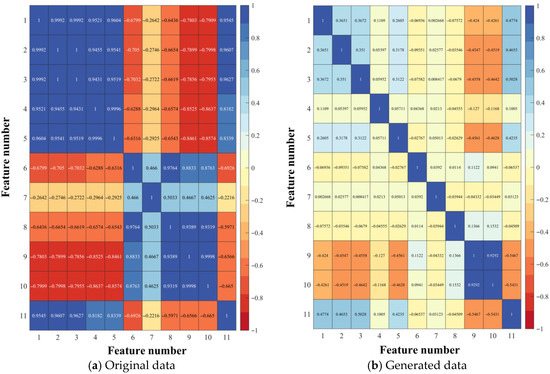
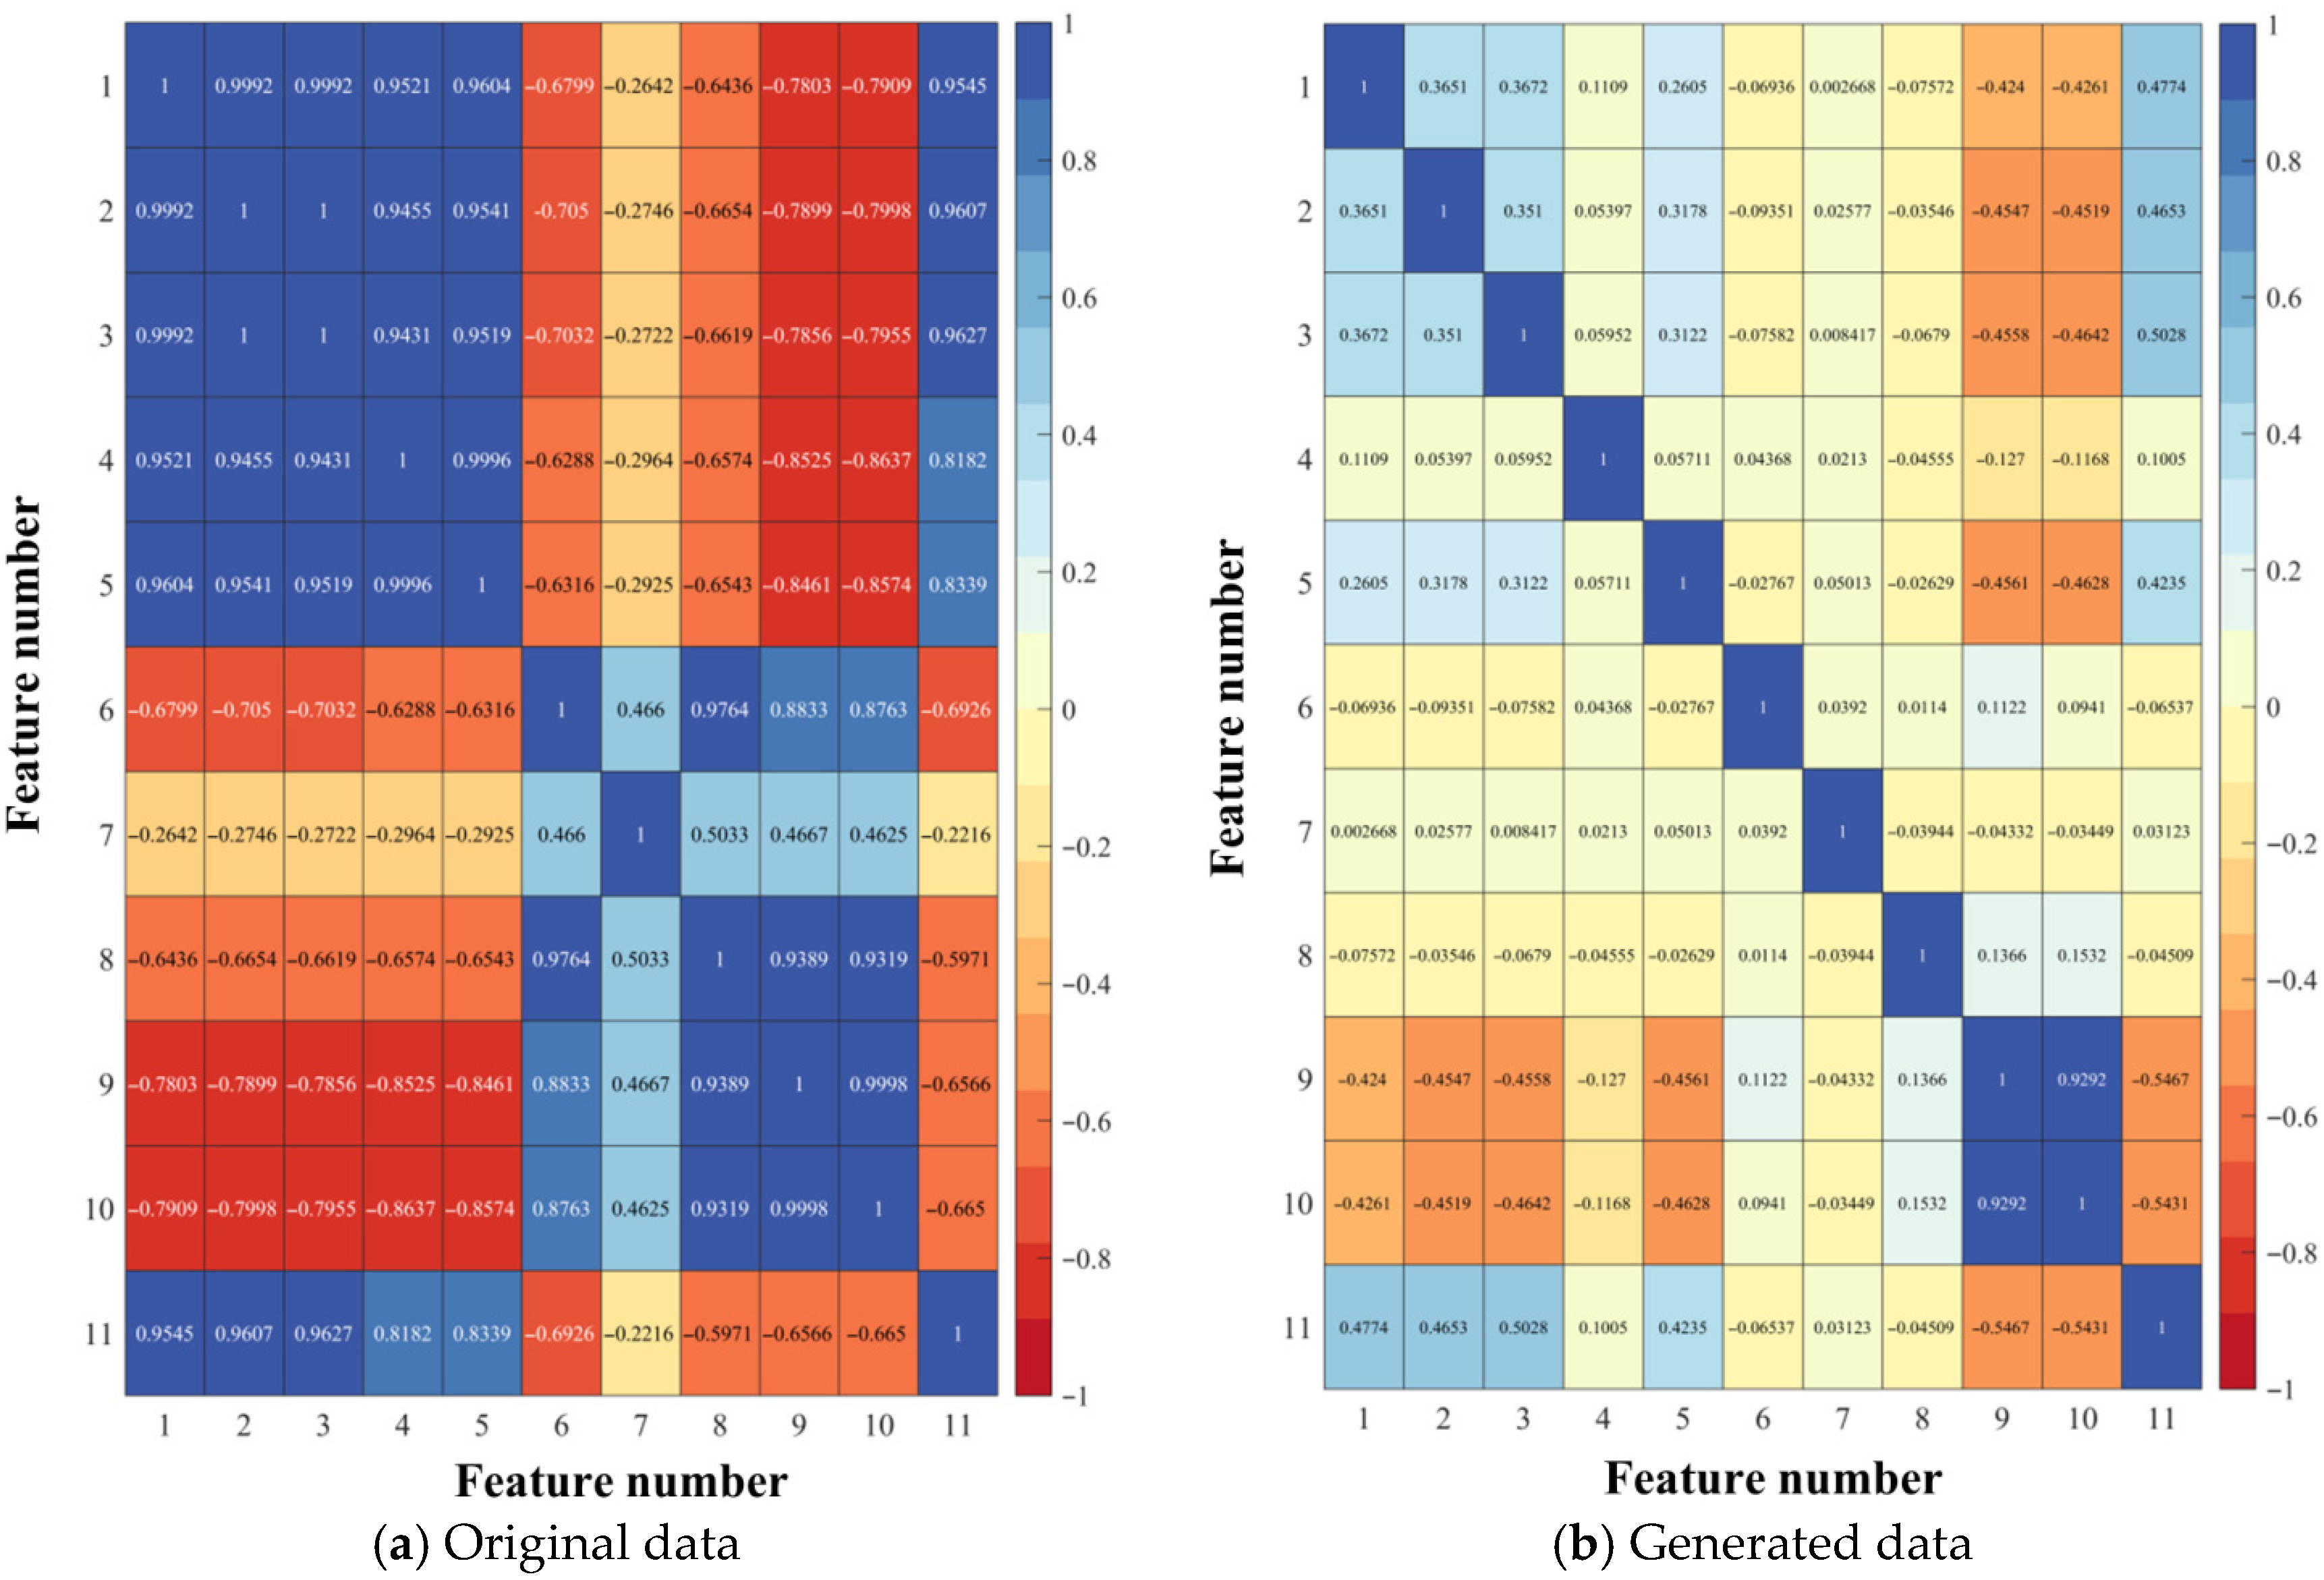
Figure 10 shows the feature correlation matrices of the original data and the generated data, which are used to analyze correlations among the 11 extracted features. The correlation coefficient ranges from −1 (perfect negative correlation) to 1 (perfect positive correlation). In the heatmaps, darker colors indicate stronger correlations; red denotes positive correlation, blue denotes negative correlation, and lighter colors indicate weak or no correlation. In Figure 10a, the original data exhibit a strong positive correlation (close to 1) between Feature 9 (spectral centroid) and Feature 10 (mean square frequency), because both features describe the frequency distribution of the signal and characterize the tendency of spectral energy concentration in the frequency domain. Features 6 (kurtosis coefficient) and 7 (skewness coefficient) show a pronounced negative correlation (approximately −0.7 to −0.9) with amplitude-related features such as Feature 3 (root mean square) and Feature 5 (square root amplitude), indicating that as impulsiveness (kurtosis coefficient) increases, the overall signal energy (root mean square) and amplitude-related measures tend to decrease. This may reflect an inherent trade-off between concentrated impulsive fluctuations and the overall energy level. In Figure 10b, the generated data largely preserve a correlation structure similar to that of the original data, especially the relationships between frequency-related features and energy-related features. However, the correlations among some feature pairs become weaker. In particular, the negative correlation between Feature 1 (mean) and frequency-related features is reduced, suggesting that the coupling between leakage-related impulsiveness and spectral characteristics may be less pronounced in the generated samples. Moreover, for leakage signals, the generated data tend to show stronger fluctuations in amplitude-related or energy-related features, making indicators such as kurtosis coefficient, skewness coefficient, and margin factor more salient. In contrast, valve-regulation and pump-speed-regulation signals exhibit noticeably different and weaker inter-feature correlations, reflecting their distinct transient behaviors from leakage signals.
Figure 10.
Feature correlation matrices of original and generated data.
Although the above analyses confirm the distributional plausibility of the GAN-generated feature vectors under the adopted fivefold augmentation setting, the final identification performance may still depend on the choice of classifier, augmentation ratio, and feature-input scheme. Therefore, these factors are further examined in Section 4.3 through a series of comparative experiments.
4.2.2. Comparison with Simpler Augmentation Strategies
To further clarify whether the observed gain originates mainly from learned generation rather than from nominal sample enlargement alone, two simpler augmentation baselines were additionally introduced in the ReliefF-selected feature space, namely Gaussian perturbation and SMOTE. Gaussian/noise perturbation is widely recognized as a lightweight augmentation strategy in time-series learning [48], whereas SMOTE remains a classical and widely accepted oversampling method [49], with recent applications also reported in pipeline-related defect classification tasks [50]. Under the same 5× training-only augmentation setting and the same RF classifier, both simpler baselines improve performance relative to the non-augmented baseline, indicating that sample enrichment is beneficial to some extent. However, the proposed class-wise GAN augmentation achieves the best overall performance across Accuracy, Macro-F1, Leak-F1, and Leak-Rec. This result strongly suggests that the gain is not merely due to enlarged training size, but also to the higher quality and class-aware structure of the generated feature vectors.
As summarized in Table 3, both Gaussian perturbation and SMOTE improve the results relative to the non-augmented baseline, whereas the proposed GAN-based augmentation achieves the strongest overall improvement. This comparison provides more direct evidence that the observed gain is not solely caused by enlarged sample size.
Table 3.
Comparison of different augmentation strategies in the ReliefF-selected feature space.
4.3. Classification Performance and Comparison Studies
After verifying the quality of the GAN-generated feature vectors, further experiments were carried out to evaluate the final multi-condition identification performance. In this section, three aspects are compared systematically: the effectiveness of different classifiers, the influence of augmentation ratio, and the impact of different feature-input schemes. The objective is not only to identify the most suitable model configuration for the present dataset, but also to clarify the respective roles of classifier design, synthetic sample size, and feature selection in the proposed framework.
4.3.1. Benchmarking of Candidate Classifiers
To determine a suitable classifier for the subsequent comparison studies, four representative supervised learning models were benchmarked, including RF, SVM-RBF, LR, and kNN. These models were selected because they represent distinct learning mechanisms, namely ensemble-based tree learning, kernel-based classification, linear regularized modeling, and distance-based classification. For consistency, all classifiers were trained and tested under the same data partition and evaluation protocol, using the ReliefF-selected feature subset as input.
Table 4 lists the optimized hyperparameter settings of the candidate classifiers used in this study. These settings were determined under the same experimental protocol to ensure a fair comparison among different learning models.
Table 4.
Optimized hyperparameter settings of the candidate classifiers.
Table 5 reports the comparative performance of four representative classifiers (SVM-RBF, LR, RF, and kNN) evaluated on real test samples under an outer 5-fold cross-validation protocol. To quantify both overall discrimination and leakage-oriented detection capability, we report Accuracy, Macro-F1, and leakage-specific metrics including Leak-F1, Leak-Prec, Leak-Rec, and Leak-Spec. Results are summarized as mean ± standard deviation across the outer folds, ensuring that the reported statistics reflect both average performance and cross-split robustness. Overall, the augmented setting consistently improves the leakage-related metrics—particularly recall and F1—indicating that the generated feature vectors can enrich the training distribution and enhance generalization to noisy real-world measurements.
Table 5.
Classification performance of four classifiers with original-data training and GAN-generated data augmentation (training only).
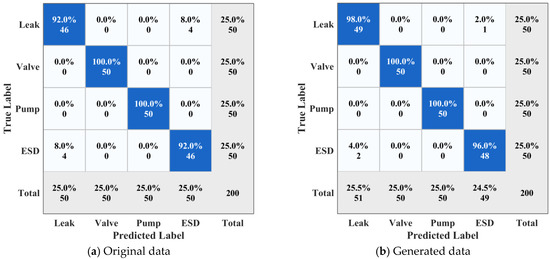
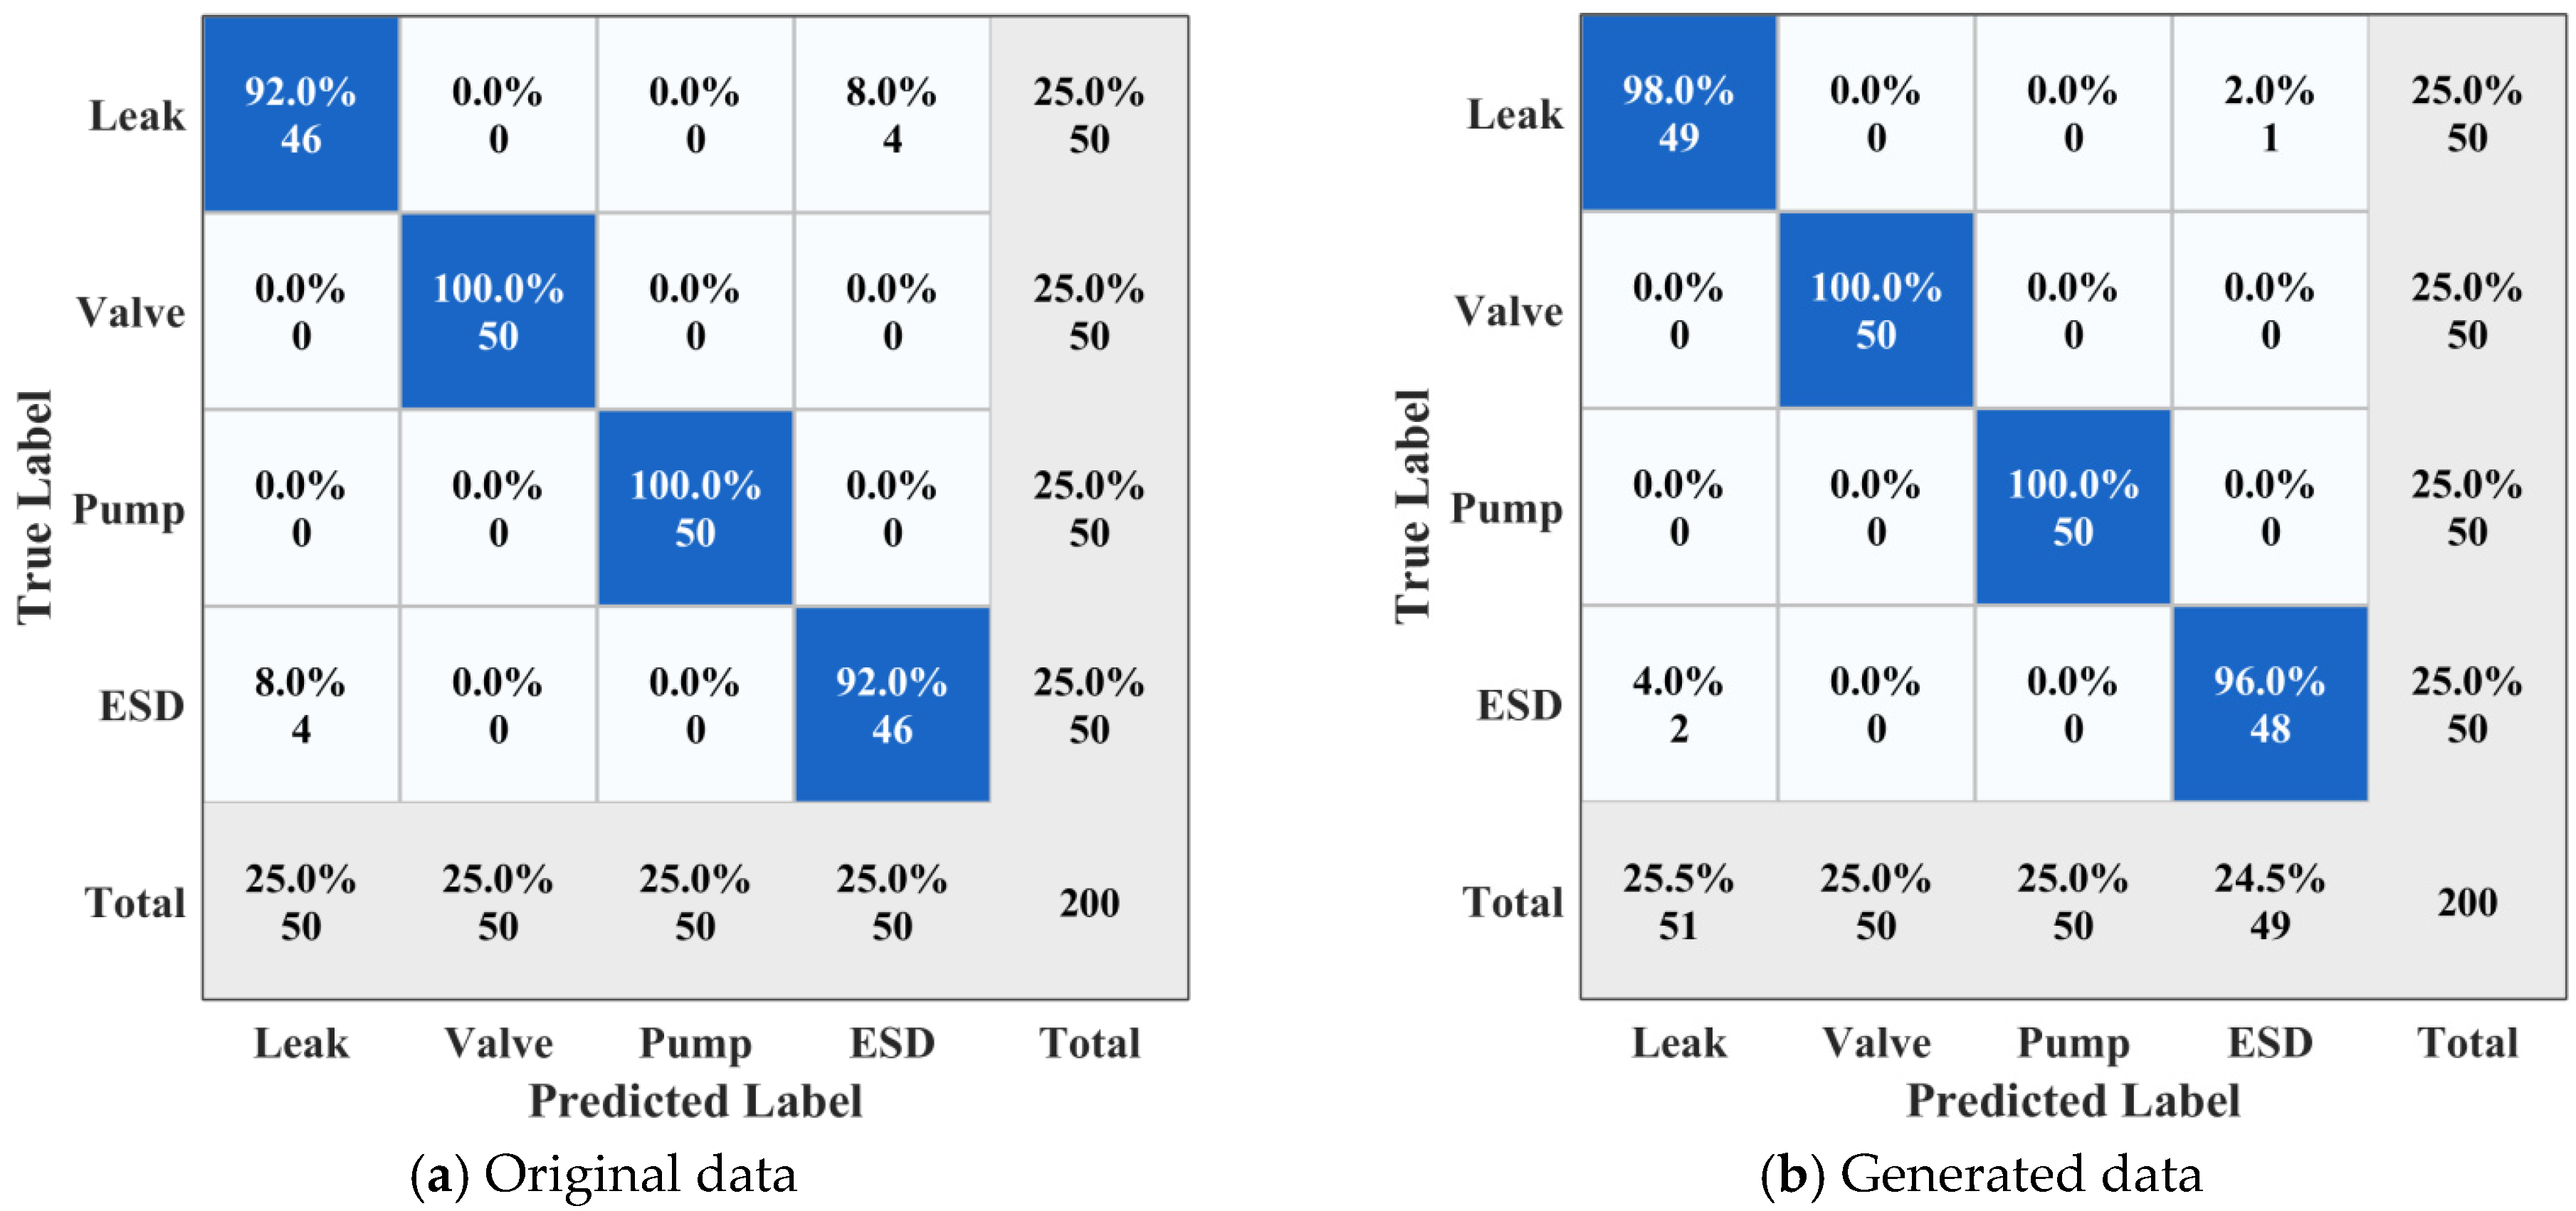
Figure 11 compares the class-wise prediction patterns of the RF classifier via confusion matrices aggregated on real test samples. When trained on original data only (Figure 11a), leakage events are occasionally confused with operational transients, reflecting the similarity between leakage-induced pressure-wave signatures and routine disturbances. After augmenting the training set with GAN-generated synthetic feature vectors (Figure 11b), the confusion matrix exhibits stronger diagonal dominance and fewer leakage-related misclassifications, indicating improved separability and robustness under noisy measurements.
Figure 11.
Confusion-matrix analysis of the RF classifier under original-data training and GAN-generated data augmentation (training only).
4.3.2. Sensitivity Analysis of Augmentation Ratio
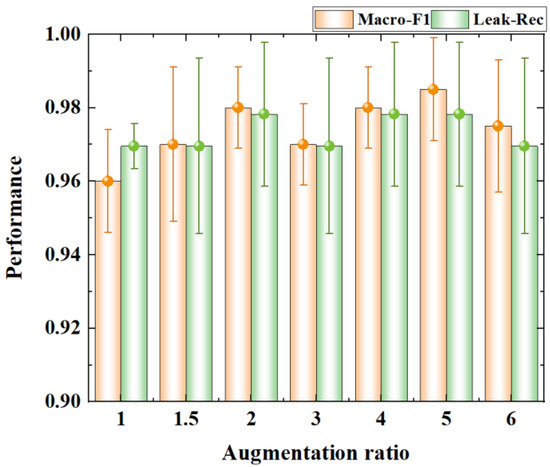
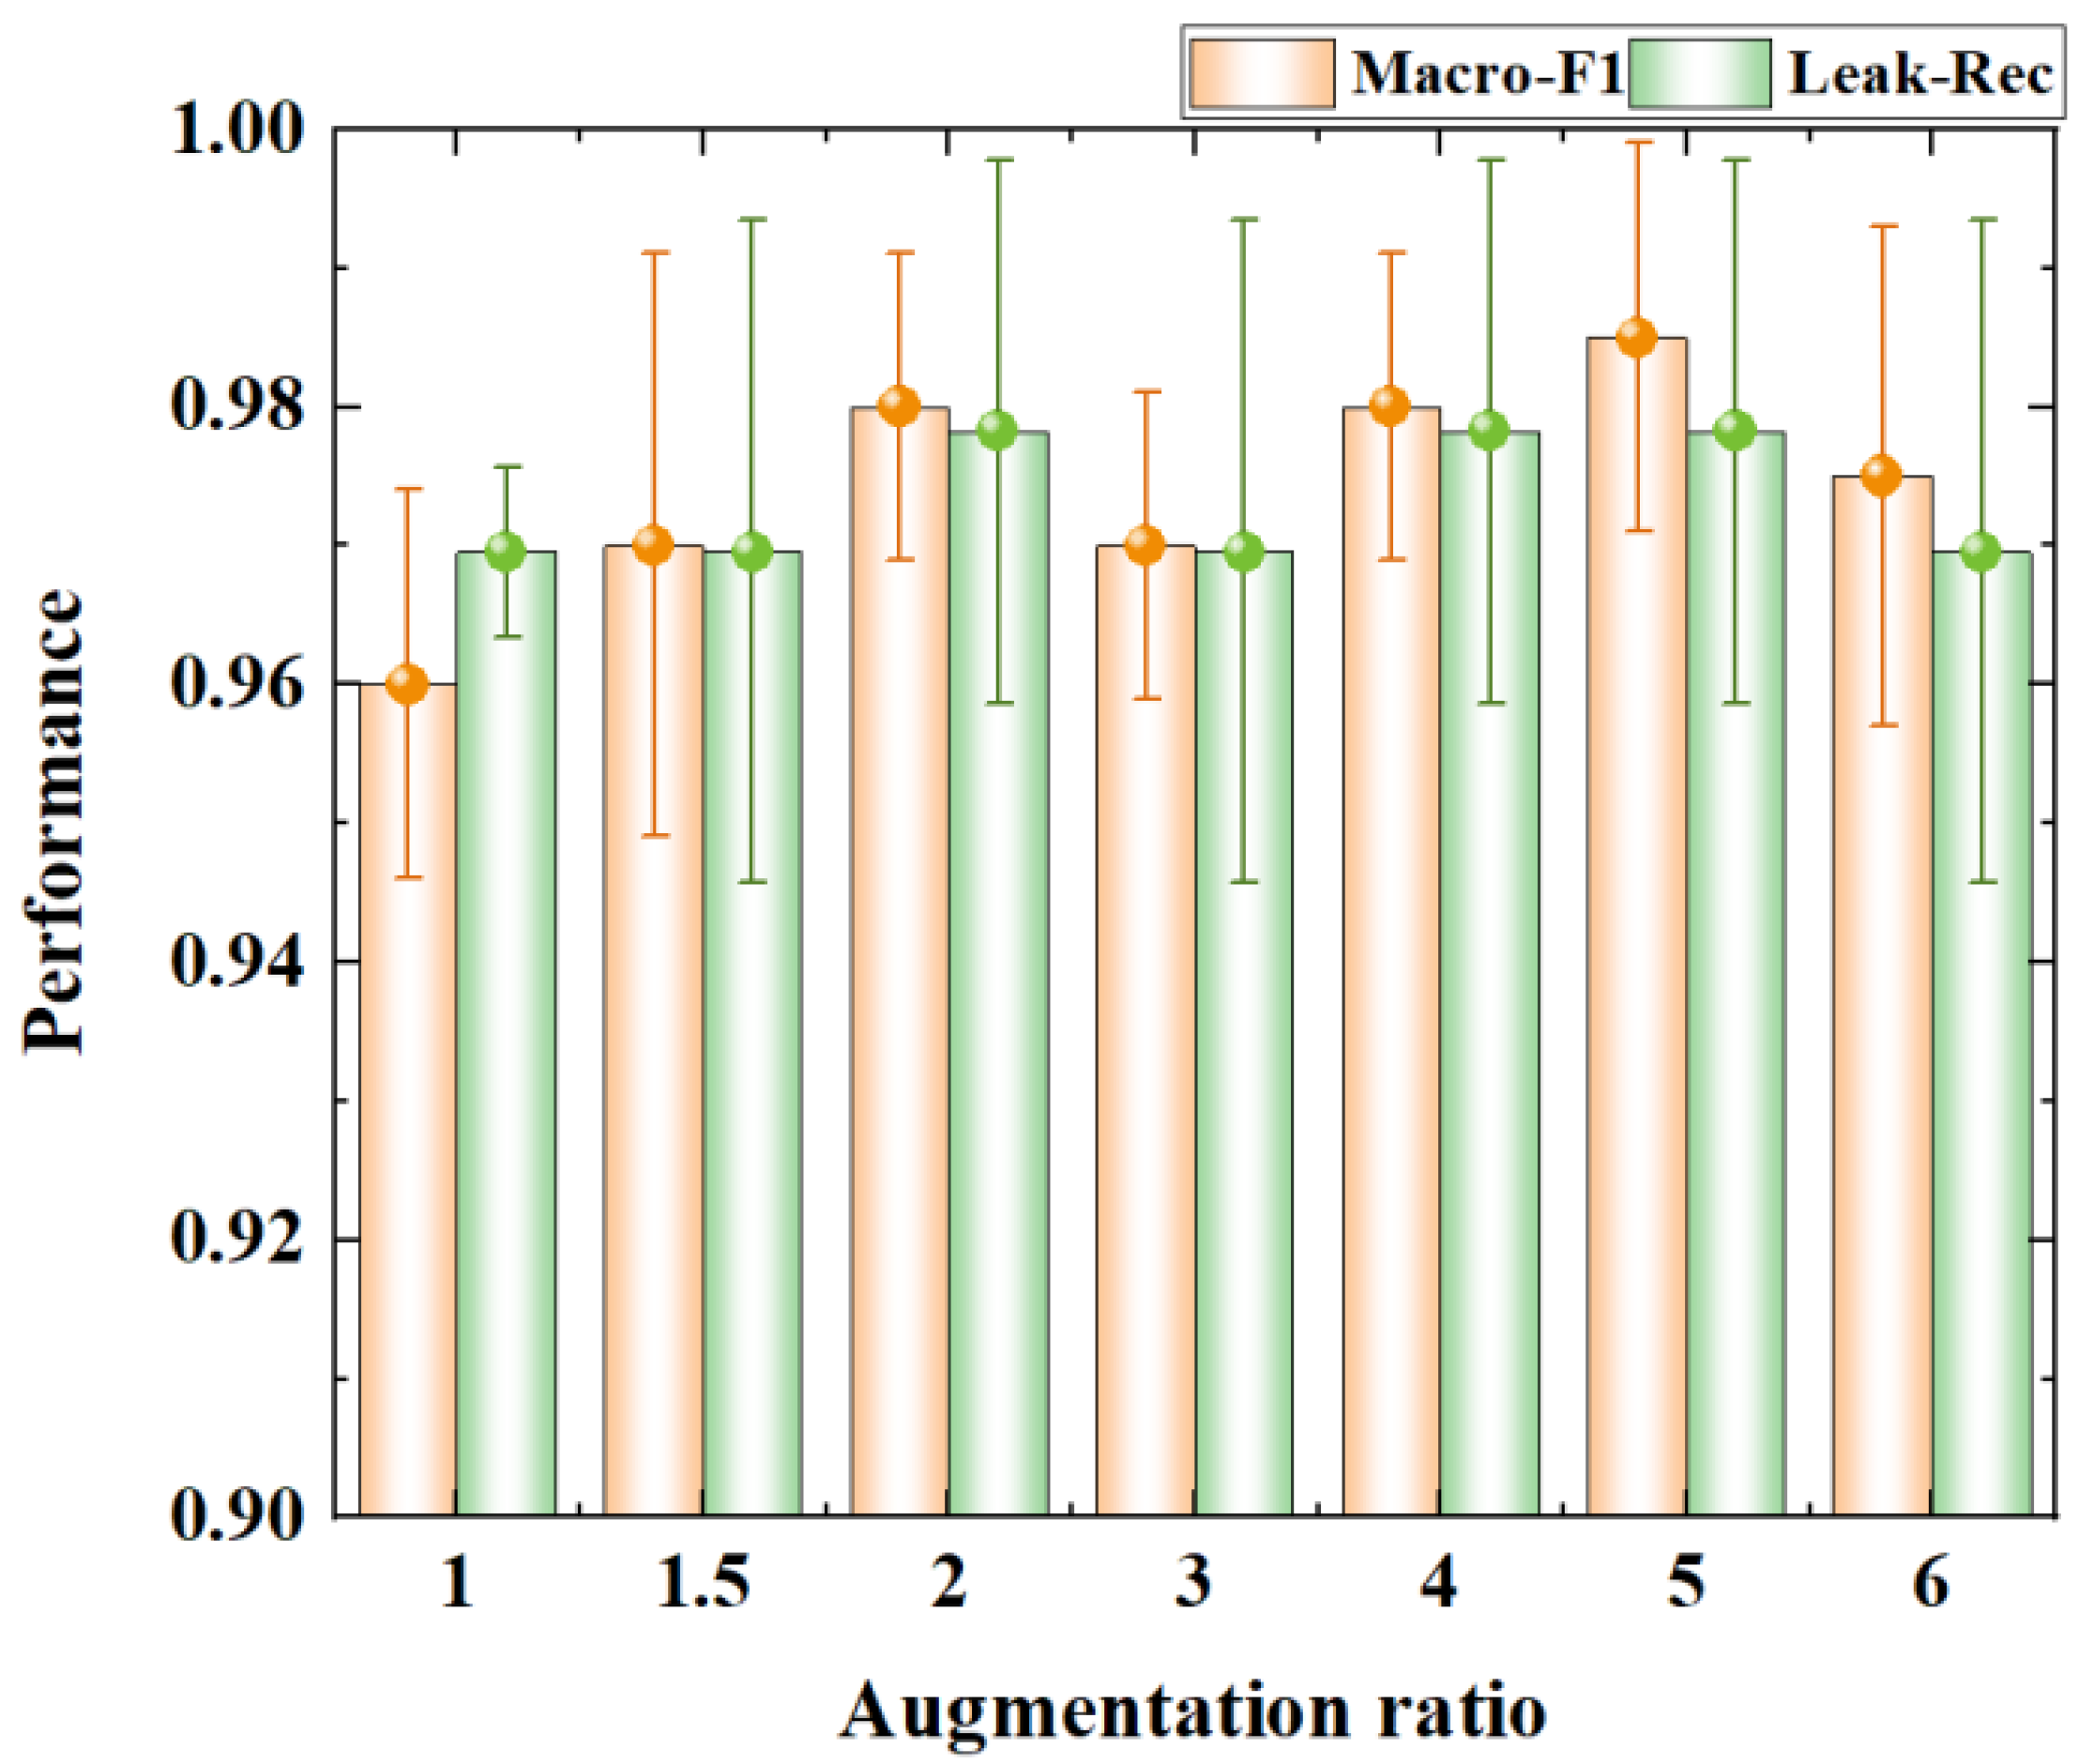
After selecting the representative classifier, we further conducted a sensitivity analysis with respect to the augmentation level. Although a fivefold expansion was used in Section 4.2 to assess the quality of the generated samples, this ratio is not necessarily optimal for downstream classification. We therefore varied the augmentation ratio r (i.e., the target number of training samples per class after augmentation relative to the original training size) and evaluated performance on real test samples under outer 5-fold cross-validation. This analysis clarifies how the amount of GAN-generated synthetic feature vectors affects generalization, thereby separating mere distributional plausibility of generated data from their practical utility in improving leakage identification.
Figure 12 indicates that the augmentation ratio r exerts a non-monotonic influence on generalization performance. As r increases from 1 to moderate levels, both Macro-F1 and Leak-Rec generally improve, suggesting that GAN-generated feature vectors can enrich the training distribution and strengthen leakage-related separability under noisy measurements. When r becomes overly large, the gains saturate and may slightly degrade, implying that excessive synthetic data can introduce distributional bias and reduce the effective contribution of real samples. These results highlight the necessity of selecting a suitable augmentation level rather than assuming that more synthetic data always yields better generalization.
Figure 12.
Sensitivity of classification performance to the augmentation ratio of GAN-generated synthetic feature vectors.
4.3.3. Validation of the Feature-Selection Strategy
To further verify the rationality of adopting ReliefF in the proposed framework, additional comparisons were conducted among different feature-input schemes. Besides the ReliefF-selected compact subset, the classifier was also evaluated using the full feature set and other representative feature-selection strategies. Table 6 compares the proposed ReliefF-based feature-selection strategy with two representative alternatives, namely LASSO and mRMR, in terms of both the selected feature subsets and the resulting classification performance. All methods are evaluated under the same outer 5-fold cross-validation protocol on real test samples, and metrics are summarized as mean ± standard deviation. Besides overall accuracy and Macro-F1, leakage-oriented metrics (Leak-F1, Leak-Prec, Leak-Rec, and Leak-Spec) are reported to explicitly quantify the capability of detecting leakage events while suppressing false alarms. As shown in Table 6, the ReliefF-selected subset achieves the best overall performance and consistently higher leakage-related scores, indicating that the selected features are more discriminative for separating leakage-induced pressure-wave signatures from operational disturbances. ReliefF was preferred because it is classifier-independent, naturally applicable to multi-class problems, and computationally lighter than wrapper-based methods, while being less tied to the assumptions of a specific predictive model than embedded methods. This comparison supports the rationality of adopting ReliefF to derive a compact yet informative feature subset in the proposed framework.
Table 6.
Performance comparison of different feature-selection strategies and the resulting selected feature subsets.
4.3.4. Supplementary Real-Only Validation Under Leakage-Imbalanced Training Distributions
Although the main experiments were intentionally conducted on a balanced four-class benchmark to isolate the challenge of multi-condition signal confusion, practical leakage monitoring may involve markedly skewed class distributions, especially when leakage events are rare. To assess the intrinsic impact of such imbalance, we performed a supplementary real-only validation under leakage-imbalanced training distributions. Specifically, only the training folds were made imbalanced by reducing the number of leakage samples, whereas the three non-leakage classes retained their original training-fold sizes. Two skewed settings, 1:2 and 1:5 (leakage:each non-leakage class), were examined. No additional GAN-based augmentation was introduced in this supplementary analysis, allowing the influence of class imbalance itself to be assessed more directly under the same outer 5-fold cross-validation protocol used in the main study.
As shown in Table 7, the balanced 1:1 case from the original real-only benchmark is included as a reference. With increasing imbalance severity, the performance exhibits a consistent downward trend across Accuracy, Macro-F1, Leak-F1, and Leak-Rec, indicating that rare leakage events indeed increase the difficulty of reliable identification. However, the decline remains limited overall, suggesting that the proposed statistical-feature-based pipeline preserves a reasonable degree of robustness even when the leakage class is underrepresented. This supplementary result further supports the practical relevance of the framework, while also motivating future exploration of imbalance-aware learning and augmentation strategies.
Table 7.
Results of the supplementary real-only validation under leakage-imbalanced training distributions.
5. Conclusions
This work developed and validated a compact multicondition identification framework for DHN transient pressure-wave signals, aiming to reliably distinguish leakage from common operation-induced disturbances under small-sample constraints. The main conclusions are as follows:
- Integrated experimental validation under multi-condition DHN scenarios. A controllable indoor DHN testbed was established, and a balanced four-class dataset (leakage, valve regulation, pump speed regulation, and emergency valve shut-off) was constructed, enabling systematic evaluation of leakage recognition against operation-induced transients.
- A robust and interpretable feature pipeline was formed by preprocessing, handcrafted features, and multiclass ReliefF selection. Hampel filtering and a zero-phase 0.5–300 Hz band-pass filter were adopted to suppress impulsive spikes and broadband noise while preserving informative transient components. Time-/frequency-domain statistical descriptors were then extracted and screened by multiclass ReliefF to obtain a compact subset that retains discriminative information while reducing redundancy, which was further supported by feature-selection comparisons.
- Feature-space, class-wise GAN generation effectively alleviated the small-sample limitation for training. By generating synthetic feature vectors in the selected feature space (training only), the framework enriched the training distribution without contaminating real-test evaluation, and the augmentation ratio was shown to have a non-monotonic effect—highlighting the necessity of tuning the augmentation level rather than assuming “more is always better.”
- Improved multiclass identification and leakage-oriented performance on real test samples. Under outer 5-fold cross-validation on real data, GAN-generated feature augmentation improved generalization for representative classifiers. In particular, for random forest, accuracy and Macro-F1 increased from 0.960 to 0.985, while leakage recall rose from 0.920 to 0.980, indicating enhanced robustness when leakage signatures are partially confounded with operational disturbances.
The proposed framework is methodologically transferable to other district heating or water-supply networks that exhibit transient pressure-wave responses, but the specific model parameters are data-driven and require recalibration using local data. Network design and environmental conditions, such as pipe material, diameter, topology, routing complexity, geographical location, and climatic variations, can influence pressure-wave propagation and feature distributions, thereby affecting model accuracy. While the present testbed incorporated representative structural and operational diversity, broader validation across different networks and environments is still needed. Future work will therefore focus on cross-network validation and model adaptation using transfer learning, domain adaptation, or simulation-assisted training. Similar challenges of limited data and feature engineering have also been recognized in other energy-related fields [51,52], supporting the broader relevance of interpretable data-driven frameworks under small-sample conditions.
Author Contributions
Conceptualization, C.C., X.L. and L.D.; Methodology, C.C. and L.D.; Software, C.C.; Validation, C.C.; Formal analysis, X.J.; Writing—original draft, C.C.; Writing—review and editing, C.C., X.L. and X.J.; Visualization, X.L., X.J. and L.D. All authors have read and agreed to the published version of the manuscript.
Funding
This research received no external funding.
Data Availability Statement
The data presented in this study are available on request from the corresponding author on reasonable request.
Conflicts of Interest
The authors declare no conflicts of interest.
Nomenclature
| Abbreviations | |||
| DHN/DHNS | District heating network(s) | Pc | Prior proportion of class c |
| GAN | Generative adversarial network | Ar | Mapping corresponding to the r-th feature |
| ReliefF | A filter-based feature selection algorithm (multiclass extension of Relief) | q | Number of selected top-ranked features |
| mRMR | Minimum redundancy maximum relevance | zi | Latent variable input to the generator |
| LASSO | Least absolute shrinkage and selection operator | pz(z) | Prior distribution of latent variables |
| SVM-RBF | Support vector machine with radial basis function kernel | pdata(p) | Distribution of real feature vectors |
| LR | Logistic regression | G(⋅) | Generator |
| RF | Random forest | D(⋅) | Discriminator |
| kNN | k-nearest neighbors | E[⋅] | Expectation operator |
| PSD | Power spectral density | Nts | Number of test samples |
| Symbols | TPi | True positives for class i | |
| fs | Sampling rate, Hz | FPi | False positives for class i |
| fi | Discrete frequency bin on the one-sided spectrum, Hz | FNi | False negatives for class i |
| Nf | Number of frequency bins | TNi | True negatives for class i |
| w(fi) | Spectral weight at frequency bin fi, defined as the one-sided PSD (pressure unit2/Hz) | Greek letters | |
| N | Number of samples | α | Skewness coefficient |
| P | Number of candidate features | β | Kurtosis coefficient |
| c | Class index | σ | Standard deviation |
| C | Number of classes | ε | Small positive constant (pressure unit2/Hz) |
| pi | Feature vector of the i-th sample | Performance metrics | |
| W(t) | ReliefF feature-weight vector after iteration t | Accuracy | Overall classification accuracy |
| T | Number of ReliefF iterations | Macro-F1 | Macro-averaged F1-score |
| t | Iteration index | Leak-Prec | Precision of the leakage class |
| k | Number of nearest neighbors in ReliefF | Leak-Rec | Recall of the leakage class |
| Hj(pi) | j-th nearest neighbor of pi from the same class | Leak-Spec | Specificity of the leakage class |
| Prior proportion of the class to which the reference sample belongs | Leak-F1 | F1-score of the leakage class | |
| Mc,j(pi) | j-th nearest neighbor of pi from class c | ||
References
- Manservigi, L.; Bahlawan, H.; Losi, E.; Morini, M.; Spina, P.R.; Venturini, M. A diagnostic approach for fault detection and identification in district heating networks. Energy 2022, 251, 123988. [Google Scholar] [CrossRef] [Scilit]
- Bahlawan, H.; Ferraro, N.; Gambarotta, A.; Losi, E.; Manservigi, L.; Morini, M.; Saletti, C.; Spina, P.R.; Venturini, M. Detection and identification of faults in a District Heating Network. Energy Convers. Manag. 2022, 266, 115837. [Google Scholar] [CrossRef] [Scilit]
- Liu, C.; Zhou, S.J.; Zhang, Y.L.; Zhang, C.; Liu, X.R. Leakage diagnosis of district heating-network based on system simulation and PCA_BP neural network. Process. Saf. Environ. Prot. 2023, 180, 260–273. [Google Scholar] [CrossRef] [Scilit]
- Vollmer, E.; Ruck, J.; Volk, R.; Schultmann, F. Leak detection using thermal imagery: Deep learning versus traditional computer vision state-of-the-art. ISPRS-J. Photogramm. Remote Sens. 2025, 228, 505–518. [Google Scholar] [CrossRef] [Scilit]
- Koolivand, Y.; Szczerek, W.J.; Dahl, M.K.; Bendtsen, J.M.H.; Rezaeiyan, Y.; Richter, S.; Laursen, K.; Mosalmani, A.; Maurya, P.; Sadeghi, M.; et al. Thermally Powered Autonomous Water Leakage Detection System for District Heating Pipes. IEEE Sens. J. 2025, 25, 32953–32963. [Google Scholar] [CrossRef] [Scilit]
- Li, H.J.; Zhu, H.H.; Tan, D.Y.; Shi, B.; Yin, J.H. Detecting pipeline leakage using active distributed temperature Sensing: Theoretical modeling and experimental verification. Tunn. Undergr. Space Technol. 2023, 135, 105065. [Google Scholar] [CrossRef] [Scilit]
- Valincius, M.; Vaisnoras, M.; Kaliatka, A. Study and demonstration of pressure wave-based leak detection in a district heating network. Struct. Infrastruct. Eng. 2018, 14, 151–162. [Google Scholar] [CrossRef] [Scilit]
- Zheng, X.J.; Hu, F.S.; Wang, Y.R.; Zheng, L.J.; Gao, X.Y.; Zhang, H.; You, S.J.; Xu, B.X. Leak detection of long-distance district heating pipeline: A hydraulic transient model-based approach. Energy 2021, 237, 121604. [Google Scholar] [CrossRef] [Scilit]
- Xu, Z.Q.; Li, C.; Mu, L.B.; Wang, S.L.; Lu, J.H.; Lan, Y.C. Leakage detection method of underground heating pipeline based on improved wavelet threshold function. Energy 2024, 295, 131051. [Google Scholar] [CrossRef] [Scilit]
- Zhao, L.K.; Cao, Z.; Deng, J.Q. A review of leak detection methods based on pressure waves in gas pipelines. Measurement 2024, 236, 115062. [Google Scholar] [CrossRef] [Scilit]
- Guo, X.J.; Deng, J.Q.; Cao, Z.; Xiong, Z.K. Research on the generation and modulation of active pressure wave for pipelines leak diagnosis. Measurement 2025, 242, 116059. [Google Scholar] [CrossRef] [Scilit]
- Zhou, X.; Liu, F.; Luo, L.S.; Peng, S.M.; Xie, J.L. Study on the Leakage Diagnosis of a Chilled Water Pipeline Network System Based on Pressure Variation Rate Analysis for Climate Change Mitigation. Buildings 2025, 15, 1384. [Google Scholar] [CrossRef] [Scilit]
- Vahldiek, K.; Rüger, B.; Klawonn, F. Optimal Sensor Placement and Influence of Noise on Pressure Wave Evaluation for Leakage Localization in a District Heating Network. Sustain. Energy Grids Netw. 2022, 30, 100672. [Google Scholar] [CrossRef] [Scilit]
- Losi, E.; Manservigi, L.; Spina, P.R.; Venturini, M. Data-driven approach for the detection of faults in district heating networks. Sustain. Energy Grids Netw. 2024, 38, 101355. [Google Scholar] [CrossRef] [Scilit]
- Zhou, S.J.; O’Neill, Z.; O’Neill, C. A review of leakage detection methods for district heating networks. Appl. Therm. Eng. 2018, 137, 567–574. [Google Scholar] [CrossRef] [Scilit]
- Hu, Z.K.; Chen, B.Q.; Chen, W.L.; Tan, D.B.; Shen, D.T. Review of model-based and data-driven approaches for leak detection and location in water distribution systems. Water Supply 2021, 21, 3282–3306. [Google Scholar] [CrossRef] [Scilit]
- Tang, J.; Wang, X.F.; Bi, H.B.; Dai, R.; Yue, Y.C.; Yang, J.H.; Feng, C. Technology for detecting small-aperture leaks in natural gas pipelines utilizing transfer learning methodologies. Meas. Sci. Technol. 2025, 36, 026128. [Google Scholar] [CrossRef] [Scilit]
- Shi, G.X.; Wang, X.P.; Zhang, J.J.; Gao, X.L. High Precision Detection Pipe Bursts Based on Small Sample Diagnostic Method. Sensors 2025, 25, 3431. [Google Scholar] [CrossRef] [Scilit]
- Wang, D.M.; Sun, Y.; Lu, J.Y. Pipeline leak detection based on generative adversarial networks under small samples. Flow Meas. Instrum. 2025, 101, 102745. [Google Scholar] [CrossRef] [Scilit]
- Rajabi, M.M.; Komeilian, P.; Wan, X.; Farmani, R. Leak detection and localization in water distribution networks using conditional deep convolutional generative adversarial networks. Water Res. 2023, 238, 120012. [Google Scholar] [CrossRef] [Scilit]
- Zhang, H.G.; Hu, X.G.; Ma, D.Z.; Wang, R.; Xie, X.P. Insufficient Data Generative Model for Pipeline Network Leak Detection Using Generative Adversarial Networks. IEEE Trans. Cybern. 2022, 52, 7107–7120. [Google Scholar] [CrossRef] [Scilit]
- Shang, R.; Dong, H.L.; Wang, C.; Chen, S.Q.; Sun, T.; Guan, C. Imbalanced data augmentation for pipeline fault diagnosis: A multi-generator switching adversarial network. Control Eng. Pract. 2024, 144, 105839. [Google Scholar] [CrossRef] [Scilit]
- Chandrashekar, G.; Sahin, F. A survey on feature selection methods. Comput. Electr. Eng. 2014, 40, 16–28. [Google Scholar] [CrossRef] [Scilit]
- Peng, H.C.; Long, F.H.; Ding, C. Feature selection based on mutual information: Criteria of max-dependency, max-relevance, and min-redundancy. IEEE Trans. Pattern Anal. Mach. Intell. 2005, 27, 1226–1238. [Google Scholar] [CrossRef] [Scilit] [PubMed]
- Tibshirani, R. Regression shrinkage and selection via the Lasso. J. R. Stat. Soc. Ser. B-Stat. Methodol. 1996, 58, 267–288. [Google Scholar] [CrossRef] [Scilit]
- Hu, J.C.; Szymczak, S. A review on longitudinal data analysis with random forest. Brief. Bioinform. 2023, 24, bbad002. [Google Scholar] [CrossRef] [Scilit] [PubMed]
- Urbanowicz, R.J.; Meeker, M.; La Cava, W.; Olson, R.S.; Moore, J.H. Relief-based feature selection: Introduction and review. J. Biomed. Inform. 2018, 85, 189–203. [Google Scholar] [CrossRef] [Scilit]
- Aggarwal, N.; Shukla, U.; Saxena, G.J.; Rawat, M.; Bafila, A.S.; Singh, S.; Pundir, A. Mean based relief: An improved feature selectionmethod based on ReliefF. Appl. Intell. 2023, 53, 23004–23028. [Google Scholar] [CrossRef] [Scilit]
- Robnik-Sikonja, M.; Kononenko, I. Theoretical and empirical analysis of ReliefF and RReliefF. Mach. Learn. 2003, 53, 23–69. [Google Scholar] [CrossRef] [Scilit]
- Liang, L.P.; Zhang, J.; Xu, K.J.; Ye, G.Y.; Yang, S.L.; Yu, X.L. Classification modeling of valve internal leakage acoustic emission signals based on optimal wavelet scattering coefficients. Measurement 2024, 236, 115112. [Google Scholar] [CrossRef] [Scilit]
- Wu, L.Y.; Liang, W.; Sha, D.L. Cross-domain feature selection and diagnosis of oil and gas pipeline defects based on transfer learning. Eng. Fail. Anal. 2023, 143, 106876. [Google Scholar] [CrossRef] [Scilit]
- Colombo, A.F.; Lee, P.; Karney, B.W. A selective literature review of transient-based leak detection methods. J. Hydro-Environ. Res. 2009, 2, 212–227. [Google Scholar] [CrossRef] [Scilit]
- Xu, Z.Y.; Liu, H.X.; Fu, G.T.; Zeng, Y.K.; Li, Y.C. Feature selection of acoustic signals for leak detection in water pipelines. Tunn. Undergr. Space Technol. 2024, 152, 105945. [Google Scholar] [CrossRef] [Scilit]
- Liang, M.; An, T.F.; Zhao, R.H.; Liu, T.X.; Liu, W.L. Signal processing techniques for detecting leakage in urban water supply pipelines: Denoising and feature enhancement. Tunn. Undergr. Space Technol. 2025, 162, 106670. [Google Scholar] [CrossRef] [Scilit]
- Huang, L.H.; Hu, B.; Wan, S.T.; Lu, B. Research on pipeline flange leakage detection method based on random forest and Pearson correlation coefficient. Appl. Acoust. 2025, 240, 110918. [Google Scholar] [CrossRef] [Scilit]
- Ahmad, Z.; Nguyen, T.K.; Rai, A.; Kim, J.M. Industrial fluid pipeline leak detection and localization based on a multiscale Mann-Whitney test and acoustic emission event tracking. Mech. Syst. Signal Process. 2023, 189, 110067. [Google Scholar] [CrossRef] [Scilit]
- Liu, R.S.; Zayed, T.; Xiao, R. Advanced acoustic leak detection in water distribution networks using integrated generative model. Water Res. 2024, 254, 121434. [Google Scholar] [CrossRef] [Scilit]
- Flórez-López, R. Reviewing RELIEF and its extensions: A new approach for estimating attributes considering high-correlated features. In Proceedings of the 2nd IEEE International Conference on Data Mining, Maebashi City, Japan, 9–12 December 2002; IEEE Computer Society: Washington, DC, USA, 2002; pp. 605–608. [Google Scholar]
- Fan, H.Y.; Xue, L.Y.; Song, Y.; Li, M. A repetitive feature selection method based on improved ReliefF for missing data. Appl. Intell. 2022, 52, 16265–16280. [Google Scholar] [CrossRef] [Scilit]
- Friedman, J.; Hastie, T.; Tibshirani, R. Regularization Paths for Generalized Linear Models via Coordinate Descent. J. Stat. Softw. 2010, 33, 1–22. [Google Scholar] [CrossRef] [Scilit]
- Cortes, C.; Vapnik, V. Support-vector networks. Mach. Learn. 1995, 20, 273–297. [Google Scholar] [CrossRef] [Scilit]
- Cervantes, J.; Garcia-Lamont, F.; Rodríguez-Mazahua, L.; Lopez, A. A comprehensive survey on support vector machine classification: Applications, challenges and trends. Neurocomputing 2020, 408, 189–215. [Google Scholar] [CrossRef] [Scilit]
- Fan, X.D.; Wang, X.W.; Zhang, X.J.; Yu, X. Machine learning based water pipe failure prediction: The effects of engineering, geology, climate and socio-economic factors. Reliab. Eng. Syst. Saf. 2022, 219, 108185. [Google Scholar] [CrossRef] [Scilit]
- Hattori, K.; Takahashi, M. A new nearest-neighbor rule in the pattern classification problem. Pattern Recognit. 1999, 32, 425–432. [Google Scholar] [CrossRef] [Scilit]
- Taunk, K.; De, S.; Verma, S.; Swetapadma, A. A Brief Review of Nearest Neighbor Algorithm for Learning and Classification. In Proceedings of the International Conference on Intelligent Computing and Control Systems (ICCS); IEEE: Piscataway, NJ, USA; Anna University, Vaigai College Engineering: Madurai, India, 2019; pp. 1255–1260. [Google Scholar]
- Opitz, J. A Closer Look at Classification Evaluation Metrics and a Critical Reflection of Common Evaluation Practice. Trans. Assoc. Comput. Linguist. 2024, 12, 820–836. [Google Scholar] [CrossRef] [Scilit]
- Rainio, O.; Teuho, J.; Klén, R. Evaluation metrics and statistical tests for machine learning. Sci. Rep. 2024, 14, 6086. [Google Scholar] [CrossRef] [Scilit]
- Gao, Z.J.; Liu, H.B.; Li, L.B. Data Augmentation for Time-Series Classification: An Extensive Empirical Study and Comprehensive Survey. J. Artif. Intell. Res. 2025, 83, 46. [Google Scholar] [CrossRef] [Scilit]
- Chawla, N.V.; Bowyer, K.W.; Hall, L.O.; Kegelmeyer, W.P. SMOTE: Synthetic minority over-sampling technique. J. Artif. Intell. Res. 2002, 16, 321–357. [Google Scholar] [CrossRef] [Scilit]
- Wang, X.C.; Cui, N.; Fan, J.P.; Gu, Y.J.; Zhang, J.; Liu, N.N.; An, Y.; Hu, X.; Qu, Z. 1D-CNN with SMOTE for Acoustic Detection and Classification of Structural Defects in Municipal Sewage Pipelines: Addressing Imbalanced Data Set and High Sewage Level Challenges. J. Pipeline Syst. Eng. Pract. 2026, 17, 04026016. [Google Scholar] [CrossRef] [Scilit]
- Wu, X.Z.; Wang, L.Q.; Li, A.R.; Wu, G.; Hu, Z.; Yun, F.F.; Mori, T. High Conversion Efficiency in Intrinsic High Power-Density Mg2Sn-GeTe Thermoelectric Generator. Adv. Sci. 2025, 12, e06997. [Google Scholar] [CrossRef] [Scilit]
- Tao, Q.L.; Yu, J.X.; Mu, X.Y.; Jia, X.; Shi, R.P.; Yao, Z.F.; Wang, C.; Zhang, H.; Liu, X. Machine learning strategies for small sample size in materials science. Sci. China-Mater. 2025, 68, 387–405. [Google Scholar] [CrossRef] [Scilit]

Disclaimer/Publisher’s Note: The statements, opinions and data contained in all publications are solely those of the individual author(s) and contributor(s) and not of MDPI and/or the editor(s). MDPI and/or the editor(s) disclaim responsibility for any injury to people or property resulting from any ideas, methods, instructions or products referred to in the content. |
© 2026 by the authors. Licensee MDPI, Basel, Switzerland. This article is an open access article distributed under the terms and conditions of the Creative Commons Attribution (CC BY) license.