


Abstract
In the design of shaking table tests concerning saturated sand–pile interactions, quantitatively achieving similarity in liquefaction responses between the model and the prototype has long been a challenging task. In addition, the dynamic shear modulus of the prepared model soil often fails to satisfy the ideal similarity conditions, which further exacerbates the difficulty of realizing liquefaction response similarity. To address the above issues, the authors have proposed a liquefaction similarity law for saturated sand–pile shaking table tests under horizontal excitation, considering the dynamic shear modulus error of the model soil. To further verify the accuracy of the proposed liquefaction similarity law, investigate its simulation capability, and evaluate its applicability under different conditions, this paper establishes and validates numerical models of saturated sand–pile dynamic interaction systems based on shaking table test results and conducts a series of parametric analyses via numerical simulation. The results indicate that when the proposed similarity law is applied, the acceleration similarity ratio should be set to 1, which can satisfy both gravity similarity and elastic force similarity simultaneously. A comparison with the artificial mass similarity law demonstrates the distinct advantages of the proposed similarity law. Finally, the applicability of the proposed similarity law under different parametric conditions is verified, and the influence of various parameters on the accuracy of the back-calculated results using the similarity law is investigated.
1. Introduction
Sand foundations are widely distributed across the globe. In addition to offshore constructions and waterfront structures, such as harbor terminals, which are often located on saturated sand foundations, the sand foundations of some onshore buildings can also become saturated under conditions like dewatering [1,2]. For such structures, pile foundations are commonly adopted to mitigate the effects of foundation liquefaction [3,4,5,6]. However, under seismic loading, the liquefaction of saturated sand may still lead to the failure and damage of pile foundations. Therefore, the issues of dynamic soil–pile interaction and liquefaction in saturated sand supporting pile foundations constitute crucial research topics in earthquake engineering [7,8,9,10,11]. Numerous scholars have conducted scale model shaking table tests to investigate the seismic response of pile-supported structures founded on liquefiable saturated sand [12]. Nevertheless, the achievement of similarity between the model and the prototype has long been a major challenge in the design of shaking table tests for saturated sand–pile interaction systems. Most existing shaking table studies primarily provide qualitative or semi-quantitative insights, while reliable quantitative back-calculation of prototype responses remains limited.
Some scholars have adopted the dimensional analysis method to achieve similarity in the seismic response of liquefiable soil–structure interaction systems, to a certain extent, by ensuring the similarity of key physical quantities. Xu et al. [13] proposed that the similarity ratio design should follow the principle of the “gravity-distorted model” in their group pile tests on liquefiable sites, prioritizing the matching of soil shear wave velocity and structural frequency while balancing the coordination of geometric and material parameters. Some other scholars have derived the similarity control of seismic responses for liquefiable soil–structure interaction systems by summarizing key dimensionless groups. Bhattacharya et al. [14,15,16] developed a similarity design method suitable for the serviceability limit state by using dimensionless groups to control dynamic similarity, which was specifically proposed for the monopile foundations of offshore wind turbines on saturated soil foundations. In addition, some scholars have proposed model design methods for shaking table tests of saturated soil–structure interaction systems using the governing equation method. Iai et al. [17,18] put forward a similarity design method for shaking table tests of saturated soil–structure–fluid systems under 1 g gravitational field. They established the governing equations for the soil skeleton, pore water, structure, and external fluid and derived the scaling ratios of key parameters through the dimensionless normalization of these equations. However, this similarity design method is not directly applicable to liquefaction limit states, as it does not explicitly account for the nonlinear accumulation of excess pore water pressure and stiffness degradation associated with cyclic liquefaction.
For shaking table tests on the liquefaction response of saturated sand–pile systems, existing dimensional similarity laws, by focusing only on key physical quantities or dimensionless groups rather than complete governing equations, cannot establish quantitative model–prototype similarity or estimate the error in back-calculated prototype responses. The existing similarity laws established via the governing equation method also do not explicitly address the similarity of pore pressure evolution and energy dissipation mechanisms during soil liquefaction in saturated sand–pile systems. In addition, in 1 g shaking table tests, the dynamic shear modulus of the prepared model soil often cannot meet the ideal similarity conditions, which may lead to dissimilar soil–pile dynamic interaction and consequently affect the pore pressure accumulation in the surrounding soil. Under such circumstances, there is a lack of relevant research on how to quantitatively back-calculate the liquefaction response of the prototype from the model test results. To fill the aforementioned research gaps, aiming at the condition of horizontal seismic excitation, the authors adopted the governing equation method, took the dynamic ground impedance function and foundation input motion formula in the substructure method for soil–structure dynamic interaction analysis, as well as the energy-based model for pore pressure development as analytical tools, proposed a liquefaction similarity law for saturated sand–pile shaking table tests, and derived an adjustment method for the similarity law when there were errors in the dynamic shear modulus of the model soil. Furthermore, the proposed liquefaction similarity law was verified through a series of saturated sand–pile shaking table tests with multiple scales [19].
Constrained by test costs, only a limited number of parameters can be varied in shaking table tests, which allows for a merely preliminary validation of the proposed liquefaction similarity law rather than an exhaustive investigation through arbitrary adjustments of model parameters. In this paper, based on the results of shaking table tests, numerical models of the saturated sand–pile dynamic interaction systems are established and validated. Then, parametric analyses are conducted via the numerical models to thoroughly investigate the simulation capability of the proposed liquefaction similarity law and its applicability under different conditions. This study focuses on horizontally excited saturated sand–pile systems and aims to: (1) clarify the acceleration similarity ratio; (2) evaluate the proposed similarity law against the artificial mass similarity law; and (3) assess its applicability under selected parametric conditions.
2. Liquefaction Similarity Law and Its Experimental Verification
2.1. Liquefaction Similarity Law
2.1.1. Similarity of Soil–Pile Dynamic Interaction
According to the motion equation of the overall soil–structure system in the substructure method, two conditions should be satisfied to achieve similarity in foundation motion when the superstructure meets the ideal similarity requirements: (1) similarity of the dynamic ground impedance; (2) similarity of the foundation input motion.
Only the case of the saturated sand–pile interaction system subjected to horizontal seismic excitation is considered. Based on the Dynamic Winkler Model, the calculation formula for the horizontal dynamic ground impedance at the pile head can be derived [20]:
where and are the elastic modulus and the cross-section moment of inertia of the pile; is the imaginary unit; , and are the elastic modulus, Poisson’s ratio and density of the soil surrounding the pile, respectively; is the pile diameter; is the material damping ratio of the soil; and is the shear wave velocity of the soil surrounding the pile.
Kausel proposed an approximate formula for the horizontal foundation input motion [21]:
where is the Fourier transform amplitude of the free-field horizontal displacement; is the pile length; and is the horizontal first-order circular frequency of the soil.
It can be seen from Equations (1) and (2) that, to achieve simultaneous similarity of and , the similarity of the following nine physical quantities should be satisfied: (1) ; (2) ; (3) ( is the shear modulus of the soil, and similarity of is equivalent to similarity of ); (4) ; (5) ; (6) ; (7) ; (8) ; and (9) .
In the 1 g shaking table test, there often exists a discrepancy between the actual dynamic shear modulus of the model soil, , and its ideal value, , which is expressed as (). Under these circumstances, the actual shear wave velocity and the horizontal first-order circular frequency of the model soil are and respectively. Assume the functions , , and are given as follows:
Equations (1) and (2) can then be expressed as follows:
By scaling the model’s actual excitation circular frequency to and adjusting the model’s actual pile bending stiffness to , we obtain , , and .
represents the radiation damping in the dynamic ground impedance function, which only needs to be considered when the excitation frequency exceeds the horizontal first-order frequency of the soil () [22]. In addition, the authors’ previous research on saturated sand model soil has shown that the error in the dynamic shear modulus can be controlled within a range of −30% to 50% (i.e., ranges from 0.7 to 1.5) [23]. When , , and when , , this indicates that the error of does not exceed 17% at maximum. In summary, for excitation components with frequencies not exceeding soil’s horizontal first-order frequency, can be satisfied; for excitation components with frequencies exceeding soil’s horizontal first-order frequency, the stiffness and material damping terms ( and ) in the dynamic ground impedance function can be maintained as equal, with a maximum error of up to 17% occurring only in the radiation damping term; accordingly, it can be reasonably assumed that .
To satisfy , it is further required that . We transform the control point displacement of the ideal model, , as ; that is, the control point displacement of the adjusted model should be . Correspondingly, the control point acceleration of the adjusted model should be . It can be seen that after frequency modulation of the input acceleration at the control point, its amplitude should be further scaled by a factor of . In this case, to maintain the equality of the inertial force of the superstructure, the mass at the pile head should be adjusted to .
2.1.2. Similarity of Based on the Energy-Based Model for Pore Pressure Development
The similarity of the soil liquefaction process is reflected by the similarity of the development process of the pore pressure ratio, . The expression of the energy-based model for pore pressure development is given as follows [24]:
where is the consolidation confining pressure; is the accumulated strain energy per unit volume of soil; and is a dimensionless parameter.
It can be seen from Equation (9) that the similarity of the pore pressure ratio, , between the model and the prototype can be achieved as long as the similarity of the dimensionless group, , between them is satisfied.
The similarity of can be achieved by ensuring the similarity of foundation embedment depth and structural additional stress. The parameter β can be adjusted by controlling the particle size, gradation and relative density of the model soil according to Equation (10) [23], thereby achieving its similarity.
where is the relative density; is the effective particle size; and is the uniformity coefficient.
depends on the stress–strain response of the soil and is calculated by the following formula:
where is the excitation duration; is the shear stress of the soil; and is the shear strain of the soil.
The stress–strain response of the soil surrounding the pile is affected by the soil–pile dynamic interaction. Therefore, to achieve the similarity of , when the soil enters the nonlinear stage, it is required to ensure the similarity of the curves depicting the variation in the dynamic shear modulus ratio and damping ratio with the dynamic shear strain. On this occasion, based on the principle of the soil’s equivalent linear model, the similarity of the soil–pile dynamic interaction can be achieved under different dynamic shear strain levels. The variation in the dynamic shear modulus ratio and damping ratio with the dynamic shear strain can be described by the parameter [23]. Thus, by controlling the relative density and gradation of the model soil to satisfy the similarity of , according to Equation (12) [23], the similarity of can be realized.
where is the curvature coefficient.
In Equation (11), the relationship between the shear stress and acceleration of each soil layer is given by Equation (13), and the relationship between the shear strain, , and displacement, , is shown in Equation (14) [25].
where ( = 1,2,3…) is the horizontal shear stress of the th soil layer; is the horizontal acceleration of the th soil layer; is the depth of the th soil layer; is the horizontal shear strain of the th soil layer; is the horizontal displacement of the th soil layer; and is the thickness of the th soil layer.
As indicated in Section 2.1.1, when there exists an error in the dynamic shear modulus of the model soil (), the displacement and acceleration of the model soil become and , respectively, after adjusting the input excitation at the control point. Therefore, it can be derived from Equations (13) and (14) that at the corresponding time instants of the adjusted model and the ideal model (i.e., ), the relationships and are satisfied. Furthermore, from Equation (11), the relationship between the accumulated strain energy per unit volume of soil for the adjusted model and that for the ideal model can be obtained as .
We adjust the particle size, gradation and relative density of the model soil according to Equation (10) to satisfy the condition of , and thus, the relationship can be established between the actual model and the ideal model. In this case, the similarity of the pore pressure ratio, , between the model and the prototype can be achieved, thus realizing the similarity of the soil liquefaction process.
2.1.3. Summary of the Liquefaction Similarity Law
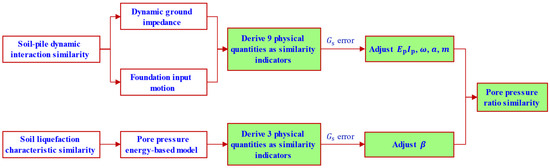
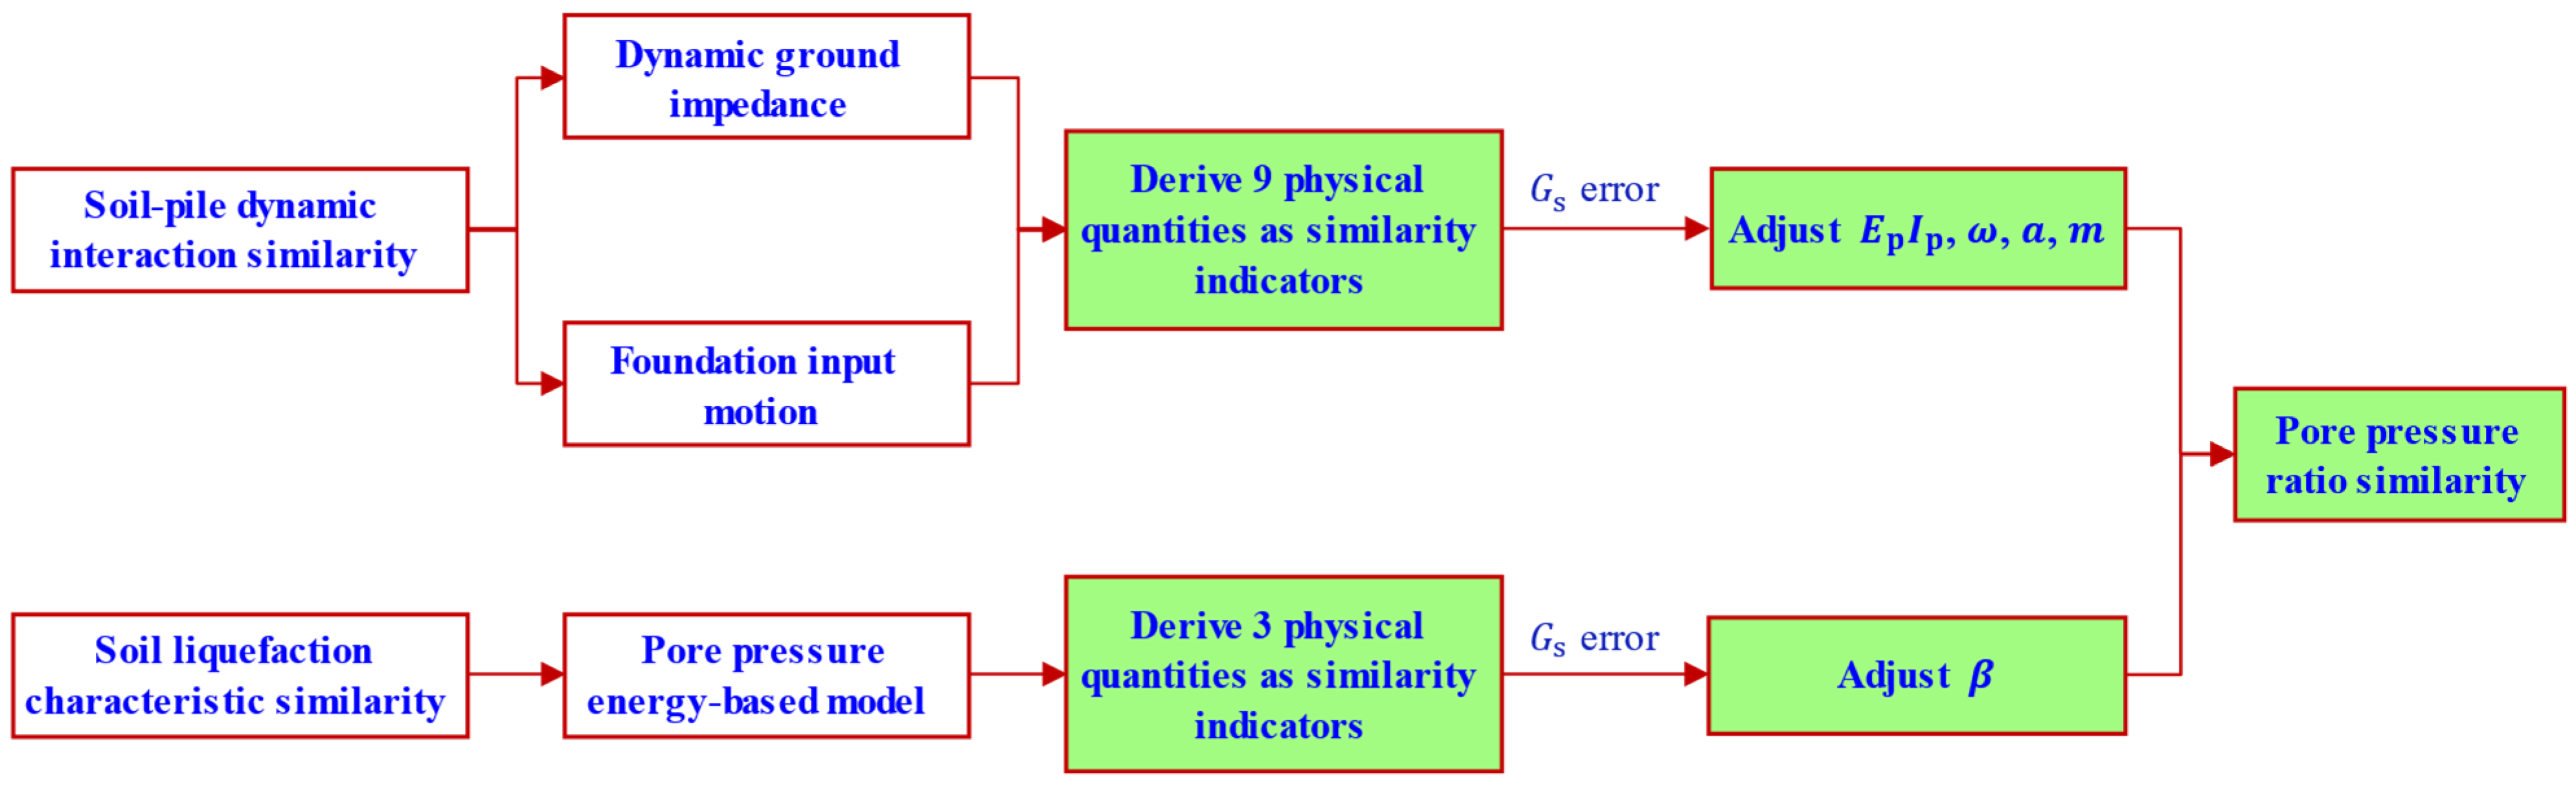
The derivation process of the proposed liquefaction similarity law for saturated sand–pile shaking table tests, considering the dynamic shear modulus error of model soil, is illustrated in Figure 1.
Figure 1.
Derivation process of the liquefaction similarity law for saturated sand–pile shaking table tests.
A comparison of the similarity ratios of various physical quantities between the proposed liquefaction similarity law and the dimensional analysis similarity law is presented in Table 1 [19].
Table 1.
Comparison of similarity ratios between the proposed similarity law and dimensional similarity law.
2.2. Experimental Verification of the Liquefaction Similarity Law
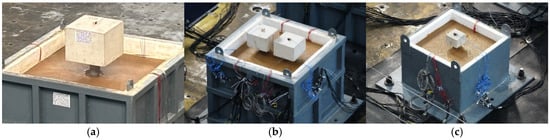
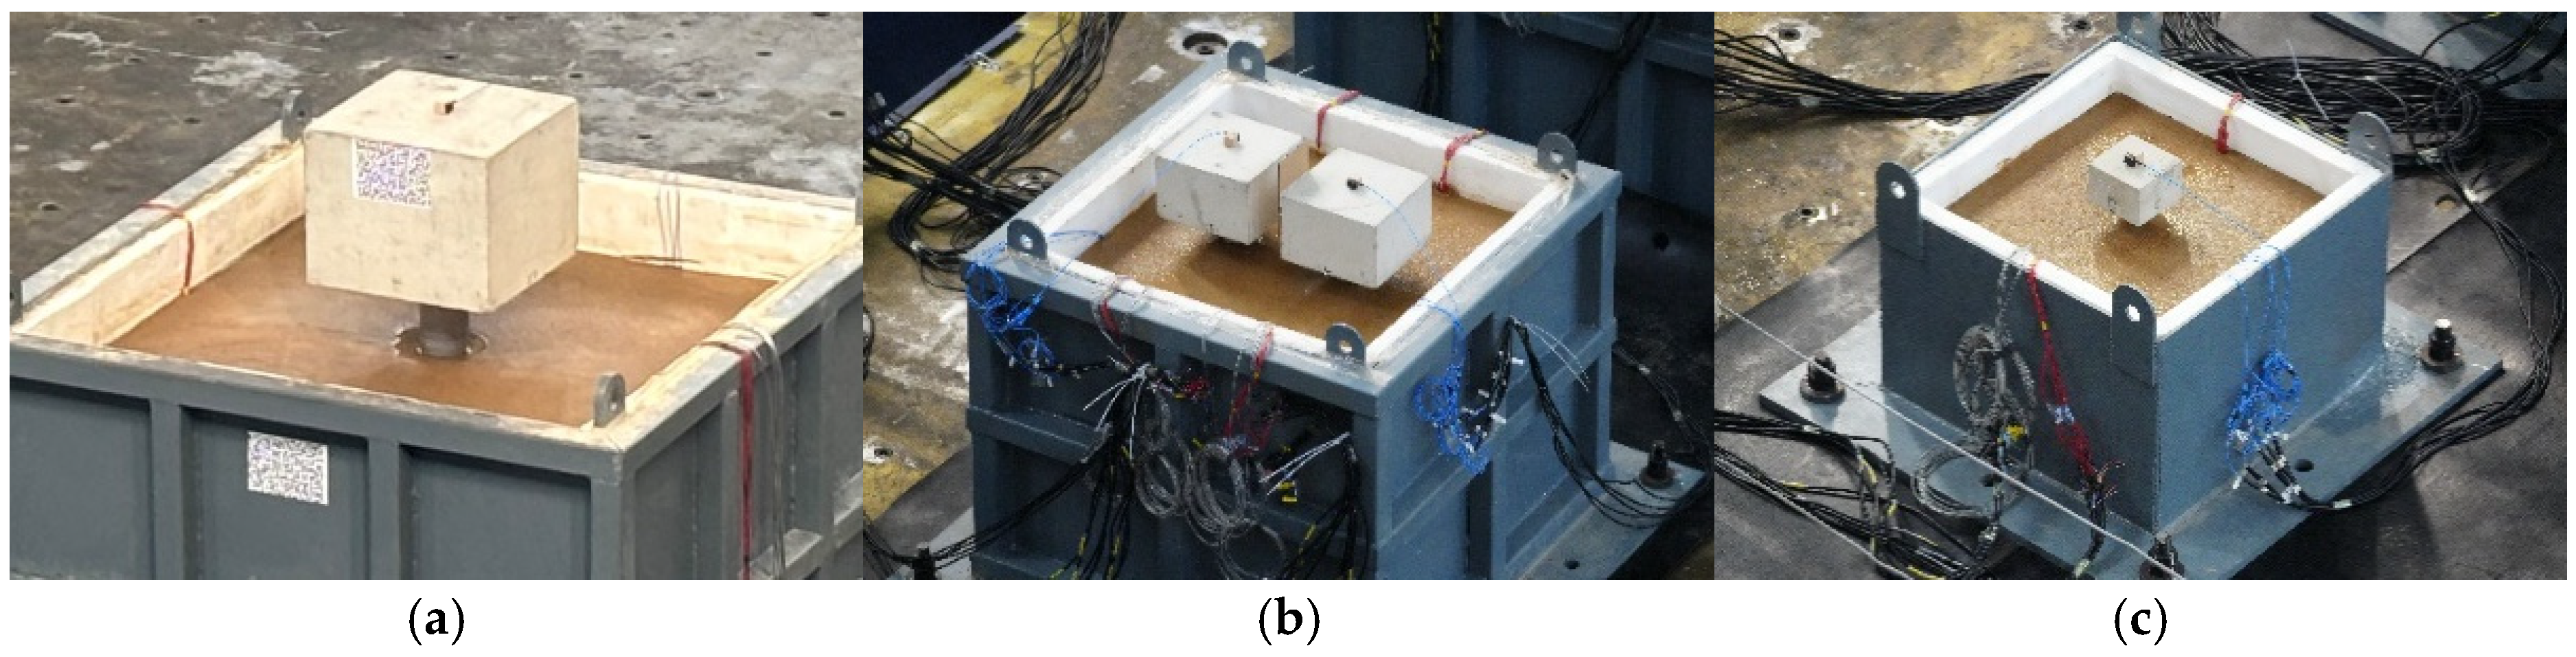
To verify the accuracy of the proposed liquefaction similarity law, shaking table tests of saturated sand–pile interaction models with three scales (1:1, 1:2, and 1:4), as illustrated in Figure 2, were designed and conducted [19].
Figure 2.
Multi-scale saturated sand–pile interaction shaking table tests: (a) 1:1 model; (b) 1:2 model; (c) 1:4 model.
To precisely control the dynamic and liquefaction characteristics of the model soil, saturated manufactured sand with a particle size range of 0.075 mm to 1 mm was adopted for preparing the model soil. The authors have previously conducted thorough research on such soil and proposed its use as a universal model soil. An approach for preparing model saturated sand was proposed, which emphasizes the similarity of dynamic and liquefaction characteristics rather than physical parameters such as relative density and gradation [23]. For natural sands, the dynamic and liquefaction parameters (e.g., , , and ) are first determined through laboratory testing. Based on similarity ratios, the corresponding target parameters for the model manufactured sand are then derived, which are used to define preparation parameters such as relative density and gradation. Taking the 1:1 model as the prototype, a dynamic shear modulus error was introduced into the 1:2 and 1:4 model soils, such that the actual dynamic shear modulus was set to 70% of the ideal value; i.e., . of the 1:2 and 1:4 model soils were specified to be identical to that of the 1:1 model soil, while was set to be times that of the 1:1 model soil. The parameters of the model soils for each scale are presented in Table 2.
Table 2.
Parameters of the model soils for each scale.
The test piles were fabricated from 304 stainless steel pipes, with the pile toes welded to the bottom plate of the soil container to simulate the supporting condition of rock-socketed piles. Based on the dynamic shear modulus error, , of the model soil and the similarity ratios listed in Table 1, the piles for each scale model were designed, as presented in Table 3. To investigate the influence of the similarity of dynamic ground impedance on the similarity of liquefaction responses between the model and the prototype, Pile2-2, whose bending stiffness was not adjusted in accordance with the proposed similarity law, was installed in the 1:2 model for comparison with Pile2-1.
Table 3.
Parameters of the piles for each scale model.
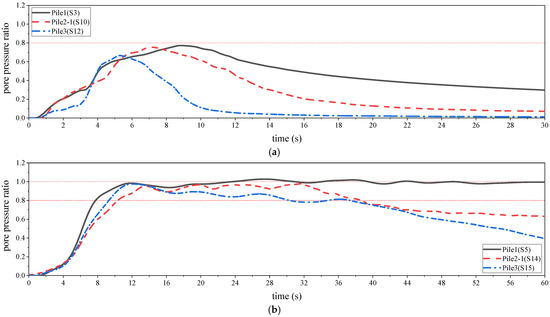
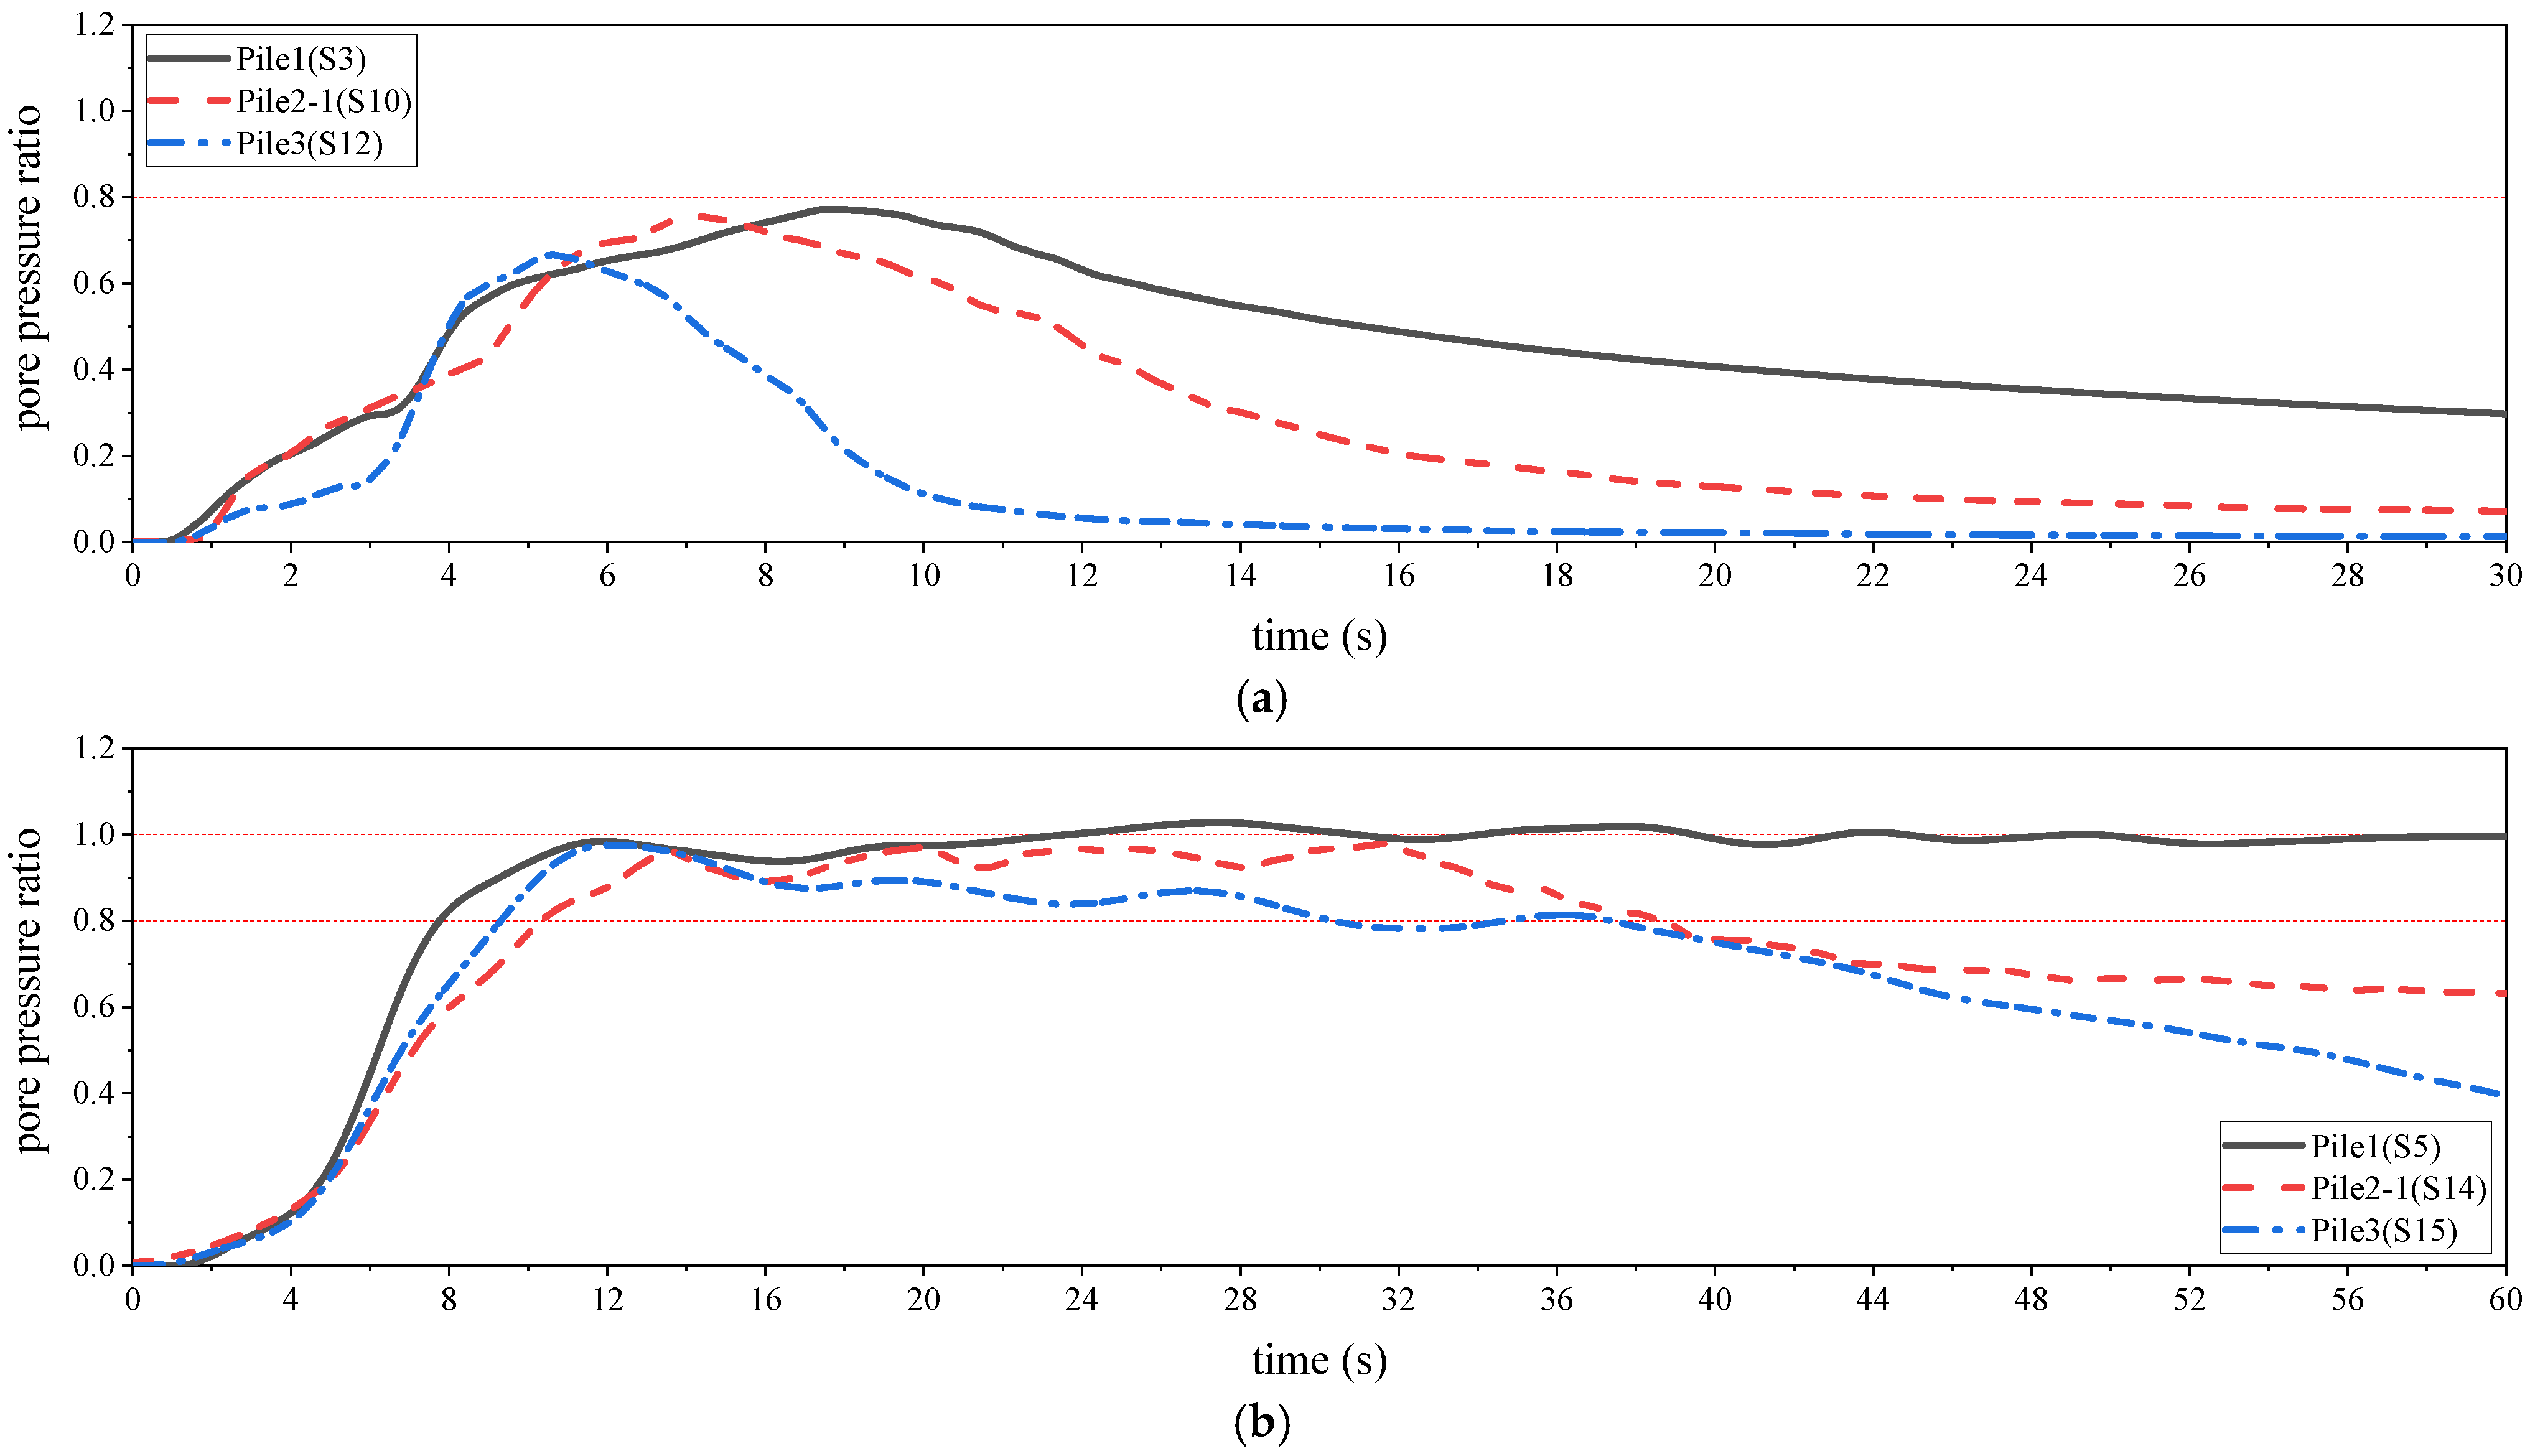
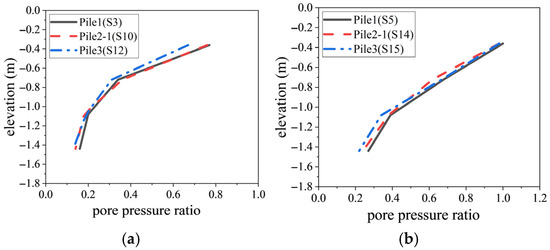
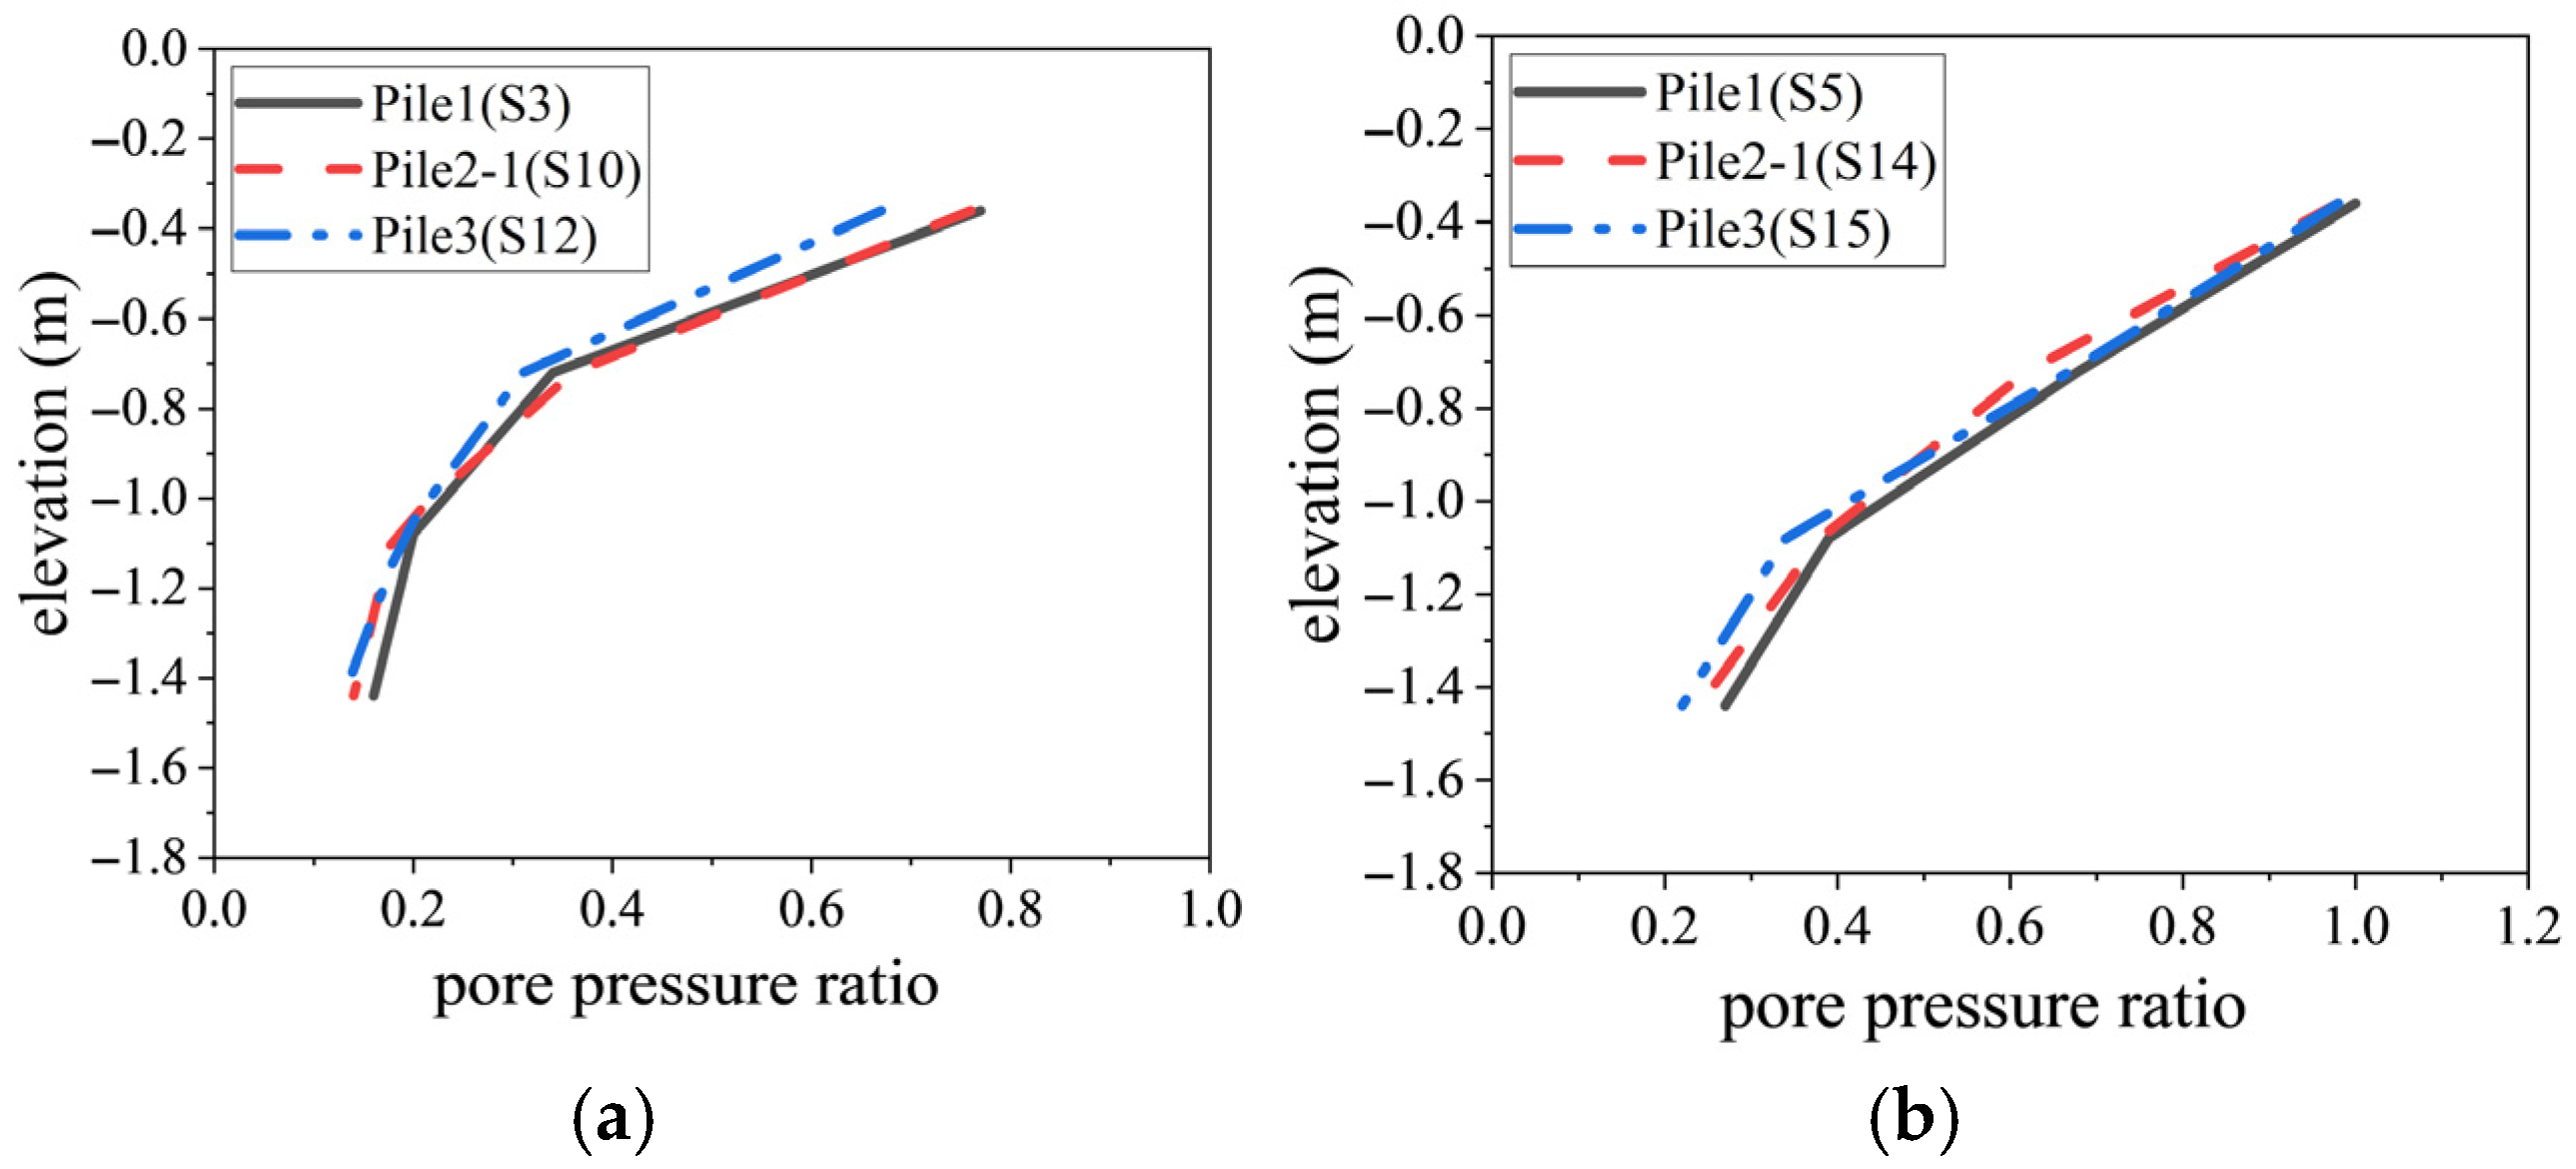
The time histories of the pore pressure ratio at the top soil layer and the maximum pore pressure ratios at different depths obtained from the S10 (Kobe wave) and S14 (Chichi wave) conditions of Pile2-1 (1:2 model), as well as the S12 and S15 conditions of Pile3 (1:4 model), were back-calculated to the 1:1 model using the similarity ratios listed in Table 1 and then compared with the prototype responses of Pile1 obtained from the S3 and S5 conditions, respectively, as illustrated in Figure 3 and Figure 4. It can be observed that under different loading waveforms and amplitudes, the back-calculated pore pressure ratio time history curves (rising phase) and the distribution curves of maximum pore pressure ratios at different depths are in good agreement with the prototype curves, with all errors not exceeding 20%. The shaking table test results indicate that scaling model design performed in accordance with the proposed liquefaction similarity law enables accurate back-calculation of prototype liquefaction responses from model liquefaction responses, thus verifying the accuracy of the proposed similarity law.
Figure 3.
Back-calculated pore pressure ratio time histories of shaking table tests: (a) pore pressure ratio time histories under 0.4 g Kobe wave at −0.36 m; (b) pore pressure ratio time histories under 0.64 g Chichi wave at −0.36 m.
Figure 4.
Back-calculated maximum pore pressure ratios at different depths of shaking table tests: (a) 0.4 g Kobe wave; (b) 0.64 g Chichi wave.
3. Establishment and Validation of the Numerical Model
OpenSees (Open System for Earthquake Engineering Simulation) incorporates a variety of extensively validated sand liquefaction models, which can accurately simulate pore pressure accumulation, stiffness degradation, and strength loss under cyclic shearing and thus exhibit significant advantages in the seismic response analysis of liquefiable soils [26]. Therefore, OpenSees was selected as the tool for numerical modeling and analysis in this study.
The dimensions and materials of the finite element models were consistent with those of the test models described in Section 2.2.
Stainless-steel pipe piles were modeled using the Displacement-Based Beam–Column Element, a high-order beam element based on displacement interpolation and supporting fiber sections, which can accurately simulate the geometric and material nonlinear responses of structures under loads such as earthquakes. The ideal elastoplastic constitutive model was adopted for the pile material, with the elastic modulus set to 193 GPa, yield strength to 205 MPa, Poisson’s ratio to 0.3, density to 7930 kg/m3 and damping ratio to 0.006. The concrete mass blocks at the pile heads were simulated in the form of lumped masses.
The saturated sand was modeled using the Twenty-Eight Node Brick u-p Element, a twenty-node hexahedral isoparametric element. Each node has three solid displacement degrees of freedom, and each of the eight corner nodes is additionally equipped with one extra fluid pressure degree of freedom. Based on Biot’s theory of porous media, this element is suitable for simulating the dynamic responses of fully coupled fluid–solid materials [27]. The PressureDependMultiYield Material (abbreviated as PDMY material) was adopted for the saturated sand. As an advanced plane–strain sand constitutive model in OpenSees, the PDMY material is specifically designed to simulate the nonlinearity, plastic deformation and liquefaction behavior of sand under cyclic loading. Classified as a “multi-yield surface-plasticity” model, it can account for confining pressure dependence and dilatancy/contraction characteristics and is regarded as one of the core material models for seismic response analysis of liquefiable soils. The material parameters of the saturated sand for the 1:1 model are listed in Table 4. In addition, a user-defined yield surface approach was employed, where the degradation curve of dynamic shear modulus with increasing dynamic shear strain was customized by inputting (, ) data. Among the aforementioned parameters, some parameters, such as (, ) data, refPress, refShearModul and Rho, were calibrated through laboratory tests, including dynamic triaxial tests. The remaining parameters, which are not easily calibrated directly via laboratory testing, were adjusted within a reasonable range by correlating with shaking table test results. The material parameters of the saturated sand for other scale models were determined according to the similarity ratios.
Table 4.
Material parameters of saturated sand for the 1:1 model.
The boundary foam boards were modeled using the Twenty-Node Brick Element, and a linear elastic constitutive model was adopted for the material. The elastic modulus was set to 1 MPa, Poisson’s ratio to 0.2, density to 15 kg/m3 and damping ratio to 0.15.
Rayleigh damping was adopted for the damping configuration. The Rayleigh damping coefficients, and , of each material can be calculated by the formulas and , in which is the damping ratio, and and are the first- and second-order natural frequencies of the system, which can be obtained by modal analysis. The contact relationship between the soil and piles was established using the ZeroLengthContact Element, where the pile nodes were defined as constrained nodes and the soil nodes as retained nodes. A hard contact model was employed for the normal direction, and Coulomb friction was adopted for the tangential direction with a friction coefficient of 0.3 [28]. The normal and tangential contact stiffnesses are set to 108 kN/m and 107 kN/m, respectively. Displacement compatibility and force equilibrium between the soil and boundary foam boards were achieved using the common node method [29]. The boundary conditions were consistent with those of the shaking table tests, which were set as rigid soil container boundary conditions: specifically, the lateral boundary nodes were subjected to motion coupling constraints, the relative sliding between the soil and the bottom plate of the soil container was neglected, and the excitation was applied directly to the bottom surface of the soil and the pile toes. The four lateral surfaces and the bottom surface of the soil were set as impermeable boundaries, while the top surface was set as a permeable boundary.
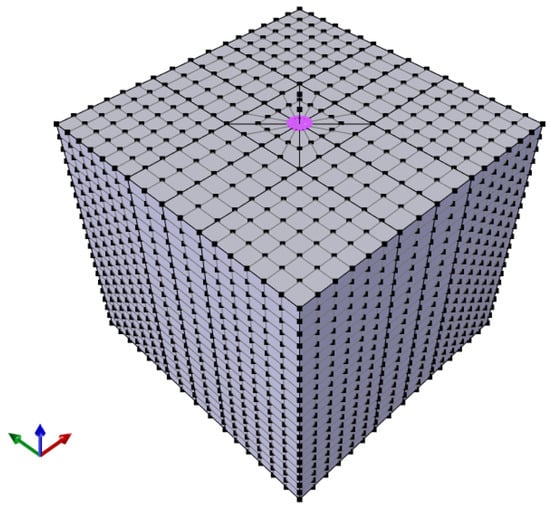
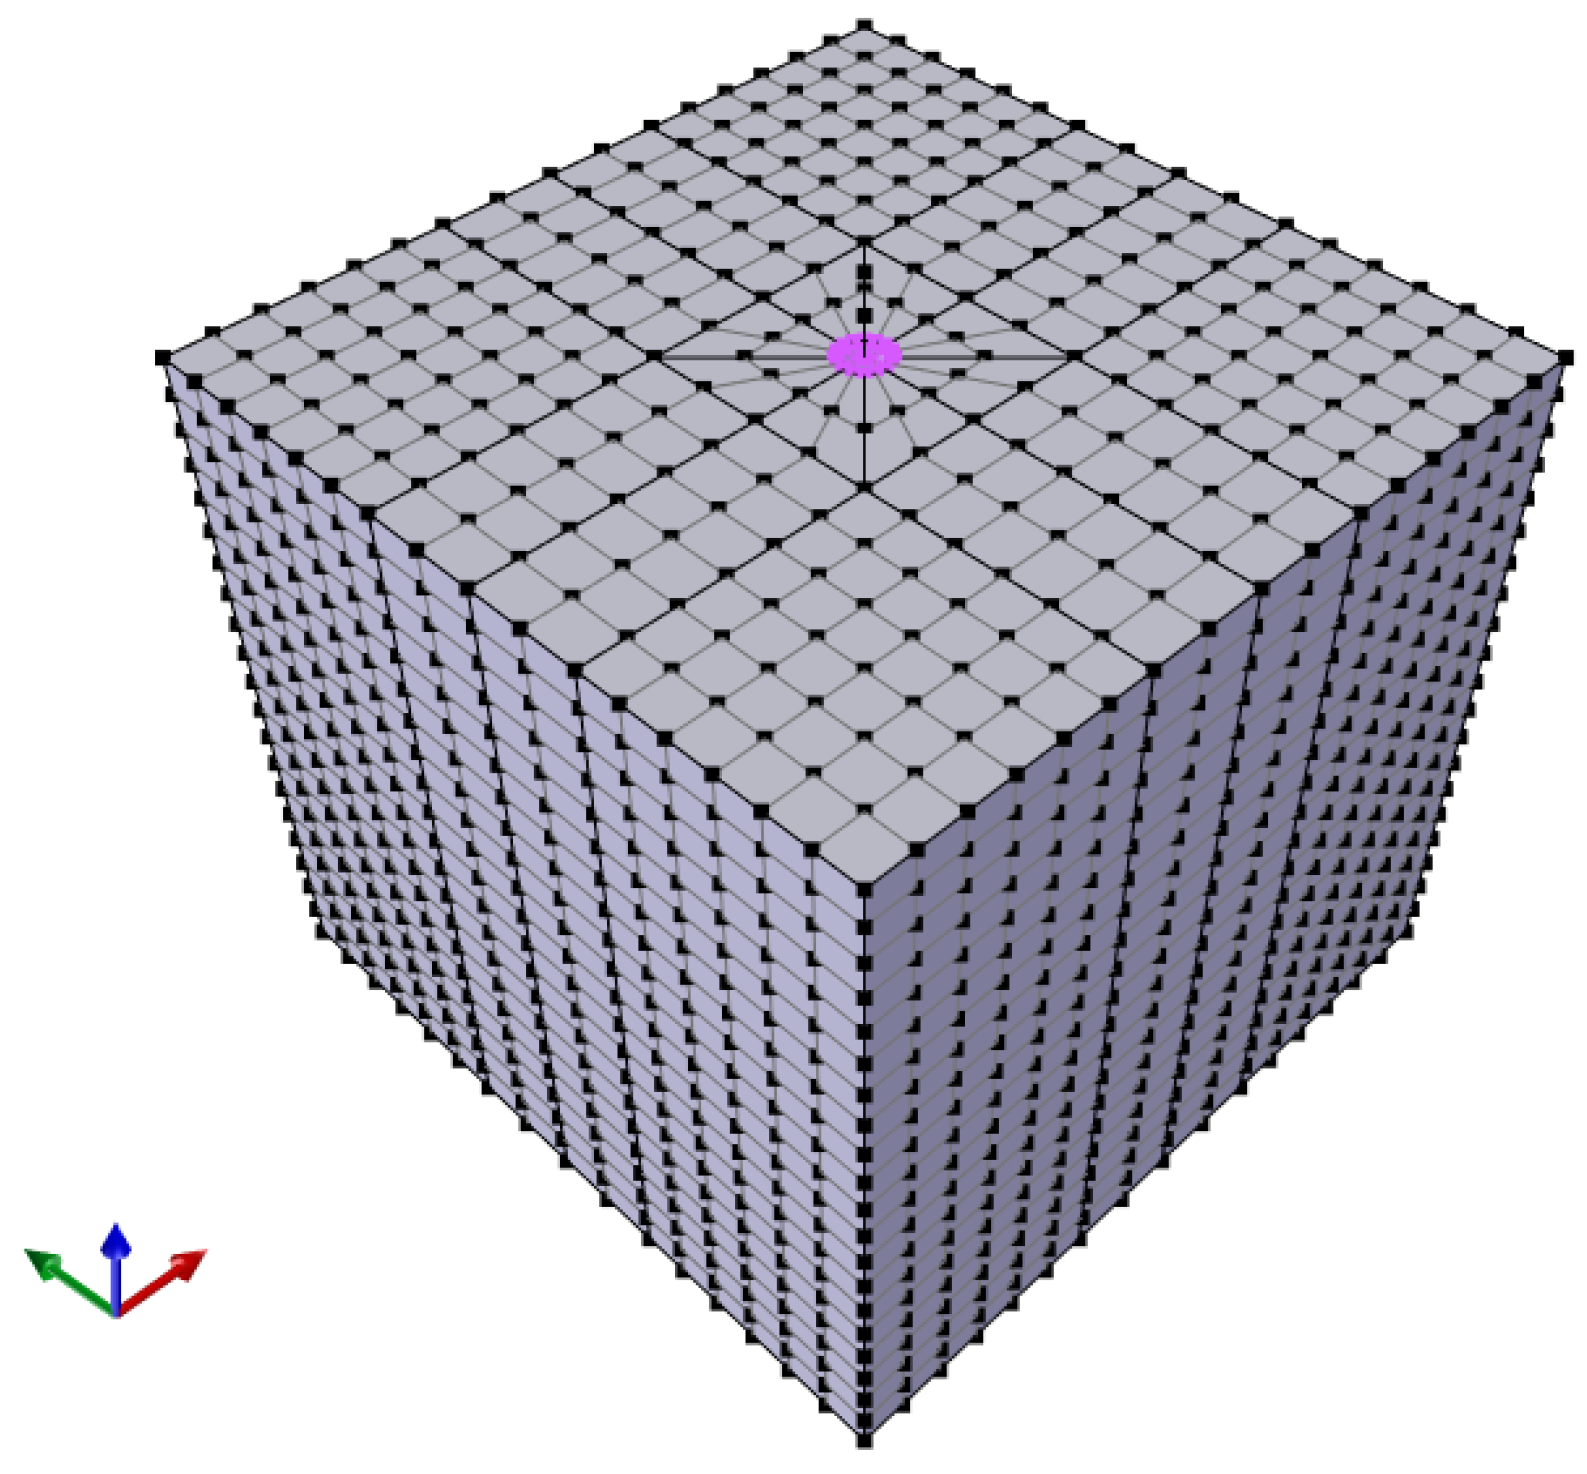
In the finite element analysis, the convergence tolerance was set to 10−6. A refined mesh generation was adopted, as shown in Figure 5. Taking the 1:1 model as an example, the maximum size of soil elements was 100 mm, which is much smaller than the wavelength of the input excitation. To ensure the accuracy of the calculation results, the pile was discretized into 16 meshes along the circumferential direction and 22 meshes along the longitudinal direction. The mesh sensitivity analysis showed that doubling the mesh density resulted in variations of less than 3% in various model responses, demonstrating that the mesh resolution met the requirements.
Figure 5.
Mesh generation of the finite element model.
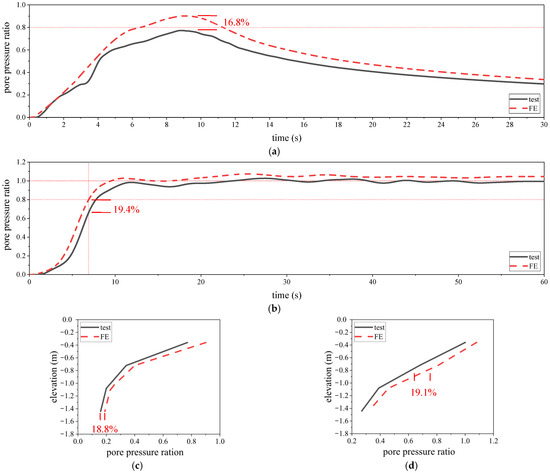
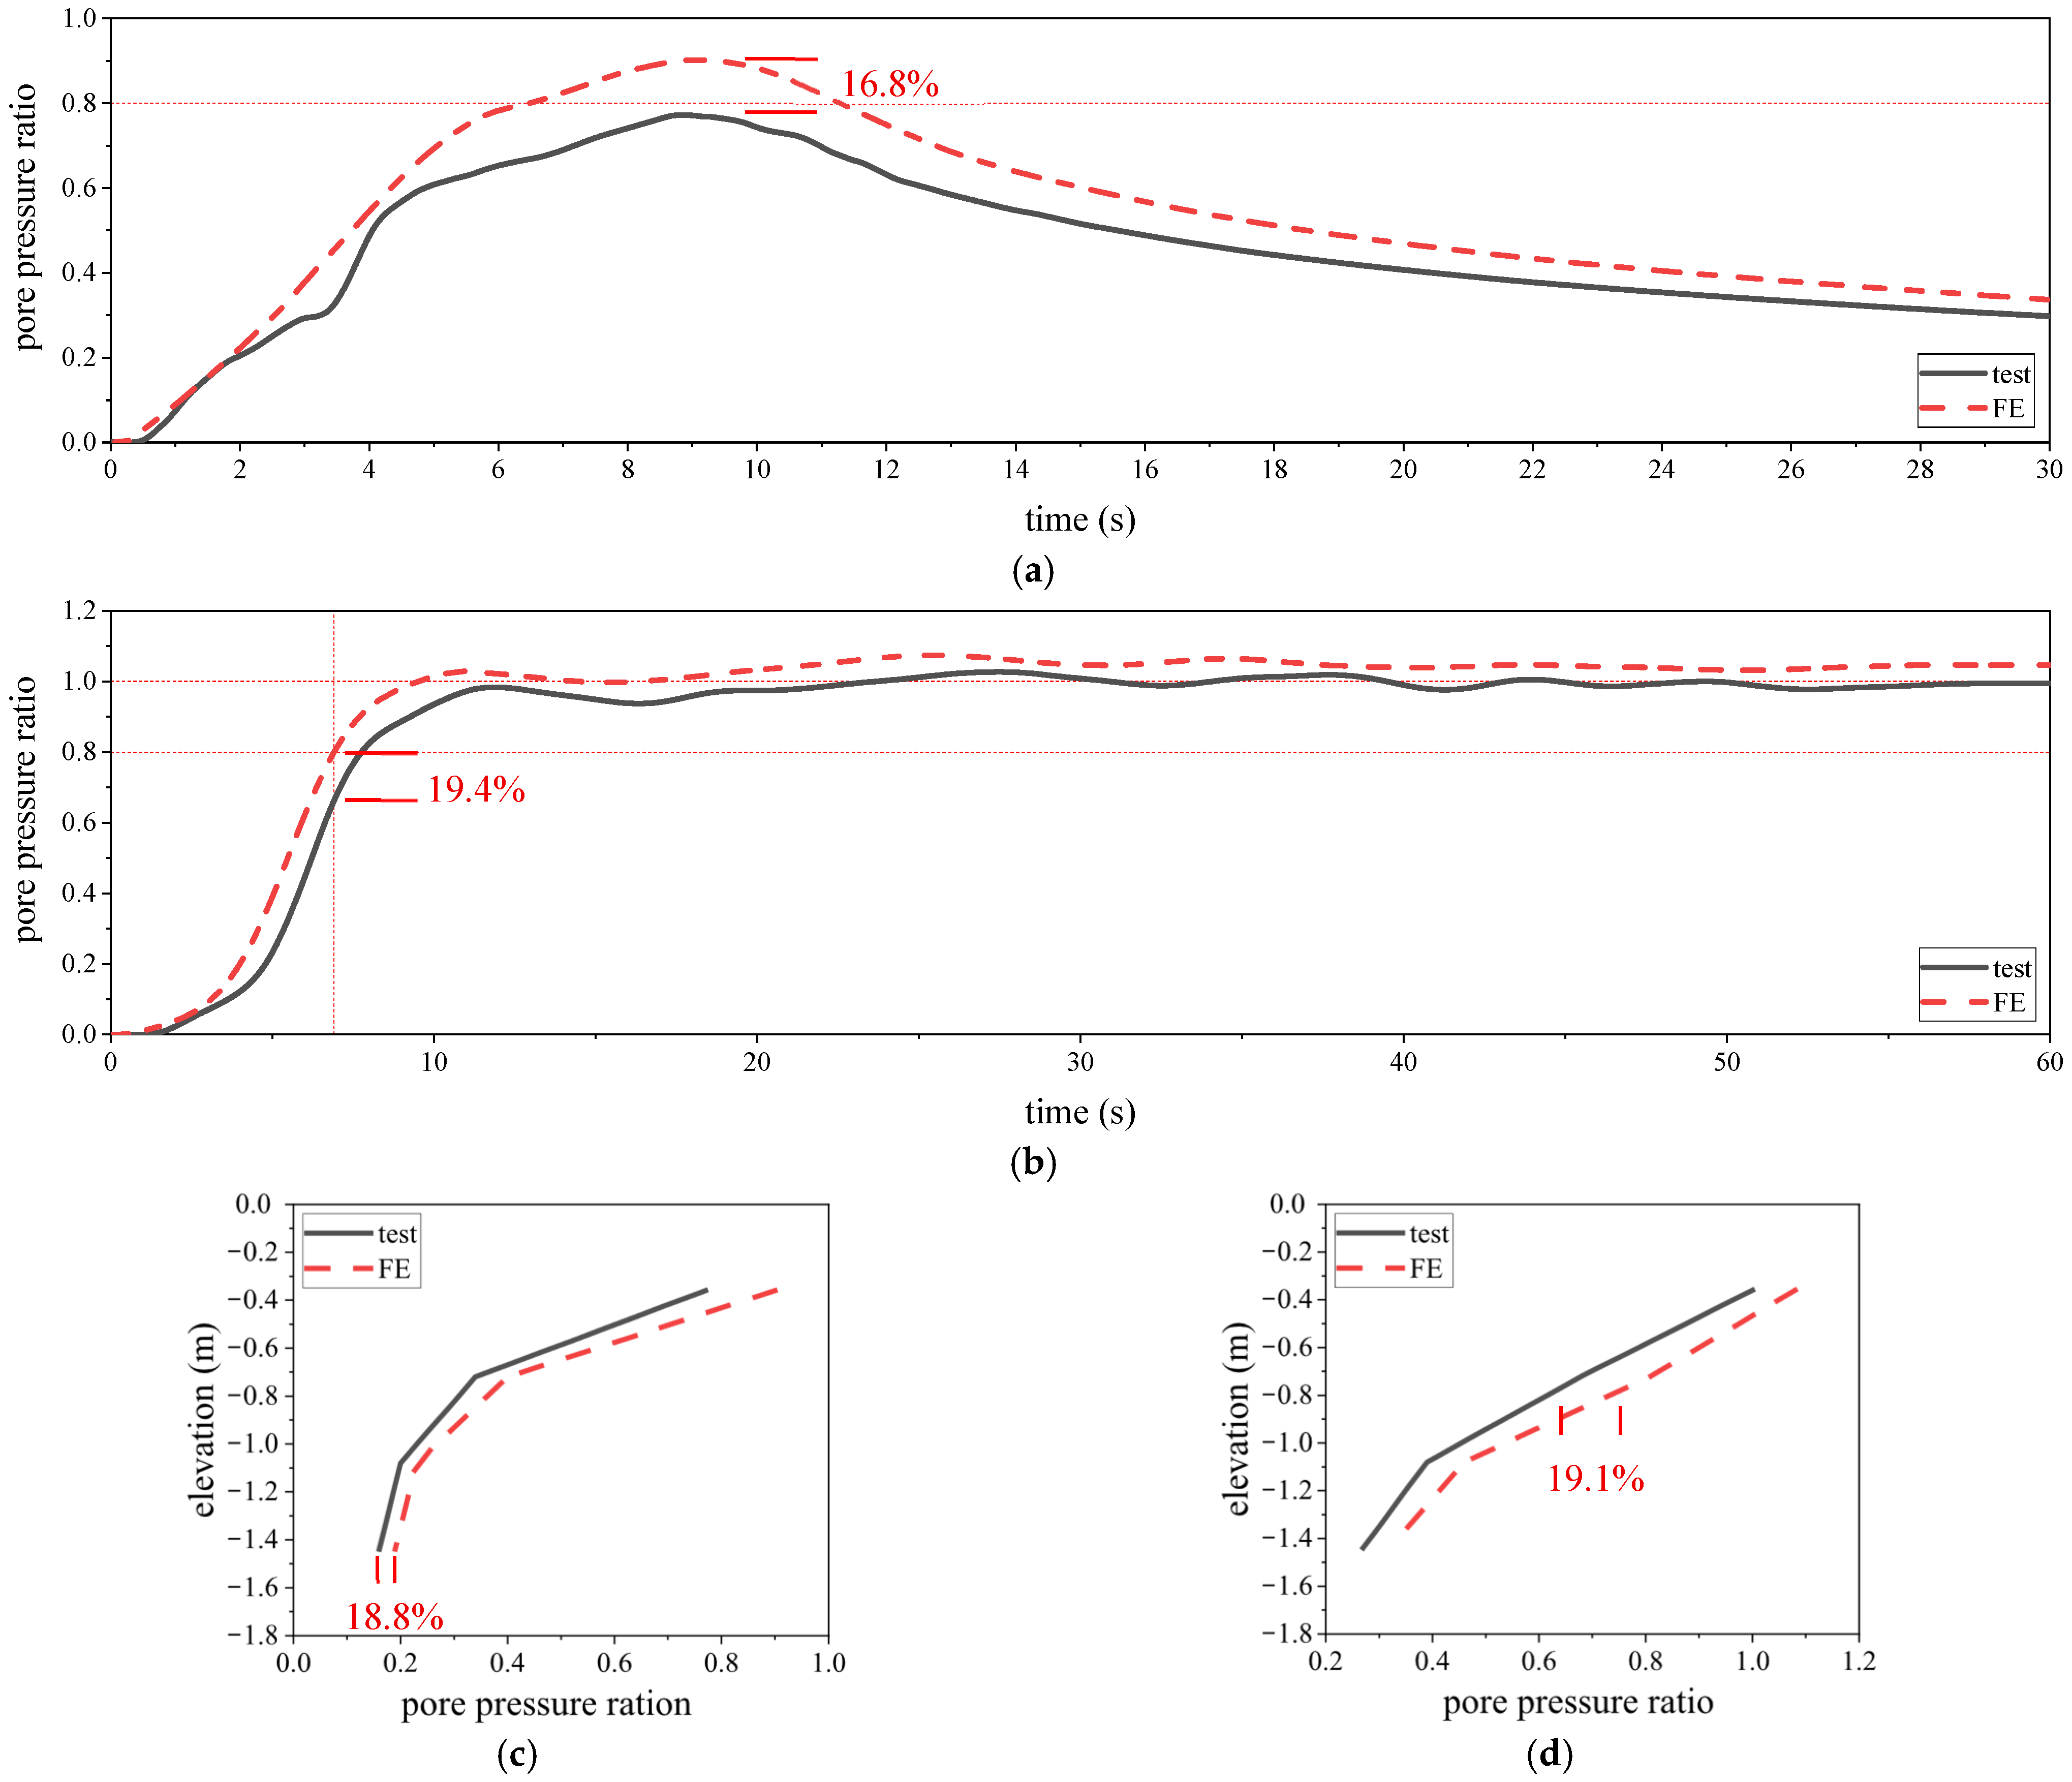
The numerical results of the finite element models were compared with the shaking table test data. Specifically, comparisons of the pore pressure ratio time histories and maximum pore pressure ratios at different depths under the 0.4 g Kobe wave condition (Pile1(S3)) and 0.64 g Chichi wave condition (Pile1(S5)) of the 1:1 model are presented in Figure 6. It can be observed that the time history curves are in good agreement, and the errors of the maximum pore pressure ratios at different depths are all less than 20%. This verifies that the finite element models are accurate and can be employed for subsequent research and analysis.
Figure 6.
Comparison between finite element simulation results and test results of pore pressure ratio: (a) pore pressure ratio time histories under 0.4 g Kobe wave at −0.36 m; (b) pore pressure ratio time histories under 0.64 g Chichi wave at −0.36 m; (c) at different depths under 0.4 g Kobe wave; (d) at different depths under 0.64 g Chichi wave.
4. Numerical Analysis of the Liquefaction Similarity Law
4.1. Determination of the Acceleration Similarity Ratio
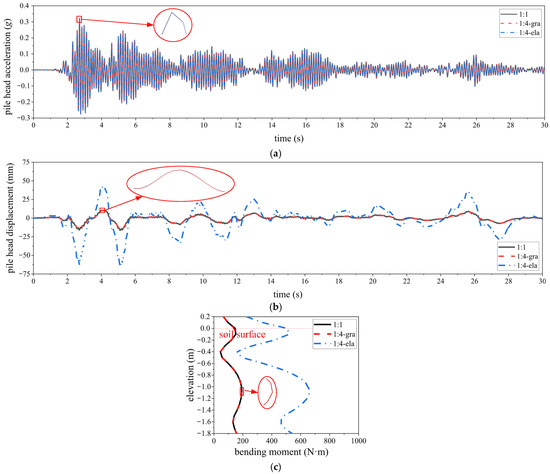
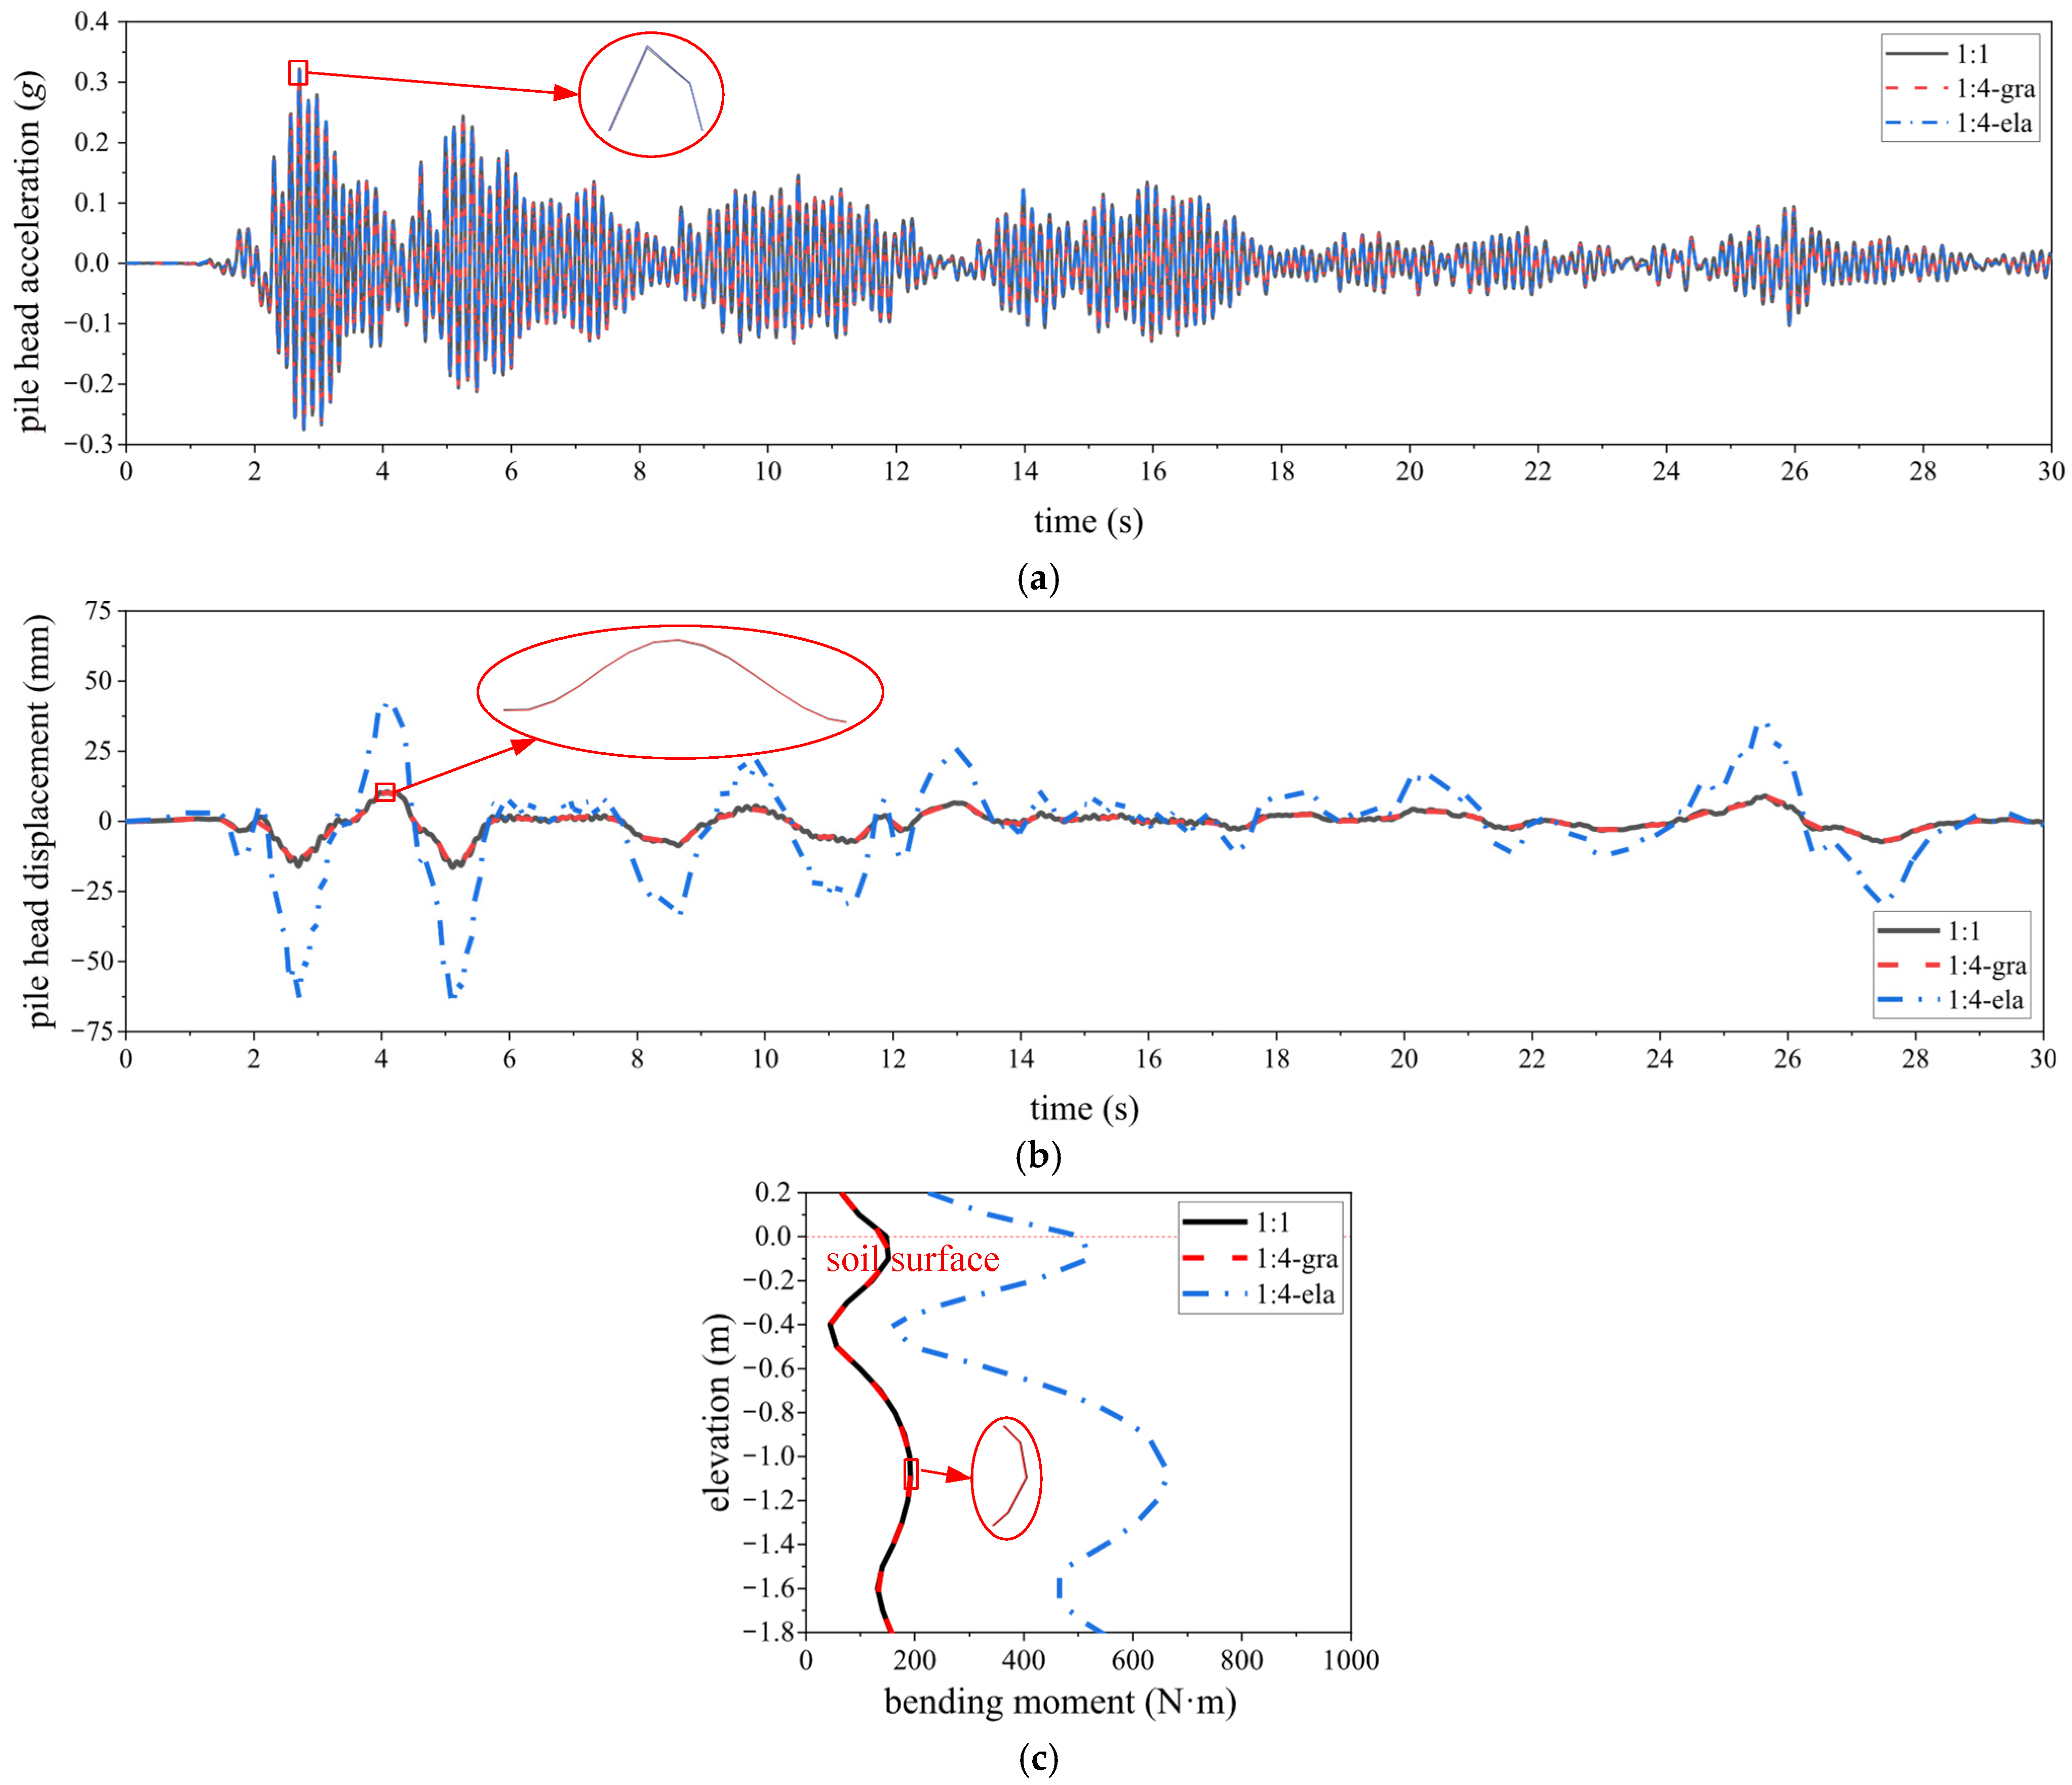
In the proposed similarity law, the similarity requirements for , and have been relaxed. As a result, the acceleration similarity ratio, , differs depending on whether the similarity is established based on gravity or elastic force. Under gravity-based similarity, , whereas under elastic-force-based similarity, , implying that when and , the 1:4 model yields . Then, 1:4 finite element models were developed using acceleration similarity ratios of based on gravity similarity and based on elastic force similarity. Under 0.1 g El Centro excitation, the back-calculated prototype responses from both models are compared in Figure 7.
Figure 7.
Comparison of back-calculated responses using based on gravity similarity and elastic force similarity: (a) pile head accelerations; (b) pile head displacements; (c) pile bending moments.
As shown in Figure 7, when the acceleration similarity ratio, , is determined based on gravity similarity, the prototype’s pile head acceleration, pile head displacement, and pile bending moment responses can be accurately scaled back from the model results. In contrast, when is determined based on elastic force similarity, although the prototype’s pile head acceleration can still be reasonably estimated, the pile head displacement and pile bending moment responses are significantly overestimated. Specifically, the peak displacement at the pile head exhibits an error of 300.17%, and the maximum bending moment along the pile reaches an error of 235.19%. These results suggest that the acceleration similarity ratio should be determined based on gravity similarity, i.e., adopting .
A further analysis of the method for determining based on elastic force similarity shows that is derived from the assumption that the similarity ratio of the pile’s inertial force is equal to that of the pile’s elastic restoring force. However, in reality, due to the limited mass of the pile itself, its inertial force contributes minimally to the dynamic response of the soil–pile interaction system. This is evident from the derivation results of the proposed similarity law in Table 1, which does not require similarity in pile density. The experimental results in Section 2.2 and the numerical results in Section 4 further confirm that, despite the lack of pile mass similarity, the model responses can accurately predict the prototype responses. In fact, the dominant contribution comes from the inertial force of the superstructure. When is derived based on the assumption that the similarity ratio of the superstructure’s inertial force is equal to that of the pile’s elastic restoring force, from , the relationship can be obtained, where and are the superstructure’s mass and density, respectively, and is the pile curvature. When the similarity ratio of the superstructure’s density is , or when an additional artificial mass is added to achieve , the result obtained is , which is consistent with the outcome derived from gravity similarity.
In summary, when applying the proposed similarity law, should be chosen, as this value satisfies both gravity similarity and approximately satisfies elastic force similarity.
4.2. Comparative Analysis with the Artificial Mass Similarity Law
This section aims to verify the advantages of the proposed liquefaction similarity law by comparing the accuracy of prototype response prediction derived from the proposed similarity law and existing similarity laws. Among the existing classical similarity laws, the artificial mass similarity law is generally regarded as a relatively comprehensive and accurate one since it can realize the equivalence of the similarity ratios of inertial force, gravity and elastic force by adding artificial masses. Therefore, a comparative analysis is conducted between the proposed similarity law and the artificial mass similarity law, covering two scenarios: the case where there is no error in the dynamic shear modulus of the model soil and the case where such an error exists.
4.2.1. When There Is No Error in the Dynamic Shear Modulus of the Model Soil
Finite element models with scales of 1:1 and 1:4 are established. For the 1:4 models, no errors are introduced into the dynamic shear modulus of the model soil, and the model design is performed in accordance with the proposed similarity law and the artificial mass similarity law, respectively.
In the proposed similarity law, the similarity requirements for the pile’s elastic modulus , wall thickness and density can be relaxed, with only the similarity requirement for the pile’s bending stiffness needing to be satisfied. In this study, the model piles are designed by keeping the pile material unchanged and adjusting to meet the similarity requirement of . Accordingly, the relationships , and are derived, from which the value of for the model pile can be determined. Consequently, the mass of the 1:4 model pile is calculated to be 0.09 kg.
In the artificial mass similarity law, it is necessary to compensate for the mass loss of the model pile. The ideal dimensional analysis similarity law yields the relationships , and , from which the ideal mass of the 1:4 model pile is calculated to be 0.36 kg. It can thus be seen that for the model design adopting the proposed similarity law, the mass loss of the pile is 0.36 kg − 0.09 kg = 0.27 kg, which needs to be compensated for in the artificial mass similarity law. In shaking table tests on soil–pile interaction, since it is difficult to attach additional masses to the pile shaft, artificial masses are generally attached to the pile head [3]. For the model design using the proposed similarity law, the superstructure mass at the pile head of the 1:4 model is 3.67 kg. Therefore, for the model design adopting the artificial mass similarity law, the total mass at the pile head of the 1:4 model is the sum of 3.67 kg (superstructure mass) and 0.27 kg (artificial mass to compensate for pile mass loss), resulting in a total of 3.94 kg.
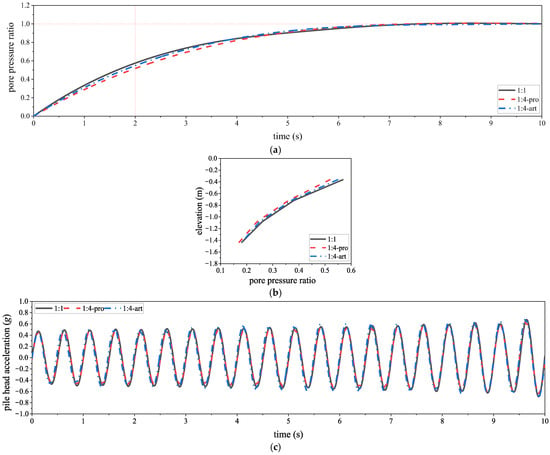
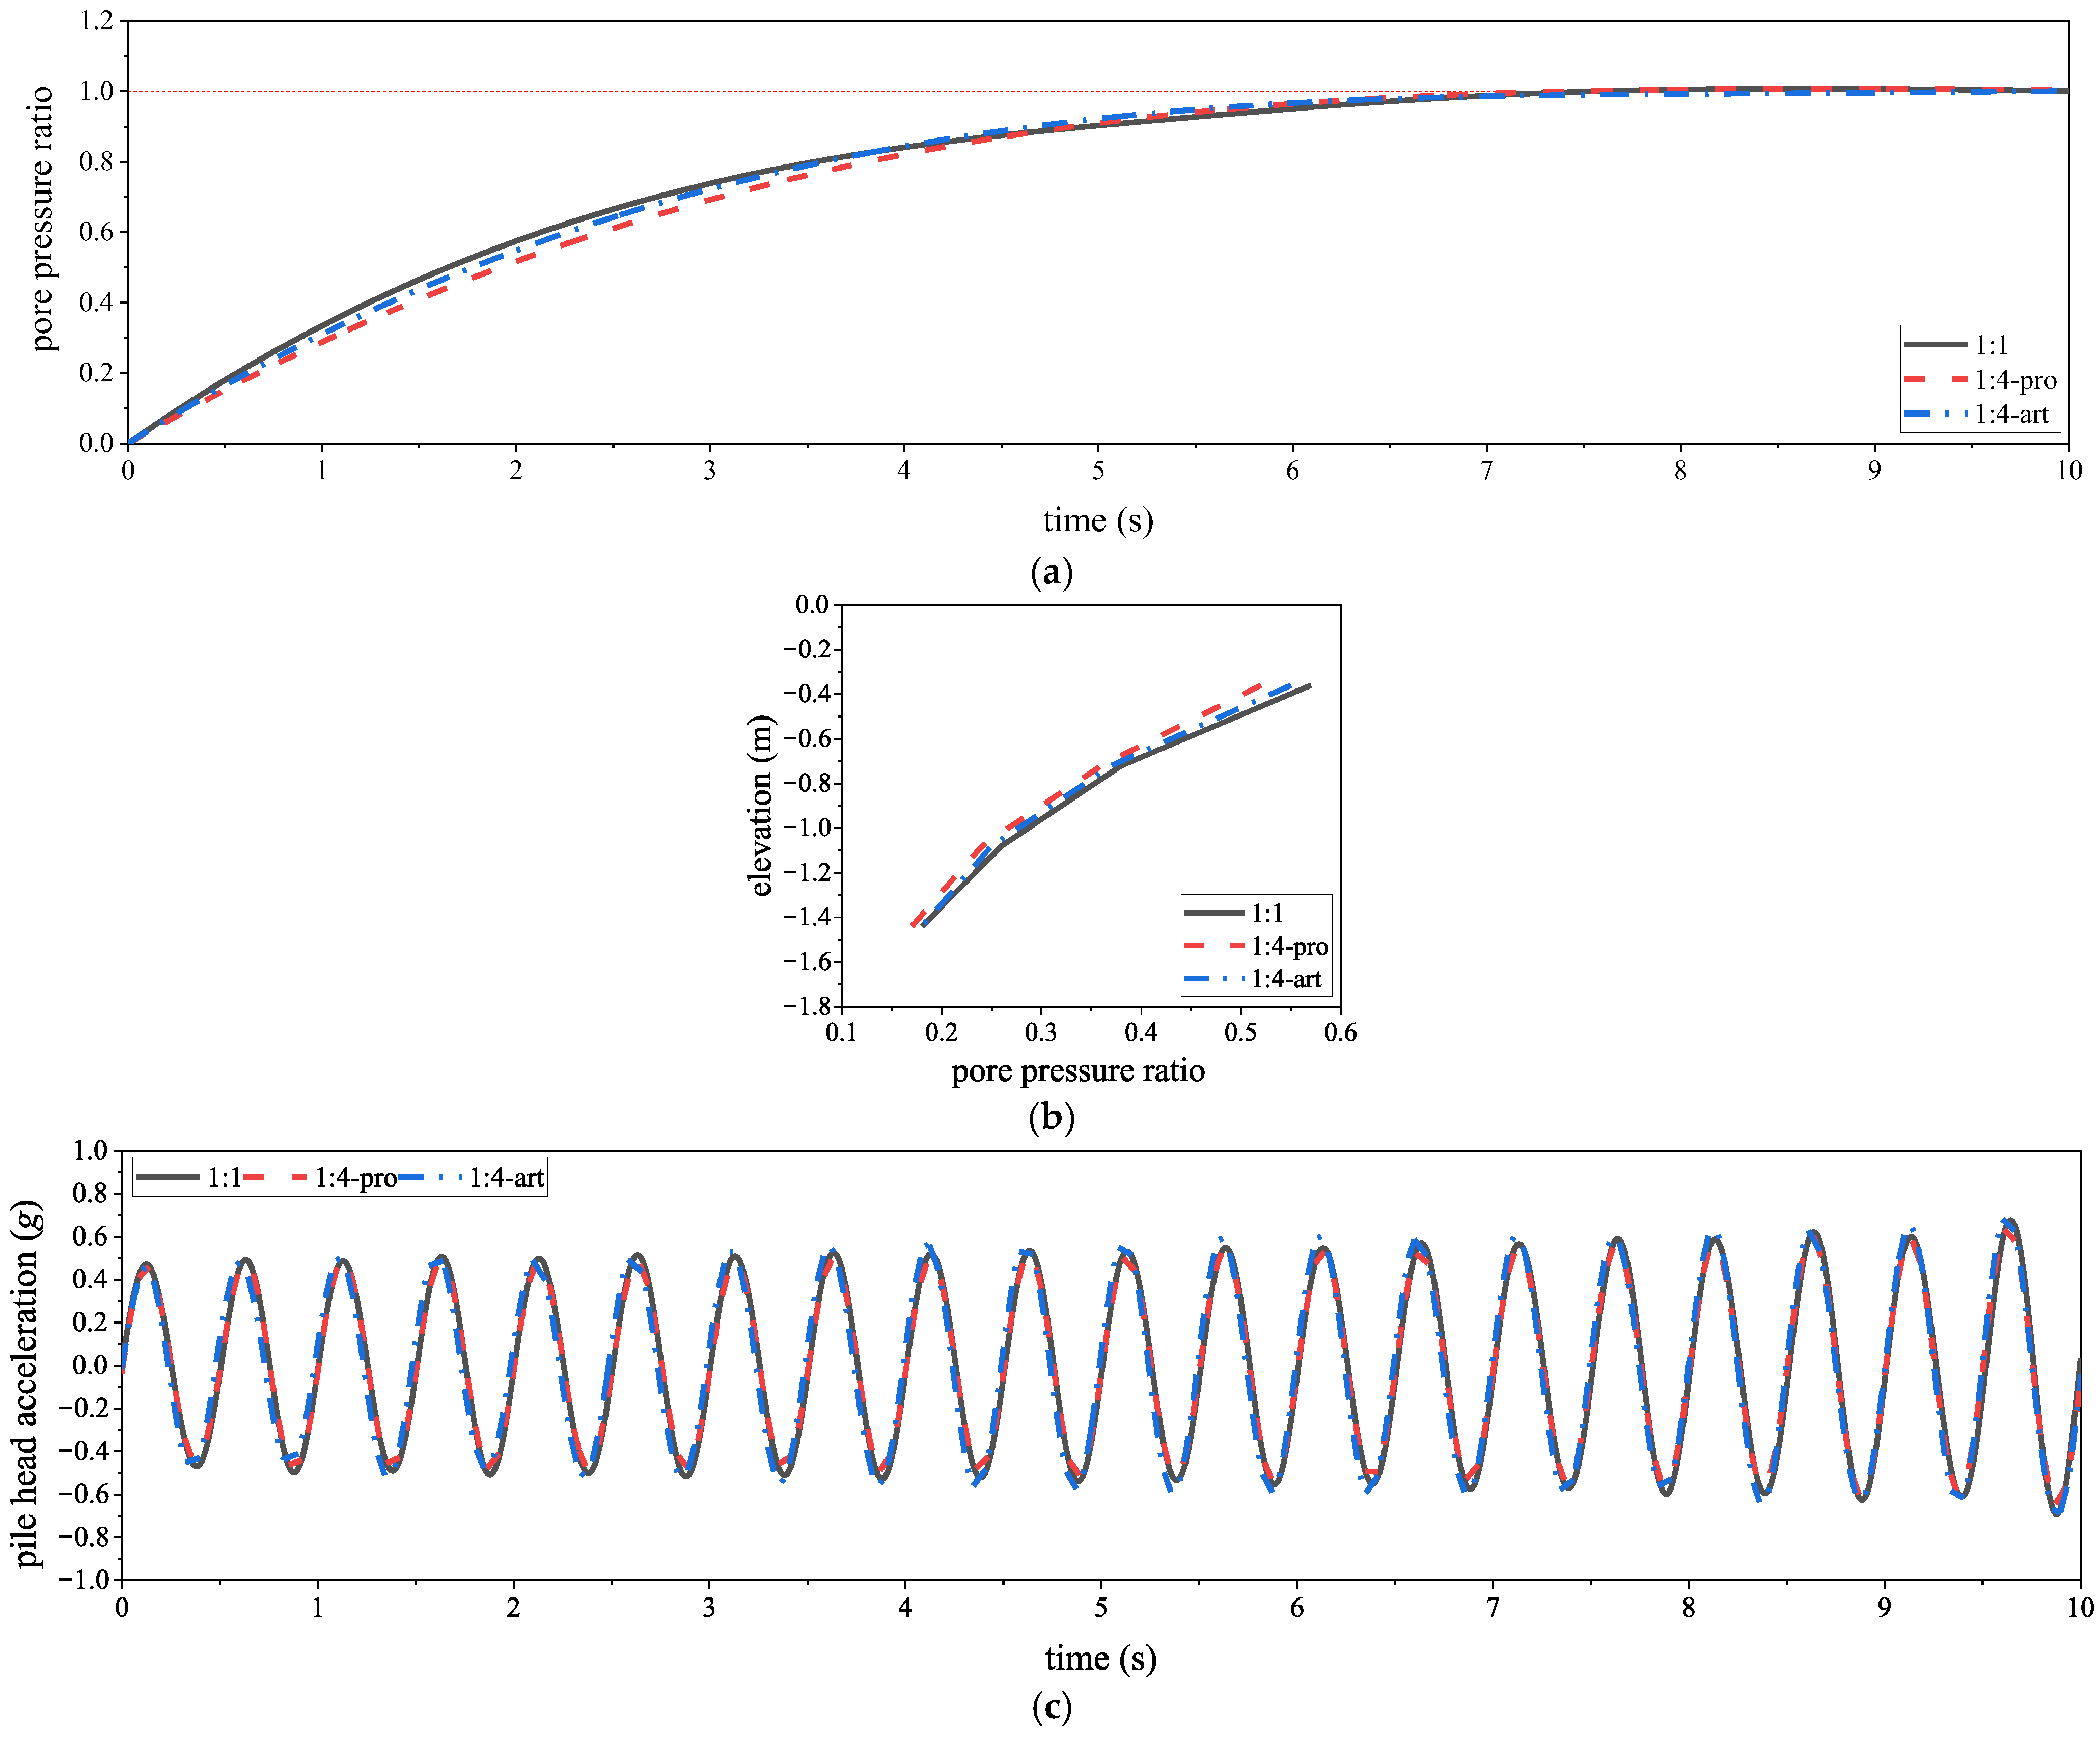
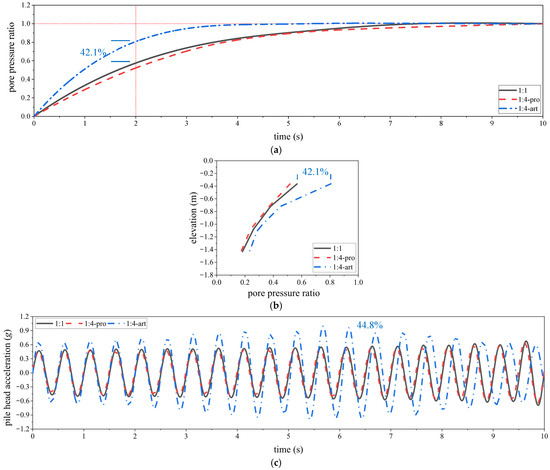
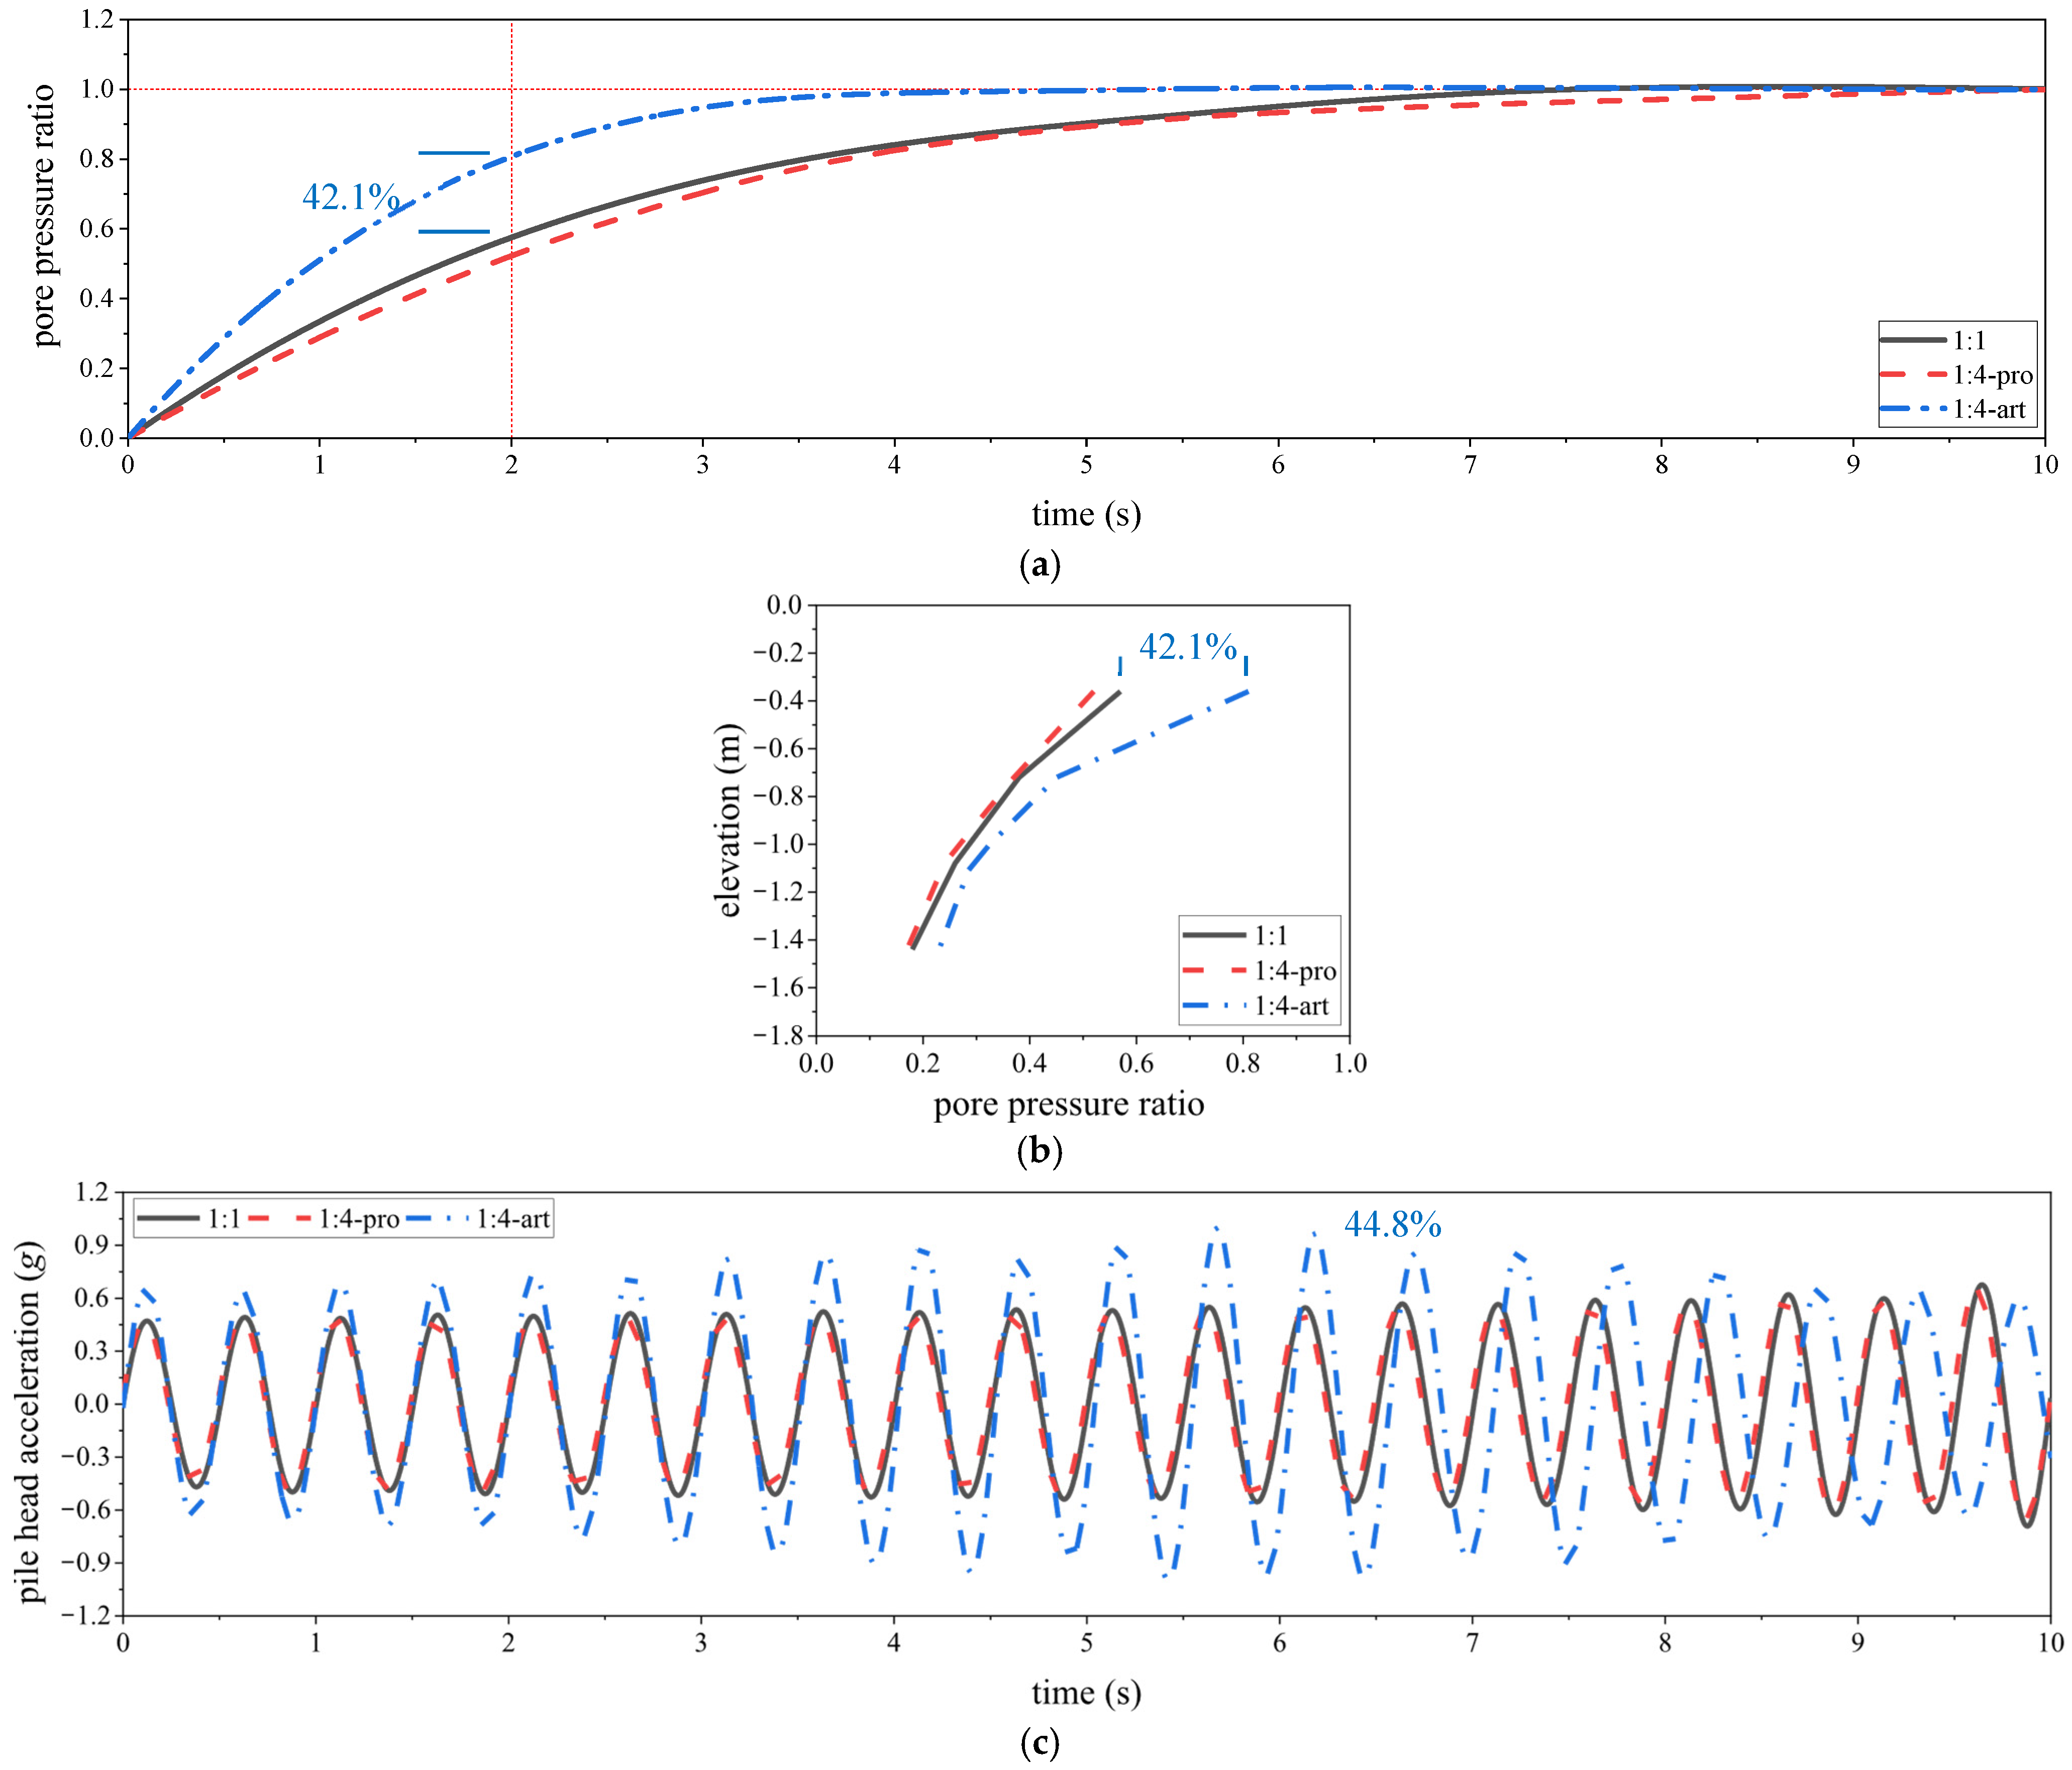
When loaded with a 0.4 g sine wave (frequency: 2 Hz) and in the case of no error in the dynamic shear modulus of the model soil, the comparison results of the prototype responses back-calculated by the proposed similarity law and the artificial mass similarity law are shown in Figure 8.
Figure 8.
Comparison of back-calculated responses using the proposed and artificial mass similarity laws when there is no error in Gs: (a) Pore pressure ratio time histories (elevation: −0.36 m); (b) Pore pressure ratios at different depths (time: 2 s); (c) Pile head accelerations.
It can be seen from Figure 8 that both the proposed similarity law and the artificial mass similarity law can accurately back-calculate the prototype liquefaction responses, with all response errors not exceeding 10%. As indicated in Figure 8c, for the pile head acceleration response, the artificial mass similarity law will lead to a slight overestimation of the back-calculated prototype response. The reason is that, as demonstrated by the theoretical analysis in Section 2.1, the pile mass does not affect the pile head dynamic ground impedance or the foundation input motion. However, concentrating the uniformly lost mass of the pile shaft and attaching it to the pile head is inconsistent with the actual situation. The increased pile head mass will, in turn, lead to a larger inertial force at the pile head, thereby increasing the pile head acceleration. The more intense soil–pile dynamic interaction caused by this phenomenon accelerates the growth of pore pressure in the soil, which, to a certain extent, reduces the error in the back-calculated pore pressure ratio (as shown in Figure 8a,b. The cause of this error lies in the fact that, with decreasing geometric similarity ratio, the soil layer thickness becomes smaller, resulting in faster pore pressure dissipation and slightly slower accumulation of the excess pore pressure ratio. Under short-duration seismic excitation, the soil can be approximately considered to be under an undrained condition. Therefore, this error is relatively small during the pore pressure ratio accumulation stage but becomes more pronounced during the pore pressure ratio dissipation stage [19]. A detailed quantitative analysis of this error is presented in Section 4.3.4.
In summary, when there is no error in the dynamic shear modulus of the model soil, both the proposed similarity law and the artificial mass similarity law can accurately back-calculate the prototype liquefaction responses. This indicates that when designing scaled models using the proposed similarity law, the pile mass loss caused by relaxing the similarity requirements for , and does not affect the accuracy of back-calculating the prototype liquefaction responses, and thus there is no need to compensate for it by attaching artificial masses.
4.2.2. When There Is an Error in the Dynamic Shear Modulus of the Model Soil
Finite element models with scales of 1:1 and 1:4 are established. For the 1:4 model, an error of −30% is introduced into the dynamic shear modulus of the model soil, and the scaled model design is carried out in accordance with the proposed similarity law and the artificial mass similarity law.
When designing the 1:4 model according to the proposed similarity law, considering the dynamic shear modulus error of the model soil, the excitation frequency is adjusted to , the pile bending stiffness to , the input acceleration amplitude to , and the pile head mass to and the pore pressure energy-based model parameter to (when the soil dynamic shear modulus error is −30%, ) so that the model liquefaction responses still satisfy similarity.
When designing the 1:4 model using the traditional artificial mass similarity law, there is no way to correct the influence caused by the dynamic shear modulus error of the model soil. Therefore, the dynamic shear modulus error of the model soil is neglected, and the pile head mass is set as the sum of 3.67 kg (superstructure mass) and 0.27 kg (artificial mass to compensate for pile mass loss), resulting in a total of 3.94 kg. The values of the other physical quantities are determined in accordance with the dimensional analysis similarity law that does not account for the dynamic shear modulus error of the model soil.
When loaded with a 0.4 g sine wave (frequency: 2 Hz) and in the case of a −30% error in the dynamic shear modulus of the model soil, the comparison results of the prototype responses back-calculated by the proposed similarity law and the artificial mass similarity law are shown in Figure 9.
Figure 9.
Comparison of back-calculated responses using the proposed and artificial mass similarity laws when there is an error in Gs: (a) pore pressure ratio time histories (elevation: −0.36 m); (b) pore pressure ratios at different depths (time: 2 s); (c) pile head accelerations.
It can be seen from Figure 9 that when there is an error in the dynamic shear modulus of the model soil, the back-calculated response curves obtained from the scaled model designed with the proposed similarity law are basically consistent with the prototype curves, with no errors exceeding 10%. In contrast, the back-calculated responses derived from the scaled model designed with the artificial mass similarity law show significant errors relative to the prototype responses. Specifically, the pore pressure ratio error at −0.36 m depth at the time of 2 s amounts to 42.1%, and the pile head peak acceleration error amounts to 44.8%. As indicated in Section 4.2.1, since the added artificial mass is relatively small, the artificial mass distribution method introduces a certain error, but its impact is limited. The primary source of error in the artificial mass similarity law lies in its inability to eliminate the influence of errors in the dynamic shear modulus of the model soil. From Section 2.1.1, it is understood that errors in the dynamic shear modulus lead to inaccuracies in both the dynamic ground impedance and the foundation input motion, and errors in the dynamic ground impedance and foundation input motion both contribute significantly to inaccuracies in the back-calculated prototype liquefaction responses [19].
In summary, when there is an error in the dynamic shear modulus of the model soil, the proposed similarity law is able to accurately back-calculate the prototype liquefaction responses. In contrast, the artificial mass similarity law cannot correct the influence caused by the dynamic shear modulus error of the model soil, resulting in considerable errors in the back-calculated prototype liquefaction responses. This proves the distinct advantage of the proposed similarity law.
4.3. Parameter Analysis
4.3.1. Analysis of Different Superstructure Masses
The superstructure mass is a key factor influencing the soil–pile inertial interaction. To verify the accuracy of the proposed liquefaction similarity law under different superstructure masses and analyze the influence of the dynamic ground impedance similarity on the liquefaction response similarity between the model and the prototype under diverse inertial interaction intensities, a parametric analysis of different superstructure masses is conducted in this section.
In practical engineering, the superstructure mass that a pile can bear is related to the properties of the foundation soil, such as its type and strength. According to the Code for Design of Building Foundation (GB 50007-2011) [30], the characteristic value of the vertical bearing capacity of a single pile can be estimated using the following formula when the pile toe is embedded in intact and relatively intact hard rock:
where is the characteristic value of the vertical bearing capacity of a single pile (kN); is the characteristic value of the rock bearing capacity at the pile toe (kPa); and is the cross-sectional area of the pile toe (m2).
Assuming that the bedrock is slightly weathered hard rock, the maximum superstructure mass that can be supported by the 1:1 model pile is calculated to be 2016 kg.
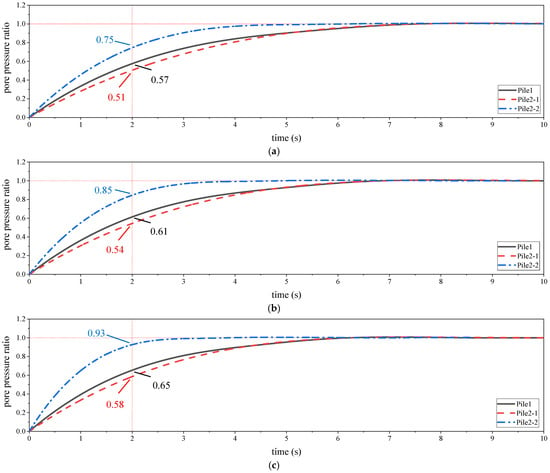
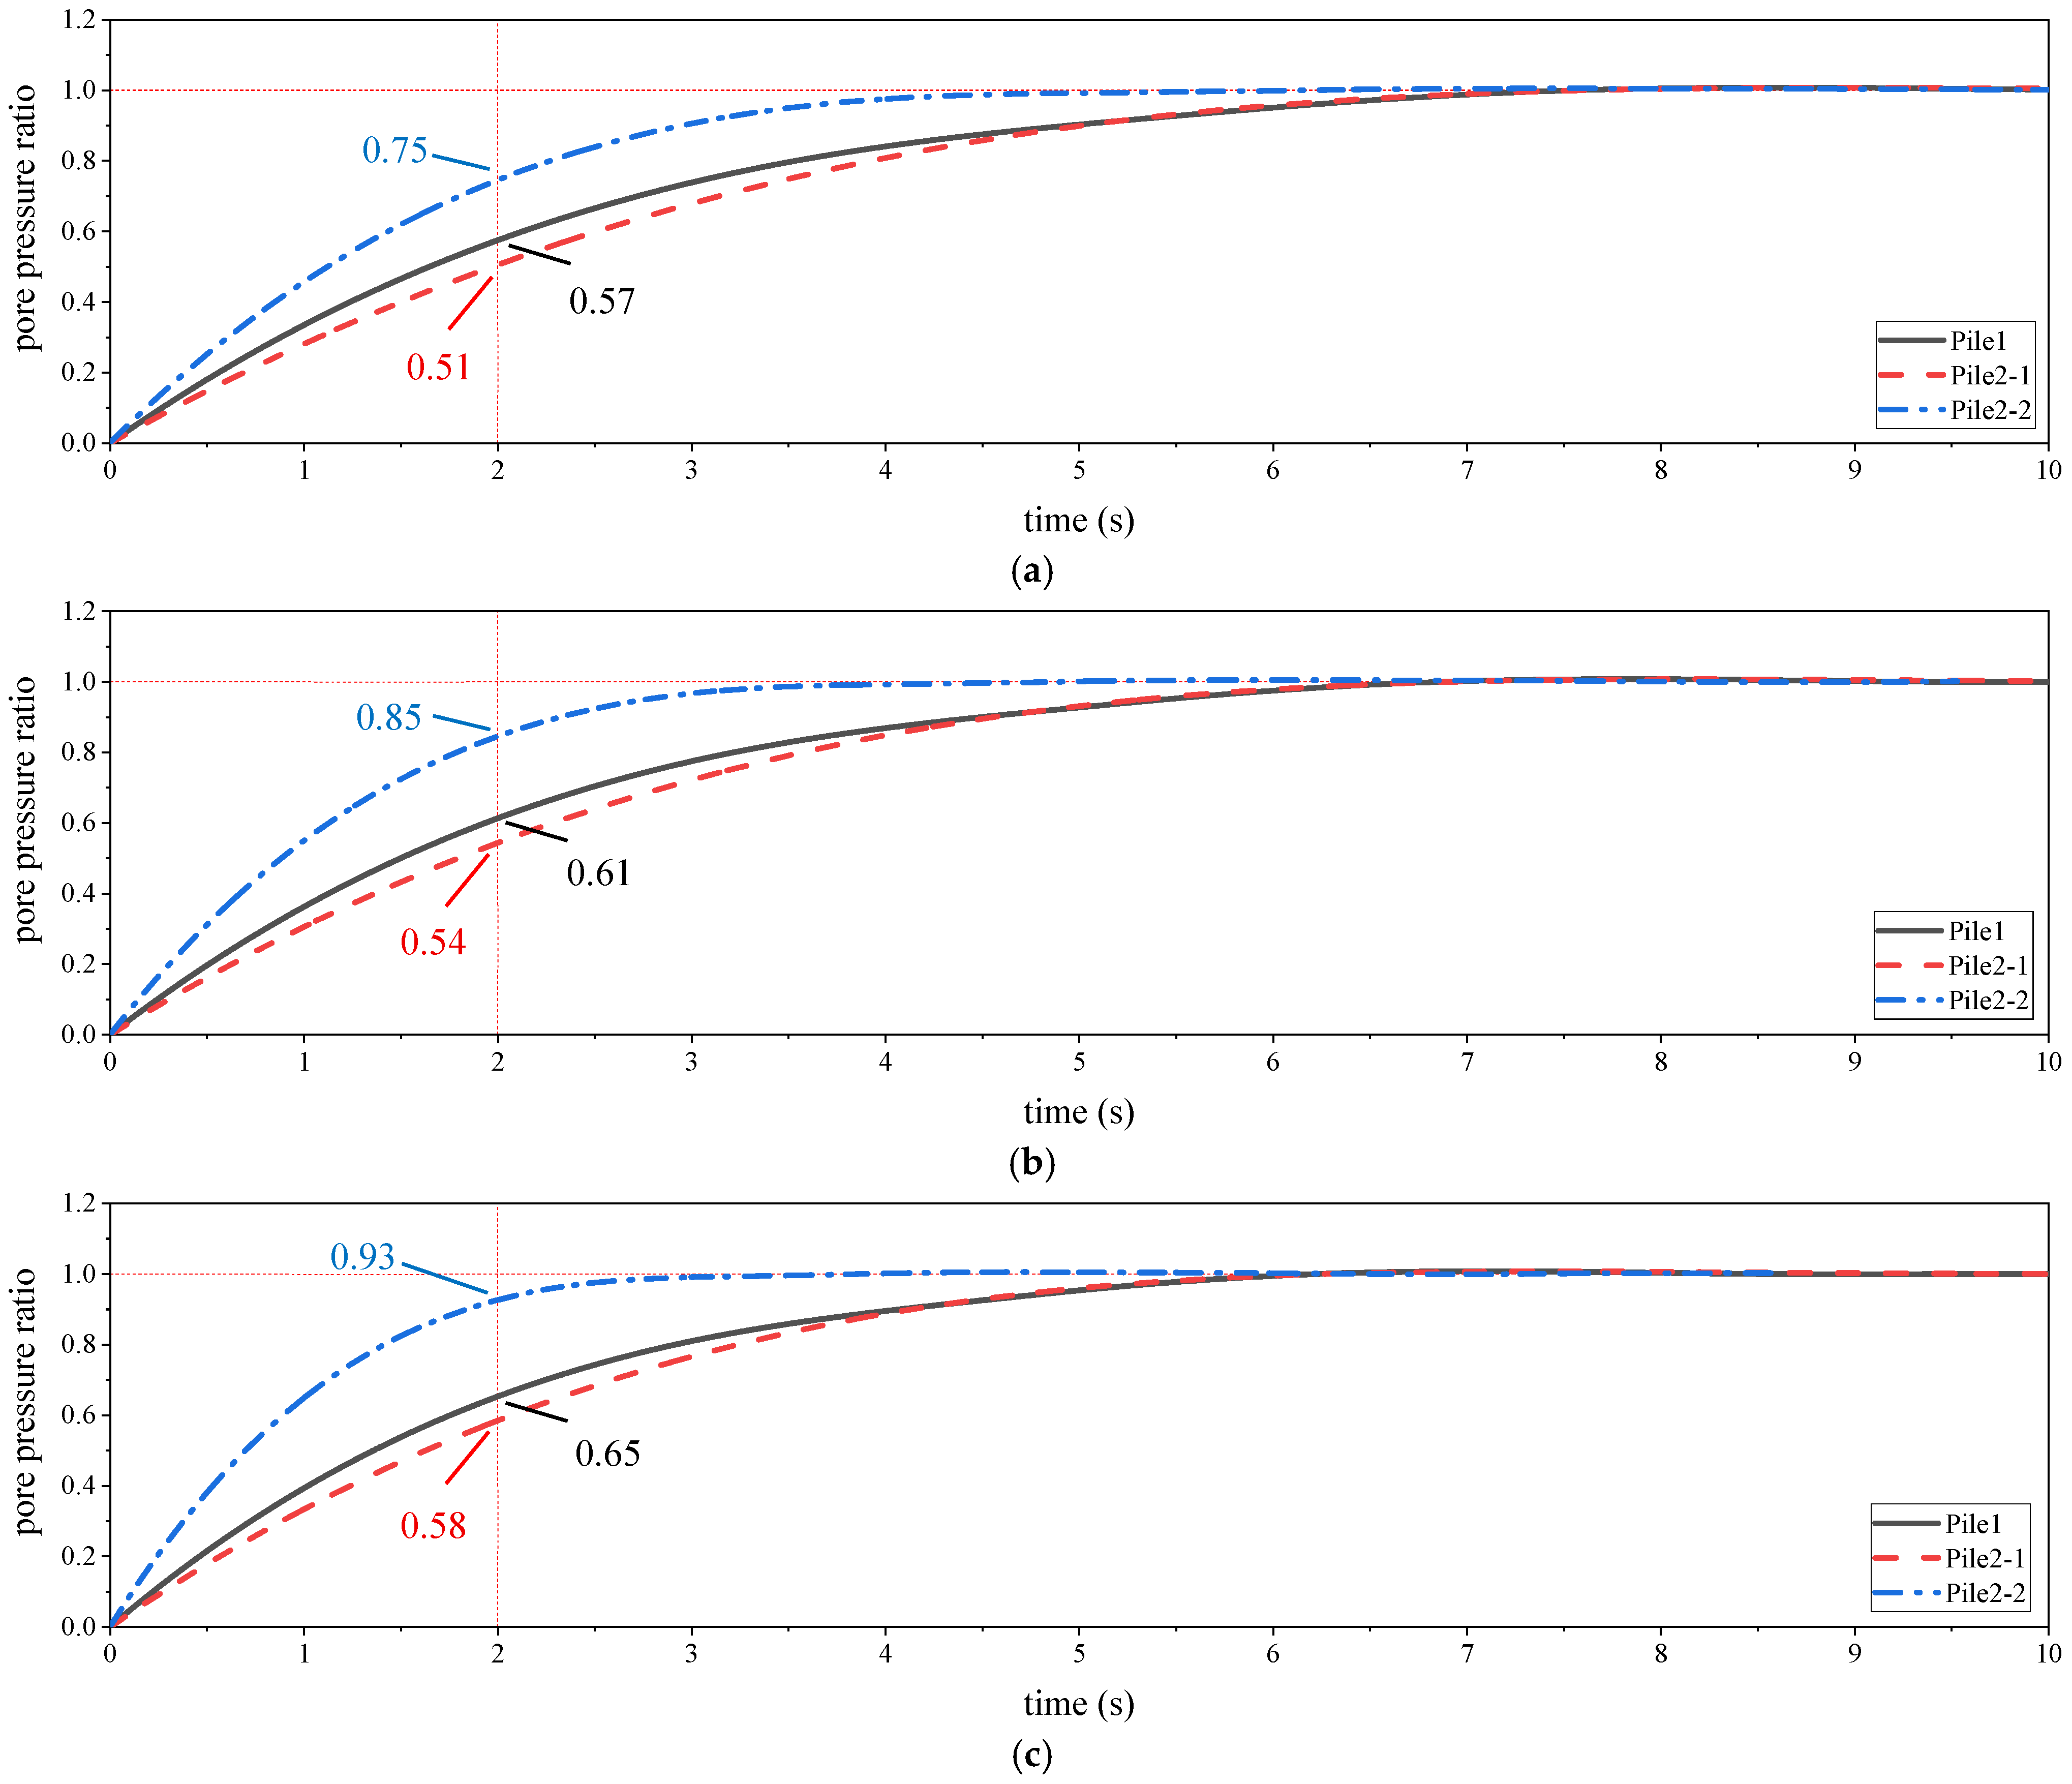
Subsequently, 1:1-scale finite element models and corresponding 1:2-scale finite element models are established by adopting superstructure masses of 235 kg (test value), 940 kg (four times the test value), and 1880 kg (eight times the test value). In the 1:2 models, the dynamic shear modulus error of the model soil is set to −30%, and two piles, namely Pile2-1 (with similar dynamic ground impedance) and Pile2-2 (with dissimilar dynamic ground impedance), as shown in Table 3, are analyzed and compared to study the influence of the similarity of dynamic ground impedance on the similarity of liquefaction responses of the saturated sand–pile dynamic interaction system under different superstructure masses. Under different superstructure masses and with the excitation of a 0.4 g sine wave (frequency: 2 Hz), the comparison results of the liquefaction responses of Pile1 (1:1 model), back-calculated from Pile2-1 and Pile2-2 (1:2 model), are presented in Figure 10, Figure 11 and Figure 12. Specifically, Figure 10 shows the time history curves of pore pressure ratios at a depth of −0.36 m, and Figure 11 shows the distribution curves of pore pressure ratios at different depths at 2 s, which are used to reflect the similarity of the liquefaction process and liquefaction degree of the foundation soil; Figure 12 shows the time history curves of pile head accelerations, which is used to reflect the similarity of pile response during liquefaction.
Figure 10.
Back-calculated pore pressure ratio time histories (elevation: −0.36 m) under different superstructure masses: (a) 235 kg; (b) 940 kg; (c) 1880 kg.
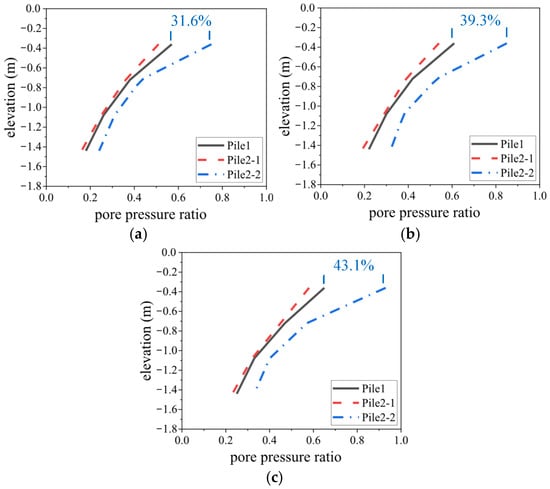
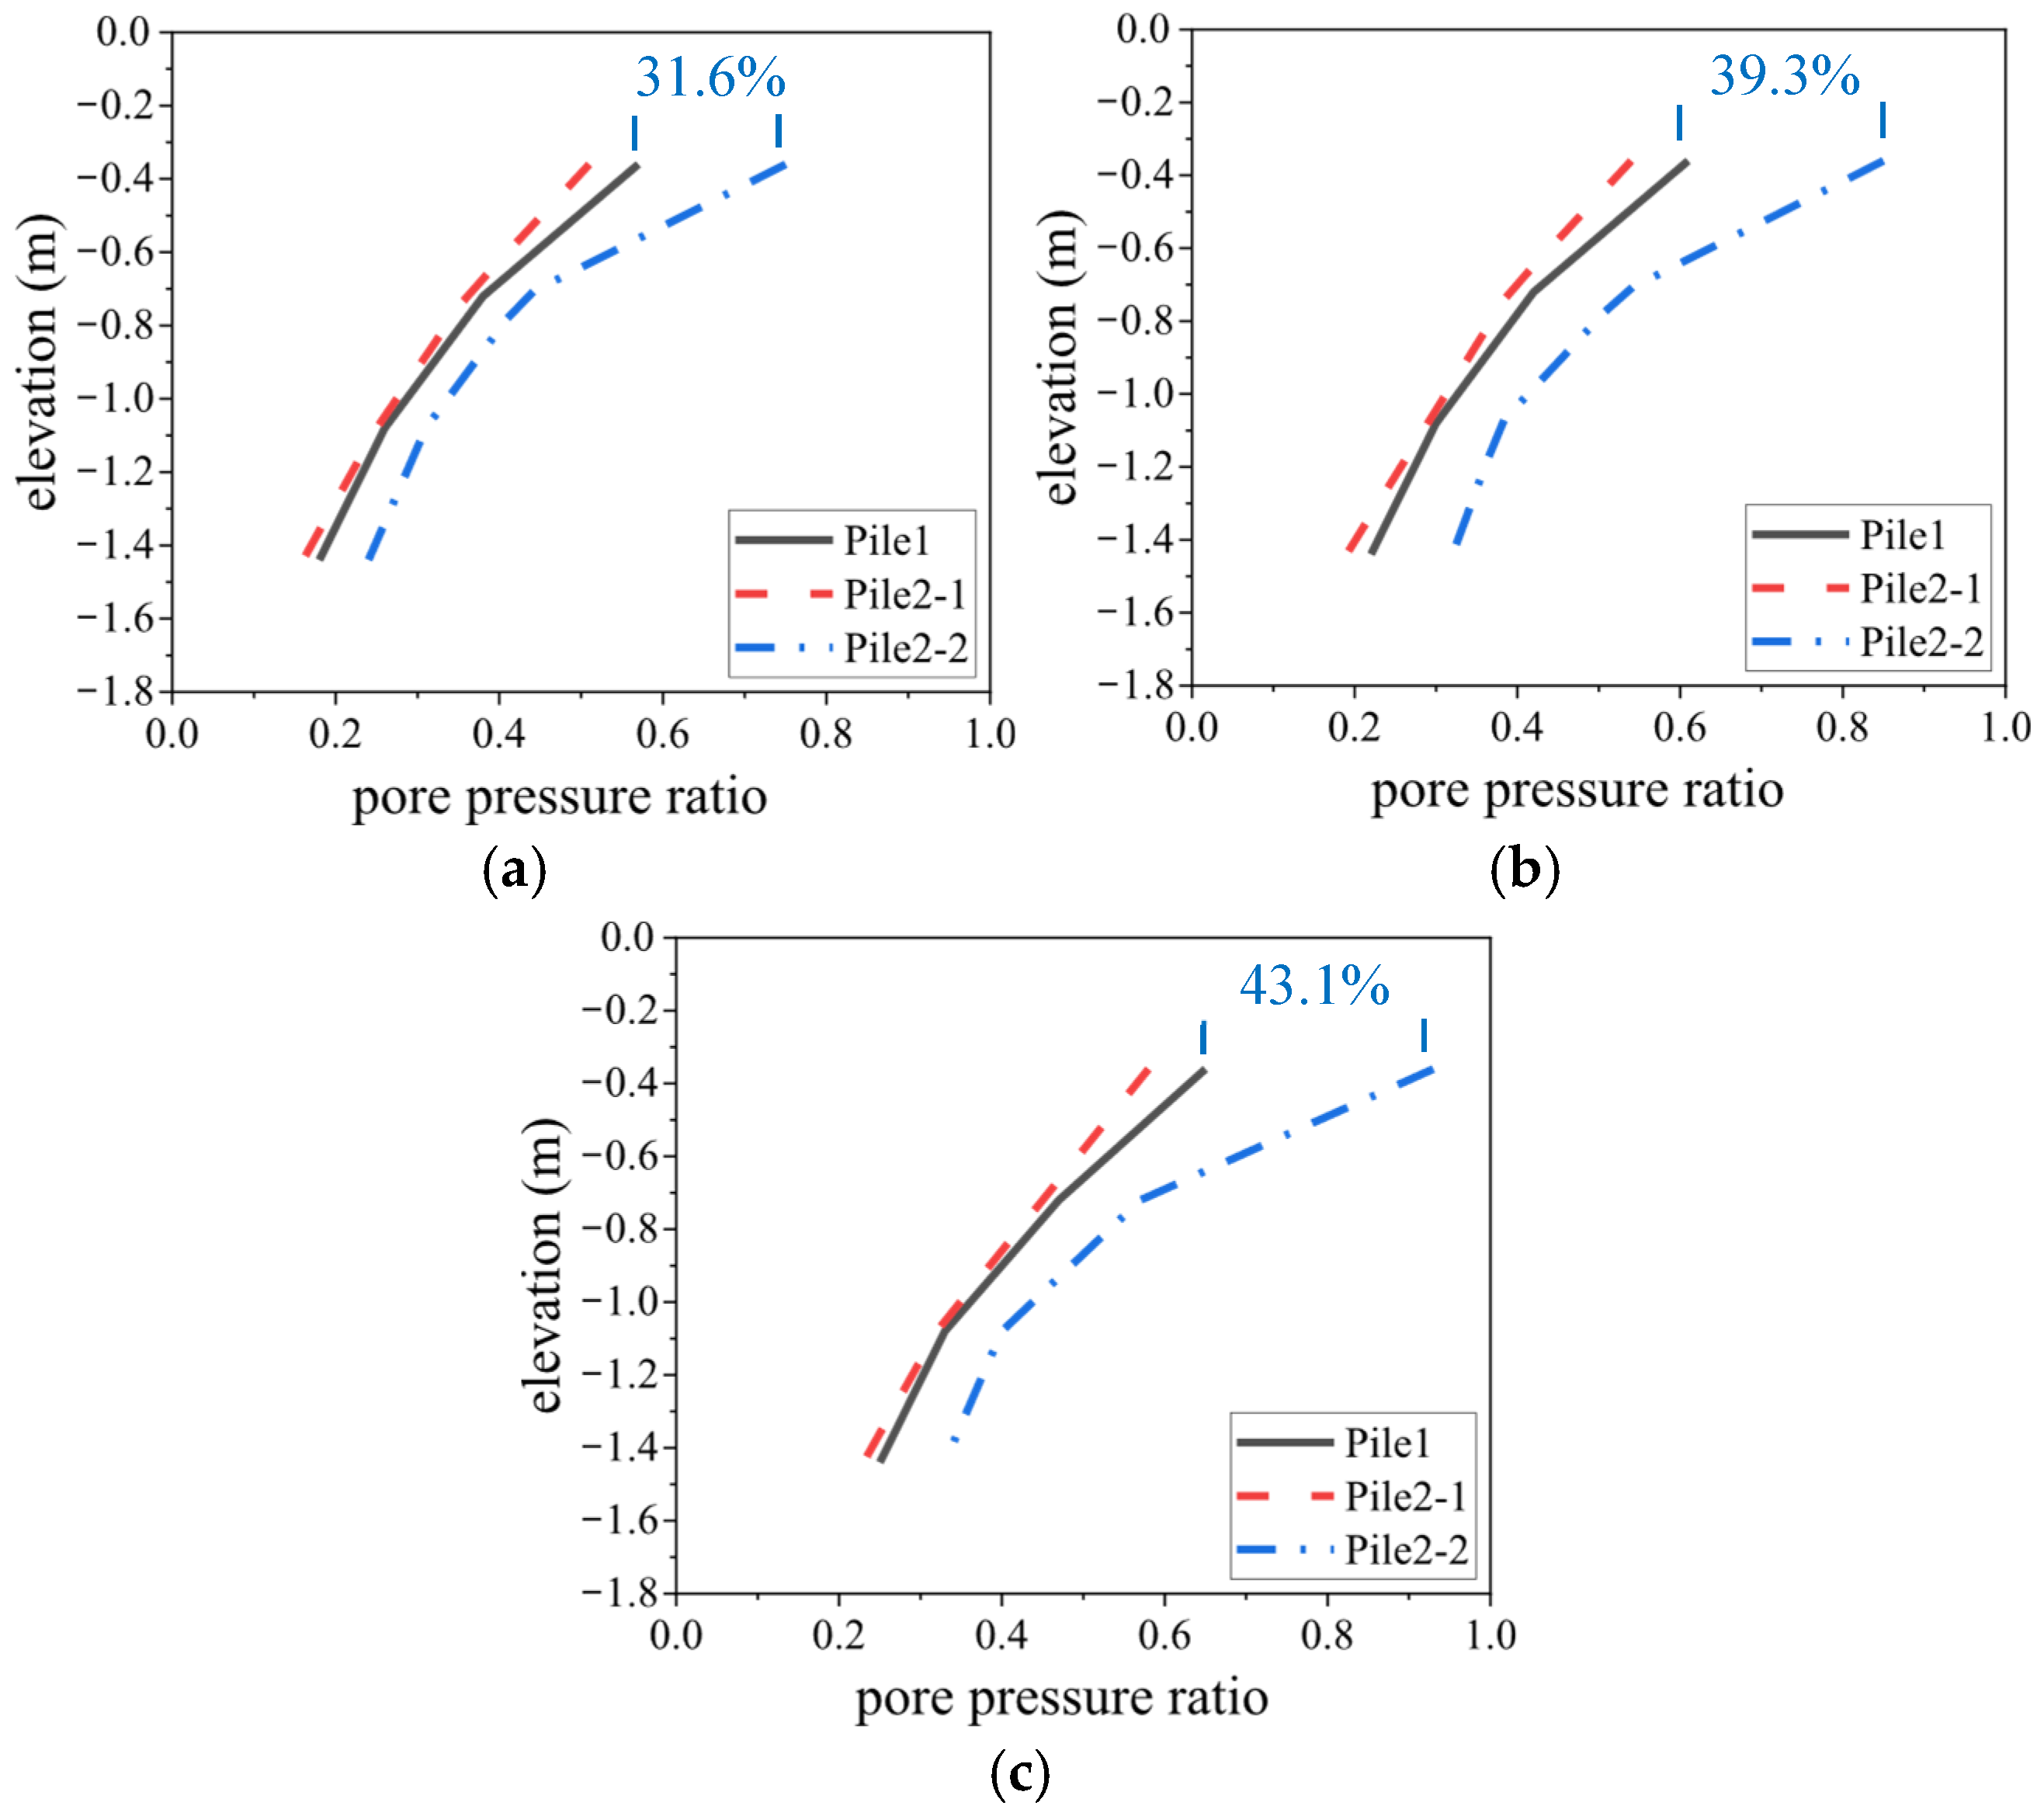
Figure 11.
Back-calculated pore pressure ratios at different depths (time: 2 s) under different superstructure masses: (a) 235 kg; (b) 940 kg; (c) 1880 kg.
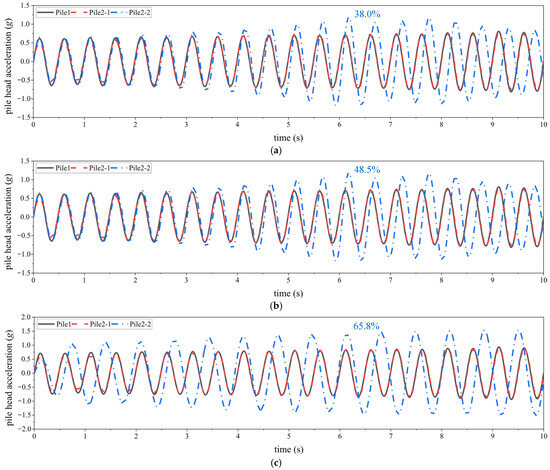
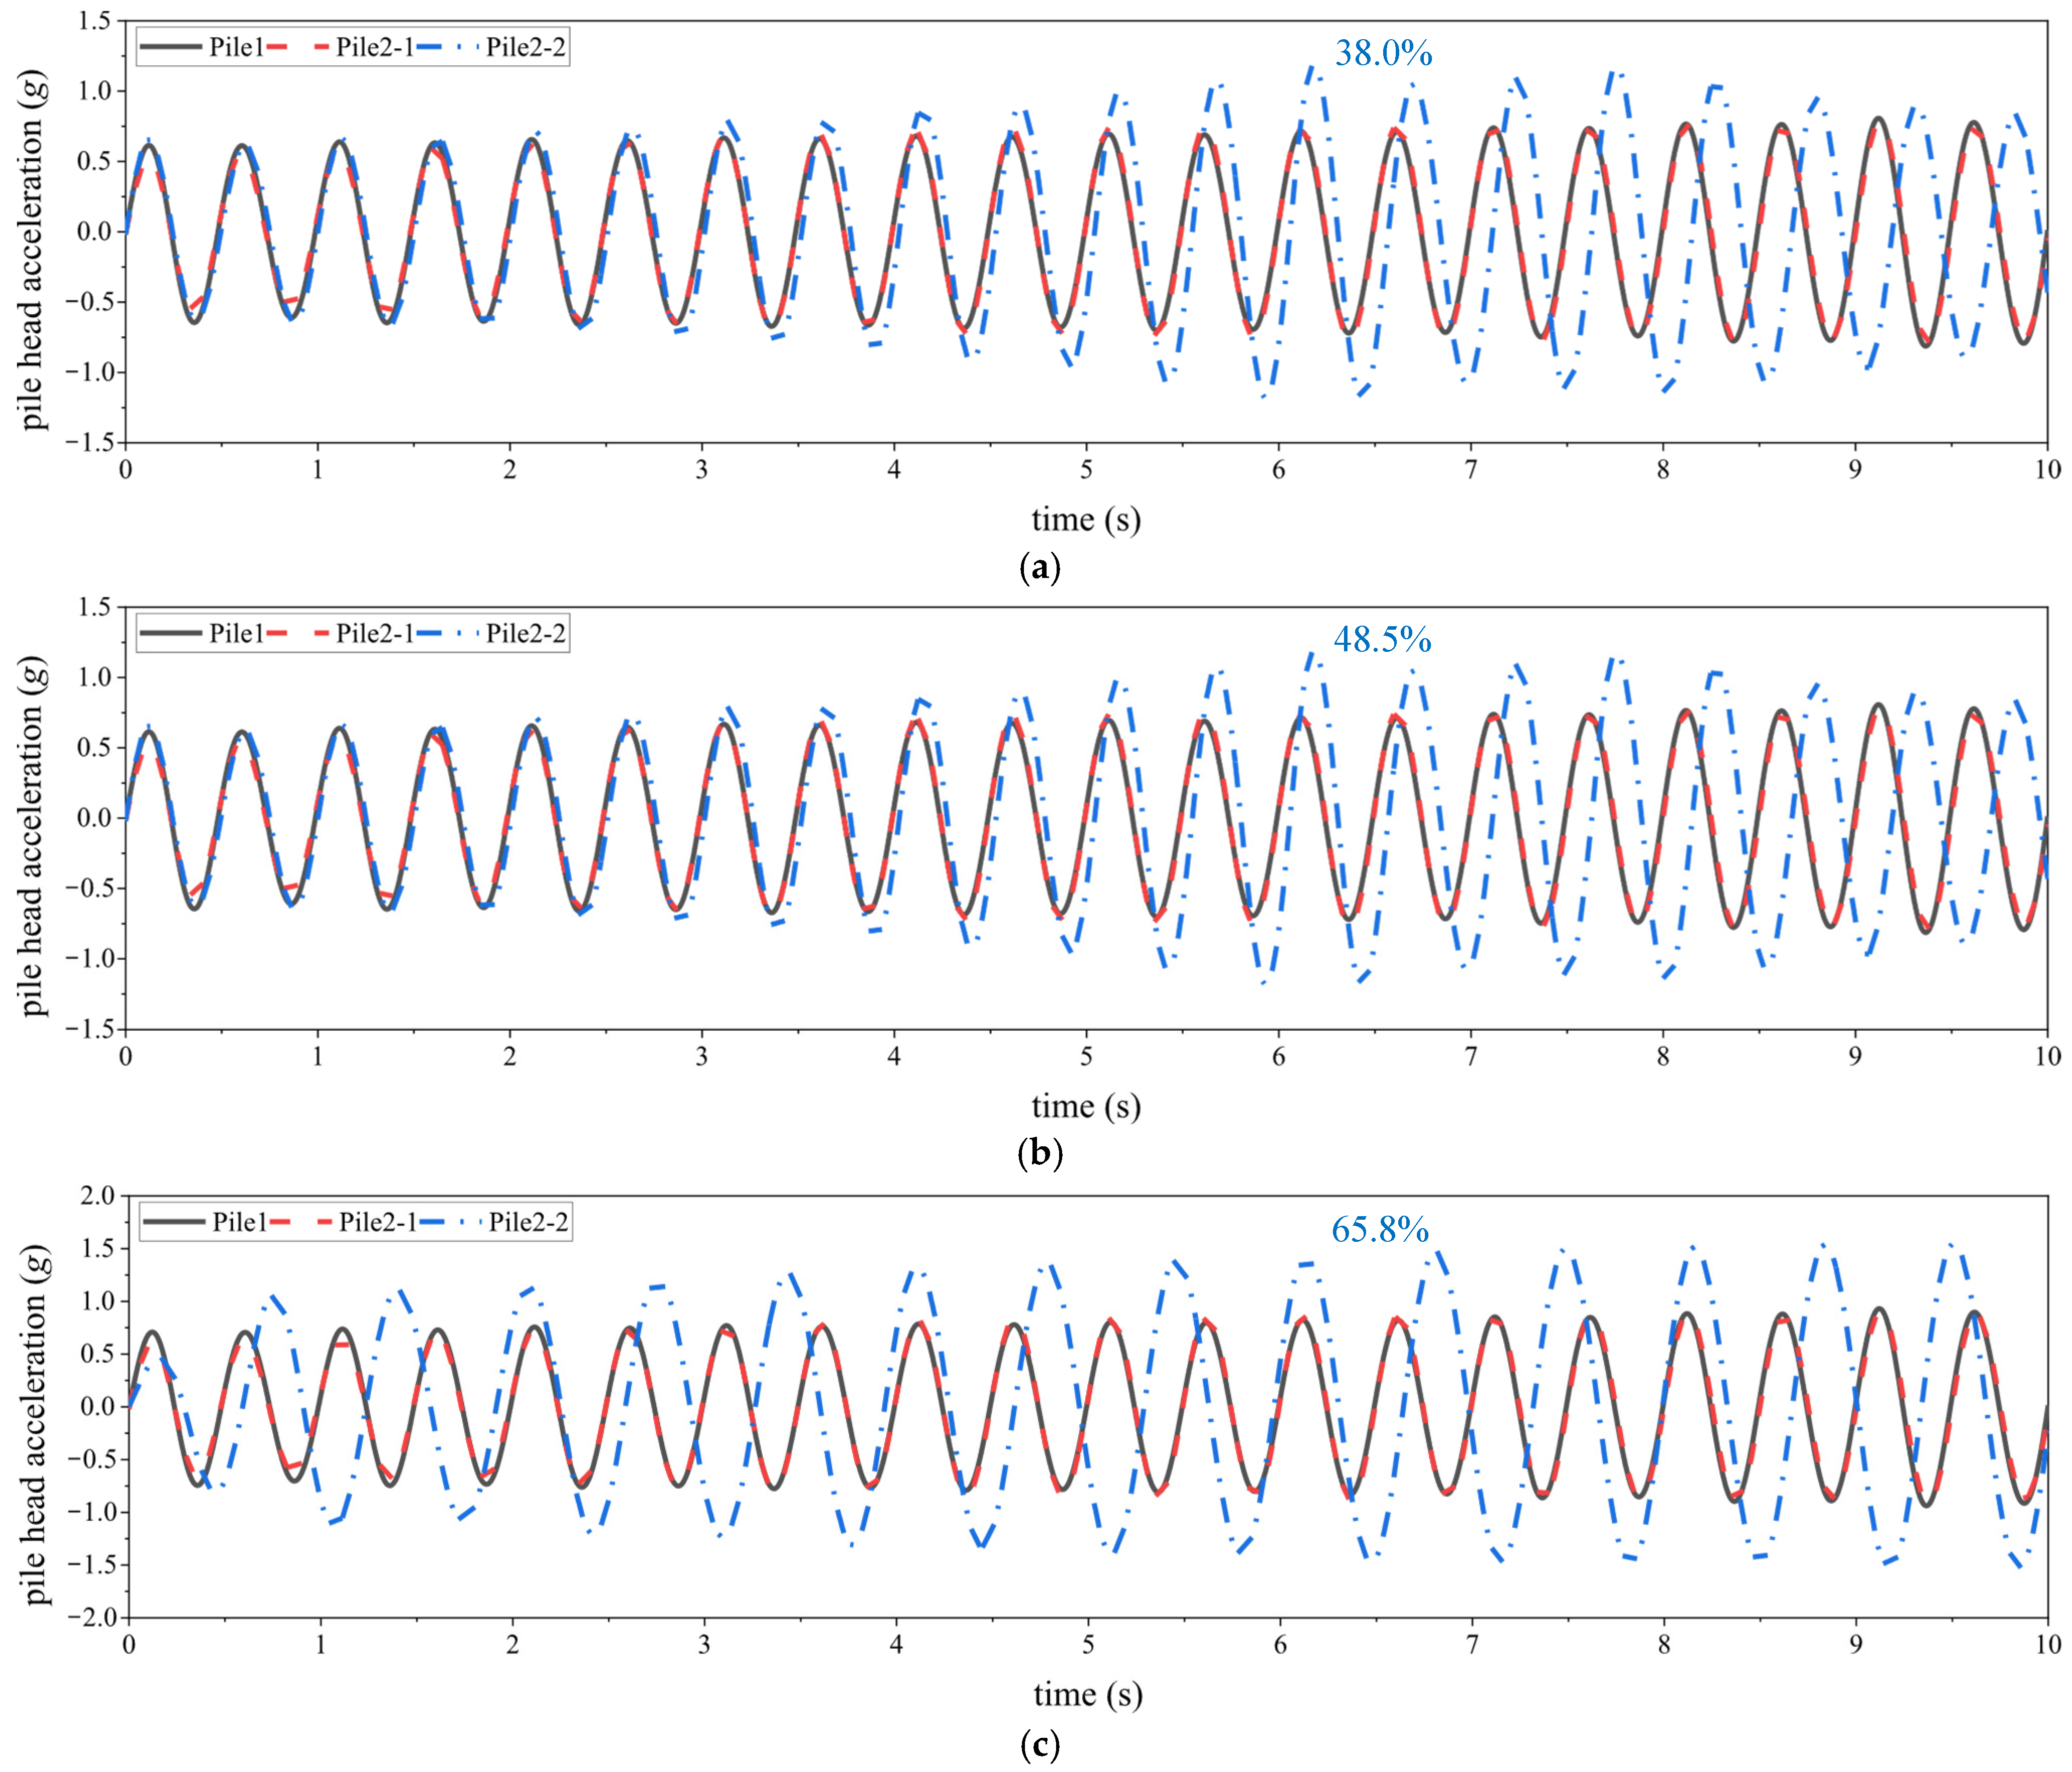
Figure 12.
Back-calculated pile head accelerations under different superstructure masses: (a) 235 kg; (b) 940 kg; (c) 1880 kg.
As can be seen from Figure 10, Figure 11 and Figure 12, under different superstructure masses, the back-calculated pore pressure ratio time history curves, pore pressure ratio distribution curves at different depths, and pile head acceleration time history curves from Pile2-1 are very close to the prototype curves, with all errors less than 12%. This proves that the proposed similarity law can accurately back-calculate the prototype liquefaction responses from the model liquefaction responses under different superstructure mass conditions.
In addition, it can be observed that when the superstructure masses are 235 kg, 940 kg, and 1880 kg, the back-calculated prototype responses from Pile2-2 yield pore pressure ratio errors of 31.6%, 39.3% and 43.1%, respectively, at a depth of −0.36 m at 2 s, along with pile head peak acceleration errors of 38.0%, 48.5% and 65.8%. Both the back-calculated results of soil liquefaction degree and pile response are larger than the prototype values. This is because the bending stiffness of Pile2-2 is not adjusted in accordance with the proposed similarity law, which leads to a smaller dynamic ground impedance, an amplified dynamic response of the pile, and thus an accelerated soil liquefaction process induced by the soil–pile dynamic interaction. Moreover, with the increase in superstructure mass, the errors of all back-calculated responses from Pile2-2 increase. When the superstructure mass increases from 235 kg to 1880 kg, the pore pressure ratio error increases by 36.4%, and the pile head peak acceleration error increases by 73.2%. The reason lies in the fact that the dissimilarity of dynamic ground impedance leads to the dissimilarity of soil–pile inertial interaction, and the larger the superstructure mass, the stronger the inertial interaction, thus resulting in greater response errors. As shown in Figure 11, the pore pressure ratio error is the largest near the soil surface. This is mainly because the soil constraint in this region is weakened, causing more intense pile vibration, enhancing the soil–pile dynamic interaction, thereby increasing the pore pressure ratio error. In summary, when an error exists in the dynamic shear modulus of the model soil, ensuring the similarity of dynamic ground impedance by adjusting the bending stiffness of the model pile according to the proposed similarity law becomes increasingly important for accurately back-calculating the prototype liquefaction responses, especially in cases with larger superstructure masses.
4.3.2. Analysis of Different Excitation Amplitudes
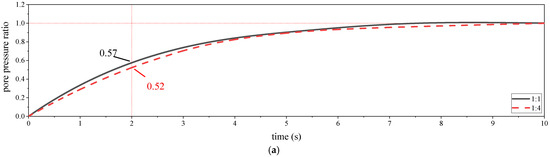
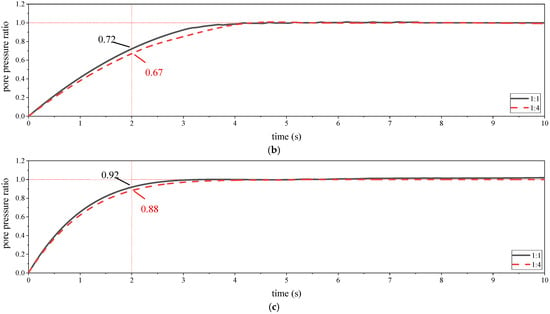
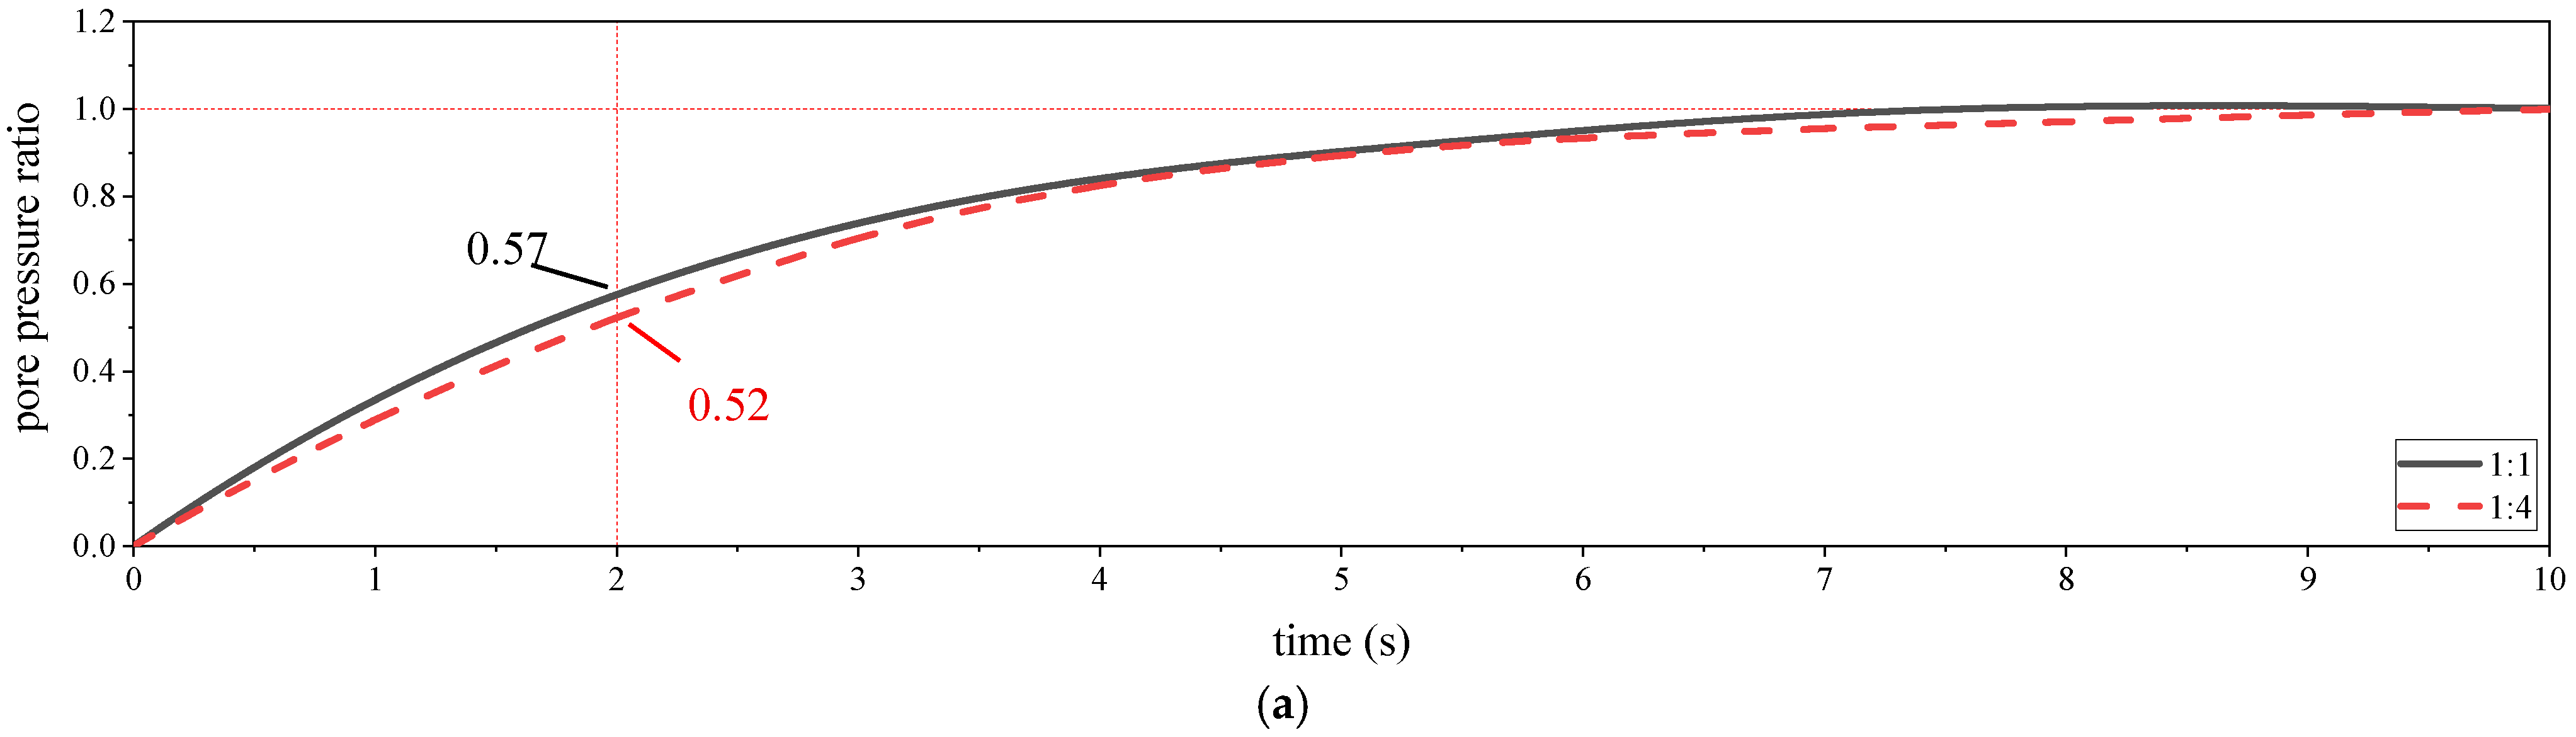
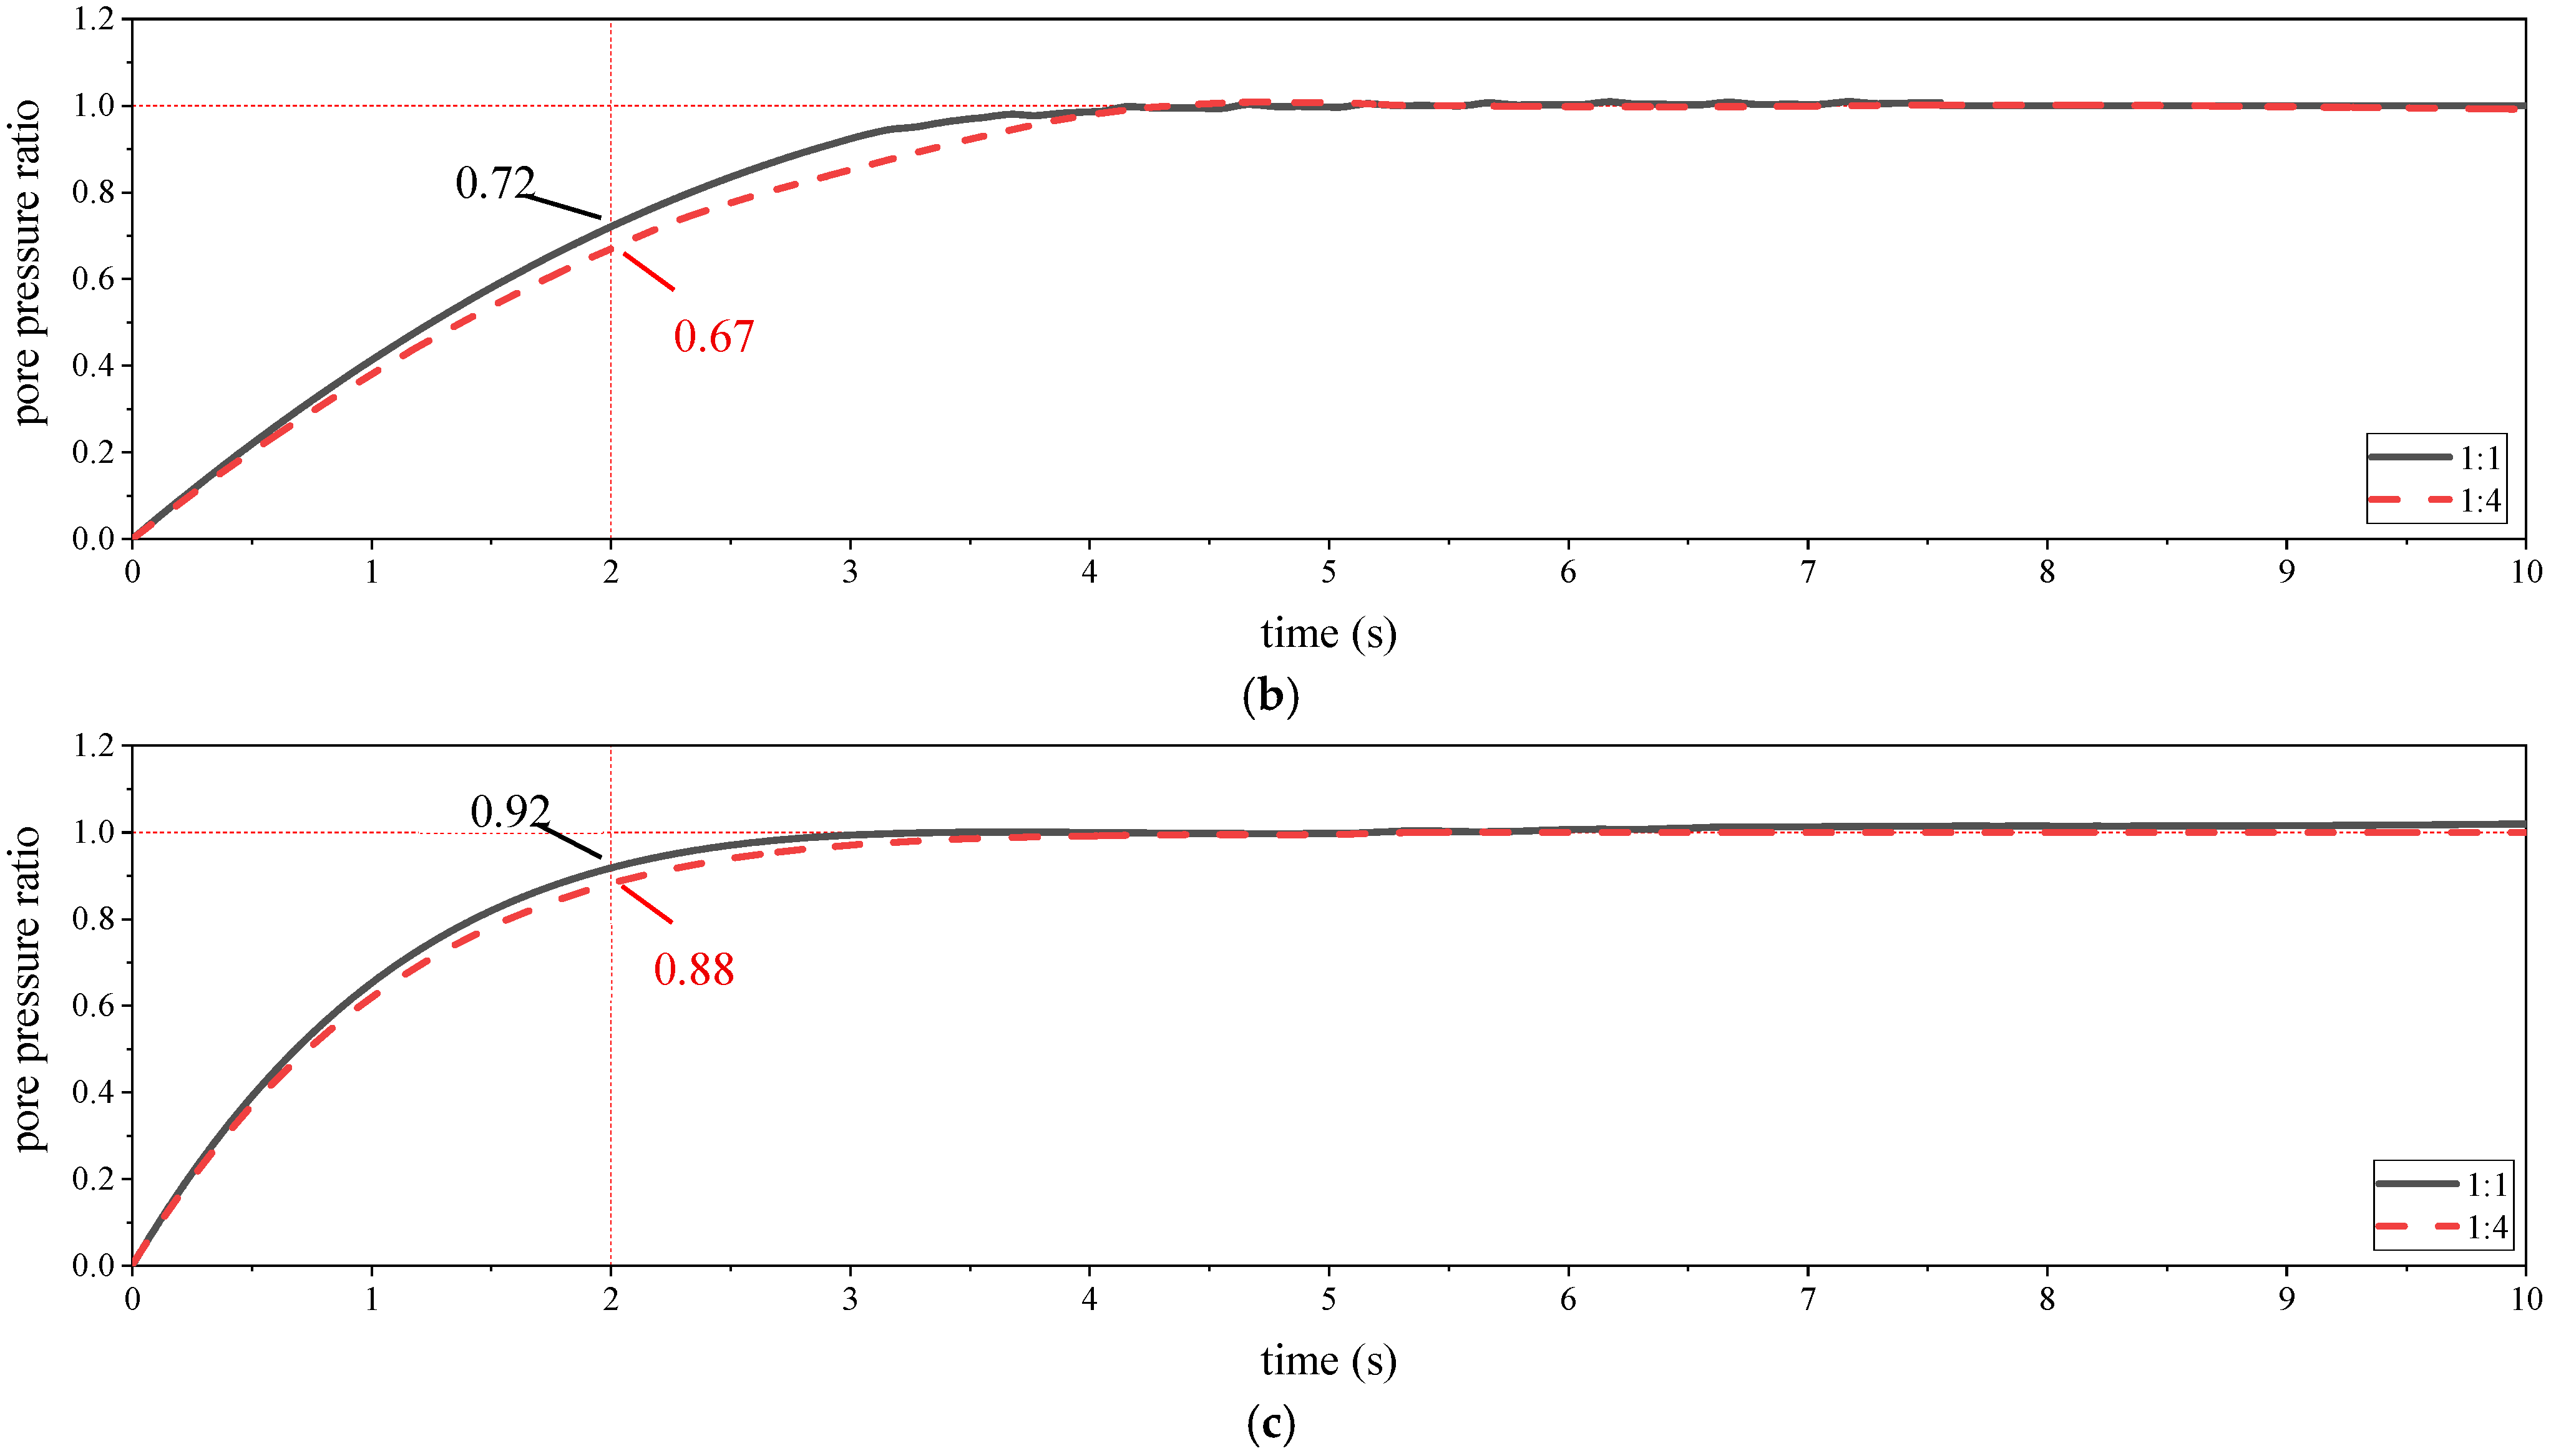
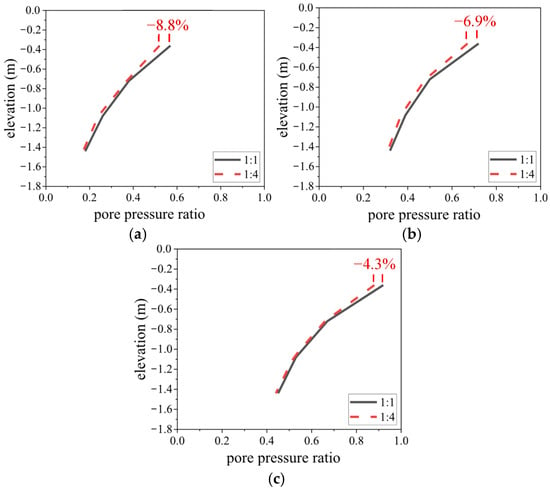
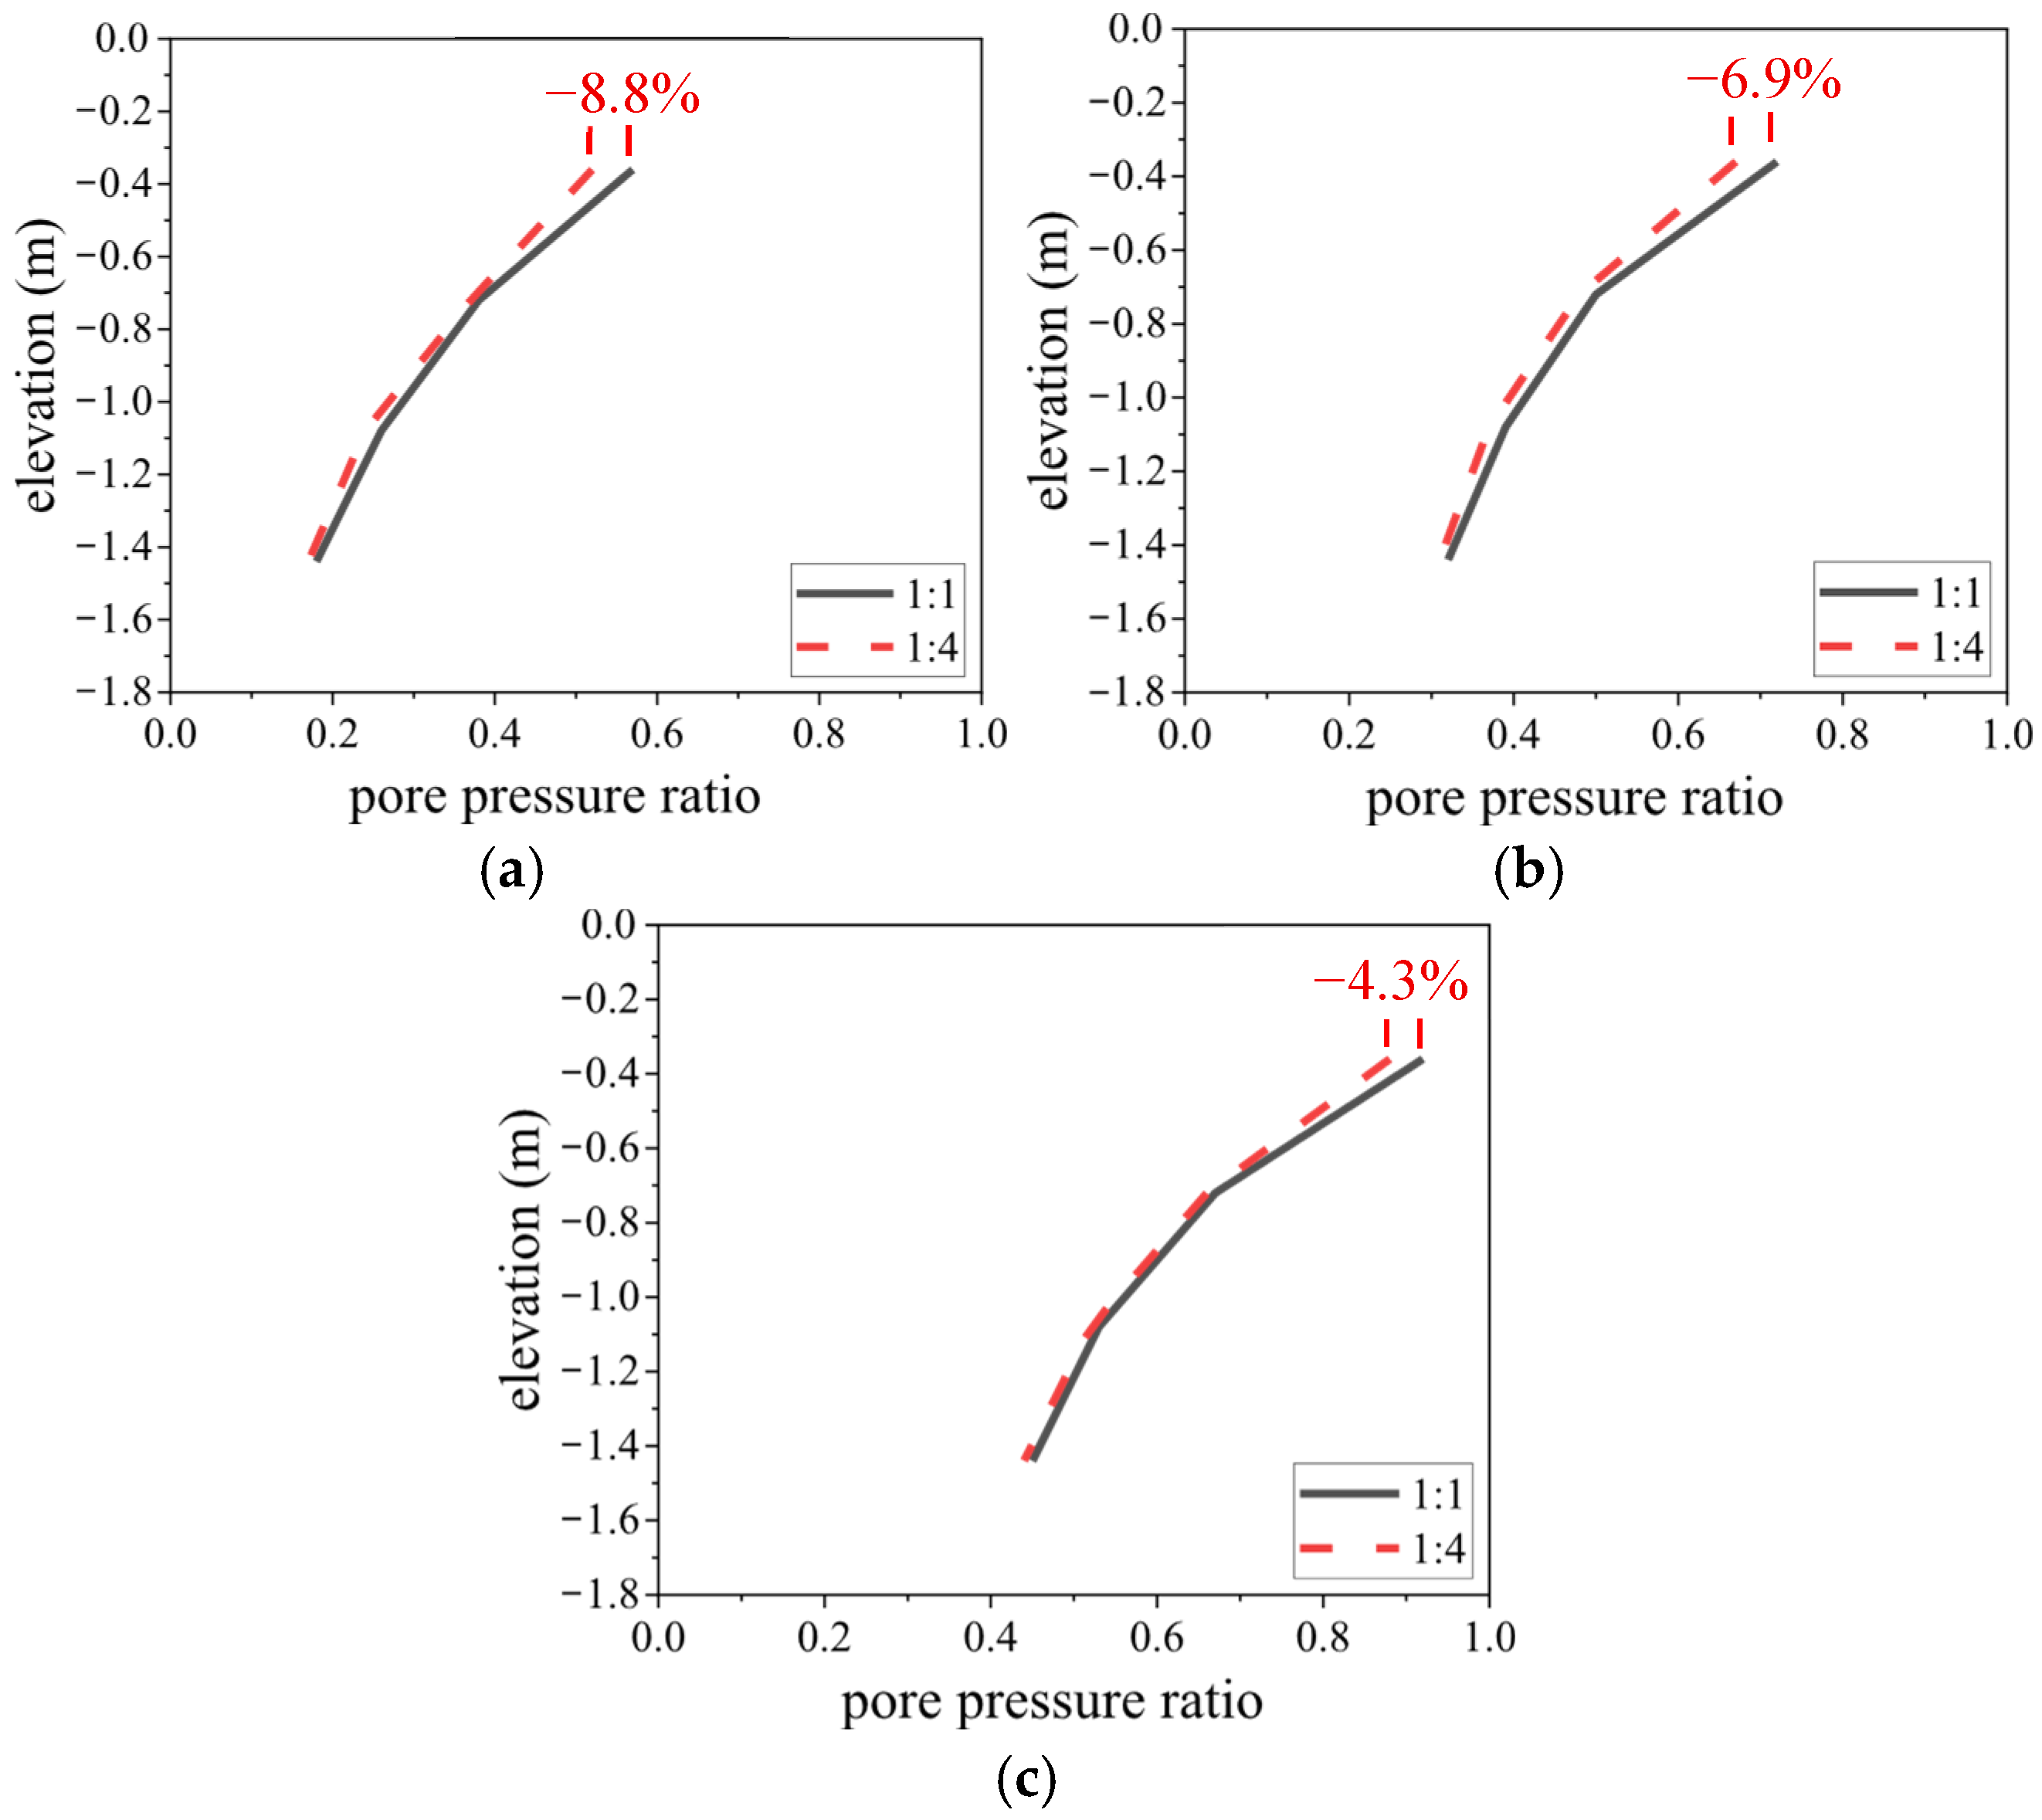
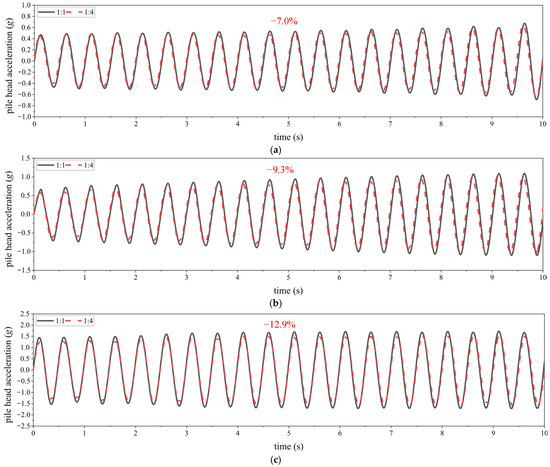
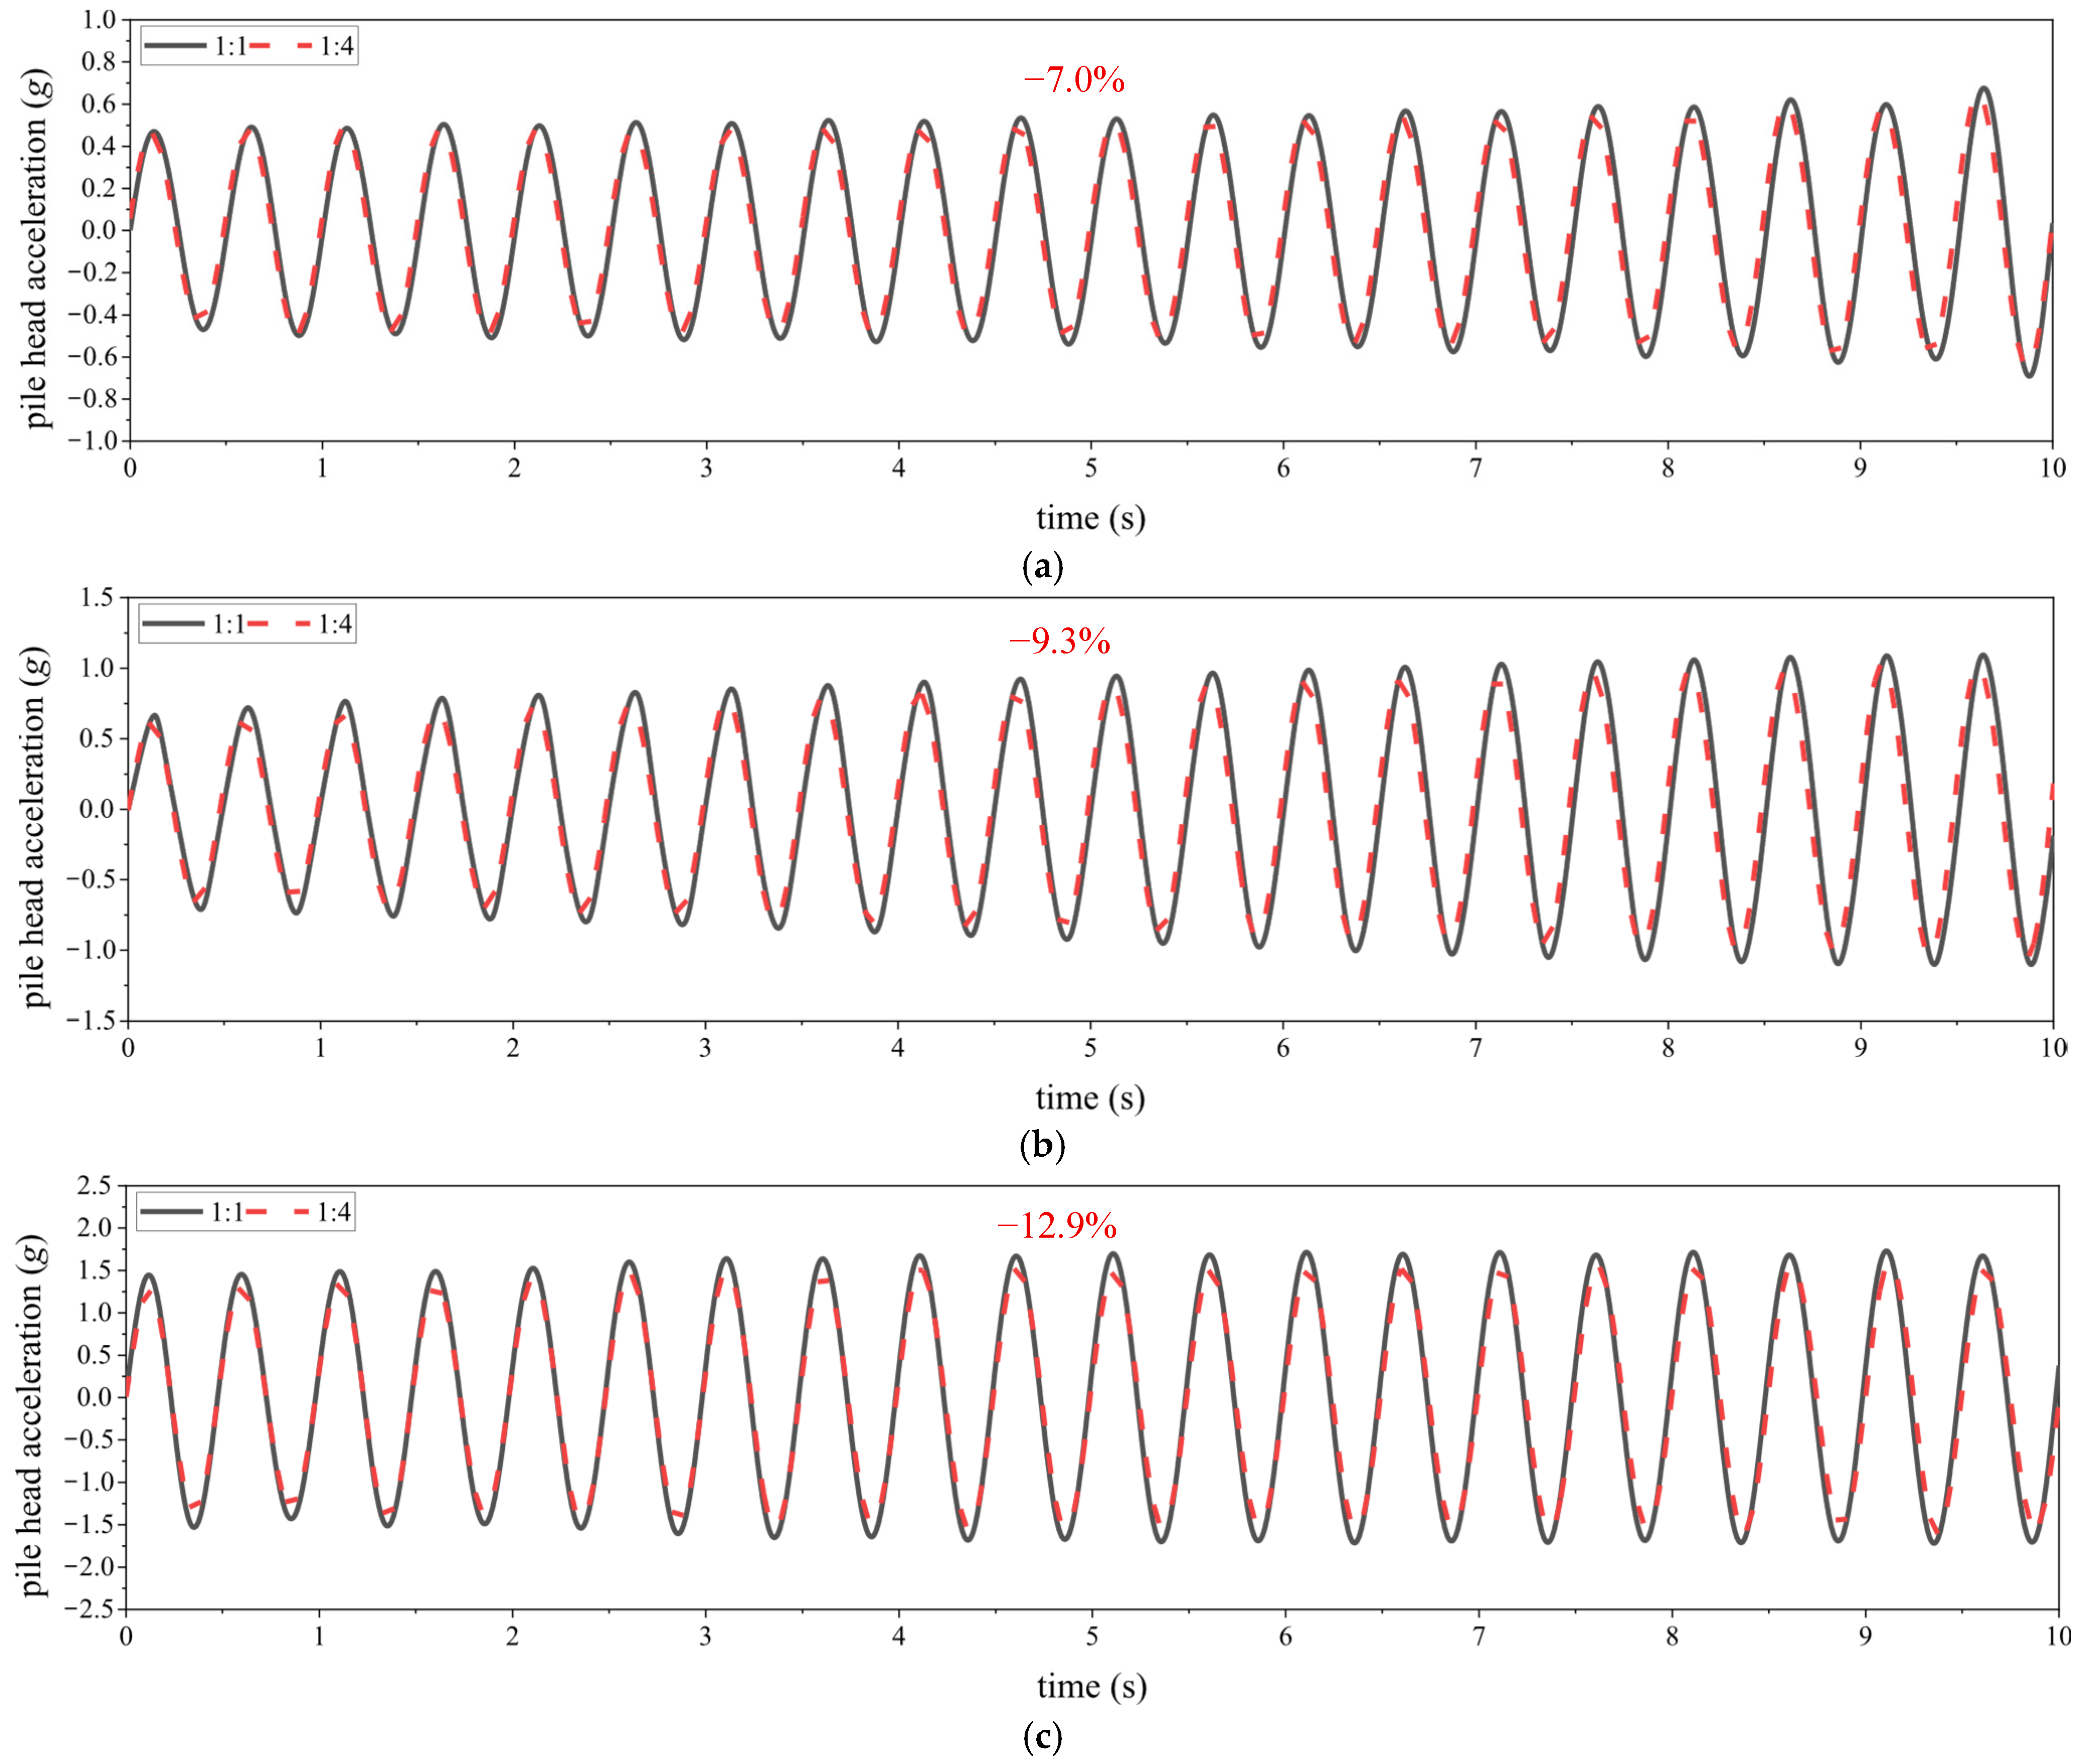
To verify the applicability of the proposed liquefaction similarity law under different excitation amplitudes, 1:1- and 1:4-scale finite element models are established in this section. In the 1:4 model, the dynamic shear modulus error of the model soil is set to −30%. Excitation is applied with a sine wave (frequency: 2 Hz). The excitation amplitudes of the 1:1 model are set to 0.4 g, 0.64 g and 1.0 g, while those of the 1:4 model are assigned corresponding values in accordance with the proposed similarity law. The back-calculated prototype liquefaction responses obtained from the 1:4 model under different excitation amplitudes are presented in Figure 13, Figure 14 and Figure 15.
Figure 13.
Back-calculated pore pressure ratio time histories (elevation: −0.36 m) under different excitation amplitudes: (a) 0.4 g; (b) 0.64 g; (c) 1.0 g.
Figure 14.
Back-calculated pore pressure ratios at different depths (time: 2 s) under different excitation amplitudes: (a) 0.4 g; (b) 0.64 g; (c) 1.0 g.
Figure 15.
Back-calculated pile head accelerations under different excitation amplitudes: (a) 0.4 g; (b) 0.64 g; (c) 1.0 g.
As can be seen from Figure 13, Figure 14 and Figure 15, when the excitation amplitudes are set to 0.4 g, 0.64 g and 1.0 g, the back-calculated pore pressure ratio time history curves, pore pressure ratio distribution curves at different depths, and pile head acceleration time history curves from the model are all very close to the prototype curves. The pore pressure ratio errors at a depth of −0.36 m at 2 s are −8.8%, −6.9% and −4.3% respectively, while the pile head peak acceleration errors are −7.0%, −9.3% and −12.9% respectively. The pore pressure ratios back-calculated from the model are slightly smaller than those of the prototype because the thinner soil layer in the model leads to a faster pore pressure dissipation rate. The accelerations back-calculated from the model are also slightly smaller than those of the prototype; this is because the liquefaction degree of the model is slightly lower than that of the prototype, resulting in stronger constraints of the model soil on the model pile and thus smaller back-calculated pile head accelerations. Although the pile head peak acceleration error increases slightly with the increase in excitation amplitude, the pore pressure ratio error decreases. This is because the increase in excitation amplitude accelerates the growth rate of the pore pressure ratio, thereby reducing the impact of the difference in pore pressure dissipation rates between the model and the prototype.
In summary, when excitation amplitudes are set to different values, all errors of the prototype liquefaction responses back-calculated by the proposed similarity law are within 13%, which verifies the accuracy of the proposed liquefaction similarity law under different excitation amplitudes.
4.3.3. Analysis of Different Distances from the Pile in Soil
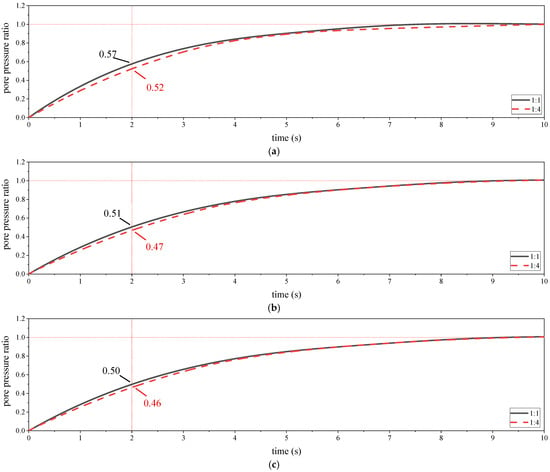
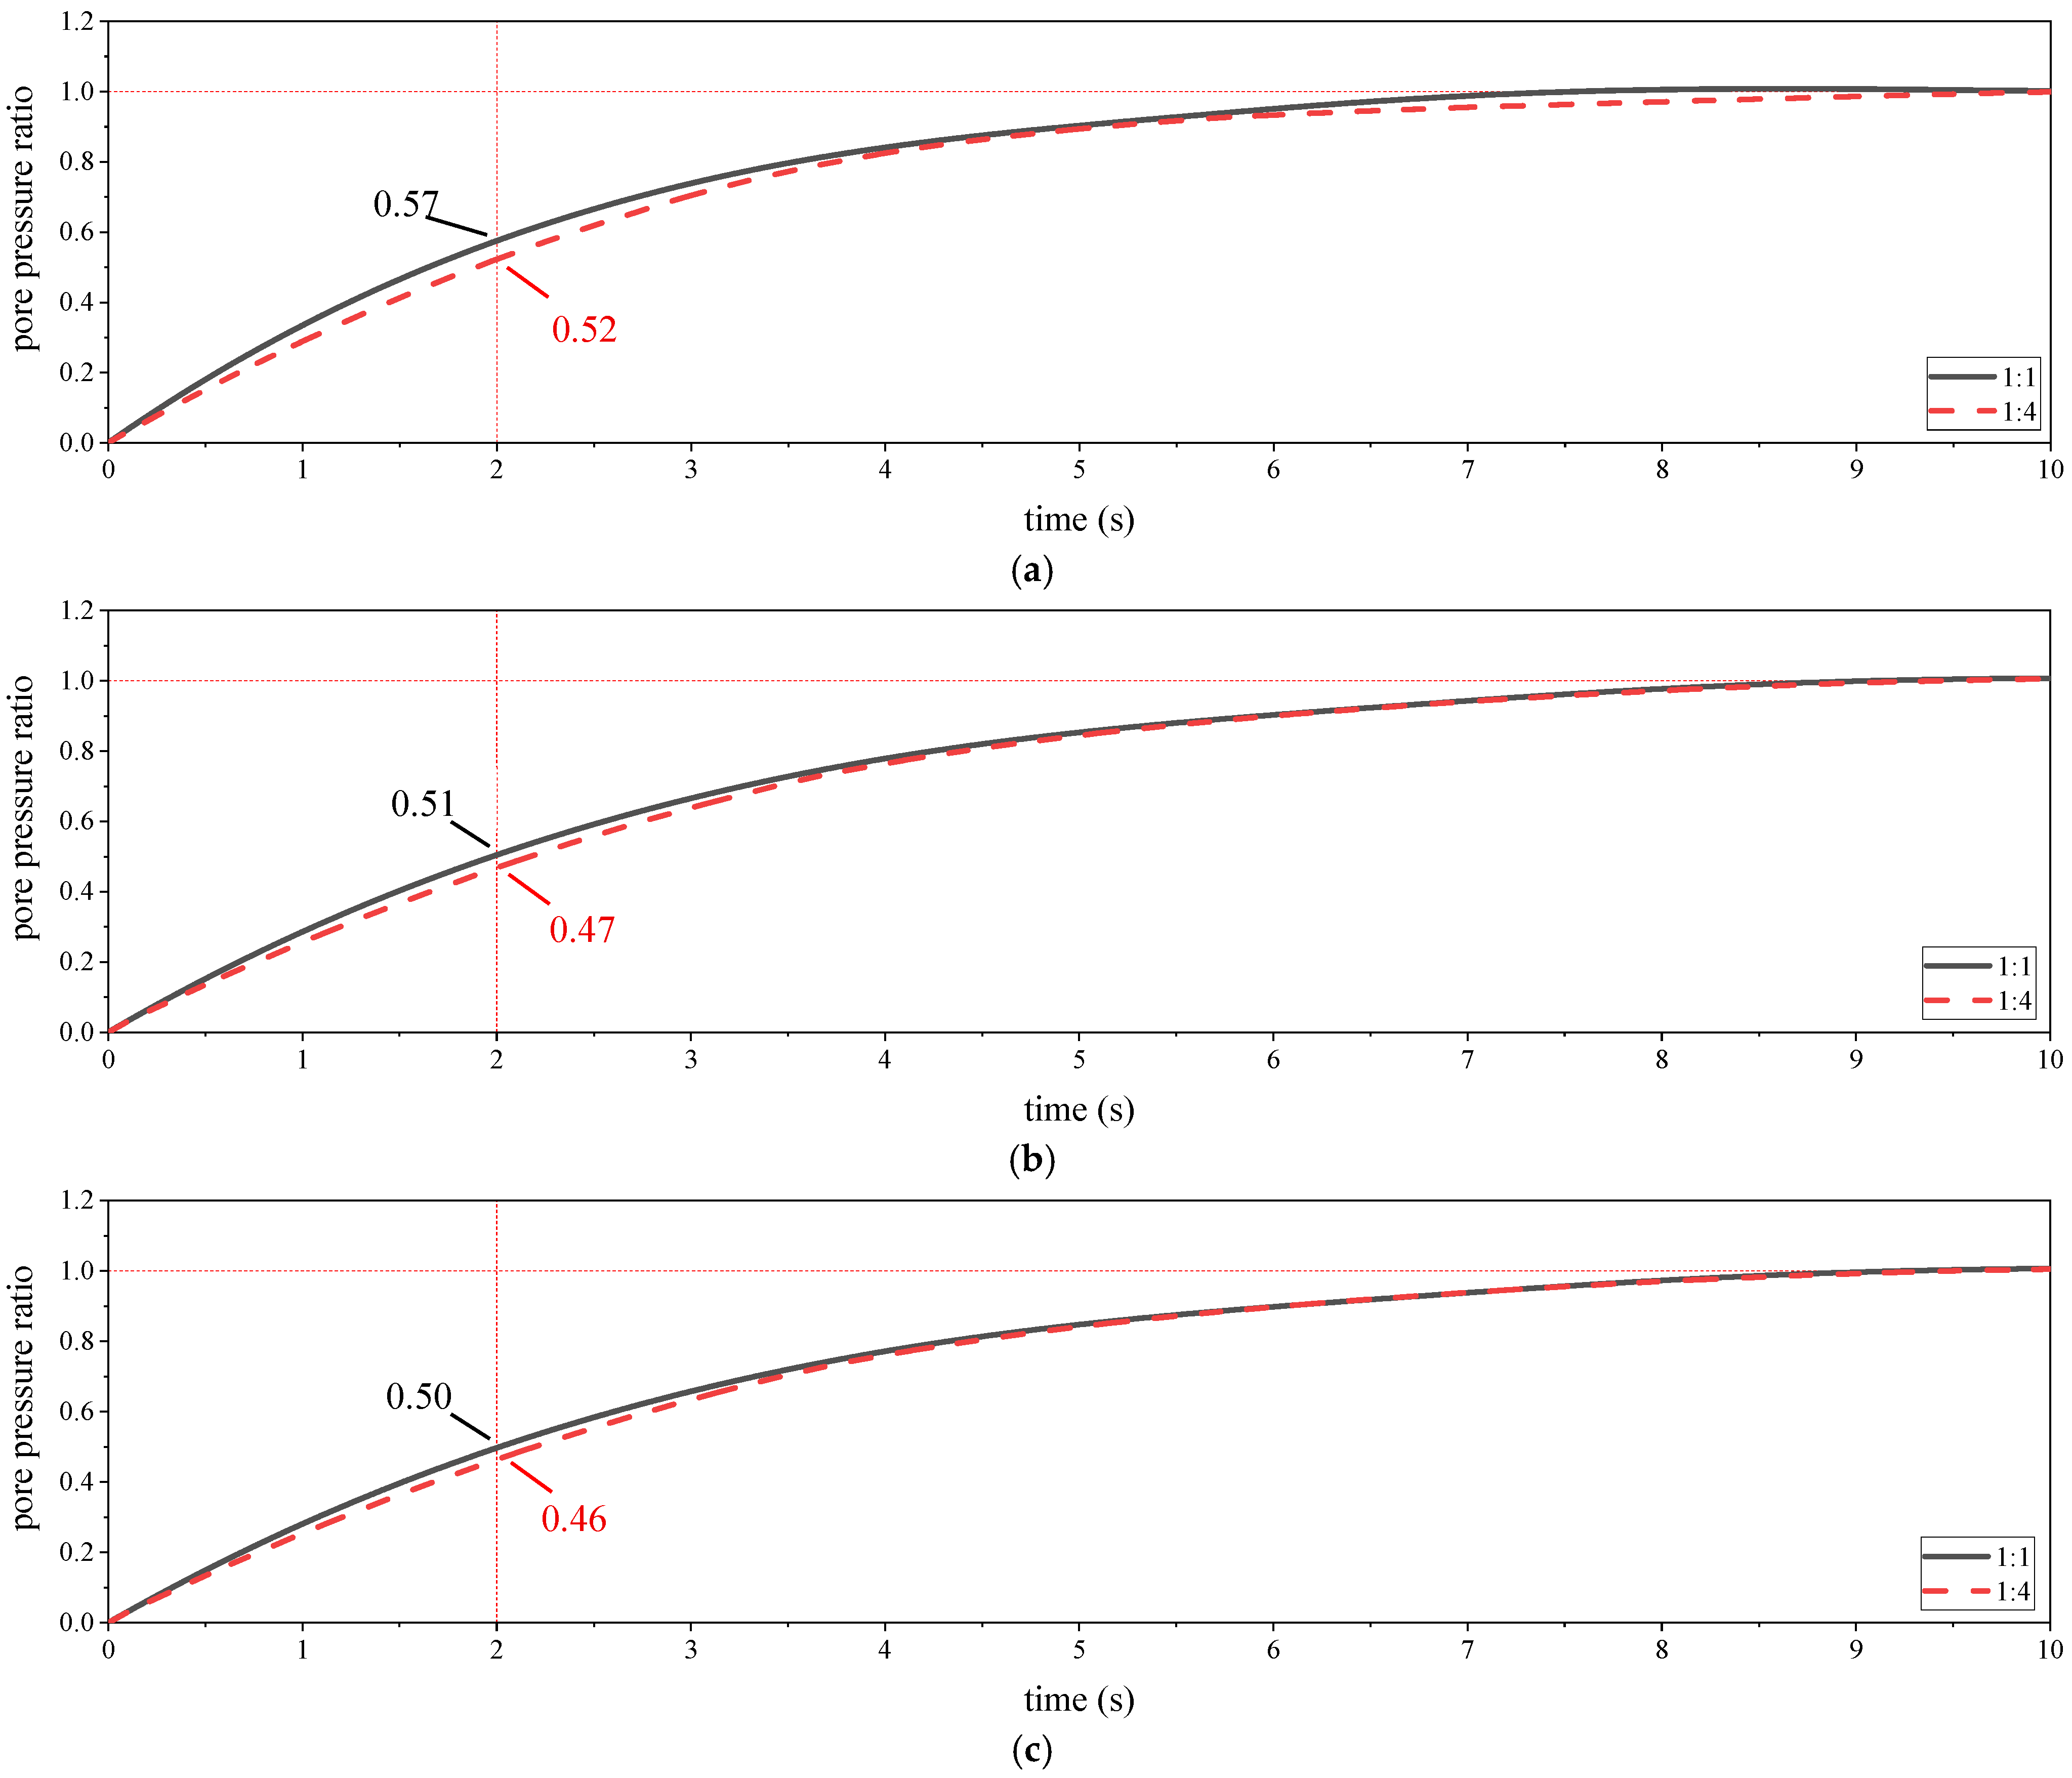
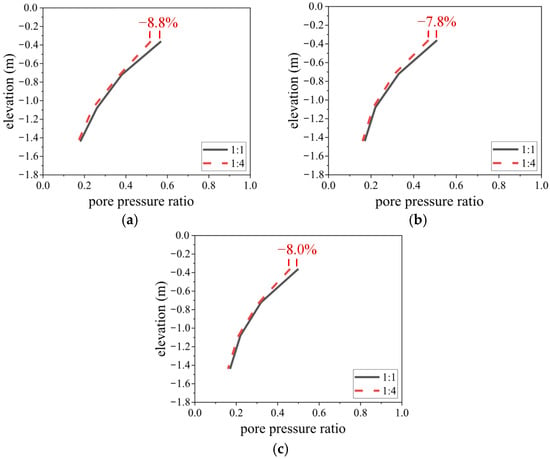
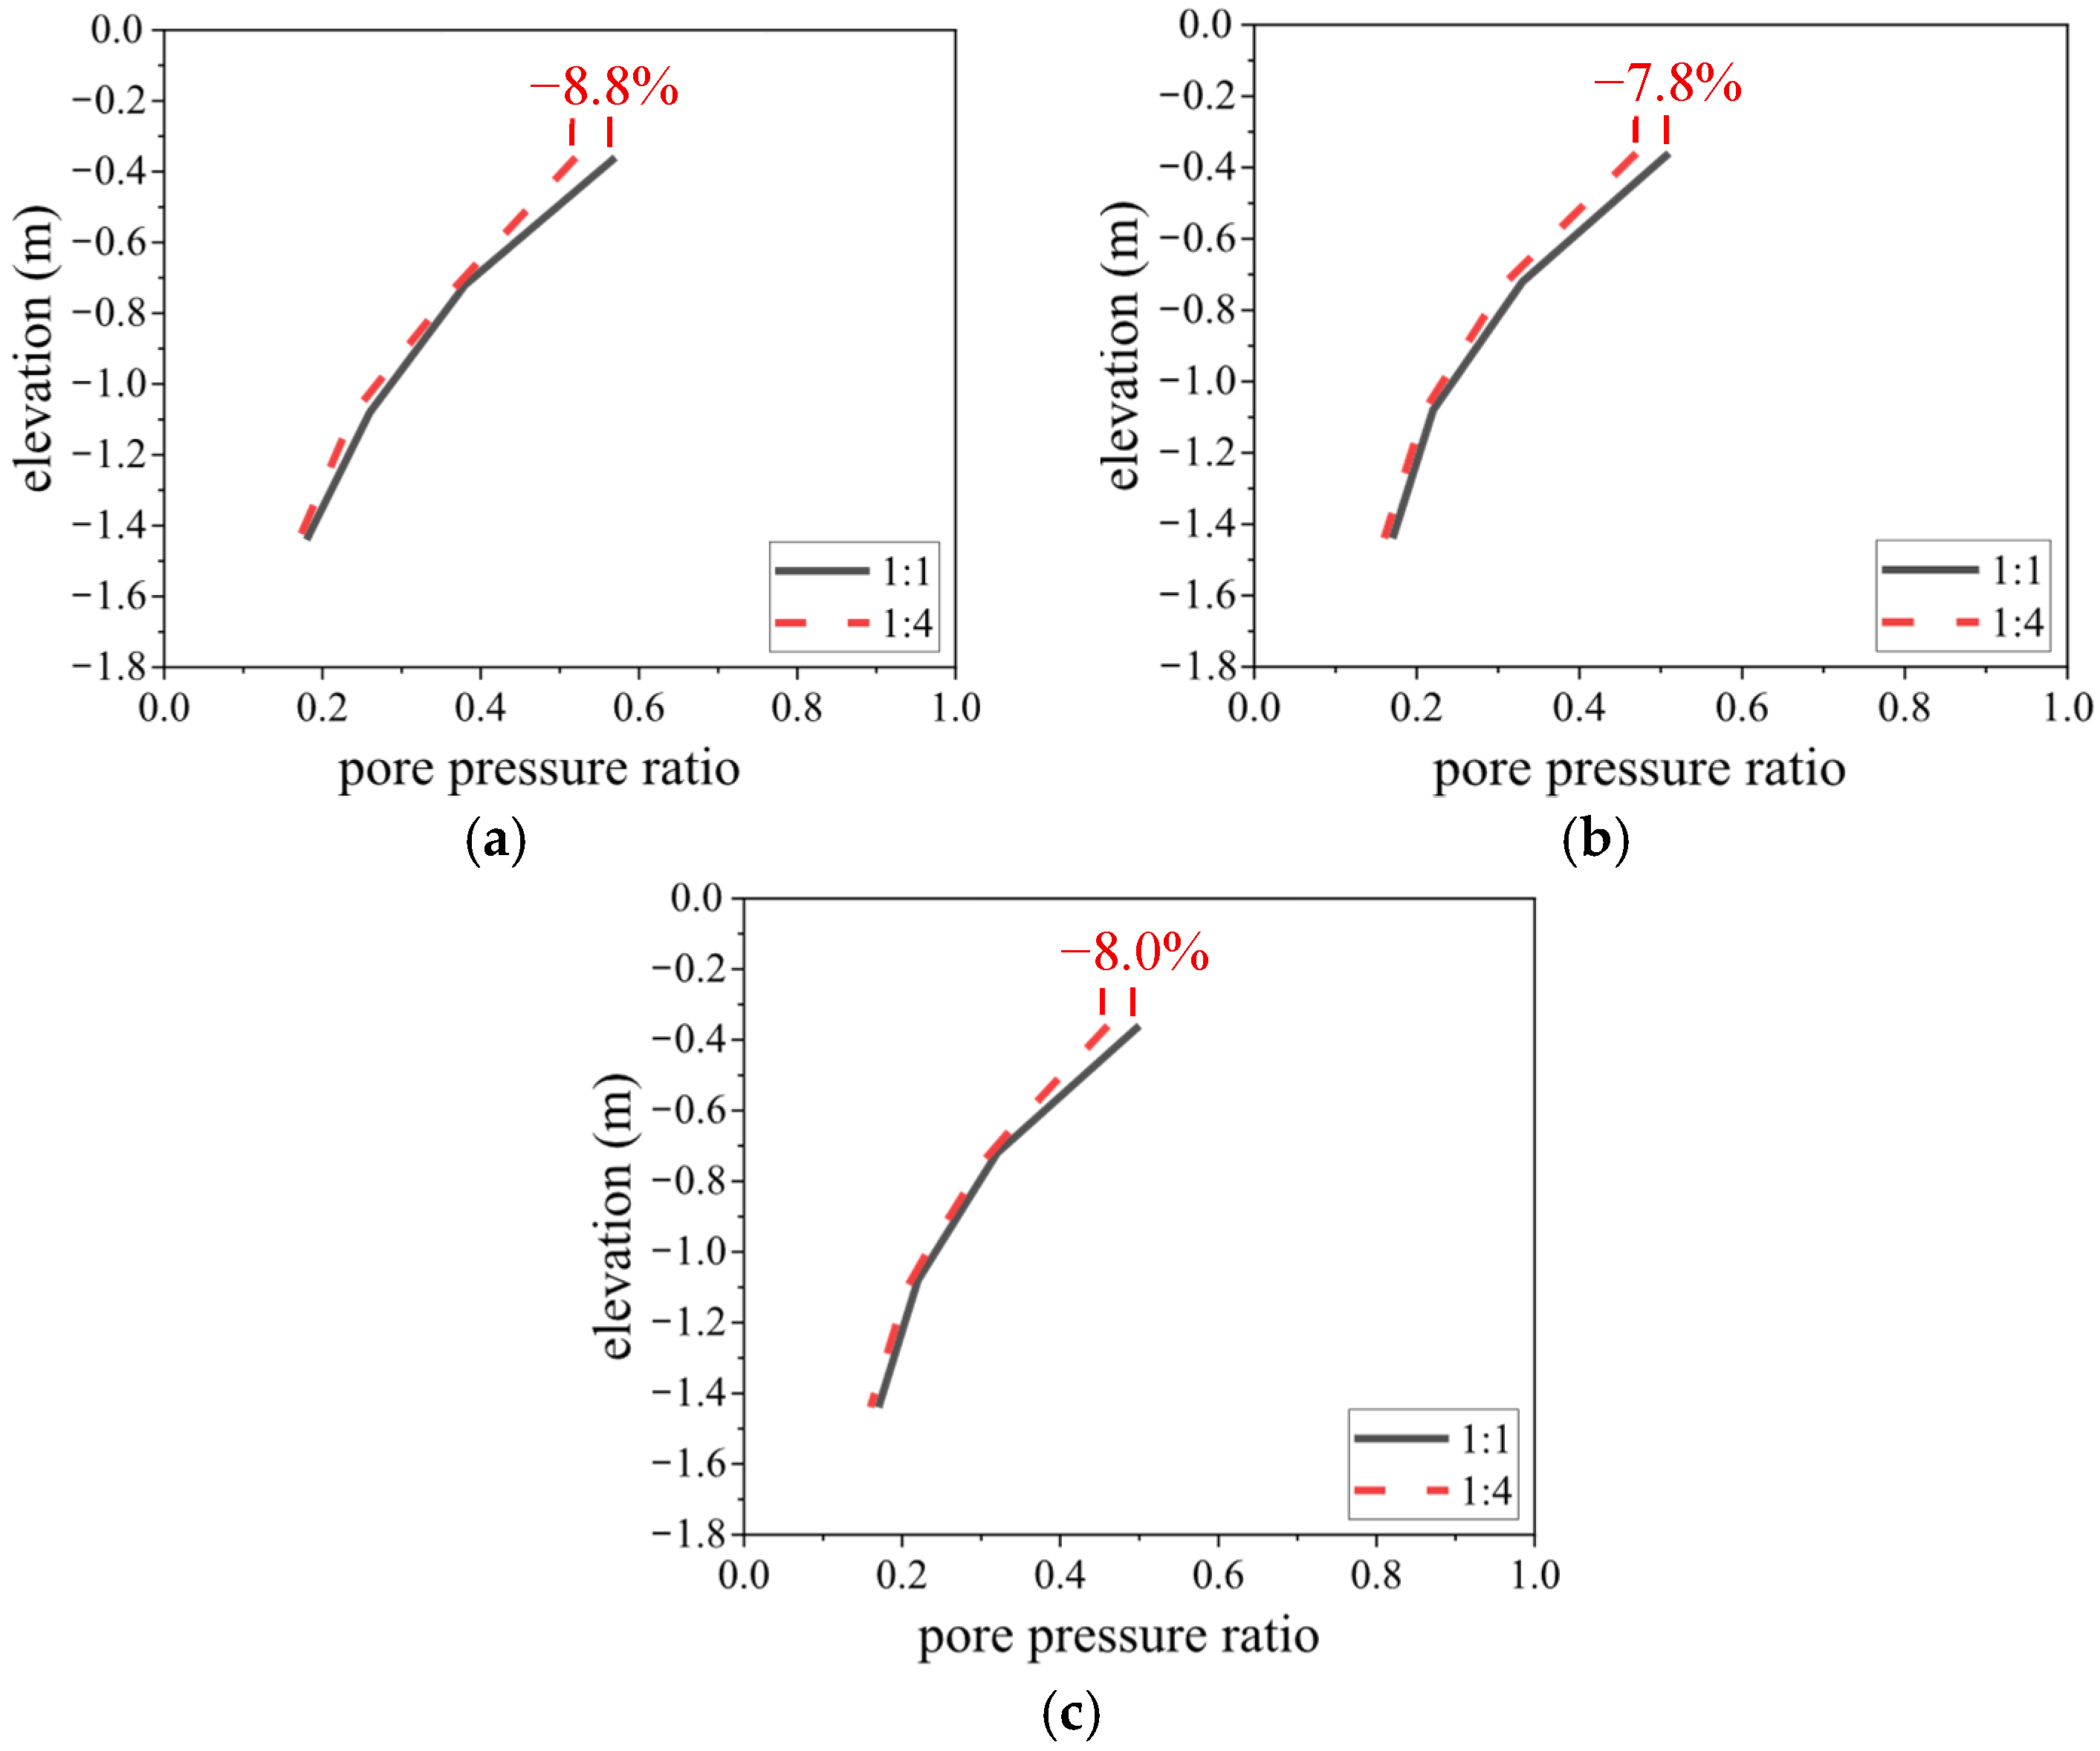
In the foundation soil, the farther the distance from the pile, the smaller the influence of pile vibration on the soil. To analyze and verify the accuracy of the proposed liquefaction similarity law in back-calculating the pore pressure ratios at different positions in the soil, 1:1- and 1:4-scale finite element models are established in this section. In the 1:4 model, the dynamic shear modulus error of the model soil is set to −30%. Excitation is applied with a 0.4 g sine wave (frequency: 2 Hz). The pore pressure ratios at positions of two times, four times and eight times the pile diameter in the soil are extracted. The back-calculated prototype pore pressure ratio time histories and pore pressure ratio distributions at different depths obtained from the 1:4 model are presented in Figure 16 and Figure 17.
Figure 16.
Back-calculated pore pressure ratio time histories (elevation: −0.36 m) at different distances from the pile in soil: (a) at 2× pile diameter from the pile; (b) at 4× pile diameter from the pile; (c) at 8× pile diameter from the pile.
Figure 17.
Back-calculated pore pressure ratios at different depths (time: 2 s) at different distances from the pile in soil: (a) at 2× pile diameter from the pile; (b) at 4× pile diameter from the pile; (c) at 8× pile diameter from the pile.
As can be seen from Figure 16 and Figure 17, at positions of two, four and eight times the pile diameter in the soil, the back-calculated pore pressure ratio time history curves and pore pressure ratio distribution curves at different depths from the model are all in good agreement with the prototype curves. The pore pressure ratio errors at a depth of −0.36 m at 2 s are −8.8%, −7.8% and −8.0% respectively. It can be observed that the errors at four and eight times the pile diameter are relatively close and smaller than those at two times the pile diameter. For both the pore pressure ratio time history curves and the pore pressure ratio distribution curves at different depths, the back-calculated curves from the model match the prototype curves better at four and eight times the pile diameter than at two times the pile diameter, and the curve shapes at four and eight times the pile diameter are basically consistent. This is because, in the foundation soil, the farther the distance from the pile, the smaller the influence of pile vibration on the soil, and beyond a certain distance, the influence of pile vibration on the soil can be basically neglected.
In summary, at different distances from the pile in the foundation soil, all errors of the prototype pore pressure ratios back-calculated by the proposed liquefaction similarity law are within 10%, and the farther the distance from the pile, the more accurate the back-calculated results. This verifies that the proposed similarity law is accurate for back-calculating the liquefaction responses of foundation soil at different distances from the pile.
4.3.4. Analysis of Different Soil Surface Permeability Conditions
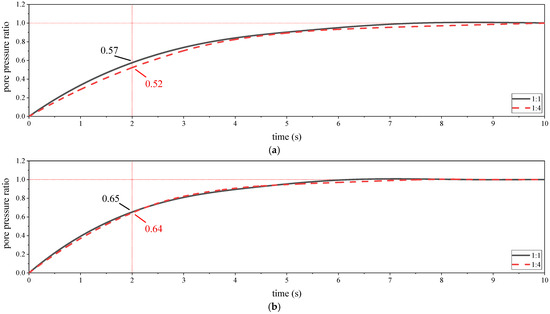
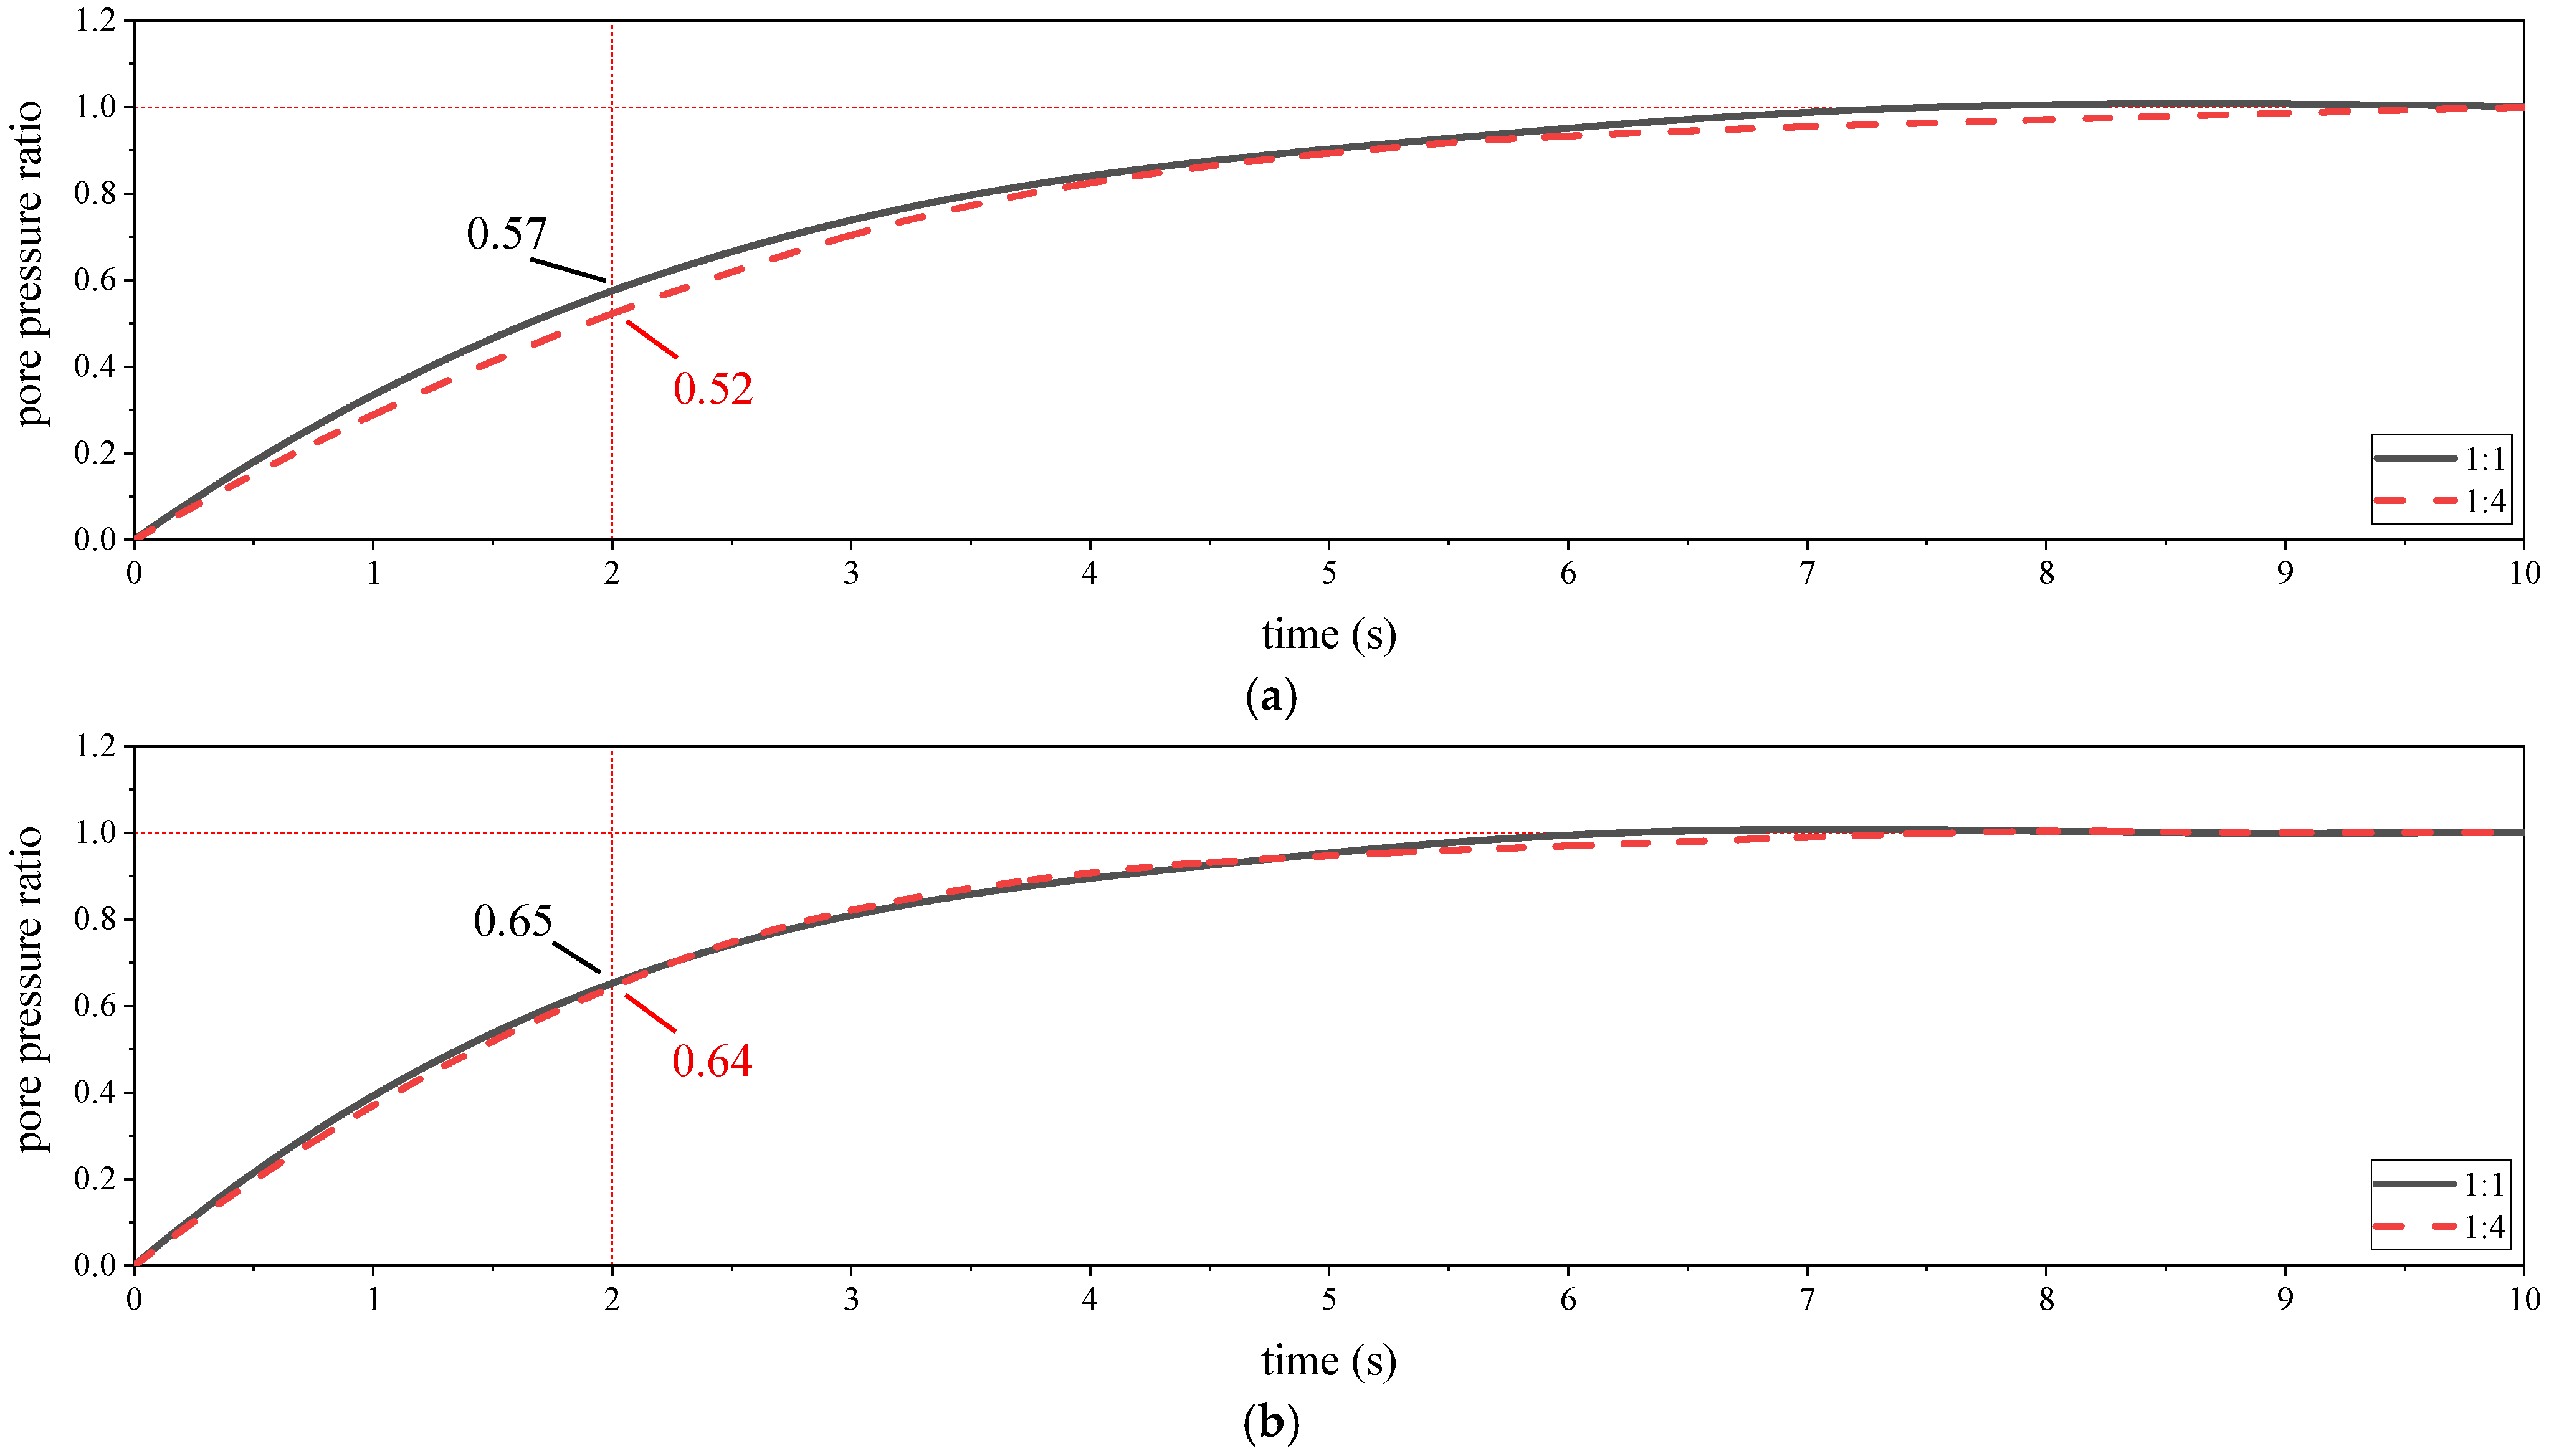
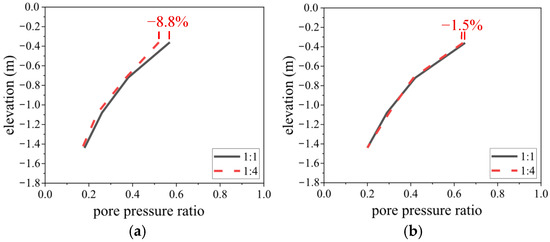
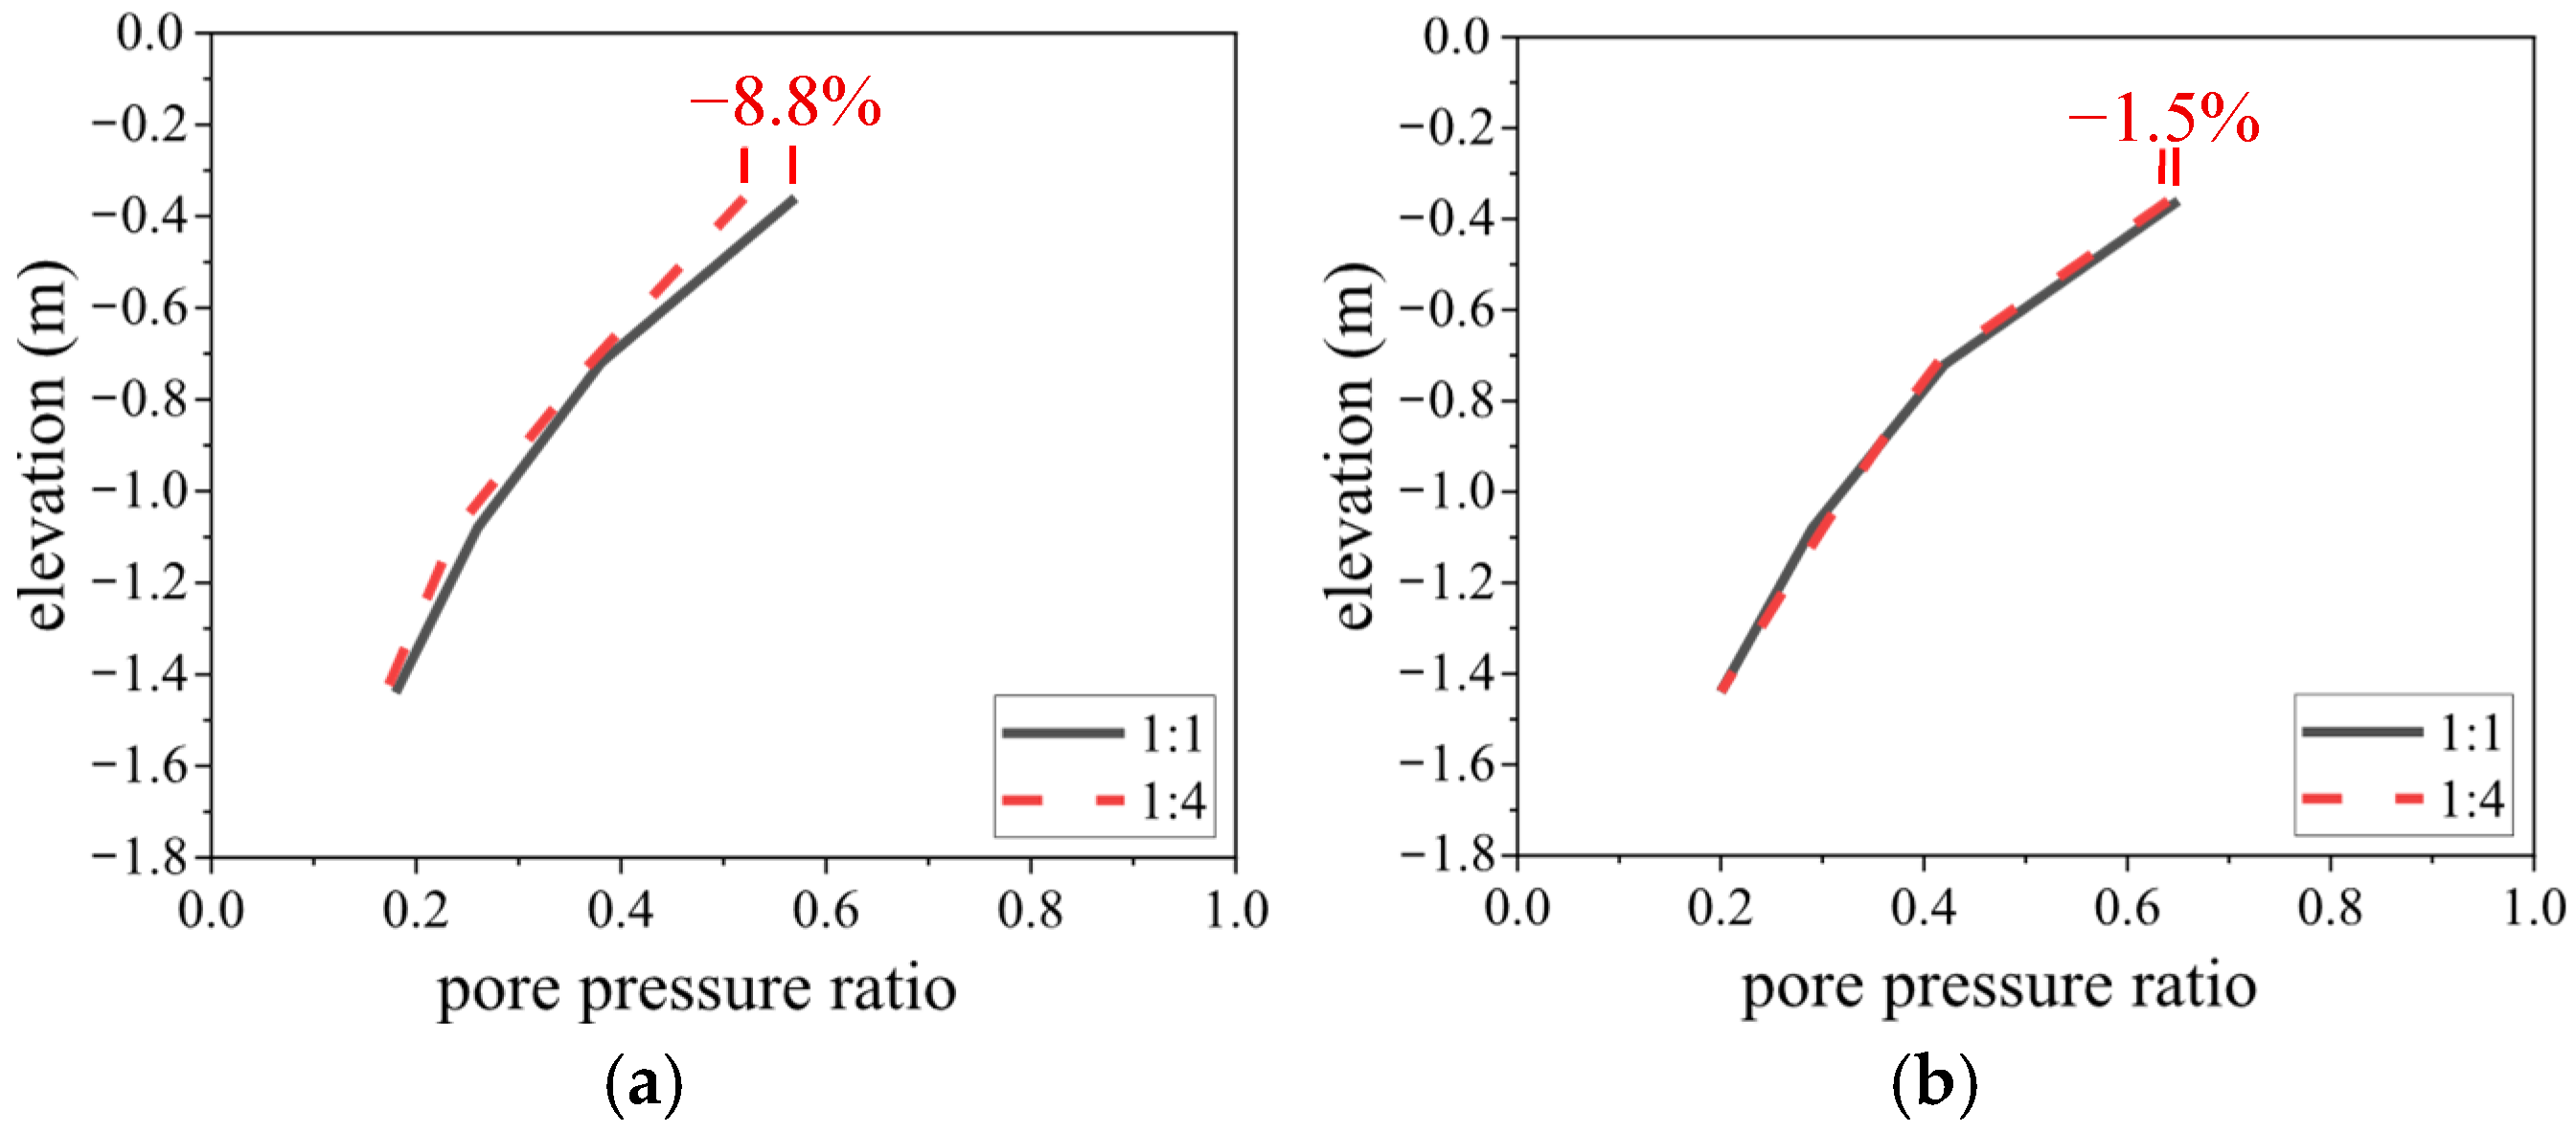
Based on the analysis of the test results, the smaller thickness of the model soil layer leads to a faster pore pressure dissipation rate, thus resulting in the pore pressure ratios back-calculated from the model being slightly lower than those of the prototype [19]. To further analyze and determine the influence of soil surface permeability conditions on the similarity of liquefaction responses between the model and the prototype, 1:1- and 1:4-scale finite element models are established in this section. In the 1:4 model, the dynamic shear modulus error of the model soil is set to −30%. The soil surface is configured into two cases: permeable boundary and impermeable boundary. In the finite element models, the permeable boundary is set by fixing the fluid pressure degree of freedom of the soil surface nodes, while the impermeable boundary is set by releasing the fluid pressure degree of freedom of the soil surface nodes. Excitation is applied with a 0.4 g sine wave (frequency: 2 Hz). The prototype liquefaction responses back-calculated from the 1:4 model under different soil surface permeability conditions are presented in Figure 18, Figure 19 and Figure 20.
Figure 18.
Back-calculated pore pressure ratio time histories (elevation: −0.36 m) under different soil surface permeability conditions: (a) soil surface permeable; (b) soil surface impermeable.
Figure 19.
Back-calculated pore pressure ratios at different depths (time: 2 s) under different soil surface permeability conditions: (a) soil surface permeable; (b) soil surface impermeable.
Figure 20.
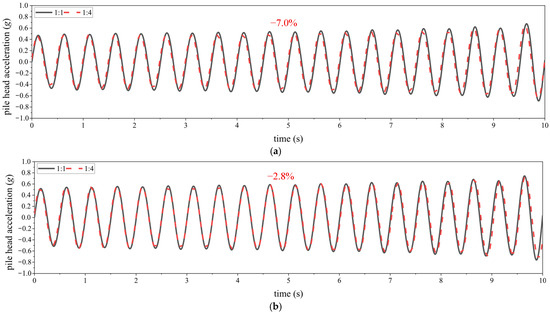
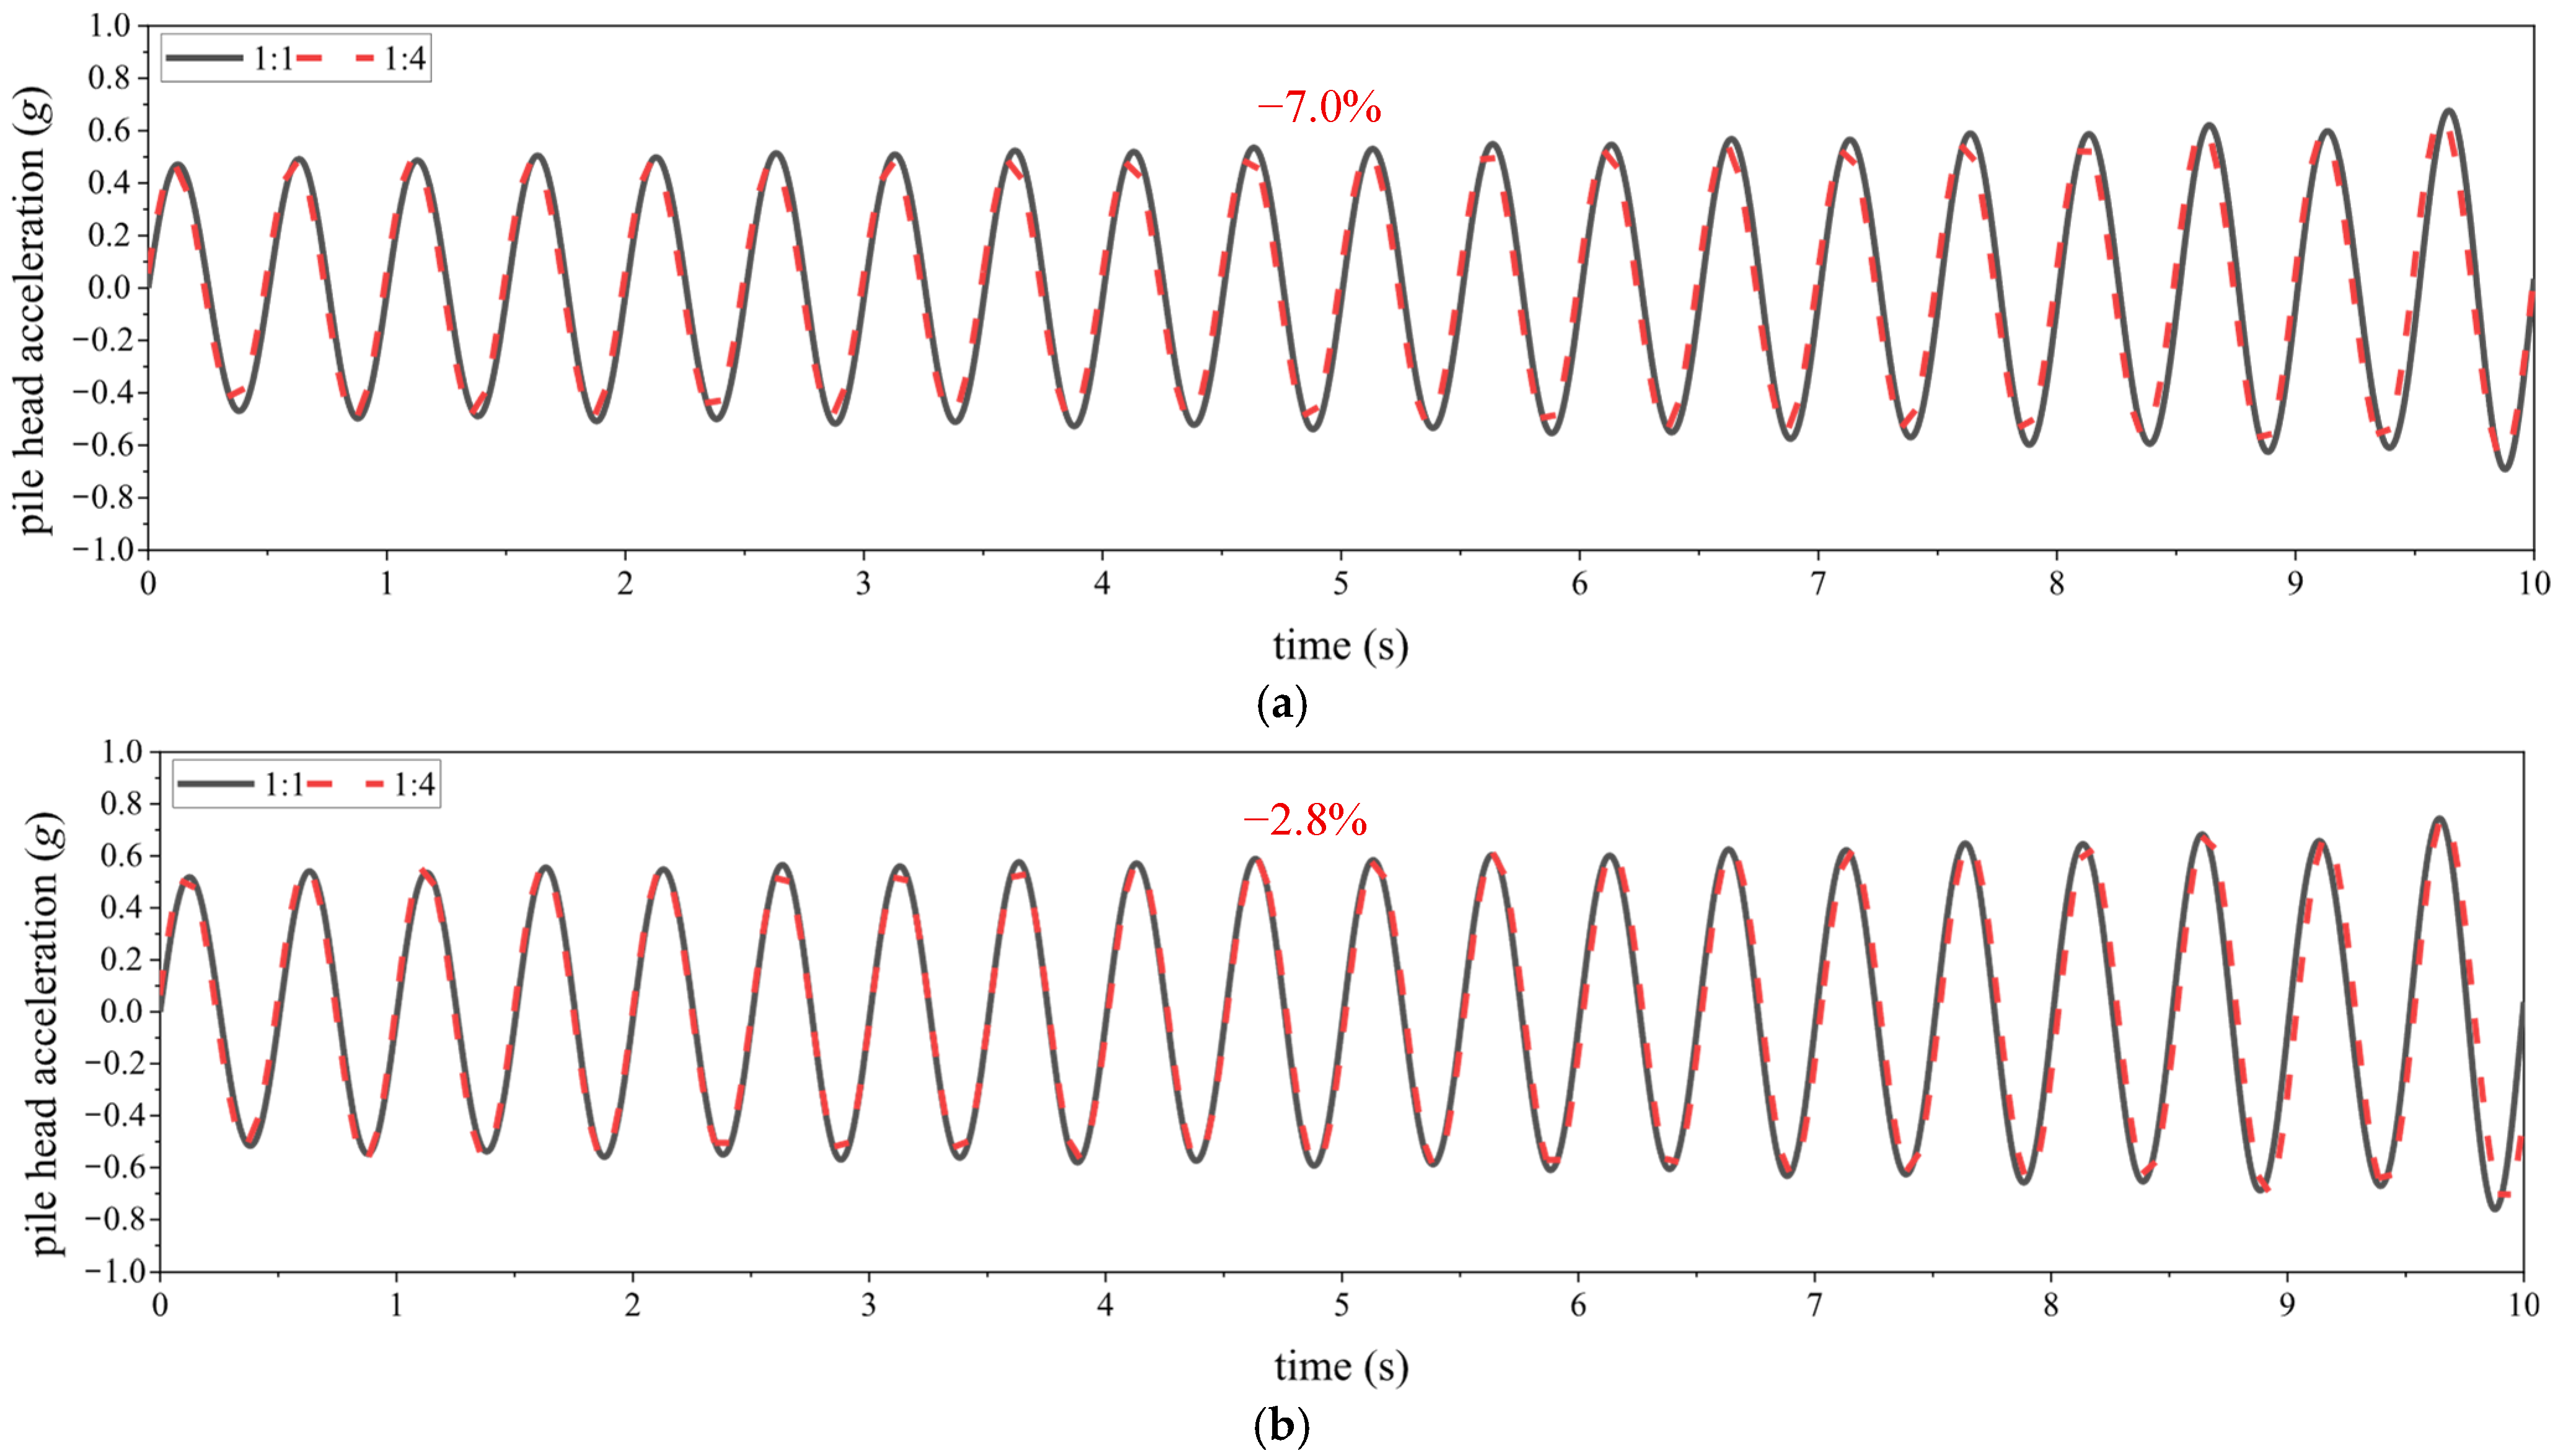
Back-calculated pile head accelerations under different soil surface permeability conditions: (a) soil surface permeable; (b) soil surface impermeable.
As can be seen from Figure 18, Figure 19 and Figure 20, when the soil surface is configured as a permeable boundary and an impermeable boundary, the pore pressure ratio errors at a depth of −0.36 m at 2 s are −8.8% and −1.5%, respectively, while the pile head peak acceleration errors are −7.0% and −2.8%. The errors are smaller under the impermeable boundary condition of the soil surface. From the perspective of the fitting degree of the response curves, the back-calculated curves from the model basically coincide with the prototype curves under the impermeable boundary condition, indicating a better agreement. This verifies that when the proposed liquefaction similarity law is applied, the errors in back-calculating the prototype responses from the model responses are mainly caused by the faster pore pressure dissipation rate of the model due to its smaller soil layer thickness. In the finite element model, such errors can be eliminated by setting the soil surface as an impermeable boundary.
5. Conclusions
Based on the results of shaking table tests, finite element models of saturated sand–pile dynamic interaction systems were established and validated. Parametric analyses were conducted using numerical models to investigate the simulation capability and applicability under different conditions of the proposed liquefaction similarity law for saturated sand–pile shaking table tests under horizontal excitation, considering the dynamic shear modulus error of the model soil. The main conclusions are drawn as follows:
- When applying the proposed similarity law, the acceleration similarity ratio should be set to . This value can satisfy gravity and approximately satisfy elastic force similarity for the investigated configurations, thus enabling the accurate back-calculation of prototype responses from model responses.
- When there is no error in the dynamic shear modulus of the model soil, both the proposed similarity law and the artificial mass similarity law can accurately back-calculate the prototype liquefaction responses. The advantage of the proposed similarity law lies in that it relaxes the similarity requirements for , and , thus being more feasible for implementation. When errors exist in the dynamic shear modulus of the model soil, the proposed similarity law can still accurately predict the prototype liquefaction responses (with errors less than 10%). In contrast, the artificial mass similarity law cannot eliminate the influence induced by the inaccuracies in the dynamic shear modulus of the model soil, leading to considerable errors in the back-calculated prototype liquefaction responses (with a pore pressure ratio error of 42.1% and a pile head peak acceleration error of 44.8%). This proves the distinct advantage of the proposed similarity law in the design of saturated sand–pile shaking table tests under horizontal excitation.
- Under conditions of different superstructure masses, the proposed similarity law enables the accurate back-calculation of prototype liquefaction responses from model liquefaction responses (with errors less than 12%). In addition, when the dynamic ground impedance is dissimilar, the stronger inertial interaction induced by larger superstructure masses amplifies the effects of impedance dissimilarity. With the superstructure mass increasing from 235 kg to 1880 kg, the pore pressure ratio error increases by 36.4%, and the pile head peak acceleration error increases by 73.2%. It can be concluded that when there are errors in the dynamic shear modulus of the model soil, for cases with larger superstructure masses, adjusting the bending stiffness of the model pile according to the proposed similarity law to ensure the similarity of dynamic ground impedance is more crucial for the accurate back-calculation of prototype liquefaction responses.
- Under conditions of different excitation amplitudes, the proposed similarity law enables the accurate back-calculation of prototype liquefaction responses from model liquefaction responses (with errors less than 13%). A decreasing error trend was observed for the investigated excitation amplitudes, likely due to a higher excitation amplitude accelerating the growth rate of the pore pressure ratio, thereby reducing the impact of discrepancies in the pore pressure dissipation rate.
- The proposed similarity law demonstrates accuracy in back-calculating the liquefaction response of soil at different distances from the pile. The error of the back-calculated prototype pore pressure ratio does not exceed 10%, and the farther the distance from the pile, the more accurate the back-calculation results are.
- In the application of the proposed similarity law, the errors in back-calculating the prototype liquefaction responses from the model liquefaction responses are mainly attributed to the faster pore pressure dissipation rate induced by the smaller thickness of the model soil layer. Such errors can be significantly reduced in numerical simulations by adopting an impermeable surface boundary condition. After setting the saturated sand surface as an impermeable boundary, the pore pressure ratio error can be reduced from −8.8% to −1.5%, and the pile head peak acceleration error can be reduced from −7.0% to −2.8%.
Author Contributions
Conceptualization, M.L.; methodology, Y.W.; software, Y.W.; validation, X.W.; formal analysis, C.W.; investigation, Z.F.; resources, M.L.; data curation, Y.W.; writing—original draft preparation, Y.W.; writing—review and editing, Z.F.; visualization, Y.W.; supervision, X.W. and C.W.; project administration, M.L.; funding acquisition, M.L. All authors have read and agreed to the published version of the manuscript.
Funding
This research was funded by the National Natural Science Foundation of China, grant number 52320105004; the Creative Research Groups of National Natural Science Foundation of China, grant number 52421005; and the Discretionary Fund of the National Science Center for Earthquake Engineering, grant number 2025ZZB2005.
Data Availability Statement
The data used to support the findings of this study are available from the corresponding author upon request.
Acknowledgments
The authors express gratitude for the financial support extended by the organizations referenced in the funding section.
Conflicts of Interest
The authors declare no conflicts of interest. The funders had no role in the design of the study; in the collection, analyses, or interpretation of the data; in the writing of the manuscript; or in the decision to publish the results.
References
- Orang, M.J.; Motamed, R.; Prabhakaran, A.; Elgamal, A. Large-scale shake table tests on a shallow foundation in liquefiable soils. J. Geotech. Geoenviron. Eng. 2021, 147, 04020152. [Google Scholar] [CrossRef] [Scilit]
- Zhuang, H.Y.; Wang, X.; Miao, Y.; Yao, E.; Chen, S.; Ruan, B.; Chen, G. Seismic responses of a subway station and tunnel in a slightly inclined liquefiable ground through shaking table test. Soil Dyn. Earthq. Eng. 2019, 116, 371–385. [Google Scholar] [CrossRef] [Scilit]
- Chen, Y.; Lv, Y.; Wu, K.; Huang, X.; Shi, Y.-D. Special-shape similitude law of a soil-pile-structure model for centrifuge shaking table tests. Ocean. Eng. 2023, 286, 115682. [Google Scholar] [CrossRef] [Scilit]
- Chen, Y.; Lv, Y.; Wu, K.; Huang, X. Numerical analysis of bridge piers under earthquakes considering pile-soil interactions and water-pier interactions. Ocean. Eng. 2022, 266, 113023. [Google Scholar] [CrossRef] [Scilit]
- He, R.; Kaynia, A.M.; Zhang, J.S.; Chen, W. Seismic response of monopiles to vertical excitation in offshore engineering. Ocean. Eng. 2020, 216, 108120. [Google Scholar] [CrossRef] [Scilit]
- Huang, Y.M.; Wang, P.G.; Zhao, M.; Zhang, C.; Du, X. Dynamic responses of an end-bearing pile subjected to horizontal earthquakes considering water-pile-soil interactions. Ocean. Eng. 2021, 238, 109726. [Google Scholar] [CrossRef] [Scilit]
- Pan, R.J.; Xu, C.S.; Meite, R.; Chen, J.L. Seismic Performance of Pile Groups under Liquefaction-Induced Lateral Spreading: Insights from Advanced Numerical Modeling. Buildings 2024, 14, 3125. [Google Scholar] [CrossRef] [Scilit]
- Seed, H.B.; Idriss, I.M. A Simplified procedure for evaluating soil liquefaction potential. ASCE Soil Mech. Found. Div. J. 1971, 97, 1249–1273. [Google Scholar] [CrossRef] [Scilit]
- Zhang, Z.Q.; Liu, X.; Wu, W.B.; Liu, K.F.; Pan, E. Kinematic analysis of pile in anisotropic poroelastic soil subjected to vertical incident S-waves. J. Rock Mech. Geotech. Eng. 2025; in press. [CrossRef] [Scilit]
- Wu, W.B.; Liu, C.; El Naggar, M.H.; Liu, H.; Zhang, Z.Q.; Liu, X. Theoretical analysis for dynamic response of helical pipe pile based on helix-modified impedance transfer method. Comput. Geotech. 2025, 188, 107557. [Google Scholar] [CrossRef] [Scilit]
- Liu, H.; Zhang, Y.X.; Dong, X.L.; Gao, Y.; Liu, X.; Li, L.C.; El Naggar, M.H.; Wu, W.B. Analytical solution for lateral dynamic characteristics of offshore pile-bucket foundation embedded in saturated soil. Ocean Eng. 2025, 339, 122153. [Google Scholar] [CrossRef] [Scilit]
- Zhou, S.H.; Feng, Z.J.; Zhang, C.; Zhang, C.C.; Wang, J.K.; Wang, S.Q. Dynamic Response and Damage Analysis of Variable Section Pile Group Foundation at Liquefaction Site Under Different Seismic Intensities. Buildings 2025, 15, 3840. [Google Scholar] [CrossRef] [Scilit]
- Xu, C.S.; Dou, P.F.; Du, X.L.; El Naggar, M.H.; Miyajima, M.; Chen, S. Seismic performance of pile group-structure system in liquefiable and non-liquefiable soil from large-scale shake table tests. Soil Dyn. Earthq. Eng. 2020, 138, 106299. [Google Scholar] [CrossRef] [Scilit]
- Bhattacharya, S.; Lombardi, D.; Wood, D.M. Similitude relationships for physical modelling of monopile-supported offshore wind turbines. Int. J. Phys. Model. Geotech. 2011, 11, 58–68. [Google Scholar] [CrossRef] [Scilit]
- Bhattacharya, S.; Lombardi, D.; Dihoru, L.; Dietz, M.S.; Crewe, A.J.; Taylor, C.A. Model container design for soil-structure interaction studies. In Role of Seismic Testing Facilities in Performance-Based Earthquake Engineering; Springer: Dordrecht, The Netherlands, 2012; pp. 135–158. [Google Scholar]
- Lombardi, D.; Bhattacharya, S.; Scarpa, F.; Bianchi, M. Dynamic response of a geotechnical rigid model container with absorbing boundaries. Soil Dyn. Earthq. Eng. 2015, 69, 46–56. [Google Scholar] [CrossRef] [Scilit]
- Iai, S. Similitude for shaking table tests on soil-structure-fluid model in 1g gravitational field. Soils Found. 1989, 29, 105–118. [Google Scholar] [CrossRef] [Scilit]
- Iai, S.; Tobita, T.; Nakahara, T. Generalised scaling relations for dynamic centrifuge tests. Geotechnique 2005, 55, 355–362. [Google Scholar] [CrossRef]
- Han, Q.; Wang, Y.; Liu, M.; Lu, Y.; Wu, H.; Wang, Z. Liquefaction Similarity Law for Saturated Sand-Pile Shaking Table Tests Under Horizontal Excitation Considering Soil Shear Modulus Error. J. Earthq. Eng. 2025, 1–31. [Google Scholar] [CrossRef] [Scilit]
- Jiang, T.; Tajimi, H. Soil-Structure Dynamic Interaction Analysis Method: Principles and Applications of the Thin-Layer Method; Tongji University Press: Shanghai, China, 2009; Volume 341. (In Chinese) [Google Scholar]
- Ad Hoc Group. Analyses for Soil-Structure Interaction Effects for Nuclear Power Plants; ASCE: New York, NY, USA, 1980. [Google Scholar]
- Anoyatis, G.; Lemnitzer, A. Dynamic pile impedances for laterally-loaded piles using improved Tajimi and Winkler formulations. Soil Dyn. Earthq. Eng. 2017, 92, 279–297. [Google Scholar] [CrossRef] [Scilit]
- Han, Q.; Wang, Y.; Liu, M.; Li, H. Study on dynamic characteristics of saturated manufactured sand model soil for shaking table test. China Civ. Eng. J. 2024, 57, 110–122. (In Chinese) [Google Scholar] [CrossRef]
- Wang, Z.; He, J.; Gao, H.; Wang, B.; Shen, J. Dynamic pore water pressure model for liquefiable soils based on theory of thixotropic fluid. Chin. J. Geotech. Eng. 2018, 40, 2332–2340. (In Chinese) [Google Scholar] [CrossRef]
- Chen, H.J.; Chen, S.; Chen, S.C.; Zhang, X.; Wang, L. Dynamic behavior of sawdust-mixed soil in shaking table test. Soil Dyn. Earthq. Eng. 2021, 142, 106542. [Google Scholar] [CrossRef] [Scilit]
- Alzabeebee, S.; Forcellini, D. Numerical Simulations of the Seismic Response of a RC Structure Resting on Liquefiable Soil. Buildings 2021, 11, 379. [Google Scholar] [CrossRef] [Scilit]
- Elgamal, A.; Yang, Z.H.; Parra, E.; Ragheb, A. Modeling of cyclic mobility in saturated cohesionless soils. Int. J. Plast. 2003, 19, 883–905. [Google Scholar] [CrossRef] [Scilit]
- Li, Y.; Li, D.; Zhang, Y. Effects of grain size distribution and surface texture on shear behaviors at saturated sand-steel interface. Chin. J. Geotech. Eng. 2024, 46, 335–344. (In Chinese) [Google Scholar] [CrossRef]
- Chuai, M.Z. Numerical simulation of shaking table tests on a soil-structure system. J. Asian Archit. Build. Eng. 2022, 21, 1002–1018. [Google Scholar] [CrossRef] [Scilit]
- GB 50007-2011; Code for Design of Building Foundation. China Architecture & Building Press: Beijing, China, 2011. (In Chinese)

Disclaimer/Publisher’s Note: The statements, opinions and data contained in all publications are solely those of the individual author(s) and contributor(s) and not of MDPI and/or the editor(s). MDPI and/or the editor(s) disclaim responsibility for any injury to people or property resulting from any ideas, methods, instructions or products referred to in the content. |
© 2026 by the authors. Licensee MDPI, Basel, Switzerland. This article is an open access article distributed under the terms and conditions of the Creative Commons Attribution (CC BY) license.