


Abstract
This paper presents an experimental study on the cyclic performance of large-scale composite plate shear walls–concrete encased (C-PSW/CE). Three C-PSW/CE specimens with concrete panels of different thicknesses were tested under cyclic loading. Their failure mode, lateral load–drift ratio relationship, strength and stiffness deterioration, and hysteretic energy dissipation were systematically analyzed. Initial concrete cracking occurred at a drift ratio of approximately 0.24%, while the three specimens reached their load-bearing capacities at a drift ratio of 1.34%. The results demonstrated that concrete panel thickness significantly influences the buckling behavior of the steel web plate. Thicker concrete panels provide enhanced out-of-plane restraint stiffness, delaying steel plate buckling and shifting the failure mode from overall to local buckling. Furthermore, an increased concrete thickness improves both the load-bearing and hysteretic energy dissipation capacities of the walls. These findings offer valuable insights for the design and application of C-PSW/CE in seismic-resistant structures.
1. Introduction
Composite plate shear walls–concrete encased (C-PSW/CE) are composed of a steel plate with concrete panels on one or both sides of the plate, as well as a boundary steel frame. The seismic performance of C-PSW/CE highly depends on the composite action of its components. The thickness of the concrete panel is a critical design parameter, as it directly regulates the out-of-plane restraint stiffness of the steel plate, thereby influencing the wall’s buckling mode, load-bearing capacity, ductility, and energy dissipation mechanisms.
Studies have compared the performance of C-PSW/CE with that of steel plate shear walls (SPSWs) and found that C-PSW/CE have a superior load-bearing capacity compared to SPSWs [1,2]. Composite plate shear walls have shown good ductility and energy dissipation performance under cyclic loading, as reported in [3,4,5].
The effects of different parameters on C-PSW/CE have been studied, such as concrete panels on one side or both sides of the steel plate [6]; the thickness of the steel plate, the number of headed studs, and the reinforcement ratio [7]; the beam-to-column connection and middle beam stiffness [8]; and two-side-connected or four-side-connected C-PSW/CE [9]. The results showed that the C-PSW/CE specimen with concrete panels on both sides of the steel plate had a higher energy dissipation capacity and shear strength compared to specimens with a concrete panel on only one side. The lateral stiffness, shear strength, and buckling load of C-PSW/CE decreased with low headed stud spacing, while its ductility improved with increasing the spacing of headed studs. In addition, the hysteretic energy dissipation performance of C-PSW/CE did not improve by increasing the reinforcement ratio of reinforced concrete panels, and the middle beam stiffness and beam–column connection had little influence on C-PSW/CE’s cyclic performance. Furthermore, the two-side-connected C-PSW/CE was prone to overall buckling, so its shear strength and lateral stiffness were lower than the four-side-connected C-PSW/CE specimen.
Recent research on C-PSW/CE has extended to novel materials, such as lightweight concrete, ceramic concrete, and ultra-high-performance concrete used in composite shear walls. Rassouli et al. [10] experimentally compared the cyclic behavior of three C-PSW/CE specimens containing normal and lightweight concrete. The results showed that the shear strength of C-PSW/CE with lightweight concrete was comparable to that of C-PSW/CE with normal-weight concrete, but the weight of the former was reduced by 36%. The development trends were similar for the lateral stiffness of all three specimens. The energy dissipation capacity of the C-PSW/CE specimen with two concrete panels was significantly higher than that of the other specimens. Yang et al. [11] numerically studied the shear behavior of composite plate shear walls–engineered cementitious materials encasing both sides of the steel plate and found that the walls showed a good shear performance. Ayazi et al. [12] studied composite shear walls with high-performance fiber concrete encasement using cyclic tests. The shear strength, lateral stiffness, and energy consumption capacity of the walls with concrete encasement on one or both sides of the steel web plate were similar. Composite shear walls with an ultra-high-performance concrete encasement showed a good deformation capacity [13]. Studies have investigated the use of high-performance fiber concrete, engineered cementitious composites, and ultra-high-performance concrete to enhance crack resistance and energy dissipation, while reducing panel thickness and weight [11,12,13].
Researchers have studied the shear performance and design method of C-PSW/CE under monotonic loading. Arabzade et al. [14] theoretically obtained the shear buckling coefficient of composite shear walls, and the coefficient could be used to determine the spacing of headed studs. Amani et al. [15] numerically investigated the shear performance of composite plates under pure shear loading, and the shear capacity of the composite panels with cover plates on both sides of the steel plate was significantly larger compared to the composite panels with a cover plate only on one side of the steel plate. Dey and Bhowmich [16] conducted dynamic time history analyses of both single-bay four-story and six-story C-PSW/CE specimens, and all specimens showed a stable seismic performance. Shafaei et al. [17] numerically investigated the influence of concrete thickness on the shear performance of C-PSW/CE and found that the shear strength of C-PSW/CE increased when increasing the thickness of the concrete panel. A pushover analysis on C-PSW/CE was conducted to study the interactions between the composite plate and boundary frame, the steel plate and concrete panels [18]. The shear strength of composite shear walls consisting of one steel plate and one concrete panel was studied using numerical and theoretic methods [19]. The formula for calculating the shear strength of C-PSW/CE was developed, taking into account the eccentric effect of the concrete panel being on only one side of the steel plate. Qi et al. [20,21,22] performed finite element analyses to study the demands of concrete panel thickness and internal force for headed studs in C-PSW/CE.
Numerical modeling techniques have advanced with the adoption of machine learning and artificial intelligence to predict the hysteretic performance and failure modes of shear walls. Djerrad et al. [23] developed a deep learning-based model that accurately simulates the responses of shear walls with varying design parameters, offering a tool for rapid performance evaluation and design optimization.
Although prior studies have investigated various parameters related to shear walls, such as concrete type [10,11,12,13], headed stud spacing [7], and connection details [9], systematic experimental research focusing on the fundamental parameter of concrete panel thickness is lacking. The existing research often treats the concrete panel as a component with a fixed thickness or explores its theoretical requirements only in limited numerical analyses [20,21,22]; there is a lack of empirical data from systematic cyclic tests that quantitatively reveal the impact of panel thickness variation on the full-range hysteretic performance, including failure mode transition (overall buckling to local buckling), stiffness/strength degradation patterns, and hysteretic energy dissipation capacity. Because of this gap, the selection of panel thickness in design often relies on empirical judgment or conservative estimates, failing to fully exploit the potential of concrete panels in optimizing structural performance.
To address this research gap, this study aimed to quantitatively investigate the decisive influence of concrete panel thickness on the seismic performance of C-PSW/CE through systematic low-cycle reversed loading tests. Specifically, three 1/3-scale C-PSW/CE specimens with varying concrete panel thicknesses (20 mm, 30 mm, and 40 mm) were designed and then tested to address the following key scientific questions: (1) How does concrete panel thickness quantitatively affect the shear wall’s elastic stiffness, peak load capacity, and buckling mode, including the threshold for transition from overall to local buckling? (2) How does concrete panel thickness control the damage progression under cyclic loading, including crack development, concrete crushing, and the law of strength degradation? (3) What is the quantitative impact of concrete panel thickness on the shear wall’s hysteretic energy dissipation efficiency and deformation capacity? The findings of this study will provide direct experimental evidence for establishing performance-based design guidelines for concrete panel thickness, promoting the refined design and application of this high-performance shear wall system.
2. Experimental Methods
2.1. Test Specimens
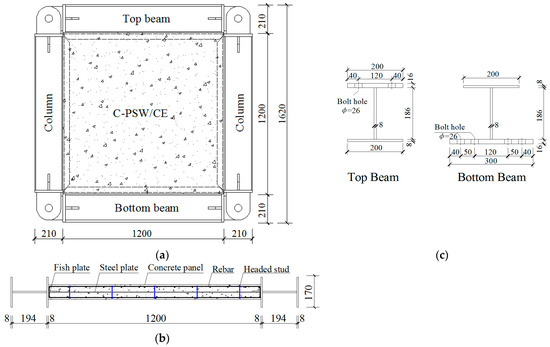
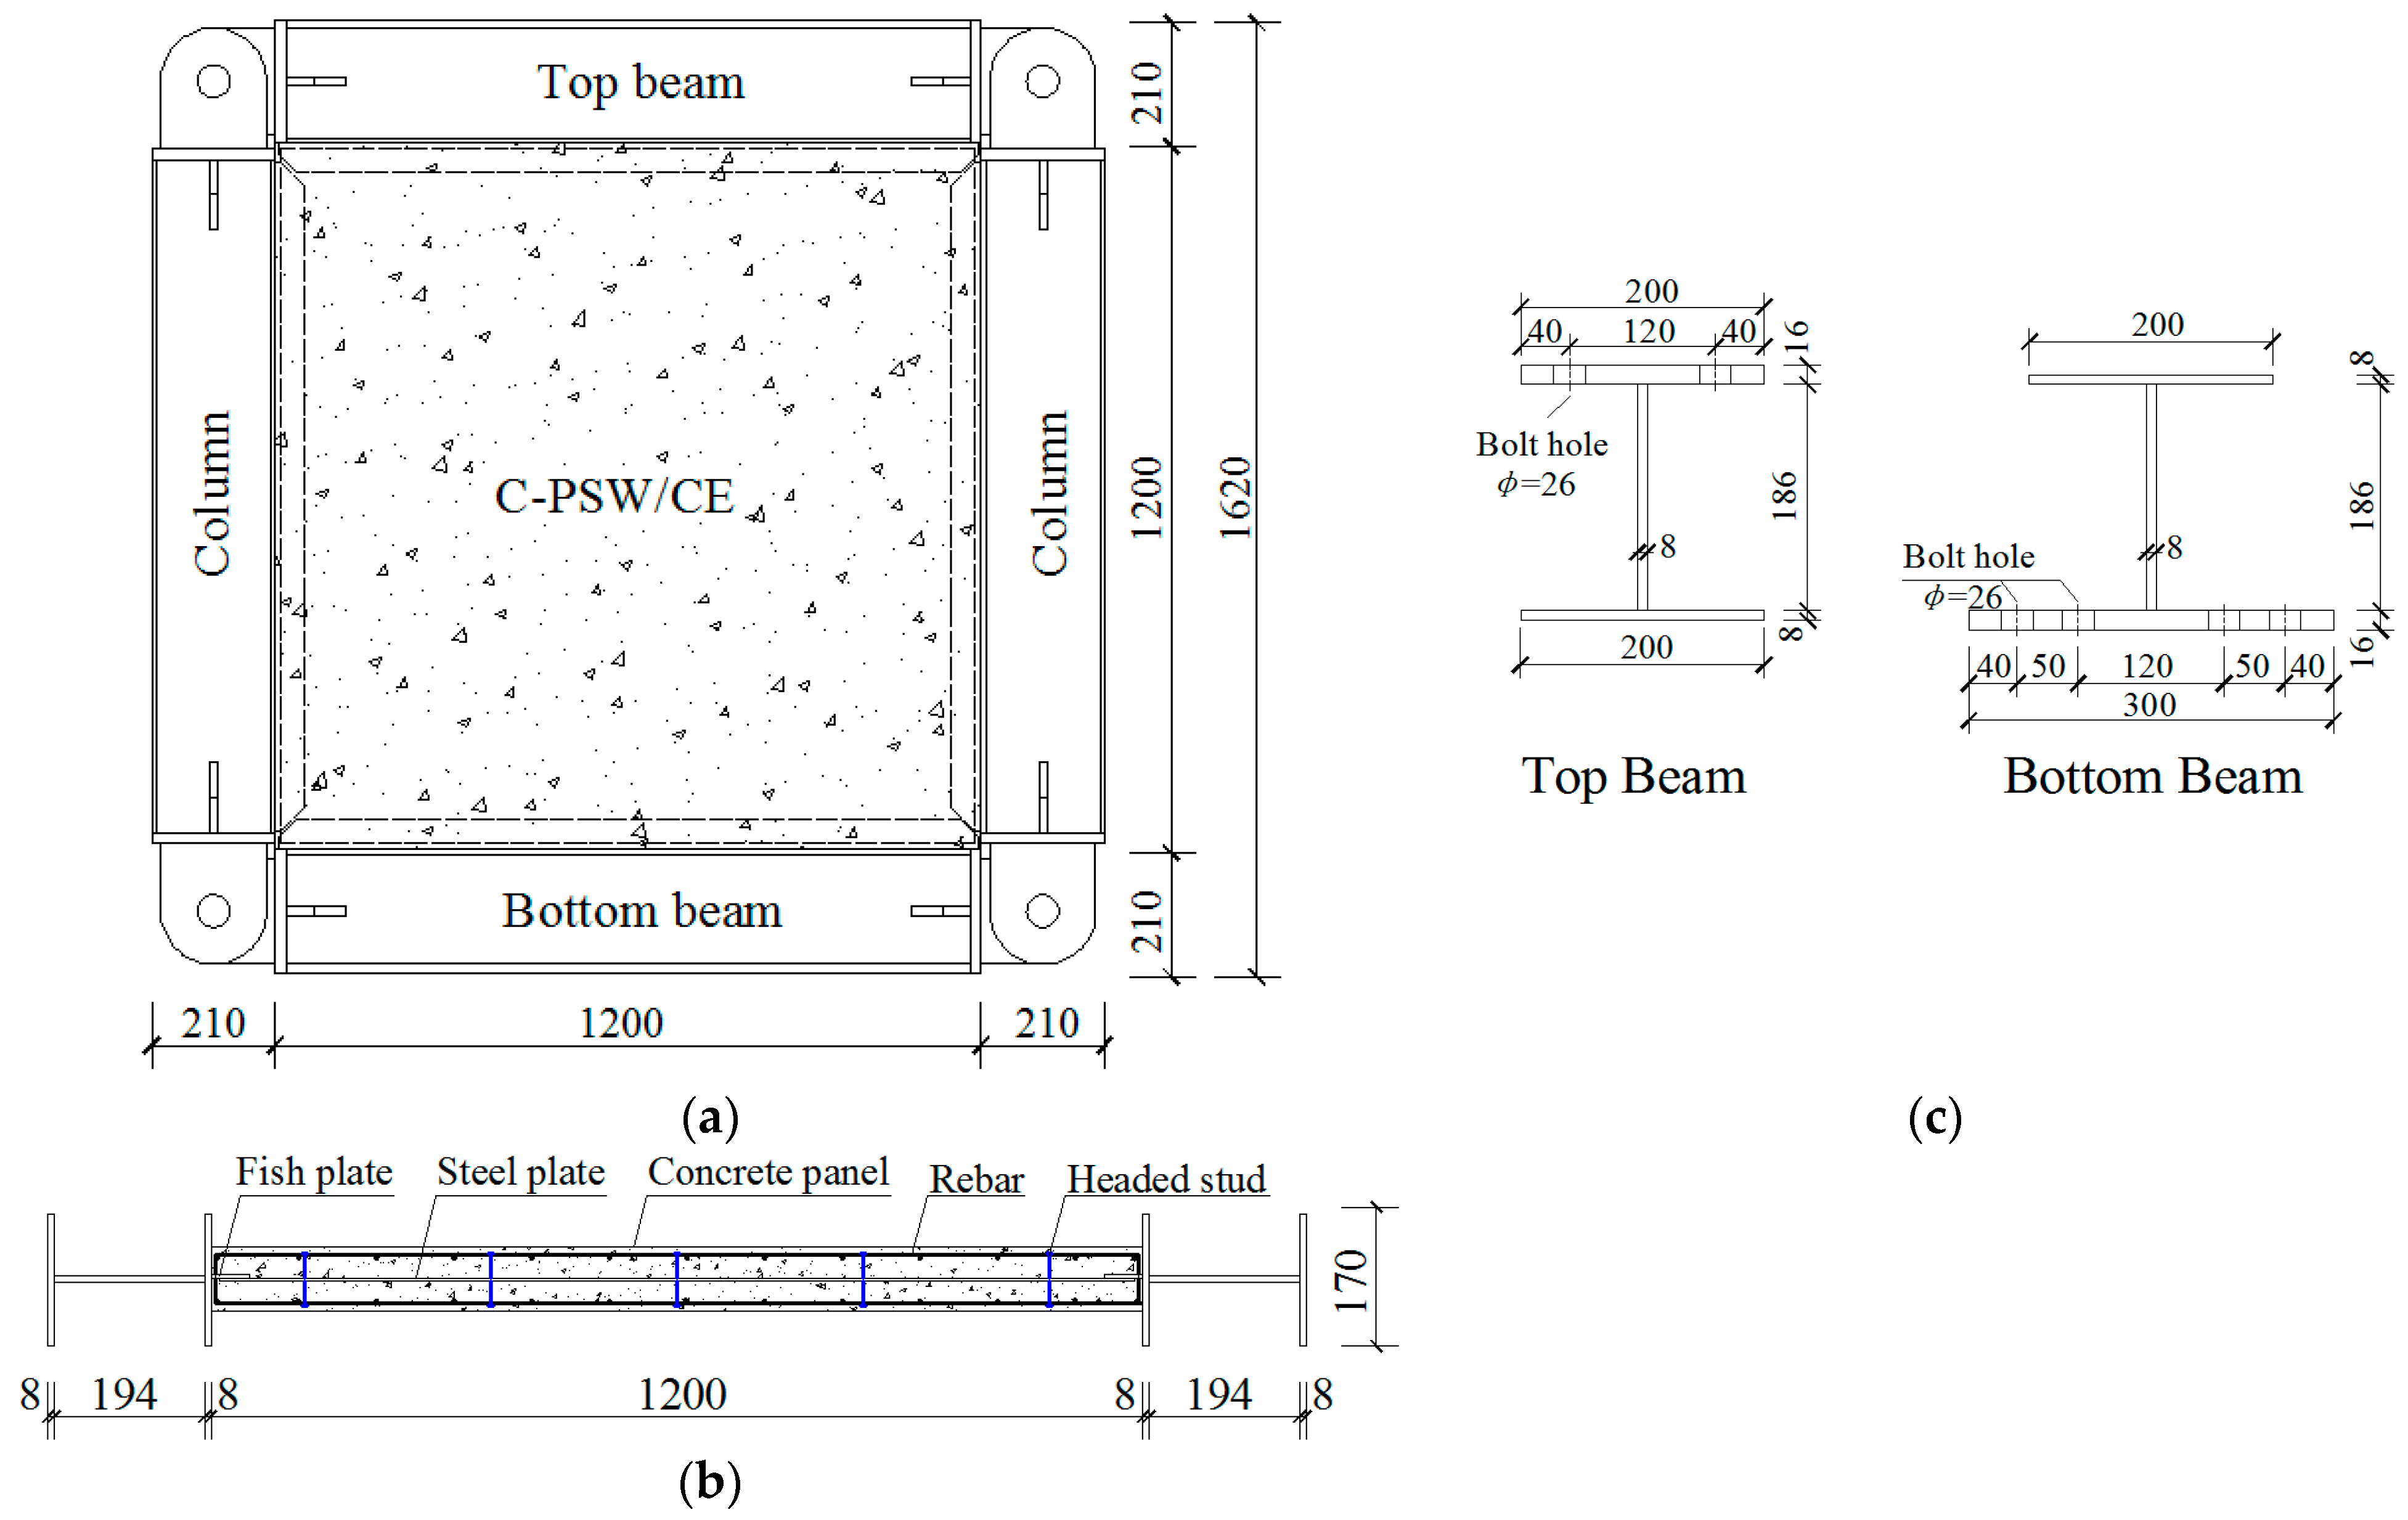
Three 1/3-scale C-PSW/CE specimens (W1, W2, and W3) with the same height and width of 1620 mm and an aspect ratio of 1.0 were constructed and tested in the Jiangsu Provincial Key Laboratory of Structural Engineering at Suzhou University of Science and Technology. The elevation view and cross-section of the specimen are illustrated in Figure 1a and Figure 1b, respectively. Each specimen was composed of an infill composite shear wall panel (hereafter referred to as a wall panel), boundary steel beams, and columns. The wall panel of each specimen was 1200 mm high. The beam-to-column connections were captured by pin shafts. A steel web, 2.5 mm thick, was connected to boundary beams and columns by fishplates and laterally supported by two cast-in-place concrete panels. Next, 10 mm diameter headed studs were welded to the steel web, in a layout of five rows and five columns. The cross-sections of boundary beams are presented in Figure 1c. To connect the loading beam, two rows of 26 mm diameter holes spaced at 80 mm were machined in the outer flange of top beam. In addition, four rows of bolt holes were cut in the lower flange of the bottom beam to fix the specimen to the reaction beam.
Figure 1.
Details of specimens: (a) elevation view, (b) cross-section, and (c) cross-section of boundary beams (units: mm).
The concrete panel thicknesses on each side of the steel web were 20 mm, 30 mm, and 40 mm in specimens W1, W2, and W3, respectively. The concrete panels were reinforced in both horizontal and vertical directions. In specimen W1, the diameter of the rebars was 4 mm, the spacing was 50 mm, and the reinforcement ratio was 1.31%. In specimens W2 and W3, the 6 mm diameter rebars were arranged in the concrete panels at s spacing of 100 mm. The corresponding reinforcement ratios in specimens W2 and W3 were 1.02% and 0.77%, respectively.
The concrete panel thickness series (each side) for specimens W1, W2, and W3 of 20 mm, 30 mm, and 40 mm, respectively, were determined using the following interconnected principles:
(1) Upper Limit (40 mm)
The maximum thickness was constrained by the loading capacity of our laboratory actuator (1000 kN). Detailed preliminary finite element pushover analysis indicated that the estimated peak load for a specimen with a 40 mm thick panel would approach this limit. Setting the upper bound at 40 mm was therefore a necessary and scientific decision to ensure the safety, completeness, and comparability of the experimental procedure for all specimens on the same setup.
(2) Benchmark (30 mm)
A key objective of this study was to provide experimental data relevant to design codes. AISC 341-16 [24] often stipulates a minimum concrete panel thickness of 100 mm for full-scale C-PSW/CE. The corresponding theoretical thickness for this study 1/3-scale model is approximately 33 mm. Therefore, 30 mm was selected as the central benchmark thickness to directly evaluate the performance of a model with a thickness comparable to the code-specified value and to assess the associated safety margin.
(3) Lower Limit and Parametric Spectrum (20 mm)
To systematically investigate the effect of thickness, a 20 mm case, below the code benchmark, was deliberately introduced. This creates a complete and meaningful parameter series (20 mm, 30 mm, and 40 mm) that covers scenarios below, near, and above the code-recommended value. This design is highly effective for revealing quantitative trends, identifying potential performance thresholds, and understanding the impact of thickness on failure mechanisms.
A 1/3 geometric scale was adopted for this study. The design follows the theory of similitude in structural model testing to ensure that the model responses can effectively reflect the behavior of a full-scale prototype. The rationale is detailed as follows:
(1) Geometric similarity
All critical linear dimensions, including the overall wall height and width, thicknesses of concrete panels and the steel plate, boundary frame member sections, and connector spacing, were strictly scaled down by a factor of 3. This ensures a complete similarity in geometric configuration between the model and the prototype, forming the foundation for simulating its mechanical behavior.
(2) Kinematic compatibility (deformation similarity)
The test employed the drift as the loading control parameter. This means that the calculated drift ratio levels corresponding to the elastic deformation, yielding, peak capacity, and ultimate state of the model are directly equivalent to the performance levels expected in a full-scale prototype under corresponding seismic demands. Consequently, comparability in deformation modes and failure mechanisms is ensured.
(3) Stress Level Comparability
To achieve comparable stress states in critical regions (e.g., the steel plate and concrete panels) between the model and prototype, two key measures were implemented: (i) Material identity: The model uses identical steel and concrete materials as the intended prototype, ensuring a consistency in elastic modulus, yield strength, and constitutive relationships, which is the prerequisite for stress similarity. (ii) Design under feasibility constraints: While adhering to the aforementioned similitude principles, the final selection of the 1/3 scale also holistically considered the capacity limit of the laboratory actuator (1000 kN). This ensures that all specimens can be safely and completely tested through the full-range loading process until failure using the same setup.
It is acknowledged that perfect similitude is difficult to achieve. The primary sources of scale effects include the size effect in concrete (e.g., the proportional influence of aggregate size on crack development) and the incomplete simulation of gravity effects. To minimize the impact of scale effects and uphold the validity of the study’s core findings, a controlled-variable comparative strategy was employed: all specimens (W1, W2, and W3) were tested under identical scaling ratios, material batches, loading protocols, and boundary conditions. Therefore, while the absolute quantitative mechanical values may differ from a full-scale prototype, the conclusions drawn from the comparison of relative performance differences, evolutionary trends, and failure mechanisms among specimens with varying concrete thicknesses are highly reliable and valid. The primary objective of this study, to systematically reveal the influence trend of the “concrete panel thickness” parameter, is fully achievable with this scaled model design.
2.2. Material Properties
The coupon tests of the steel plate and rebars are conducted. Table 1 lists the elastic modulus Es, yield strength fy, tensile strength fu, and elongation ratio δ obtained for the plate and rebars. In this table, ϕ denotes the diameter of the rebar, and ts is the thickness of the steel plate. For headed studs, the yield strength was 320 MPa and the tensile strength was 400 MPa.
Table 1.
Material properties of steel.
The two sides of the steel web plate were denoted as A and B. Concrete was poured on both sides, A and B, forming three 150 mm × 150 mm × 150 mm test cubes, respectively. These concrete cubes were cured under the same conditions as the specimens and tested on the test day. Table 2 presents the concrete compressive strengths obtained.
Table 2.
Material properties of concrete.
2.3. Test Setup and Loading Protocol
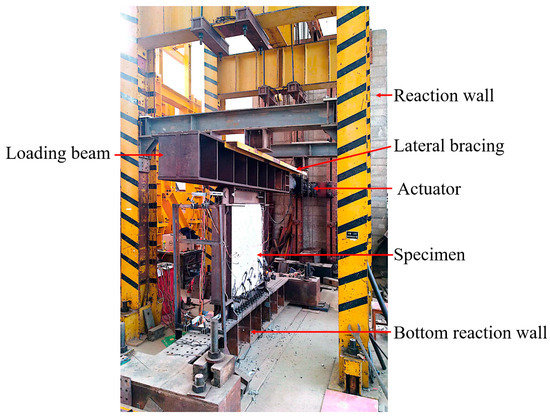
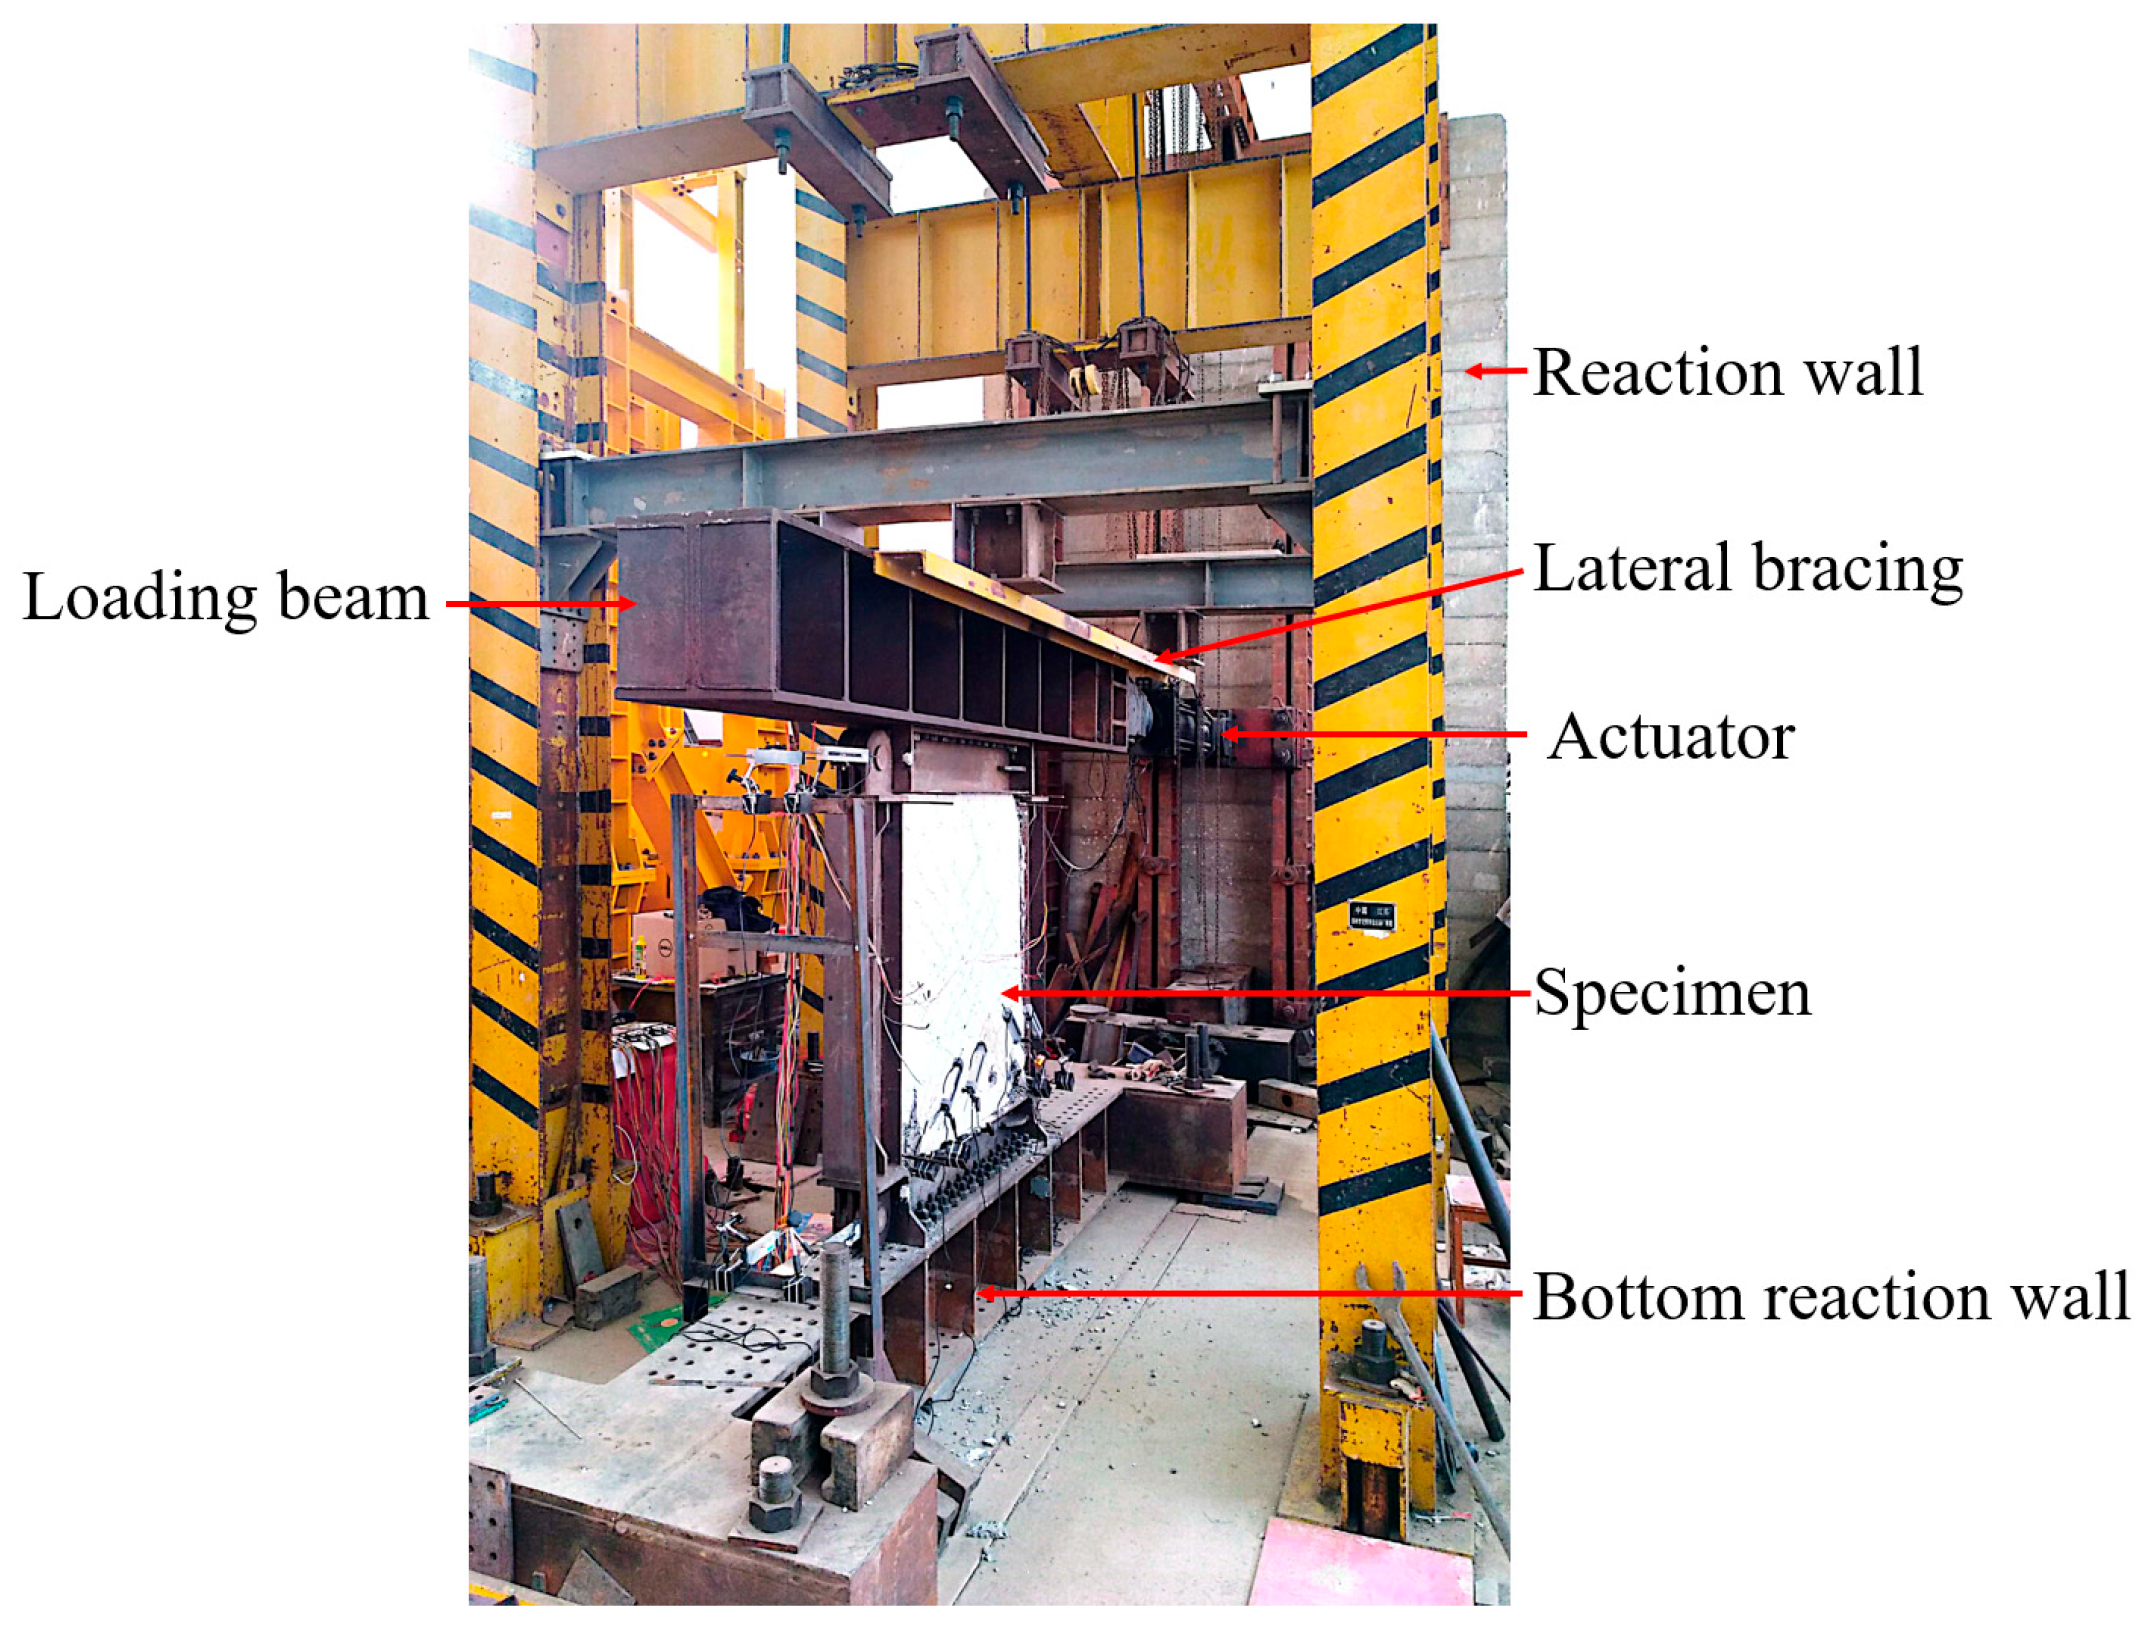
All C-PSW/CE specimens were tested under cyclic loading. This test setup, which consists of an actuator, a loading beam, a reaction wall, a reaction beam, and lateral bracing, is illustrated in Figure 2. One end of the actuator was secured to the loading beam using high-strength bolts, while its opposite end was fixed to the reaction wall. The loading beam was supported on both sides with lateral bracing to prevent out-of-plane displacement of the specimen. The bottom reaction beam was fixed to the laboratory floor through eight anchors. The specimen’s top beam was connected to the loading beam using 28 Grade 10.9 high-strength bolts, simulating the constraint from a floor slab. In addition, 60 high-strength bolts were used to fix the specimen’s bottom beam to the bottom reaction beam, simulating a fixed foundation. The beam-to-column connections were designed as pins (see Figure 1) to isolate the bending moment capacity of the boundary frame, thereby ensuring that the lateral load was primarily resisted by the infill wall panel. This setup focused the study on the inherent performance of the shear wall itself.
Figure 2.
Test setup.
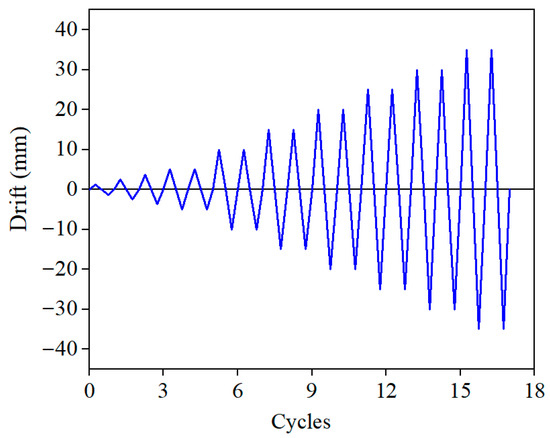
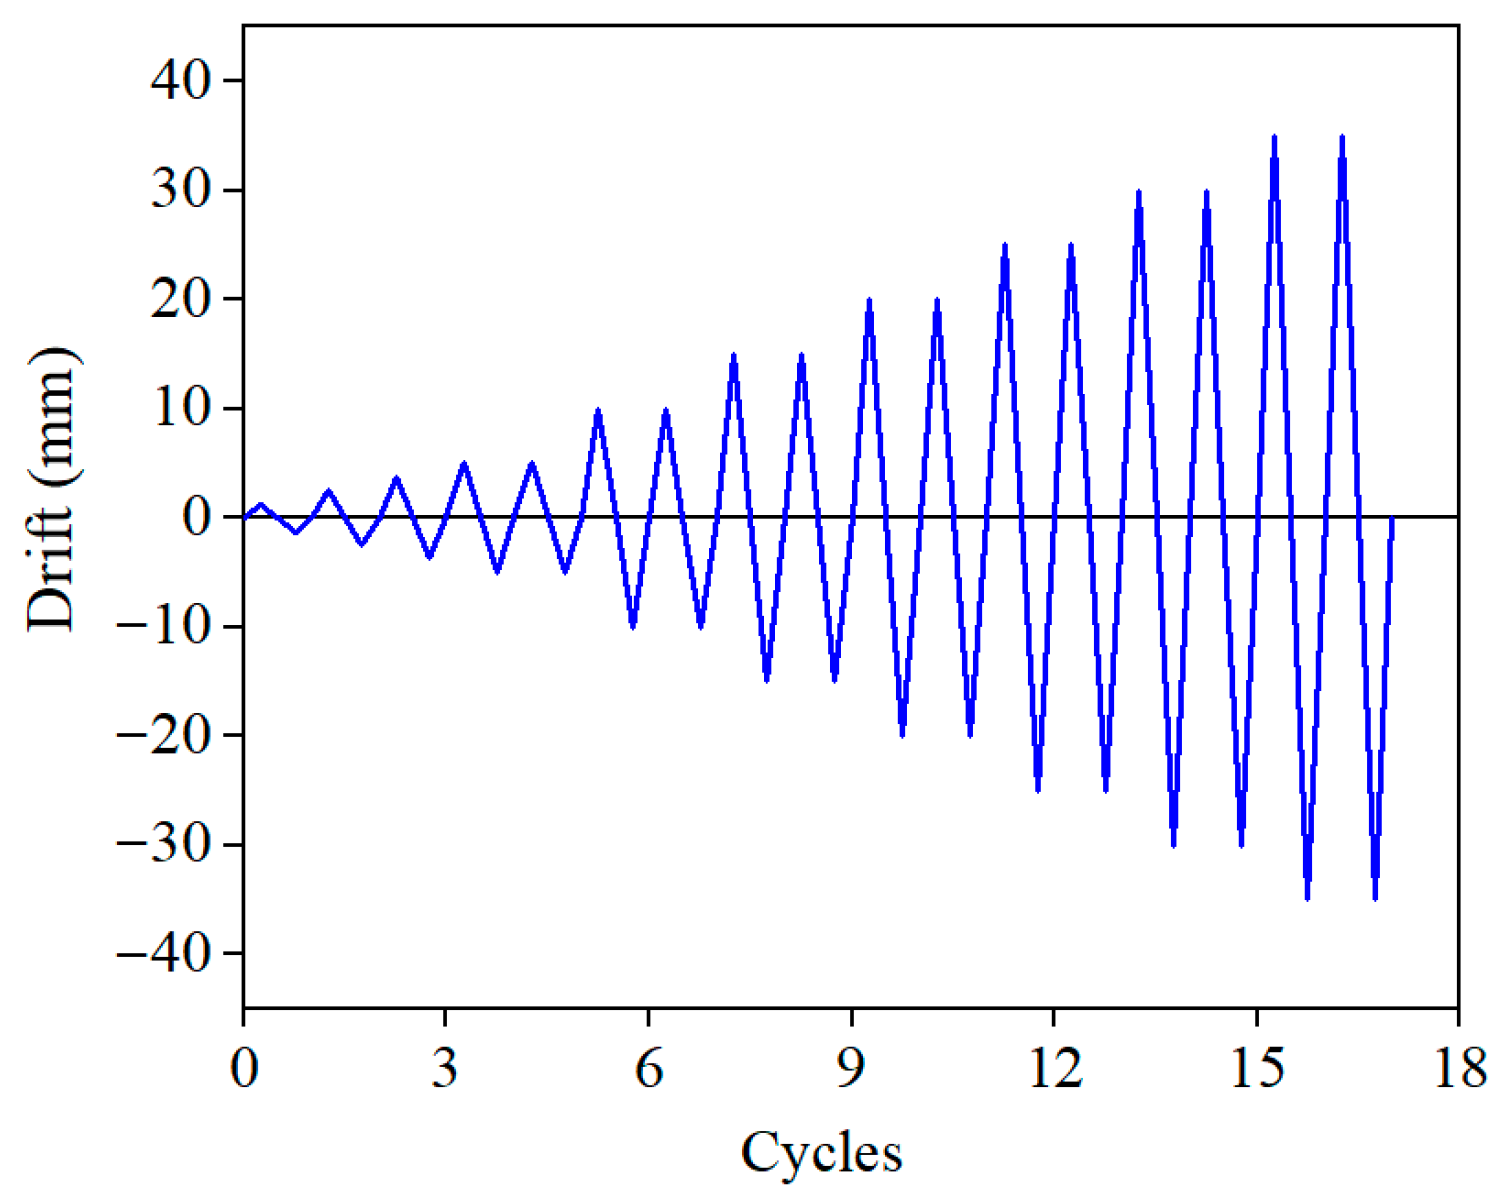
The displacement-controlled cyclic loading protocol (Figure 3) was designed in accordance with the Specification for Seismic Test of Buildings (MOHURD, 2015) [25] to address specific seismic performance objectives. The drift ratio (θ), a key performance indicator, was calculated as the actuator displacement divided by the total specimen height. When the actuator was pushed outward, the displacement was recorded as positive, and when the actuator was pushed inward, the displacement was recorded as negative.
Figure 3.
Loading protocol.
The 5 mm threshold corresponds to a drift ratio of approximately 0.3%. This is widely recognized as the transition point from the elastic to the elasto-plastic phase for shear walls, roughly corresponding to the performance limit under a Frequent (Minor) Earthquake. Before this point, the structure is predominantly elastic. Therefore, one cycle was applied per load step to efficiently pass through the elastic phase while accurately capturing the initial stiffness and crack initiation.
For drift ratios exceeding 0.3%, the structure enters the elasto-plastic phase, simulating the response to Design Basis and Rare Intense Earthquakes. Here, 2 cycles were applied per load step, with a step increment of 0.3% (corresponding to 5 mm). Testing continued until specimen failure or until the lateral load degraded by more than 15% from its peak value to assess the collapse prevention capacity.
2.4. Instrumentation
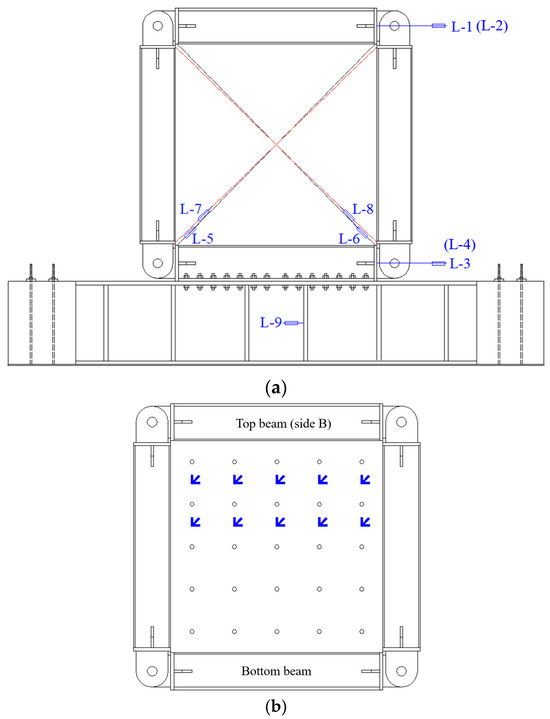
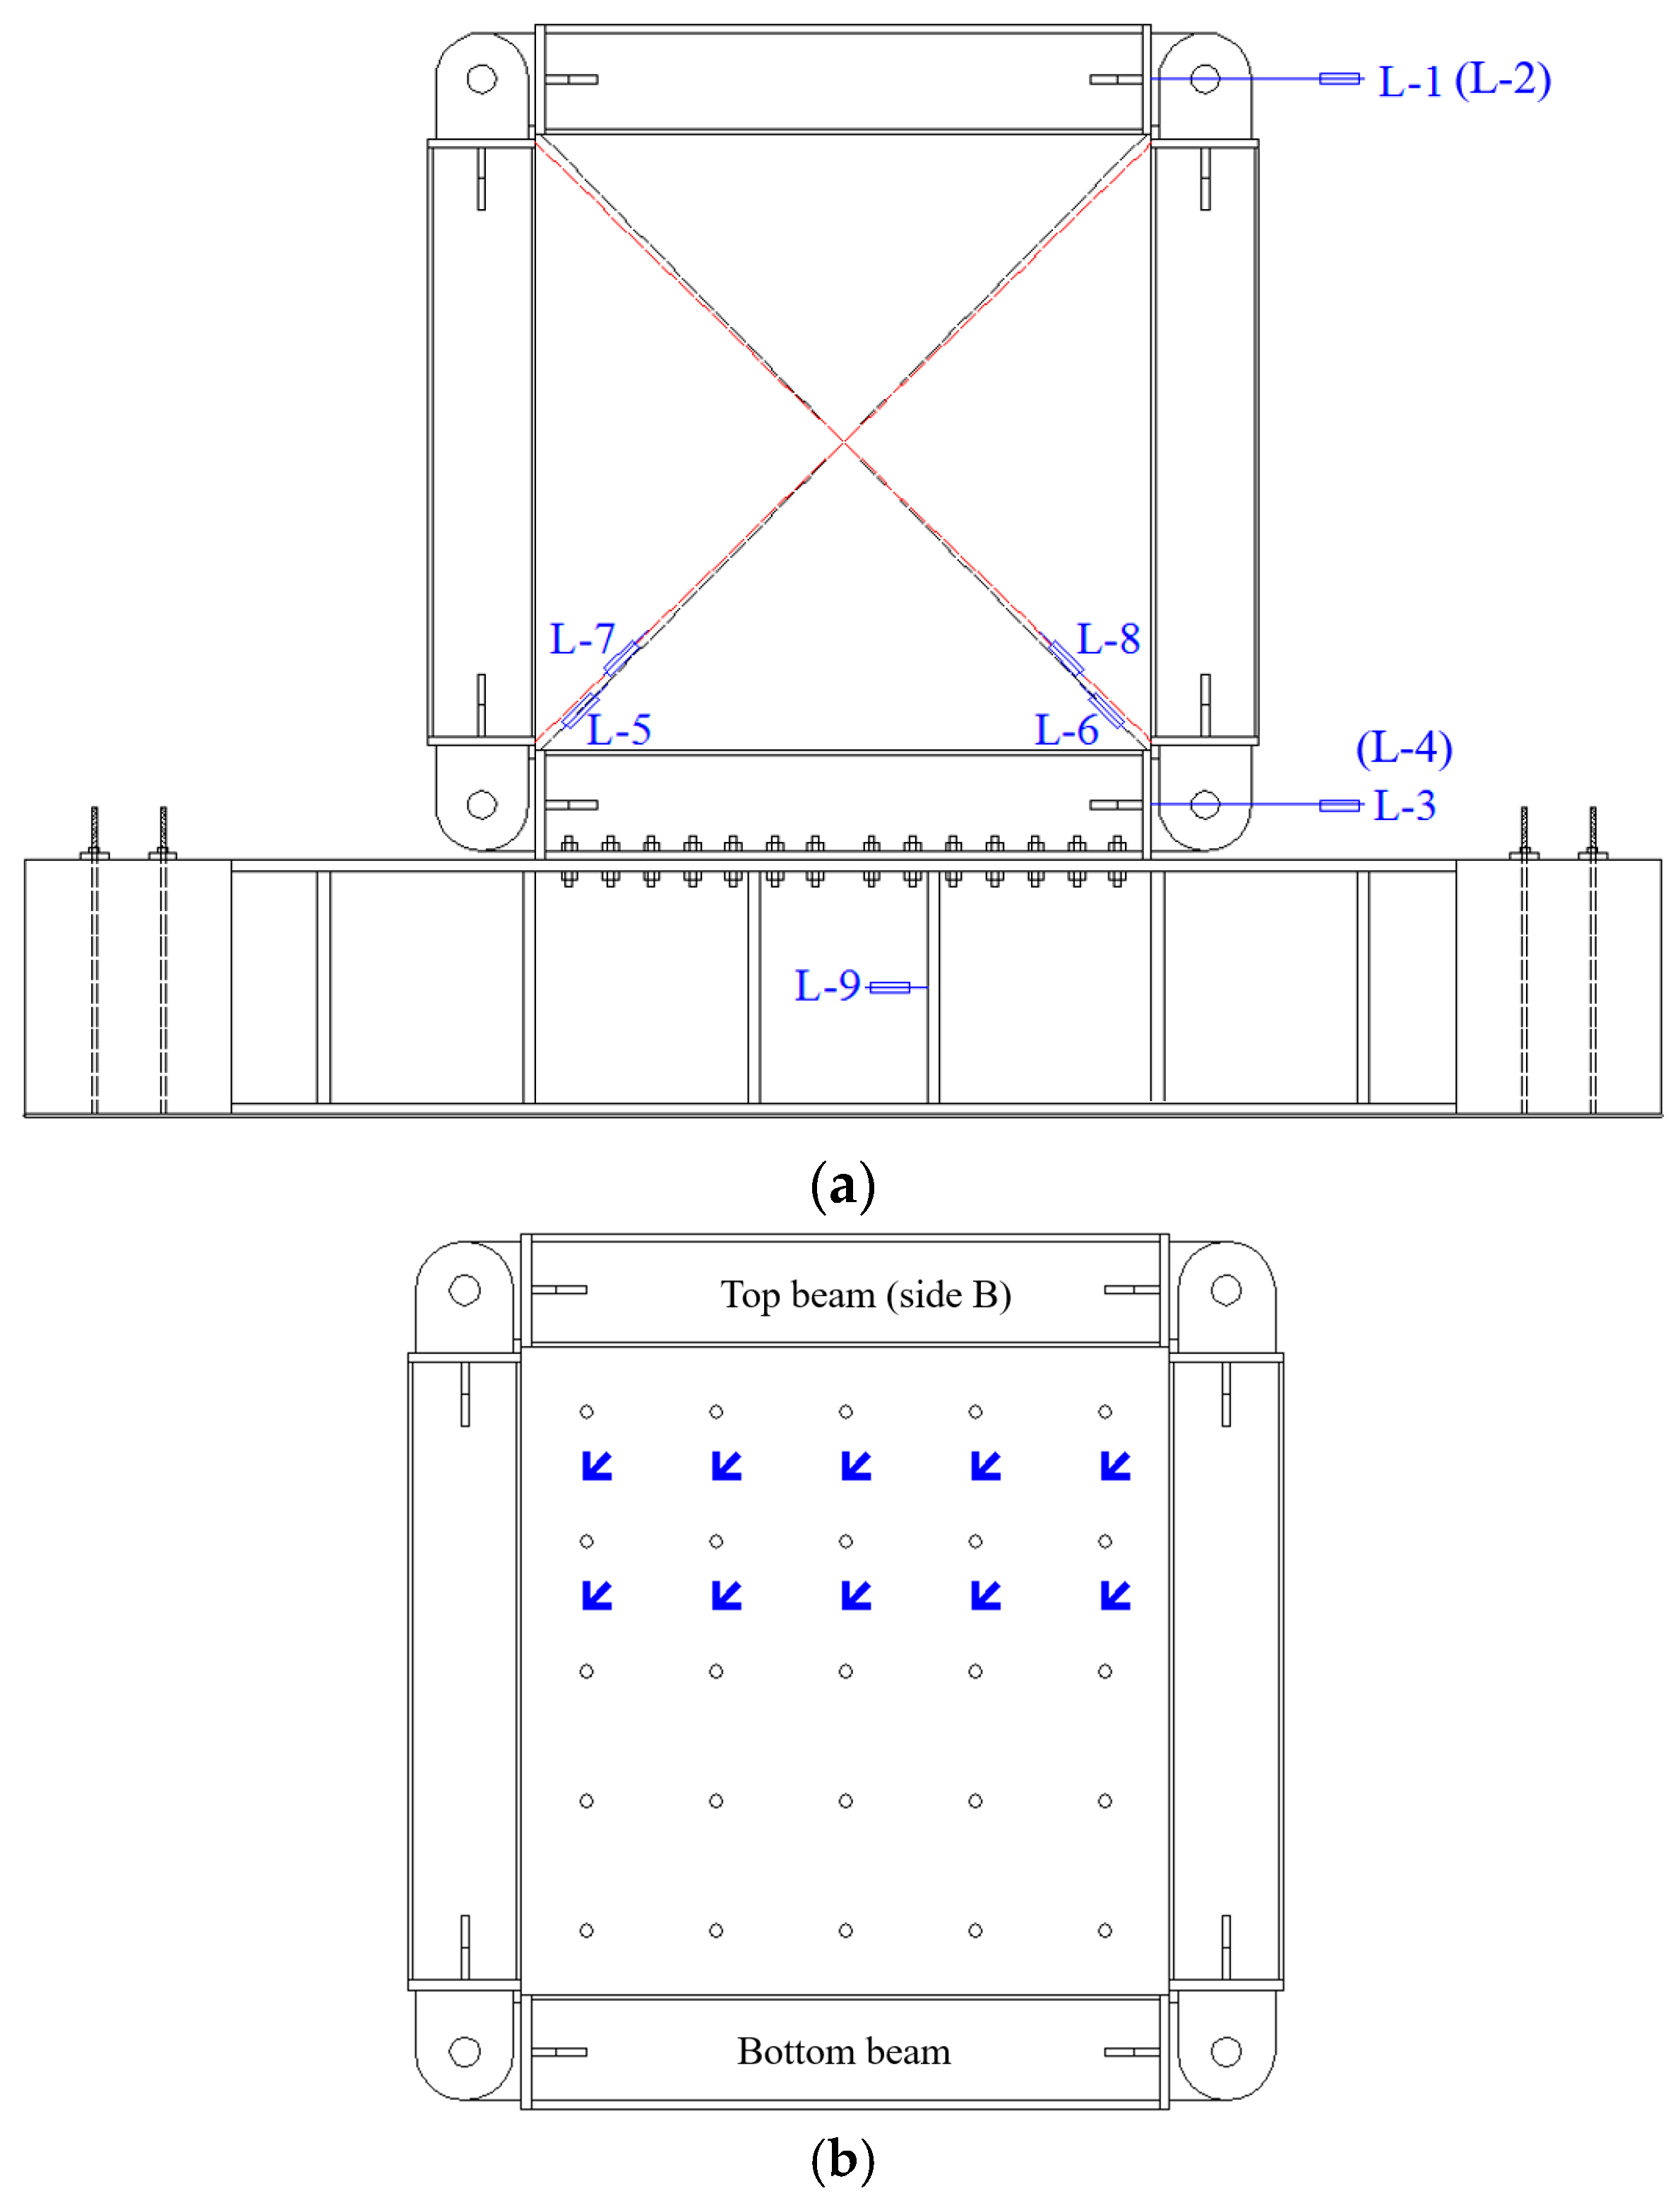
To obtain the displacement of specimens during the test, linear variable differential transformers (LVDTs) were mounted on the key points of each specimen, as illustrated in Figure 4a. To accurately obtain the drift of specimens, LVDTs L-1 through L-4 were installed at the mid-depths of both top and bottom beams (two LVDTs on each). The drift ratio θ of each specimen was calculated by dividing the average relative horizontal displacement between the mid-depths of the top and bottom beams by the clear height H0 between these two reference lines, as shown in Equation (1).
where D1–D4 are the displacements of specimen measured using LVDT L1–L4, respectively.
Figure 4.
Layout of linear variable differential transformers: (a) layout of LVDTs and (b) layout of strain rosettes.
LVDTs L-5 through L-8 were placed along the diagonal direction of the steel web wall to calculate its shear deformation; LVDT L-9 at the bottom reaction beam was used to measure its slip. As shown in Figure 4b, strain rosettes were arranged on the steel plate to monitor the principal strain development in critical regions (particularly along the diagonal direction) in order to identify the onset of yielding, stress state, and potential buckling behavior of the steel plate.
3. Experimental Results and Discussion
3.1. Damage to Specimens
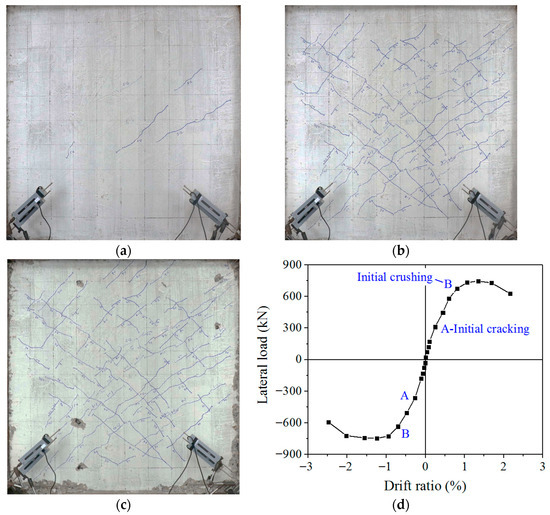
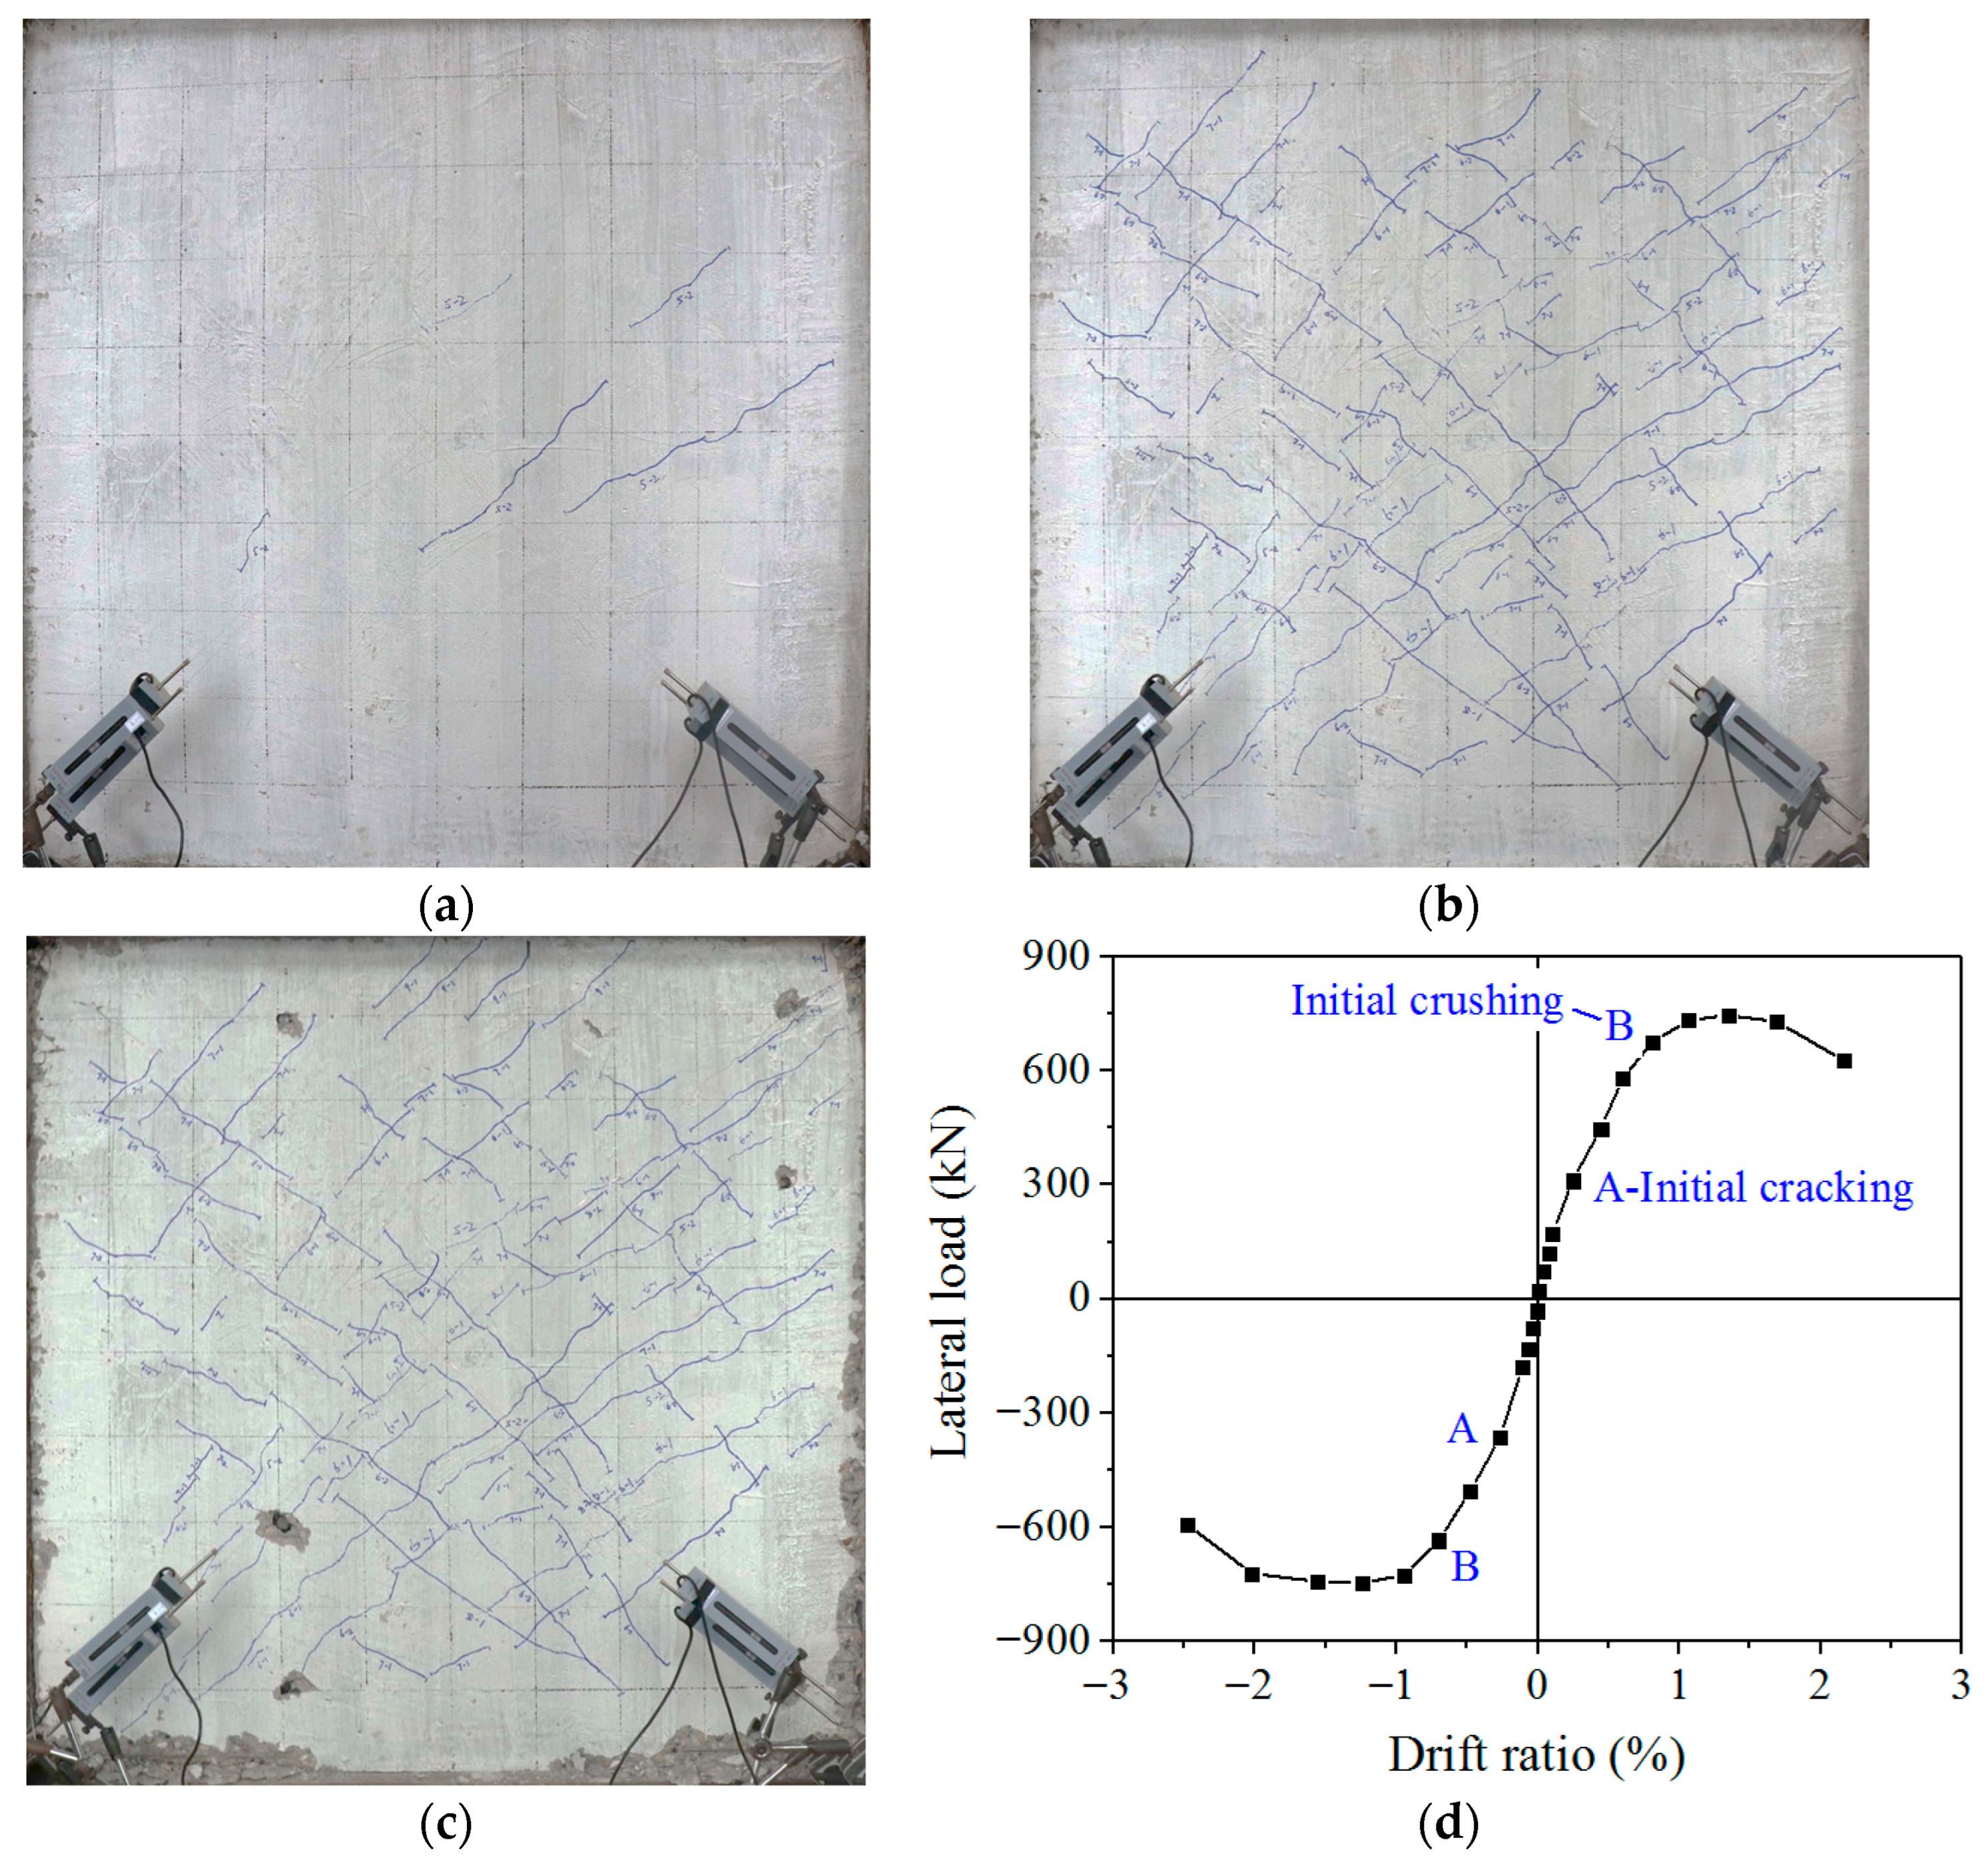
The progression of damage to the C-PSW/CE specimens with different concrete thicknesses are similar and could be essentially divided into three stages: stage I, initial cracking (see Figure 5a); stage II, cracking developing (see Figure 5b); and stage III, concrete collapse and the steel plate buckling. The failure of the specimen W1 at the end of the test is shown in Figure 5c. Figure 5d presents the progression of damage to the C-PSW/CE specimen in detail, illustrating the backbone curve of the lateral load–drift ratio relationship for the specimen W1, and key points are marked in this curve.
Figure 5.
Failure mode and backbone curve of the lateral load–drift ratio relationship for specimen W1: (a) initial cracking of the concrete panel, (b) crack distribution in the concrete panel, (c) concrete damage at the end of the test, and (d) backbone curve.
Stage I: Initial cracking (beginning of loading to onset of cracking in concrete panels): The concrete panels of the specimens W1, W2, and W3 cracked at the fifth load step, and the drift ratio was approximately 0.24%. As shown in Figure 5a, a few short, fine cracks appeared near the diagonal of the concrete panel in specimen W1, with the cracks oriented at an angle of approximately 45° relative to the horizontal. The primary cause of these cracks was the principal tensile stress in the concrete exceeding the tensile strength of the concrete; this stress arose from the composite action of the system, specifically due to shear from the headed studs, compression from the frame flanges, and the interfacial bond between the steel and the concrete panel.
Table 3 shows the drift ratios and loads at key damage stages for each specimen. Although the concrete panel thickness of specimen W2 (30 mm) is 50% higher than that of W1 (20 mm), their cracking loads are essentially the same. This finding indicated that, during the elastic stage, concrete cracking is primarily controlled by the stress state of the steel plate, and minor-to-moderate variations in concrete thickness do not significantly alter the load distribution ratio between the steel and concrete. However, when the concrete panel thickness increased to 40 mm (specimen W3), the cracking load rose notably, indicating that the concrete panel began to contribute substantially to the overall elastic stiffness.
Table 3.
Drift ratios and loads at key damage stages for each specimen.
During stage I, specimen W1 was essentially in the elastic range, and the backbone curve of its lateral load–drift ratio relationship was linear, as illustrated in Figure 5d.
Stage II: Crack development (concrete cracking (point A in Figure 5d) to onset of concrete crushing (point B in Figure 5d)): At this stage, more cracks were formed in the concrete panel, gradually connecting with increasing displacement. Most cracks were distributed in the middle of the concrete panels, as shown in Figure 5b, with a few cracks at the edges. The orientation of the cracks was approximate along the diagonal of the concrete panels, and cracks generated during the positive loading were perpendicular to those generated during the negative loading. As the displacement increased, the concrete panels began to get crushed.
As presented in Table 3, the drift ratio at the onset of concrete crushing increased notably with concrete thickness, ranging from 0.81% for specimen W1 to 1.09% for specimen W3. This quantitative trend indicated that thicker concrete panels significantly retard the intensification of damage. During this stage, no visible out-of-plane deformation occurred. Based on the strain measured with the strain rosettes on the steel plate, the steel web yielded at several points. As depicted in Figure 5d, specimen W1 exhibited slight nonlinear behavior.
Stage III: Concrete crushing and the steel web plate buckling (concrete crushing (point B) to specimen failure): As the displacement increased during this stage, the concrete panels were crushed and spalled at their bottom corners. In addition, the concrete around the headed studs was crushed, and the headed studs became visible. As the displacement continued to increase, the concrete panel warped outward at the bottom corners, and the steel web plate buckled, as shown in Figure 5c. As shown in Table 3, steel plate buckling occurred in specimen W1 at a drift ratio of 1.07% and a corresponding load of 733 kN, prior to specimen W1’s peak load of 743 kN at 1.34% drift. For specimens W2 and W3, the steel web plates buckled as they reached their peak loads; at a drift ratio of 1.34%, the peak loads were 809 kN and 891 kN, respectively.
The results indicate that concrete panel thickness significantly influences steel plate buckling. In specimen W1, with thinner concrete panels (20 mm), the steel plate buckled before reaching the peak load, indicating that an insufficient restraint stiffness led to failure, regulated by stability. In contrast, in specimens W2 and W3, with thicker concrete panels (30 mm and 40 mm, respectively), the adequate restraint stiffness led to the steel plate coinciding with the peak loads, shifting the failure mode to the more desirable material strength control. This finding confirms that using sufficiently thick concrete panels is essential to ensure that the composite shear wall can fully use its strength and ductility potential.
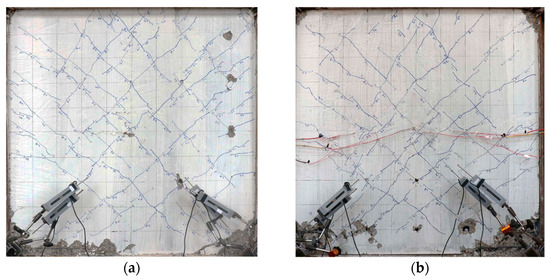
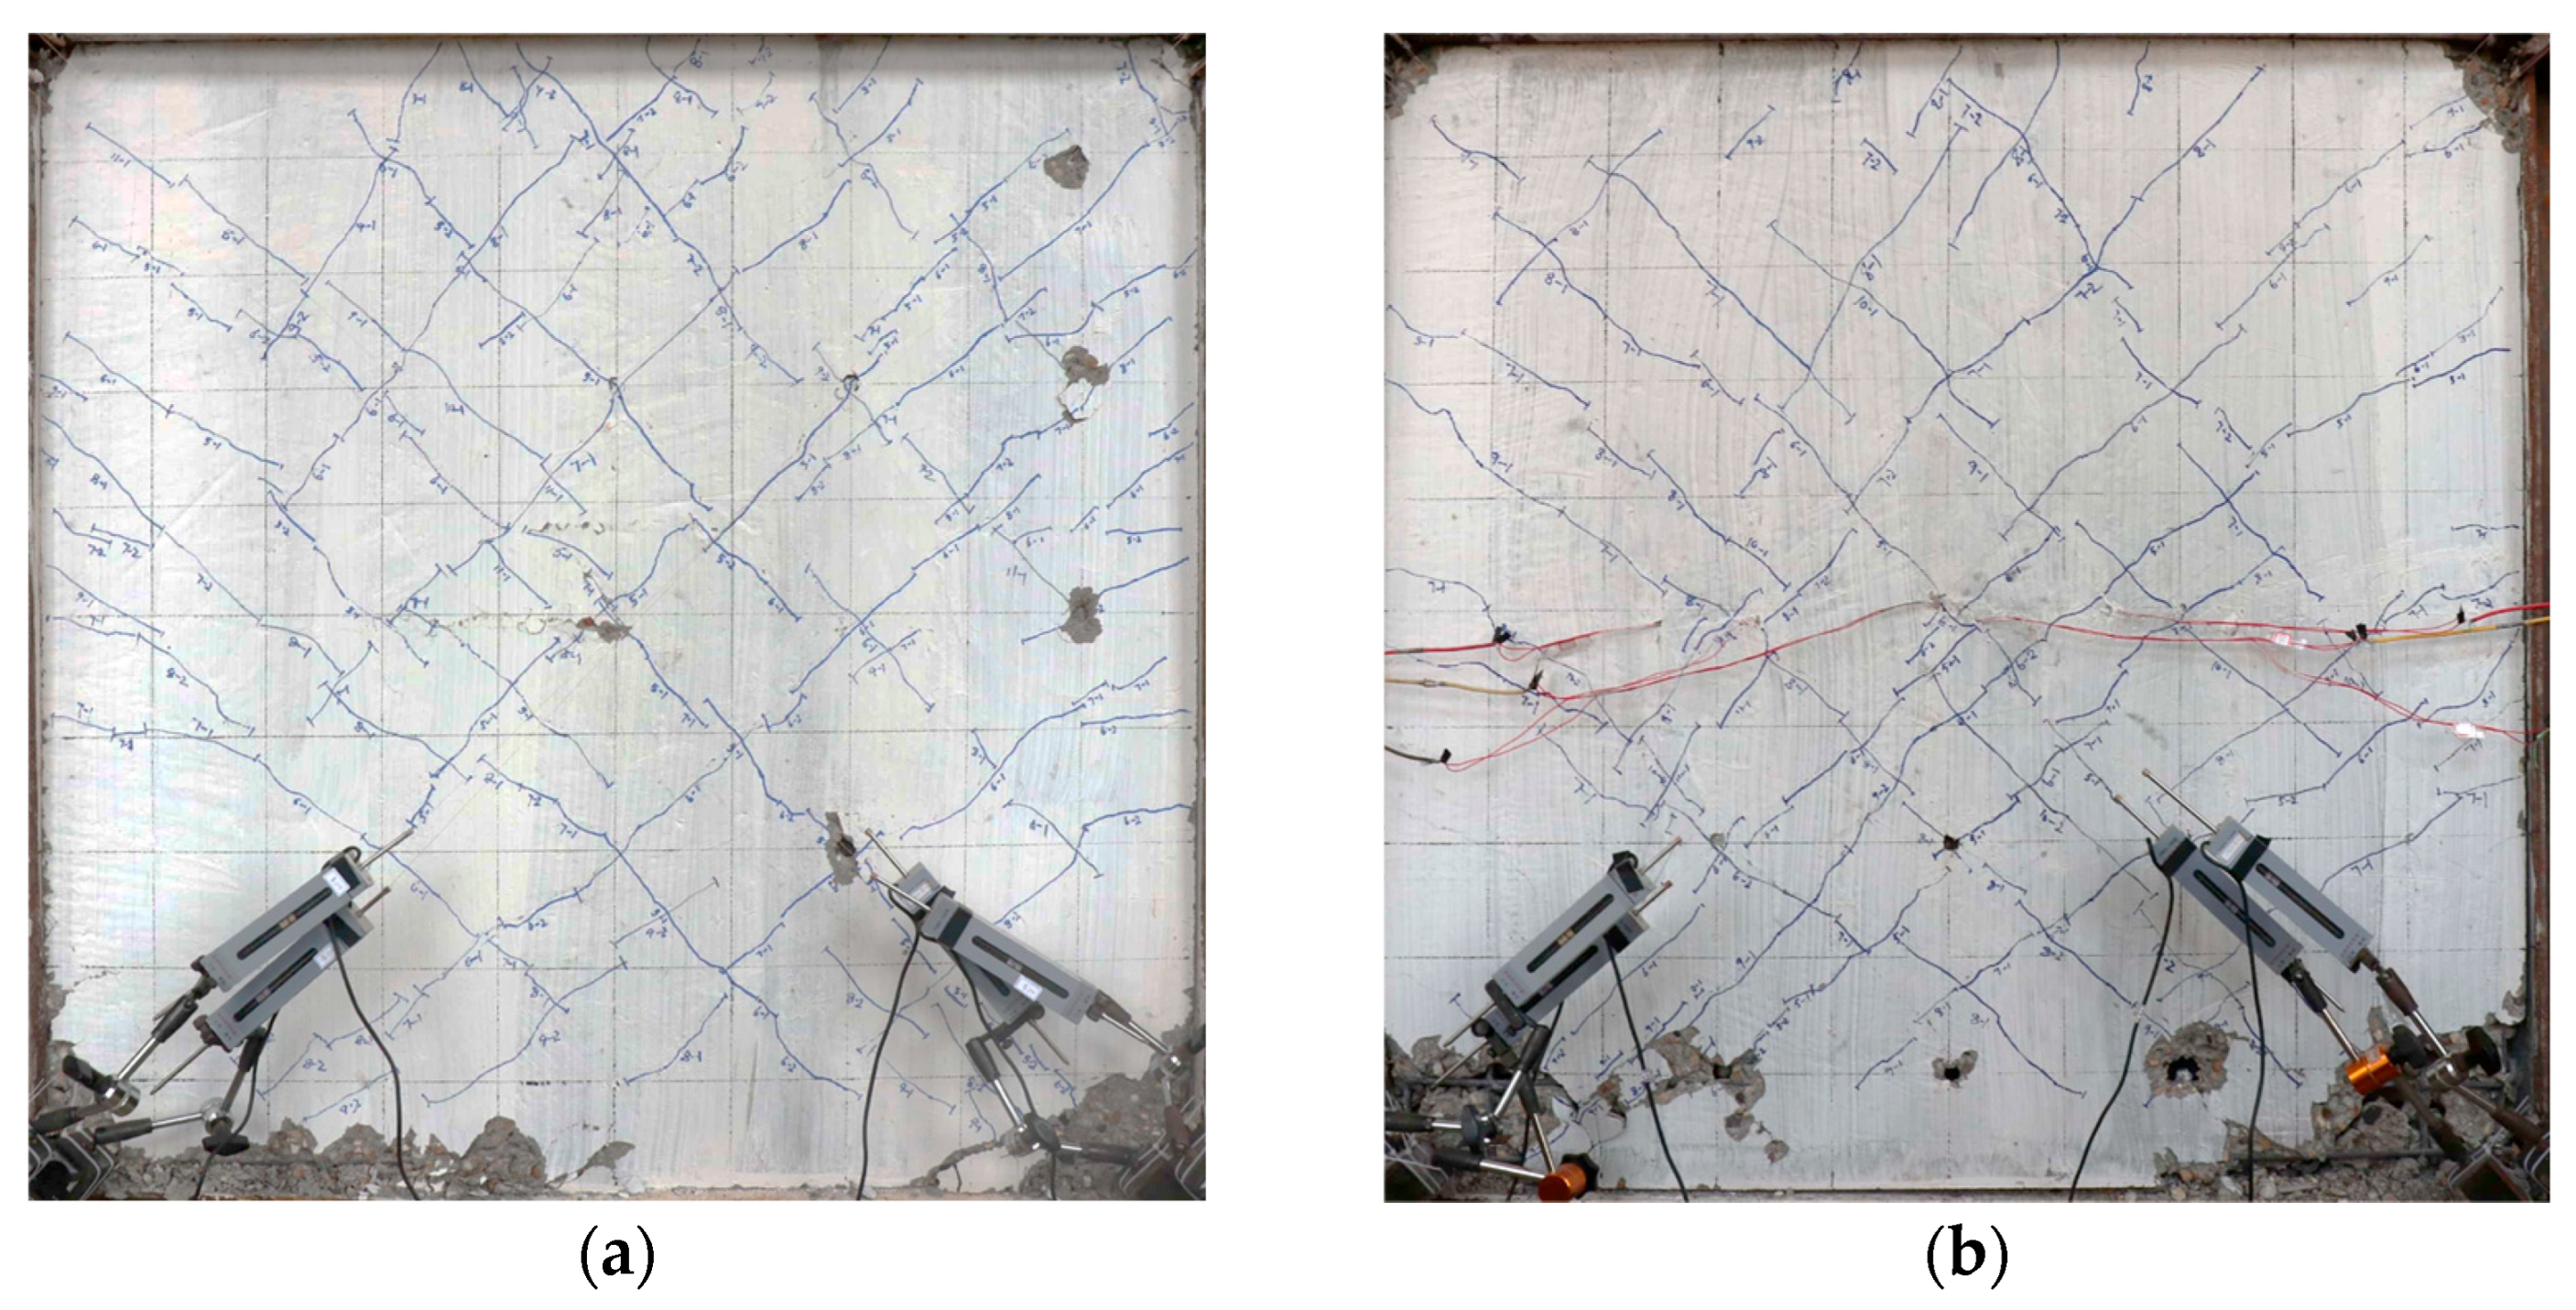
Specimens W1, W2, and W3 failed at drift ratios of 2.16%, 2.30%, and 2.63%, respectively. The thicker the concrete panels, the stronger the out-of-plane restraint stiffness they provide to the steel plate, so the steel plate buckles at a larger drift ratio. Figure 6 shows images of the damage caused to specimens W2 and W3 at the end of the test.
Figure 6.
Failure modes of specimens: (a) W2 and (b) W3.
Compared to Figure 5c and Figure 6, the concrete panels in specimen W1 were damaged more severely compared to specimens W2 and W3. The concrete panels in specimen W1 were spalled at the edges, and the concrete around several headed studs was crushed. The entire concrete panels were separated from the steel plate and, obviously, warped outward, close to falling. In specimen W2, with thicker concrete panels compared to specimen W1, the middle and bottom parts of the reinforced concrete panels separated from the steel plate, the lower part warped outward, and the concrete at the bottom corners was crushed. In specimen W3, the concrete panels were only crushed at the bottom corners and separated from the steel plate near the bottom row of the headed studs, and the concrete panels at the corner were slightly warped outward. These findings indicate that thicker concrete panels undergo less severe damage than thinner concrete panels.
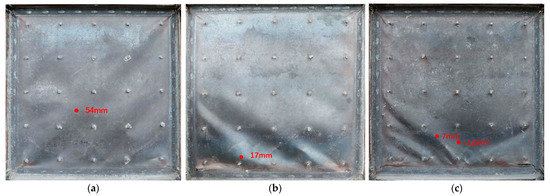
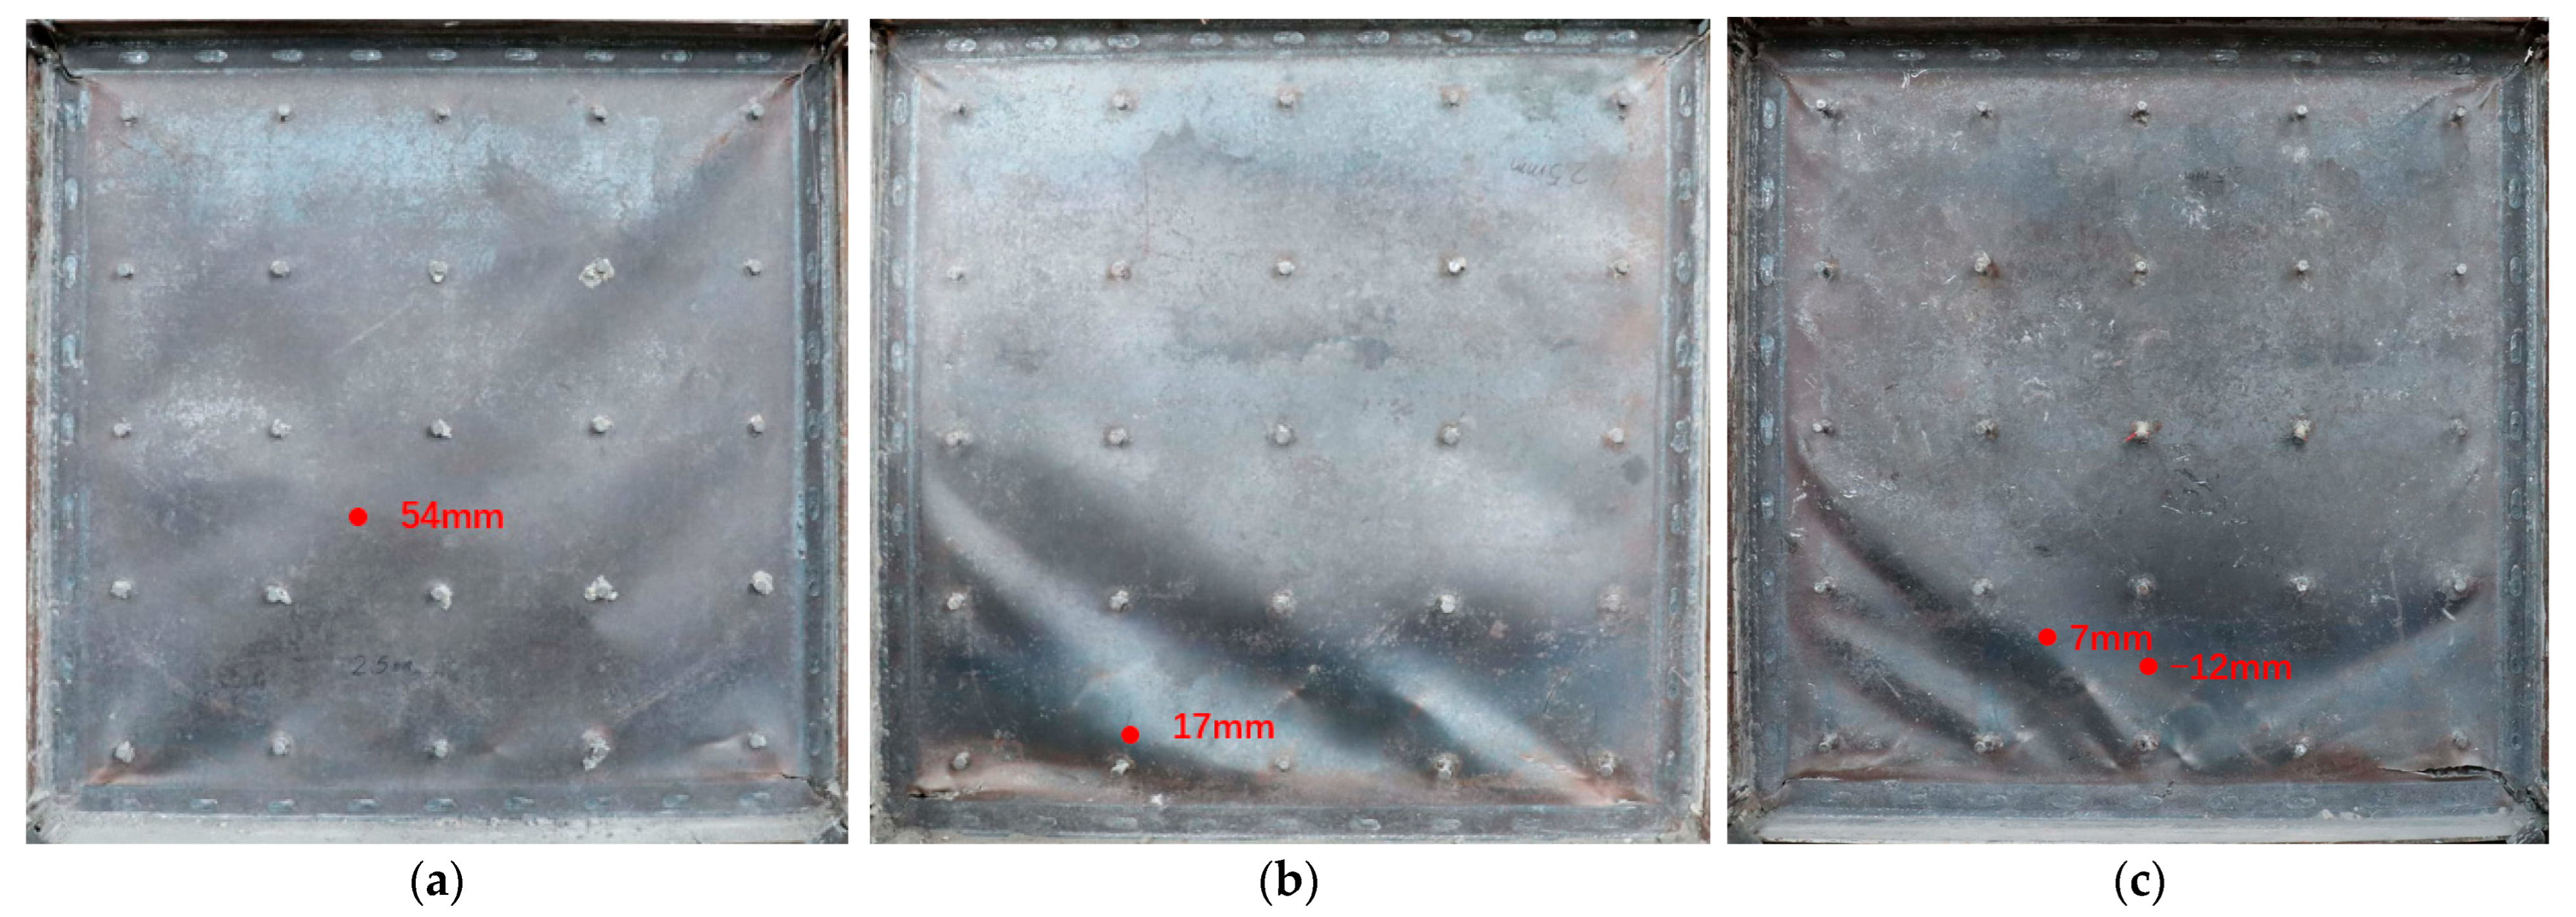
After the test, the concrete panel on side A of the steel plates was removed. Figure 7 shows the buckling modes of the steel plates in the three specimens. The steel plate in specimen W1 underwent overall buckling, where the maximum residual out-of-plane deformation was up to 54 mm. In specimen W2, only the lower half part of the steel plate buckled, forming two obvious half-waves, and the maximum residual out-of-plane deformation was 17 mm. In specimen W3, most of the steel plate was still flat, and only its bottom corners buckled. Buckling half-waves were observed along the diagonal of the steel web plate in the bottom left corner; the maximum out-of-plane deformation was +7 mm, and the maximum reverse out-of-plane deformation in the bottom middle of the steel plate was −12 mm. All four corners of the steel web plate in the three specimens were torn. Specimen W1 exhibited the largest out-of-plane deformation, followed by specimen W2, while specimen W3 showed the smallest out-of-plane deformation.
Figure 7.
Buckling modes of infill steel plates: (a) specimen W1, (b) specimen W2, and (c) specimen W3.
Comparing the buckling modes of the steel plates of specimens W1, W2, and W3 showed that a 20 mm thick concrete panel cannot provide sufficient out-of-plane restraint stiffness to a steel plate, resulting in overall buckling. When increasing the concrete thickness, the buckling mode of the steel plate changes from overall buckling to local buckling between the headed studs. A concrete panel with a larger thickness can provide stronger lateral support for the steel web; thus, overall buckling is restrained.
3.2. Lateral Load–Drift Ratio Relationship
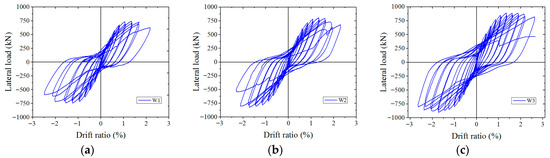
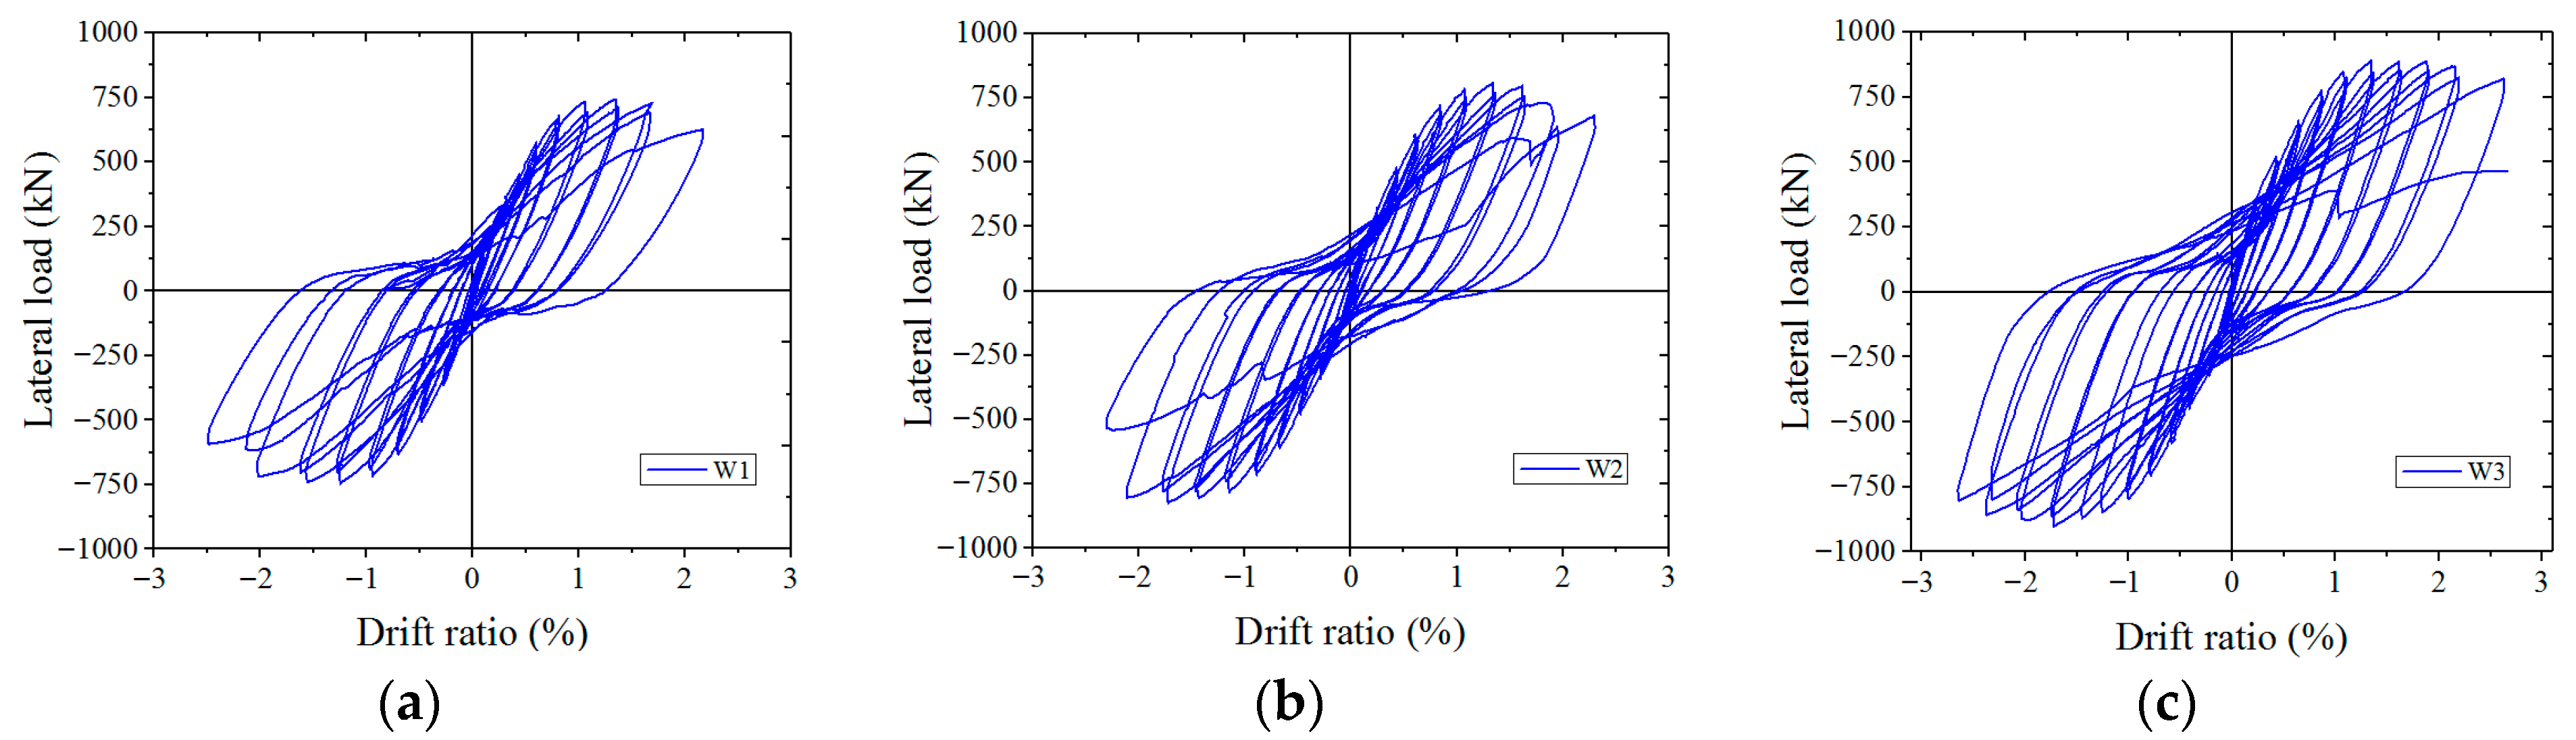
Figure 8 illustrates the lateral load–drift ratio curves of specimens W1, W2, and W3. The hysteretic curves of specimens W1 and W2 were inverse S-shaped and severely pinched, while the hysteretic curve of specimen W3 was arch-shaped and relatively fuller. Before the concrete panels in specimen W1 were crushed, with a corresponding drift ratio of 0.81%, the steel plate did not buckle and the hysteretic curve was not pinched. After the concrete panels were crushed, the out-of-plane restraint of the steel plate weakened, the steel plate buckled, and the hysteretic curve was pinched. When the lateral load was unloaded to zero, the lateral displacement of the specimen did not return to zero, and the steel plate still showed some residual deformation. When a reversed lateral load was applied to specimens, the buckling half-waves of the steel plate flattened gradually. In this process, the stiffness and bearing capacity of the steel plates were low, which is shown in the hysteresis curve as the “pinching effect”.
Figure 8.
Lateral load–drift ratio curves of specimens: (a) W1, (b) W2, and (c) W3.
The pinching extent of the hysteretic curves for the three specimens differed mainly due to the different concrete thicknesses. The hysteretic curve of specimen W1 was severely pinched. With an increasing concrete thickness, the pinching extent of the hysteretic curve decreased from specimen W2 to specimen W3; at a concrete panel thickness of 40 mm, the hysteretic curve of specimen W3 was relatively full because the out-of-plane restraint stiffness for the steel plate grew stronger when increasing the concrete thickness. As the concrete thickness increased, the steel plate buckled at a larger displacement, and the out-of-plane deformation was less. After the lateral load was unloaded to zero, the reversed loading still needed a larger force. For specimens with thicker concrete panels, the pinching effect of the hysteretic curve decreased.
The aforementioned phenomena can be understood from the mechanical basis of composite action and buckling restraint. A concrete panel provides continuous out-of-plane support to the steel plate via headed studs, with its restraint stiffness being approximately proportional to the cube of its thickness. This restraint significantly increases the elastic buckling load of the steel plate. In the initial loading stage, the composite section works integrally, with both components contributing to the stiffness. After the concrete cracks and is crushed, its restraining stiffness on the steel plate softens. For thin-concrete-panel specimens (e.g., W1), the significant softening of the restraint stiffness leads to an overall buckling of the steel plate at a relatively low stress, entering post-buckling equilibrium, characterized by a large deformation and low load-bearing capacity. During unloading and reloading, the buckled wave must first be “straightened,” a process with low restraint stiffness, macroscopically manifesting as severe pinching. For thick-concrete-panel specimens (e.g., W3), the high restraint stiffness delays steel plate buckling, and any buckling that occurs remains local, resulting in a more gradual post-buckling strength degradation. Hence, the hysteretic loops in thick-concrete-panel specimens are fuller. Therefore, the concrete panel thickness regulates the restraint stiffness, thereby fundamentally determining the buckling mode and post-buckling behavior of the steel plate, which, in turn, dictates the macroscopic hysteretic shape of the composite shear wall.
3.3. Backbone Curves
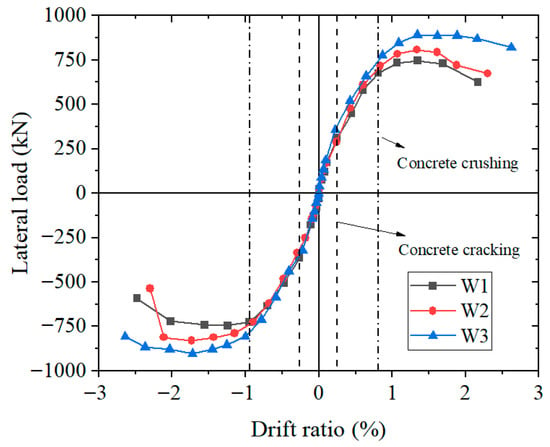
In this study, the backbone curve is depicted by successively connecting the peak points of the lateral load–drift ratio curve of each specimen at each loading level. The backbone curves for the three specimens are illustrated in Figure 9. At a drift ratio of −0.26% to 0.24%, the backbone curve of specimen W1 was essentially linear, without cracks in the concrete panels, and the specimen remained essentially elastic. At drift ratios of −0.26% to −0.94% and 0.24% to 0.81%, cracks occurred in the concrete panels. As the drift ratio increased, more cracks were formed. Specimen W1 exhibited an elasto-plastic behavior, the backbone curve was nonlinear, and the bearing capacity increased slowly with an increasing drift ratio. At a drift ratio of 1.34%, the bearing capacity of the specimen reached a peak of 743 kN. When the drift ratio increased to 2.16%, the bearing capacity dropped to 626 kN, less than 85% of the peak load. Before concrete cracking, the backbone curves of the three specimens were similar. As loading progressed, the differences among them gradually widened. After concrete crushing, the distinctions became significant, with specimen W3 demonstrating the highest load-bearing capacity, followed by specimen W2, while specimen W1 showed the lowest.
Figure 9.
Backbone curves of the three specimens.
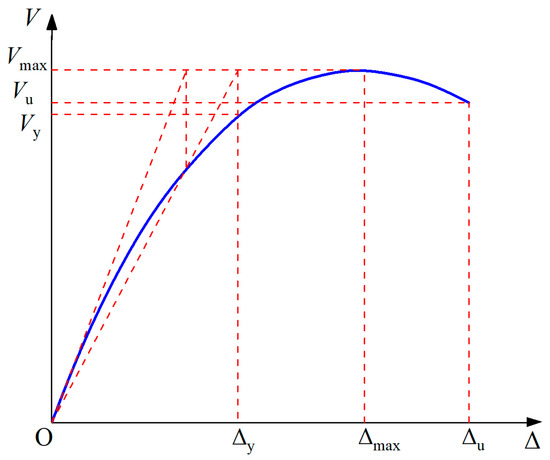
Table 4 shows the yield load Vy, the peak load Vmax, and the ultimate load Vu of the three specimens, and their corresponding drift ratios θy, θmax, and θu. The yield load and the corresponding drift ratio of the specimen were determined using the method illustrated in Figure 10 [26]. As shown in Table 4, the positive peak loads of specimens W1, W2, and W3 were 743 kN, 809 kN, and 891 kN, respectively, and the negative peak loads were −747 kN, −825 kN, and −903 kN, respectively. The magnitudes of the positive and negative peak loads of the specimen were essentially the same.
Table 4.
Strength and deformation capacities of the three specimens.
Figure 10.
Determination of yield point for specimen.
The ductility ratio μ of each specimen was calculated using Equation (2), and the calculated values are listed in Table 4.
The ductility ratios of the three specimens ranged from 2.79 to 3.10, as shown in Figure 9; all three specimens had platforms near the load peak point, especially specimen W3. At a drift ratio of 1.34% to 2.15%, the bearing capacity of specimen W3 almost did not degrade, indicating that the specimen had good ductility.
Next, the elastic stiffness, peak capacity increasing ratio, post-peak platform length (as drift ratio range), and residual carrying capacity percentage of the three specimens were compared based on their backbone curves, as shown in Table 5. The elastic stiffness was defined as the secant stiffness at the onset of concrete cracking and was calculated as 88 kN/mm, 91 kN/mm, and 104 kN/mm for specimens W1, W2, and W3, respectively. The peak capacity of specimen W3 was approximately 1.20 times that of specimen W1. The post-peak platform length was defined as the drift ratio range from peak capacity to ultimate strength and was calculated as 0.82%, 0.96%, and 1.28% for specimens W1, W2, and W3, respectively. The results show that increasing the concrete thickness increases the post-peak platform length significantly.
Table 5.
Key parameters of the three specimens.
The residual carrying capacity percentage of each specimen was defined as the ratio of the ultimate strength to the peak capacity. The tests were terminated for each specimen under the following distinct ultimate states, differing failure modes, and load-bearing behaviors:
Specimen W1: At a drift ratio of 2.16%, the load-carrying capacity dropped below 85% of its peak value, satisfying the predefined termination criterion based on strength degradation.
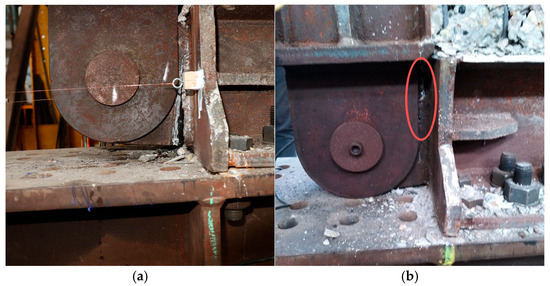
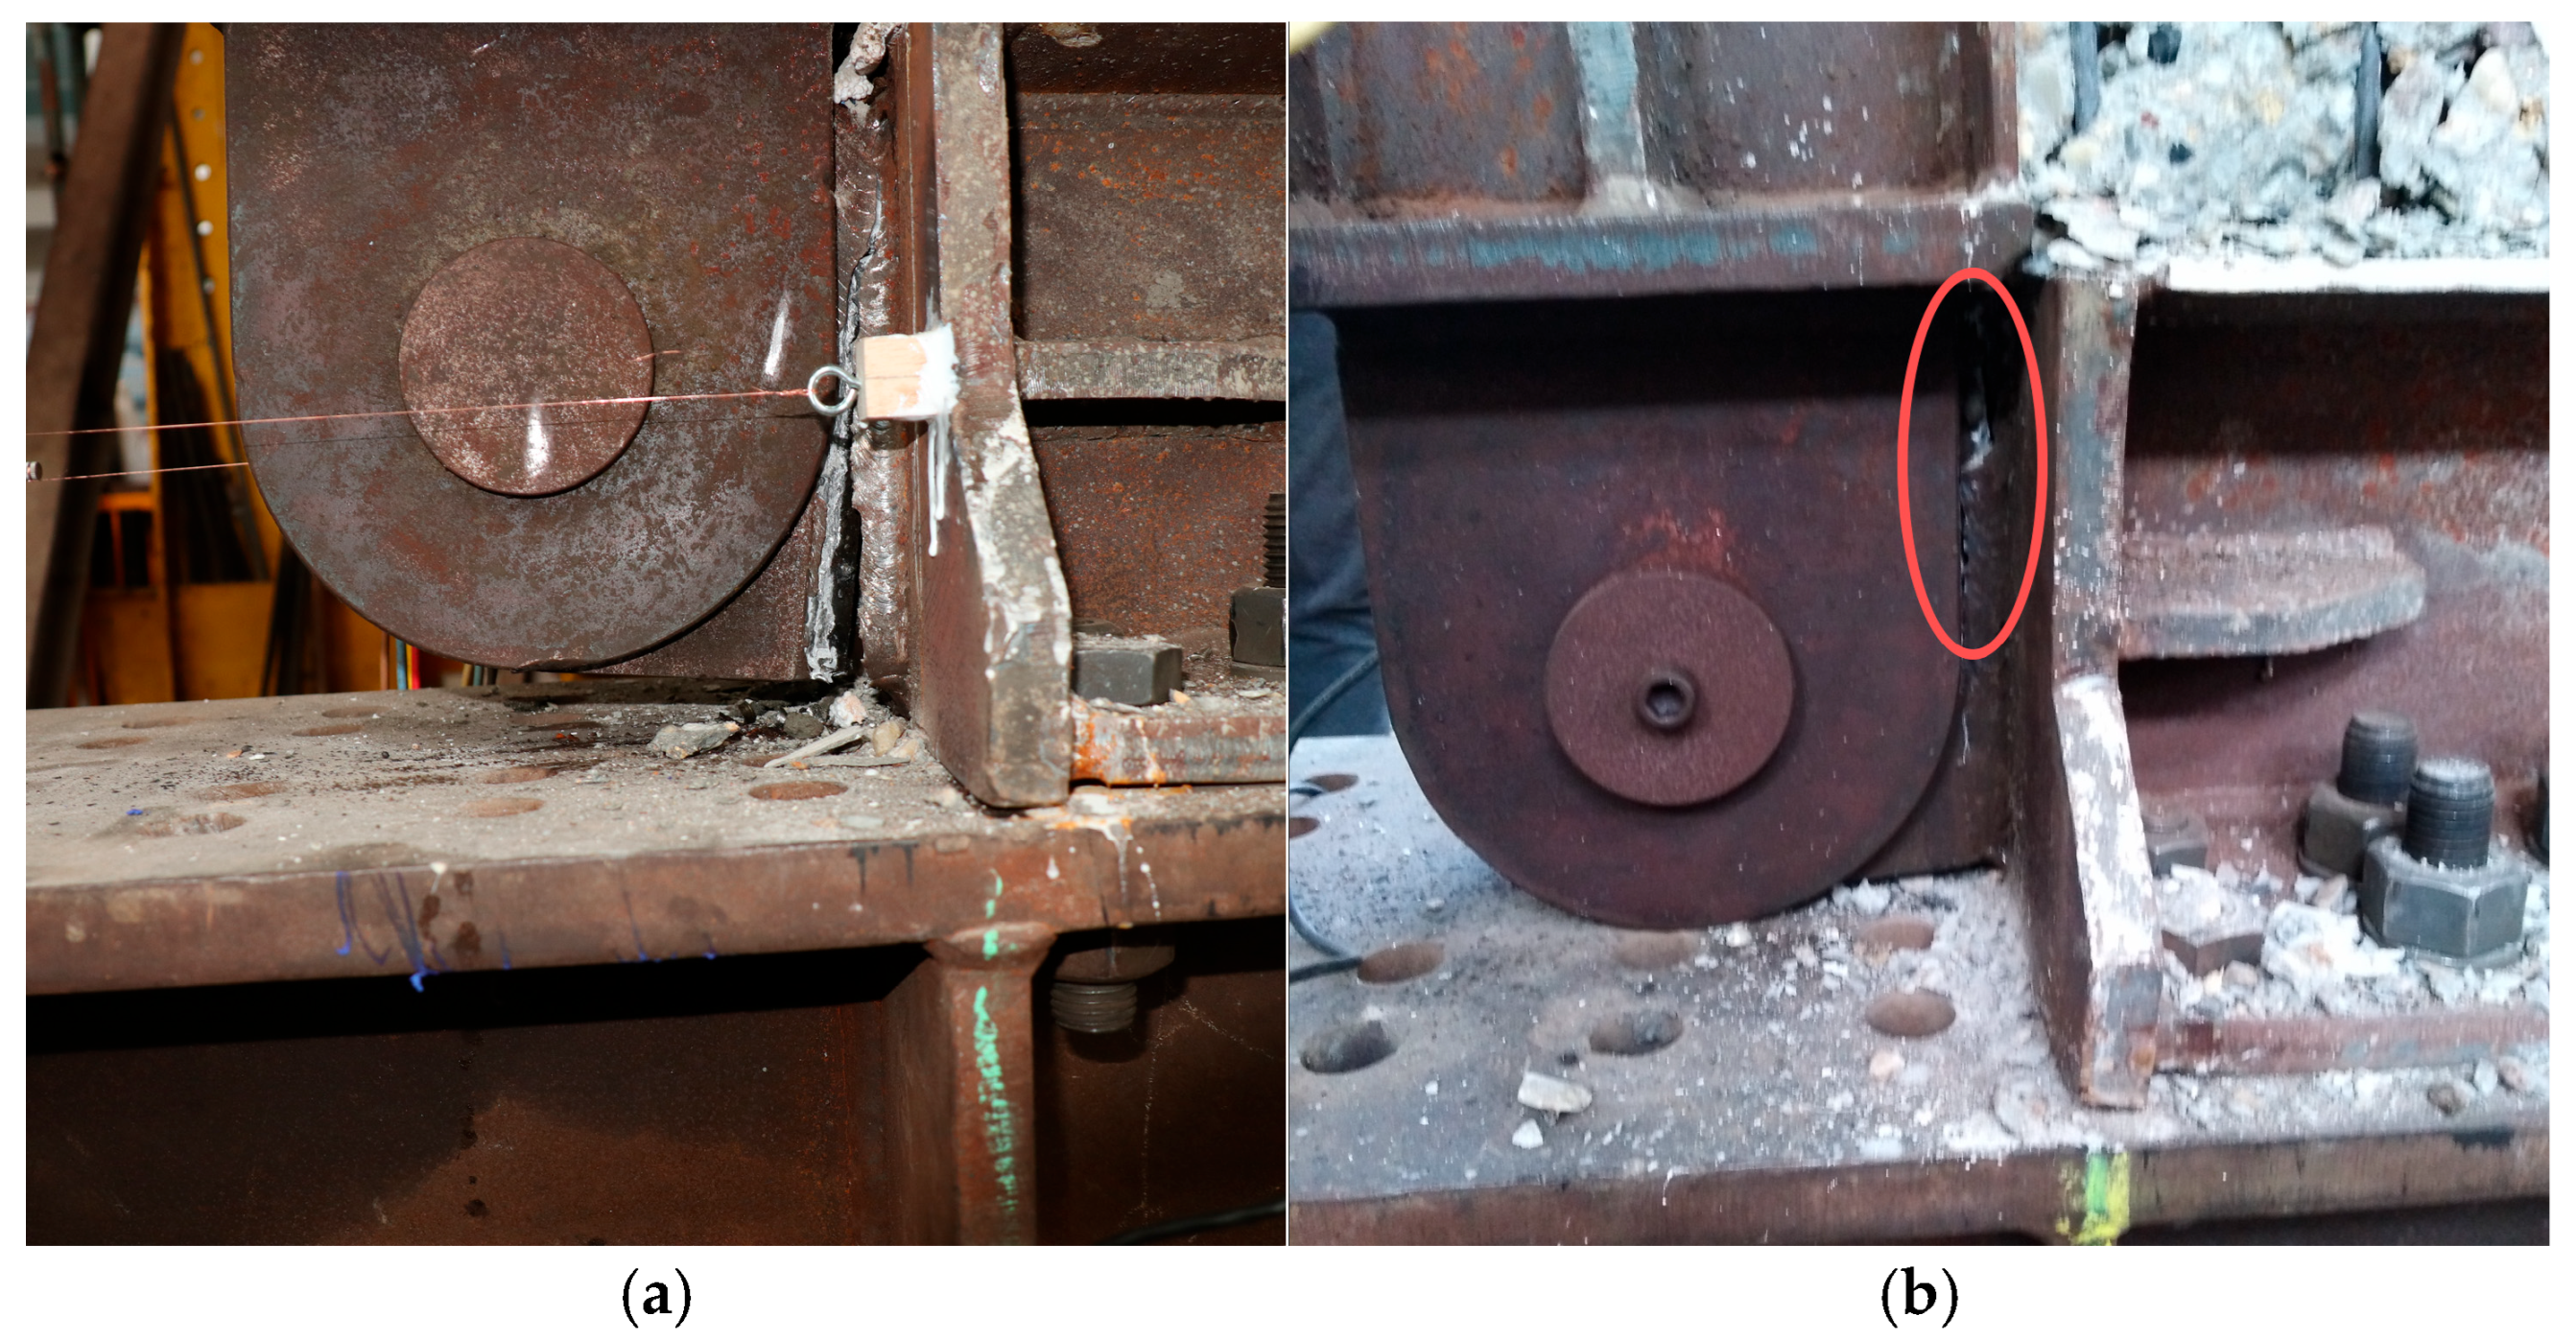
Specimen W2: At a drift ratio of 2.30%, a sudden failure occurred at the beam-to-column connection (see Figure 11a), which triggered a significant and abrupt loss of load-carrying capacity.
Figure 11.
Failure of the beam-to-column connection: (a) specimen W2 and (b) specimen W3.
Specimen W3: At a drift ratio of 2.62%, a failure occurred at the beam-to-column connection, as shown in Figure 11b. However, as the beam end descended and came into contact with the reaction beam, substantial secondary support was provided. Consequently, there was no marked decline in the load capacity during the final stage of loading.
Therefore, the dominant failure mechanisms in the three specimens with different concrete panel thicknesses were different.
Specimen W1 (concrete panel thickness: 20 mm): With the thinnest concrete panel providing a relatively weaker out-of-plane restraint stiffness to the steel plate, the specimen was more susceptible to global or local buckling of the steel plate, which dominated its failure mode. The load-carrying capacity exhibited a relatively smooth yet continuous decline after the peak, characteristic of a stability-controlled degradation process.
Specimens W2 and W3 (concrete panel thickness: 30 mm and 40 mm, respectively): As the concrete panel thickness increased, the enhanced confinement effect significantly delayed or suppressed steel plate buckling. The failure mode transitioned from “stability-dominated buckling” to “strength failure at the boundary connections”. Both specimens failed at the beam-to-column connections at larger drift ratios, indicating that the wall panel itself achieved a more complete use of its capacity, with the ultimate failure shifting to the critical boundary details.
3.4. Stiffness Degradation
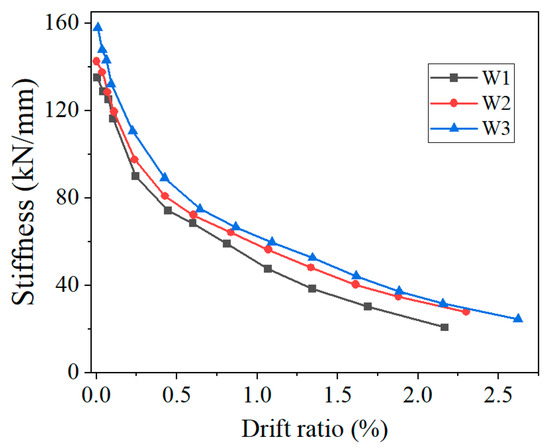
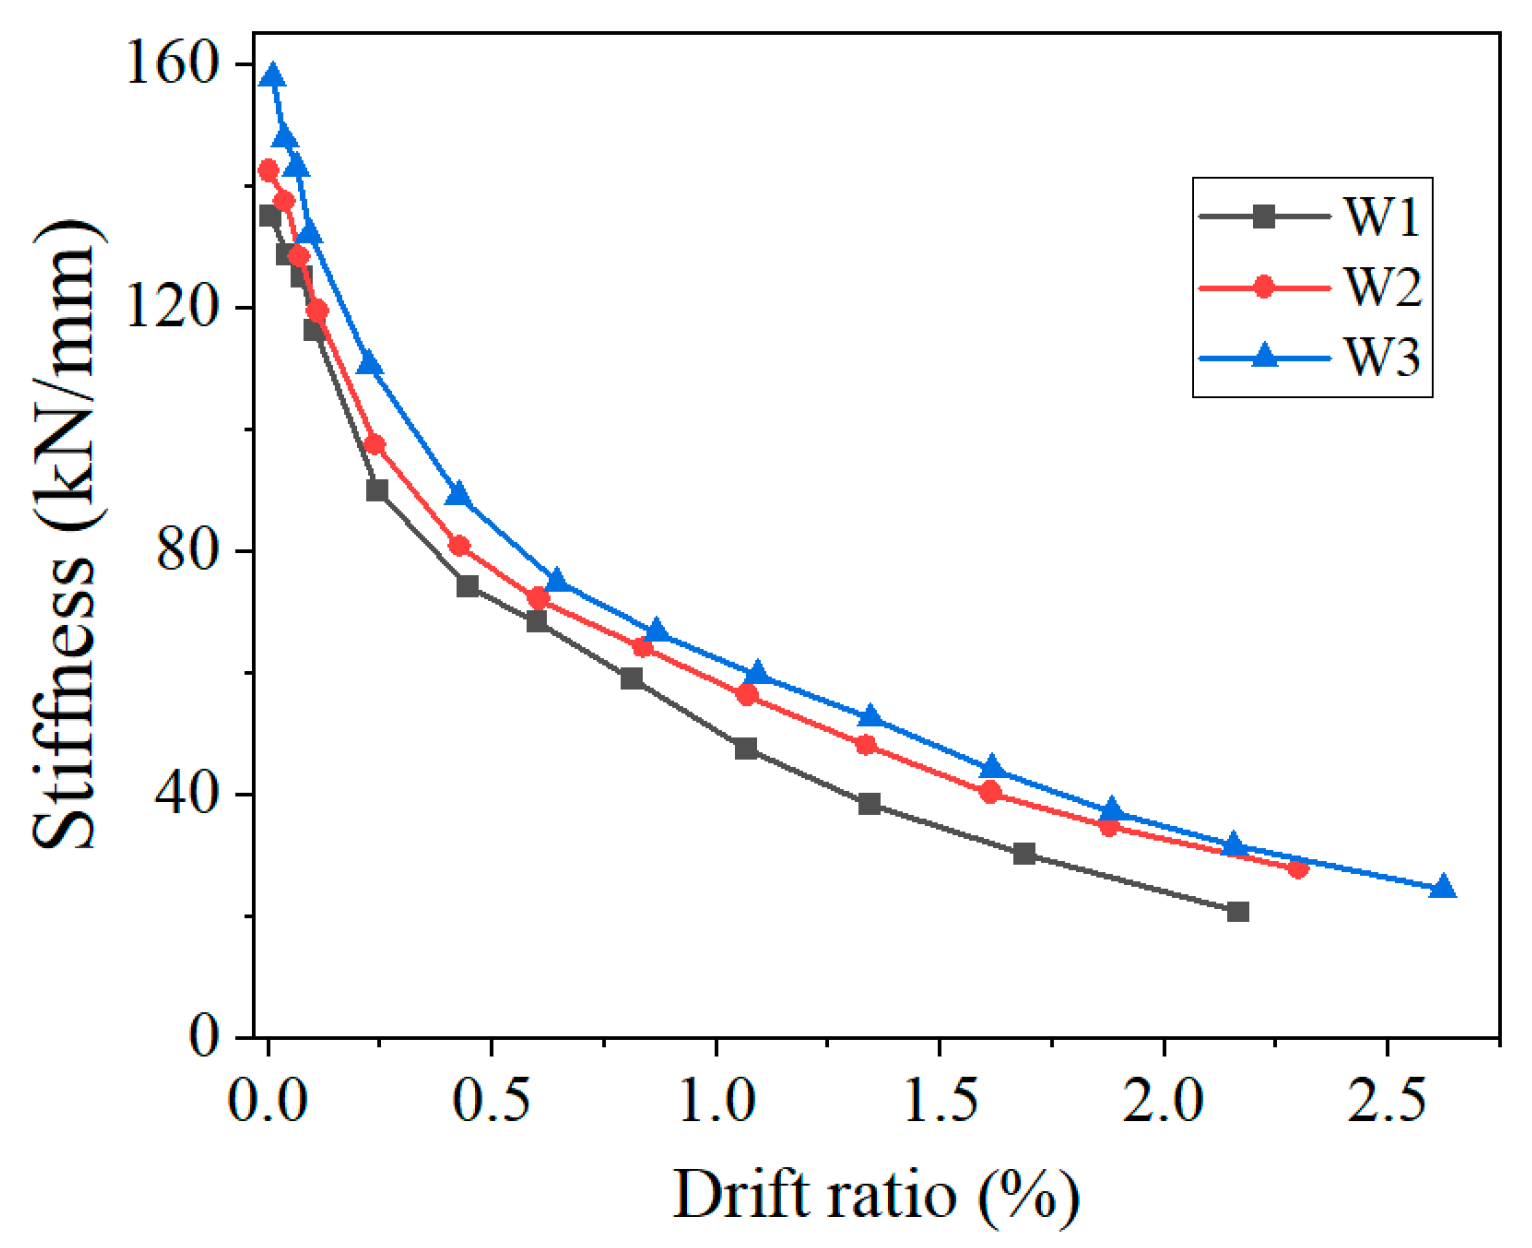
The secant stiffness Ki of the three specimens was calculated at all loading levels, according to Equation (3).
where +Vi and −Vi are the positive and negative peak lateral loads in the first cycle at the ith loading step, respectively, and +Δi and −Δi are the drifts corresponding to +Vi and −Vi, respectively. The secant stiffness–drift ratio curves of the three specimens are illustrated in Figure 12.
Figure 12.
Stiffness degradation of the three specimens.
As illustrated in Figure 12, the stiffness degradations of the three specimens were similar and gradually slowed with an increasing drift ratio. At a drift ratio of about 0.24%, the stiffness of specimens reduced sharply due to concrete cracking. As the drift ratio increased, the stiffness degradation of the specimens gradually decreased. Comparing the stiffness of the three specimens at the same drift ratio, the stiffness of specimen W3 was the largest, followed by W2 and W1. The thicker the concrete panels, the stronger the out-of-plane restraint stiffness they provide to the steel plate. Thus, specimen W3 had the largest stiffness among the three specimens.
The process of stiffness degradation essentially mirrors the irreversible accumulation of internal damage within the wall panel and its impact on the overall mechanical performance. This process can be categorized into three critical phases: (1) the elastic stiffness phase, regulated by the intact composite action of concrete and the steel web; (2) a sharp decline and steady degradation, initiated by concrete cracking (at a drift ratio of about 0.24%), where stiffness loss is primarily driven by the propagation of concrete cracks, the progressive yielding of the steel web, and micro-slipping at their interface; and (3) accelerated degradation, corresponding to concrete crushing and steel web buckling, where the restraint system weakens, leading to a precipitous loss of primary structural stiffness. In this study, thicker concrete panels (e.g., W3) exhibited a more gradual stiffness degradation curve in each phase. The underlying mechanism is that the higher-order out-of-plane restraint stiffness provided by the thick concrete panels (approximately proportional to the cube of the thickness) not only delays the propagation of concrete cracks and crushing but also, more crucially, supplies robust lateral support to the steel web. This significantly elevates the steel plate’s elastic critical buckling stress, thereby effectively suppressing the initiation and progression of buckling. Consequently, the concrete panel thickness regulates the stiffness and robustness of the restraint system, directly dictating the path and rate of stiffness degradation throughout the entire loading history from elasticity to failure.
3.5. Strength Degradation
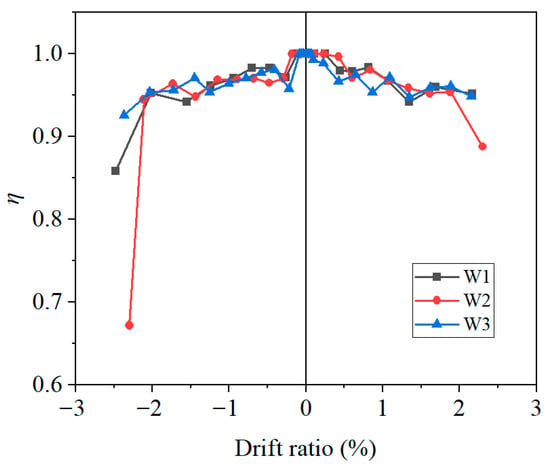
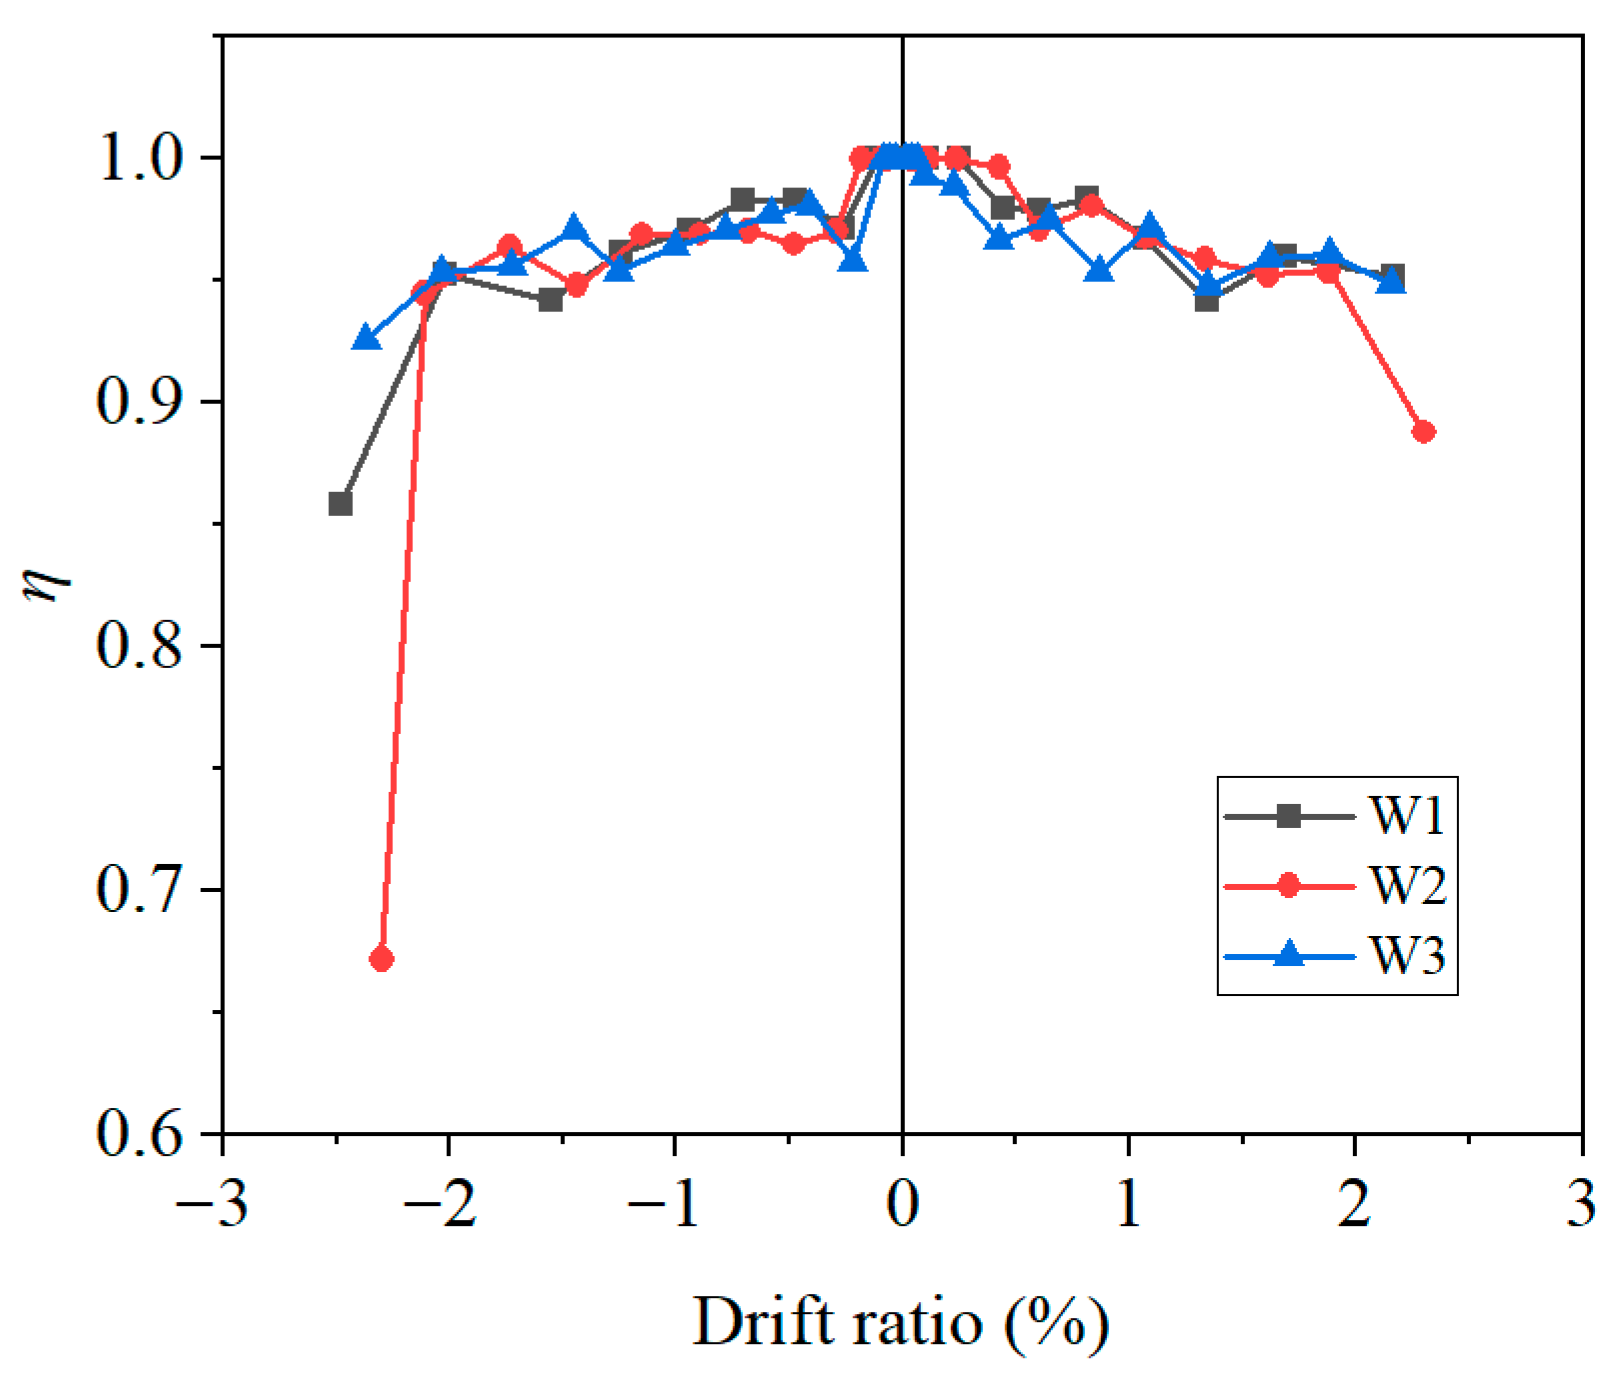
In the cyclic loading, at the same loading level, the strength of the specimens deteriorated in the second cycle because of the accumulation of concrete damage. The strength degradation ratio ηi of each specimen was calculated according to Equation (4).
where Vi(1) and Vi(2) are the peak shear forces of the first and second cycles at the ith loading level, respectively.
The strength degradation ratio reflects the degradation extent of the strength for specimens under the same load level. The lower the strength degradation ratio ηi, the more severely the strength of the specimens deteriorates. The strength degradation ratio–drift ratio curves of the three specimens are illustrated in Figure 13.
Figure 13.
Strength degradation of the three specimens.
As illustrated in Figure 13, the strength degradation ratios of the three specimens had a similar variation trend based on the drift ratio and gradually decreased as the drift ratio increased. The strength degradation ratios of the three specimens were essentially above 0.9 and were low only at the final loading level. The minimum strength degradation ratios of specimens W1 and W2 were 0.85 and 0.67, respectively. At a low drift ratio, strength degradation is caused by the accumulation of concrete damage. With an increasing drift ratio, the strength degradation ratio of the specimen reduces due to the concrete cracking and collapsing and the steel plate buckling.
Strength degradation under cyclic loading is the macroscopic manifestation of low-cycle fatigue and cumulative damage within the composite shear wall in the plastic deformation range. The reduction in load-bearing capacity in subsequent cycles at the same displacement amplitude primarily stems from three factors: (1) cyclic softening at the material level, such as the Bauschinger effect in steel and stiffness damage in concrete under repeated compression; (2) geometric deterioration at the component level, such as the intensification of plasticity in the buckling half-wave of the steel web under tension–compression reversal, and the expansion of concrete crushing zones; and (3) the degradation of interface performance, such as a reduced load transfer efficiency due to the local bearing failure of concrete around headed studs. In this study, the strength degradation ratio at the same drift ratio significantly increased (i.e., degradation lessened) with increasing concrete panel thickness.
3.6. Hysteretic Energy
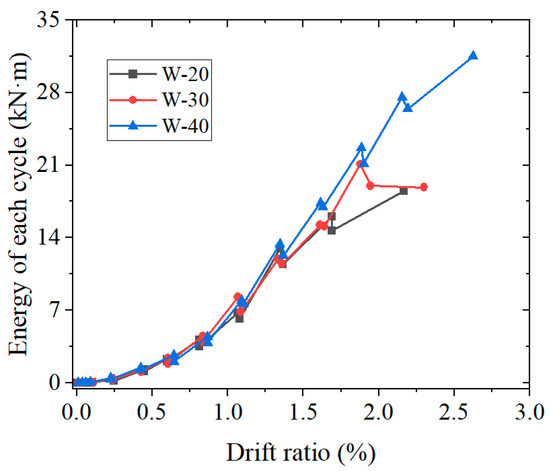
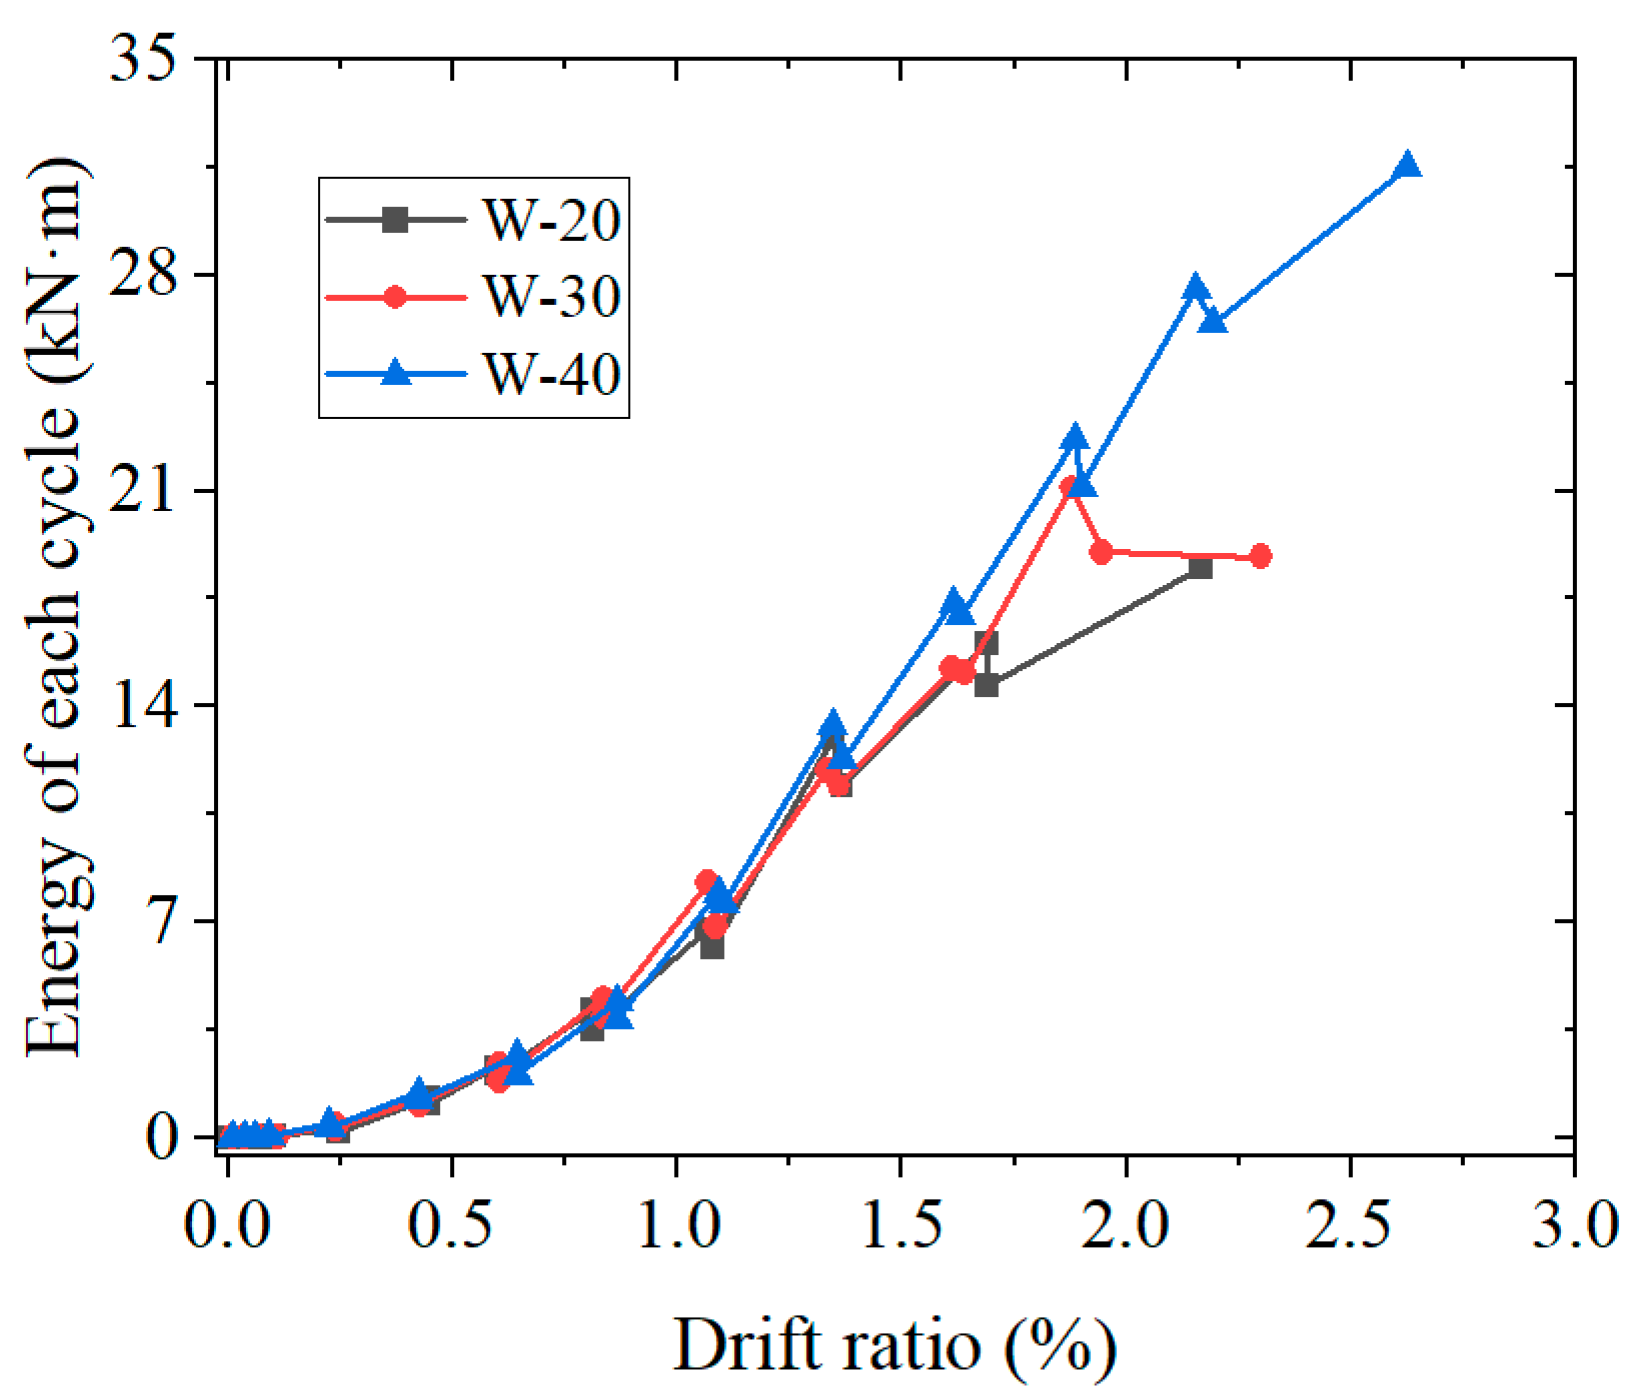
Figure 14 illustrates the hysteretic energy dissipation for the three specimens for each cycle–drift ratio relationship. At a drift ratio of 0.24%, the energy absorption of the three specimens was close to zero because, at a drift ratio less than 0.24%, the specimens were essentially elastic. As the drift ratio increased, the specimens entered the elasto-plastic range, and their energy absorption gradually increased. At the same loading level, the energy absorption of the specimens in the first cycle was more than that in the second cycle. This is because the accumulation of concrete damage leads to strength deterioration, thereby reducing the hysteretic energy dissipated through the specimen. When the drift ratio was the same, the hysteretic energy dissipation of specimen W3 was higher than that of specimens W2 and W1. The difference in the hysteretic energy dissipation between the three specimens increased as the drift ratio increased. The maximum hysteretic energy dissipation of specimens W3, W2, and W1 in each cycle was 31.5, 21.8, and 18.5 kN·m, respectively.
Figure 14.
Energy dissipation of the three specimens in each cycle.
The reduction in energy absorption for specimen W2 at the final loading step requires specific clarification. This abrupt drop is not indicative of the wall’s hysteretic energy dissipation capacity being exhausted. Rather, it is caused by the fracture of the welded connection at the pinhole gusset plate of the bottom beam. This connection failure interrupts the stress transfer path, leading to immediate test termination and creating the observed discontinuity in the hysteretic energy record. This event highlights the critical need for connection details that match the enhanced capacity of walls with thicker concrete panels.
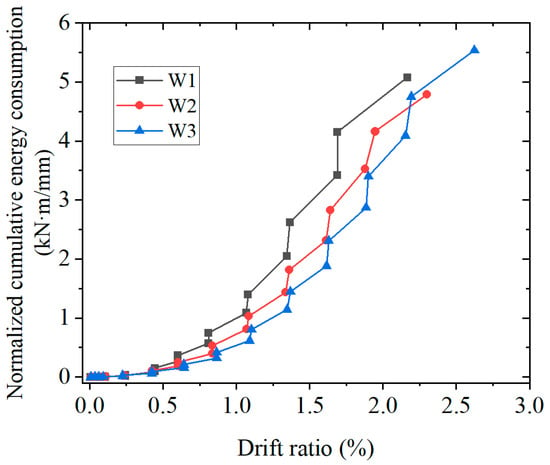
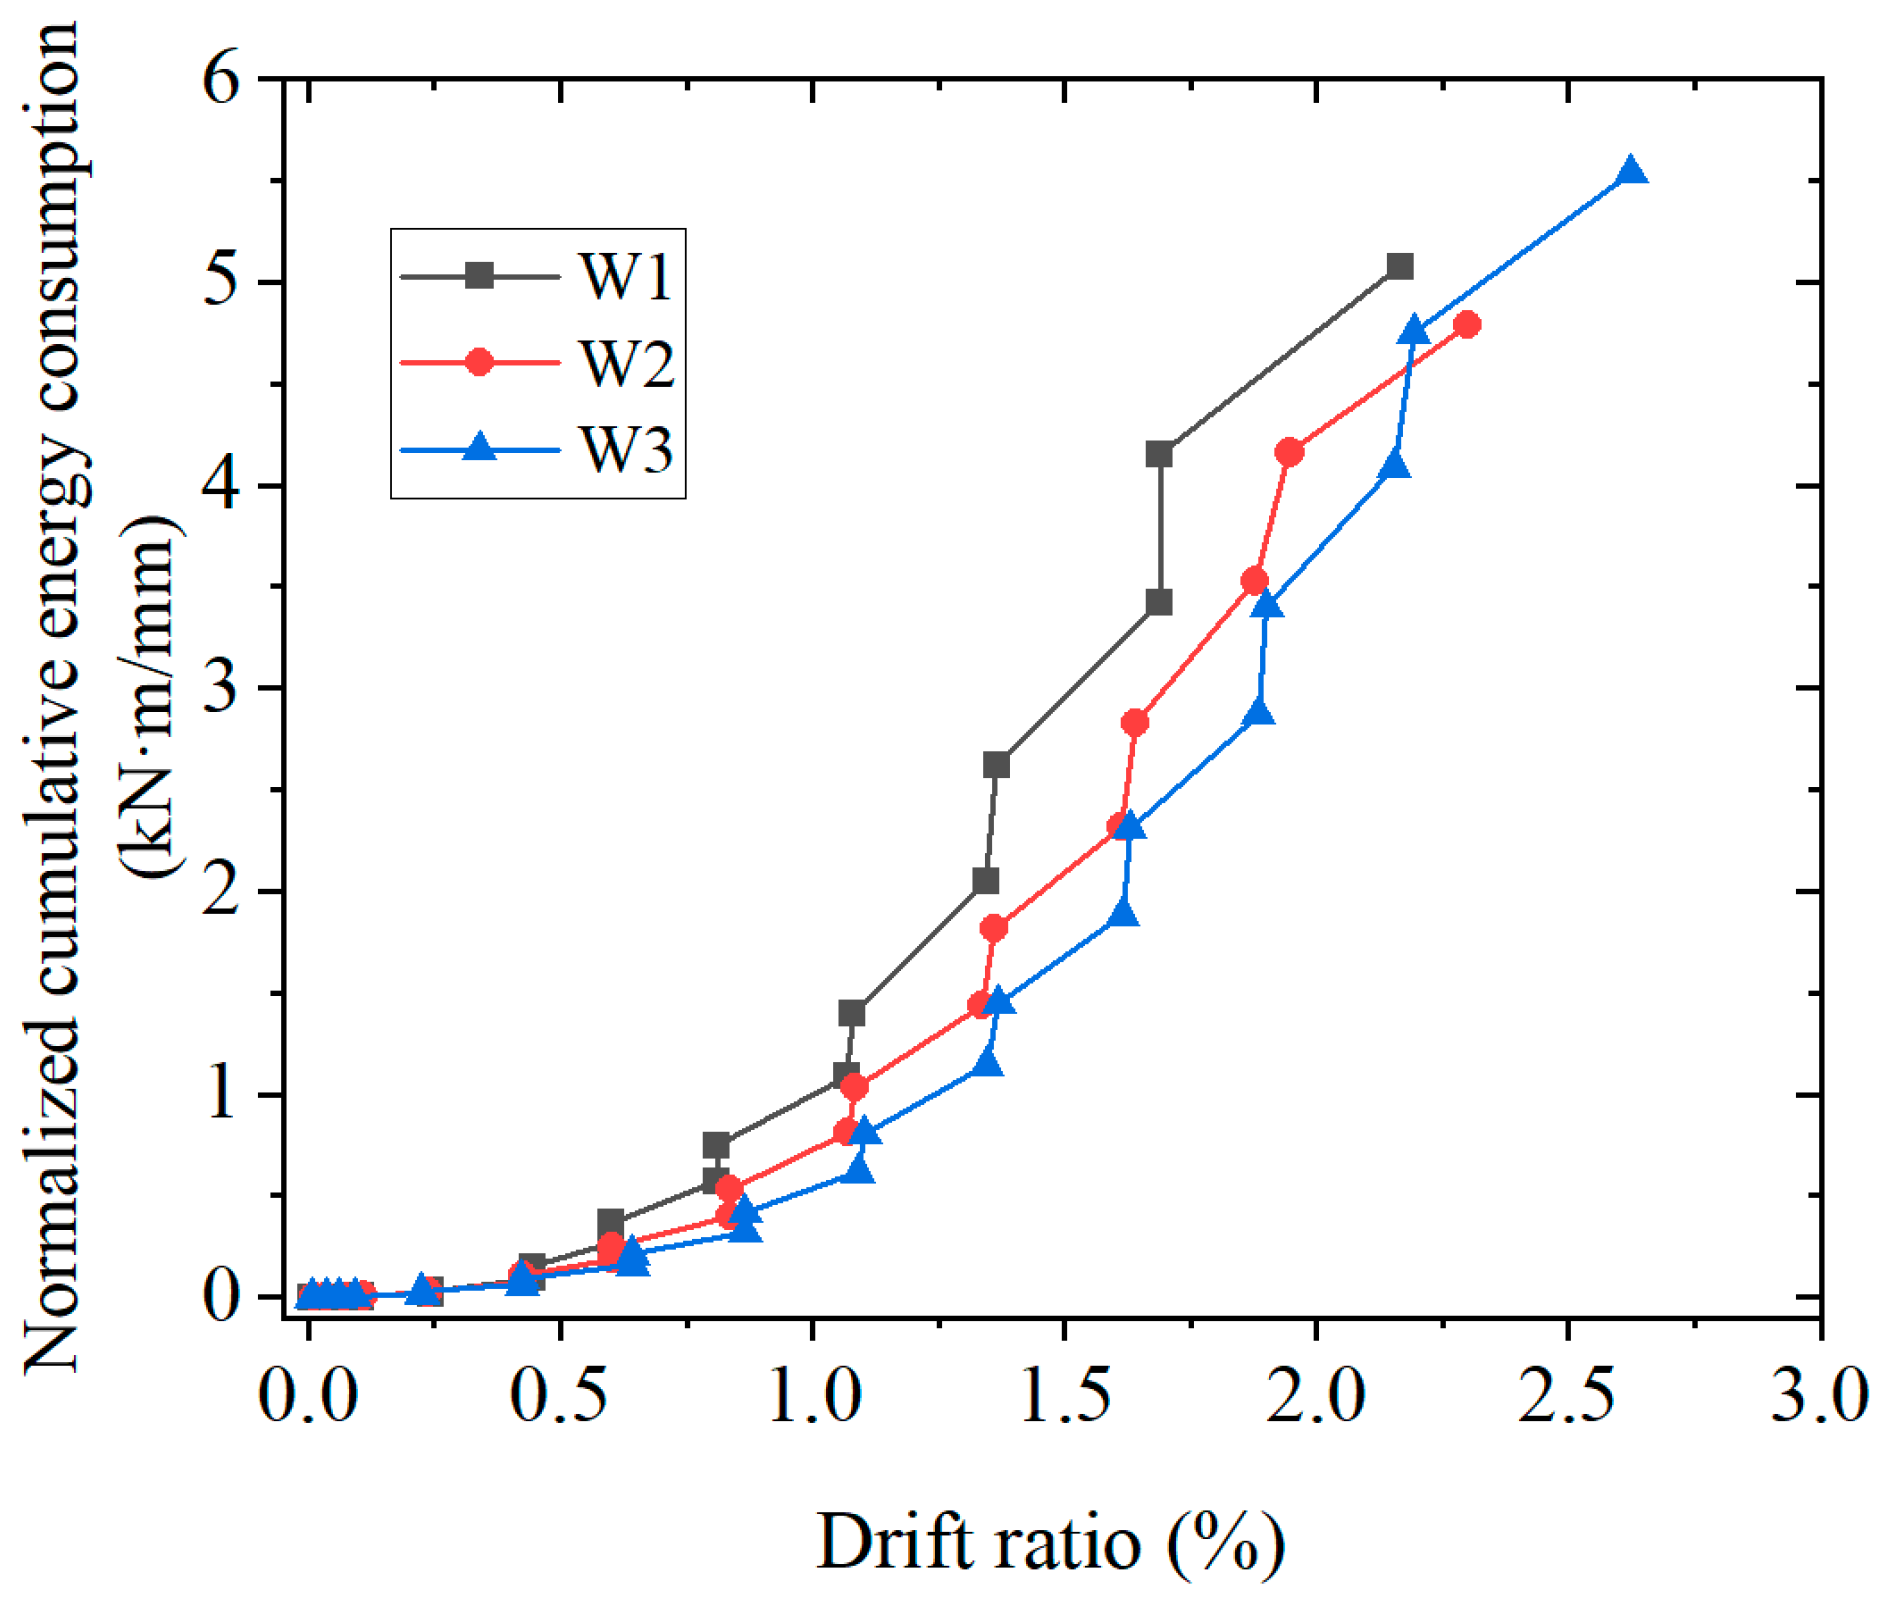
To evaluate the hysteretic energy dissipation efficiency relative to the material used, the cumulative energy dissipation was normalized by concrete panel thickness. As shown in Figure 15, at a drift ratio of less than 2%, the order of energy dissipation per unit thickness was W1 > W2 > W3. This indicated that, due to their weaker restraint, thinner concrete panels allow the steel plate to yield earlier, thereby exhibiting an initial advantage in hysteretic energy dissipation efficiency. However, this order reversed as the displacement further increased. When the drift ratio exceeded approximately 2%, the hysteretic energy dissipation per unit thickness for specimen W3 grew rapidly and ultimately surpassed that of the other specimens. This is because the thicker concrete panels provide superior ductility reserves and stability. Strongly restraining the steel plate and delaying its overall buckling enables the wall panel to dissipate hysteretic energy continuously and stably over a long displacement plateau following the peak load. Although the material in the thick-panel specimen (W3) was not “fully mobilized” in the early stage, its tremendous potential for hysteretic energy dissipation in the later stage ensured the highest final total energy dissipation in terms of both efficiency and absolute magnitude. Therefore, the true value of using thick concrete panels sacrifices a small amount of initial efficiency in exchange for a fundamental performance enhancement: preventing brittle instability and ensuring the system’s sustained hysteretic energy dissipation capacity under extreme deformations, which is crucial for the seismic safety of structures.
Figure 15.
Normalized cumulative hysteretic energy consumption of the three specimens.
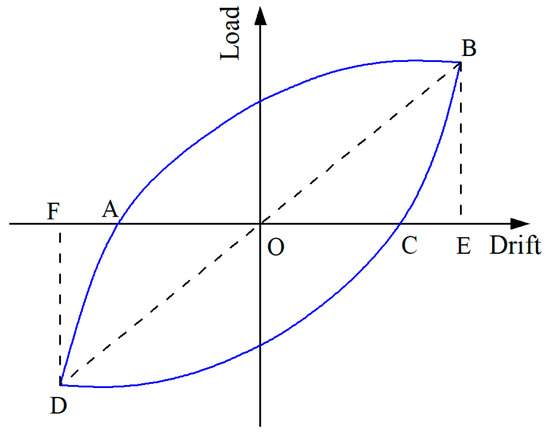
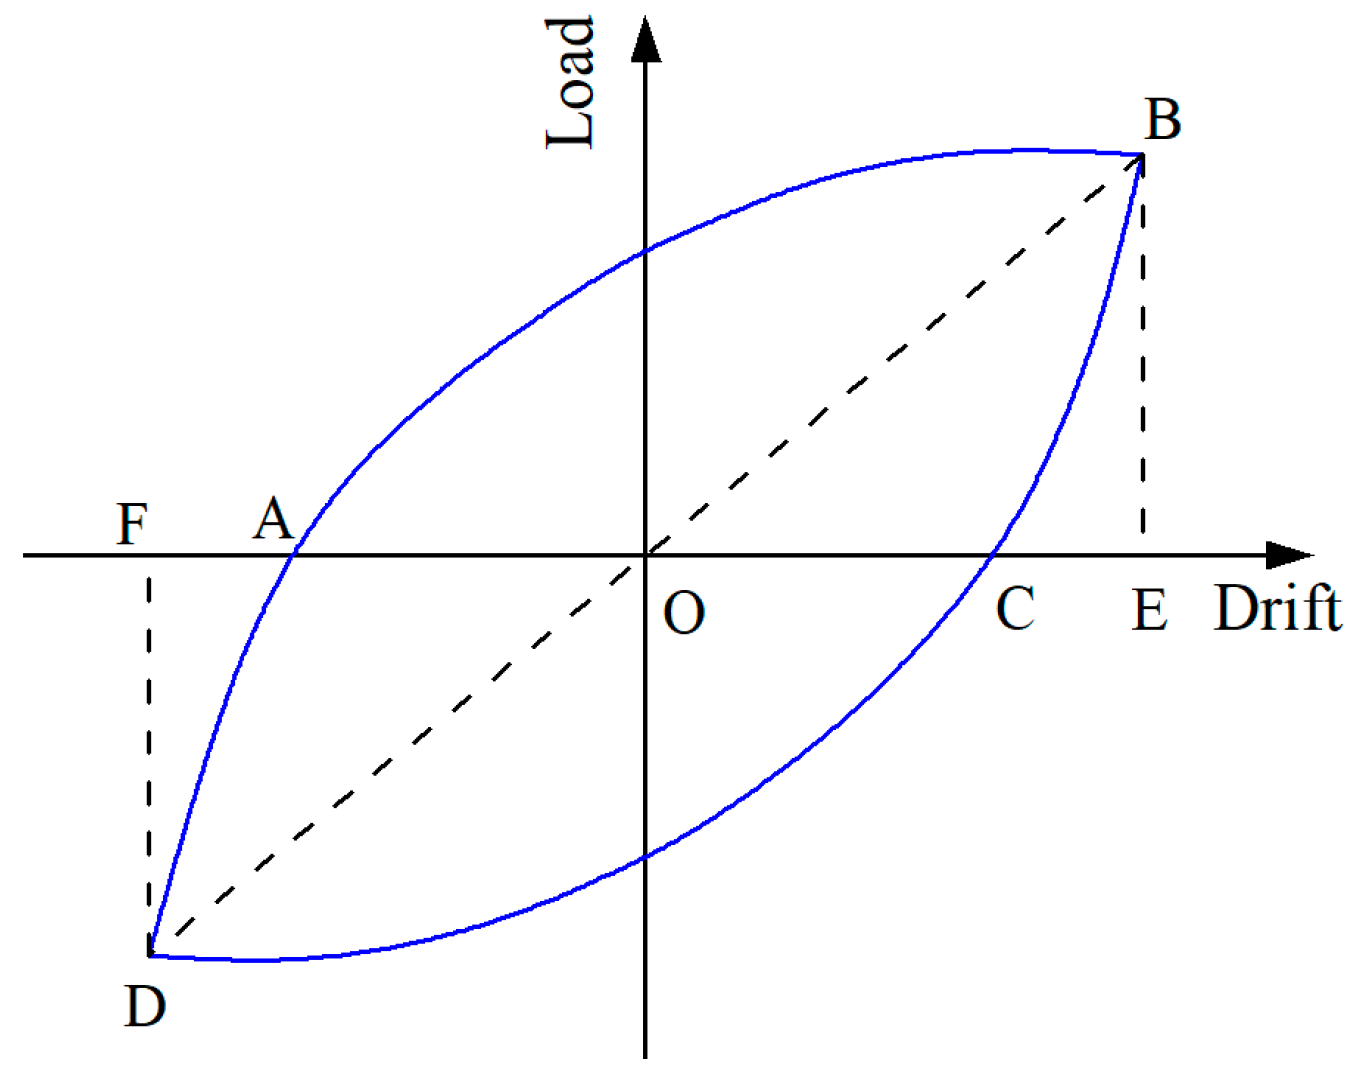
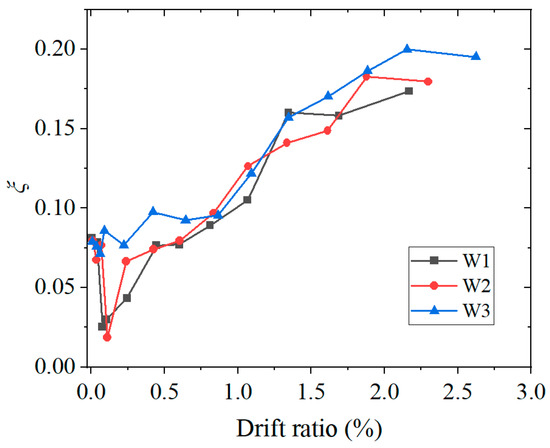
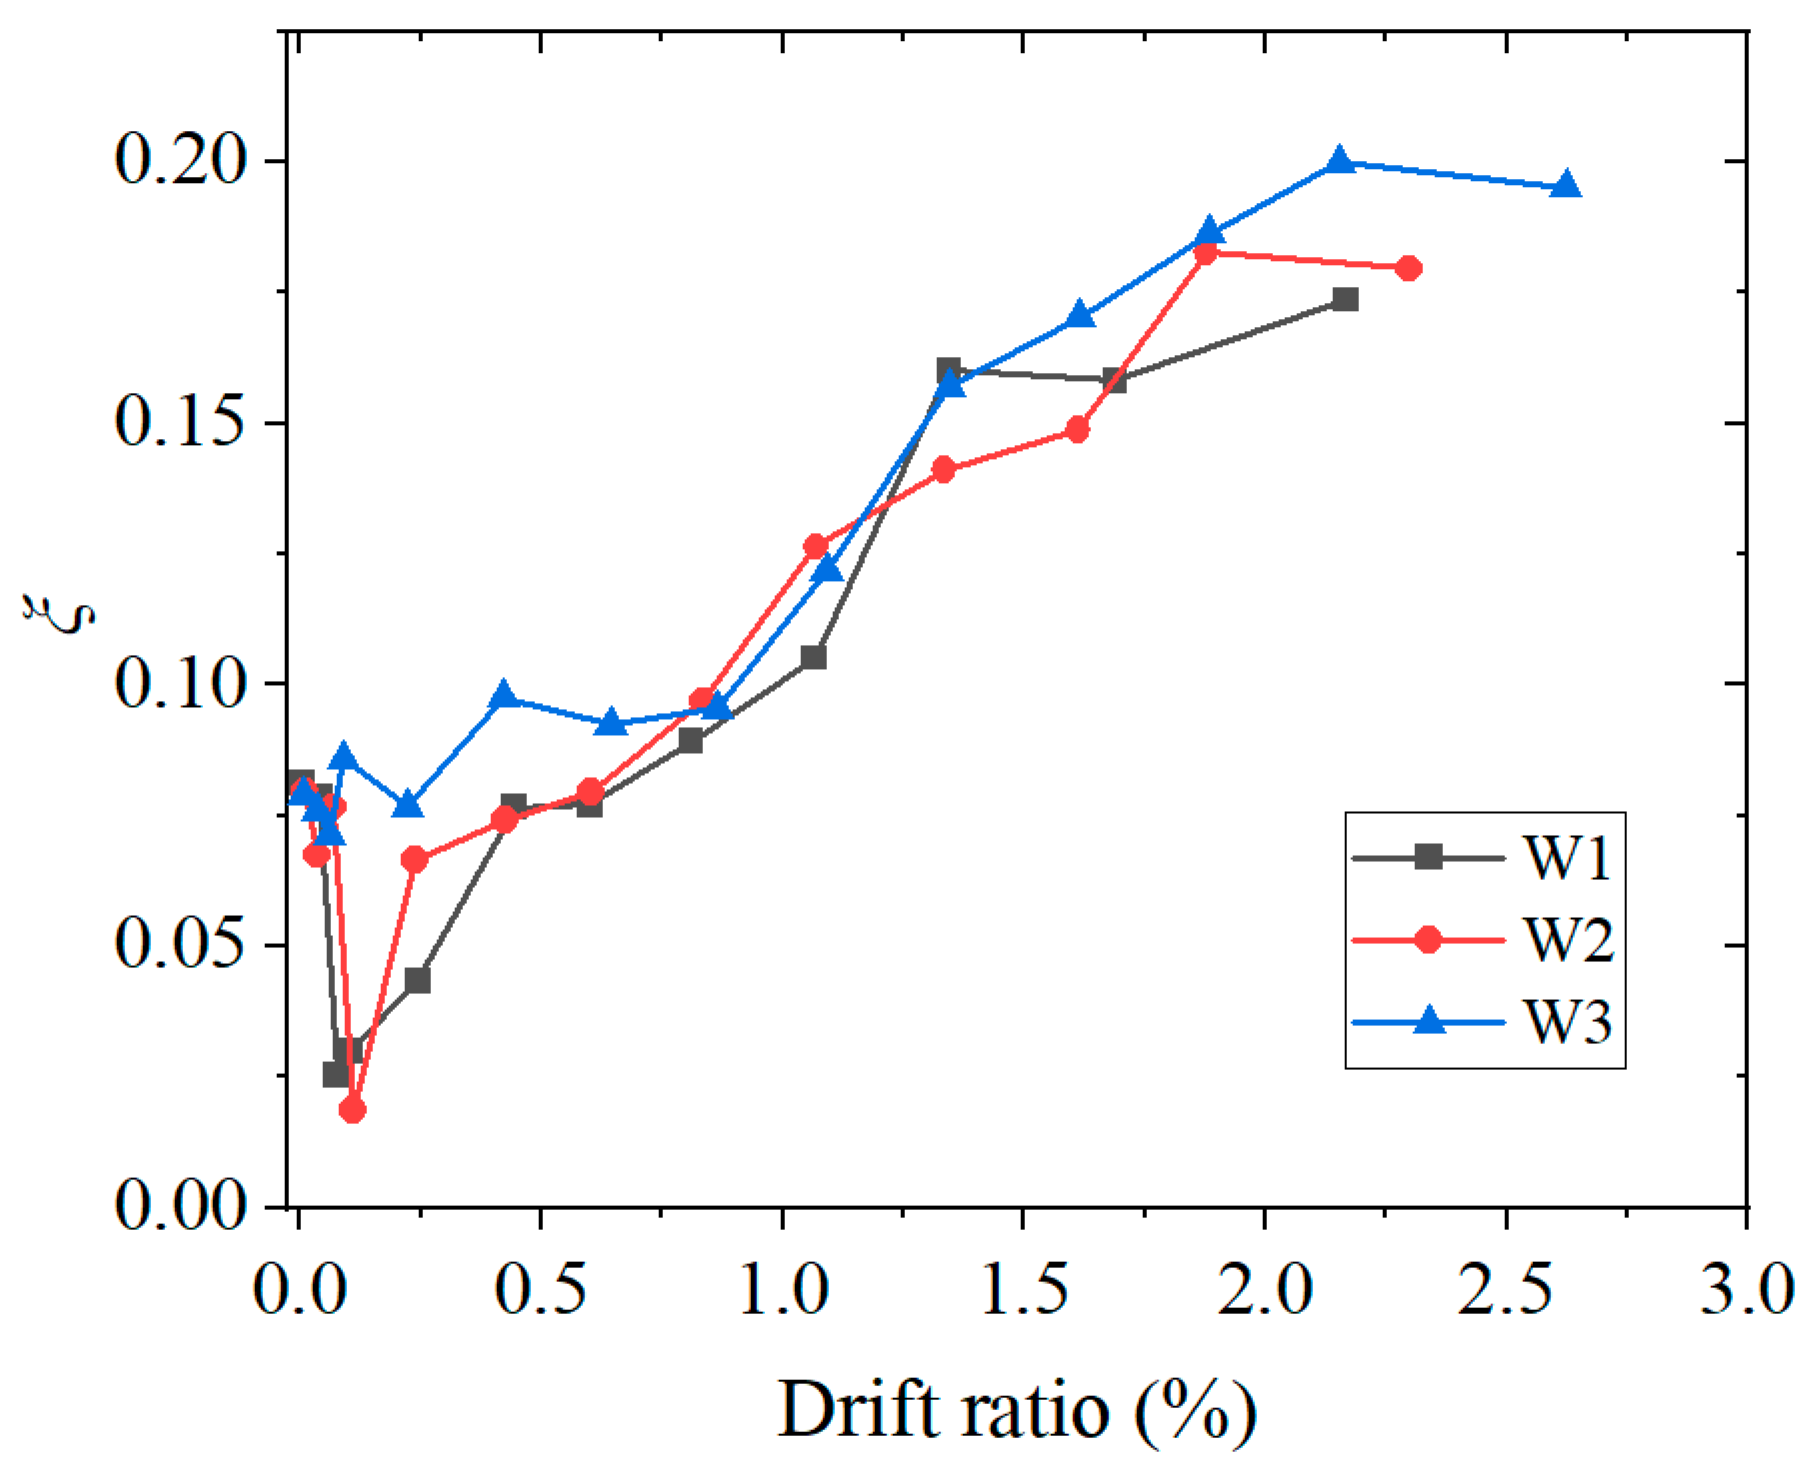
The equivalent viscous damping ratio ξ was used to better evaluate the hysteretic energy dissipation capacity of the three specimens and can be calculated using Equation (5).
where S(ABC+CDA),i is the area of the hysteresis hoop of specimens in the first cycle of the ith loading level, as illustrated in Figure 16, and S(OBE+ODF),i is the area of the triangles OBE and ODE.
Figure 16.
Calculation of the equivalent viscous damping ratio.
The equivalent viscous damping ratio ξ reflects the fullness extent of the hysteretic curve. A higher value of ξ indicates a fuller hysteretic curve, reflecting a better hysteretic energy dissipation. Figure 17 illustrates the equivalent viscous damping ratio ξ–drift ratio curves of specimens. The value of ξ essentially increased with an increasing drift ratio. Specimen W3 had a higher ξ than specimens W2 and W1. For specimen W1, the maximum value of ξ, 0.17, was obtained at a drift ratio of 2.16%, the final loading level. However, for specimens W2 and W3, the maximum values of ξ, 0.18 and 0.20, respectively, were obtained at the second-to-final loading level. During the final loading level, the premature failure of the beam-to-column connection gusset plates disrupted stable load transfer, resulting in an aberrant hysteresis loop and premature test termination. Consequently, the value of ξ calculated from the final cycle no longer represented the true hysteretic energy dissipation capacity of the wall panel. In contrast, specimen W1 completed the full loading protocol, with its peak value of ξ occurring at the final loading stage, when the wall panel’s performance was fully exhausted.
Figure 17.
Equivalent viscous damping ratios of the three specimens.
3.7. Shear Deformation of Wall Panels
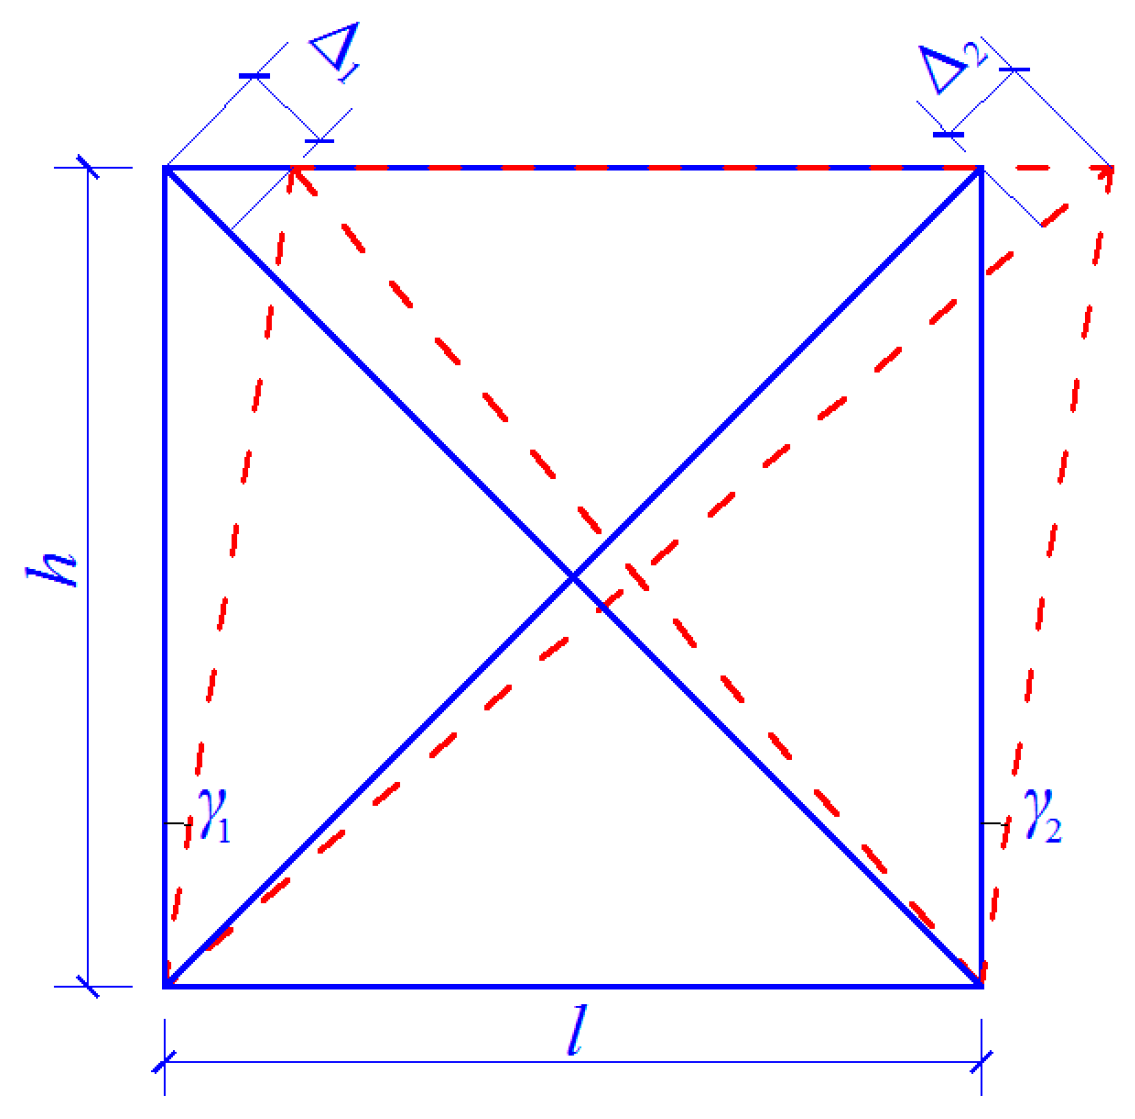
Figure 18 illustrates the shear deformation of C-PSW/CE under lateral loading. The shear deformation γ of a wall panel can be approximatively calculated using Equation (6).
where γ1 and γ2 are the shear deformation of the left and right edges of the wall panel, respectively, as illustrated in Figure 18. When the shear deformation of the wall panel is low, the relationships between shear deformations γ1 and γ2 and the variations Δ1 and Δ2 of the main diagonals of the wall panel are as follows:
Figure 18.
Shear deformation of the wall panel.
Based on Equations (6)–(8), the relationship between shear deformation γ and variations Δ1 and Δ2 of the diagonals of the wall panel can be derived, as shown in Equation (9).
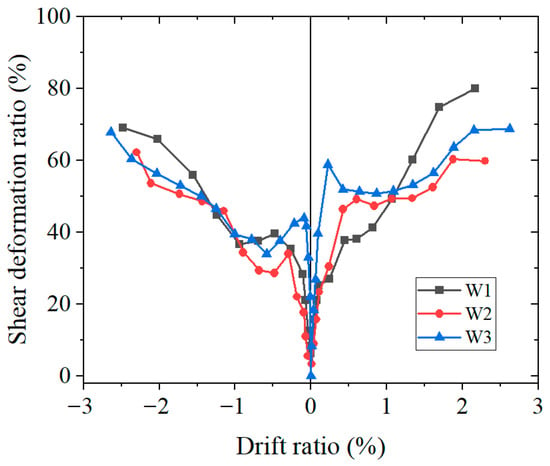
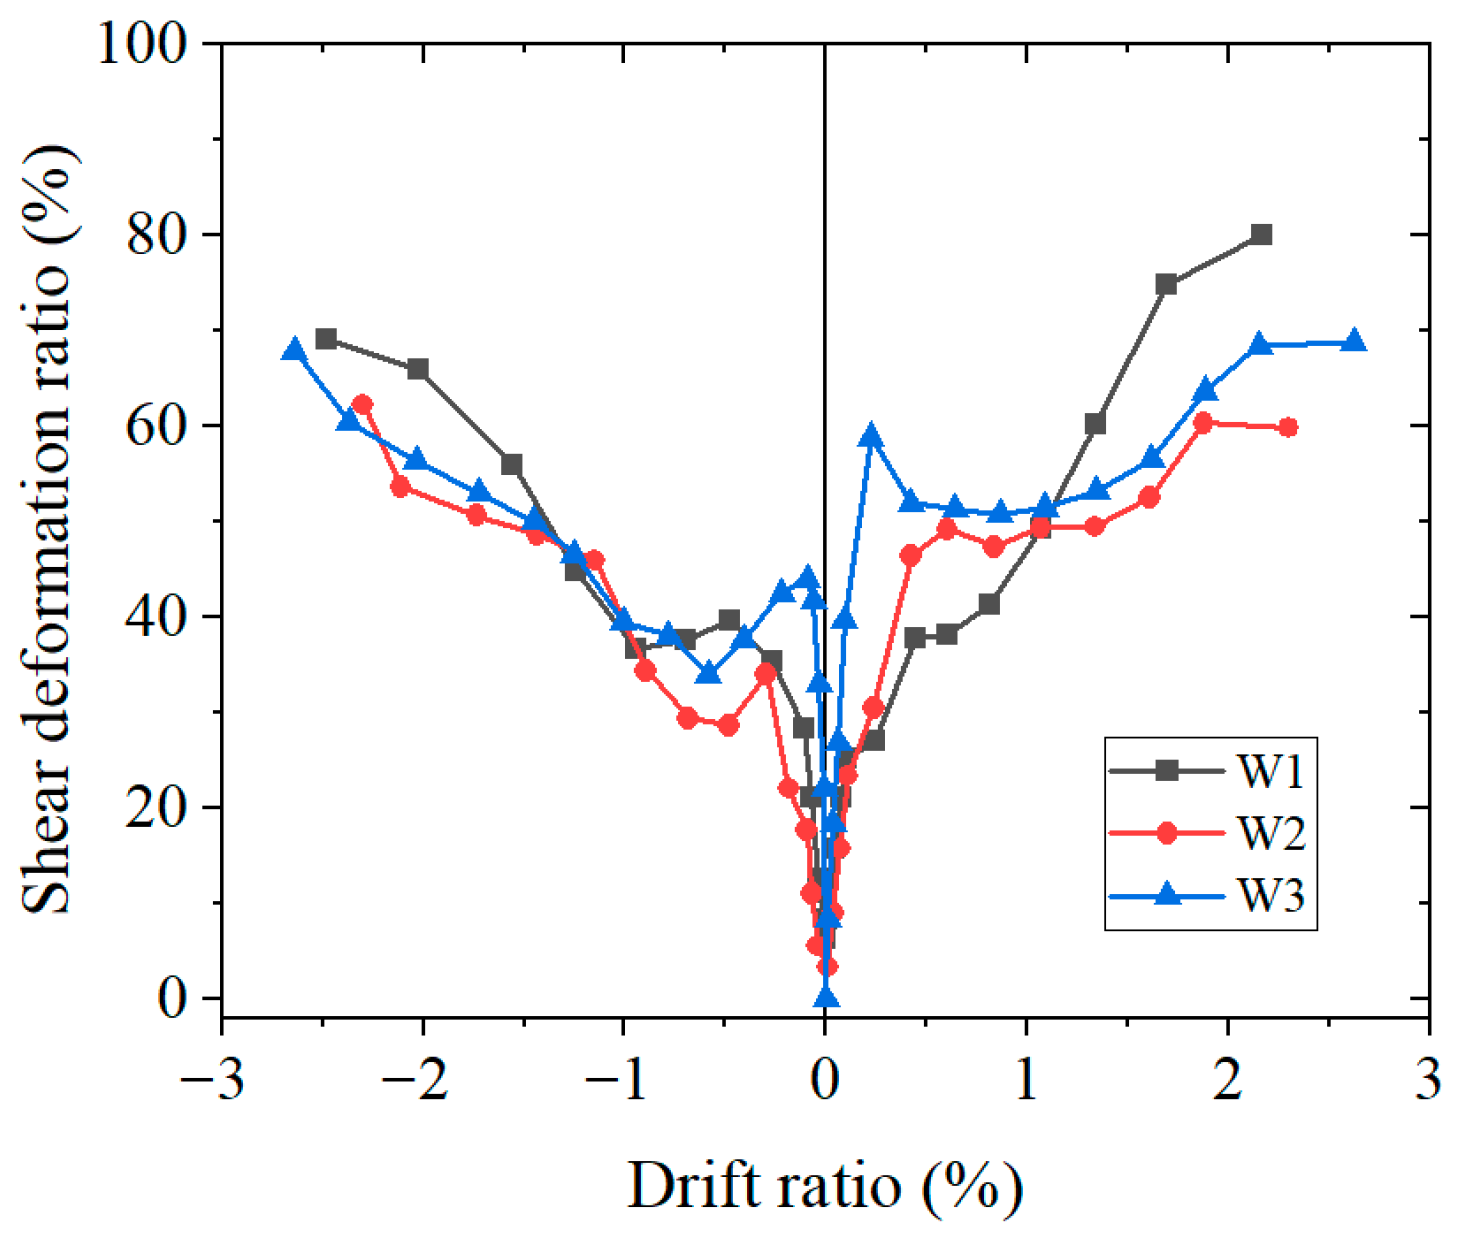
The variations Δ1 and Δ2 of the diagonals of the wall panel were measured in this study, and the shear deformation γ of the wall panel was calculated using Equation (9). Furthermore, the shear deformation ratio–drift ratio of each specimen was calculated, which was denoted as the shear deformation ratio of the wall panel.
Figure 19 illustrates the shear deformation ratio–drift ratio curves of the wall panels of the three specimens, providing key insights into how concrete thickness influences the in-plane deformation mechanism. The primary finding is that thinner concrete panels (specimen W1) lead to a significantly higher proportion of shear deformation at large drifts, with a maximum of 80%, compared to 60% for the thickest panel (specimen W3). This trend is consistent in both positive and negative loading directions. The divergence becomes pronounced after a drift ratio of 1.3%, coinciding with the onset of severe nonlinearity. This behavior is directly attributed to the differing buckling modes of the steel web: the overall buckling in W1 caused substantial diagonal lengthening/shortening, dominating the global deformation. In contrast, the local buckling in W2 and W3, afforded by the greater out-of-plane restraint from thicker concrete, preserved the integrity of the primary shear resisting mechanism, resulting in a lower shear deformation ratio and a more balanced deformation composition.
Figure 19.
Shear deformation ratio of composite shear wall panels.
4. Conclusions
This study compared the seismic performance of C-SPW/CE with varying concrete panel thicknesses through tests on three 1/3 scale specimens. The results provide key performance thresholds and thickness recommendations for engineering practice. The core findings are summarized as follows:
(1) Capacity retention threshold: To ensure that composite shear walls maintain a high load-carrying capacity (a suggested target of >90% of the peak capacity) under strong earthquake drift levels (2%), the concrete panel thickness should not be less than 35 mm. This recommendation is derived from interpolations based on specimen data (at an approximate 2% drift ratio, specimens W1 and W3 retained 84% and 92% residual carrying capacity, respectively).
(2) Buckling mode control threshold: To prevent the unfavorable overall buckling of steel web plates and promote a more ductile local buckling mode, the minimum thickness of the concrete panel should be no less than 30 mm. The results showed that overall buckling occurs at a thickness of 20 mm, while local buckling is observed at a thickness of 30 mm and more.
(3) Comprehensive safe design thickness range: Integrating the aforementioned requirements for capacity and stability, a “safe minimum thickness” of 30 mm is recommended for concrete panels in this type of C-PSW/CE. For primary structural components with higher seismic performance requirements, a thickness range of 35–40 mm is advisable. This range ensures that the wall panel simultaneously possesses an excellent capacity retention, ductility, and hysteretic energy dissipation capacity, facilitating a fundamental shift in the failure mode from “stability-controlled” to “strength-and-ductility-controlled”.
(4) Based on this study, a conceptual load-bearing capacity prediction model could be developed. The peak capacity of a composite shear wall can be expressed as
where Vy0 is the yield capacity of the steel web, Vc(t) is the contribution of the concrete panel, t is the concrete thickness, and β(t) is the restraint enhancement factor related to the concrete panel thickness, steel strength, and headed stud spacing.
Vmax = β(t)·Vy0 + Vc(t)
This provides a clear roadmap for future research to promote the systematic incorporation of concrete panel thickness into design codes: (a) conduct parametric studies (varying panel thickness, steel strength, headed stud spacing) to extensively calibrate β(t); (b) develop restoring force and deformation capacity calculation methods that account for the effect of concrete panel thickness; and (c) propose practical simplified formulas and detailed recommendations, based on performance-based design principles, suitable for engineering design.
Author Contributions
Conceptualization, X.D., X.M., J.D. and Q.G.; methodology, Y.Q., H.W., J.D. and N.W.; data curation, H.W.; writing—original draft preparation, H.W.; writing—review and editing, H.W., X.M., Q.G., X.D. and Y.Q.; supervision, Q.G., Y.Q. and X.D.; project administration, X.M.; funding acquisition, Q.G., Y.Q. and H.W. All authors have read and agreed to the published version of the manuscript.
Funding
This research was funded by the National Natural Science Foundation of China (52008283, 51678382) and the National Pre-Research Project of Suzhou City University (2024SGY016).
Data Availability Statement
The original contributions presented in this study are included in the article. Further inquiries can be directed to the corresponding authors.
Conflicts of Interest
The authors declare no conflicts of interest.
References
- Guo, L.H.; Li, R.; Rong, Q.; Zhang, S. Cyclic behavior of SPSW and CSPSW in composite frame. Thin Wall. Struct. 2012, 51, 39–52. [Google Scholar]
- Guo, L.H.; Ma, X.B.; Li, R.; Zhang, S. Experimental research on the seismic behavior of CSPSWs connected to frame beams. Earthq. Eng. Eng. Vib. 2011, 10, 65–73. [Google Scholar] [CrossRef] [Scilit]
- Zhao, Q.H.; Astaneh-Asl, A. Cyclic behavior of traditional and innovative composite shear walls. J. Struct. Eng. 2004, 130, 271–284. [Google Scholar] [CrossRef] [Scilit]
- Gan, C.J.; Lu, X.L.; Wang, W. Study on seismic behavior of steel plate reinforced concrete shear walls. J. Build. Struct. 2009, 5, 93–100. (In Chinese) [Google Scholar]
- Xiao, C.Z.; Zhu, A.P.; Li, J.H.; Li, Y. Experimental study on seismic performance of embedded steel plate-HSC composite shear walls. J. Build. Eng. 2021, 34, 101909. [Google Scholar] [CrossRef] [Scilit]
- Rahnavard, R.; Hassanipour, A.; Mounesi, A. Numerical study on important parameters of composite steel-concrete shear walls. J. Constr. Steel Res. 2016, 121, 441–456. [Google Scholar] [CrossRef] [Scilit]
- Arabzadeh, A.; Soltani, M.; Ayazi, A. Experimental investigation of composite shear walls under shear loadings. Thin Wall. Struct. 2011, 49, 842–854. [Google Scholar]
- Rahai, A.; Hatami, F. Evaluation of composite shear wall behavior under cyclic loadings. J. Constr. Steel Res. 2009, 65, 1528–1537. [Google Scholar] [CrossRef] [Scilit]
- Sun, F.F.; Li, G.Q.; Gao, H. Experimental research on seismic behavior of two-side composite steel plate walls. In Proceedings of the 3rd International Conference on Steel and Composite Structures, Manchester, UK, 30 July–1 August 2007. [Google Scholar]
- Rassouli, B.; Shafaei, S.; Ayazi, A.; Farahbod, F. Experimental and numerical study on steel-concrete composite shear wall using light-weight concrete. J. Constr. Steel Res. 2016, 126, 117–128. [Google Scholar]
- Yang, X.; Xu, L.; Pan, J.L. Mechanical behavior of full-scale composite steel plate shear wall restrained by ECC panels. J. Build. Eng. 2021, 44, 102864. [Google Scholar] [CrossRef] [Scilit]
- Ayazi, A.; Shafaei, S. Steel–concrete composite shear walls using precast high performance fiber reinforced concrete panels. Struct. Des. Tall Spec. 2019, 10, e1617. [Google Scholar]
- Cobanoglu, O.; Lu, X.; Ni, X.; Liang, L.; Zhou, Z. Cyclic behavior of UHPC-filled high-strength double steel plate composite shear walls. J. Constr. Steel Res. 2025, 226, 109292. [Google Scholar]
- Arabzade, A.; Moharami, H.; Ayazi, A. Local elastic buckling coefficients of steel plates in composite steel plate shear walls. Sci. Iran. 2011, 18, 9–15. [Google Scholar] [CrossRef] [Scilit]
- Amani, M.; Rafeei, B.; Alinia, M. Shear buckling and ultimate capacity of steel plates coupled with cover panels. J. Constr. Steel Res. 2013, 80, 181–187. [Google Scholar] [CrossRef] [Scilit]
- Dey, S.; Bhowmick, A.K. Seismic performance of composite plate shear walls. Structures 2016, 6, 59–72. [Google Scholar] [CrossRef] [Scilit]
- Shafaei, S.; Ayazi, A.; Farahbod, F. The effect of concrete panel thickness upon composite steel plate shear walls. J. Constr. Steel Res. 2016, 117, 81–90. [Google Scholar] [CrossRef] [Scilit]
- Shafaei, S.; Farahbod, F.; Ayazi, A. The Wall-Frame and the Steel-Concrete Interactions in Composite Shear Walls. Struct. Des. Tall Spec. 2018, 11, e1476. [Google Scholar] [CrossRef] [Scilit]
- Hayatdavoodi, A.; Dehghani, A.; Aslani, F.; Nateghi-Alahi, F. The development of a novel analytical model to design composite steel plate shear walls under eccentric shear. J. Build. Eng. 2021, 44, 103281. [Google Scholar] [CrossRef] [Scilit]
- Qi, Y.; Gu, Q.; Sun, G.H.; Zhao, B.; Wang, H.F. Concrete panel thickness demand for the design of composite steel plate shear wall. Struct. Des. Tall Spec. 2019, 28, e1605. [Google Scholar] [CrossRef] [Scilit]
- Qi, Y.; Gu, Q.; Sun, G.H.; Zhao, B.; Wang, H.F. Tensile force and bending moment demands on headed stud for the design of composite steel plate shear wall. Adv. Steel Constr. 2019, 15, 338–348. [Google Scholar]
- Qi, Y.; Gu, Q.; Sun, G.H.; Zhao, B. Shear force demand on headed stud for the design of composite steel plate shear wall. Eng. Struct. 2017, 148, 780–792. [Google Scholar] [CrossRef] [Scilit]
- Djerrad, A.; Zhou, Y.; Meng, S. A transformer-based deep learning framework for predicting crack patterns and structural responses in RC shear walls. Eng. Struct. 2025, 343, 121051. [Google Scholar] [CrossRef] [Scilit]
- ANSI/AISC 341-16; Seismic Provisions for Structural Steel Buildings. American Institute of Steel Construction: Chicago, IL, USA, 2016.
- Ministry of Housing and Urban-Rural Development of the People’s Republic of China. Specification for Seismic Test of Buildings; China Architecture and Building Press: Beijing, China, 2015. (In Chinese) [Google Scholar]
- Mu, Z.; Yang, Y. Experimental and numerical study on seismic behavior of obliquely stiffened steel plate shear walls with openings. Thin Wall. Struct. 2020, 146, 106457. [Google Scholar]

Disclaimer/Publisher’s Note: The statements, opinions and data contained in all publications are solely those of the individual author(s) and contributor(s) and not of MDPI and/or the editor(s). MDPI and/or the editor(s) disclaim responsibility for any injury to people or property resulting from any ideas, methods, instructions or products referred to in the content. |
© 2026 by the authors. Licensee MDPI, Basel, Switzerland. This article is an open access article distributed under the terms and conditions of the Creative Commons Attribution (CC BY) license.