


Abstract
The quality of rebar construction is a critical factor that significantly affects the structural stability of reinforced concrete structures. Various automated inspection technologies have been developed to overcome the limitations of conventional labor-intensive inspection methods. However, owing to the complex geometry of rebar arrangements and challenging site conditions, existing approaches still face difficulties in achieving the high accuracy and real-time performance required for practical applications. To address these limitations, this study proposes an automated rebar-spacing inspection technique based on color recognition of painted tie wires with the aim of improving the efficiency and accuracy of data recognition and processing. Field experimental results demonstrated that the use of fluorescent-green tie wires in the HSV color space minimized false detections and achieved a high average recognition rate of 92.6% with the identification of optimal threshold ranges. Furthermore, by utilizing tie-wire intersection coordinates, the stable identification of rebar arrangement conditions and reliable estimation of rebar spacing were achieved, even under conditions with missing data. The proposed automated inspection method can enable more efficient data acquisition and processing under complex construction site conditions while providing accurate and reliable inspection results.
1. Introduction
In reinforced concrete (RC) structures, the quality of the rebar work has a significant impact on the overall structural safety and durability. Deficiencies in rebar quality control may arise from various factors, including design-stage errors, negligence, improper practices at construction sites, and insufficient supervision and inspection. Consequently, inadequate reinforcement, incorrect rebar placement, and insufficient anchorage or lap splice lengths can occur, leading to cracking, excessive deflection, and even structural failure during both construction and operation stages. For example, recent investigations following major earthquakes, including the 2023 Kahramanmaraş earthquake, have demonstrated that poor reinforcement properties in RC buildings can lead to brittle failure and loss of load-bearing capacity [1]. Similarly, the collapse accident in 2023 at an apartment construction site in Incheon highlighted how deficiencies in reinforcement placement and quality control can compromise structural safety [2]. These cases underscore the critical importance of rigorous quality control in rebar work.
Particularly, recent trends, such as the aging of skilled rebar workers and increasing reliance on foreign labor, have contributed to a general decline in the quality of rebar placement at construction sites. Moreover, visual inspections conducted by a limited number of supervisory and management personnel increase the likelihood of inspection omissions and human errors, while also reducing the efficiency of documentation and information-sharing processes [3,4].
Accordingly, recent efforts have focused on transitioning from conventional manual inspection methods to digital inspection approaches by leveraging advanced technologies. Although digital inspection can overcome the limitations of direct visual observation, its practical applicability is reduced by various factors, including the measurement accuracy, inspection time, and the need for specialized equipment. Existing studies on automated rebar inspection have primarily focused on developing methods to automatically measure rebar spacing and quantity using data acquired from light detection and ranging (LiDAR) systems or 2D and 3D cameras. LiDAR-based point-cloud measurement methods offer high data accuracy and wide measurement coverage; however, large data volumes and noise generated when using these methods significantly increase the computational burden and processing time during object recognition and analysis, thereby limiting the provision of real-time inspection results [5,6]. Conversely, image-based measurement methods using cameras offer advantages in terms of real-time performance; however, large amounts of training data are required for achieving high inspection accuracy, and the performance is influenced by the image acquisition conditions [7,8]. Therefore, most studies have focused on laboratory-scale specimens or single rebar components, emphasizing improvements in rebar extraction accuracy and the high processing speeds achieved using artificial intelligence-based methods [4,7,9,10,11]. Consequently, although digital inspection technologies can be applied to limited areas of construction sites, they have not been sufficiently developed for generalized onsite use or commercial deployment.
For the effective functioning of automated rebar inspection technologies in complex and diverse construction environments, both real-time performance through efficient data acquisition and processing and the provision of accurate inspection results through reliable object extraction are required. However, existing approaches often struggle to simultaneously achieve these objectives under real site constructions. To address this gap, this study developed an automated approach for detecting rebar spacing by extracting details of the tie wires used to fix rebar positions at intersection points, rather than directly detecting the entire rebar network. Typically, tie wires are applied at more than 50% of the rebar intersection points, facilitating the assessment of rebar spacing and detection of missing reinforcements based on tie-wire information. However, as conventional tie wires are thin and in colors similar to those of rebars, their visual identification is challenging. To address this issue, this study adopted a method of painting tie wires with visually distinctive colors before tying, thereby enhancing the efficiency and accuracy of tie-wire recognition and extraction. The use of painted tie wires does not affect structural performance but improves visual manageability and represents an economically feasible solution [12]. This study developed (1) a method for recognizing rebar tying points using the color information of painted tie wires and (2) a method for identifying rebar arrangement conditions and spacing based on extracted intersection coordinates. Field experiments under real construction site conditions were conducted to evaluate the applicability of the proposed approach. By achieving a reliable inspection accuracy without requiring additional model training, this study fills the gap between laboratory-scale research and practical deployment, contributing to the enhanced applicability of automated rebar inspection technologies.
2. Literature Review
Table 1 lists the representative studies that proposed automated inspection methods for rebar recognition and quality assessment of RC structures. These studies can be broadly classified into image- and point-cloud-based approaches according to their data acquisition methods. RGB image-based techniques in which images are acquired from drones or smartphone cameras have primarily been combined with deep learning-based object detection techniques, such as You Only Look Once (YOLO) or Faster Regions with Convolutional Neural Networks (R-CNN) algorithms, enabling real-time automatic identification of rebar objects and placement conditions from 2D images [13,14,15]. Such methods have demonstrated strong performance in identifying the number of hoop bars, counting rebar cross sections, or verifying the presence of reinforcement in column regions. The primary advantage of these approaches is their accessibility; smartphones and drones provide low-cost and flexible data acquisition.
Conversely, in studies based on 3D point-cloud models, data are acquired using terrestrial laser scanners or handheld LiDAR systems and combined with algorithms such as random sample consensus (RANSAC) or customized slicing algorithms, facilitating a more precise quantitative inspection of various factors, including spacing, diameter, and positional attributes [4,10,16]. These approaches provide a significantly higher geometric accuracy than RGB image-based methods.
Moreover, attempts have been made to generate 3D models more efficiently by simultaneously acquiring 2D images and depth information using sensors such as RGB-depth (RGB-D) and 360-degree cameras [11,17,18]. Another study reconstructed 3D models from multiple images by applying techniques such as Structure-from-Motion (SfM) and Multi-View Stereo (MVS) to extract quantitative information with enhanced reliability [19]. Moreover, studies integrating augmented reality (AR) technologies have demonstrated their potential in enhancing interactions with onsite workers by intuitively visualizing inspection results and providing real-time corrective guidance in the field [4,20].
Despite these technological advancements, several limitations remain for practical applications at real construction sites. High-precision LiDAR scanners are expensive and require specialized training, whereas point-cloud processing is computationally expensive. Conversely, low-cost camera-based approaches are sensitive to environmental noise, scale ambiguity, and illumination variability, making precise measurements challenging without extensive calibration or model training. Moreover, occlusions caused by complex reinforcement patterns frequently result in incomplete or inaccurate 3D reconstructions, even when LiDAR or multi-view approaches are used. Therefore, several existing studies have validated their methods in controlled laboratory environments or via simplified structural configurations, resulting in insufficient performance under diverse and complex field conditions.
To overcome these limitations, this study proposes a novel approach that shifts the detection focus from the entire rebar network to tie wires, which serve as a reliable indicator of rebar intersections. By targeting tie wires instead of the entire rebar arrangement, the proposed approach significantly reduces the object complexity, computational burden, and processing time. Moreover, painted tie wires with visually distinctive colors are employed to enhance robustness against external environmental variations. By using colors that clearly contrast with the surrounding rebars and other objects, the proposed method enables robust object recognition without additional training while minimizing noise under various site conditions. Finally, based on the detected tie wire intersections, the proposed approach estimates the condition of the rebar arrangement and measures the rebar spacing, even in the presence of noise and partial data loss. Through this strategy, combining simplified detection targets, training-free color-based recognition, and field-validated evaluation, this study introduces a practical alternative to existing automated rebar inspection technologies for real construction environments.
Table 1.
Research on automated rebar inspection.
3. Automated Rebar Inspection Process Based on Painted Tie Wire Color Recognition
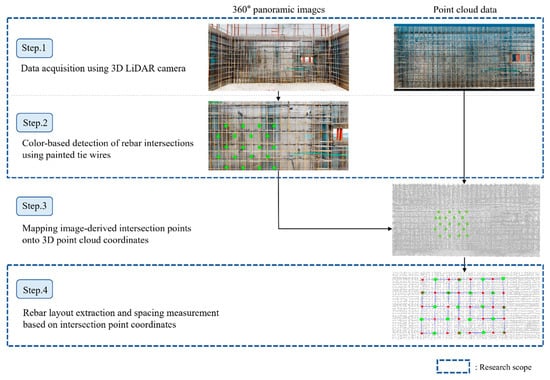
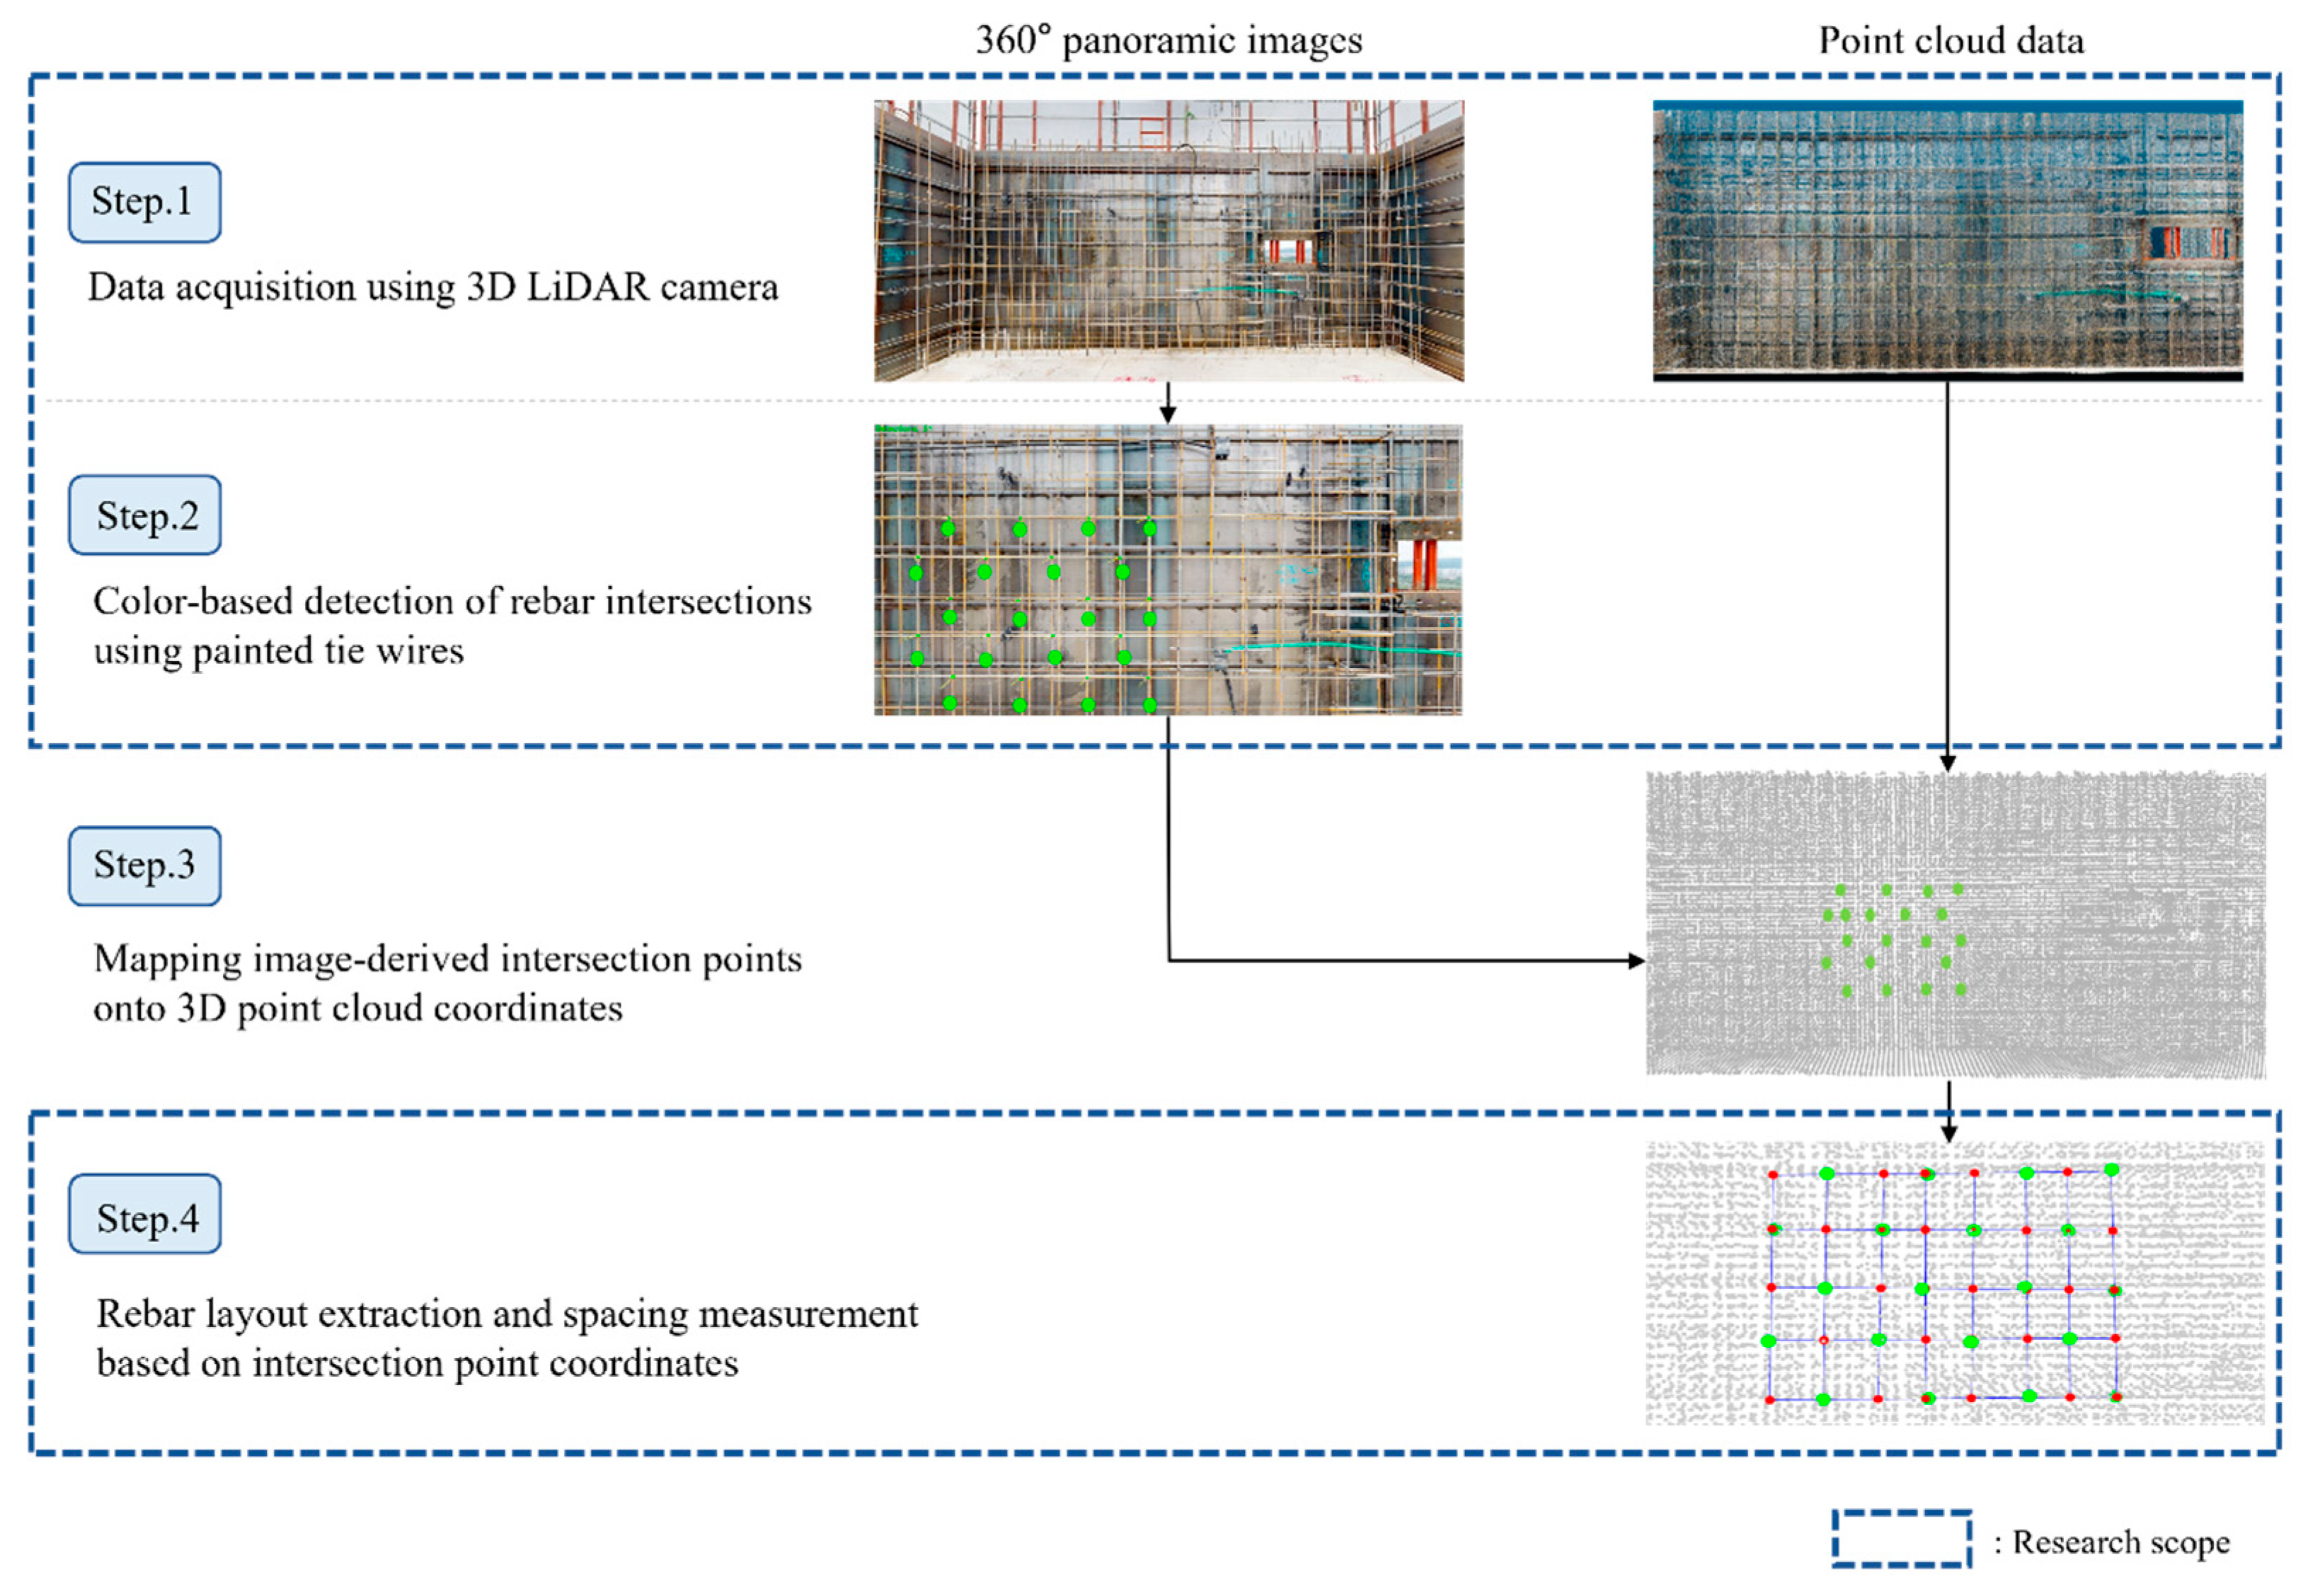
As illustrated in Figure 1, the automated rebar inspection process based on painted tie-wire recognition comprises the following four major stages: (1) data acquisition using a 3D LiDAR camera, (2) extraction of intersection points through color recognition of painted tie wires, (3) mapping of image-derived intersection points to 3D point-cloud coordinates, and (4) extraction of rebar arrangement geometry and measurement of rebar spacing based on intersection coordinates.
Figure 1.
Automated rebar inspection process based on painted tie wires.
This study proposes two methods: a method for recognizing rebar tying points using the color information of painted tie wires and an approach for identifying rebar arrangement conditions and spacing based on the extracted intersection coordinates. The primary focus of this study was to evaluate the applicability of the proposed approach under various conditions using real-world field experimental data.
3.1. Data Acquisition Using a 3D LiDAR Camera
As discussed previously, image-based approaches exhibit limited measurement precision, whereas point-cloud-based approaches suffer from limitations in terms of real-time performance. In this study, high-resolution images and point-cloud data (PCD) were simultaneously acquired using a 3D LiDAR camera, and only tie-wire objects were targeted for recognition. This strategy enabled the proposed method to achieve both real-time performance and high inspection accuracy.
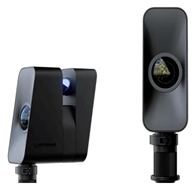
As listed in Table 2, a Pro3 camera manufactured by Matterport LLC, CA, USA, which integrates a 360° camera that provides RGB-D images with a LiDAR sensor, was employed [21]. It integrates a high-resolution panoramic-imaging system with a LiDAR sensor to simultaneously capture visual and depth information. The camera system uses multiple high-resolution sensors to acquire 360° panoramic images with a combined resolution of approximately 134.2 megapixels. The LiDAR sensor can measure depth information at distances of up to 100 m and provides 3D PCD with high geometric reliability, with a specified measurement accuracy of approximately ±20 mm at a 10 m range. The acquired RGB imagery and LiDAR-based depth data were jointly processed to generate panoramic visual representations and corresponding point-cloud models. Under standard-density settings, a single scan can be completed in approximately 15–20 s, enabling efficient data acquisition in field environments. Therefore, the collected data were well suited for both image-based color recognition of painted tie wires and point-cloud-based distance and spacing measurements, supporting the proposed automated rebar inspection process.
Table 2.
Images and specifications of the data acquisition device [21].
3.2. Color-Based Intersection Extraction Using Painted Tie Wires
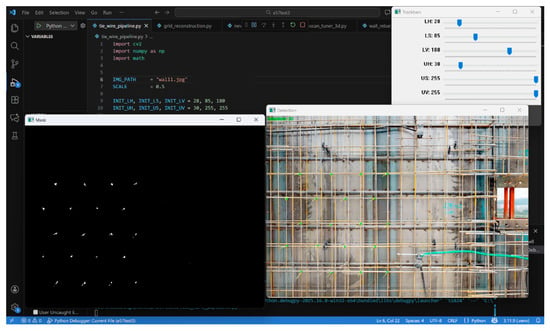
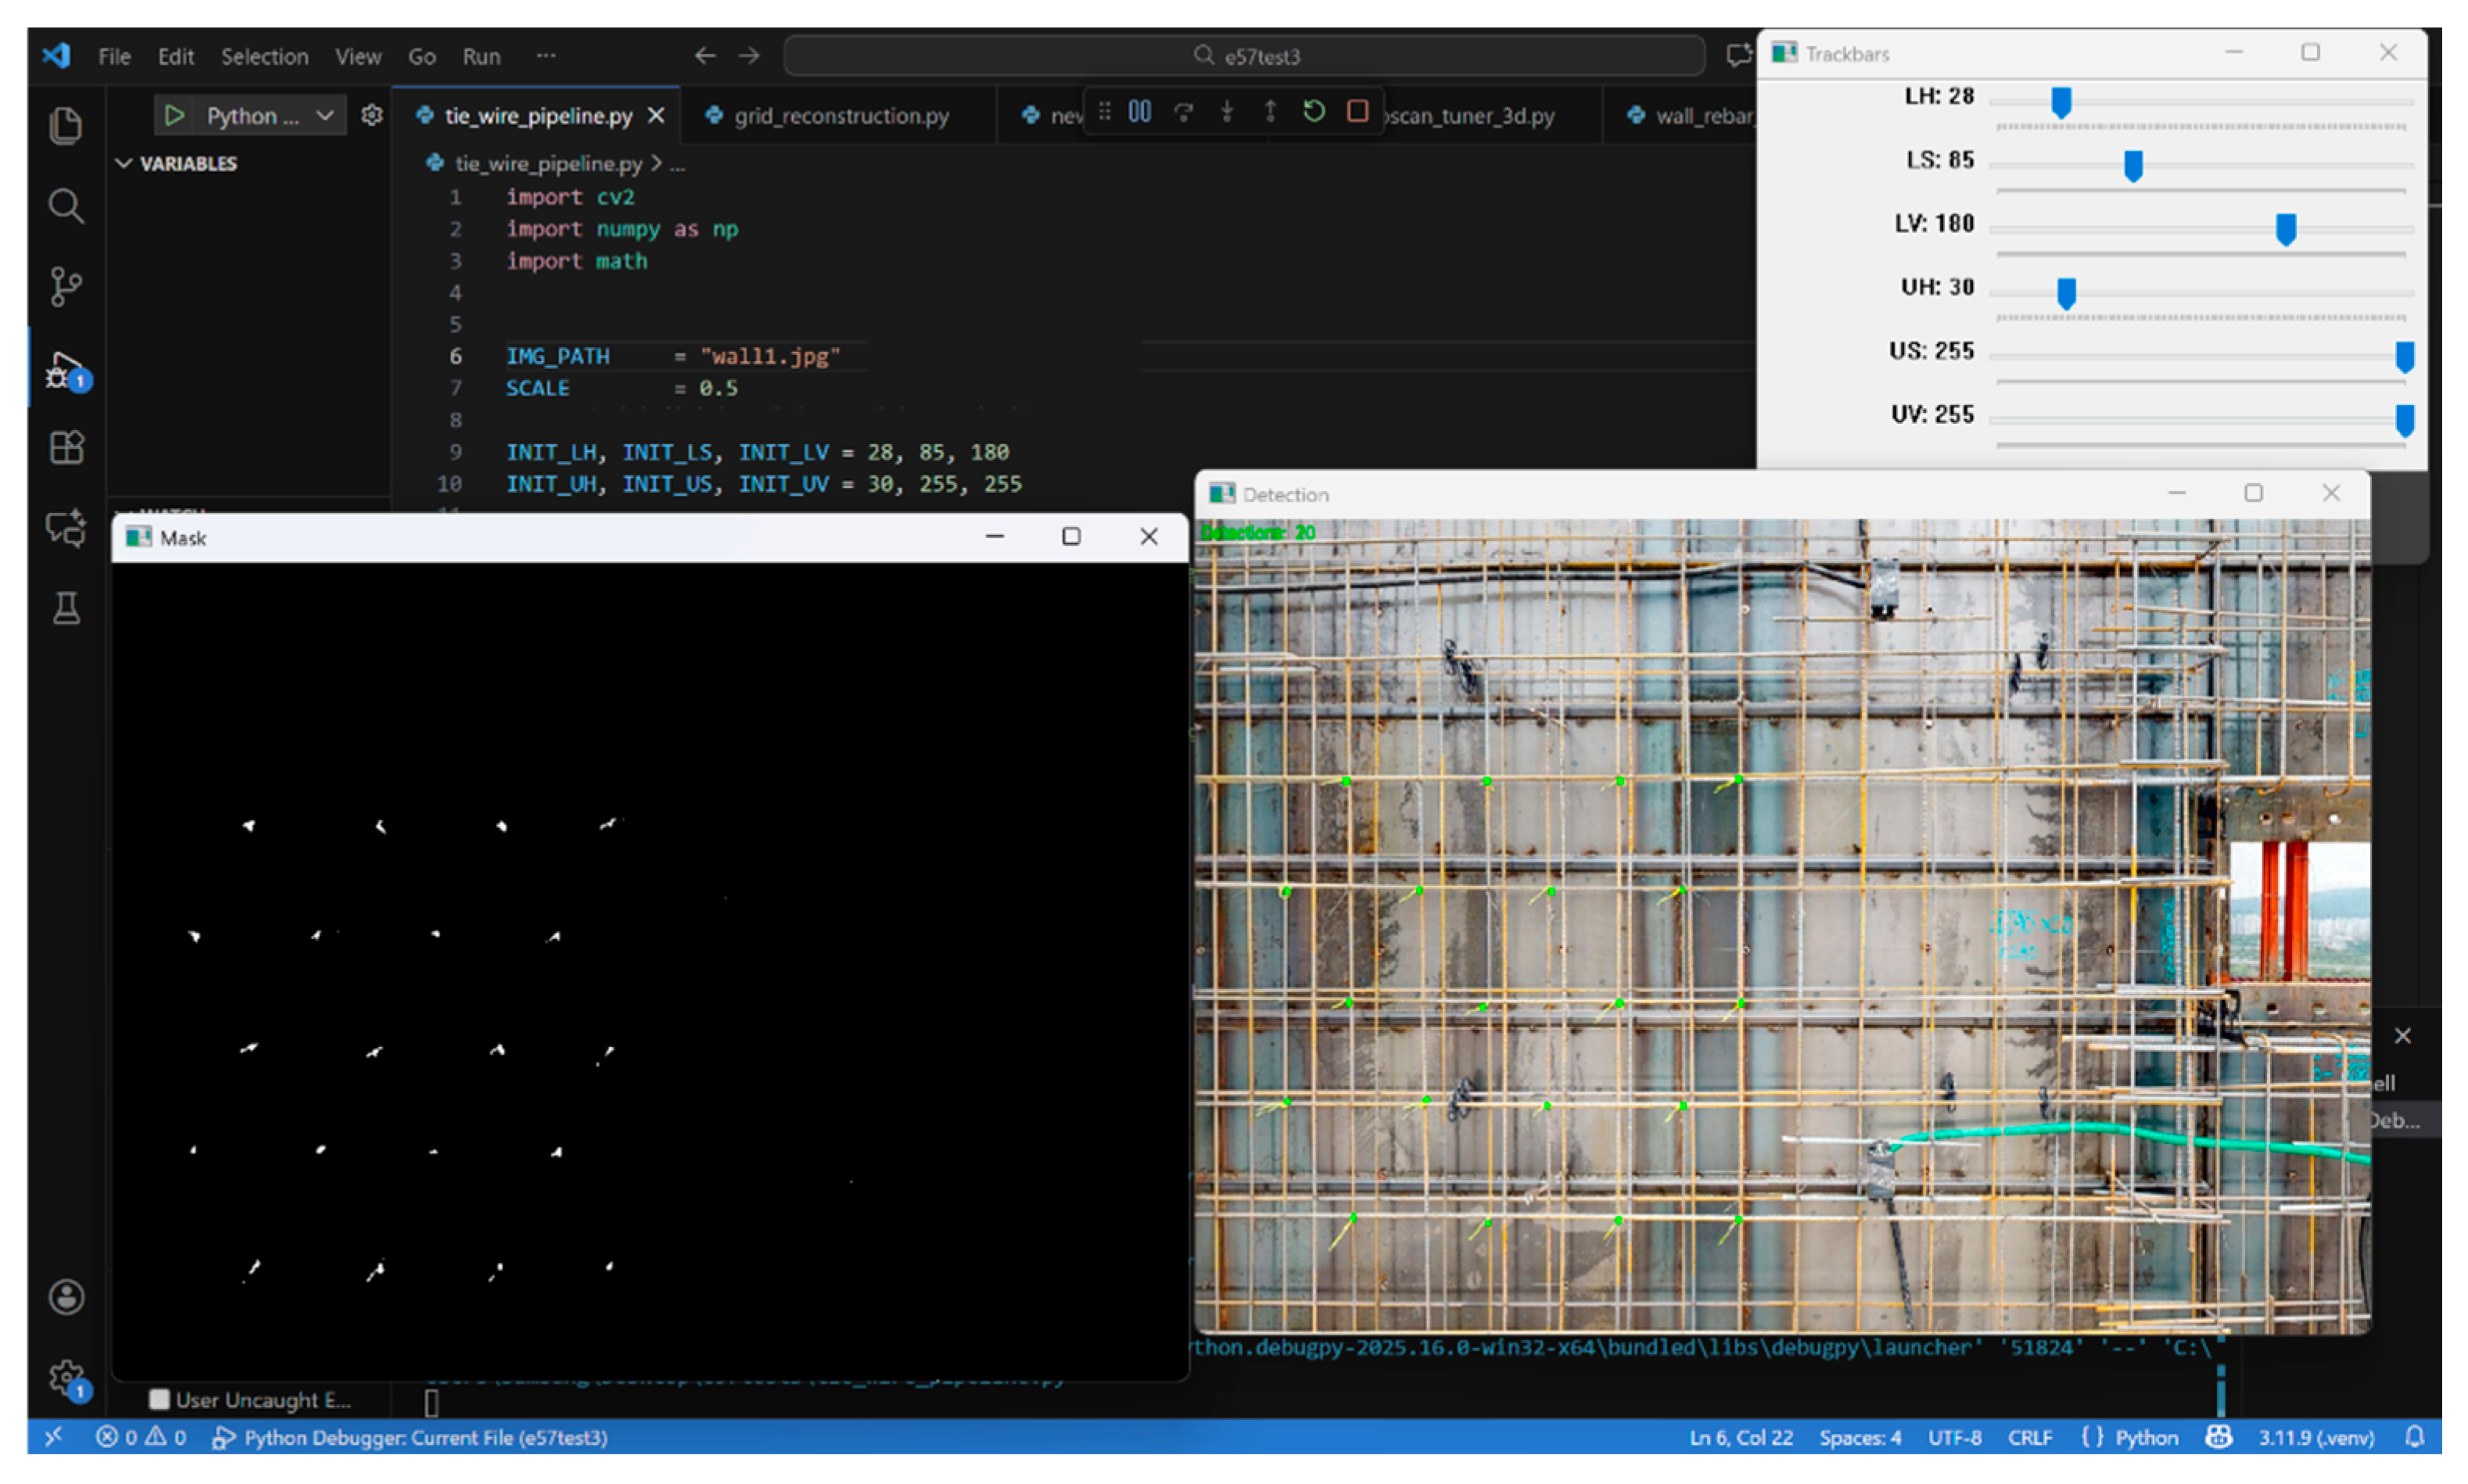
Color recognition of the painted tie wires was first performed using the previously acquired panoramic image data. In this study, both the RGB and HSV color spaces were employed for painted tie-wire color recognition, and the more suitable color space was determined based on the experimental results. For each color space, threshold ranges capable of effectively extracting the colors of the painted tie wires were applied to separate the candidate tie-wire pixels into a foreground mask (Figure 2). The threshold ranges were also determined experimentally to identify the appropriate values.
Figure 2.
Threshold setting and foreground mask extraction in the HSV color space.
Subsequently, noise was removed from the candidate pixels that were extracted through color-range filtering, and the fragmented tie-wire segments were processed to extract the locations of the tie-wire intersection points. Depending on the imaging environment, residual noise caused by light reflections, shadows, and background textures may persist. Moreover, certain portions of the tie wires may be detected as disconnected segments owing to illumination conditions or viewing angles. To address these issues, a noise-removal procedure that combines morphological operations with connected component analysis was applied, which is explained subsequently.
First, a morphological closing operation () using a structuring element () was applied twice to a binary mask () to fill the gaps between the disconnected tie-wire segments. Here, is a small kernel used for morphological operations. In this study, a circular structuring element with a diameter of seven pixels was selected based on the thickness of the tie-wire knots and image resolution, allowing small gaps to be filled without excessive merging. The closing operation comprised dilation (⊕) followed by erosion (⊖), as expressed in Equation (1). During the dilation step, the foreground (white) regions were expanded outward to bridge small discontinuities and fill minor voids. In the subsequent erosion step, excessively expanded boundaries were contracted to approximate the original thickness, thereby reducing protrusions and noise while preserving the newly connected regions. Through this process, noise removal and contour restoration were achieved simultaneously.
After morphological processing, the area () of each connected component () was computed using the “connectedComponentsWithStats()” function from the OpenCV library. Components with an area smaller than 15 square pixels were considered too small to represent meaningful tie-wire fragments and were therefore classified as sensor noise and removed.
Even after noise removal, a single tie wire can be represented by multiple separate components. To address this, a set of centroid coordinates () was constructed for the extracted connected components. The Euclidean distance () between two centroids ( and ) was computed using Equation (2). Here, and denote the centroid of the candidate fragment and and denote the centroid of another fragment (i j). If was smaller than the predefined merging radius (30 pixels), the two candidates were regarded as belonging to the same tie wire and were merged into a single group. This merging rule was applied transitively; for example, if () was merged with () and () was merged with (), then , , and would belong to the same group. A group of tie wires was obtained using this process.
Finally, the representative point () of each group () is defined as the mean of all the centroid coordinates within the group, as expressed in Equation (3). This representative point corresponded to the final intersection location of the tie wires.
3.3. Rebar Arrangement and Spacing Detection Based on Intersection Coordinates
The proposed rebar-spacing estimation process involved reconstructing a virtual grid using the centroids of the detected painted tie wires and calculating the differences in the distances between adjacent grid lines. Previous studies [3,5,22] directly detected the entire rebar geometry from PCD or relied on RANSAC-based fitting. However, such approaches often struggle to achieve stable results under complex site conditions owing to noise, occlusions, and environmental variability. Conversely, this study utilized only repetitive tie wires and grid-like feature points as minimal units to inversely estimate the entire reinforcement grid, thereby overcoming the limitations of conventional methods. Therefore, the rebar-spacing-detection algorithm proposed by Hwang et al. [23] was refined and applied.
Mapping the previously detected 2D pixel coordinates of the tie-wire candidates to a 3D coordinate system was beyond the scope of this study. Therefore, a manual mapping approach was adopted to obtain the input data for 3D analysis. Particularly, the scan data acquired using the 3D LiDAR camera were converted into PCD in the LAS file format. Subsequently, corresponding 3D points were manually selected by the user based on the locations of the tie-wire candidates extracted from the 2D images, thereby forming the initial point-cloud dataset.
Subsequently, a preprocessing step was performed using density-based spatial clustering (DBSCAN). Because rebar tie wires are physically concentrated near a dominant plane, the densest cluster was identified as the main cluster, whereas statistically separated points were regarded as noise and removed.
Because the refined point cloud (P) is distributed in 3D space, the optimal plane representing the rebar arrangement must be mathematically defined. In this study, a principal component analysis-based plane estimation method was applied by exploiting the geometric characteristics of RC wall reinforcement, which exhibited wide distributions along the horizontal (u) and vertical (v) directions, but a narrow distribution along the thickness (w) direction.
By performing singular value decomposition on the covariance matrix of the PCD, eigenvectors corresponding to descending variance magnitudes were obtained. The eigenvector associated with the smallest singular value represents the direction of minimal variance, which corresponds to the wall thickness direction, and thus defines the normal vector (n). Using the extracted normal vector (n) and centroid (c) of the point cloud, the depth () of each point () relative to the plane was calculated as follows:
The distribution of the computed depth values () was then analyzed to automatically determine the reinforcement configuration. First, a 1D DBSCAN was applied to the depth data to cluster points according to depth. The difference in distance between clusters () was subsequently computed to identify the reinforcement type. If the intercluster distance was smaller than a predefined threshold (set to 2 cm in this study, considering the rebar diameter and construction tolerances), the configuration was regarded as a single-layer reinforcement, and all points were merged into one group. Otherwise, the reinforcement was classified as a double-layer reinforcement and separated into front and back layers. This procedure enabled automatic identification of the reinforcement configuration without requiring user-defined settings, thereby enhancing the general applicability of the proposed algorithm.
Because the points within each separated layer are irregularly distributed in 3D space, they must be transformed into structured grid representations. The points in each layer were projected onto a 2D plane, and clustering was performed along the u-axis (horizontal) and v-axis (vertical) to identify the groups of rebars lying on the same line. For each group, a representative straight-line equation was derived using the least squares method. Equation (5) represents the objective function for estimating the slope (a) and intercept (b) by minimizing the sum of the squared errors (E):
However, each group may still contain noise points that deviate from the actual rebar lines. To remove these outliers, the perpendicular distance between each point and the estimated line was calculated. Points exceeding a tolerance threshold () (set to 10 cm in this study based on typical rebar spacing) were classified as outliers and removed. The final line equations were recalculated using only the refined points to minimize the grid distortion caused by noise.
The final rebar spacing was computed based on the distances between the intersection points formed by the reconstructed sets of virtual horizontal (H) and vertical (V) lines. When the equations of the horizontal line () and vertical line () were solved simultaneously, the coordinates (u, v) of the intersection point were obtained using the linear algebraic solution, as shown in Equation (6). Here, and denote the slope and intercept of the horizontal rebar line, respectively, and and represent those of the vertical rebar line, respectively.
The resulting 2D intersection points were then inversely transformed into 3D coordinates. Finally, the Euclidean distance (D) between the adjacent intersection points (, , ) and , , )) was calculated using Equation (7), enabling quantitative measurement of the rebar spacing. Because the virtual intersection points are mathematically reconstructed even in regions where tie wires are physically missing or occluded, the proposed method enabled the complete estimation of the rebar spacing without omission.
4. Experimental Overview
To verify the applicability of the proposed method under the complex and diverse conditions of real construction environments, field-based experiments reflecting actual site conditions were conducted. The experiments were conducted in a newly constructed RC residential building project comprising 734 housing units located in Gwangju, Republic of Korea. The building adopted a wall-type structural system, and data were collected from the wall elements located on the top floor of the structure under cloudy or diffused daylight conditions with dry surfaces.
Two stages of experiments were conducted according to the experimental objectives. The first experiment was performed to determine an appropriate paint color for tie wires, optimal color space, and suitable threshold ranges for color recognition. Based on the results of the first experiment, the second experiment was conducted to evaluate the applicability of the proposed intersection extraction and rebar-spacing measurement algorithms.
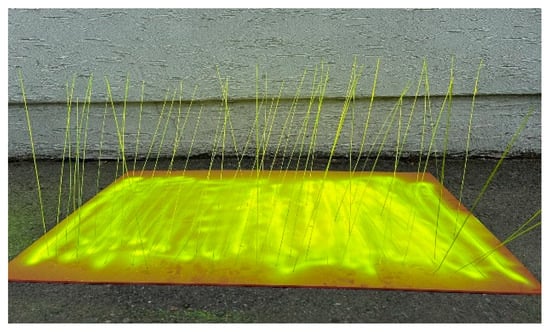
In the first experiment, two fluorescent paint colors, fluorescent green and fluorescent pink, were applied to the tie wires. These colors were selected based on preliminary simulation tests that considered visual distinctiveness and recognition performance. The selected colors were applied to conventional tie wires using spray coating with a drying time of a few minutes (Figure 3). In this study, the coating process was completed one day prior to the field experiment. As a result, the painted tie wires remained visually distinguishable throughout handling and tying, without causing any adverse effects on site operations.
Figure 3.
Tie wires coated with fluorescent-green spray.
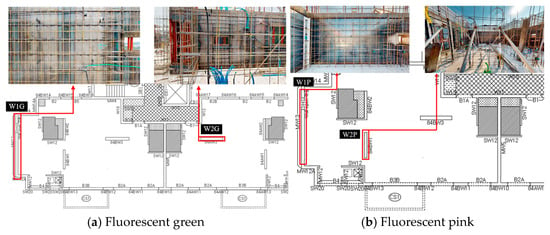
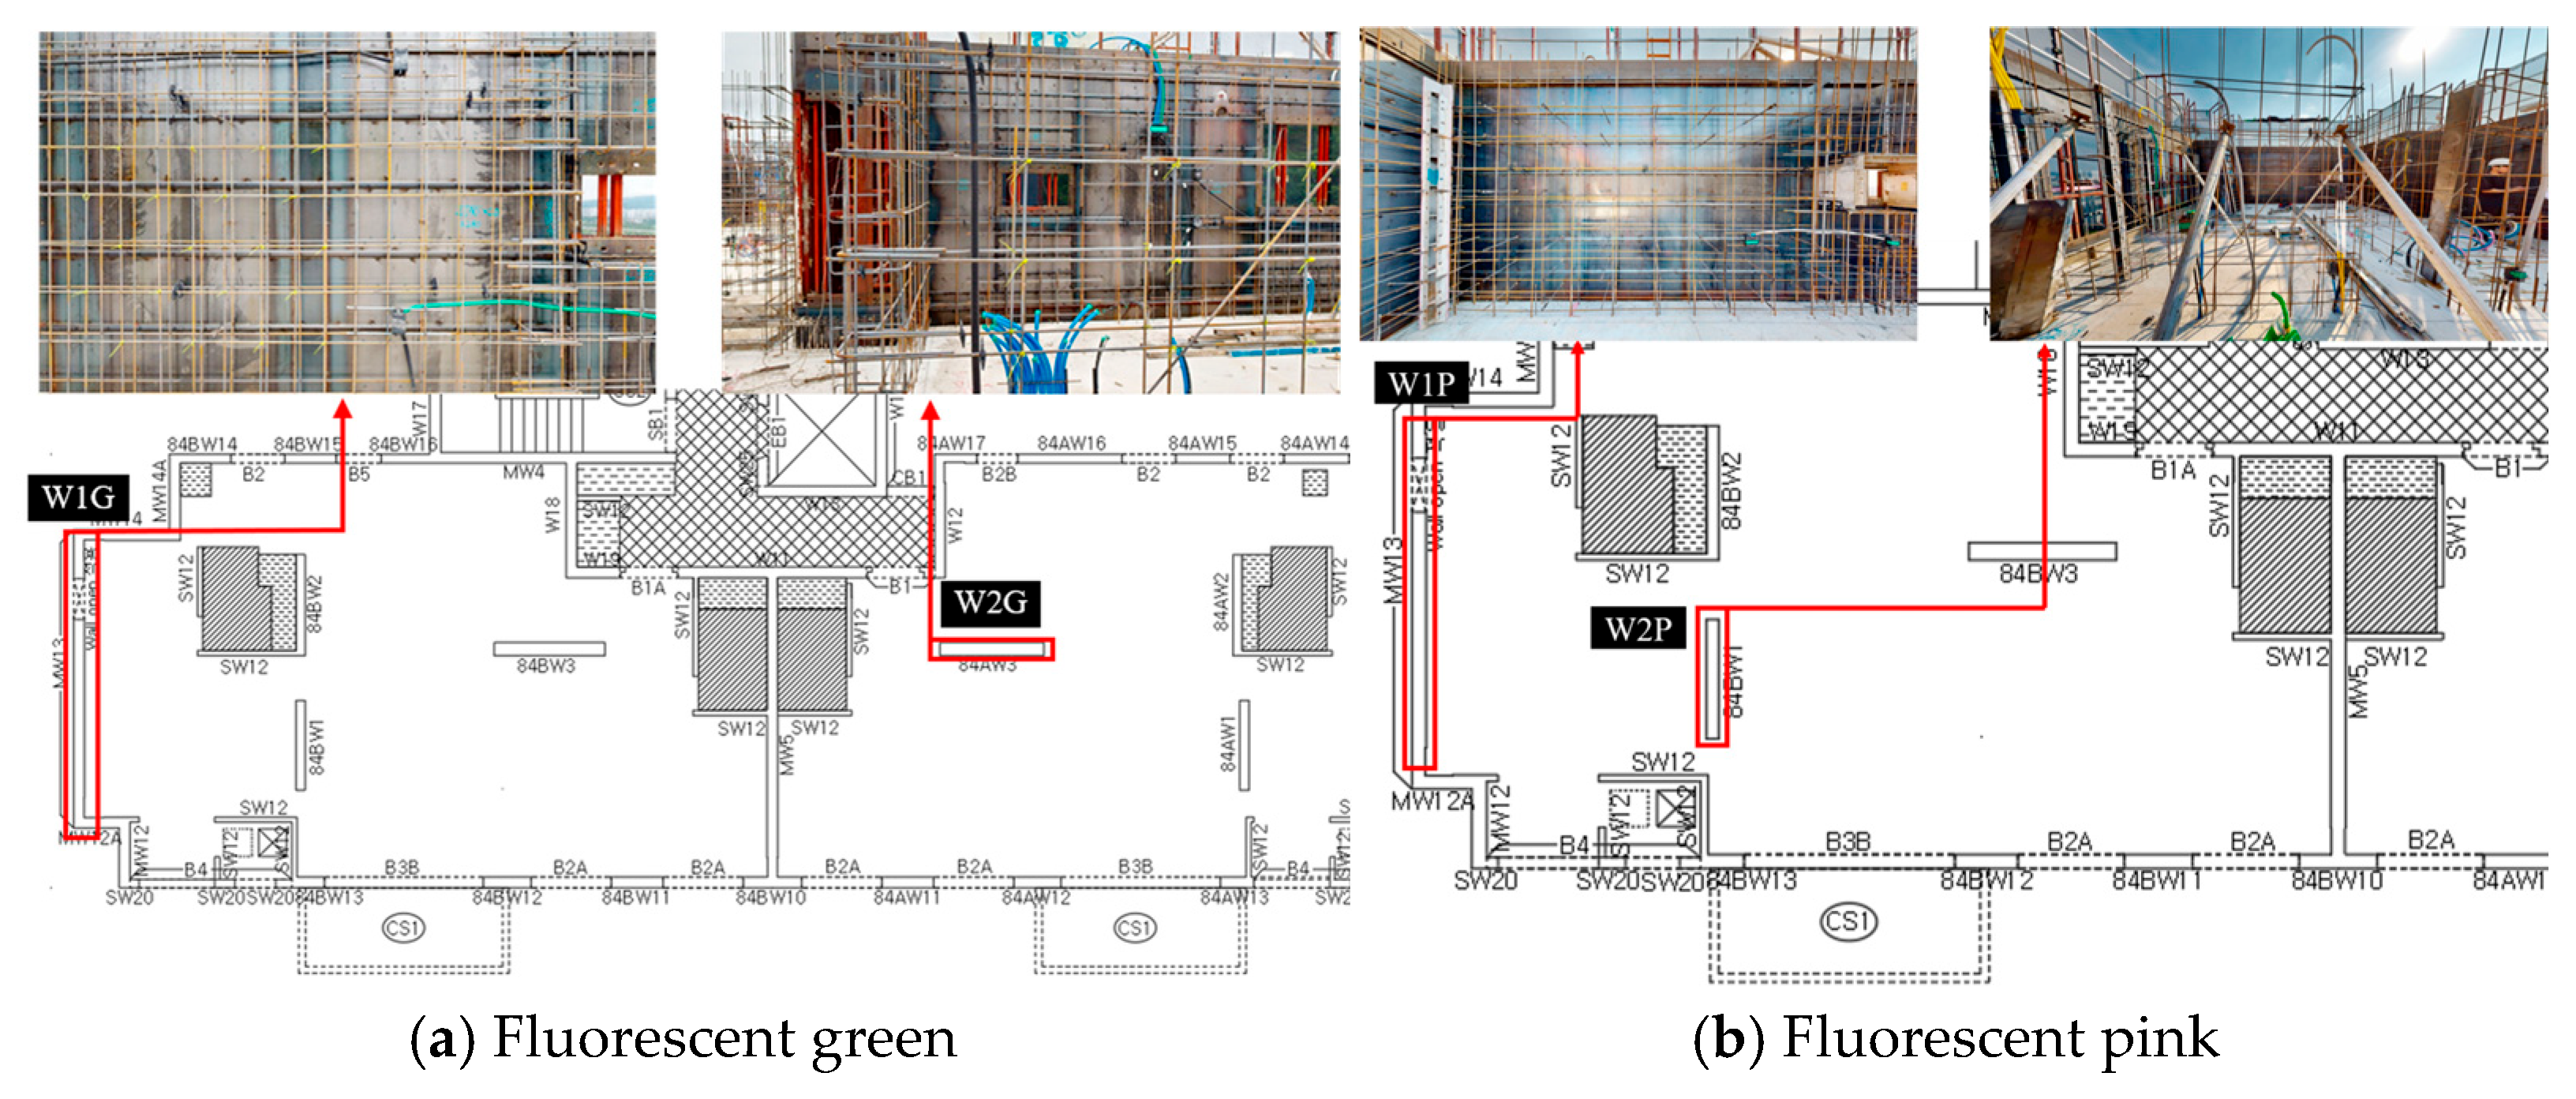
For each color, two wall elements with similar environmental conditions were selected for testing (Figure 4). In one of the wall elements (W1G), the tie wires were applied only to the front face, and a tying rate of 50% was adopted (Table 3).
Figure 4.
Wall elements according to the tie-wire color in the first experiment.
Table 3.
Rebar arrangement and tie-wire conditions of wall elements in the first experiment.
For each test area, data were collected using the 3D LiDAR camera, with the scan positions spaced approximately 2–3 m and the camera-to-wall distance maintained at approximately 1.5–2 m. The scan density, a key factor that affects point-cloud quality, was uniformly configured at a medium-quality level. Under the medium-quality setting, the scanning time was approximately 40 s per scan position, and approximately 1.5 million points were acquired, which is approximately twice the number obtained under the standard setting. Conversely, a high-quality setting requires a significantly longer scanning time of approximately 2 min per scan position and produces significantly larger data volumes, which reduces the efficiency in onsite applications. Therefore, the medium-quality setting was considered to provide a favorable balance by capturing sufficient tie-wire detail compared to that obtained using the standard setting, while offering superior data processing speed and storage efficiency compared to those of the high-quality setting. Consequently, the medium-quality scan density was deemed to enhance both data reliability and practical applicability in field conditions.
To recognize the painted tie wires in the acquired panoramic images, both the RGB and HSV color spaces were applied to each tie-wire color. The threshold ranges for each color component were defined based on the reference color values of each paint, as listed in Table 4, and the recognition performance was compared. Moreover, for each test area, two viewing angles were considered in the color recognition process: a front view with the camera approximately normal to the wall surface and a side view with an oblique incidence angle of approximately 30°. Through these experimental conditions, this study aimed to determine a stable and robust combination of tie-wire color, color space, and threshold ranges that can be reliably applied while minimizing the influence of various rebar arrangements, tying conditions, and image-viewing angles on the acquired data.
Table 4.
Threshold ranges for color recognition in RGB and HSV color spaces.
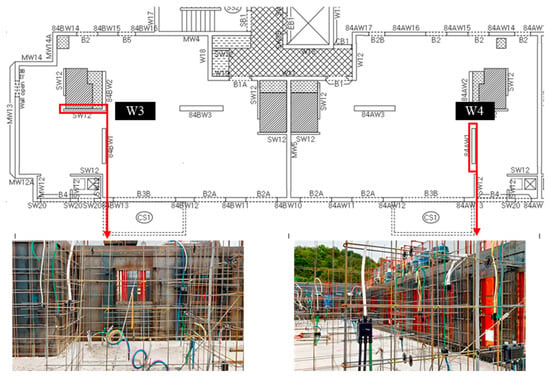
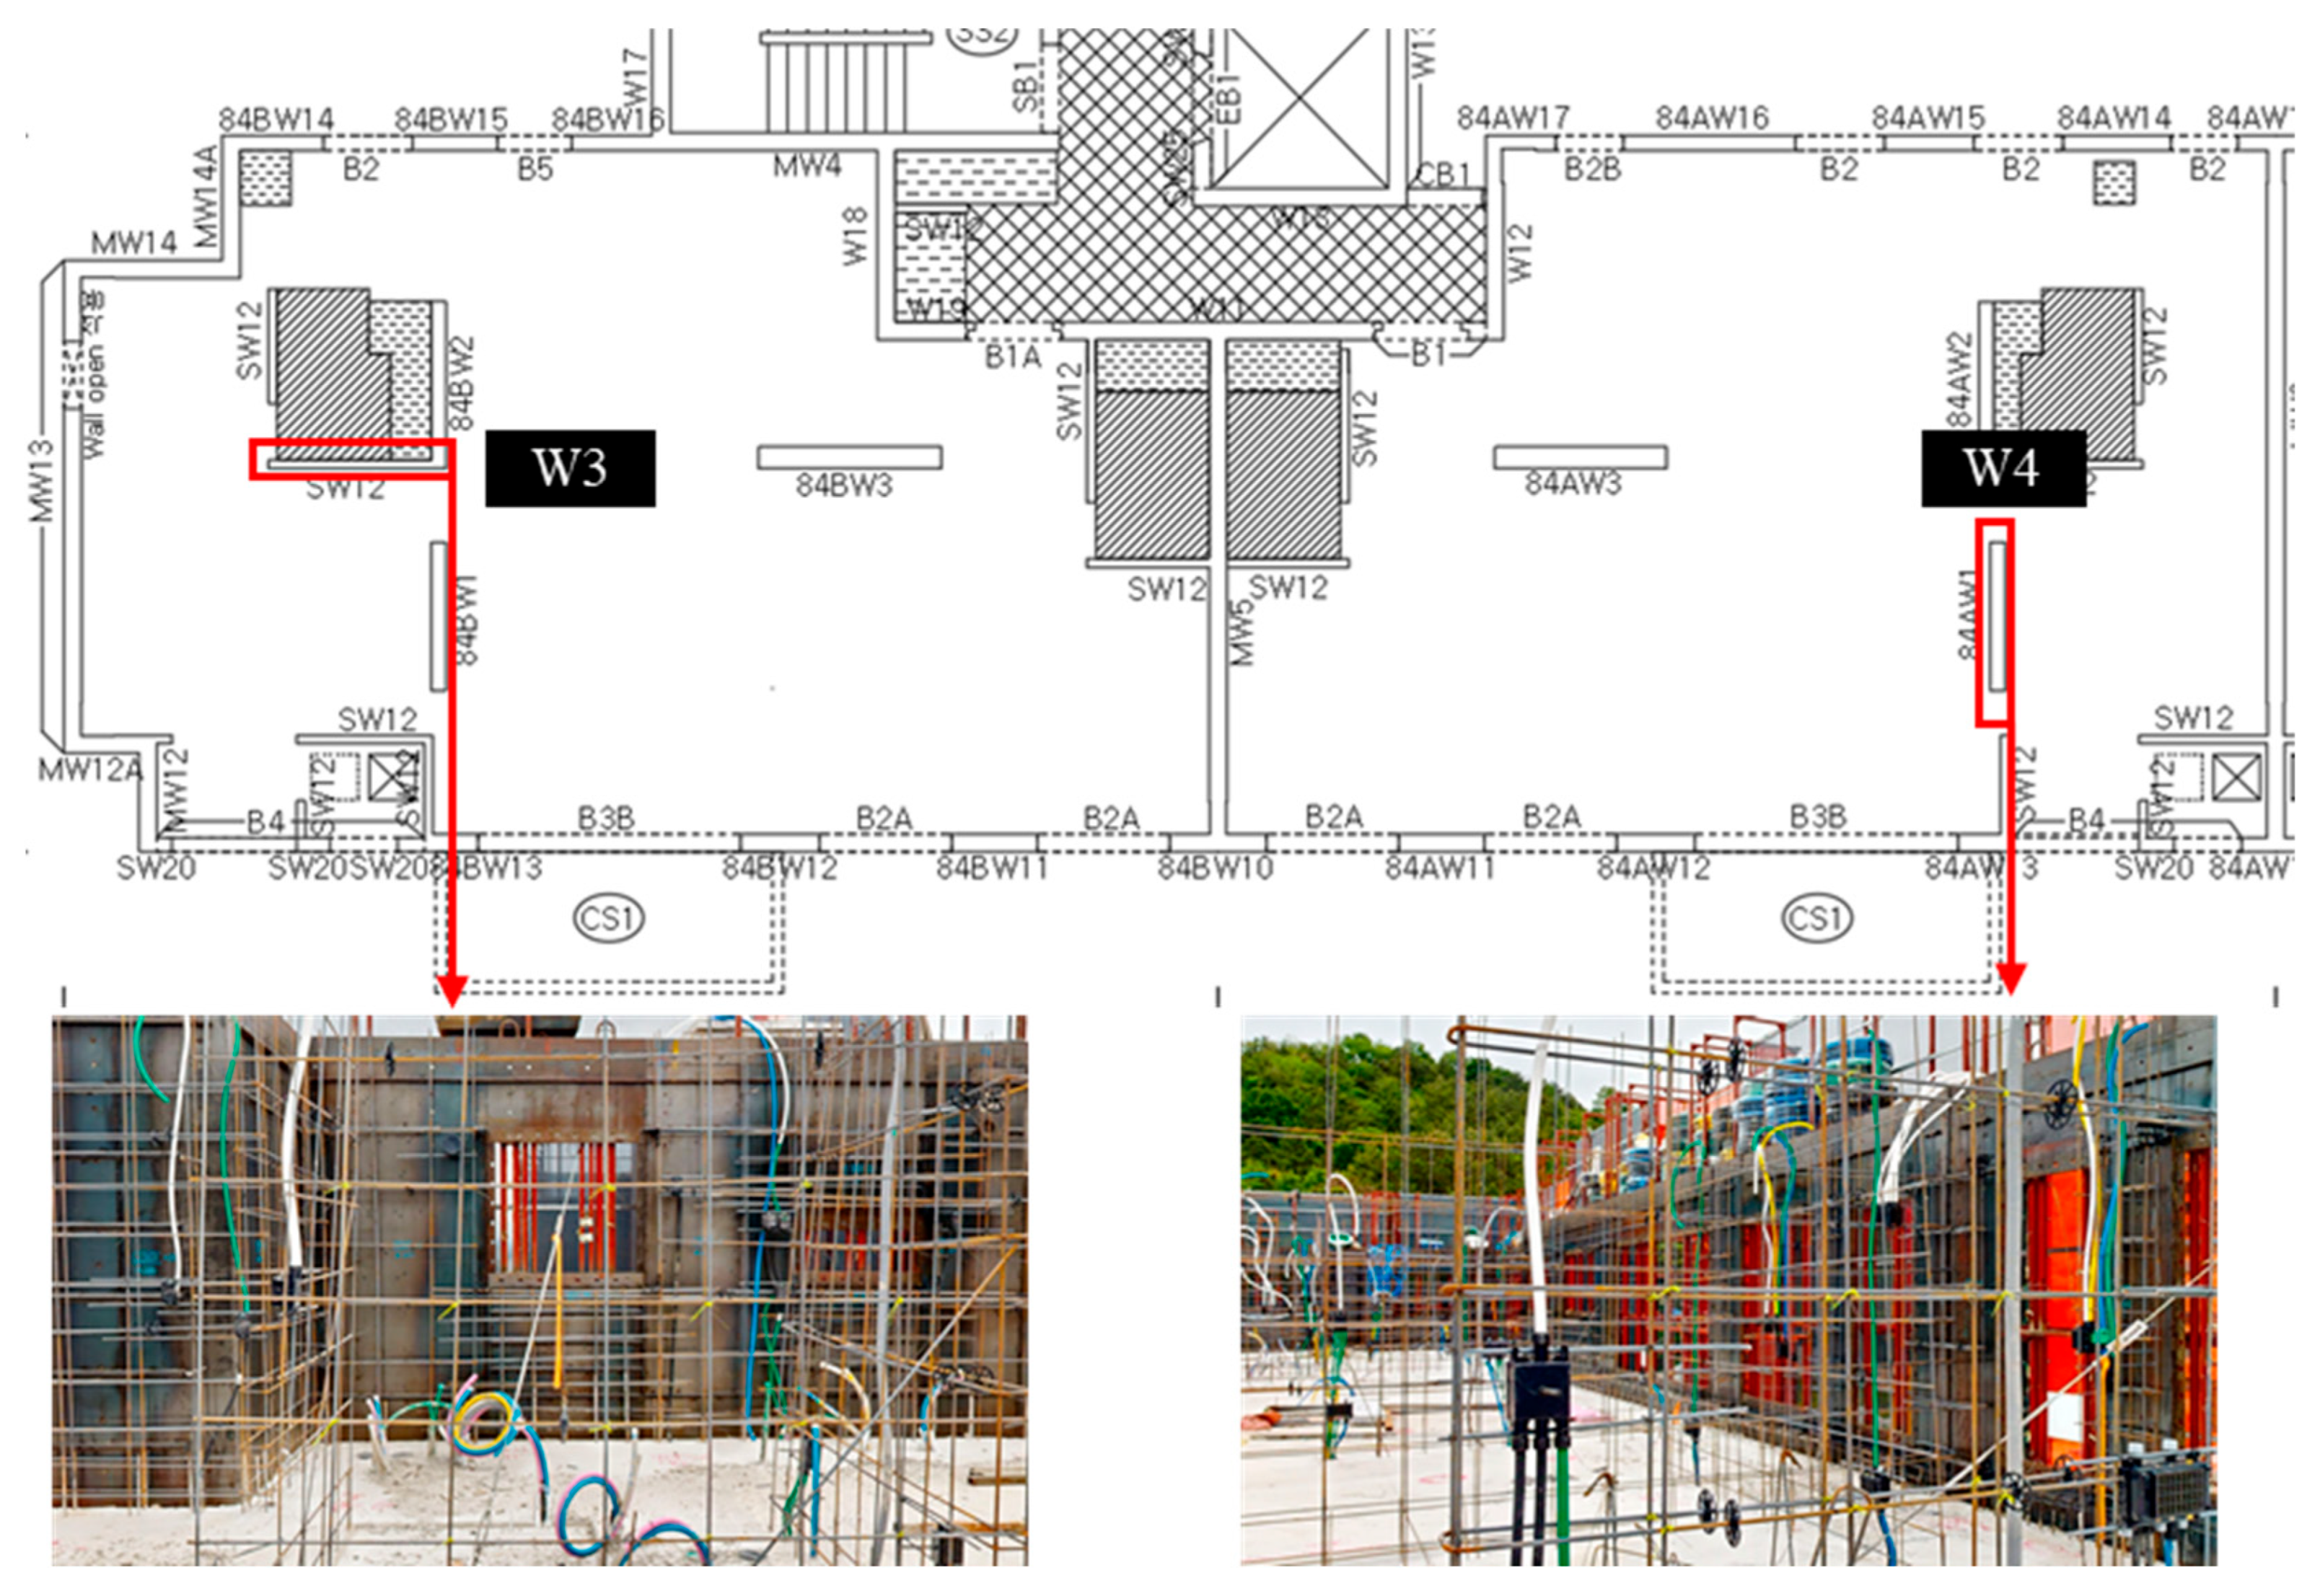
In the second experiment, two additional wall elements at the same construction site were selected (Figure 5 and Table 5), and tie wires with the colors chosen in the first experiment were used. The experiment was conducted under the same data acquisition conditions as those used in the first experiment, with scan intervals of 2–3 m and a medium-density setting. Using the acquired images, the threshold ranges of the selected color space determined in the first experiment were applied to evaluate the performance of tie-wire intersection extraction.
Figure 5.
Wall elements in the second experiment.
Table 5.
Rebar arrangement and tie-wire conditions of wall elements in the second experiment.
Subsequently, the locations of the detected tie-wire intersections and falsely detected points (noise) extracted from the images were marked on the corresponding PCD, and the performance of the rebar-spacing-detection algorithm was evaluated based on these coordinates. As mentioned previously, this study did not apply an automated algorithm for mapping image-based extracted intersection points to 3D coordinates in the point cloud. Consequently, although the locations of the points marked on the images and those displayed in the point cloud were spatially similar, they were not identical. Therefore, the evaluation of the rebar-spacing-detection algorithm in this study focused on the following aspects: (1) effectiveness of noise removal and feasibility of identifying the rebar arrangement condition, and (2) validity of the grid reconstruction method based on the extracted intersection points. The accuracy of the detected rebar-spacing values, that is, the quantitative error with respect to the actual rebar spacing, was excluded from the scope of the analysis.
5. Results and Discussion
5.1. First Experiment
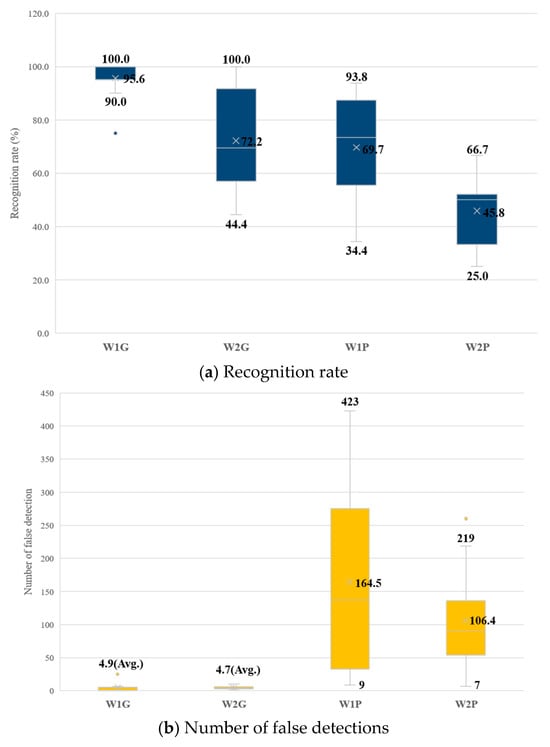
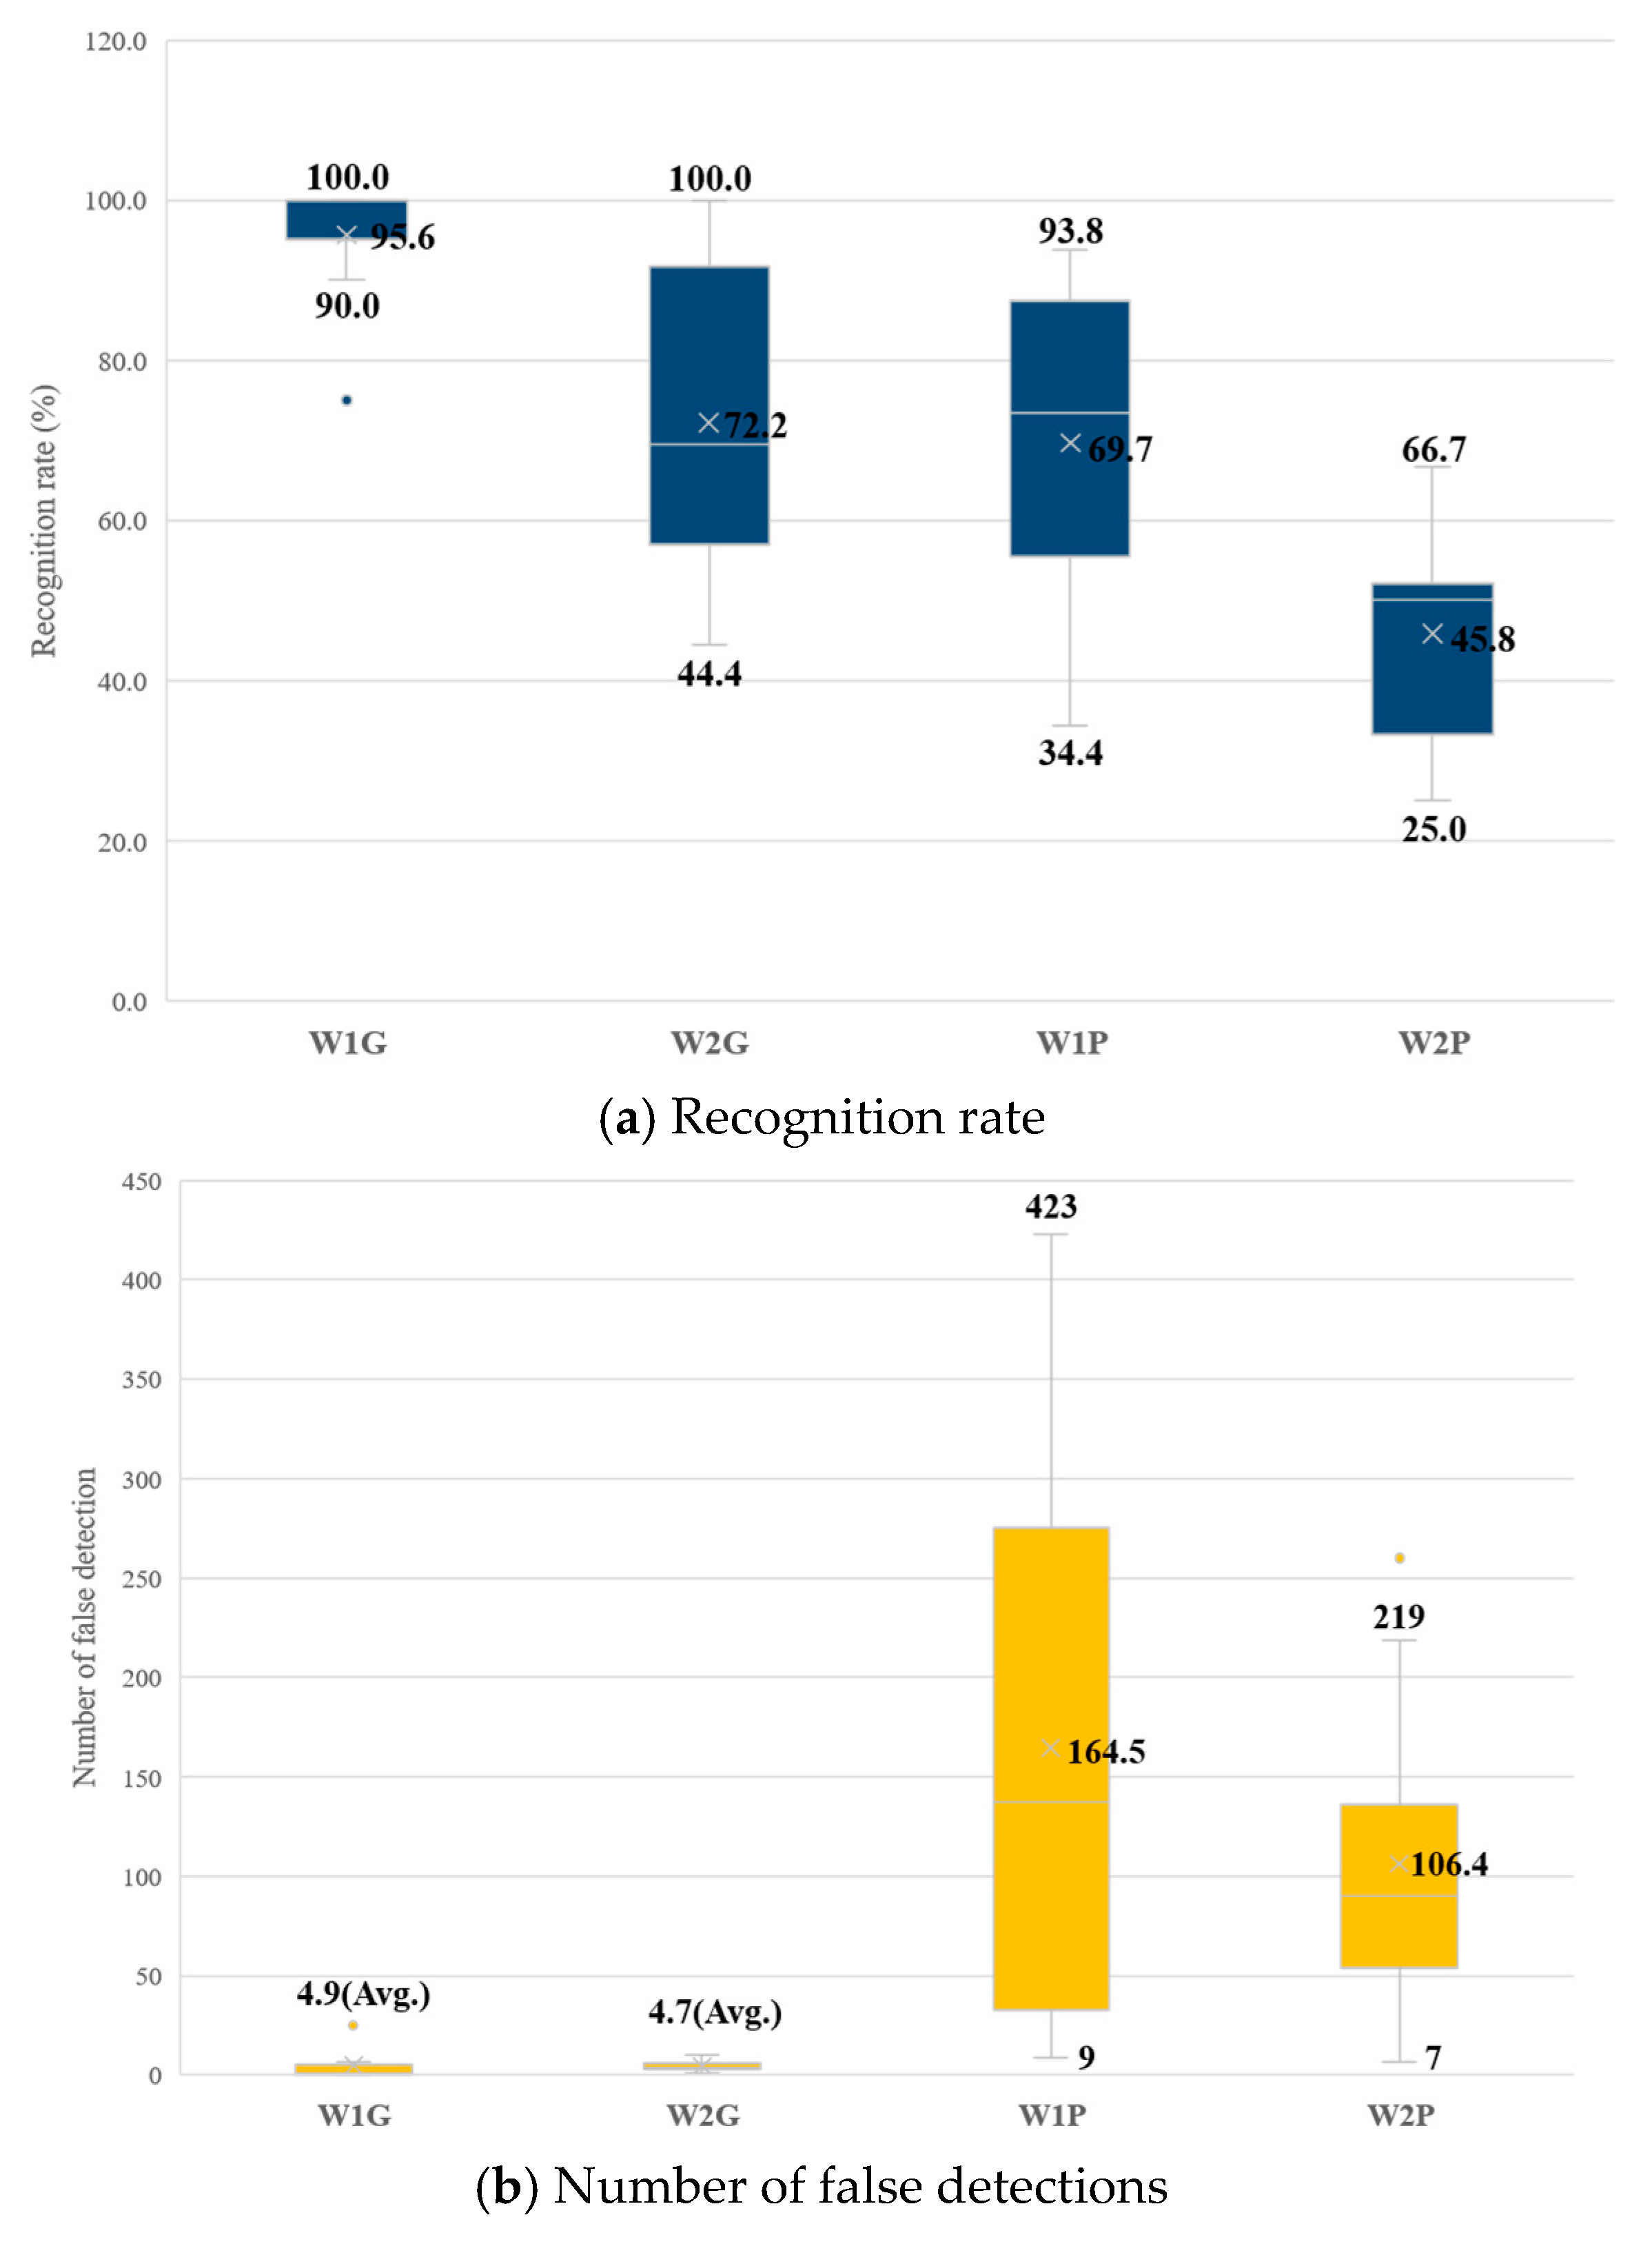
Figure 6 shows a comparison of the recognition rates and number of false detections according to the tie-wire color for each wall element. The recognition rate and the number of false detections were computed based on tie wire intersection points, which serve as the fundamental units for rebar arrangement and spacing analysis. As expressed in Equation (8), the recognition rate represents the proportion of ground-truth tie wire intersection points that were correctly detected. Multiple detected points associated with a single physical intersection were counted as one true positive after spatial clustering.
where TP is the number of correctly detected tie wire intersection points, and FN is the number of missed tie wire intersection points.
Figure 6.
Recognition rate and number of false detections according to the tie-wire color for each wall element.
False detections correspond to incorrectly detected points that do not match any ground-truth tie wire intersection point, typically caused by background objects or illumination effects. Accordingly, the number of false detections is defined as follows:
where FP denotes the number of detected points that do not correspond to any ground-truth tie wire intersection point.
The application of fluorescent green generally resulted in higher recognition rates and fewer false detections than when using fluorescent pink. In the case of W1G, although the spacing between the tie wires was similar to that of the other wall elements, a significantly higher recognition rate (average of 95.6%) was exhibited because the tied wires were all facing toward the front with a relatively simple background condition. When considering the remaining wall elements, in which both the front and back faces were tied, W1P did not exhibit a higher recognition rate than W2G, despite having background conditions similar to those of W1G. Moreover, W2P exhibited an average recognition rate of less than 50%. Statistical analysis further confirmed that the mean recognition rate for the fluorescent-green tie wires was significantly higher than that for fluorescent-pink tie wires (Table 6), where N denotes the number of independent trials, each corresponding to the recognition result obtained from a single wall-face image under a specific combination of the color space, threshold range, and viewing-angle conditions.
Table 6.
Independent t-test analysis of recognition rate differences according to the tie-wire color.
In particular, when detecting the fluorescent-green tie wires, the mean false-detection rate was consistently less than five, regardless of the wall conditions, whereas more than 100 false detections on average were observed when detecting the fluorescent-pink tie wires. This indicates that green tones are more robust to variations in illumination and background conditions, whereas pink tones are more susceptible to interference between saturation and brightness, leading to increased noise. This tendency was consistently observed in both RGB and HSV color spaces. In particular, fluorescent-pink exhibited chromatic similarity to common construction site elements such as rusted rebars, steel props, and formwork panels, which often contain reddish or magenta-like components. As a result, these background objects were more frequently misclassified as tie wires, leading to increased false detections. Therefore, the application of fluorescent green was considered more appropriate for tie-wire recognition, demonstrating superior applicability in terms of improved recognition performance and reduced noise levels.
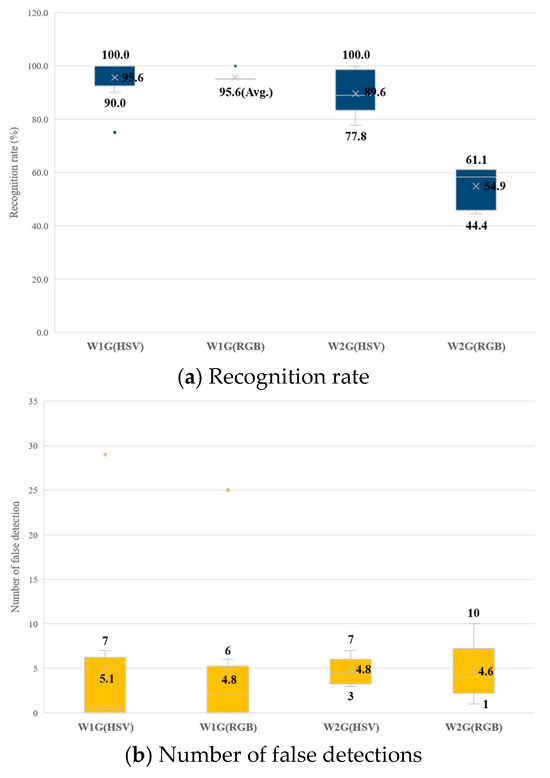
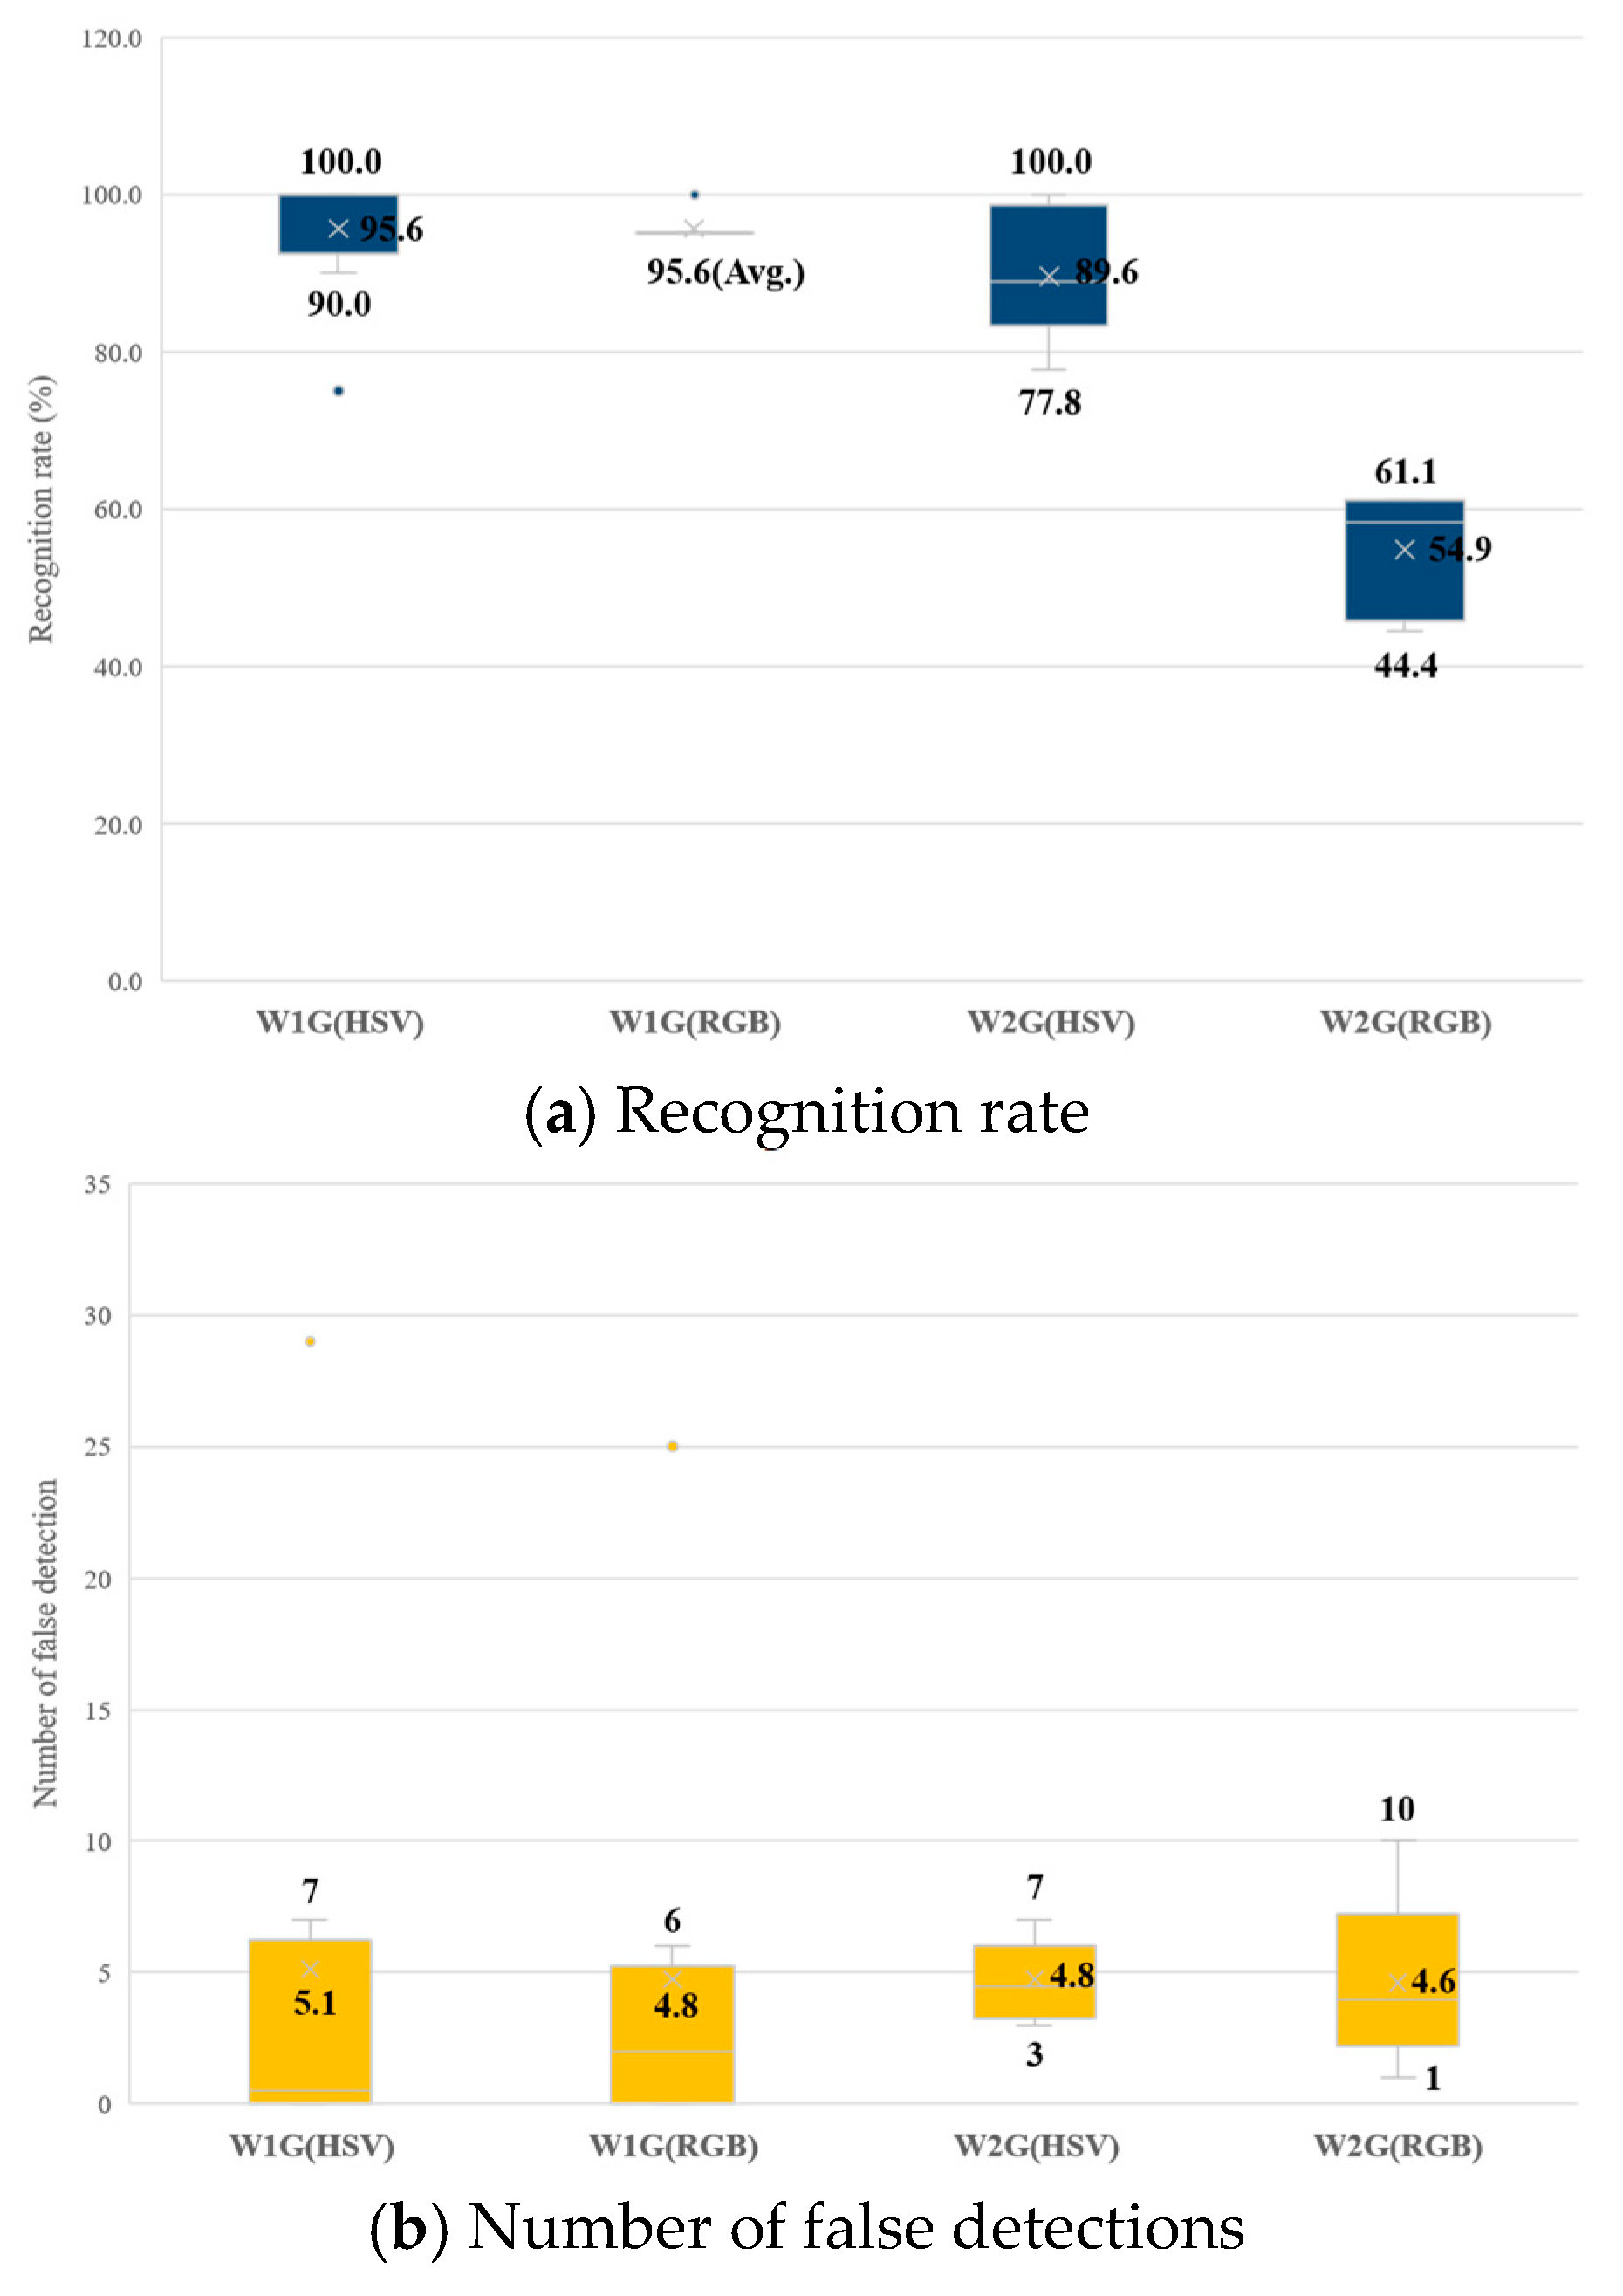
Figure 7 shows a comparison of the recognition rates and number of false detections according to the color space for the fluorescent-green tie wires. In the case of W1G, consistently high recognition rates were observed, regardless of the color space. However, for W2G, which included more complex background conditions, the recognition rate in the RGB color space decreased sharply to an average of 54.9%. On average, across the two wall elements, the recognition rate in the HSV color space was 92.6% (standard deviation = 9.1), whereas that in the RGB color space was 75.2% (standard deviation = 21.7), indicating a statistically significant difference (Table 7). In contrast, the number of false detections showed similar distributions in both the HSV and RGB color spaces and remained consistently low.
Figure 7.
Recognition rate and number of false detections according to the color space for each wall element.
Table 7.
Independent t-test analysis of recognition rate differences according to the color space.
Therefore, the application of the HSV color space is more appropriate because of its relatively high stability in terms of both recognition performance and noise occurrence. This can be attributed to the fact that, in the RGB color space, the component values of the same color can vary significantly depending on the surrounding conditions and illumination, whereas the HSV color space enables more robust color recognition and noise suppression under diverse environments by isolating the hue (H) after applying saturation (S) and value (V) constraints.
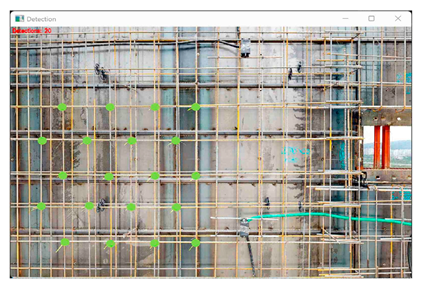
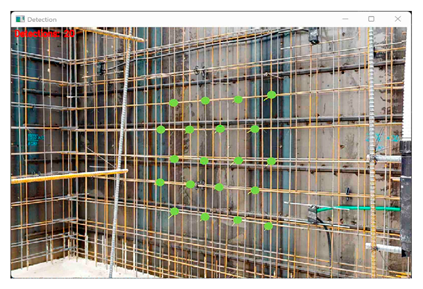
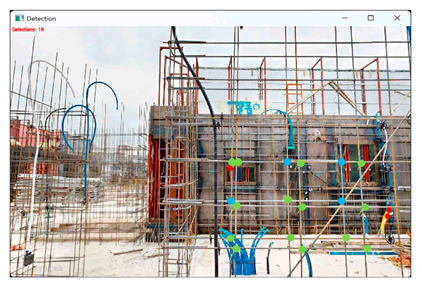
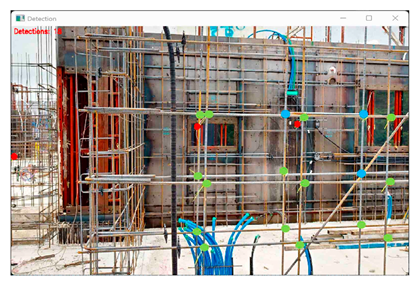
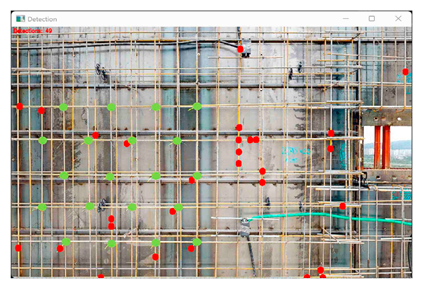
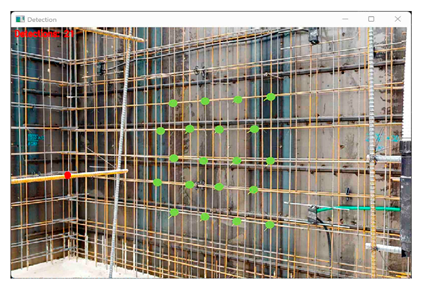
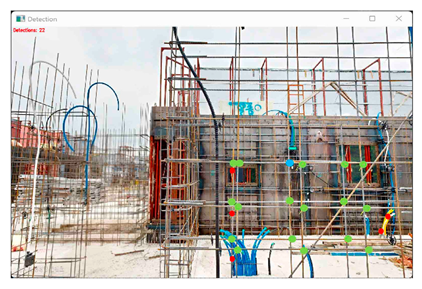
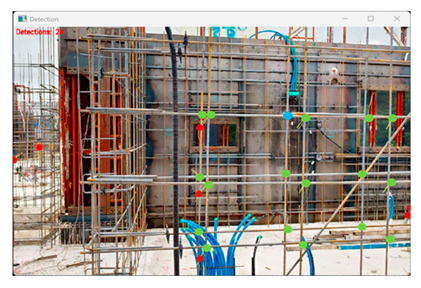
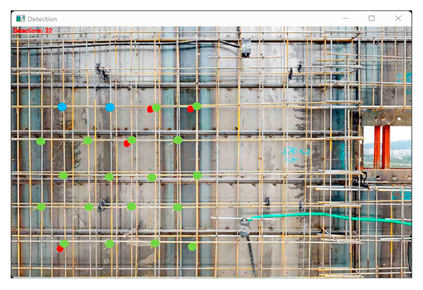
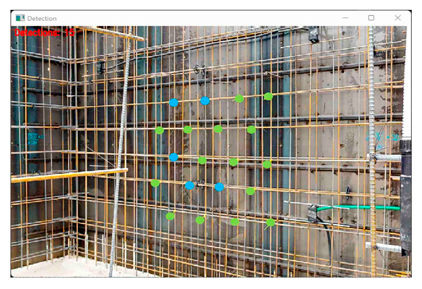
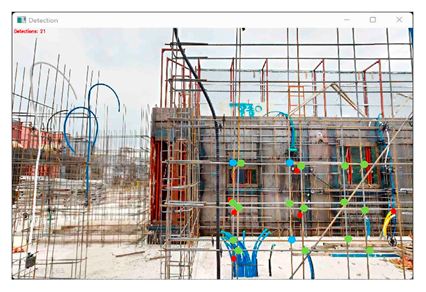
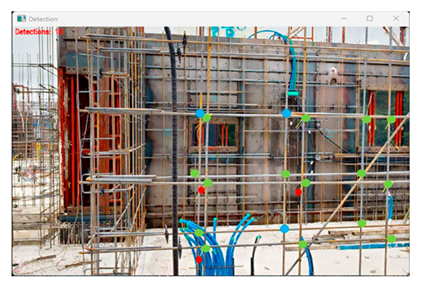
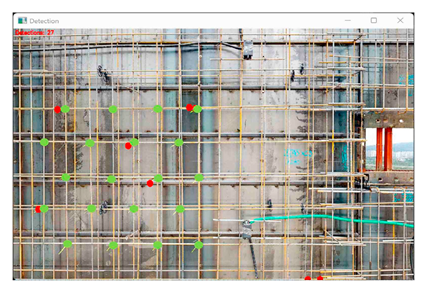
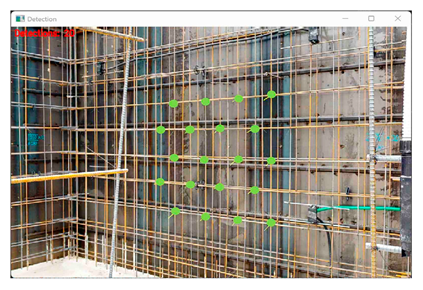
Based on the preceding results, Table 8 presents a comparison of tie-wire recognition and the occurrence of false detections according to the HSV threshold ranges and viewing angles for fluorescent-green tie wires. In the images, the color-coded markers indicate correct (green), missed (cyan), and false (red) detections.
Table 8.
Comparison of tie-wire recognition and false detections across HSV threshold ranges.
The four HSV threshold combinations used in the experiment were designed to systematically analyze the influence of each channel and were defined for the following reasons. H1-G (H: 28–30, S: 85–255, V: 180–255) was selected as the baseline threshold. Based on preliminary tests, this range captured the core H of the fluorescent-green color, while setting high lower bounds for S and V to reflect the characteristics of the fluorescent paint. This configuration was intended to suppress background noise and improve precision. H2-G (H: 25–35, S: 85–255, V: 180–255) maintained the same S and V ranges as H1-G, but expanded the H range to examine changes in false detections when adjacent reddish-brown colors were included. H3-G (H: 31–40, S: 60–255, V: 160–255) shifted the H range upward to evaluate changes in the recognition rate when the yellowish component of the tie wires was excluded, whereas it lowered the S and V thresholds to assess noise behavior when non-fluorescent colors were included. H4-G (H: 28–30, S: 60–255, V: 160–255) retained the same H range as that in H1-G, whereas it lowered only the S and V thresholds, allowing the effects of increased recognition rate and reduced precision to be independently evaluated.
For W1G, which had a relatively simple background and where tie wires were applied only on the front face, all 20 painted tie wires were successfully recognized under H1-G, H2-G, and H4-G regardless of the viewing angle. Notably, the best results were produced under H1-G, with zero false detections for both the front and side views. Conversely, H2-G, with its expanded H range, resulted in a sharp increase in false detections (29 cases) under the front-view condition, whereas H4-G, with relaxed S and V thresholds, produced seven false detections. Under H3-G, 2–5 tie wires could not be recognized. Accordingly, H1-G exhibited the best overall performance for W1G.
For W2G, tie wires were applied to both the front and back faces, resulting in missed detections of tie wires on the back side; moreover, the increased background complexity led to more noise compared to that in W1G. Superior recognition performances were exhibited under H2-G and H4-G, where 17 and 18 out of 18 tie wires were identified, respectively, regardless of the viewing angle; however, a relatively large number of false detections were also observed under these threshold combinations. Conversely, only 15 tie wires were recognized under H1-G, but the fewest false detections were generated under this combination. These results clearly demonstrate the tradeoff between recognition rate and precision, with H1-G providing the best performance in terms of stability by minimizing false detections.
These findings are consistent with the characteristics of each HSV channel. The H of fluorescent-green was concentrated in the range of 28–30. Lowering the lower bound of H below 28 (H2-G) introduced reddish-brown noise (e.g., rusted rebar), whereas increasing it above 31 (H3-G) led to increased missed detections of the tie wires. For S and V, the high lower bounds (S ≥ 85 and V ≥ 180) effectively suppressed non-fluorescent objects and dark backgrounds. Lowering these bounds in H4-G compensated for certain missed detections but increased false detections. Overall, H1-G provided the most stable and well-balanced performance by maintaining high recognition rates, while effectively suppressing false detections with minimal sensitivity to viewing-angle variations.
5.2. Second Experiment
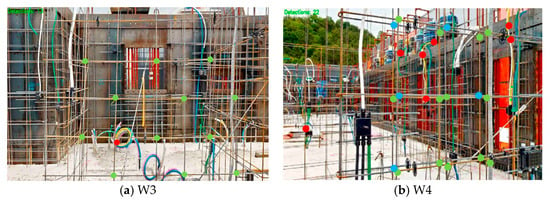
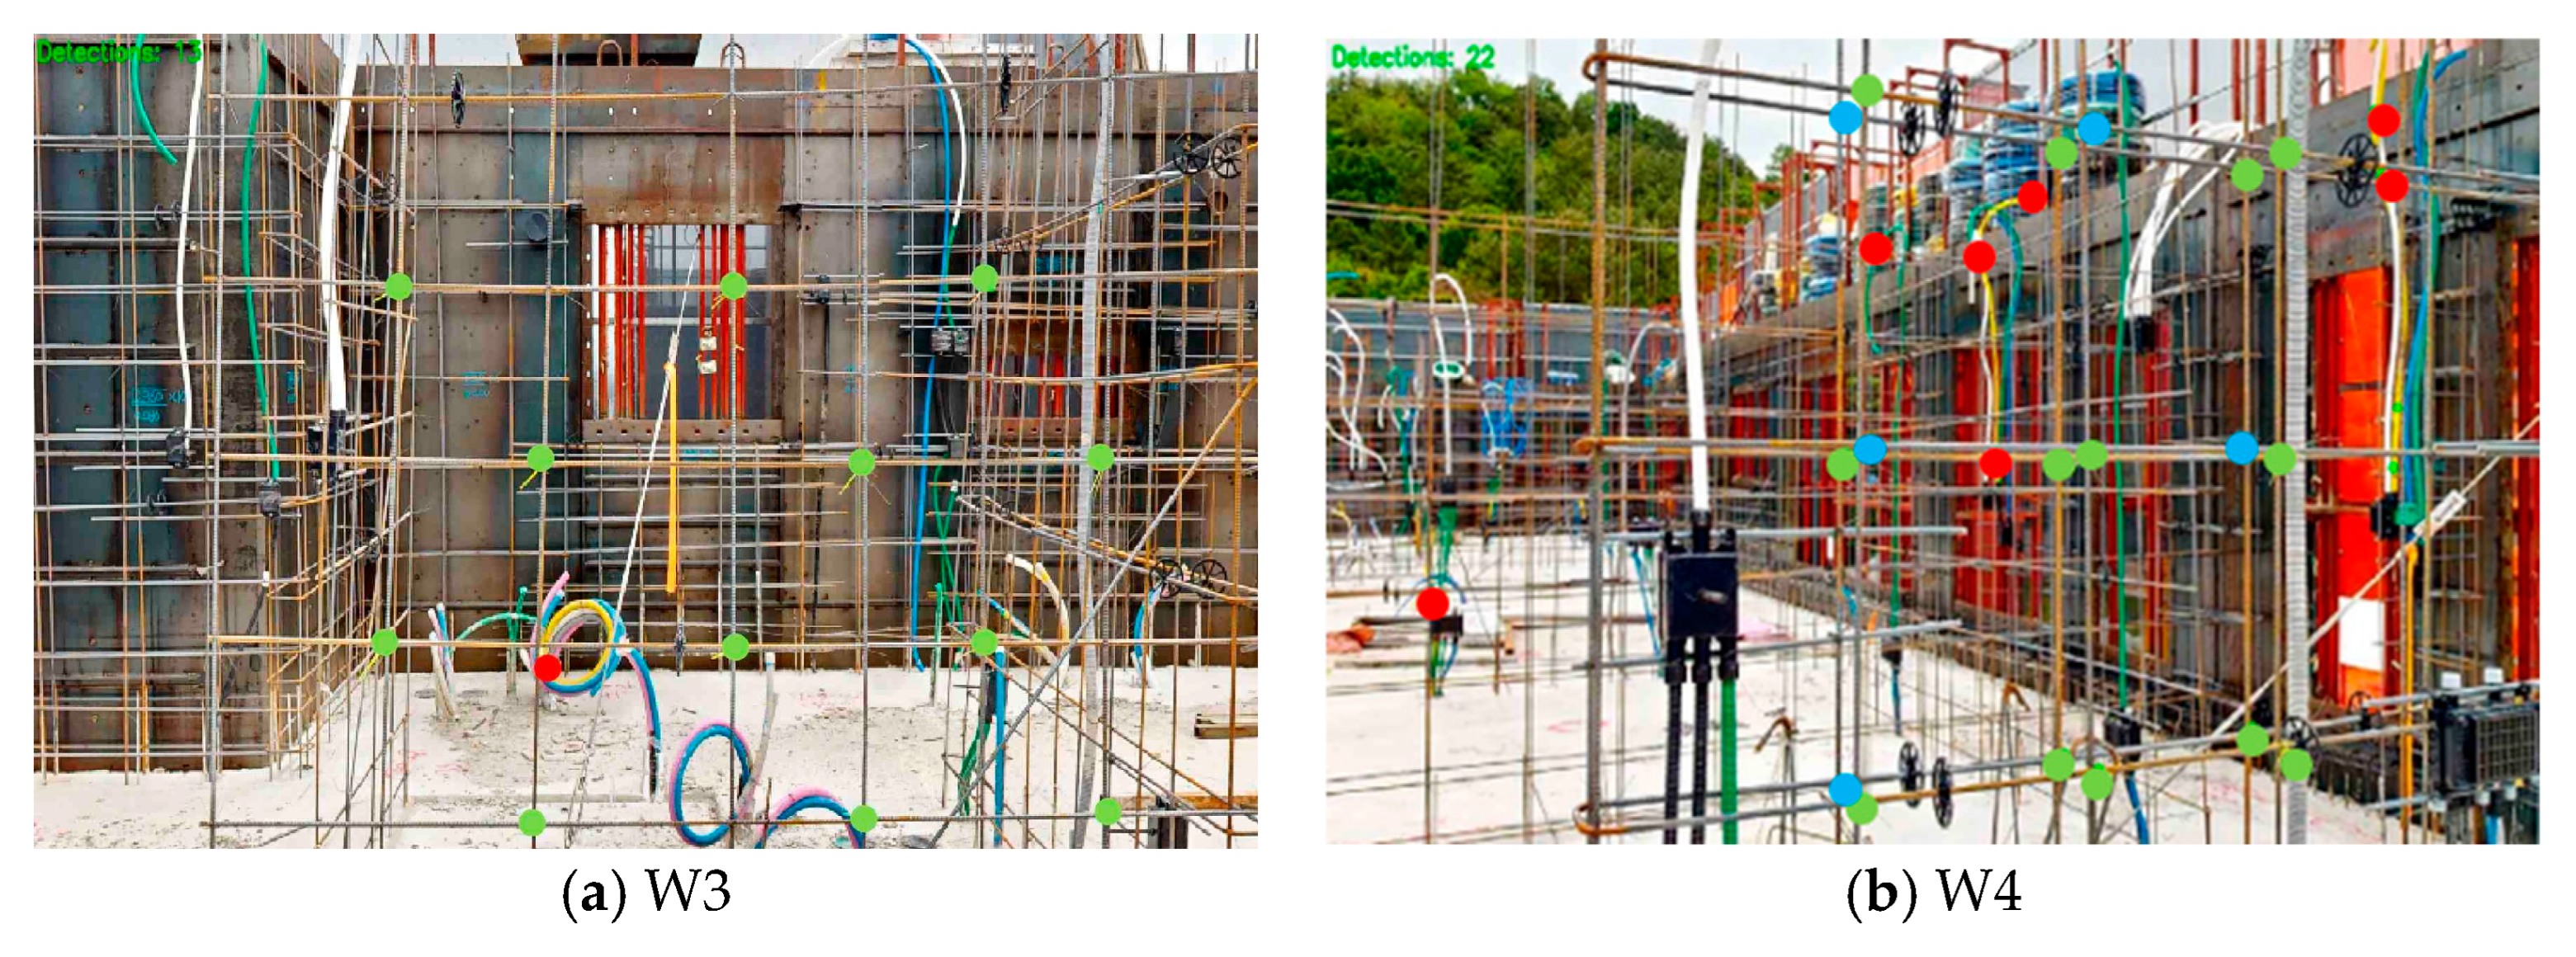
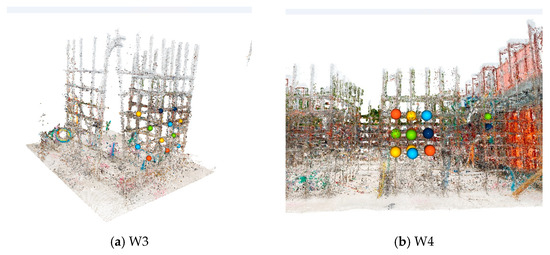
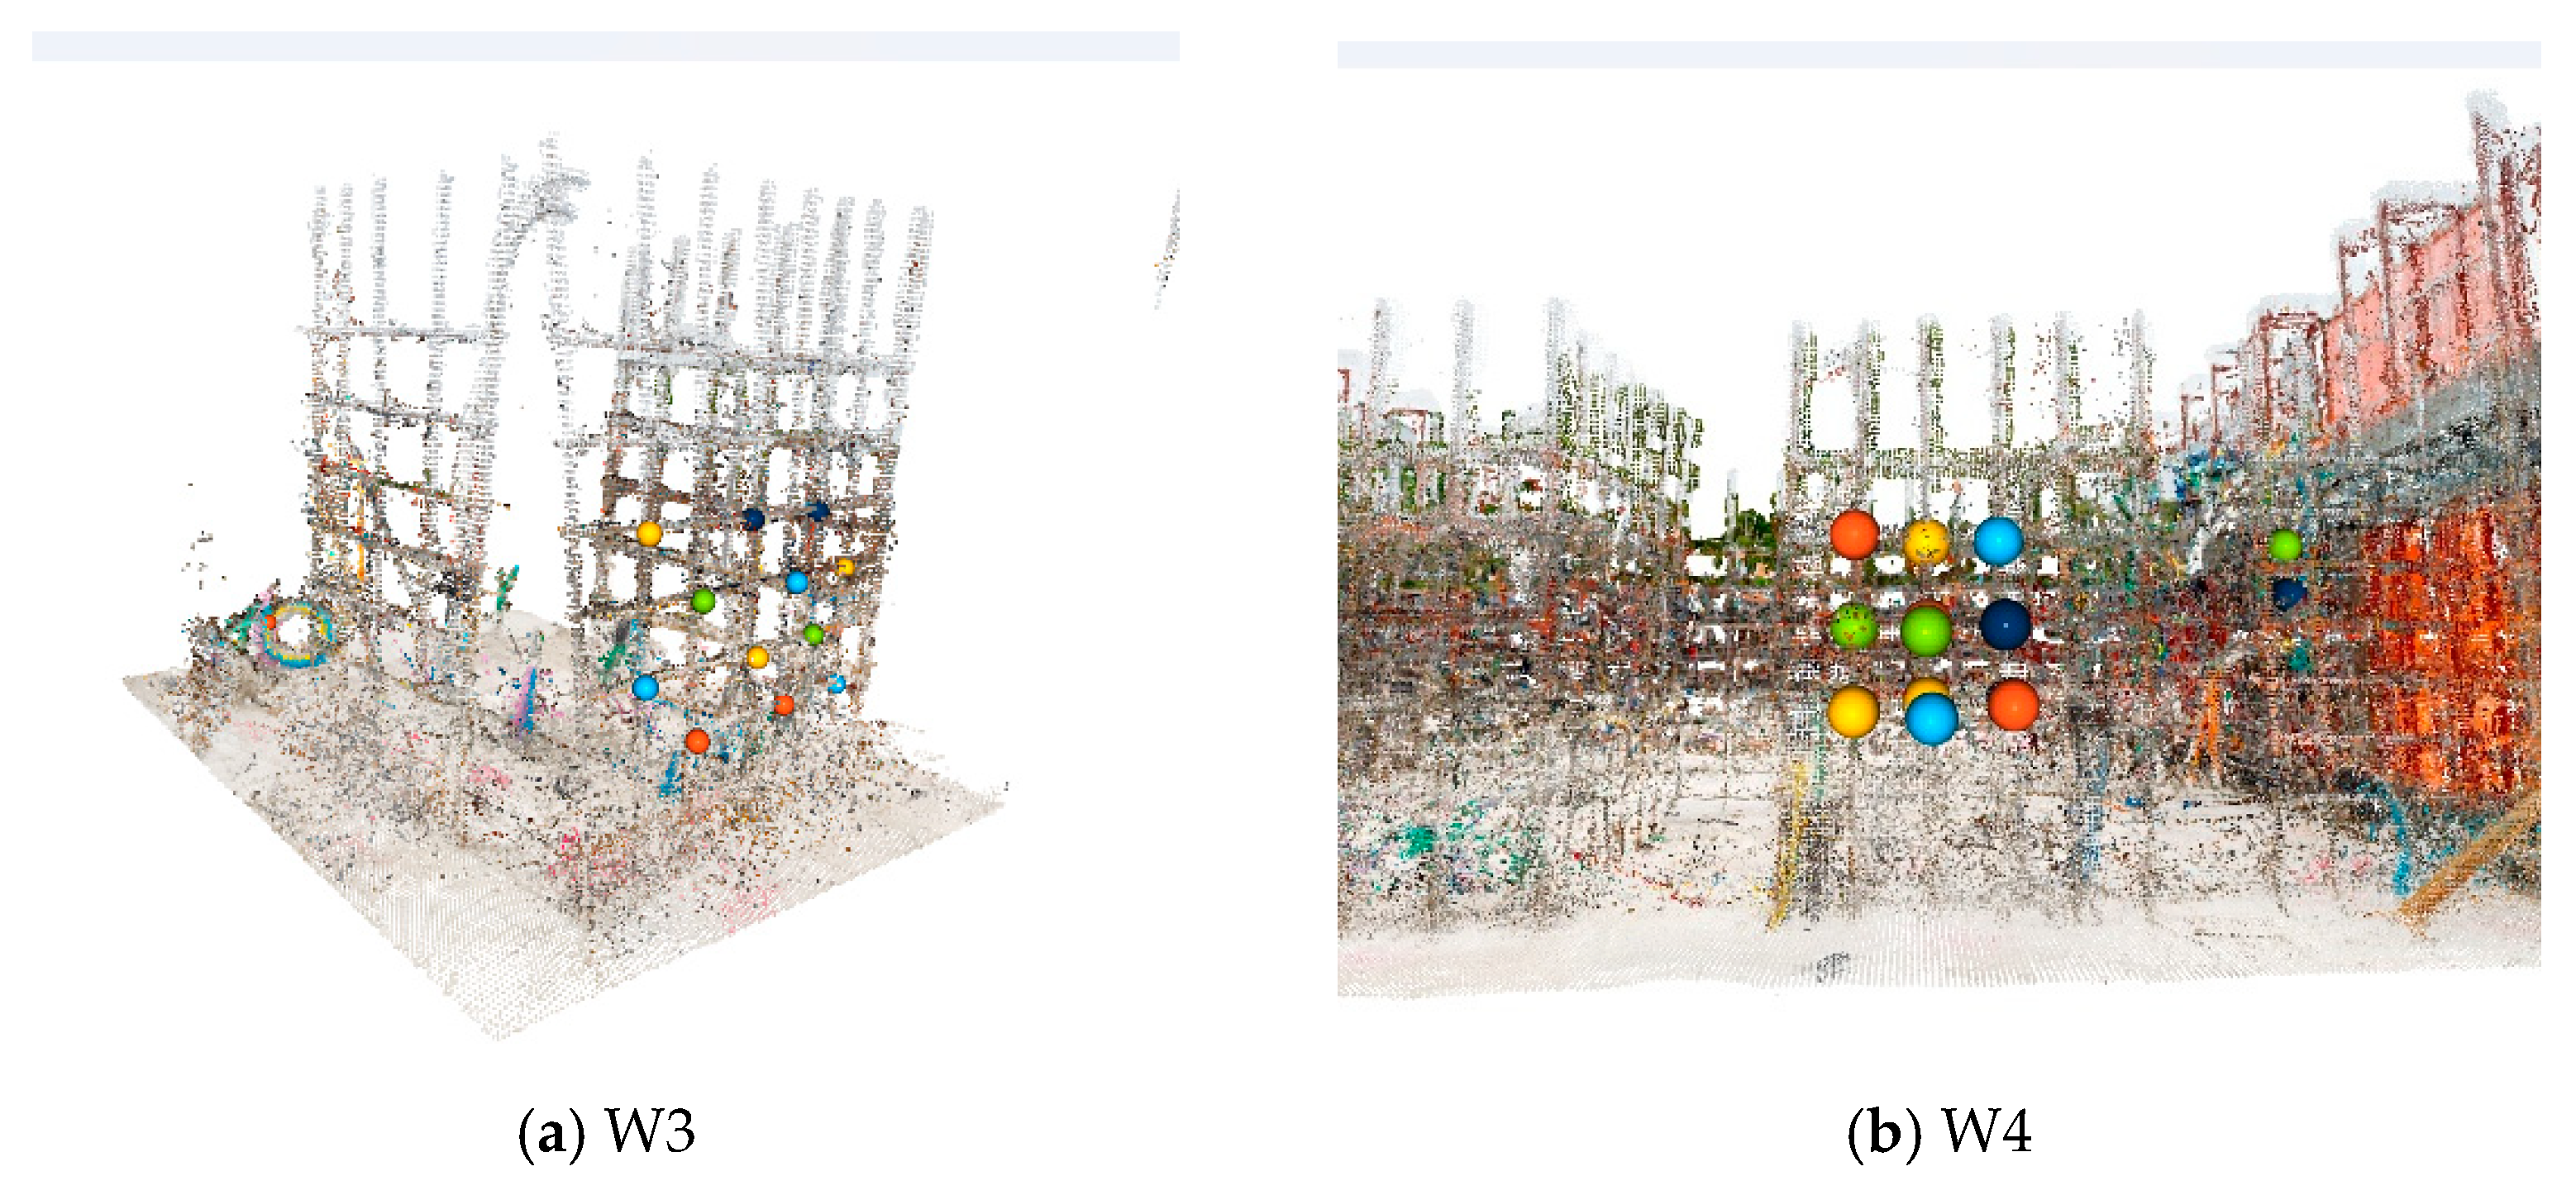
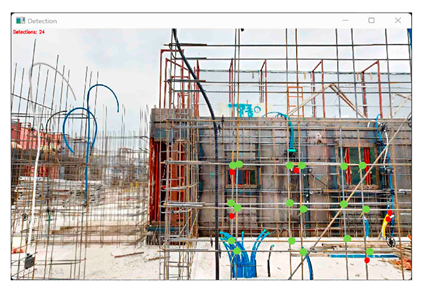
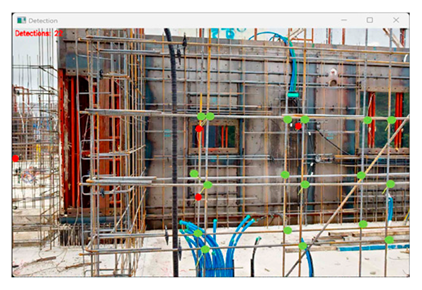
Figure 8 illustrates the recognition results obtained by applying fluorescent-green tie wires and the HSV color space with threshold ranges of H: 28–30, S: 85–255, and V: 180–255 (H1-G) to the two newly selected wall elements. As mentioned earlier, in Figure 8, the color-coded markers indicate correct (green), missed (cyan), and false (red) detections. In the case of W3, in which tie wires were applied to only 50% of the front face, a recognition rate of 100% was achieved with only one false detection. Conversely, W4, in which tie wires were fully applied to both the front and back faces under conditions similar to those of W2G, exhibited missed detections primarily on the back face, resulting in a recognition rate of 72.2%. Moreover, multiple pipelines with colors similar to those of the tie wires in the background were detected as noise, yielding nine false detections. Nevertheless, although five of the 18 tie wires (two on the front face and three on the back face) were not recognized, the detected intersection points were sufficient to infer the overall rebar arrangement condition.
Figure 8.
Tie-wire recognition and false detections under optimal color and threshold settings.
Figure 9 illustrates the tie-wire intersection points and noise detected in the previous step, which were visualized on the PCD through manual mapping. The point size shown in Figure 9 is enlarged for visual clarity; in practice, each marker represents a single point. As noted previously, the points detected in the images did not coincide precisely with those displayed in the point cloud because of the absence of an automated image-to-PCD coordinate-mapping algorithm. Accordingly, the evaluation of the proposed spacing detection algorithm was limited to verifying (1) the effectiveness of noise removal and feasibility of identifying the rebar arrangement condition and (2) the validity of the grid reconstruction method based on the detected intersection points.
Figure 9.
Visualization of tie-wire intersection points and noise in the PCD.
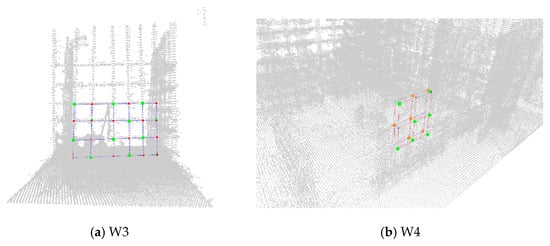
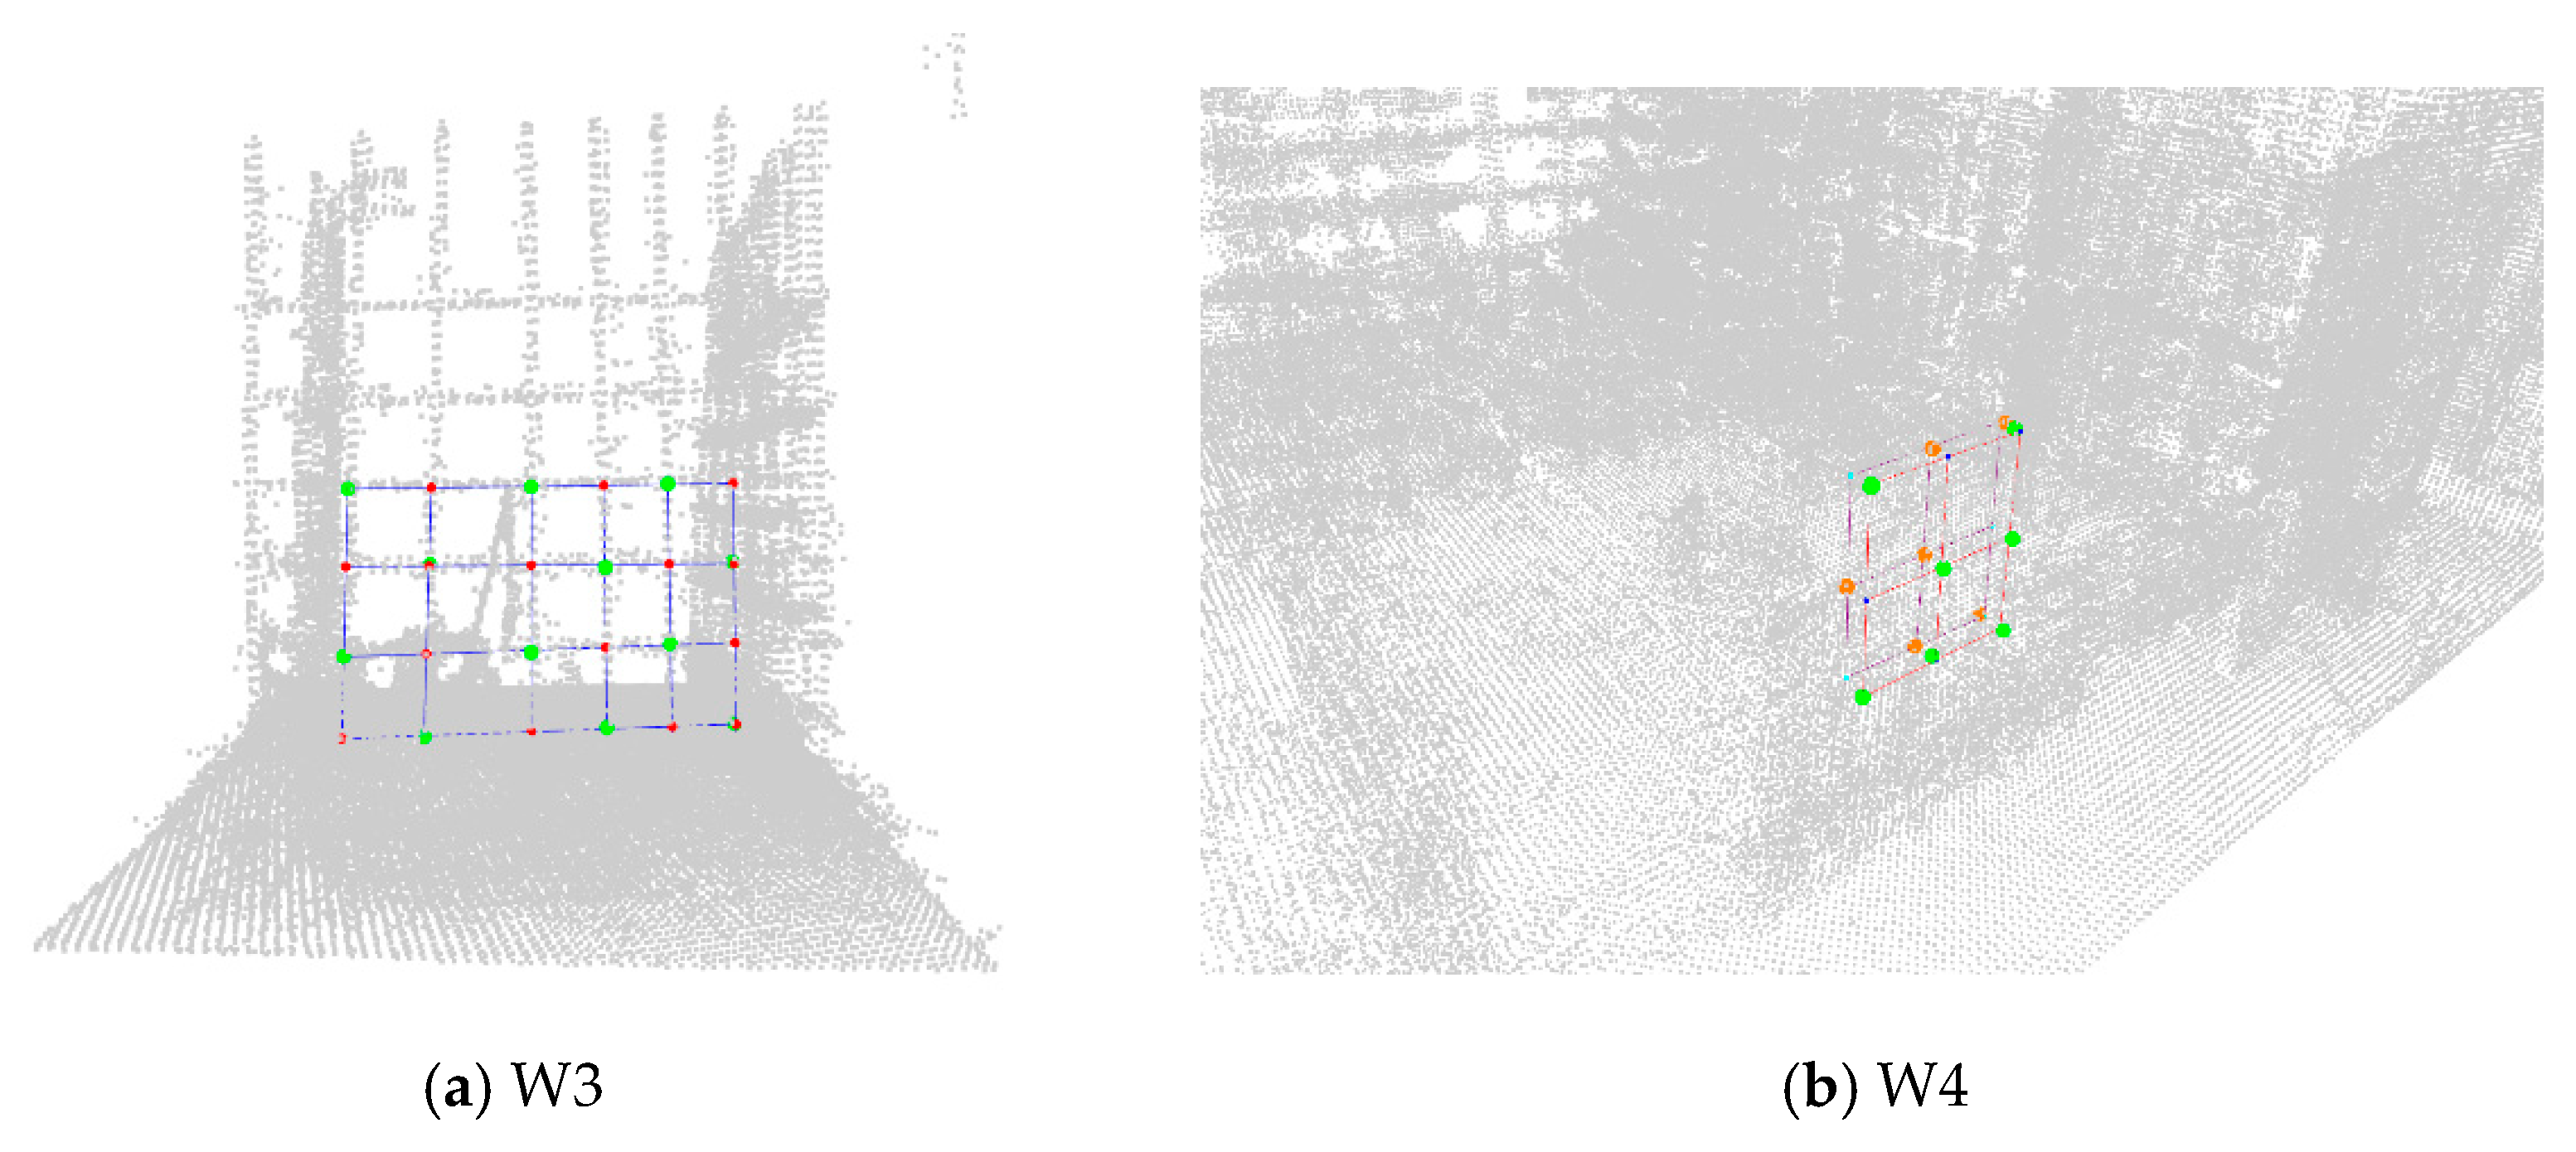
Figure 10 shows the results of the rebar grid reconstruction based on the mapped points. For both wall elements, one and nine noise points originating from pipelines located behind the target walls were detected, respectively. However, after the preprocessing stage, these noise points were successfully removed, and grid planes were generated solely based on the recognized tie-wire intersection points. In the case of W3, despite a tying rate of only 50%, the rebar arrangement comprising four horizontal rebars and six vertical rebars could be fully identified based on the 12 recognized tie-wire intersection points. Similarly, for W4, although five intersection points were not recognized, the rebar arrangement condition, consisting of three horizontal and three vertical rebars on both the front and back faces, could still be identified. These results demonstrate that the proposed algorithm effectively removes noise and reliably identifies rebar arrangement conditions.
Figure 10.
Reconstructed rebar grids based on mapped tie-wire intersection points.
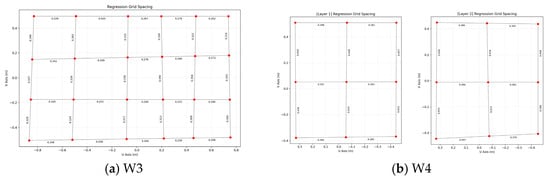
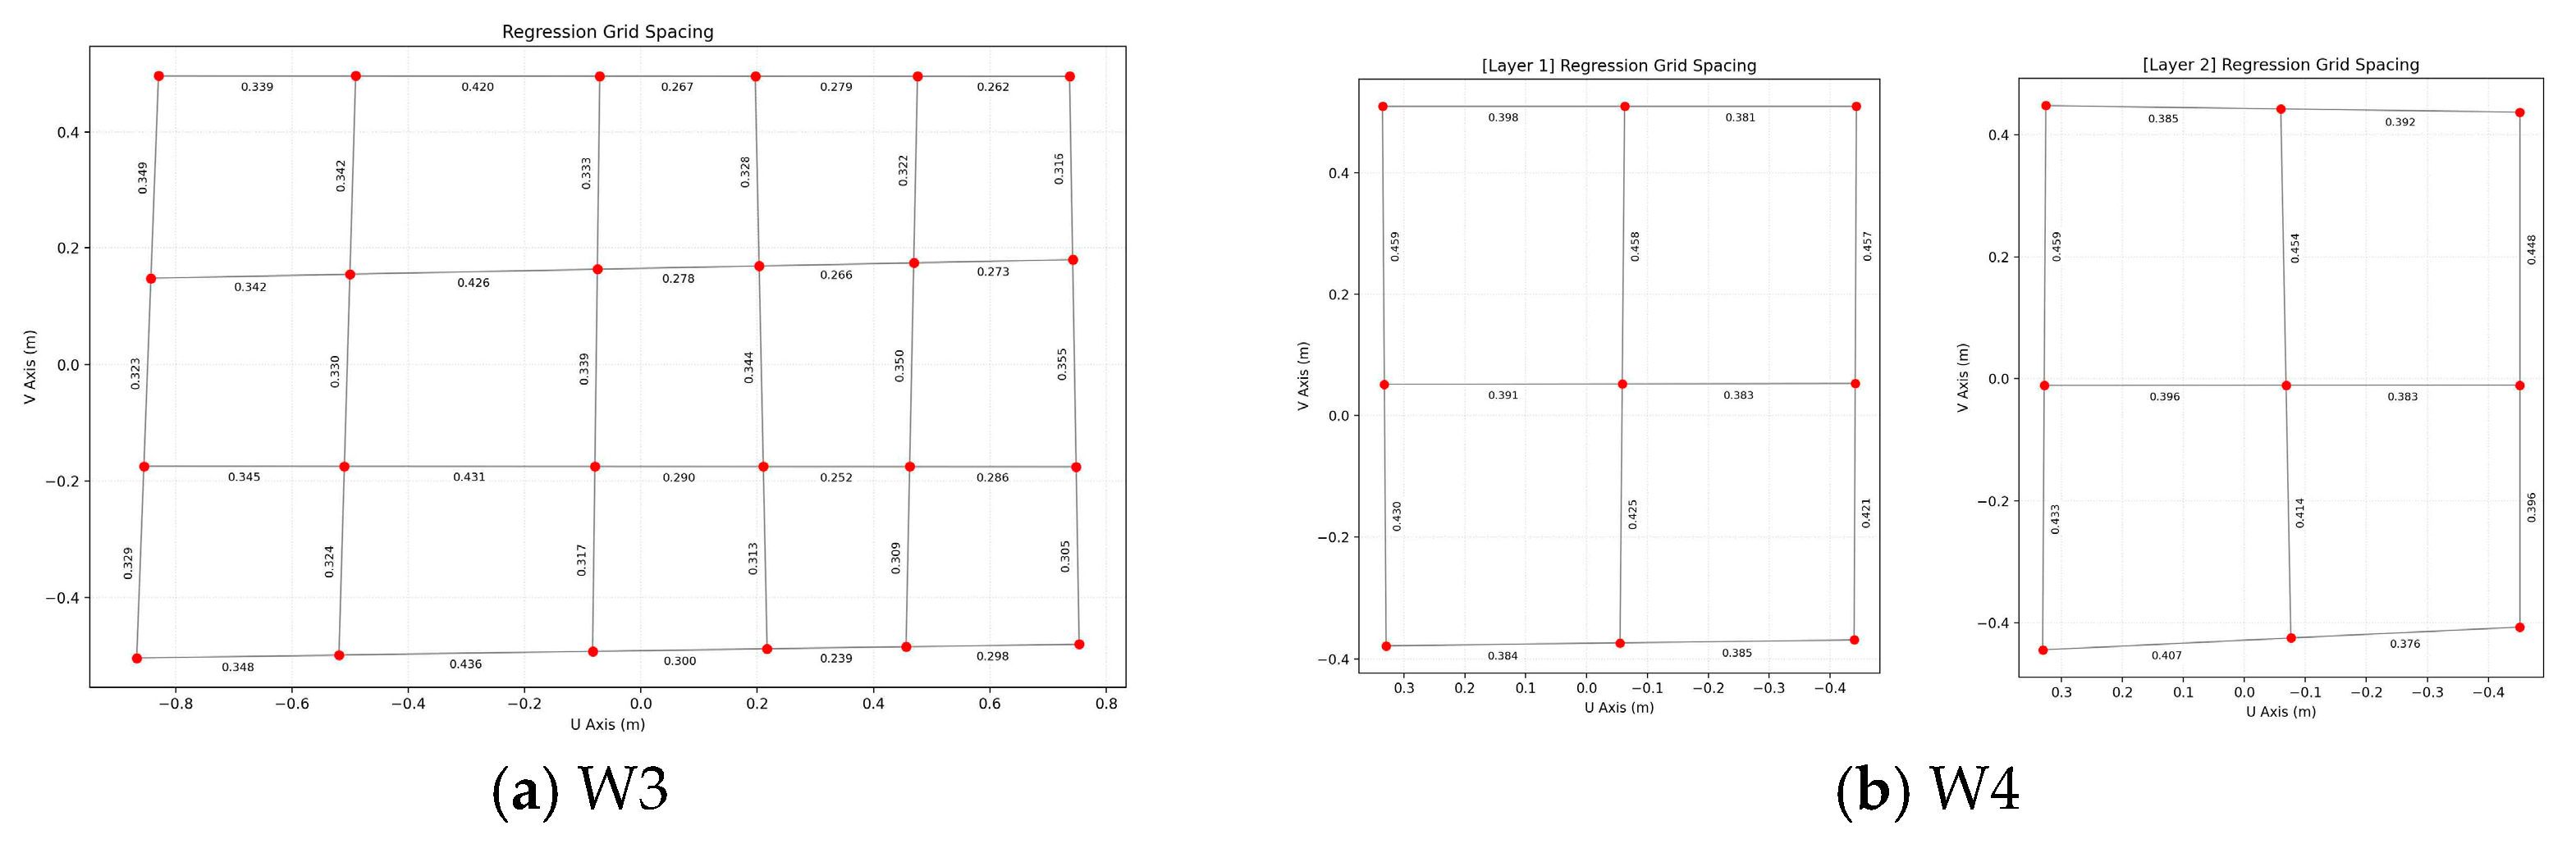
Figure 11 shows the rebar spacing calculated based on the reconstructed grids, and Table 9 lists the positional errors that occurred while reconstructing straight-line grids from the detected tie-wire intersection points. The intersection points detected along a single rebar are generally not perfectly aligned on an ideal straight line owing to construction tolerances in actual rebar placement and recognition errors during the detection process. The proposed algorithm addresses this issue by fitting a single straight line that minimizes the distance errors between the detected points and reconstructing the grid based on the fitted lines. During this process, discrepancies inevitably arise between the originally detected intersection points and their adjusted positions on the reconstructed grid. To verify the validity of the grid reconstruction method, the effect of these positional correction errors on the final spacing calculation was analyzed. The results indicated an average positional error of 3.96 mm, corresponding to an error ratio of 0.89%, with a maximum error of 28 mm (6.8%) observed at a single location. Relatively larger errors were observed for W4, which comprised fewer intersection points for grid formation and overall plane reconstruction. However, the errors predominantly remained within 10 mm, and the error magnitude is expected to be further reduced as the number of intersection points used for the estimation increases.
Figure 11.
Visualization of rebar spacing calculated from the reconstructed grid.
Table 9.
Evaluation of positional correction errors during rebar grid reconstruction.
Overall, the influence of the positional correction errors introduced during grid reconstruction on the spacing calculation was considered to be negligible. Moreover, the proposed approach, which compensated for the irregularity of individual points and enabled the inference of missing locations, was deemed to be sufficiently valid and robust.
In summary, this study offers meaningful contributions in the following aspects. First, the use of a 3D LiDAR camera demonstrated that images with sufficient resolution and PCD with appropriate density could be acquired within a short time, even under complex onsite conditions, to support reliable tie-wire color recognition and rebar-spacing calculations. Second, this study identified an optimal combination of painted tie-wire color, color space, and threshold ranges that enabled robust tie-wire recognition while minimizing noise without requiring additional learning, even under real construction site conditions. Third, the proposed approach facilitates the estimation of rebar intersection points and overall rebar arrangement conditions even when certain tie wires are not detected, and enables rebar-spacing measurement within an acceptable range of positional correction error. Therefore, by applying the proposed method, efficient data acquisition and targeted object extraction can be achieved in complex and diverse construction environments, ensuring real-time performance while providing accurate inspection results.
6. Conclusions
In RC structures, the rebar construction quality has a significant impact on the overall structural stability and durability. Recent challenges, including the shortage and aging of skilled workers, potential quality degradation associated with manual inspection, and increasing difficulties in quality management, have intensified the demand for automated inspection technologies. However, the slender geometry and complex arrangement of rebars, together with diverse site conditions, substantially increase the difficulty of data processing and analysis required for automated inspection. To address these challenges, an automated rebar spacing inspection technique was developed based on the recognition of painted tie wires, rather than the detection of the entire rebar geometry. By focusing on painted tie wires, the proposed approach improves both the efficiency and accuracy of data recognition and processing, thereby enabling its applicability in complex and diverse construction site environments.
The proposed tie-wire intersection recognition technique, which is based on recognizing the colors of painted tie wires, demonstrated the stable identification of rebar intersection points while minimizing noise under specific color and threshold conditions without requiring additional learning. Furthermore, the rebar arrangement and spacing detection method based on tie-wire intersection coordinates was shown to mitigate issues arising from noise and missing data (undetected tie-wire intersections), enabling the reliable identification of rebar arrangement conditions and reasonably accurate spacing estimation. Unlike several previous studies, this study utilized multiple datasets acquired from actual construction sites, which is expected to enhance both the practical applicability of the proposed method and reliability of the results. In addition, although painted tie wires were manually prepared for experimental purposes in this study, it is deemed feasible to produce pre-painted tie wires at the manufacturing stage for practical deployment. Preliminary assessments indicate that the additional manufacturing cost would be marginal [12], suggesting that the proposed approach is economically viable for practical adoption.
However, this study has several limitations that should be acknowledged when interpreting the results. First, the experimental validation was conducted under a limited range of illumination conditions and camera settings. Although the proposed method demonstrated stable performance under the tested site conditions, further verification under a wide range of weather-related illumination conditions and different camera configurations is required to fully assess the robustness and generalizability of the approach. Second, the experimental validation was conducted exclusively on the wall elements among RC members. Therefore, future research should extend the proposed approach to other structural components, such as slabs, columns, and beams, to further verify its applicability. Third, although tie-wire intersection points detected in images were mapped to the point cloud for evaluation purposes, a fully automated algorithm for precise 2D–3D correspondence between image-based intersection point candidates and 3D coordinates in PCD was not implemented. As a result, the accuracy of rebar spacing estimation was assessed in terms of feasibility and robustness rather than strict geometric precision. The development and integration of an automated image-to-PCD mapping algorithm will be essential for a comprehensive validation of the accuracy of rebar-spacing estimation and further improvement of the reliability of the proposed framework.
Author Contributions
Conceptualization, T.K.; methodology, T.K. and K.C.; formal analysis, T.K., K.-W.B., J.H. and K.C.; data curation, T.K., K.-W.B. and J.H.; writing—original draft preparation, T.K., K.-W.B. and J.H.; writing—review and editing, T.K. and K.C.; visualization, T.K., K.-W.B. and J.H.; supervision, K.C.; funding acquisition, T.K. All authors have read and agreed to the published version of the manuscript.
Funding
This work was supported by the National Research Foundation of Korea (NRF) grant funded by the Korea government (MSIT) (RS-2025-16071964) and Chosun University, 2019.
Data Availability Statement
The data used in this study are available from the authors and can be shared upon reasonable request.
Conflicts of Interest
The authors declare no conflicts of interest.
References
- Işık, E.; Radu, D.; Harirchian, E.; Avcil, F.; Arkan, E.; Büyüksaraç, A.; Hadzima-Nyarko, M. Failures in Reinforced-Concrete Columns and Proposals for Reinforcement Solutions: Insights from the 2023 Kahramanmaraş Earthquakes. Buildings 2025, 15, 1535. [Google Scholar] [CrossRef] [Scilit]
- Construction Accident Investigation Committee. Accident Investigation Report on Slab Collapse Accident During Apartment Construction in Seogu, Incheon-si; Ministry of Land, Infrastructure, and Transport: Sejong, Republic of Korea, 2023. [Google Scholar]
- Wang, R.; Zhang, J.; Qiu, H.; Sun, J. Intelligent inspection method for Rebar installation quality of reinforced concrete slab based on point cloud processing and semantic segmentation. Buildings 2024, 14, 3693. [Google Scholar] [CrossRef] [Scilit]
- Chi, H.-L.; Kim, M.-K.; Liu, K.-Z.; Thedja, J.P.P.; Seo, J.; Lee, D.-E. Rebar inspection integrating augmented reality and laser scanning. Autom. Constr. 2022, 136, 104183. [Google Scholar] [CrossRef] [Scilit]
- Yuan, X.; Smith, A.; Moreu, F.; Sarlo, R.; Lippitt, C.D.; Hojati, M.; Alampalli, S.; Zhang, S. Automatic evaluation of rebar spacing and quality using LiDAR data: Field application for bridge structural assessment. Autom. Constr. 2023, 146, 104708. [Google Scholar] [CrossRef] [Scilit]
- Liu, Z.; Liu, Z.; Sun, Z. Massive point cloud processing for efficient construction quality inspection and control. Sensors 2024, 24, 6806. [Google Scholar] [CrossRef] [Scilit] [PubMed]
- Wang, S.; Deng, L.; Guo, J.; Liu, M.; Cao, R. Automatic quality inspection of Rebar spacing using vision-based deep learning with RGBD camera. In Proceedings of the 41st ISARC, Lille, France, 3–5 June 2024; The International Association for Automation and Robotics in Construction: Singapore, 2024; pp. 57–64. [Google Scholar] [CrossRef] [Scilit]
- Sun, T.; Fan, Q.; Shao, Y. Deep learning-based rebar detection and instance segmentation in images. Adv. Eng. Inform. 2025, 65, 103224. [Google Scholar] [CrossRef] [Scilit]
- Kim, M.K.; Thedja, J.P.P.; Chi, H.L.; Lee, D.-E. Automated rebar diameter classification using point cloud data based machine learning. Autom. Constr. 2021, 122, 103476. [Google Scholar] [CrossRef] [Scilit]
- Kim, M.K.; Thedja, J.P.P.; Wang, Q. Automated dimensional quality assessment for formwork and rebar of reinforced concrete components using 3D point cloud data. Autom. Constr. 2020, 112, 103077. [Google Scholar] [CrossRef] [Scilit]
- Yuan, X.; Moreu, F.; Hojati, M. Cost-effective inspection of Rebar spacing and clearance using RGB-D sensors. Sustainability 2021, 13, 12509. [Google Scholar] [CrossRef] [Scilit]
- Baek, K.-O.; Hwang, J.-W.; Kim, T.; Cho, K. A Basic Study on Reinforcement Spacing Inspection Through Recognition of Tie Wire. In Proceedings of the Korea Institute of Building Construction, Gyeongju, Republic of Korea, 14–16 May 2025; Volume 25, pp. 277–278. [Google Scholar]
- Park, J.-H.; Kim, T.-H.; Choo, S.-Y. A development on deep learning-based detecting technology of Rebar placement for improving building supervision efficiency. J. Archit. Inst. Korea Plan. Des. 2020, 36, 93–103. [Google Scholar] [CrossRef]
- Li, Y.; Lu, Y.; Chen, J. A deep learning approach for real-time rebar counting on the construction site based on YOLOv3 detector. Autom. Constr. 2021, 124, 103602. [Google Scholar] [CrossRef] [Scilit]
- Kim, M.C. Development of Rebar Counting Model Using Image Obtained from Drone by Introducing Faster R-CNN. Master’s Thesis, Hanyang University, Seoul, Republic of Korea, 2022. [Google Scholar]
- Yuan, X.; Smith, A.; Sarlo, R.; Lippitt, C.D.; Moreu, F. Automatic evaluation of rebar spacing using LiDAR data. Autom. Constr. 2021, 131, 103890. [Google Scholar] [CrossRef] [Scilit]
- Lee, M.-H.; Woo, U.; Choi, H.; Kang, S.; Choi, K.-K. Development of remote measurement method for reinforcement information in construction field using 360 degrees camera. J. Korea Inst. Struct. Maint. Insp. 2022, 26, 157–166. [Google Scholar] [CrossRef]
- Duan, H.; Yu, M.; Ai, T.; Zhu, M.; Jiang, H.; Guo, S. YOLO-FAS: A lightweight model for detecting rebar intersections location and tying status. Neurocomputing 2025, 624, 129485. [Google Scholar] [CrossRef] [Scilit]
- Chang, C.C.; Huang, T.W.; Chen, Y.H.; Lin, J.J.; Chen, C.S. Autonomous dimensional inspection and issue tracking of rebar using semantically enriched 3D models. Autom. Constr. 2024, 160, 105303. [Google Scholar] [CrossRef] [Scilit]
- Hsu, H.W.; Hsieh, S.-H. Applying augmented reality technique to support on-site Rebar inspection. In Proceedings of the 36th ISARC, Banff, AB, Canada, 21–24 May 2019; The International Association for Automation and Robotics in Construction: Singapore, 2019; pp. 1312–1318. [Google Scholar] [CrossRef] [Scilit]
- Matterport. PRO3. Available online: http://www.matterport.com/pro3 (accessed on 19 December 2025).
- Li, S.; Zhang, B.; Zheng, J.; Wang, D.; Liu, Z. Development of automated 3D LiDAR system for dimensional quality inspection of prefabricated concrete elements. Sensors 2024, 24, 7486. [Google Scholar] [CrossRef] [Scilit] [PubMed]
- Hwang, J.; Baek, K.-W.; Lee, J.; Kim, T. A study on detecting Rebar spacing based on colored tie-wire recognition: Using point cloud data. In Proceedings of the KICEM National Undergraduate Academic Conference, Jeju, Republic of Korea, 20–22 November 2025; pp. 1–4. [Google Scholar]

Disclaimer/Publisher’s Note: The statements, opinions and data contained in all publications are solely those of the individual author(s) and contributor(s) and not of MDPI and/or the editor(s). MDPI and/or the editor(s) disclaim responsibility for any injury to people or property resulting from any ideas, methods, instructions or products referred to in the content. |
© 2026 by the authors. Licensee MDPI, Basel, Switzerland. This article is an open access article distributed under the terms and conditions of the Creative Commons Attribution (CC BY) license.