


Abstract
Solid-web steel-reinforced concrete (SRC) columns are widely utilised in building structures. Currently, the design of complex cross-sectional columns (CCSCs) primarily relies on finite-element models (FEM) or empirical formulas. Both routes, however, carry penalties: empirical and semi-empirical models lack accuracy and flexibility for arbitrary cross-sections, whereas finite-element simulation of such geometries demands considerable modelling effort and is inefficient. This study introduces a CCSC design framework that directly predicts the mechanical performance of columns based on cross-sections. It employs the displacement–force relationship as a constraint to inversely design cross-sectional forms that can meet specified demands. The framework learns the conditional distribution of cross-sectional forms for given mechanical properties, enabling a reversible, one-to-many geometry-to-performance mapping. Consequently, this work can simplify and accelerate the design of structural components with complex target performances. Results show that the Vision Transformer (ViT) reduces the mean squared error (MSE) by 62.72% relative to ResNet18 (mean absolute percentage error (MAPE) 12.95% versus 30.20%). In the inverse design, generated sections attain a root mean square error (RMSE) of 5.99 kN, and the diffusion exponential-integrator sampler (DEIS) reaches the target in 10 steps, about 1% of the 1000 denoising diffusion probabilistic model (DDPM) steps, while preserving accuracy.
1. Introduction
Earthquakes, as one of the most severe natural disasters, have repeatedly caused significant economic loss and human casualties throughout human history [1,2,3]. Post-disaster assessments reveal that the collapse and failure of numerous building structures are primary contributors to both the immediate and subsequent losses incurred during and after an earthquake. The seismic performance of these structures is often below the intended design objectives, compounded by a lack of adequate seismic redundancy. These factors collectively exacerbate the severity of earthquake-induced damages [4,5,6]. Under the influence of strong seismic forces, the ductility of a structure is fundamental in preventing brittle shear failure of the structure and its components. Ensuring the ductility and load-bearing capacity of columns is a prerequisite for avoiding structural collapse. As the primary elements responsible for withstanding and transferring seismic forces, columns are of paramount importance in the seismic design process [7,8,9].
Reinforced concrete (RC) columns subjected to strong ground motion exhibit a limited but recurring set of damage patterns, including flexural cracking and spalling of the cover concrete in the plastic hinge regions, inclined shear cracking in short columns, crushing of the core concrete, and buckling of the longitudinal reinforcement followed by fracture [10,11]. These patterns show that the deformation capacity of a column is governed by the combined action of flexure and shear, and that the ductility and the load-bearing capacity of the columns determine whether the surrounding structure is able to avoid collapse. Conventional RC columns, however, provide only a limited deformation capacity once the cover concrete has spalled, so that a comparatively large cross-section is required in order to satisfy a given combination of axial and seismic demands [12]. Solid-web SRC columns overcome this limitation by embedding a solid steel section in the concrete: the embedded steel and the concrete act compositely, so that the load-bearing capacity, the ductility and the energy dissipation are improved, the cross-sectional dimensions can be reduced, and the steel is protected against corrosion and fire by the surrounding concrete [12,13,14,15,16,17]. The design of such columns is nevertheless governed by fundamental requirements, including a minimum steel ratio, sufficient stirrup confinement of the core concrete, an adequate thickness of the concrete encasement and the local stability of the embedded steel section, all of which must be verified for each cross-sectional form [12]. It is this verification burden, together with the scarcity of efficient design tools, that motivates the present study.
In recent years, experimental research on SRC components has predominantly focused on their axial load capacity [18,19,20,21,22,23] and seismic performance under cyclic lateral loads [24,25,26,27,28]. Liu et al. [18] introduced an L-shaped SRC column, conducting axial compression tests to investigate the vertical failure modes of composite columns by varying parameters such as the steel area ratio, concrete material, and stirrup spacing. Meng et al. [21] conducted axial compression tests on T-shaped SRC columns. The test results indicated that the composite columns exhibit better composite action when the concrete strength is relatively low and the internal steel strength is high. Mostafa et al. [24] investigated the low-cycle cyclic performance of lightweight concrete columns with various steel shapes. The study demonstrated that SRC columns exhibit excellent seismic performance, with X-shaped steel columns showing greater ductility and load-bearing capacity compared to cross-shaped section columns.
In addition to experimental research, a recent emerging trend is the application of various machine learning methods to study the seismic performance of columns [29,30,31,32,33,34,35,36,37]. Shturmin et al. [35] employed various machine learning algorithms to predict the residual deformation of concrete-filled steel tubular columns under large deformations, then established relationships between the post-earthquake residual deformation of the columns and various design parameters. Ma et al. [33] developed machine learning models that accurately capture the shear failure mechanism of RC columns. Based on the models, an importance analysis of various features was performed to elucidate the influence of design parameters on shear capacity. Although the aforementioned studies employed data-driven approaches for analysing columns, most focused on predicting mechanical performance, typically targeting simple indicators such as load capacity or residual deformation, rather than the entire loading process. Given the complexity of the internal steel components in SRC columns, manual feature extraction is impractical, necessitating the use of deep learning models based on visual methods. Recent studies have continued this trend. Wen et al. [10] combined data-driven models to classify the failure modes and to predict the shear capacity of circular RC columns; Sun et al. [38] predicted the skeleton curves of seismically damaged RC columns from a finite-element database; Fan et al. [11] proposed an interpretable ensemble framework for the multi-index seismic assessment of columns; and Ni et al. [39] and Wu et al. [40] reproduced complete hysteresis curves using deep time-series models and physics-guided generative models, respectively.
In recent years, with the advancement of artificial intelligence (AI)-generated content (AIGC), AI has become capable of producing large volumes of content in a short period. Common generative models in AIGC include variational autoencoders (VAE) [41], generative adversarial networks (GAN) [42], and diffusion models [43,44,45]. The development of diffusion models, in particular, has led to significant breakthroughs in the inverse design of microstructures [46,47,48]. Unlike other inverse-design methods, this study targets macroscopic components such as SRC columns, with the objective of obtaining the complete displacement–force relationship rather than individual performance indicators. This research aims to address the complexities involved in both the mechanical performance validation of columns and the finite-element modelling (FEM) during the design phase, facilitating the rapid design of structural components in building construction. Generative models have subsequently been applied to structural design: diffusion models have been used to generate shear-wall layouts [49] and to solve inverse structural design problems for continuous beams [50], and conditional diffusion models have been used to obtain material distributions with prescribed nonlinear mechanical behaviour [51]. The same difficulty and the same modelling effort are encountered in the verification of the mechanical performance of CCSCs [10,38,39,40]. Accordingly, this study has three objectives: (i) to establish a dataset of CCSCs whose cross-sectional forms are arbitrary and whose mechanical responses are physically computed; (ii) to develop a deep learning model that predicts the complete hysteretic performance of a column directly from its cross-section; and (iii) to develop a generative inverse-design model that produces cross-sectional forms satisfying prescribed mechanical-performance demands. The study differs from existing work in two respects. First, the design is targeted at the complete hysteretic response over the full loading history rather than at a single mechanical indicator: the mechanical performance is predicted directly from the cross-sectional form as a complete displacement–force relationship, instead of through parameterised scalar indicators. Second, the cross-section is obtained by the end-to-end direct generation of the cross-sectional image from the prescribed performance rather than by generating the modelling parameters of a predefined geometry: the inverse problem is solved by the conditional generation of the cross-section rather than by an iterative search over a parameter space, and the sampling cost is compressed to 10 steps by the DEIS, which brings inverse design within the range of efficiency that engineering use requires.
2. Mechanical Performance Prediction and Design of CCSCs
2.1. Problem Statement
There are currently no mature and efficient methods for the design of arbitrary complex cross-sectional columns (CCSCs) in structural design practice. Due to the complexity of columns with arbitrary cross-sections, traditional methods for calculating the mechanical performance of concrete columns are often empirical or semi-empirical models, which tend to produce results with poor accuracy and flexibility. The experimental and finite-element studies reviewed in Section 1 bear this out: the response of columns is obtained from dedicated test programmes or detailed numerical models rather than from empirical formulas [10,11,38,39,40]. As a result, design and performance verification frequently rely on finite-element simulations, which face challenges such as modelling difficulty and low computational efficiency for CCSCs. Therefore, it is particularly crucial to develop rapid prediction algorithms for the mechanical performance and cross-sectional design models of such components.
2.2. Research Framework
Samples of columns with arbitrary complex cross-sections are extremely scarce. This research aims to investigate the relationship between cross-sectional forms and mechanical performance, and to develop machine learning models that predict performance from a given cross-section. Subsequently, the study seeks to develop inverse-design methods that derive cross-sections from specific performance demands. Both processes necessitate a substantial amount of machine learning training data, and the overall workflow of the study is summarised in Figure 1.
Figure 1.
The proposed workflow for mechanical property prediction and design of CCSCs.
The research methodology comprises four steps. In step 1 the MNIST-Section dataset is constructed by mapping hand-drawn digit images onto fibre sections (Figure 1a; the dataset and the numerical model are detailed in Section 2.3). In step 2 a deep learning model based on the Vision Transformer (ViT) is trained to map a given cross-section to its complete displacement–force relationship (Figure 1b). In step 3 the trained network is compared with a ResNet18 baseline and is transferred to more complex cross-sections (Section 4). In step 4 a conditional denoising diffusion probabilistic model (DDPM), guided by a mechanical-performance feature matrix, is trained to generate cross-sectional forms that satisfy a prescribed mechanical-performance target, and efficient samplers are evaluated in order to reduce the number of sampling steps (Figure 1c).
2.3. Materials and Methods
The member considered in this study is a solid-web steel-reinforced concrete (SRC) column, in which a solid-web steel section is embedded at the centre of a reinforced concrete cross-section. The cross-section is 400 mm × 400 mm and the height is 750 mm; the concrete is grade C30, with a compressive strength of 29.39 MPa and a tensile strength of 2.8 MPa; the steel, comprising both the embedded section and the longitudinal reinforcement, has a yield strength of 235 MPa; and the axial load ratio is 0.3. These values correspond to the material grades and load levels commonly adopted for solid-web SRC columns in engineering practice and are consistent with the Chinese code for the design of concrete structures (GB 50010) [52]. The construction detail of the cross-section is shown in Figure 2a. All the results reported in this study are obtained by numerical simulation. The numerical model is first validated against a published cyclic loading test on a reinforced concrete column [53] and is then applied to the cross-sectional forms considered here: the geometry of the reference member described above is taken from the construction drawings, while the sections of the dataset are generated by the mapping procedure described in the following paragraph.
Figure 2.
The solid-web SRC column: (a) cross-section detail; (b–e) mapping of the digits 0, 1, 4 and 7 onto the fibre cross-section (red: steel fibres; grey: concrete fibres).
The initial data of the study are provided by the MNIST-Section dataset. Handwritten digits from the Modified National Institute of Standards and Technology (MNIST) database, which contains digits written by 250 different individuals (60,000 training and 10,000 test samples), were first binarised and then expanded to 40 × 40 pixels, and each pixel was mapped onto a 10 mm × 10 mm fibre of the 400 mm × 400 mm beam-column cross-section, so that the strokes of the digit represent the embedded steel and the remaining area represents the concrete. In this way 70,000 CCSC models were generated and analysed in OpenSeesPy 3.8.0 under low-cycle reversed loading. Schematic examples of this mapping are given in Figure 2b–e. The dataset was selected because the strokes of handwritten digits produce cross-sectional forms whose steel distribution is arbitrary, non-repetitive and yet mechanically meaningful, and because sections of this kind are almost absent from existing experimental databases of SRC columns.
The extent to which the MNIST-Section dataset represents the behaviour of real SRC columns is worth clarifying. Its purpose is to span a wide and diverse range of geometric forms rather than to reproduce the frequency with which particular section types occur in practice. More importantly, the mechanical response of every sample is not synthesised statistically but computed by the experimentally validated numerical model [53] described below: each hysteretic curve in the dataset is obtained from a fibre beam-column model with realistic material constitutive laws, so that the cross-sectional forms are synthetic while the mechanical responses are physical. The deliberate inclusion of a very large number of irregular and complex sections forces the deep learning model to go beyond the empirical memorisation of regular sections and to learn the high-dimensional mapping between the spatial distribution of the constituent materials and the macroscopic mechanical response, which is also why the model can subsequently be transferred to symmetric or regular sections with high predictive accuracy. The high-fidelity reference model is thus the core guarantee of the engineering representativeness of the whole dataset. Finally, because the digit strokes impose a certain morphological bias, the diversity of the generated sections is partly constrained; the dataset is therefore best suited to verifying the feasibility of the proposed method and to studying the form–performance relationship.
In the numerical model the bond behaviour between the embedded steel, the reinforcement and the surrounding concrete is not introduced through a separate discrete bond–slip element. In principle the interface could be resolved by placing zero-length bond–slip springs along the steel–concrete boundary, but this route was not followed here for three reasons. First, the cross-sectional topology of the members considered in this study is extremely complex and geometrically random, and the boundary of the embedded steel is defined by a pixelated edge that is discrete and continuously varying; representing such a boundary by a large number of independent zero-length springs would make its geometric definition ill-conditioned, and the automated generation of a discrete interface-spring topology would in practice be unattainable. Second, the number of interface springs required for each section would grow rapidly with the complexity of the topology, so that the computational cost of generating and analysing 70,000 sections would expand to a prohibitive level. Third, an interface model of this kind would be far more difficult to calibrate against the limited experimental data that are available. The bond–slip effect is therefore represented at the macroscopic level of the fibre section, through the equivalent representation of the interface by the built-in constitutive parameters of the material models, so that the numerical singularities that mesh generation along an irregular steel boundary would introduce are avoided and so that the resulting hysteretic response reproduces the pinching that is associated with bond–slip at large displacements. Under low-cycle reversed loading, the macroscopic pinching of solid-web SRC columns originates mainly from the opening and closing of cracks in the core concrete and from the progressive yielding of the embedded steel under repeated tension and compression, and these are precisely the mechanisms that the cyclic constitutive laws adopted for the two materials reproduce. For the concrete, the law accounts for the opening and closing of cracks, for the tension-softening response, and for the abrupt change and the subsequent recovery of stiffness when the load is reversed from tension to compression. For the embedded steel, the law reproduces both the Bauschinger effect and the isotropic strain hardening that develop under low-cycle reversed loading. The deep coupling of these two advanced constitutive laws at the fibre-section level enables the overall macroscopic response of the member to reproduce the severe nonlinear degradation that a microscopic interface slip would otherwise induce, while greatly improving the computational efficiency of the large sample set.
The modelling strategy adopted in the present study was verified before the dataset was generated, by re-analysing in OpenSeesPy a benchmark cyclic loading test on a reinforced concrete column. The specimen is one of the key columns of the pseudo-static collapse test and numerical simulation competition on reinforced concrete frame structures organised by the Collapse Prevention Committee of the Architectural Society of China and coordinated by the research group of Prof. Xinzheng Lu at Tsinghua University; the geometry, the material properties and the measured response of the specimen, together with the numerical results submitted by all competition participants, were released publicly by the organisers at http://www.luxinzheng.net for the use of researchers and engineers, and the test is documented in [54,55] and in the English-language calibration study of Xie et al. [53]. The concrete was represented by the Concrete02 constitutive model, with a peak compressive strength of 29.39 MPa for the core concrete, 24.49 MPa for the cover concrete and a tensile strength of 2.8 MPa, so that both the compressive envelope and the tension-softening response of the concrete were reproduced. The steel was represented by the Steel02 constitutive model, with a yield strength of 582 MPa and an initial elastic modulus of 289,850 MPa. The cross-section was discretised into a fibre section, and a displacement-based fibre beam-column element (dispBeamColumn) was adopted; five elements were placed along the column height, and eight Gauss–Lobatto integration points were used in each element so that the development of the plastic hinge could be captured. A P-Delta geometric transformation was applied to account for the second-order effects at large deformation, and the analysis was carried out with the Krylov–Newton algorithm under displacement-controlled loading. The parameters of this verification model should not be confused with those used to generate the dataset described above: the steel and the cover concrete were matched to the benchmark specimen, whereas the dataset was generated with a normal-strength steel of 235 MPa and a constant axial load ratio of 0.3, so that the core-concrete compressive strength (29.39 MPa) and the tensile strength (2.8 MPa) are the only values shared by the two models.
The measured and the computed hysteresis curves are compared in Figure 3. The simulated response reproduces the initial stiffness, the pinching of the hysteresis loops and the strength deterioration at large drift; the peak load in the two loading directions differs from the measured value by approximately 17% and 4%, respectively. The verification specimen is a 200 mm × 200 mm reinforced concrete column, whereas the members investigated in this paper are 400 mm × 400 mm solid-web SRC columns. The comparison therefore verifies the modelling strategy and the constitutive parameters adopted in OpenSeesPy, rather than the response of the SRC columns themselves.
Figure 3.
Verification of the numerical model: measured versus computed hysteresis curves of a benchmark reinforced concrete column from the pseudo-static collapse test and numerical simulation competition organised by the Collapse Prevention Committee of the Architectural Society of China and coordinated by Prof. Xinzheng Lu’s group at Tsinghua University [54,55]; the specimen data and the numerical results of the competition are publicly available at http://www.luxinzheng.net. The computed curve is obtained from the fibre beam-column model described in Section 2.3, and the measured curve is redrawn by the authors from the publicly released test data [53]; no figure from the original publications has been reproduced.
For clarity, the symbols used in the following sections are summarised here: ξa denotes the ratio of the steel area to the total cross-sectional area of the column; ξf denotes the strength degradation rate, defined as the percentage reduction in the load-bearing capacity at the end of loading relative to the peak load-bearing capacity; and the maximum load-bearing capacity of a column is reported directly in kN throughout the paper.
3. The MNIST-Section Dataset
Since the handwritten digits used in this study are sourced from a large number of individuals with varying writing habits, they can be considered to exhibit a certain degree of randomness. When these handwritten digits are mapped to different cross-sectional forms, the mechanical properties of the corresponding columns will also vary. Therefore, the cumulative hysteresis energy dissipation and strength degradation rates of columns with different major cross-sectional forms were statistically analysed, as shown in Figure 4. The simulation results indicate that when the cross-sectional form is in the shape of the digit 0, the median cumulative energy dissipation is 558.64 kJ. In contrast, the cross-sectional form in the shape of digit 1 exhibits the lowest energy dissipation, at 243.66 kJ. Cross-sectional forms such as 0 or 8 with closed shapes formed by the steel within the cross-section clearly demonstrate better energy dissipation. Overall, the energy-dissipation distribution for the 10 types of cross-sections follows a normal distribution, as shown in Figure 4a. The strength degradation rate (ξf) is defined in Section 2.3. The overall distribution of degradation rate for the 10 types of cross-sections contrasts with their energy-dissipation capacity, as shown in Figure 4b.
Figure 4.
Distribution of mechanical properties: (a) cumulative energy, (b) strength degradation rate.
The proportion of steel area (ξa) and the degradation of column load-bearing capacity for each of the 10 different cross-sections are shown in Figure 5. The ξa in different cross-sections also follows a typical normal distribution. Except for digit type 1, the highest probability distribution of ξa is between 10% and 20%, while the distribution of ξf is concentrated between 10% and 30%. A linear fit between ξa and ξf indicates that cross-sections shaped like digit types 4 and 5 exhibit higher strength degradation rates, despite having similar ξa to the other cross-sections.
Figure 5.
The distribution of the proportion of steel area ξa and the strength degradation rate ξf for the ten digit-type cross-sections: (a–j) digit types 0–9, respectively. Each panel shows the scatter of ξf against ξa, the marginal histograms of the two variables along the top and right edges, and the linear fit (solid line) together with its equation.
The above analysis indicates that the mechanical performance of CCSCs is influenced not only by the proportion of steel fibres but also by their spatial distribution within the cross-section. Therefore, whether predicting the mechanical performance of CCSCs with different cross-sections or designing cross-sections that meet specific mechanical-performance demands, it is essential to develop models that consider the spatial effects of the steel distribution.
4. Prediction of the Mechanical Performance of CCSCs
4.1. A ViT-Based Network Architecture for Predicting Mechanical Performance
The mechanical performance prediction model for CCSCs used in this study is a deep learning model developed based on the Vision Transformer (ViT). The basic structure of the prediction model is shown in Figure 1b. First, a column section is divided into 16 patches and unfolded. Each patch is then flattened into a one-dimensional vector. Finally, these flattened patches are linearly mapped to a lower-dimensional space and input into the ViT. Before being input into the Transformer Encoder, positional encoding in the form of integers is added to each patch. Through patch embedding, this transforms the problem of predicting the mechanical performance of the column section into a sequence-to-sequence (seq2seq) problem. The Transformer Encoder is essentially a repetition of the Encoder Block stacked 12 times, and it is primarily composed of Layer Norm, Multi-Head Attention, Dropout, and MLP Block components. The shape of the output from the Transformer Encoder remains consistent with the input shape. Finally, the output from the Transformer Encoder layer is mapped to a sequence of length 1024 through the MLP Head. This sequence reflects the displacement–force relationship of the corresponding column section under cyclic loading, known as the hysteresis curves.
During the training process of the ViT, the mean squared error (MSE) loss function was used, and the optimiser employed was AdamW. The initial learning rate was set to 1 × 10⁻², with a weight decay of 1 × 10⁻⁴. An exponential decay schedule (ExponentialLR) was applied to adjust the learning rate, with a decay factor base of 0.99. Training was conducted on a dataset comprising 60,000 different column section forms, over 200 epochs, with a batch size set to 64. Due to the fact that the final prediction result of the ViT consists of 1024 data points, while the network contains 86,045,440 learnable parameters, training such a large parameter set is quite challenging. In practical operations, a pre-training phase using ViT was first conducted on the skeleton curves of the CCSCs, with the regression results containing only 13 points. Once the model could accurately predict the skeleton curves of the CCSCs, fine-tuning was carried out. Subsequently, the model was used to predict the complete hysteresis curves.
4.2. Evaluation of Predictive Performance
A comparative analysis was conducted between the regression results of the ResNet18 model and the ViT. Ten typical sections, representing digits 0 to 9, were selected for illustration, as shown in Figure 6 and Figure 7. Overall, for the prediction of the hysteretic behaviour of CCSC, the results from the ViT were more accurate compared to those from ResNet18. For sections such as digit types 1, 4 and 5, significant mechanical performance degradation and severe concrete damage leading to negative stiffness were observed at later stages of the hysteresis process, as shown in Figure 6b,e,f. The ViT can provide relatively accurate predictions of hysteresis curves, even in cases where pronounced pinching develops after concrete crushing, as shown in Figure 7b. For sections such as digit type 7, where the forces in the positive and negative directions are asymmetric, the ViT also predicts the response accurately, as illustrated in Figure 7h.
Figure 6.
The prediction results of ResNet18: (a–j) cross-sections of the digit types 0–9 (upper part of each panel) and the corresponding hysteresis curves (lower part); solid blue line, FEM result; dashed red line, ResNet18 prediction.
Figure 7.
The prediction results of ViT: (a–j) cross-sections of the digit types 0–9 (upper part of each panel) and the corresponding hysteresis curves (lower part); solid blue line, FEM result; dashed red line, ViT prediction.
To evaluate the hysteretic curves quantitatively, three error indicators are adopted. The mean squared error (MSE) and the root mean square error (RMSE) measure the mean deviation between the predicted and the reference force over the 1024 displacement points of a curve, the RMSE being expressed in kN so that it can be interpreted directly as a load error. The mean absolute percentage error (MAPE) expresses the same deviation as a percentage of the reference force; it is therefore dimensionless and allows sections with different load levels to be compared. The MSE and the MAPE are used together to compare the ViT with the ResNet18 baseline, both being computed on the same test sections and against the same reference curves, so that the two networks are compared on a common basis. In Section 6.1, Section 6.2, Section 6.3 and Section 6.4 the RMSE is used to measure the deviation of the hysteresis curve of a generated cross-section from the prescribed target curve. The same definitions are applied unchanged to all networks and to all sampling schedules, so that the reported values are mutually comparable.
The MSE and mean absolute percentage error (MAPE) of mechanical performance predictions for each section type using ResNet18 and ViT are shown in Figure 8. For section type 1, the ViT model has the smallest MSE prediction error, while for section type 5, the prediction error is relatively larger. The MSE of the ViT is lower than that of ResNet18 for every section type, with an overall reduction of 62.72%. The ViT model demonstrates relatively consistent MAPE in predicting the mechanical performance of column sections across different digit types, whereas ResNet18 exhibits greater variability. The MAPE of the ViT model is 12.95%, while that of ResNet18 is 30.20%. The primary reason for the higher error is that even small inaccuracies can significantly increase the MAPE when the column deformation is minimal. In contrast, the ViT model provides more accurate predictions for the hysteresis behaviour of columns in the plastic state. For the purposes of this paper, the term plastic state denotes the post-yield stage of the hysteretic response, that is, the range of deformations beyond the peak load in which the column exhibits strength degradation and stiffness deterioration.
Figure 8.
Performance of different network architectures for the prediction: (a) MSE, (b) MAPE.
4.3. Transferring Inference to More Complex Sections
After training on column sections of digit types, the ViT model weights were directly transferred to predict more complex arbitrary types of cross-sections, as shown in Figure 9. It is worth noting that the cross-section types in Figure 9 never appeared in the MNIST-Section dataset; these are redrawn cross-section types. Figure 9a,b represent relatively regular and common cross-section types, while the later sections, represented by alphabet shapes, are types that would not occur in actual engineering practice. However, these do not affect the testing of the ViT model’s generalisation capabilities.
Figure 9.
Prediction for more complex arbitrary cross-sections: (a–f) six cross-sections that do not occur in the training set (upper part of each panel), with the steel-area ratio ξa given in the panel, and the corresponding hysteresis curves (lower part); solid line, FEM result; dashed line, ViT prediction.
Using the ratio of steel to the total cross-sectional area (ξa) as an indicator, the cross-section shown in Figure 9c is similar to that in Figure 9b. However, their mechanical properties are significantly different. ViT can accurately predict such cases because it has learned not only simple indicative features but also the distribution of steel within the cross-section.
Gradient-weighted Class Activation Mapping (Grad-CAM) identifies key regions in an image by analysing the gradients flowing into the final layer of the ViT network. By calculating the gradients of the predicted class scores with respect to the feature maps of the last layer, Grad-CAM evaluates the significance of each feature map for a specific class. The application of Grad-CAM analysis to the predictions shown in Figure 9 produces the visualisations in Figure 10. For predicting the mechanical performance of CCSCs, ViT predominantly focuses on the locations of steel within the cross-section rather than concrete, which is consistent with empirical observations.
Figure 10.
Grad-CAM heatmap visualisation: (a–f) heatmaps for the six arbitrary cross-sections of Figure 9; (g–l) heatmaps for six digit-type cross-sections. The colour scale runs from dark blue (low importance) to dark red (high importance), so that the red regions are those to which the model attaches the greatest weight.
Although the scarcity of column cross-section samples (Section 2.2) obliged the use of MNIST-Section as a surrogate during training, the transferred model predicts regular, engineering-relevant and more complex sections alike, and its behaviour is consistent with engineering experience. Therefore, training the model on a large dataset of cross-sections to learn fundamental physical principles and subsequently applying it to practical engineering contexts proves to be a feasible approach.
5. Conditional Diffusion for Cross-Section Generation
5.1. Unconditional Generation
In this section, the denoising diffusion probabilistic model (DDPM) is extended to generate column cross-sections with fine-tuned nonlinear material properties. By setting the nonlinear characteristics of CCSCs as the generation conditions, corresponding column cross-section forms that meet specific target demands can be inversely designed.
The diffusion model is a probabilistic generative model originally derived from the diffusion process theory in physics. The central concept of the diffusion model involves defining a process in which the data distribution is progressively transformed into a Gaussian noise distribution. This process can be regarded as a series of steps that incrementally add noise. Subsequently, the model learns how to perform the inverse operation of this process, starting from pure noise and iteratively denoising through a series of reverse steps to ultimately generate samples that approximate the original data distribution.
Unconditional generative models produce content in a random manner, lacking mechanisms to control the generated outcomes. This limitation renders them insufficiently flexible when specific types of data or samples with particular attributes are required. Unconditional diffusion models can only generate new cross-sections that conform to the original distribution of cross-sectional features but are incapable of reverse-engineering CCSCs with specified mechanical properties. Consequently, developing conditionally guided diffusion models holds significant value.
5.2. Forward Process
The forward process of DDPM is pre-structured, which alters the distribution of input features and incrementally converts it into a prior distribution, usually a standard Gaussian distribution. Given that the original input feature x0 follows the distribution q(x0), the forward process produces a sequence of features x1, x2, ⋯, xT perturbed by noise, using the transition kernel q(xt|xt−1). The transition kernel for the forward process is defined as
and . In DDPM, βt is a predefined hyper-parameter that dictates the magnitude of noise introduced at each step. Consequently, xt results from scaling xt−1 by a factor of , followed by the addition of noise with a variance of βt. In this study, βt is linearly interpolated from 0.0001 to 0.02, and T is set to 1000. Given that the forward noise addition process in DDPM constitutes a Markov chain, the outcome at each step relies solely on the output features of the preceding step. Thus, the distribution at each step can be expressed as follows:
The xt can be obtained by reparameterising Equation (1) through Gaussian sampling:
where ε ~ N(0, I), αt = 1 − βt and . Within the forward diffusion process, a relationship can be derived between xt and x0, adhering to the following distribution:
As the number of diffusion steps increases, xT approaches the standard Gaussian distribution, and .
5.3. Backward Process
In the backward process, the DDPM begins by generating unstructured noise and subsequently employs a reverse learnable Markov chain to iteratively eliminate the noise and progressively produce new samples, as illustrated in Figure 11. The objective of the learnable transition kernel in the backward process is to denoise the standard normal distribution, thereby extracting new features. This can be formally defined as follows:
Given the known systems q(xt−1|x0) and q(xt|x0), the following probabilistic relationship can be derived utilising Bayes’ theorem:
where the three variables in Equation (7) satisfy the following relationship:
From Equation (8) to (10), it can be inferred that q(xt−1|xt, x0) adheres to the following relationship:
By substituting Equation (3) into Equation (11), we can obtain μθ(xt, t):
Within this framework, εθ denotes a learnable parameter. By employing this neural network-based Markov chain, noise can be sampled, the transition kernel can be iteratively applied, and x0 can ultimately be generated.
pθ(xt−1|xt) = N(xt−1, μθ(xt, t), Σθ(xt, t))
Figure 11.
Backward process.
5.4. Generation Guided by Mechanical Performance Criteria
The objective of this study is to generate CCSC cross-sections that meet specified mechanical performance criteria. To achieve this goal, this research maps the target mechanical performance and incorporates feature matrices into the unconditional diffusion model, thereby establishing a generation process guided by mechanical performance conditions.
This study employs a four-layer multilayer perceptron (MLP) to map the skeletal curves, resulting in a feature vector of length 256. This feature vector is then expanded into a feature matrix with dimensions 256 × 1280. By integrating the feature matrix-based context into the DDPM backbone network, the generation process is thereby guided. The advantage of this approach is that it modularises the guidance process, allowing the construction of the feature vector and the diffusion process to be trained synchronously. The guidance generation vectors for displacement (ζd) and force (ζf) are obtained from the mapped skeleton curves. After merging into a feature matrix, these vectors, along with the time steps ζt, are input into the model. Under the fine-tuning of the feature matrix, the neural network is capable of further sampling from the sectional feature distribution Pθ(xt−1|xt) to generate new cross-sections Pθ(xt−1|xt, ζ) that meet the specified mechanical-performance demands, as shown in Figure 12.
Figure 12.
Conditional generation diffusion model architecture.
The backbone network utilised in this research is a modified U-net architecture, consisting of four downsampling layers and four upsampling layers. This modified version incorporates attention mechanisms and residual networks into both the downsampling and upsampling processes, thereby enhancing the network’s convergence and generative performance. The attention mechanism initially maps the input of the network into three vectors: query, key, and value using MLP. It then calculates the similarity or correlation between the query and key vectors and computes the attention weights, as illustrated in Equation (13). The final output layer of the upsampling section produces the normalised form of the generated cross-section. For the output, regions with a value greater than 0.5 are classified as steel, while regions with a greyscale value less than 0.5 are classified as concrete.
The loss function of the model is the MSE, designed to predict and eliminate noise. The initial learning rate for model training is set to 0.01, with the training process spanning 200 epochs. Learning rate decay is managed using an exponential decay method with a base of 0.98, and the AdamW optimiser is employed for model optimisation. In the context of DDPM, the noise scheduling strategy plays a pivotal role in determining the quality of generated samples. Traditional linear or exponential scheduling methods may exhibit suboptimal denoising performance at different stages. This study adopts an improved scheduling strategy based on the squared cosine function.
6. Results of the Inverse Design of Complex Cross-Sections
Based on the diffusion model described in the previous section, a generative model is established to inversely design complex cross-sections. The sampling process begins with complete Gaussian noise and gradually repeats the denoising steps to produce cross-sections that meet mechanical-performance demands. In this study, the DDPM is employed, with 1000 sampling steps to achieve higher quality cross-section forms. In this section, the grey areas of the generated fibre sections represent concrete material, while the red areas indicate steel.
6.1. Sections Generated from Different Training Epochs
The generation results of cross-sections under different training epochs are shown in Figure 13. The blue curves represent the hysteresis loops of the generated column cross-sections, while the red curves indicate the target mechanical performance; the closer the generated curves are to that target, the more accurate the diffusion model. As depicted, in the second training epoch, the generated cross-section is discontinuous and irregular. The corresponding column, simulated using OpenSeesPy, yields a hysteresis curve with a root mean square error (RMSE) of 192.95 kN compared to the target mechanical performance in red, as shown in Figure 13a. As the number of training epochs increases, the cross-sections generated by the DDPM become more closely aligned with the form of handwritten digits. Correspondingly, the mechanical performance of the generated CCSC approaches the target values more closely. At the eighth training epoch, the RMSE is 68.83 kN, while at the 20th training epoch, the RMSE decreases significantly to 5.99 kN.
Figure 13.
Different training epochs: (a–h) generated cross-sections (upper part of each panel) and the corresponding hysteresis curves (lower part) after 2, 4, 6, 8, 10, 12, 20 and 50 training epochs, respectively; solid line, DDPM prediction; dashed red line, target performance.
6.2. The Process of Complex Cross-Sections Generation
At each step of the cross-section generation, the model receives an input with noise and is required to predict this noise to estimate the complete, noise-free cross-section form. In high-noise scenarios, the predictive performance of the DDPM is suboptimal; therefore, the sampling process must be decomposed into multiple steps. Each sampling step makes a small move in the direction of the prediction. If the prediction is more accurate than the previous step, the next prediction is based on this new, improved estimate.
Three sets of mechanical-performance targets for CCSCs were randomly established to guide the generation of cross-sections. The process, involving 1000 sampling steps, is illustrated in Figure 14. The maximum load-bearing capacity for the CCSC was set at 885.72 kN, with a load capacity of 741.90 kN at the end of loading, resulting in a ξf of 16.24%. This represents a target with strong energy-dissipation capability and high ductility. The generation process is depicted in Figure 14a. At the sampling step of 250, the generated cross-section appeared as irregular noise, with the fibre section densely filled with disordered steel. The corresponding load-bearing capacity RMSE of the CCSC was 1330.17 kN, exceeding the preset maximum load-bearing capacity by more than double. At a sampling step of 500, the generated cross-section exhibited some geometric regularity, with the RMSE of the CCSC’s mechanical performance relative to the target value being 565.66 kN. At 700 sampling steps, the cross-section displayed clearer features, and the RMSE was reduced to 121.17 kN. Finally, at 1000 sampling steps, the RMSE further decreased to 20.76 kN. The resulting CCSC’s hysteresis performance closely matched the predetermined demands, satisfying the design criteria.
Figure 14.
The process of section generation: (a–c) generation processes for three target performance levels. In each panel the upper row shows the generated cross-section at the sampling steps 250, 500, 600, 650, 700, 750, 800, 850, 900 and 1000, and the lower row shows the corresponding hysteresis curves, the roman numerals I–X denoting these ten sampling steps in sequence; solid line, DDPM prediction; dashed red line, target performance.
Figure 14b,c show the same pattern: the cross-sections remain disorganised noise for the first 600 sampling steps, over which interval the generated performance departs substantially from the target, and they align increasingly closely with the prescribed demands as the number of steps increases. The final cross-sections are not simply recalled from the training set: that of Figure 14a, for instance, resembles no numeral form, the DDPM combining cross-sectional features into a form that is entirely new yet meets the mechanical-performance demand.
6.3. Generation of Cross-Sections Under Different Mechanical-Performance Demands
Figure 15 shows the cross-sections generated under different performance targets, with four candidate sections for each target and the red dotted lines denoting the targets; each generated cross-section was then evaluated to verify the mechanical performance of the corresponding column.
Figure 15.
Generation based on diverse mechanical-performance demands: (a–f) six representative target performance levels. For each target, four cross-sections were generated independently and are labelled I–IV; the right-hand plot compares the hysteresis curves of these four generated sections with the target performance.
The mechanical-performance target in Figure 15a specifies a maximum load-bearing capacity of 851.01 kN and a ξf of 13.95%, indicating a demand for high load capacity, low strength degradation, and high ductility. The results from the generated column cross-sections reveal a substantial proportion of steel, with ξa values of 18.25%, 22.44%, 18.31%, and 20.31%, respectively. Despite varying ξa values, the generated CCSC exhibits nearly consistent mechanical performance characteristics. The target mechanical performance in Figure 15c is comparatively lower than that in Figure 15a, with a maximum load-bearing capacity of 646.63 kN and a ξf of 23.57%. The RMSE of the skeleton curves for the four CCSCs generated by the DDPM relative to the target values are 13.18 kN, 4.30 kN, 9.09 kN, and 10.46 kN, indicating relatively low errors. Observations of the generated cross-sections suggest a decreasing trend in the proportion of steel as the targeted mechanical performance decreases. The target load-bearing demand in Figure 15f is relatively low, with a peak capacity of 400.51 kN and a ξf of 47.65%. The steel proportion for the four cross-sections ranges between 4.5% and 5.8%, with a maximum RMSE of 32.23 kN. Most of the generated sections resemble the digit-1 form, and the corresponding hysteresis curves exhibit pronounced pinching, which is consistent with the slip-related behaviour described in Section 2.3.
6.4. The Generation Process with Varying Noise Schedules
The aforementioned study indicates that DDPM, through its iterative denoising process, can generate high-quality section forms that meet mechanical-performance demands. However, the need for multiple iterative sampling steps results in a slower inference speed. To address the limitations of DDPM, alternative noise schedules such as Denoising Diffusion Implicit Model (DDIM) [56], Pseudo-Numerical Methods for Diffusion Model (PNDM) [57], and diffusion exponential-integrator sampler (DEIS) [58] have been developed. DDIM introduces a deterministic mapping that reduces the number of sampling steps while maintaining sample quality. PNDM enhances sampling efficiency through pseudo-numerical methods. DEIS employs exponential integration to refine the sampling process, thereby better estimating the variational lower bound of the diffusion process and further reducing sampling time while preserving sample quality.
Figure 16a to d present the results of DDPM, DDIM, PNDM, and DEIS, respectively. Despite having identical mechanical performance requirements, the generated cross-sections differ significantly. Nevertheless, the mechanical properties of the corresponding CCSCs closely follow the target specifications, although the accuracy varies between the samplers. The final RMSE values for the DDPM, DDIM, PNDM and DEIS models are 8.74 kN, 5.68 kN, 29.87 kN and 9.15 kN, respectively, so that the DDIM sampler is the most accurate of the four. The decisive advantage of the DEIS is that it requires only 10 generation steps, merely 1% of the 1000 steps of the standard DDPM, so that it reduces the sampling cost by two orders of magnitude while preserving an accuracy comparable to that of the full DDPM schedule. This makes DEIS particularly suitable for the development of large-scale, rapid cross-section generation models.
Figure 16.
Generation based on different noise schedules: (a) DDPM, (b) DDIM, (c) PNDM and (d) DEIS. In each panel the upper row shows the generated cross-section at five successive sampling steps (indicated above each column) and the lower row shows the corresponding hysteresis curves, the roman numerals I–V denoting these five sampling steps in sequence; solid line, model prediction; dashed red line, target performance.
7. Discussion
This study addresses the mechanical performance of CCSCs from both a forward-prediction and an inverse-design perspective. As shown by the transfer results in Section 4.3, a model trained only on handwritten-digit sections can predict the hysteresis curves of cross-sections that are more regular and more complex than those in the training set, and the Grad-CAM analysis reported in that section indicates that the ViT concentrates on the steel regions of the section, in agreement with engineering experience.
In the inverse design of cross-sections, this study successfully generated cross-sectional forms that meet the mechanical performance requirements of CCSCs, which confirms the potential of diffusion model-based generative methods in cross-sectional design; by introducing a mechanical-performance feature matrix to guide the generation process, the diffusion model demonstrated advantages of high speed and accuracy. The limitations that remain in the generated forms are set out in Section 8.
The performance obtained here can be placed in the context of the recent literature on data-driven column assessment. Models that predict scalar seismic indicators of columns, such as the failure mode, the shear capacity or the key points of the skeleton curve, currently reach coefficients of determination of about 0.88–0.99 and classification accuracies of about 0.85–0.91 when they are trained on experimental or finite-element databases [10,11,38]. Sequence models trained on experimental databases reproduce a complete hysteresis loop with a coefficient of determination of about 0.99 [39], and physics-guided generative models reduce the RMSE of hysteresis prediction by about 60% with respect to purely numerical simulation [40]. The present study differs from these works in the quantity that is predicted and in the nature of the design problem, as set out in Section 1. Vision-Transformer-based frameworks have been reported to outperform convolutional networks in closely related structural-recognition tasks [59,60,61], which is consistent with the reduction of 62.72% in the MSE relative to ResNet18 obtained here. The diffusion models cited above have already proved effective for generating structural layouts [49,50] and material distributions [51]; the contribution of the present work is to extend conditional diffusion to the inverse design of a macroscopic SRC column section conditioned on a complete hysteresis requirement and to reduce the sampling cost to 10 steps, which to the authors’ knowledge has not previously been reported at the level of a structural section.
The works compared above all address the prediction of a mechanical response; a more fundamental difference separates the present framework from the parameterised design methods that are customary in structural design, in which the design variables are fixed in advance—typically the aspect ratio of the cross-section and the reinforcement ratio—and a multilayer perceptron or a heuristic optimiser then searches that predefined space for the combination that best satisfies one or two scalar requirements. Only a single mechanical indicator is optimised, and the search is confined to the geometries that the parameterisation is able to represent; machine learning models of this kind, such as the residual-deformation predictor of Shturmin et al. [35] and the explainable machine learning shear-capacity model of Ma et al. [33], likewise regress a single indicator from a set of predefined sectional parameters. Both differences follow from a single change in design target: taking the complete hysteresis curve, rather than a scalar indicator, as the objective means that strength and stiffness degradation and the pinching caused by bond–slip are carried in the design target itself, so that the resulting section reflects the ductility and energy-dissipation demand of a structure under strong ground motion more faithfully than a single-parameter optimisation; and generating the section directly from that target, rather than by search, removes the geometric parameterisation altogether and with it the restriction to the geometries that the parameterisation can represent. The framework is therefore not a conventional deep learning parameter regression but a data-driven image-generation paradigm—a performance-to-image generation mechanism—that removes the restriction to regular rectangular or circular outlines and widens the design boundary of SRC columns to complex shapes that are difficult to describe with conventional parameters. The result is a one-to-many mapping from performance to geometry that the parameterised methods, by construction, cannot express.
The results of this study can also be separated into a scientific–theoretical part and an engineering–practical part. From a scientific–theoretical point of view, the results demonstrate that the geometry–performance relationship of CCSCs is learnable directly from geometry—that the conditional distribution of cross-sectional forms at a prescribed performance level can be modelled and sampled, which together establish a clear and reversible high-dimensional mapping between the geometry of a complex cross-section and its nonlinear mechanical response, and thus demonstrate the theoretical feasibility of learning the physical laws of structural mechanics through a visual generative model. From an engineering–practical point of view, the results provide an efficient intelligent design methodology that replaces the cumbersome finite-element modelling and trial-and-error loop: by means of the exponential-integrator sampler (DEIS), a prescribed hysteresis requirement is converted into a cross-sectional form within seconds, and the quantitative accuracy levels (RMSE between 4.30 kN and 13.18 kN for the four sections of Figure 15c) allow an engineer to judge whether the generated section is acceptable for preliminary design.
The framework developed in this study is intended primarily for the conceptual and preliminary design of solid-web SRC columns in buildings in which a high axial load and a high seismic demand have to be accommodated within a limited cross-section, for example the lower storeys of high-rise residential and office buildings, transfer-storey and large-span podium structures, and heavy industrial buildings and plant frames in which SRC columns are already widely used. In such projects the method can be used to generate candidate sections for a prescribed target hysteresis curve and to screen them before a detailed finite-element verification is carried out, which shortens the trial-and-error loop described in Section 2.1. Geometric and code-based constraints such as symmetry, a minimum steel ratio and a minimum encasement thickness can be incorporated into the generation process so that the output is directly acceptable in engineering practice.
Figure 17 places the cross-sectional forms considered in this study in the context of engineering practice and of experimental research. Part (a) gives the forms most commonly adopted in engineering practice, in which an H-section or a cruciform steel section is embedded at the centre of a square concrete section and is confined by longitudinal reinforcement and stirrups. Part (b) shows columns with complex cross-sections that have been tested in the literature: the built-up steel skeletons of special-shaped (L- and T-shaped) concrete-encased steel stub columns tested in axial compression [62], and a distinctly shaped (cross-shaped) steel-reinforced concrete column–beam joint tested under cyclic loading, together with its cross-section [63]; in all of these the distribution of the embedded steel, rather than the outline of the concrete, governs the mechanical response. Part (c) extends the same reasoning to large-section members such as the bridge pier shown in service [64].
Figure 17.
Cross-sectional forms of solid-web SRC columns and related members: (a) forms commonly adopted in engineering practice (drawn by the authors); (b) columns with complex cross-sections tested in the literature—(i) steel skeletons of special-shaped (L- and T-shaped) concrete-encased steel stub columns, reproduced from [62] under CC BY 4.0; (ii) cross-section and (iii) test specimen of a distinctly shaped steel-reinforced concrete column–beam joint, reproduced from [63] under CC BY 4.0; (c) a bridge pier in service, reproduced from [64] under CC BY 4.0.
8. Conclusions
This research introduces a method for predicting the mechanical performance and inverse design of CCSCs based on deep learning algorithms. The main conclusions are as follows:
- (1)
- The MNIST-Section dataset was developed by using segments of handwritten digits to represent steel, while the remaining portions represented concrete materials, creating 70,000 CCSCs for numerical simulation. The statistical analysis shows that these quantities depend on the spatial arrangement of the steel and not on the steel area proportion alone.
- (2)
- A network based on ViT was developed to directly predict the complete hysteretic performance of columns from their cross-sectional forms. Compared to ResNet18, the ViT model demonstrated lower MSE and MAPE in its predictions. Analysis of the predicted hysteretic curves revealed that ViT not only accurately predicts the load-bearing capacity of CCSCs but also captures the pinching effects in the hysteretic curves associated with bond–slip at large displacements. Relative to the ResNet18 baseline, the ViT cut the MSE by 62.72% and reduced the MAPE from 30.20% to 12.95%, which confirms its advantage in reproducing the complete hysteresis curve.
- (3)
- The diffusion-based inverse-design model generates cross-sectional forms that satisfy the prescribed mechanical-performance demands, and the DEIS schedule keeps the sampling process fast enough for the rapid design of cross-sections. Quantitatively, the DEIS attains the target performance in only 10 sampling steps, about 1% of the 1000 steps required by the standard DDPM, with an RMSE of 9.15 kN.
- (4)
- The contribution of this work is therefore twofold (Section 7): a reversible geometry–performance mapping established at the scientific–theoretical level, and an intelligent design methodology usable at the engineering–practical level.
- (5)
- Several limitations should be acknowledged. The conclusions refer to the response reproduced by the fibre beam-column model, whose accuracy has been assessed against the benchmark test described in Section 2.3, rather than to experimentally measured behaviour. As noted in Section 2.3, the morphological bias inherited from the digit strokes constrains the diversity of the generated sections, and the model should be fine-tuned on real engineering cross-sections before it is used for design. The bond–slip behaviour between the steel and the concrete is represented by the built-in material parameters of OpenSeesPy rather than by a discrete interface element, so that the pinching observed in the curves should be regarded as associated with, rather than as a direct measurement of, bond–slip. The dataset was generated with fixed material strengths and a constant axial load ratio, so that the generalisation of the framework to other material combinations and loading conditions has not yet been established. Moreover, although the generated sections satisfy the prescribed mechanical demand, some of them exhibit irregular or asymmetric topologies that would complicate reinforcement detailing and formwork, so that the constructability of the generated sections is a further consideration that the present framework does not yet address. Finally, the study is restricted to a single section size, a single material grade and uniaxial cyclic loading.
- (6)
- Future work will proceed along two lines. Scientifically, more sophisticated constraint methods will be developed for the design of microstructures within cross-sections: geometric-symmetry and constructability penalties, together with physical prior constraints, will be embedded in the DEIS-based generation process, the dataset will be extended to a multi-parameter formulation that couples the material strengths and the axial load ratio with the cross-sectional geometry, and the generative model will be extended to a wider range of structural members in order to improve its generalisation. In application, the pre-trained ViT will be used to screen large numbers of sections efficiently and to assemble a symmetric cross-section dataset, and the pipeline will be retrained on real engineering sections so that it can support the conceptual design of SRC columns in high-rise, large-span and industrial buildings and produce cross-sectional forms that are not only mechanically optimal but also consistent with construction codes and engineering practice.
Author Contributions
Conceptualisation, M.S. and W.X.; methodology, M.S. and T.Z.; software, M.S. and T.Z.; validation, M.S., T.Z. and C.S.; formal analysis, M.S., T.Z. and C.S.; investigation, M.S. and T.Z.; data curation, M.S., T.Z. and C.S.; writing—original draft preparation, M.S. and W.X.; writing—review and editing, M.S., T.Z., C.S. and W.X.; funding acquisition, W.X. All authors have read and agreed to the published version of the manuscript.
Funding
This research was funded by the National Natural Science Foundation of China, grant number 52208173.
Data Availability Statement
The data and the Python code that support the findings of this study are openly available in the GitHub repository at https://github.com/AshenOneme/CCSC-Prediction-Inverse-Design (accessed on 20 October 2026). The repository account is administered by the second author (T. Zhang, zhangtianyang@njtech.edu.cn), who is responsible for uploading and versioning the dataset and the code, for keeping the repository in public access, and for answering requests for the data. A complete archived copy of the repository and the account recovery information are held by the corresponding author (W. Xu, xuwz@njtech.edu.cn), so that access to the data does not depend on a single person. Should the second author become unavailable or leave the institution, the account and the archived copy will be transferred to the corresponding author, who will then assume the same responsibilities, so that the data remain openly accessible without interruption after publication. The repository also contains the source file of Figure 1.
Acknowledgments
The authors thank Xinzheng Lu and his research group at Tsinghua University for organising and coordinating the pseudo-static collapse test and numerical simulation competition and for making the test data and the numerical results publicly available, which made the verification presented in Section 2.3 possible.
Conflicts of Interest
The authors declare no conflicts of interest.
References
- Bai, W.; Dai, J.; Liu, R.; Shao, Z.; Yang, Y.; Jiang, T.; Zhou, B. Site investigation on seismic performance of 7 isolated buildings during the 2022 Luding Ms 6.8 earthquake. J. Build. Eng. 2024, 89, 109224. [Google Scholar] [CrossRef] [Scilit]
- Zhao, B.; Taucer, F.; Rossetto, T. Field investigation on the performance of building structures during the 12 May 2008 Wenchuan earthquake in China. Eng. Struct. 2009, 31, 1707–1723. [Google Scholar] [CrossRef] [Scilit]
- Sharma, K.; Deng, L.; Noguez, C.C. Field investigation on the performance of building structures during the April 25, 2015, Gorkha earthquake in Nepal. Eng. Struct. 2016, 121, 61–74. [Google Scholar] [CrossRef] [Scilit]
- Ivanov, M.L.; Chow, W.-K. Structural damage observed in reinforced concrete buildings in Adiyaman during the 2023 Turkiye Kahramanmaras Earthquakes. Structures 2023, 58, 105578. [Google Scholar] [CrossRef] [Scilit]
- İnce, O. Structural damage assessment of reinforced concrete buildings in Adıyaman after Kahramanmaraş (Türkiye) Earthquakes on 6 February 2023. Eng. Fail. Anal. 2024, 156, 107799. [Google Scholar] [CrossRef] [Scilit]
- Turan, A.I.; Celik, A.; Kumbasaroglu, A.; Yalciner, H. Assessment of reinforced concrete building damages following the Kahramanmaraş earthquakes in Malatya, Turkey (February 6, 2023). Eng. Sci. Technol. 2024, 54, 101718. [Google Scholar] [CrossRef] [Scilit]
- Gkimousis, I.; Koumousis, V. Modeling RC column flexural failure modes under intensive seismic loading. Earthq. Eng. Struct. Dyn. 2018, 47, 1942–1962. [Google Scholar] [CrossRef] [Scilit]
- Chiu, C.K.; Sung, H.F.; Chiou, T.C. Quantification of the reduction factors of seismic capacity for damaged RC column members using the experiment database. Earthq. Eng. Struct. Dyn. 2020, 50, 756–776. [Google Scholar] [CrossRef] [Scilit]
- Park, J.; Park, M.; Chae, Y.; Kim, C.Y. Dynamic cyclic loading tests for investigating the influence of loading rate and axial force on the lateral response of RC columns. Earthq. Eng. Struct. Dyn. 2024, 53, 1537–1551. [Google Scholar] [CrossRef] [Scilit]
- Wen, Y.; Zhou, S.; Cai, G.; He, Z.; Si Larbi, A. Comprehensive assessment of failure mode and shear capacity of reinforced concrete circular columns based on data-driven machine learning methods. Eng. Appl. Artif. Intell. 2025, 150, 110603. [Google Scholar] [CrossRef] [Scilit]
- Fan, C.; Ding, Y.; Geng, F.; Xue, J.; Yang, K. Interpretable multi-index seismic assessment framework for reinforced concrete columns using voting ensemble methodology. Structures 2025, 78, 109270. [Google Scholar] [CrossRef] [Scilit]
- Shi, Y.; Jiang, L.; Yuan, G.; Guo, L.; Zhou, Q.; Zhu, F. Experimental Study on Seismic Performance of Steel-Reinforced Concrete Columns Under Different Loading Protocols. Buildings 2025, 15, 3180. [Google Scholar] [CrossRef] [Scilit]
- Dong, H.; Qin, J.; Cao, W.; Wang, H. Investigation on axial compressive behavior of pentagonal section steel-reinforced concrete columns. J. Build. Eng. 2023, 66, 105954. [Google Scholar] [CrossRef] [Scilit]
- Zhu, J.-Y.; Liu, H.; Chan, T.-M. Global buckling behaviour and design of cold-formed steel octagonal hollow section columns under compression. Thin. Wall. Struct. 2024, 205, 112447. [Google Scholar] [CrossRef] [Scilit]
- Wang, J.; Di, J.; Zheng, Y.; Qin, F.; Su, Y. Interactive buckling behaviour of Q420–Q960 steel welded thin-walled H-section long column. Thin-Walled Struct. 2024, 203, 112219. [Google Scholar] [CrossRef] [Scilit]
- Dong, H.; Zhu, J.; Cao, W.; Rao, Y. Axial compressive behavior of mega steel-reinforced high-strength concrete columns with different steel sections. Structures 2023, 48, 1158–1174. [Google Scholar] [CrossRef] [Scilit]
- Hui, C.; Li, Y.; Li, K.; Hai, R.; Myers, J.J.; Li, C. Experimental study and analysis on seismic performance of special-shaped steel reinforced concrete column frame. Structures 2022, 37, 353–363. [Google Scholar] [CrossRef] [Scilit]
- Liu, X.-C.; Meng, K.; Chen, X.; Zhang, J.; Cui, Y. Axial compression behavior of prefabricated L-section thin concrete encased steel short columns. J. Constr. Steel Res. 2023, 208, 107989. [Google Scholar] [CrossRef] [Scilit]
- Jin, B.; Liu, X.; Chen, X.; Zhang, D.; Zhang, J.; Li, Z. Axial compression behavior of a prefabricated F4T-section thin concrete encased steel short columns with different stirrup types. Structures 2024, 65, 106777. [Google Scholar] [CrossRef] [Scilit]
- Liu, Y.; Wang, J.; Tan, Q.; Gao, H.; Wang, K.; Yao, S.; Peng, Y. On multi-stage deformation and gradual energy absorption of 3D printed multi-cell tubes with varying cross-section. Eng. Struct. 2024, 319, 118839. [Google Scholar] [CrossRef] [Scilit]
- Meng, K.; Chen, X.; Liu, X.C.; Zhang, D.J.; Zhang, A.L.; Ren, Y.Z.; Xu, B.; Yin, Z. Axial compression behavior of prefabricated T-section thin concrete encased steel short columns. J. Build. Eng. 2024, 82, 108108. [Google Scholar] [CrossRef] [Scilit]
- Wang, J.; Chen, J.; Ma, S.; Gong, X.; Yan, J. Experimental study on axial compression performance of high-strength steel reactive powder concrete circular section column. Structures 2024, 69, 107444. [Google Scholar] [CrossRef] [Scilit]
- Wang, W.; Li, J.; Chen, P.; Zhou, C.; Wang, Z. Effects of Freeze-Thaw Cycles on Interfacial Shear Transfer Characteristics in Section Steel Reinforced Concrete Composite Structures with Stud Connectors. Eng. Struct. 2024, 307, 117948. [Google Scholar] [CrossRef] [Scilit]
- Mostafa, M.M.A.; Chen, S.; Wu, T.; Liu, X.; Liu, Y. Experimental seismic analysis of new types of steel-reinforced lightweight concrete columns with cross-shaped steel section. J. Build. Eng. 2022, 60, 105202. [Google Scholar] [CrossRef] [Scilit]
- Wang, B.-X.; Ding, R.; Nie, J.-G.; Wang, C.-K.; Liu, P.; Wang, C.-H. Seismic performance of special-shaped hexagonal concrete filled steel tubes with inner diaphragm plates and shear studs. Eng. Struct. 2024, 301, 117274. [Google Scholar] [CrossRef] [Scilit]
- Zhao, H.; Wang, Q.; Shi, Q.; Wang, L. Behavior and design of steel-tubed-reinforced-concrete columns reinforced with non-through section steel. J. Constr. Steel Res. 2023, 203, 107851. [Google Scholar] [CrossRef] [Scilit]
- Zhao, X.; Wen, F.; Yan, S. Behavior of multi-steel reinforced concrete columns with encased steel H-sections. Eng. Struct. 2022, 264, 114463. [Google Scholar] [CrossRef] [Scilit]
- Ke, X.-j.; Liu, L.-z.; Chen, S.-j.; Li, N. Study on bearing capacity of T-shaped steel plate reinforced concrete composite shear wall. Structures 2024, 67, 107022. [Google Scholar] [CrossRef] [Scilit]
- Cheng, J.; Li, X.; Jiang, K.; Li, S.; Su, A.; Zhao, O. Machine-learning-assisted design of high strength steel I-section columns. Eng. Struct. 2024, 308, 118018. [Google Scholar] [CrossRef] [Scilit]
- Koodiani, H.K.; Jafari, E.; Majlesi, A.; Shahin, M.; Matamoros, A.; Alaeddini, A. Machine learning tools to improve nonlinear modeling parameters of RC columns. J. Build. Eng. 2024, 84, 108492. [Google Scholar] [CrossRef] [Scilit]
- Lai, B.-L.; Bao, R.-L.; Zheng, X.-F.; Vasdravellis, G.; Mensinger, M. Machine-learning assisted analysis on the seismic performance of steel reinforced concrete composite columns. Structures 2024, 68, 107065. [Google Scholar] [CrossRef] [Scilit]
- Lee, C.S.; Mangalathu, S.; Jeon, J.S. Machine learning–assisted drift capacity prediction models for reinforced concrete columns with shape memory alloy bars. Comput.-Aided Civ. Infrastruct. Eng. 2023, 39, 595–616. [Google Scholar] [CrossRef] [Scilit]
- Ma, C.; Cao, J.; Pan, K.; Zeng, J.-J. Prediction of shear capacity of RC columns and discussion on shear contribution via the explainable machine learning. Structures 2024, 69, 107562. [Google Scholar] [CrossRef] [Scilit]
- Ma, C.; Chi, J.-w.; Kong, F.-c.; Zhou, S.-h.; Lu, D.-c.; Liao, W.-z. Prediction on the seismic performance limits of reinforced concrete columns based on machine learning method. Soil Dyn. Earthq. Eng. 2024, 177, 108423. [Google Scholar] [CrossRef] [Scilit]
- Shturmin, S.; Lee, C.S.; Choi, E.; Jeon, J.-S. Machine learning-based residual drift prediction of concrete-filled steel tube columns under earthquake loads. J. Build. Eng. 2024, 97, 110903. [Google Scholar] [CrossRef] [Scilit]
- To, Q.B.; Lee, K.; Cuong, N.H.; Shin, J. Development of machine learning based seismic retrofit scheme for AFRP retrofitted RC column. Structures 2024, 69, 107279. [Google Scholar] [CrossRef] [Scilit]
- Yang, D.; Yang, J.; Shi, J. Prediction and analysis of damage to RC columns under close-in blast loads based on machine learning and Monte Carlo method. Eng. Struct. 2024, 318, 118787. [Google Scholar] [CrossRef] [Scilit]
- Sun, P.; Wen, W.; Zhai, C.; Li, Y. Prediction of Skeleton Curves for Seismically Damaged RC Columns Based on a Data-Driven Machine-Learning Approach. Buildings 2025, 15, 3135. [Google Scholar] [CrossRef] [Scilit]
- Ni, X.; Wang, H.; Xu, J.; Zhang, Q.; Yi, S. Hysteretic behavior prediction and residual displacement-based damage assessment of reinforced concrete columns using deep time series models. Measurement 2026, 258, 119140. [Google Scholar] [CrossRef] [Scilit]
- Wu, T.-Y.; Wu, R.-T.; Wang, P.-H. Physics-guided GAN-based prognostic framework for seismic hysteresis loop and damage pattern in RC bridge columns. Eng. Struct. 2025, 328, 119668. [Google Scholar] [CrossRef] [Scilit]
- Kingma, D.P.; Welling, M. Auto-Encoding Variational Bayes. arXiv 2013, arXiv:1312.6114. [Google Scholar] [CrossRef] [Scilit]
- Goodfellow, I.; Pouget-Abadie, J.; Mirza, M.; Xu, B.; Warde-Farley, D.; Ozair, S.; Courville, A.; Bengio, Y. Generative adversarial networks. Commun. ACM 2020, 63, 139–144. [Google Scholar] [CrossRef] [Scilit]
- Hertz, A.; Mokady, R.; Tenenbaum, J.; Aberman, K.; Pritch, Y.; Cohen-Or, D. Prompt-to-Prompt Image Editing with Cross Attention Control. arXiv 2022, arXiv:2208.01626. [Google Scholar] [CrossRef] [Scilit]
- Ho, J.; Salimans, T.; Gritsenko, A.; Chan, W.; Norouzi, M.; Fleet, D.J. Video Diffusion Models. arXiv 2022, arXiv:2204.03458. [Google Scholar] [CrossRef] [Scilit]
- Karras, T.; Aittala, M.; Aila, T.; Laine, S. Elucidating the Design Space of Diffusion-Based Generative Models. arXiv 2022, arXiv:2206.00364. [Google Scholar] [CrossRef] [Scilit]
- Wang, H.; Du, Z.; Feng, F.; Kang, Z.; Tang, S.; Guo, X. DiffMat: Data-driven inverse design of energy-absorbing metamaterials using diffusion model. Comput. Methods. Appl. Mech. Engrg. 2024, 432, 117440. [Google Scholar] [CrossRef] [Scilit]
- Vlassis, N.N.; Sun, W. Denoising diffusion algorithm for inverse design of microstructures with fine-tuned nonlinear material properties. Comput. Methods Appl. Mech. Eng. 2023, 413, 116126. [Google Scholar] [CrossRef] [Scilit]
- Bastek, J.-H.; Kochmann, D.M. Inverse design of nonlinear mechanical metamaterials via video denoising diffusion models. Nat. Mach. Intell. 2023, 5, 1466–1475. [Google Scholar] [CrossRef] [Scilit]
- Gu, Y.; Huang, Y.; Liao, W.; Lu, X. Intelligent design of shear wall layout based on diffusion models. Comput.-Aided Civ. Infrastruct. Eng. 2024, 39, 3610–3625. [Google Scholar] [CrossRef] [Scilit]
- Zhuang, B.; Gallet, A.; Smyl, D. Inverse structural design with generative and probabilistic autoencoders and diffusion models. Eng. Appl. Artif. Intell. 2025, 161, 112143. [Google Scholar] [CrossRef] [Scilit]
- Li, G.; Liu, D. Inverse design of composite materials with desired mechanical behaviors based on conditional diffusion model. Eng. Struct. 2025, 345, 121417. [Google Scholar] [CrossRef] [Scilit]
- GB 50010-2010; Code for Design of Concrete Structures. China Architecture & Building Press: Beijing, China, 2010.
- Xie, L.L.; Lu, X.Z.; Guan, H.; Lu, X. Experimental Study and Numerical Model Calibration for Earthquake-Induced Collapse of RC Frames with Emphasis on Key Columns, Joints and the Overall Structure. J. Earthq. Eng. 2015, 19, 1320–1344. [Google Scholar] [CrossRef] [Scilit]
- Lin, X.; Lu, X. Numerical Models to Predict the Collapse Behavior of RC Columns and Frames. Open Civ. Eng. J. 2017, 11, 854–860. [Google Scholar] [CrossRef] [Scilit]
- Pan, P.; Zhao, G.; Lu, X.; Deng, K. Force–Displacement Mixed Control for Collapse Tests of Multistory Buildings Using Quasi-Static Loading Systems. Earthq. Eng. Struct. Dyn. 2014, 43, 287–300. [Google Scholar] [CrossRef] [Scilit]
- Song, J.; Meng, C.; Ermon, S. Denoising Diffusion Implicit Models. arXiv 2020, arXiv:2010.02502. [Google Scholar] [CrossRef] [Scilit]
- Liu, L.; Ren, Y.; Lin, Z.; Zhao, Z. Pseudo Numerical Methods for Diffusion Models on Manifolds. arXiv 2022, arXiv:2202.09778. [Google Scholar] [CrossRef] [Scilit]
- Zhang, Q.; Chen, Y. Fast Sampling of Diffusion Models with Exponential Integrator. arXiv 2022, arXiv:2204.13902. [Google Scholar] [CrossRef] [Scilit]
- Li, Y.; Sun, Z.; Li, Y.; Yang, H.; Liu, X.; He, W. A vision transformer-based method for predicting seismic damage states of RC piers: Database development and efficient assessment. Reliab. Eng. Syst. Saf. 2025, 263, 111287. [Google Scholar] [CrossRef] [Scilit]
- Lethanh, N.; Trinh, T.A.; Hossain, M.T. An Investigation on Prediction of Infrastructure Asset Defect with CNN and ViT Algorithms. Infrastructures 2025, 10, 125. [Google Scholar] [CrossRef] [Scilit]
- Yang, X.; del Rey Castillo, E.; Zou, Y.; Wotherspoon, L.; Yang, J.; Li, H. Automated Concrete Bridge Damage Detection Using an Efficient Vision Transformer-Enhanced Anchor-Free YOLO. Engineering 2025, 51, 311–326. [Google Scholar] [CrossRef] [Scilit]
- Wang, Z.; Lu, M.; Yi, W.; Zhu, L. Research on the Compression Bearing Capacity of Special-Shaped Steel-Concrete Columns. Buildings 2026, 16, 1162. [Google Scholar] [CrossRef] [Scilit]
- Duan, J.; Yang, D.; Liu, X.; Xiang, P. Seismic Energy Dissipation and Hysteresis Performances of Distinctly Shaped Steel-Reinforced Concrete Column–Beam Joints under Cyclic Loading. Buildings 2024, 14, 2777. [Google Scholar] [CrossRef] [Scilit]
- Wang, Z.; Li, J.; Ling, L.; Luo, H.; Wu, L.; Zhou, X.; Wang, Y. Strengthening Width on Local Damage to Circular Piers Caused by Rolling Boulder Impacts. Buildings 2025, 15, 4347. [Google Scholar] [CrossRef] [Scilit]
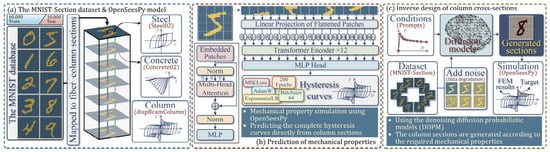
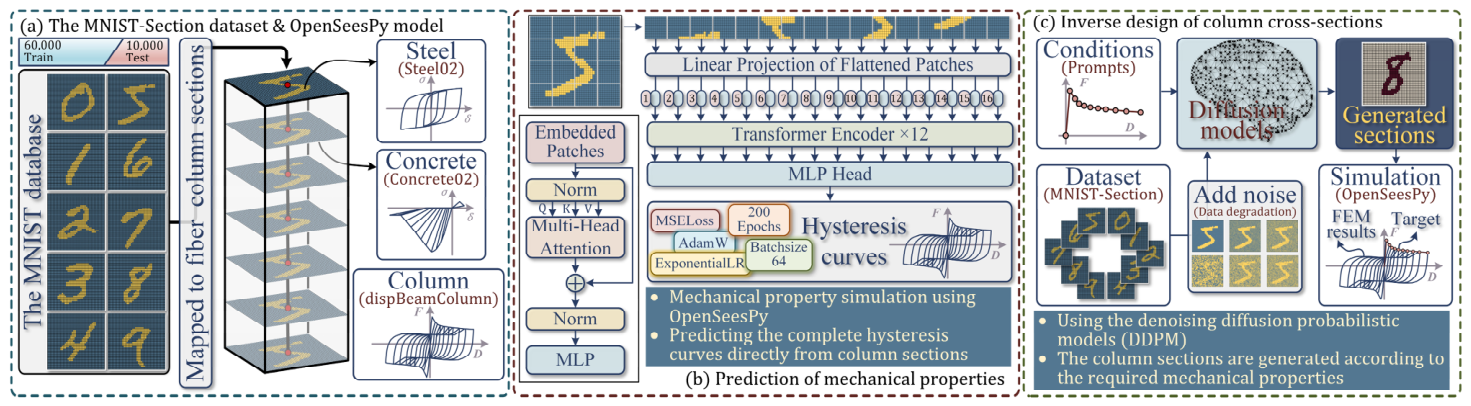
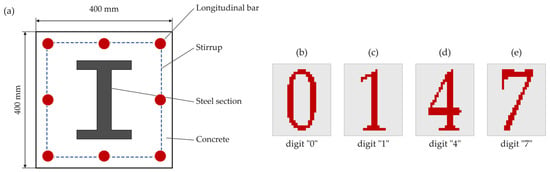
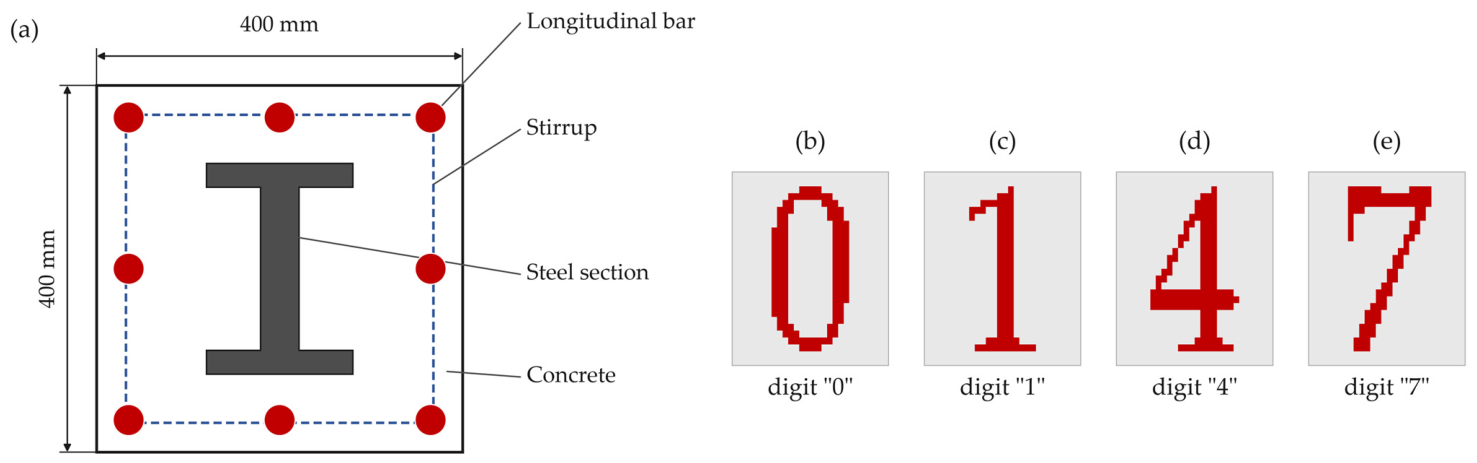
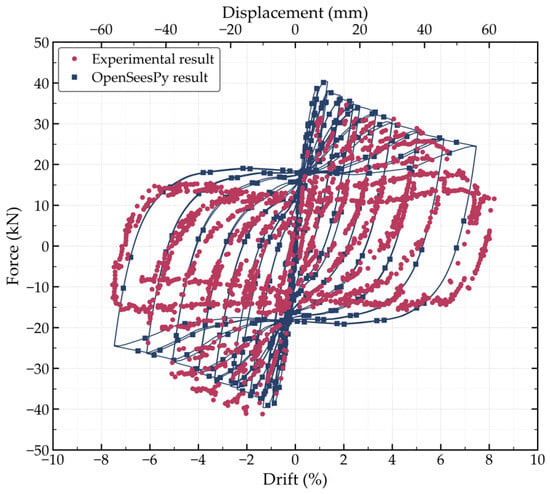
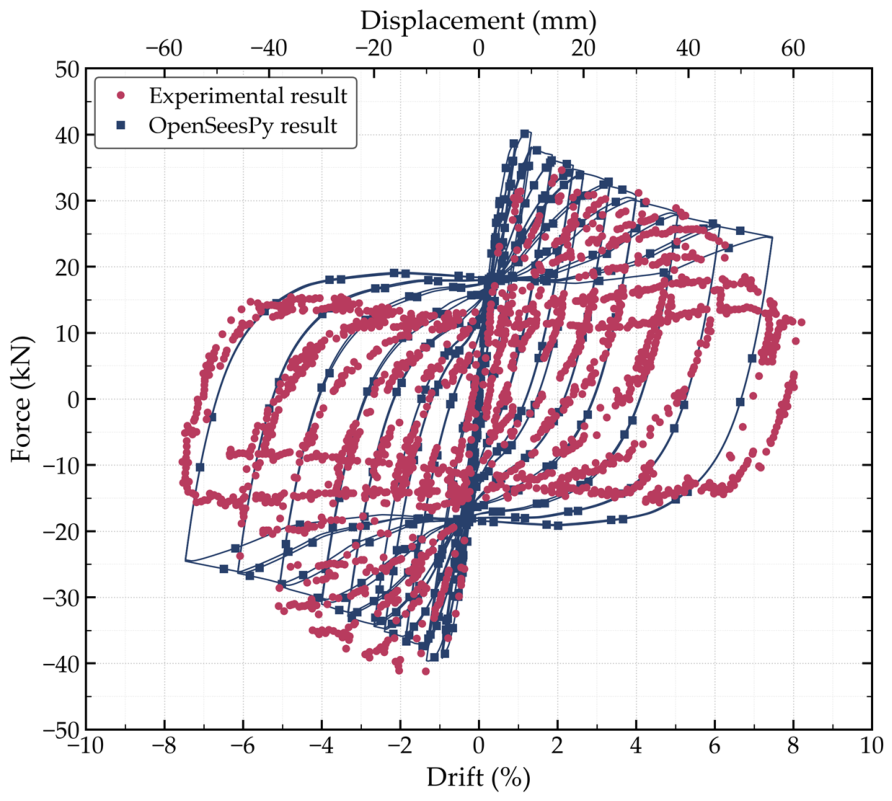
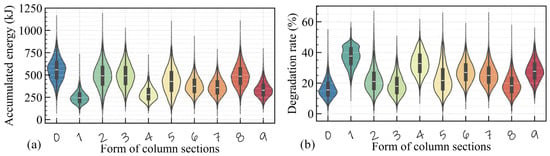
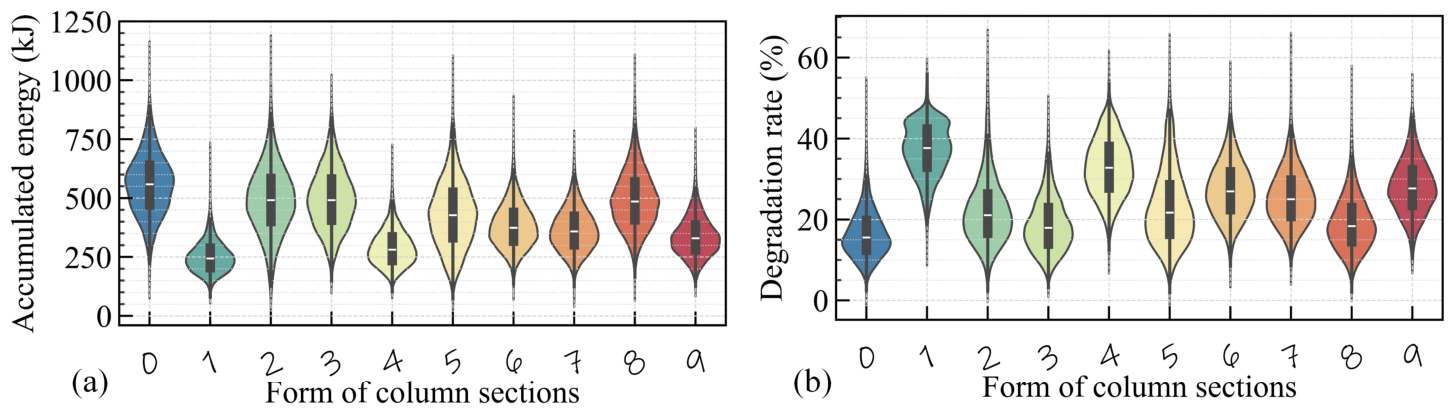
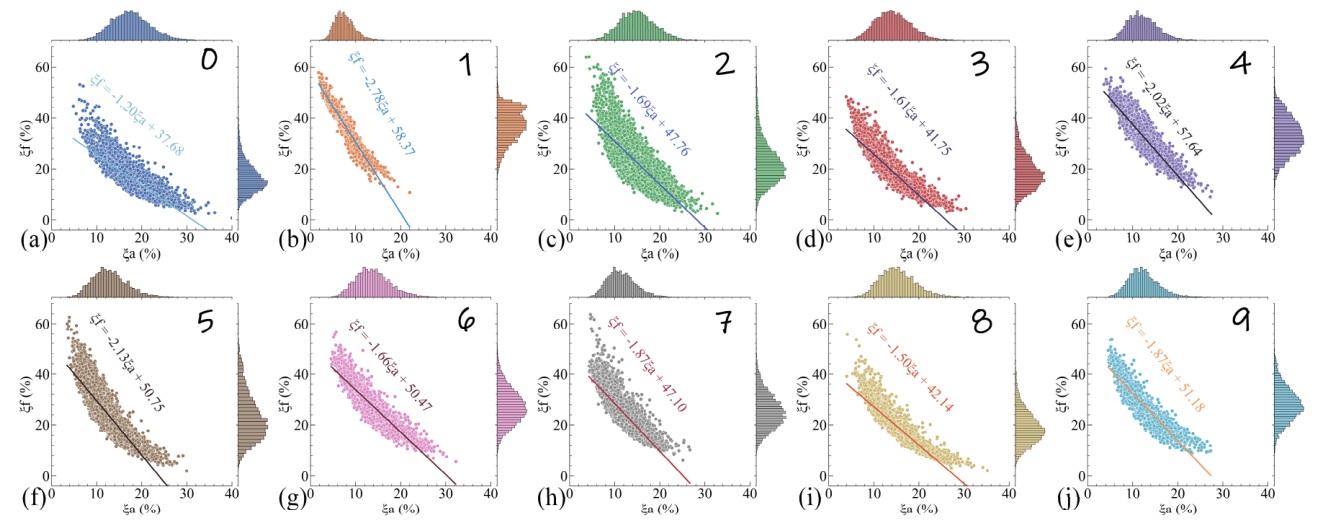
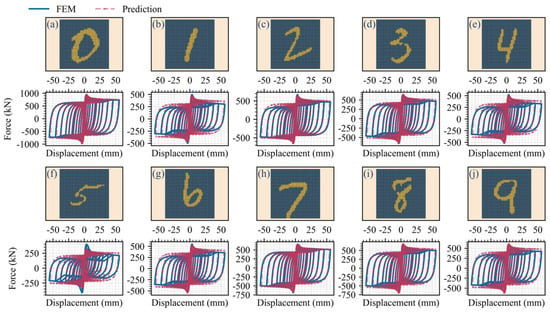
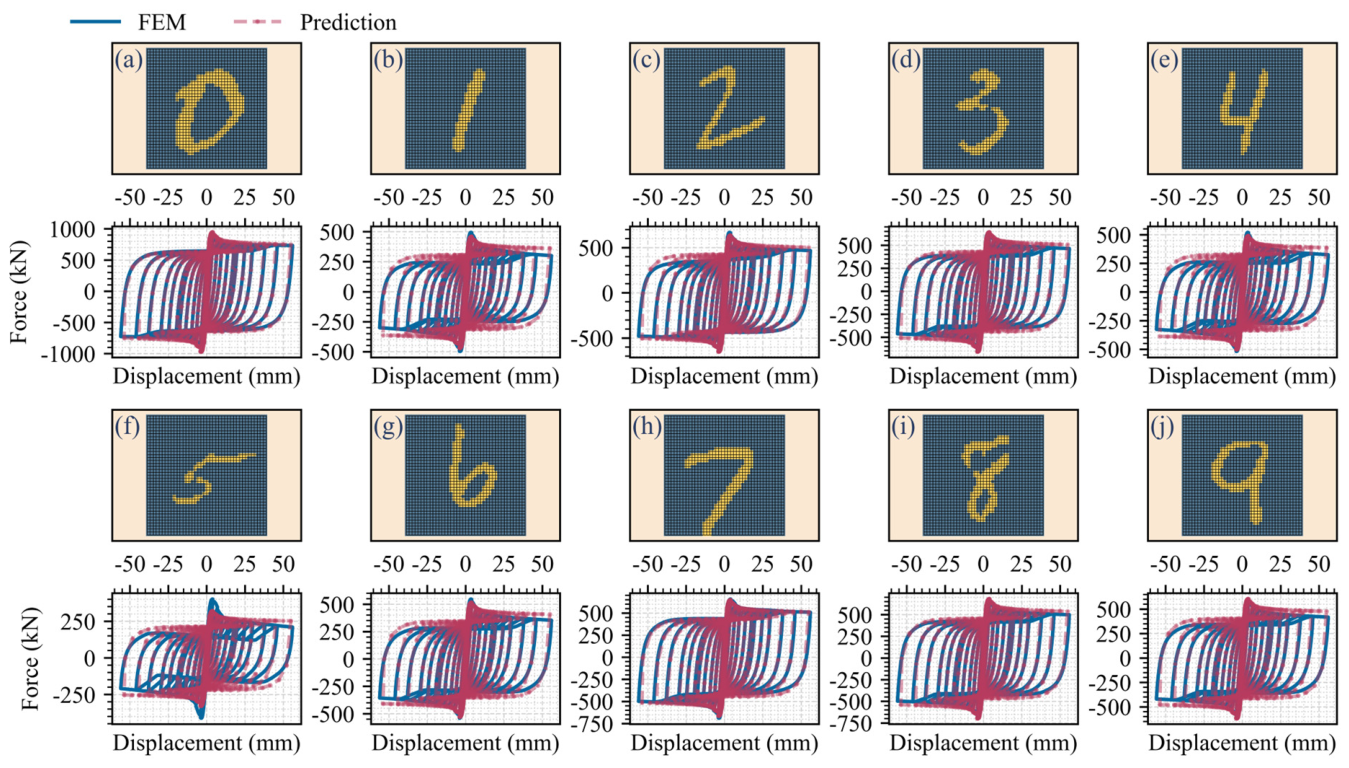
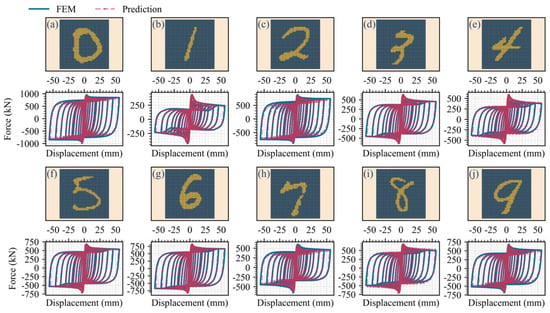
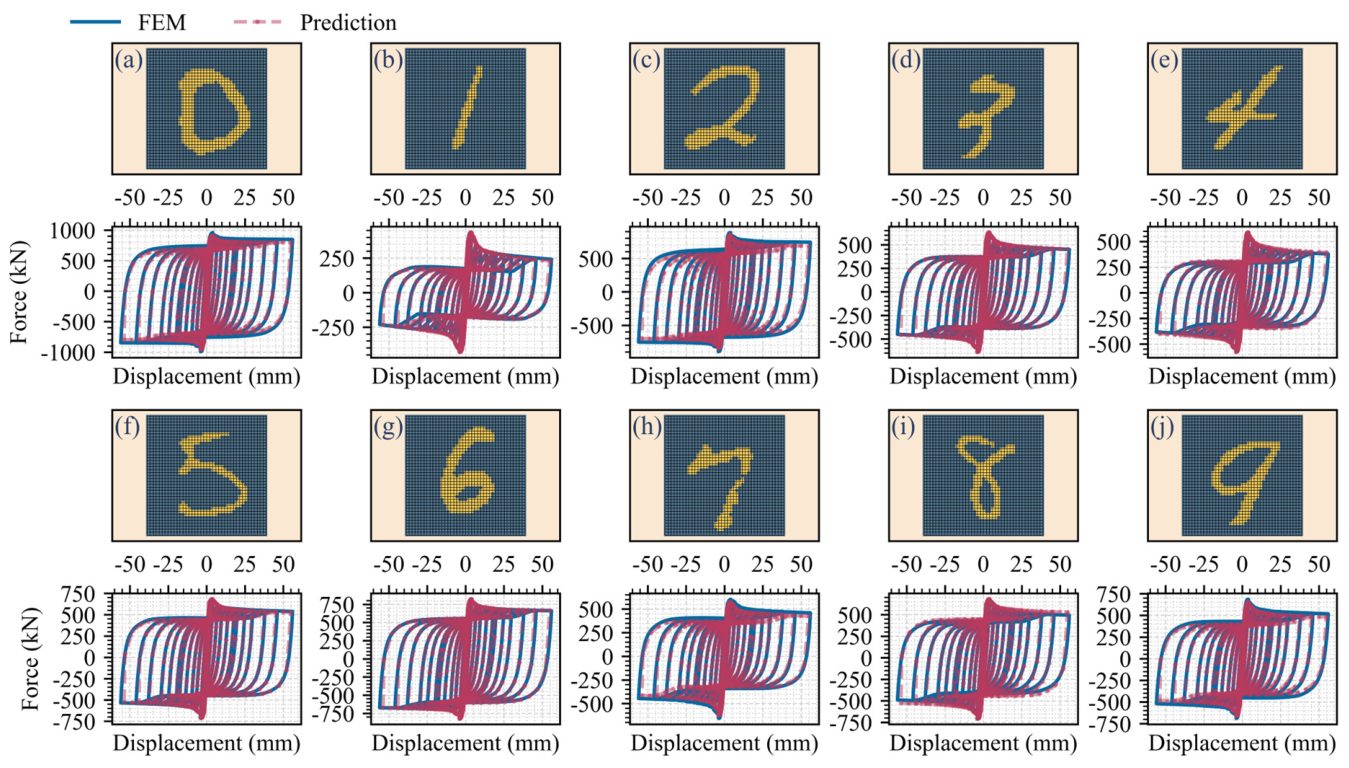
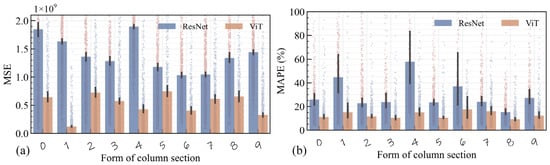
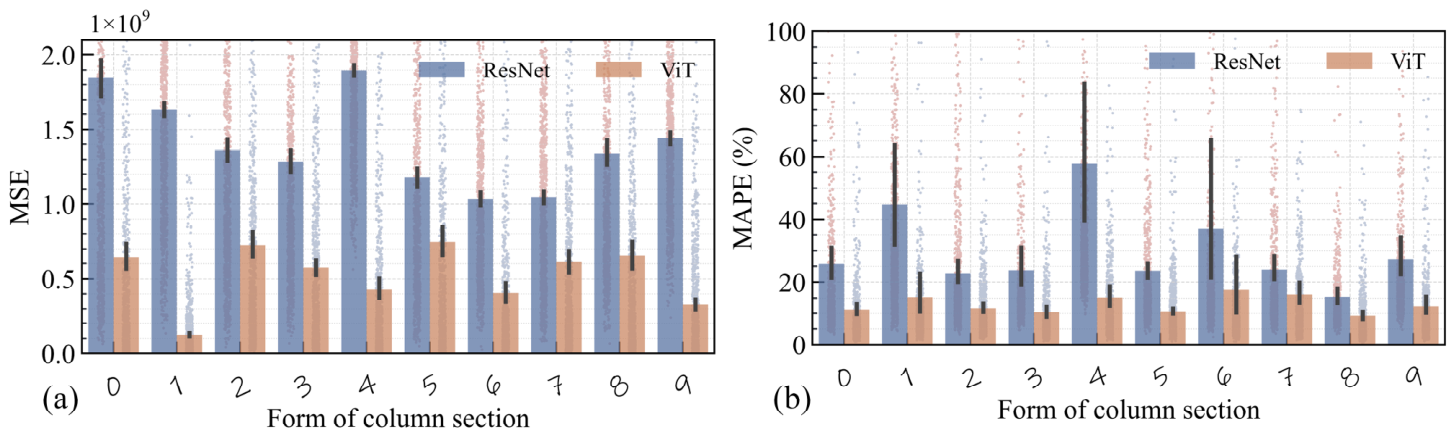
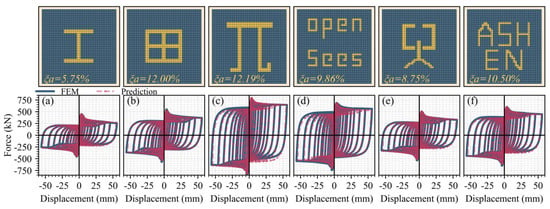
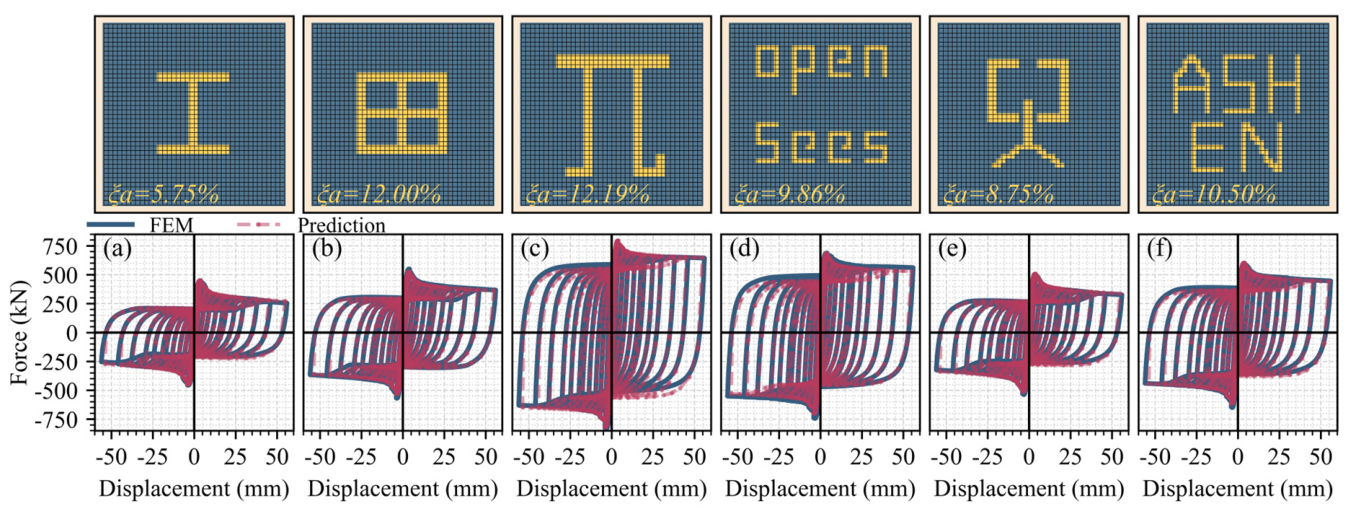
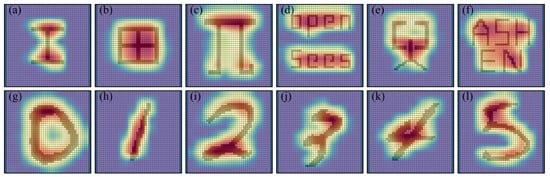
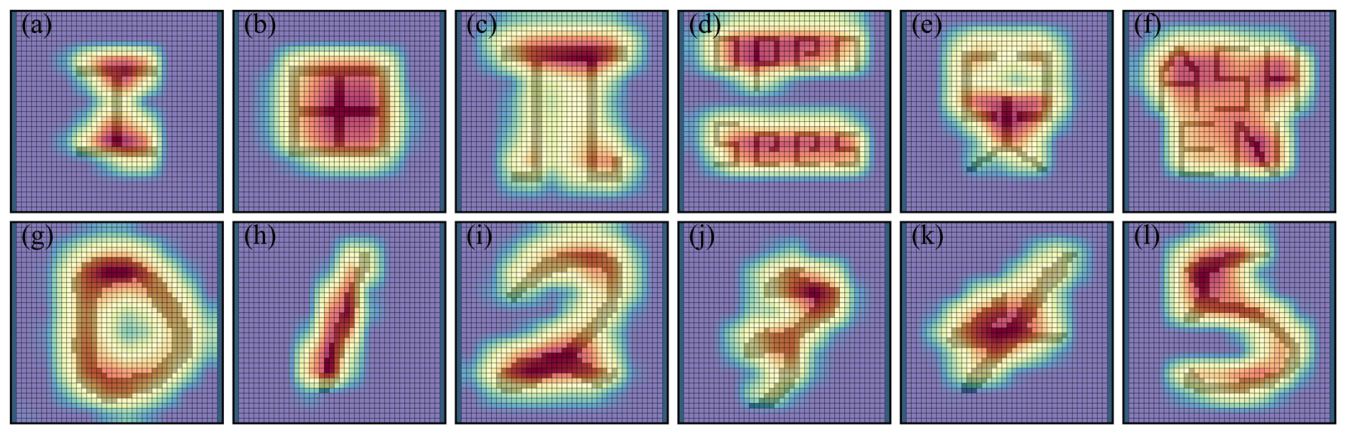


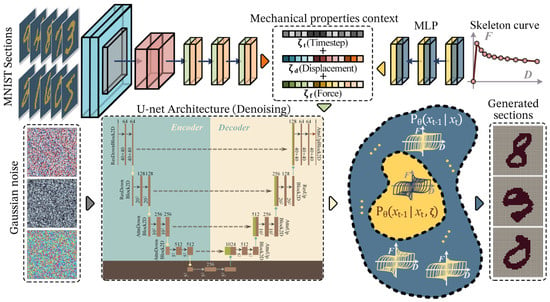
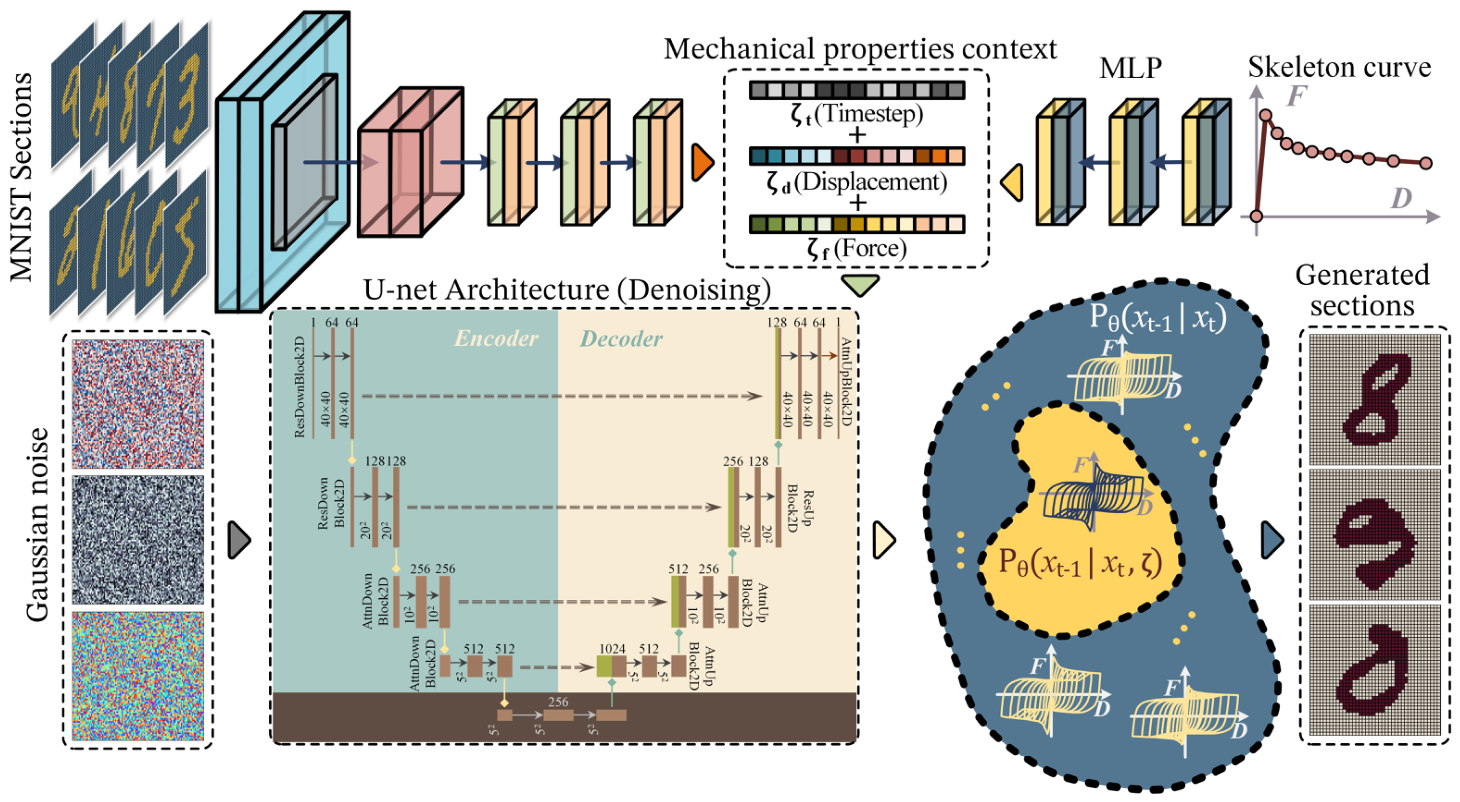
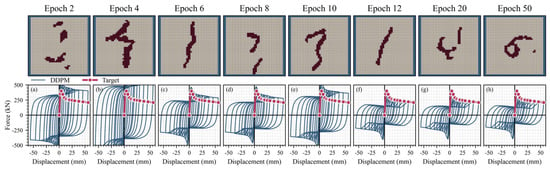
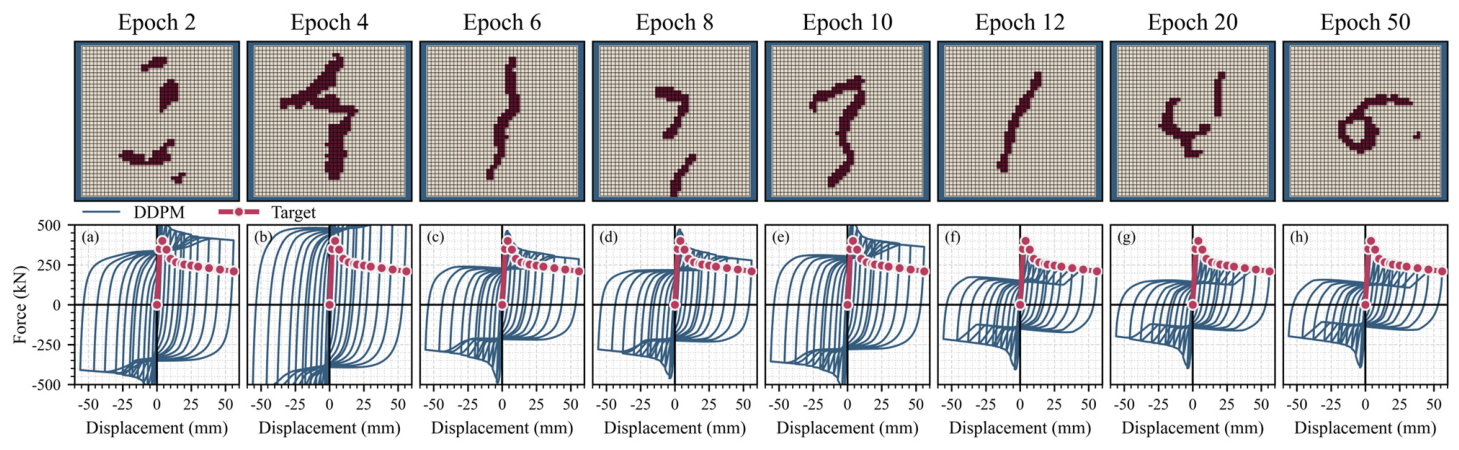
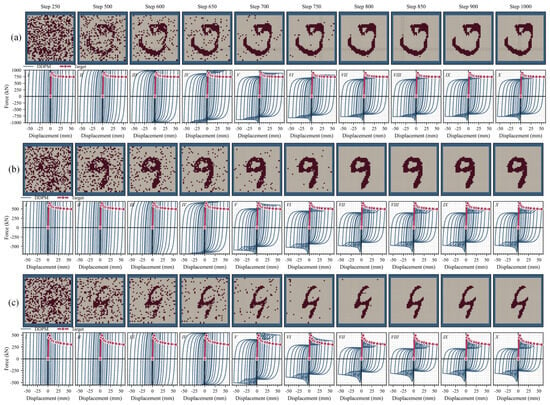
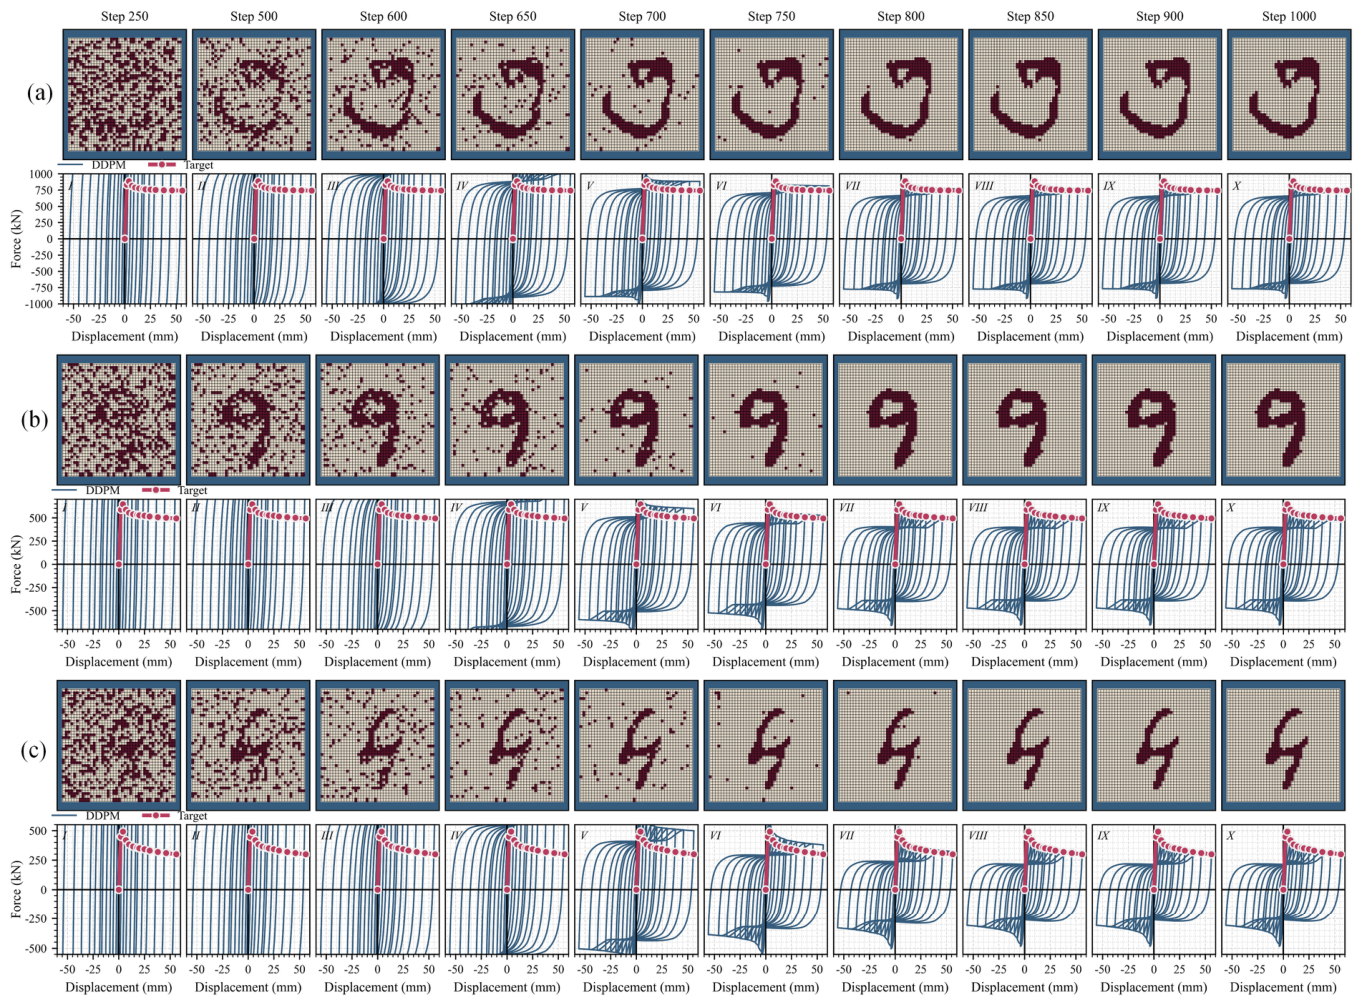
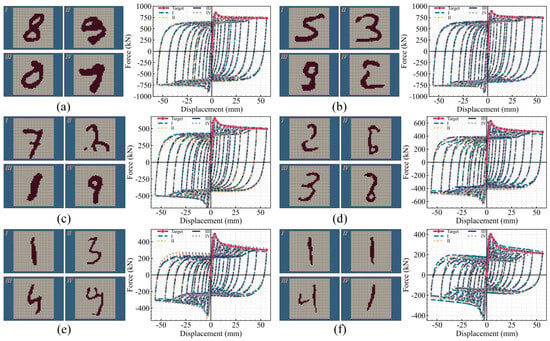
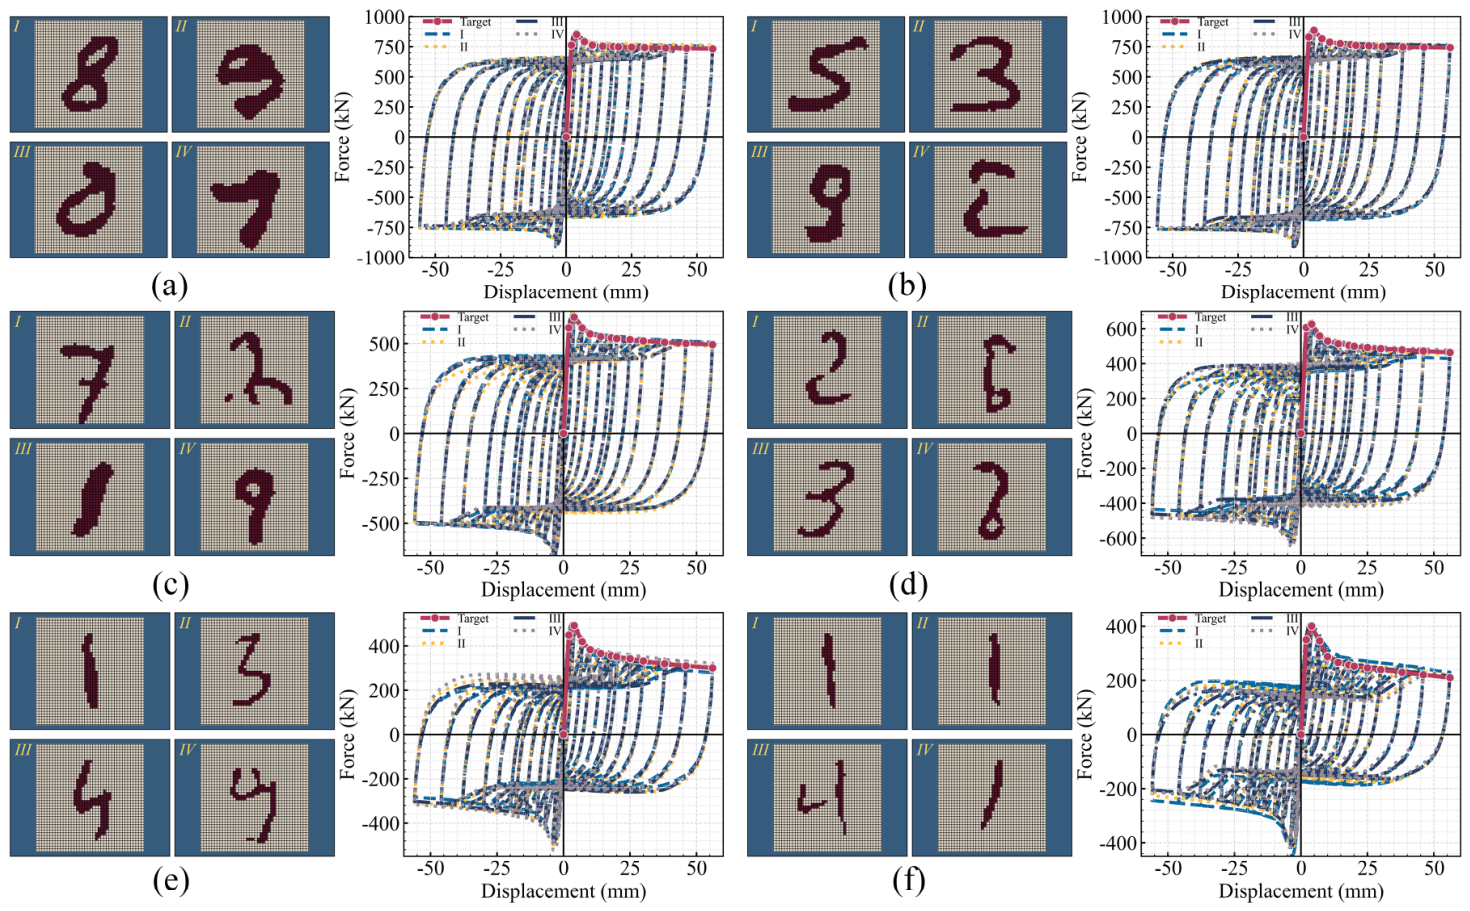
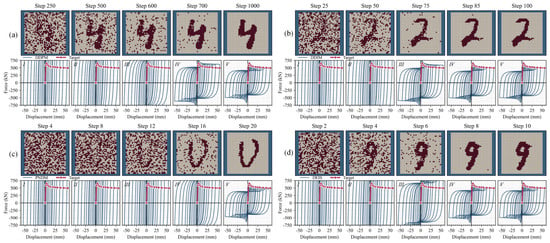
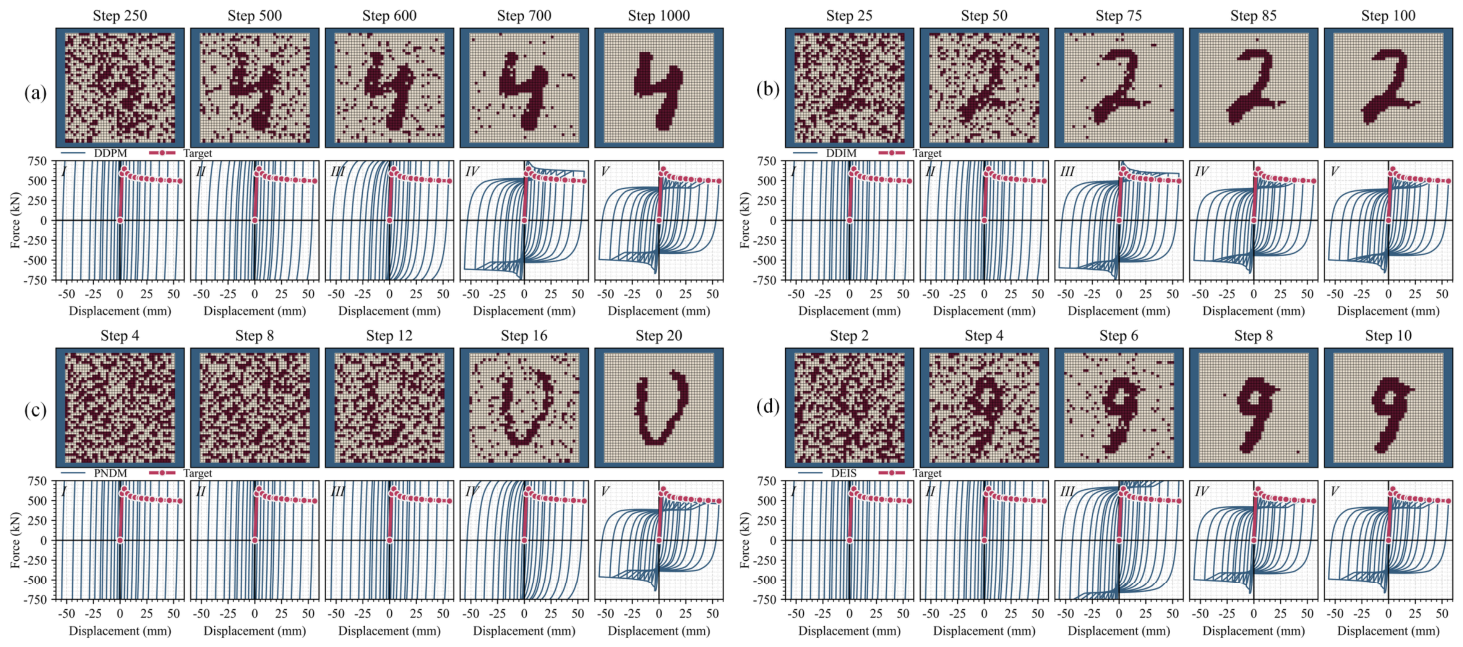
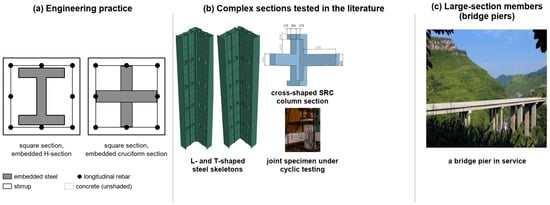
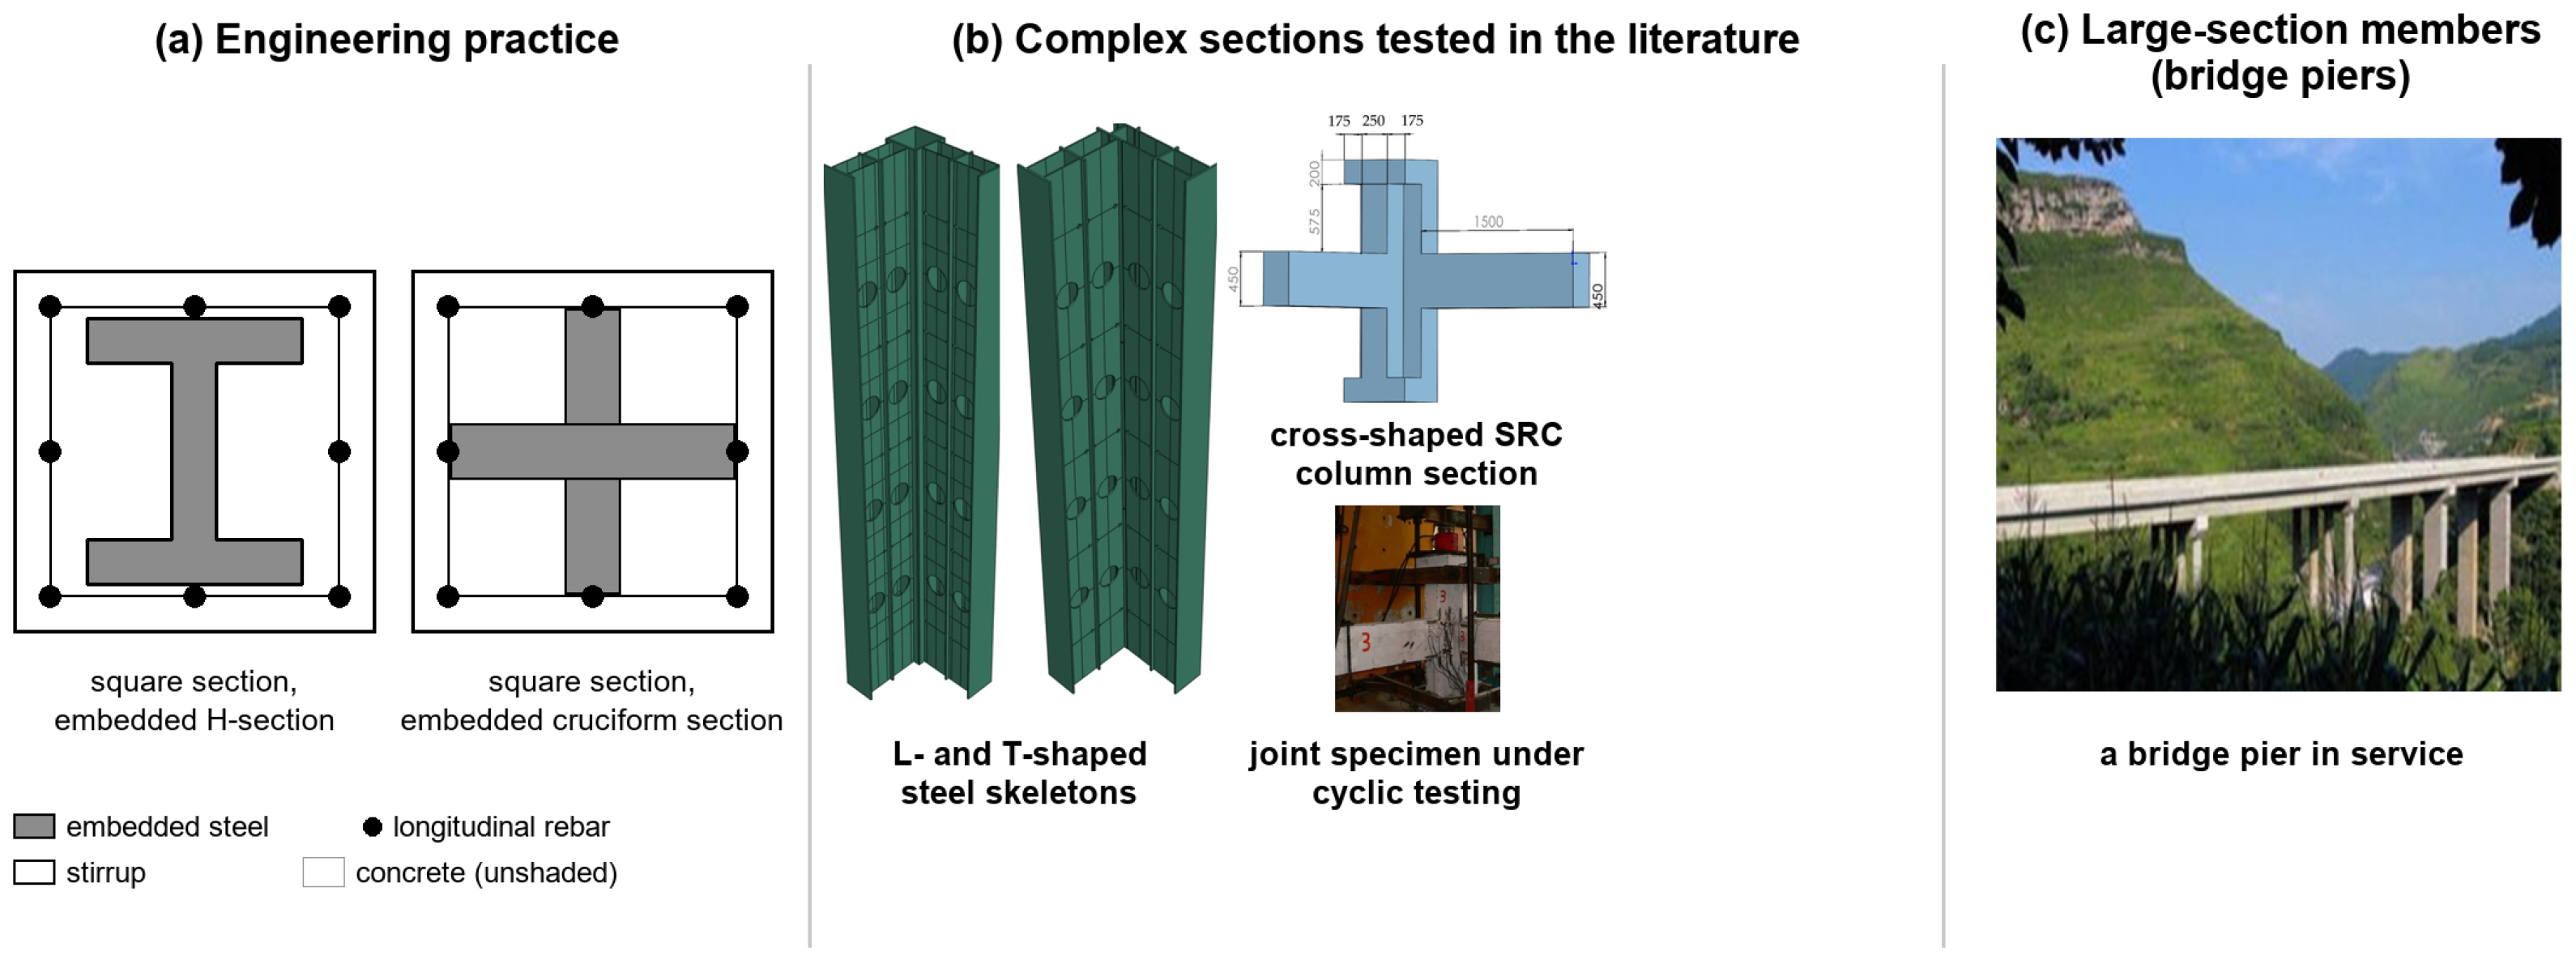
Disclaimer/Publisher’s Note: The statements, opinions and data contained in all publications are solely those of the individual author(s) and contributor(s) and not of MDPI and/or the editor(s). MDPI and/or the editor(s) disclaim responsibility for any injury to people or property resulting from any ideas, methods, instructions or products referred to in the content. |
© 2026 by the authors. Licensee MDPI, Basel, Switzerland. This article is an open access article distributed under the terms and conditions of the Creative Commons Attribution (CC BY) license.