


Abstract
Irreversible deterioration of internal microstructure in cementitious materials is induced by extreme service environments, which leads to severe degradation of macroscopic fracture properties. In this study, the fracture mechanics behavior of cementitious materials was systematically investigated under benchmark (N), continuous drying (D), extreme high-temperature (H, 400 °C), and rapid freeze–thaw cycle (F25–F100) conditions. By means of mercury intrusion porosimetry (MIP), nanoscratch technology, and backscattered electron (BSE) image segmentation processing, the evolution laws and synergistic damage mechanisms of the porous continuum matrix, aggregate–paste interfacial transition zone (ITZ), and microcrack network were quantitatively revealed. The results show that the macroscopic fracture energy Gf exhibits significant environmental sensitivity and nonlinear decay characteristics; after drying, F100 freeze–thaw, and 400 °C high-temperature exposure, Gf was decreased by 11.1%, 67.2%, and 83.0%, respectively. Microstructural analysis confirms that total porosity Pt is increased and critical pore diameter dcr is coarsened and right-shifted by environmental deterioration; nanoscratch tests reveal that the ITZ is always the lowest energy consumption channel for crack propagation, and its local fracture toughness suffers a catastrophic drop under high-temperature and severe freeze–thaw conditions (down to 0.18 MPa⋅m1/2); the microcrack area ratio C is sharply increased (up to 4.65%), and the distribution morphology is evolved from local dispersion to three-dimensional network bridging. The macroscopic fracture mechanism is thus degraded from three-dimensional matrix shear and aggregate interlocking energy dissipation to two-dimensional debonding and slip along low-resistance interfaces. Based on micro–meso physical mechanisms, a cross-scale synergistic prediction model for fracture energy considering matrix pore volume loss (Pt), microcrack network segmentation (C), and ITZ shear anti-cracking barrier () was established. The prediction desensitization problem of the single porosity index under extreme conditions was accurately eliminated by this model (R2 = 0.984, RMSE = 4.12 N/m), and theoretical support is provided for service life assessment and crack-resistance toughening design of cementitious engineering structures under extreme environments.
1. Introduction
Cementitious materials are widely used in engineering structures such as bridges, roads, and buildings. During long-term service, these materials are inevitably subjected to environmental actions including drying, high temperatures, and freeze–thaw cycles. Consequently, internal pores and microcracks continuously evolve, thereby affecting crack initiation and propagation within the materials. Therefore, compared with traditional strength indicators, parameters such as fracture energy and fracture toughness, which can reflect crack propagation and fracture energy dissipation characteristics, are of great significance for evaluating the crack resistance of cementitious materials. The formation mechanism of concrete fracture energy was investigated by Zeng et al. [1] using a mesoscopic numerical method, and it was pointed out that the internal heterogeneous structure of the material has an important influence on the fracture process. The fracture properties of concrete under dry–wet cycles and sulfate environments were studied by Yin et al. [2], and it was found that environmental media and cyclic actions can significantly alter the fracture parameters of the material.
Different damage mechanisms are induced by different environmental conditions. Dehydration of hydration products, changes in internal pores, and thermal deformation incompatibility between aggregates and paste are caused by high temperatures, leading to the deterioration of fracture properties. The residual fracture energy of natural aggregate and recycled aggregate concrete after high-temperature exposure was studied by Chen et al. [3], and it was observed that high-temperature exposure significantly changed the fracture energy dissipation capacity of the materials. A theoretical model for the fracture properties of concrete under high temperatures was further established by Wan et al. [4], revealing the relationship between temperature rise and the evolution of fracture parameters. Through flexural fracture tests on ultra-high-performance concrete after high-temperature exposure, it was found by He et al. [5] that high temperatures not only reduce the load-bearing capacity of the material, but also alter its load–displacement response and fracture failure characteristics.
Crack development is primarily promoted during freeze–thaw actions by the frost heave pressure generated from the freezing of pore water and the damage accumulation caused by repeated freeze–thaw cycles. The degree of freeze–thaw damage was evaluated by Kucharczyková et al. [6] using fracture tests, proving that fracture parameters can sensitively reflect internal damage induced by freeze–thaw cycles. The influence of freeze–thaw cycles on the mixed-mode I–II fracture behavior of concrete was further investigated by Fan et al. [7], and it was found that the crack propagation process is distinctly altered by freeze–thaw damage. Fracture tests after freeze–thaw cycles were carried out by Yu et al. [8] for high-performance concrete, further revealing the evolutionary relationship between the number of freeze–thaw cycles and fracture mechanics parameters. A fracture toughness testing method for shotcrete after freeze–thaw cycles was proposed by Han et al. [9], demonstrating that fracture mechanics indicators possess good applicability in the evaluation of freeze–thaw damage. Relevant studies have also shown that the degradation of concrete fracture properties is further accelerated by salt–frost environments, and the damage degree shows certain differences from that under ordinary freeze–thaw environments [10].
The variation in macroscopic fracture properties induced by environmental actions is essentially related to the evolution of internal pore structures within the material. A multiscale model for the tensile strength of cement paste was established by Song et al. [11] based on pore size distribution, and it was pointed out that pore scale and its distribution exert an important influence on material failure. Through relevant three-dimensional characterization studies, it was further found that the internal pores of cement paste exhibit distinct spatial heterogeneity and connectivity features, and their structural changes affect the localized damage behavior of the material [12]. Studies on foamed cement paste also indicate that the internal structural characteristics and mechanical properties of the material are jointly determined by pores at different scales [13]. Therefore, the variations in pore structure under environmental actions may be insufficiently reflected if only the total porosity is employed to describe internal defects, and further analysis combined with critical pore sizes and pore size distributions is required.
The generation and development of microcracks are usually accompanied by variations in pore structure. It has been shown by existing studies that microcracks serve as an important intermediate link connecting microstructural damage with macroscopic fracture failure. In studies on engineered cementitious composites, it was found that the quantity, area, and spatial distribution of microcracks can be effectively characterized by microscopic imaging combined with image analysis [14]. Micro-CT investigations further proved that a distinct correlation exists between internal microcracks and pore structures in cement mortar, and new connected defects can be formed by the development of microcracks [15]. In research on drying effects, it was found that microcrack distributions with obvious spatial discrepancies are induced by moisture migration and shrinkage deformation [16]. In addition, the shrinkage and microcrack formation processes in cementitious materials are also affected by changes in drying rate [17]. It can thus be seen that the variation in fracture properties of materials under environmental actions may be jointly controlled by pore evolution and microcrack development.
In addition to pores and microcracks, the interfacial transition zone (ITZ) is also an important weak region within cementitious materials. Due to bleeding, particle packing, and non-uniform distribution of hydration products, higher porosity and lower local mechanical properties are typically exhibited by the ITZ. It was found by Shen et al. [18] that a certain number of initial microcracks may already exist in the concrete ITZ before loading, providing potential paths for subsequent crack propagation. The effects of cement fineness and water–cement ratio on ITZ thickness, porosity, and mechanical properties were further investigated by Korouzhdeh et al. [19], proving that a close relationship exists between ITZ microstructure and macroscopic properties of materials. A systematic review on the concrete ITZ was conducted by Chen et al. [20], where it was pointed out that the physical characteristics and mechanical properties of the ITZ are closely related to crack initiation and propagation.
In recent years, new approaches for the characterization of local ITZ properties have been provided by the development of micro- and nanomechanical testing techniques. The local mechanical characteristics of the ITZ in fly ash-based geopolymers were investigated by Li et al. [21] using nanoscratch testing, demonstrating that the local mechanical response of the interfacial region can be effectively obtained by nanoscratch techniques. Distinct spatial heterogeneity is exhibited by the ITZ according to relevant nanoscale studies, and significant discrepancies exist between its local properties and the surrounding cement matrix [22]. It was further found in subsequent studies that the mechanical properties of the ITZ are influenced by its thickness, porosity, and spatial location [23], while the evolution of the ITZ microstructure under different preparation conditions also leads to noticeable changes in local properties [24,25]. These studies indicate that the local properties of the ITZ provide essential information for understanding the microscopic damage mechanisms of cementitious materials; however, investigations regarding the variation in local fracture properties of the ITZ after environmental actions remain relatively limited.
To predict macroscopic fracture behavior under environmental actions, diverse multiscale modeling approaches have been developed; however, existing frameworks exhibit fundamental limitations when applied across normal and extreme environments. On the one hand, conventional formulations predominantly rely on porosity-based phenomenological relations (e.g., exponential Ryshkewitch-type laws) or continuum micromechanical homogenization (such as Mori–Tanaka schemes), which treat internal defects as uniformly dispersed voids within an idealized porous matrix. While these models reasonably capture modulus and strength degradation under moderate conditions, they encounter a severe prediction desensitization problem under extreme thermal or frost damage regimes. Specifically, concrete specimens exhibiting nearly identical bulk porosities (Pt) can display a two-fold difference in residual fracture energy (e.g., severe freeze–thaw cycles versus extreme high-temperature). This major discrepancy arises because bulk porosity reflects solely the volumetric loss of the load-bearing solid skeleton, ignoring directional crack percolation and the vulnerability of interfacial transition zones. On the other hand, discrete crack damage formulations incorporate microcrack density or area fractions (C) to represent geometric defect connectivity, but they typically presume a uniform matrix fracture toughness and overlook the catastrophic degradation along aggregate–paste interfaces. Furthermore, localized ITZ nanomechanical measurements have predominantly remained isolated micro-scale characterizations without being analytically coupled into macroscopic closed-form fracture energy formulations.
What remains fundamentally unresolved in the existing literature is that neither bulk porosity (Pt), microcrack network density (C), nor interfacial toughness () acting in isolation can describe the macroscopic shift in energy dissipation pathways. In aggressive service environments, macroscopic fracture is governed by a cross-scale competitive process: whether cracks propagate via high-energy three-dimensional tortuous deflection and aggregate interlocking through the matrix, or degenerate into low-energy two-dimensional debonding and slip along compliant interfaces. A unified predictive framework that simultaneously couples these three distinct microstructural mechanisms remains largely unexplored.
To address these unresolved issues, this study establishes a cross-scale analytical framework that simultaneously incorporates matrix pore volume deficit (Pt), microcrack network geometric segmentation (C), and interfacial crack-arrest toughness (). Four representative environmental regimes—standard baseline curing (N), continuous drying (D), extreme high-temperature (H, 400 °C), and rapid freeze–thaw cycles (F25–F100)—were established. Three-point bending (TPB) fracture tests were performed on notched beams to quantify full-process load–displacement responses and macroscopic fracture energy (Gf). Mercury intrusion porosimetry (MIP), backscattered electron (BSE) image segmentation, and nanoscratch testing were systematically deployed to capture the co-evolution of pore structures, microcrack networks, and localized ITZ fracture toughness. On this basis, a cross-scale synergistic predictive model for fracture energy was established. This formulation effectively eliminates the prediction desensitization inherent to single-porosity indicators, elucidating the microscopic control mechanisms that govern the fracture degradation of cementitious materials under normal and extreme environments.
2. Materials and Experimental Methods
2.1. Materials and Mix Proportions
2.1.1. Materials
Ordinary Portland cement (P·O 42.5 grade, conforming to Chinese Standard GB 175-2023, manufactured by Anhui Conch Cement Co., Ltd., Wuhu, China) produced from the same batch was used in the experiments, and its chemical composition is shown in Table 1. Natural river sand was selected as the fine aggregate, and continuously graded crushed basalt stone with a particle size range of 4.75–16.0 mm was adopted as the coarse aggregate, which both supplied by Zhejiang Communications Resources Investment Group Co., Ltd. (Hangzhou, China). Prior to testing, both coarse and fine aggregates were dried in a blast drying oven at 105 ± 5 °C for 24 h to constant weight, so that the interference of the initial moisture content of aggregates on the actual water-to-binder ratio was eliminated; the main physical properties of the aggregates are listed in Table 2.
Table 1.
Chemical composition and physical properties of cement.
Table 2.
Properties of fine and coarse aggregates.
2.1.2. Mix Proportions and Specimen Preparation
To clarify the control mechanisms of microstructural evolution induced by environmental actions on macroscopic fracture properties, and to eliminate the nonlinear effects caused by the coupling of multiple mix-proportion parameters, a single fixed mix proportion was adopted in the tests, with a fixed water-to-binder ratio (w/b) of 0.45 and a sand ratio of 38%. The benchmark mix proportion is shown in Table 3.
Table 3.
Mix proportions and 28-day mechanical properties of concrete.
The fresh concrete was cast into high-precision steel molds, and two main types of specimens were prepared:
Three-point bending (TPB) fracture toughness test specimens: 100 mm × 100 mm × 400 mm prismatic beams;
Basic mechanical property calibration specimens: 100 mm × 100 mm × 100 mm standard cubic specimens (used for compressive and splitting tensile strength tests).
After vibrating and casting, the surface was covered with polyethylene film to prevent early plastic shrinkage cracking, and the specimens were left at room temperature for 24 h prior to demolding. After demolding, all specimens were transferred to a standard curing room (temperature 20 ± 2 °C, relative humidity RH ≥ 95%) and cured up to an age of 28 d, after which predetermined environmental exposure damage tests were carried out for different groups.
2.2. Environmental Exposure Conditions
To systematically compare the degradation effects of normal and extreme environments on the microstructure and macroscopic fracture properties of cementitious materials, all specimens standardly cured up to an age of 28 d were allocated into four environmental exposure condition groups: benchmark group (Group N), continuous drying group (Group D), extreme high-temperature group (Group H), and rapid freeze–thaw cycle group (Group F).
After completing the initial 28 d curing, specimens in the benchmark group were continuously retained in a constant temperature and humidity chamber at 20 ± 2 °C and relative humidity RH ≥ 95% until testing, serving as an intrinsic control without significant environmental stress damage. Specimens in the continuous drying group were continuously exposed to an environment with a temperature of 20 ± 2 °C and RH = 50 ± 3% for 28 d to simulate drying shrinkage cracking and local tensile stress damage induced by the continuous loss of capillary water from the matrix. For the extreme high-temperature group, the target temperature was set at 400 °C (this temperature range covers key chemical transformation phases involving the complete removal of adsorbed/interlayer water and the dehydration decomposition of calcium hydroxide); a slow heating rate of 5 °C/min was adopted using an intelligent programmable box-type resistance furnace (Model SX2-12-16TP, Shanghai Shiyan Electric Furnace Co., Ltd., Shanghai, China) to prevent spalling from excessive thermal shock, and the specimens were naturally cooled to room temperature inside the furnace after being held at the target temperature for 3 h. Rapid freeze–thaw cycles with a period of 3.5 ± 0.5 h were conducted in a water medium for the rapid freeze–thaw cycle group (the specimen center temperature was alternated back and forth between −18 ± 2 °C and 5 ± 2 °C); to capture the nonlinear accumulation characteristics of damage at different evolutionary stages, the freeze–thaw group was subdivided into gradient cycle nodes of 25, 50, 75, and 100 cycles (denoted as F25, F50, F75, and F100), thereby constructing damage gradient samples of pore coarsening, interface weakening, and crack evolution. The specific environmental exposure parameters and groupings are presented in Table 4.
Table 4.
Detailed environmental exposure conditions and degradation regimes for concrete specimens.
2.3. Fracture Test
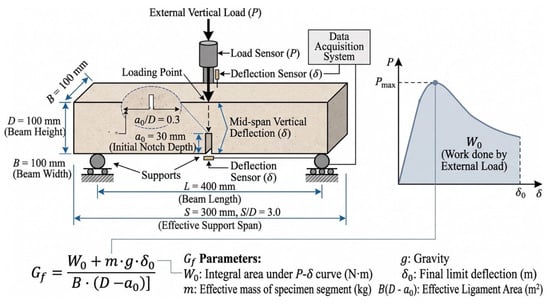
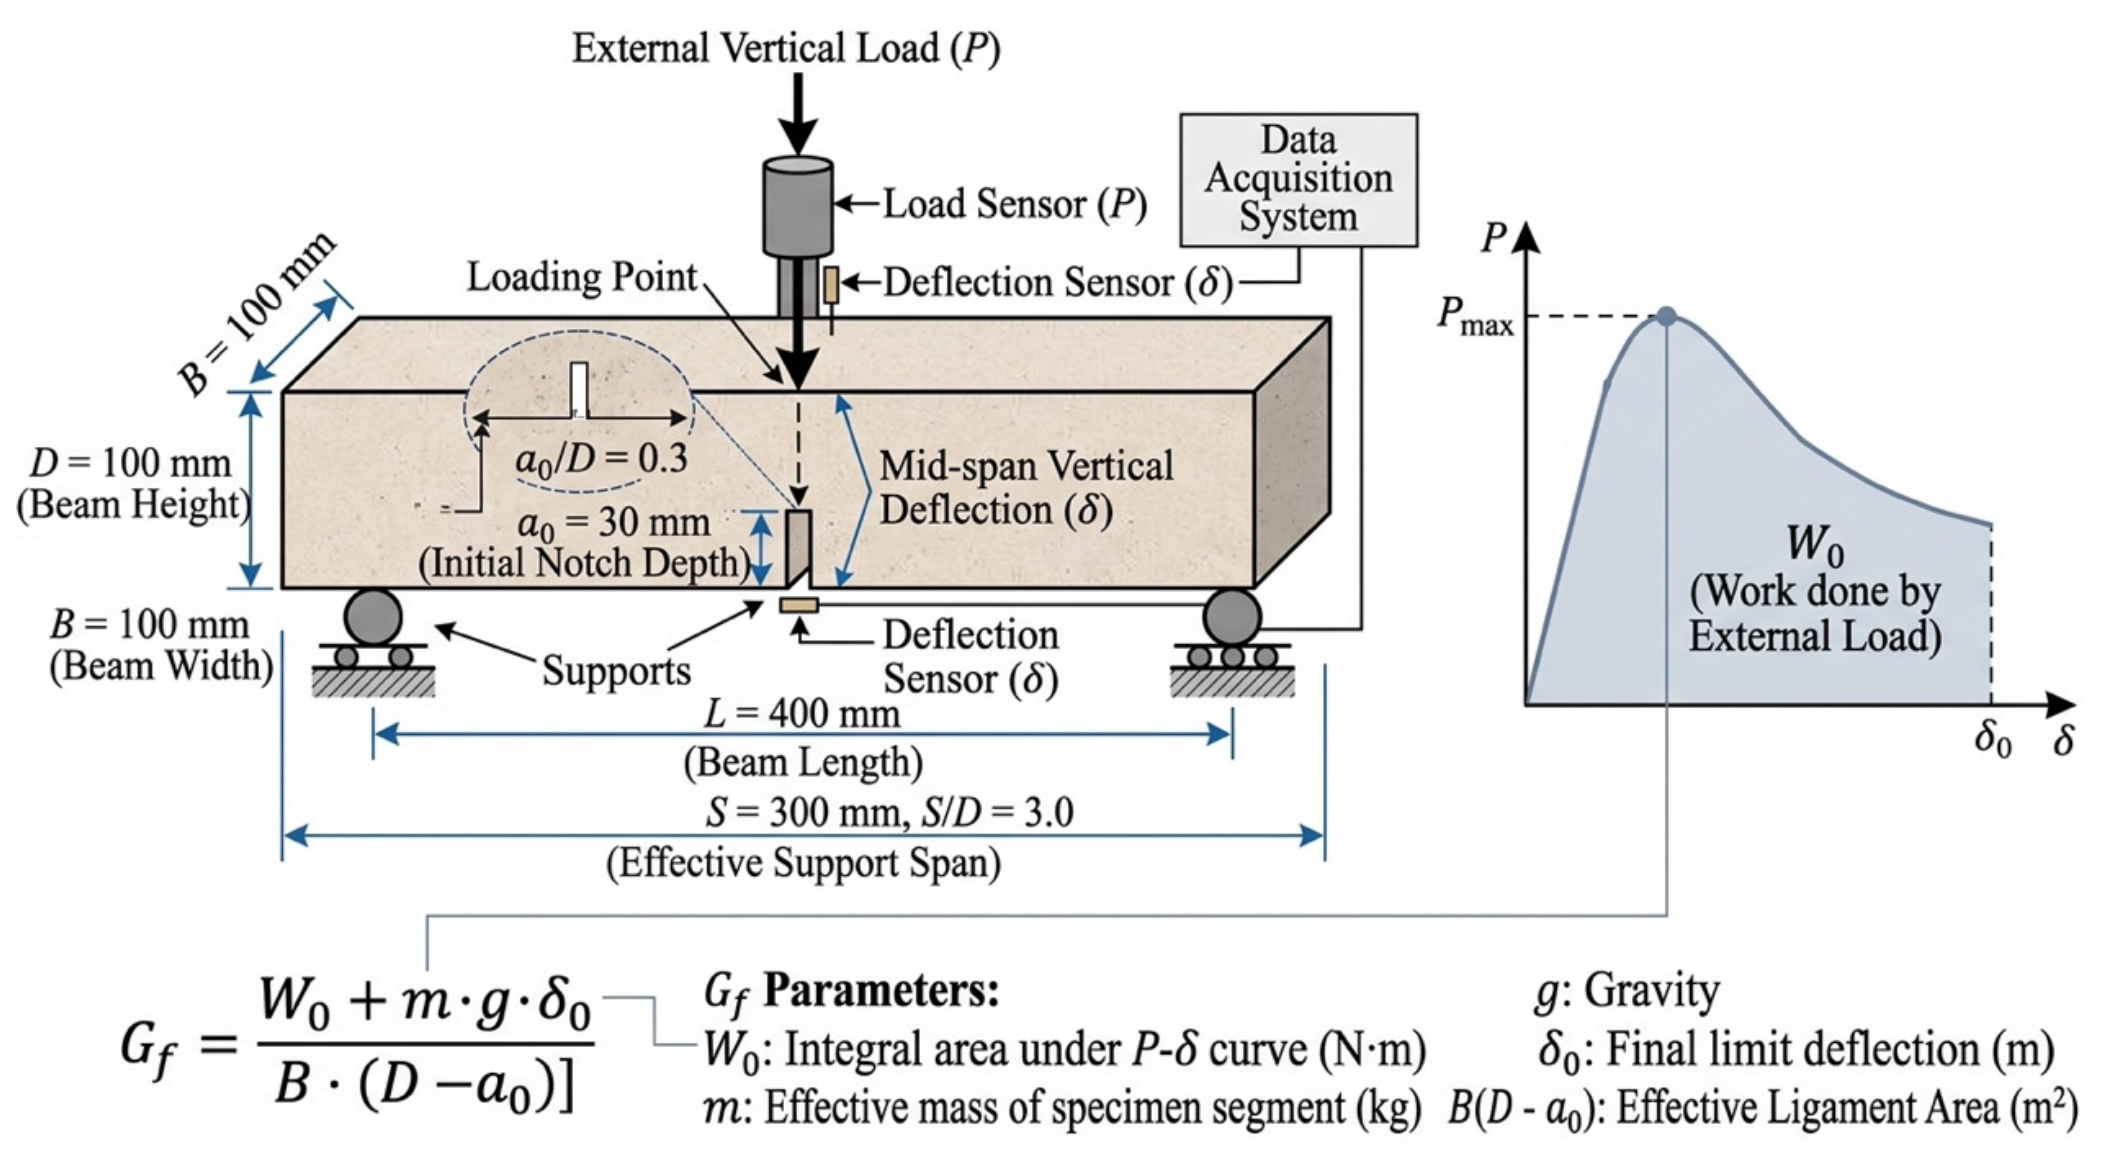
The three-point bending (TPB) test on notched beams was adopted for macroscopic fracture testing. The specimen dimensions were 100 mm × 100 mm × 400 mm, with an effective span of S = 300 mm. After conditioning under each exposure scenario, an initial notch with a depth of a0 = 30 mm (notch-to-depth ratio a0/D = 0.3) and a width of approximately 2.0 mm was cut at the bottom of the midspan, as shown in Figure 1. Displacement control at a loading rate of 0.05 mm/min was employed during the test using a closed-loop servo-hydraulic universal testing machine (MTS Landmark 370.10, MTS Systems Corporation, Eden Prairie, MN, USA), and the complete curve of load P versus midspan deflection Δ was recorded in real time via high-precision load sensors and linear variable differential transformers (LVDTs). Four specimens were tested in each group to obtain the average value.
Figure 1.
Schematic diagram of notched beam geometry and three-point bending (TPB) test setup.
The fracture energy Gf was calculated according to the following equation:
where W0 is the integral area under the P−Δ curve; m is the equivalent mass of the beam segment between the two supports; g is the acceleration of gravity (9.81 m/s2); Δ0 is the ultimate deflection; and B(D − a0) is the initial ligament cross-sectional area. The peak load Pmax and fracture energy Gf were thereby obtained.
2.4. MIP and SEM Characterization
Pore structure characteristics were determined using a mercury intrusion porosimeter (MIP, AutoPore IV 9500, Micromeritics Instrument Corporation, Norcross, GA, USA). After the completion of fracture testing, regular core blocks of approximately 5 mm × 5 mm × 5 mm were cut from the central region near the fracture surfaces of the beam specimens in each group. The specimens were immediately immersed in anhydrous ethanol for 48 h to terminate hydration, and subsequently dried to constant weight in a vacuum drying oven at 60 °C. The maximum mercury intrusion pressure was 414 MPa, covering a measurable pore size range of 3 nm to 360 μm, from which the total porosity Pt, critical pore diameter dcr, and full pore size distribution evolution curves of the materials under each environmental condition were obtained.
Microscopic phase identification, damaged morphology observation, and microcrack evolution characteristics of the materials were characterized using a field-emission scanning electron microscope (FE-SEM, GeminiSEM 300, Carl Zeiss AG, Oberkochen, Germany) equipped with a backscattered electron (BSE) detector, which were also employed for region-of-interest positioning and scratch path morphology re-examination in nanoscratch testing. During testing, the electron accelerating voltage was set to 15 kV, and the working distance was maintained at 10 mm.
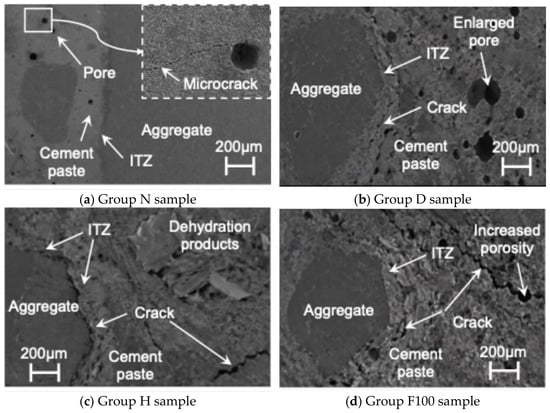
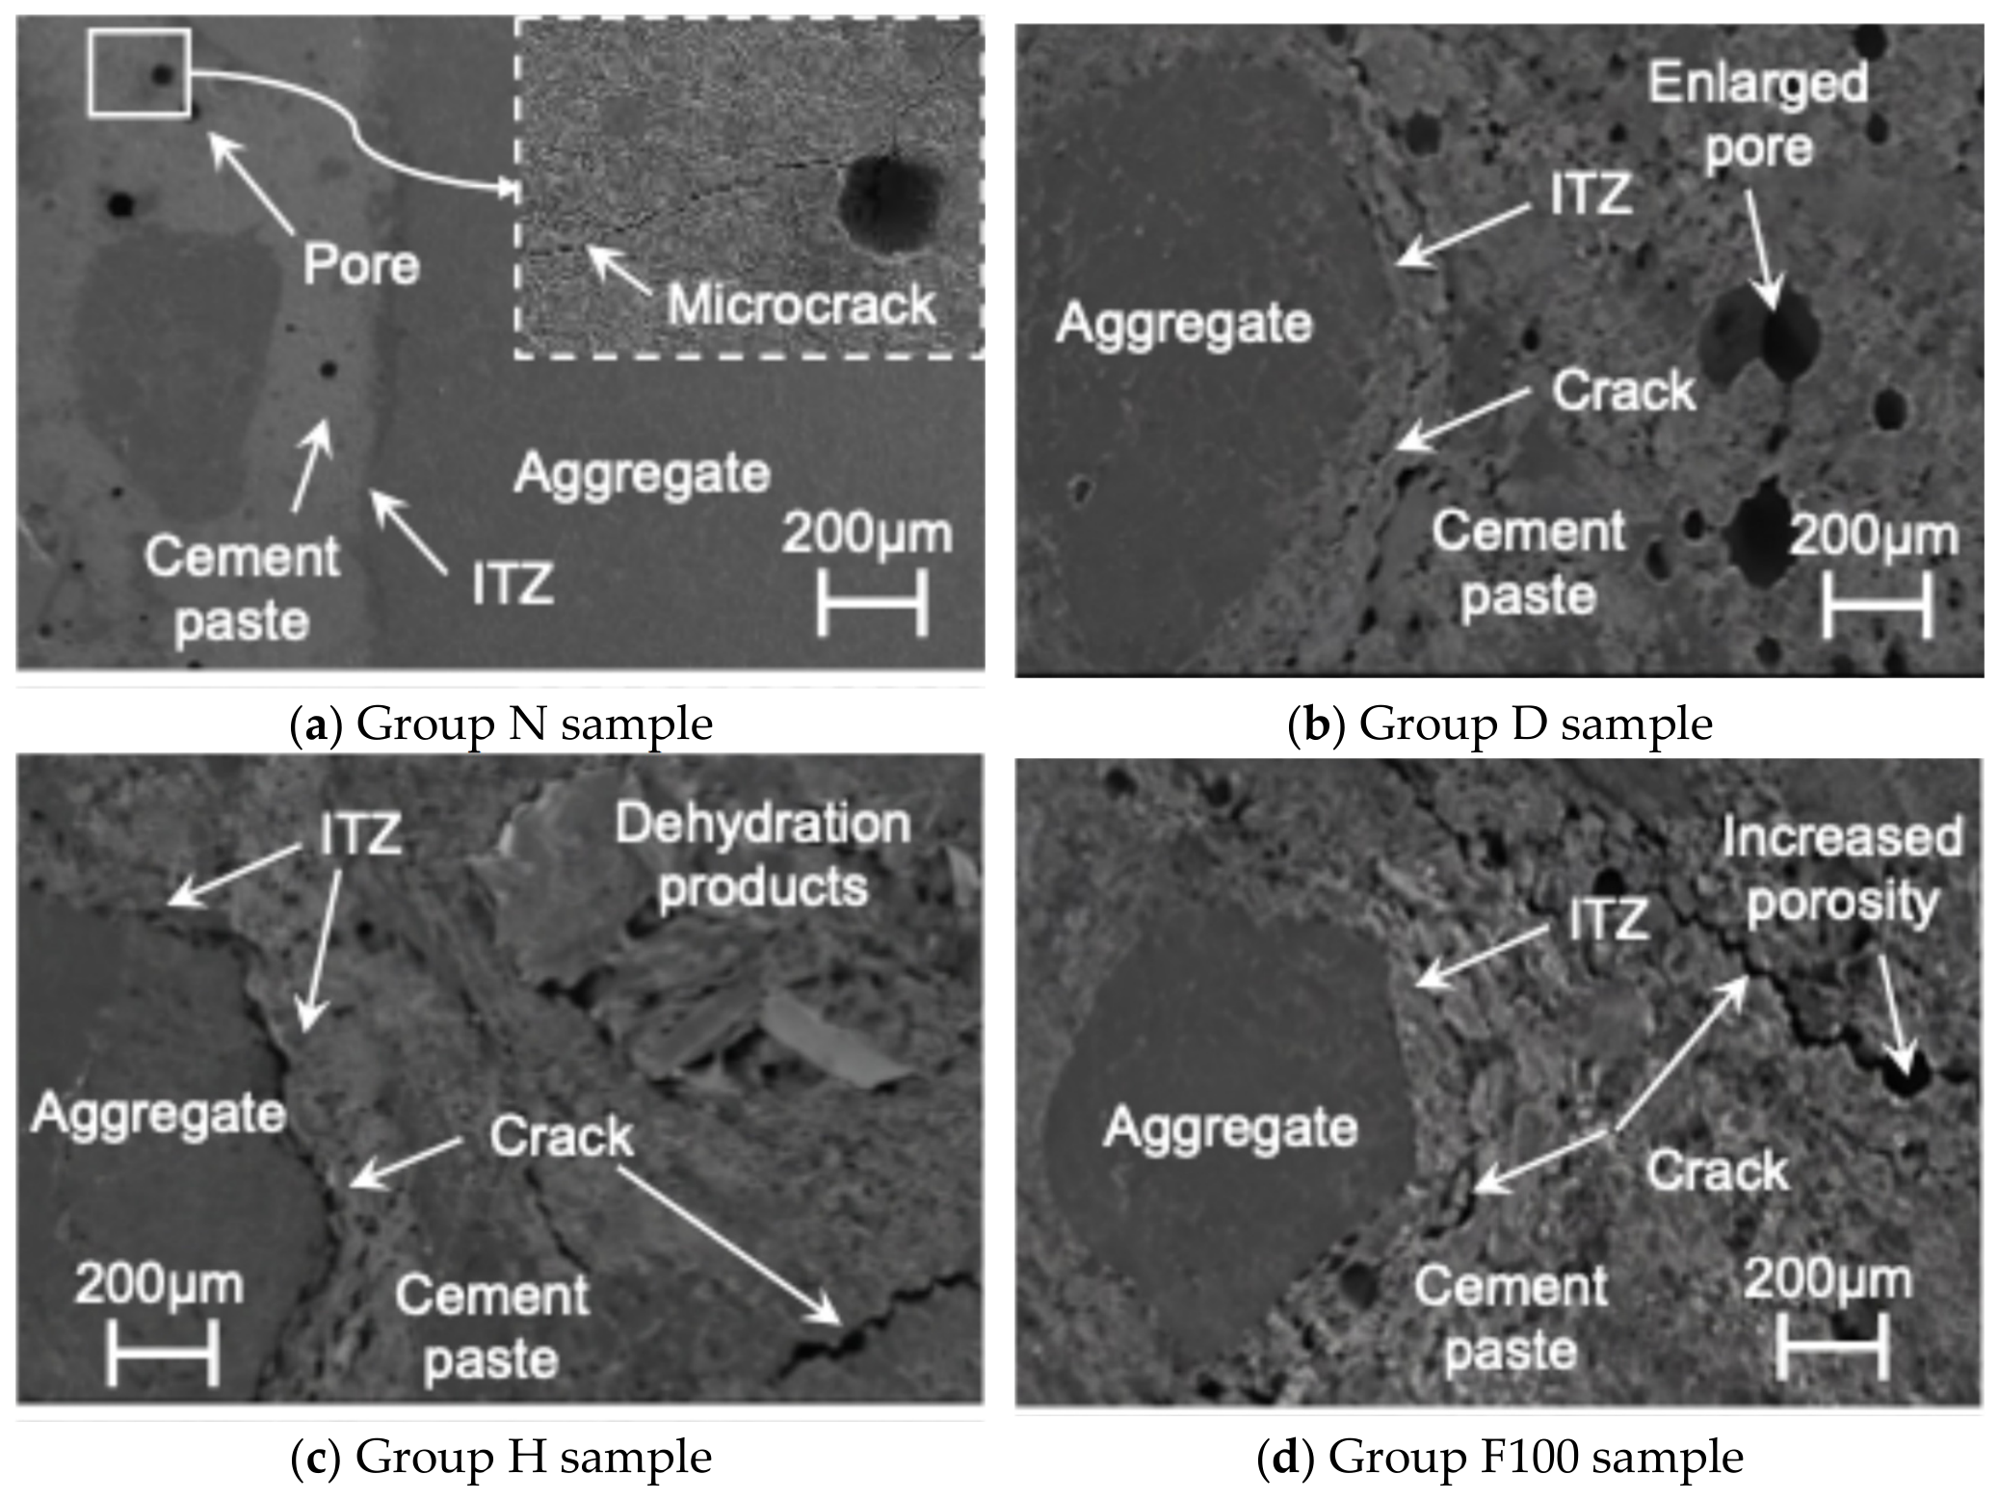
Representative SEM images of concrete specimens under benchmark and deteriorated exposure conditions are illustrated in Figure 2. As observed in Figure 2a, the benchmark specimen (Group N) exhibited a dense matrix microstructure and an intact aggregate–paste interfacial transition zone (ITZ), with only sparse, isolated micropores and localized blunt microcracks embedded in the bulk cement paste. Under continuous drying (Group D, Figure 2b), enlarged capillary pores and localized drying-shrinkage microcracks extending along the ITZ boundary were observed, while the overall matrix skeleton retained reasonable cohesion. After extreme high-temperature exposure (Group H, 400 °C, Figure 2c), prominent interfacial tearing gaps emerged along the ITZ contour accompanied by loose dehydration products and wide matrix cracks, indicating severe interfacial debonding and thermal damage. For the freeze–thaw exposure series, Group F100 is presented as the representative terminal damage state (Figure 2d), showing pronounced matrix void dilation (increased porosity) and interconnected fatigue microcracks bridging through both the ITZ and the surrounding cement paste. While Figure 2d depicts this terminal connectivity regime, the progressive crack transitions across intermediate freeze–thaw stages (F25, F50, and F75) are quantitatively captured via microcrack area statistics in Table 5.
Figure 2.
Representative SEM images of concrete specimens after exposure to different environmental conditions: (a) benchmark state (Group N); (b) continuous drying (Group D); (c) extreme high-temperature (Group H, 400 °C); and (d) rapid freeze–thaw cycles at terminal stage (Group F100).
Table 5.
Quantitative statistics of microcrack area ratio (C) and morphological characteristics under different environmental exposures.
To quantitatively characterize the degree of microcrack evolution induced by different environments, representative matrix and ITZ regions free from scratch interference were selected for grayscale threshold segmentation. The actual total pixel area of microcrack regions Acr was extracted via digital image analysis software and normalized with respect to the total effective observation area A, defining the microcrack area ratio C:
No fewer than 15 typical BSE images were randomly sampled and statistically averaged for each condition to eliminate local dispersion, thereby achieving the quantitative characterization of microscopic crack damage density in the materials under normal and extreme environments.
2.5. Nanoscratch Test of ITZ
To quantitatively evaluate the local mechanical and crack-resistance properties of the aggregate–paste interfacial transition zone (ITZ) at the micro- and nanoscale, nanoscratch testing was conducted using a Nano Indenter G200 system (KLA Corporation, Milpitas, CA, USA) equipped with a lateral force scratch testing module and a standard calibrated Berkovich diamond indenter. A constant vertical loading rate mode was adopted during testing, with the maximum normal load set to 200 mN, the constant horizontal scratching speed set to 1 μm/s, and the total scratch length set to 200 μm. The starting point of each scratch was positioned inside the aggregate approximately 50 μm away from the ITZ interface, and the indenter was driven across the ITZ into the cement matrix perpendicular to the interface, ensuring that each individual scratch line fully covered all characteristic phases. The scratch depth d and the horizontal tangential force FT were recorded at equal intervals of 1 μm, with 201 data points collected along each scratch line.
Based on the scratch energy model of linear elastic fracture mechanics, the local micro-fracture toughness KC was calculated by the following equation:
where A(d) and p(d) are the projected contact area and contact perimeter between the indenter and the material, respectively. For a standard Berkovich indenter, the product of the contact geometric parameters is proportional to the cubic scratch depth; namely, p(d)A(d) = 2.3014d3. Through the measured tangential force FT and scratch depth d in the equation, the spatial distribution profile of fracture toughness along the scratch path can be continuously back-calculated, and the local critical fracture toughness of the ITZ region (corresponding to the interfacial damage-resistance control parameter IITZ in the aforementioned outline) was extracted. No fewer than three representative interfaces were tested for each environmental condition and the valid average values were obtained, thereby characterizing the evolutionary law of crack initiation resistance in the ITZ under different environments.
3. Fracture Behavior Under Different Environmental Conditions
3.1. Load–Displacement Response
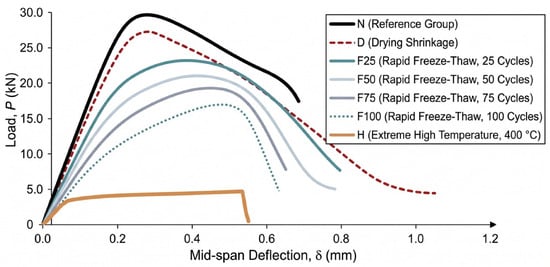
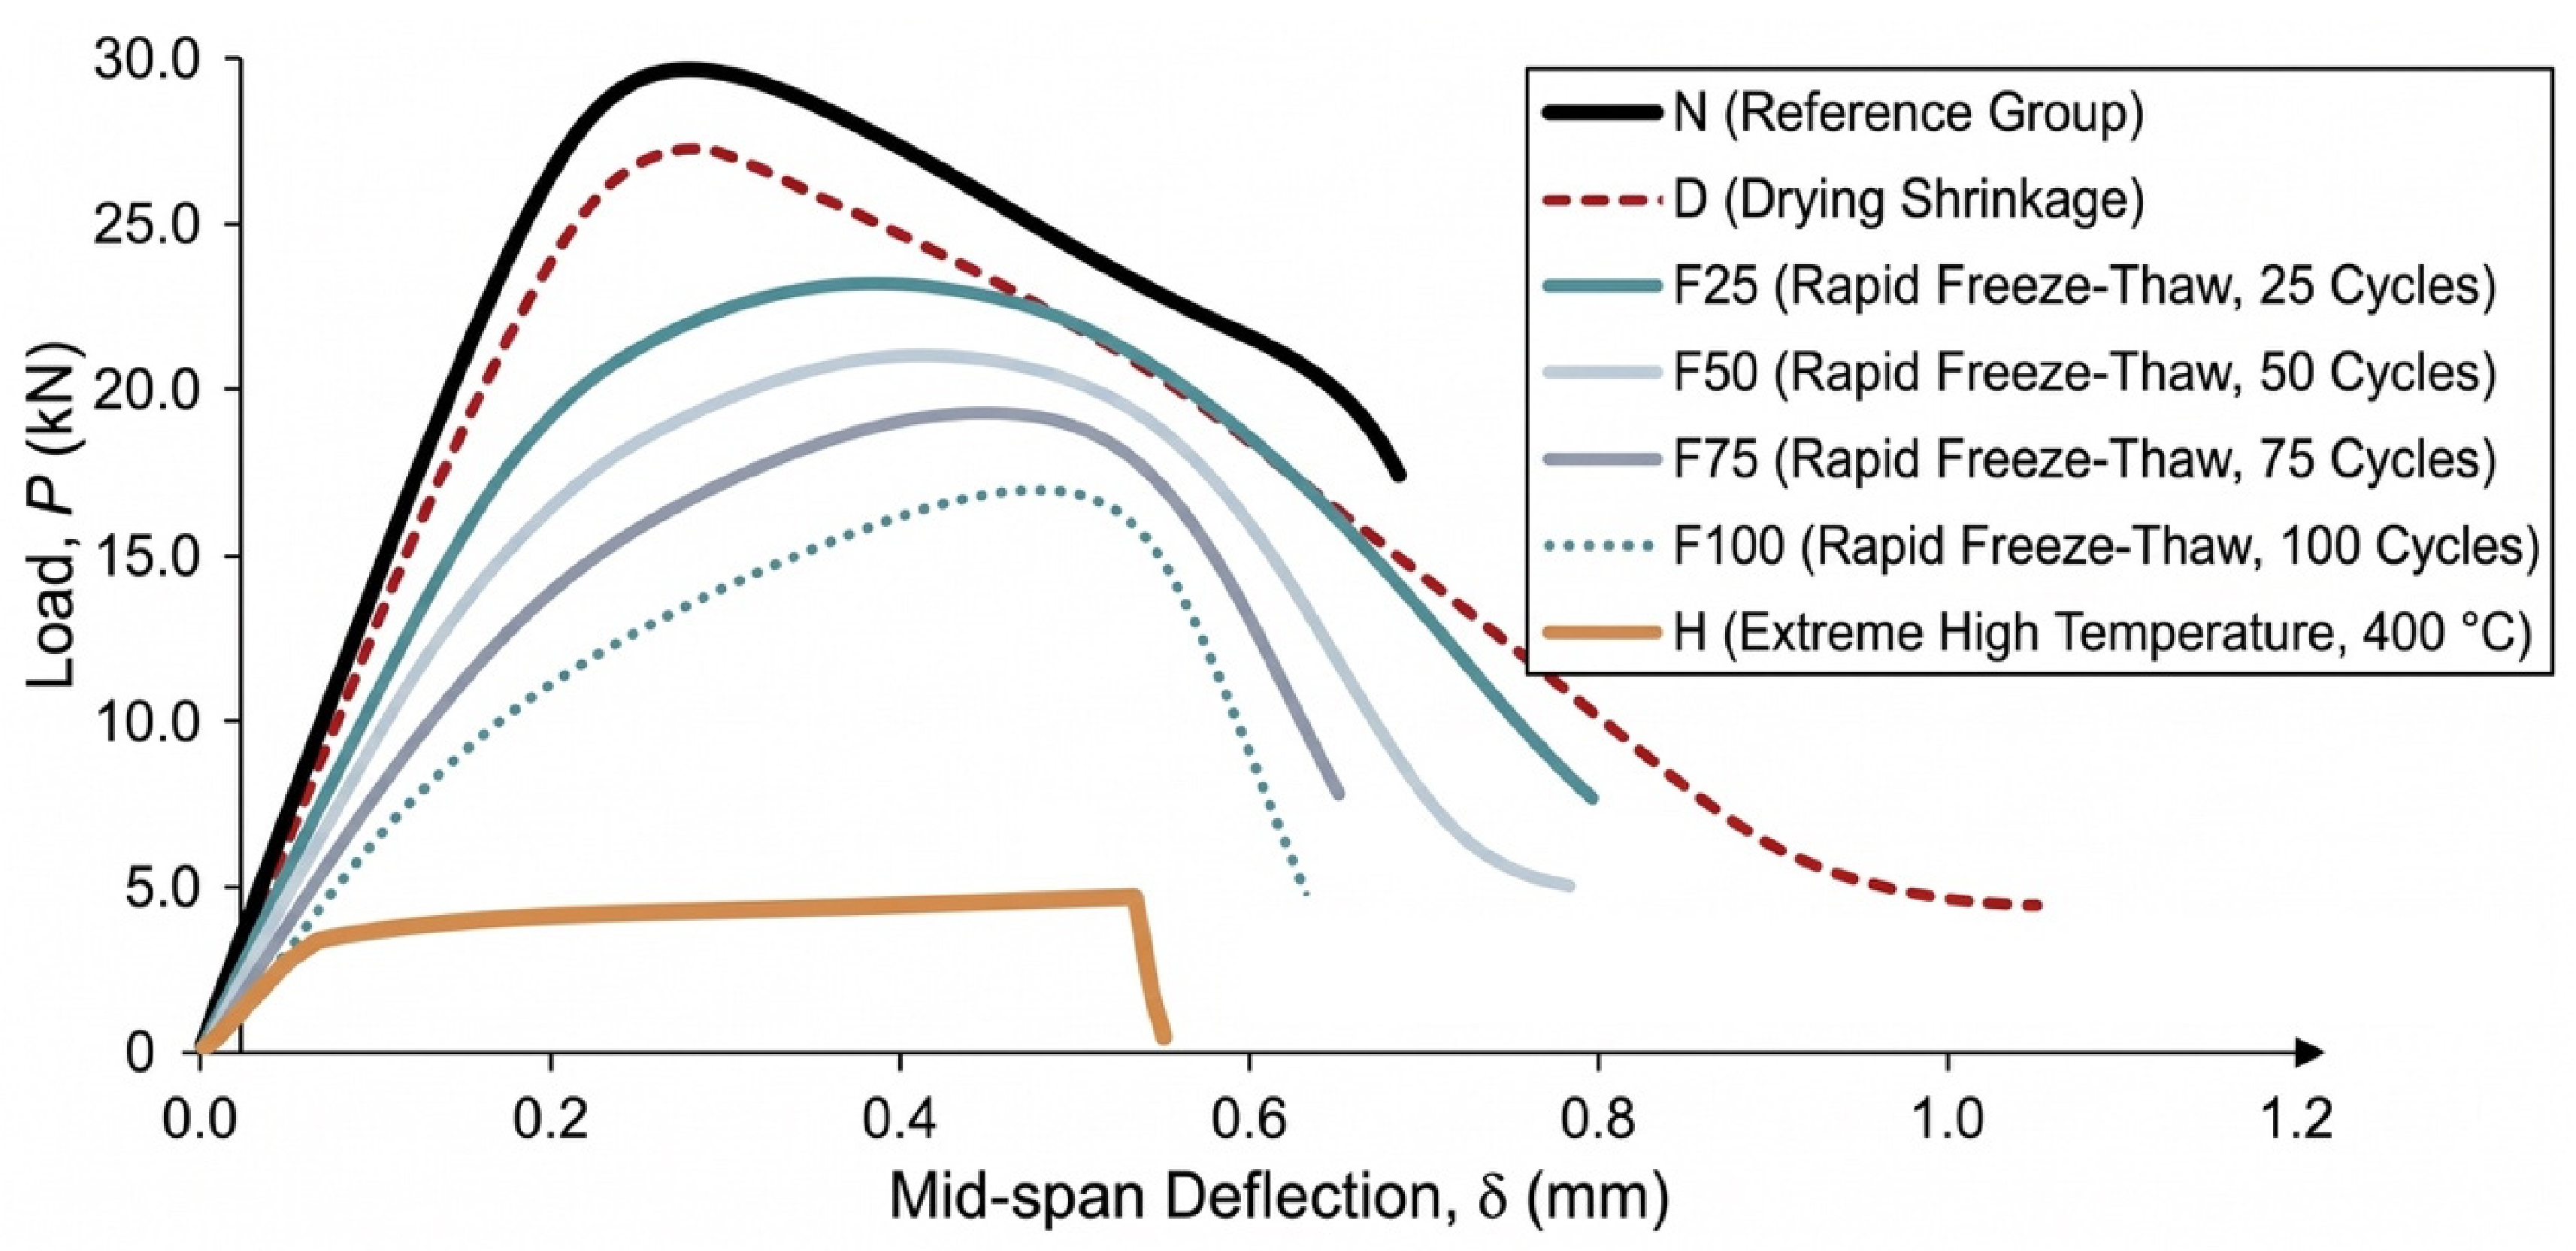
Typical full-process load–midspan deflection (P−Δ) curves of the notched beams in three-point bending tests under each environmental exposure condition are shown in Figure 3. A linear elastic response was initially exhibited by all curves, which gradually deviated toward nonlinearity as microcracks initiated and developed in the fracture process zone (FPZ), followed by entry into a softening descending stage characterizing ductile energy dissipation after reaching the peak load Pmax. However, the stiffness, peak load-bearing capacity, and post-peak ductility characteristics of the curves were significantly altered by different environmental exposures.
Figure 3.
Typical load–mid-span deflection (P−Δ) curves for notched beam three-point bending test under different environmental conditions.
The highest mechanical properties and a plump softening tail were exhibited by the benchmark group (N), with the measured Pmax reaching 29.8 kN, the peak deflection being 0.25 mm, and the ultimate deflection Δ0 extending beyond 0.78 mm, demonstrating excellent plastic energy dissipation characteristics. Affected by matrix tensile stress damage caused by drying shrinkage, Pmax of the continuous drying group (D) slightly decreased to 27.3 kN (a reduction of 8.4%), the peak deflection shifted backward to 0.28 mm, and the post-peak slope became steeper, resulting in weakened deformation storage capacity.
The most severe reshaping of the curves was induced by the extreme high-temperature environment (H, 400 °C). Its initial elastic stiffness dropped sharply by approximately 70%, and a cliff-like drop in Pmax to 4.8 kN was observed (an 83.9% reduction compared with Group N); the deformation coordination capacity was lost due to dehydration decomposition of hydration products and severe thermal crack networking (as shown in Figure 2c), causing the curve to plummet nearly vertically after the peak and fracture prematurely in a brittle manner at a deflection of only 0.55 mm, which presents typical brittle instability characteristics.
Cumulative damage effects monotonically increasing with cycle numbers were exhibited by rapid freeze–thaw cycles (F). As the number of freeze–thaw cycles increased to 25, 50, 75, and 100, Pmax was sequentially degraded to 23.5 kN, 20.8 kN, 17.2 kN, and 13.6 kN (reductions of 21.1% to 54.4%). Because fatigue microcracks were triggered by periodic frost heave in micropores, the initial slope of the curves continuously flattened, and the peak deflection broadened to 0.46 mm (an increase of 84.0% for F100), exhibiting typical stiffness softening and flattening features. Meanwhile, the softening stage dropped precipitously during the severe freeze–thaw stages (F75 and F100), where unstable fracture occurred at deflections of 0.65 mm and 0.58 mm, respectively, indicating that crack bridging resistance was severely deteriorated by the erosion of the matrix and interfaces.
3.2. Evolution of Fracture Energy
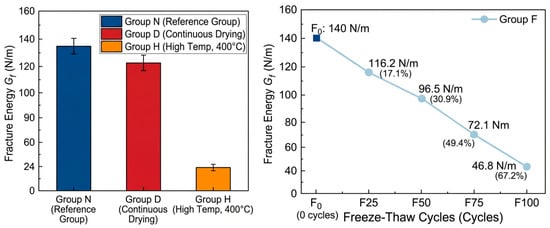
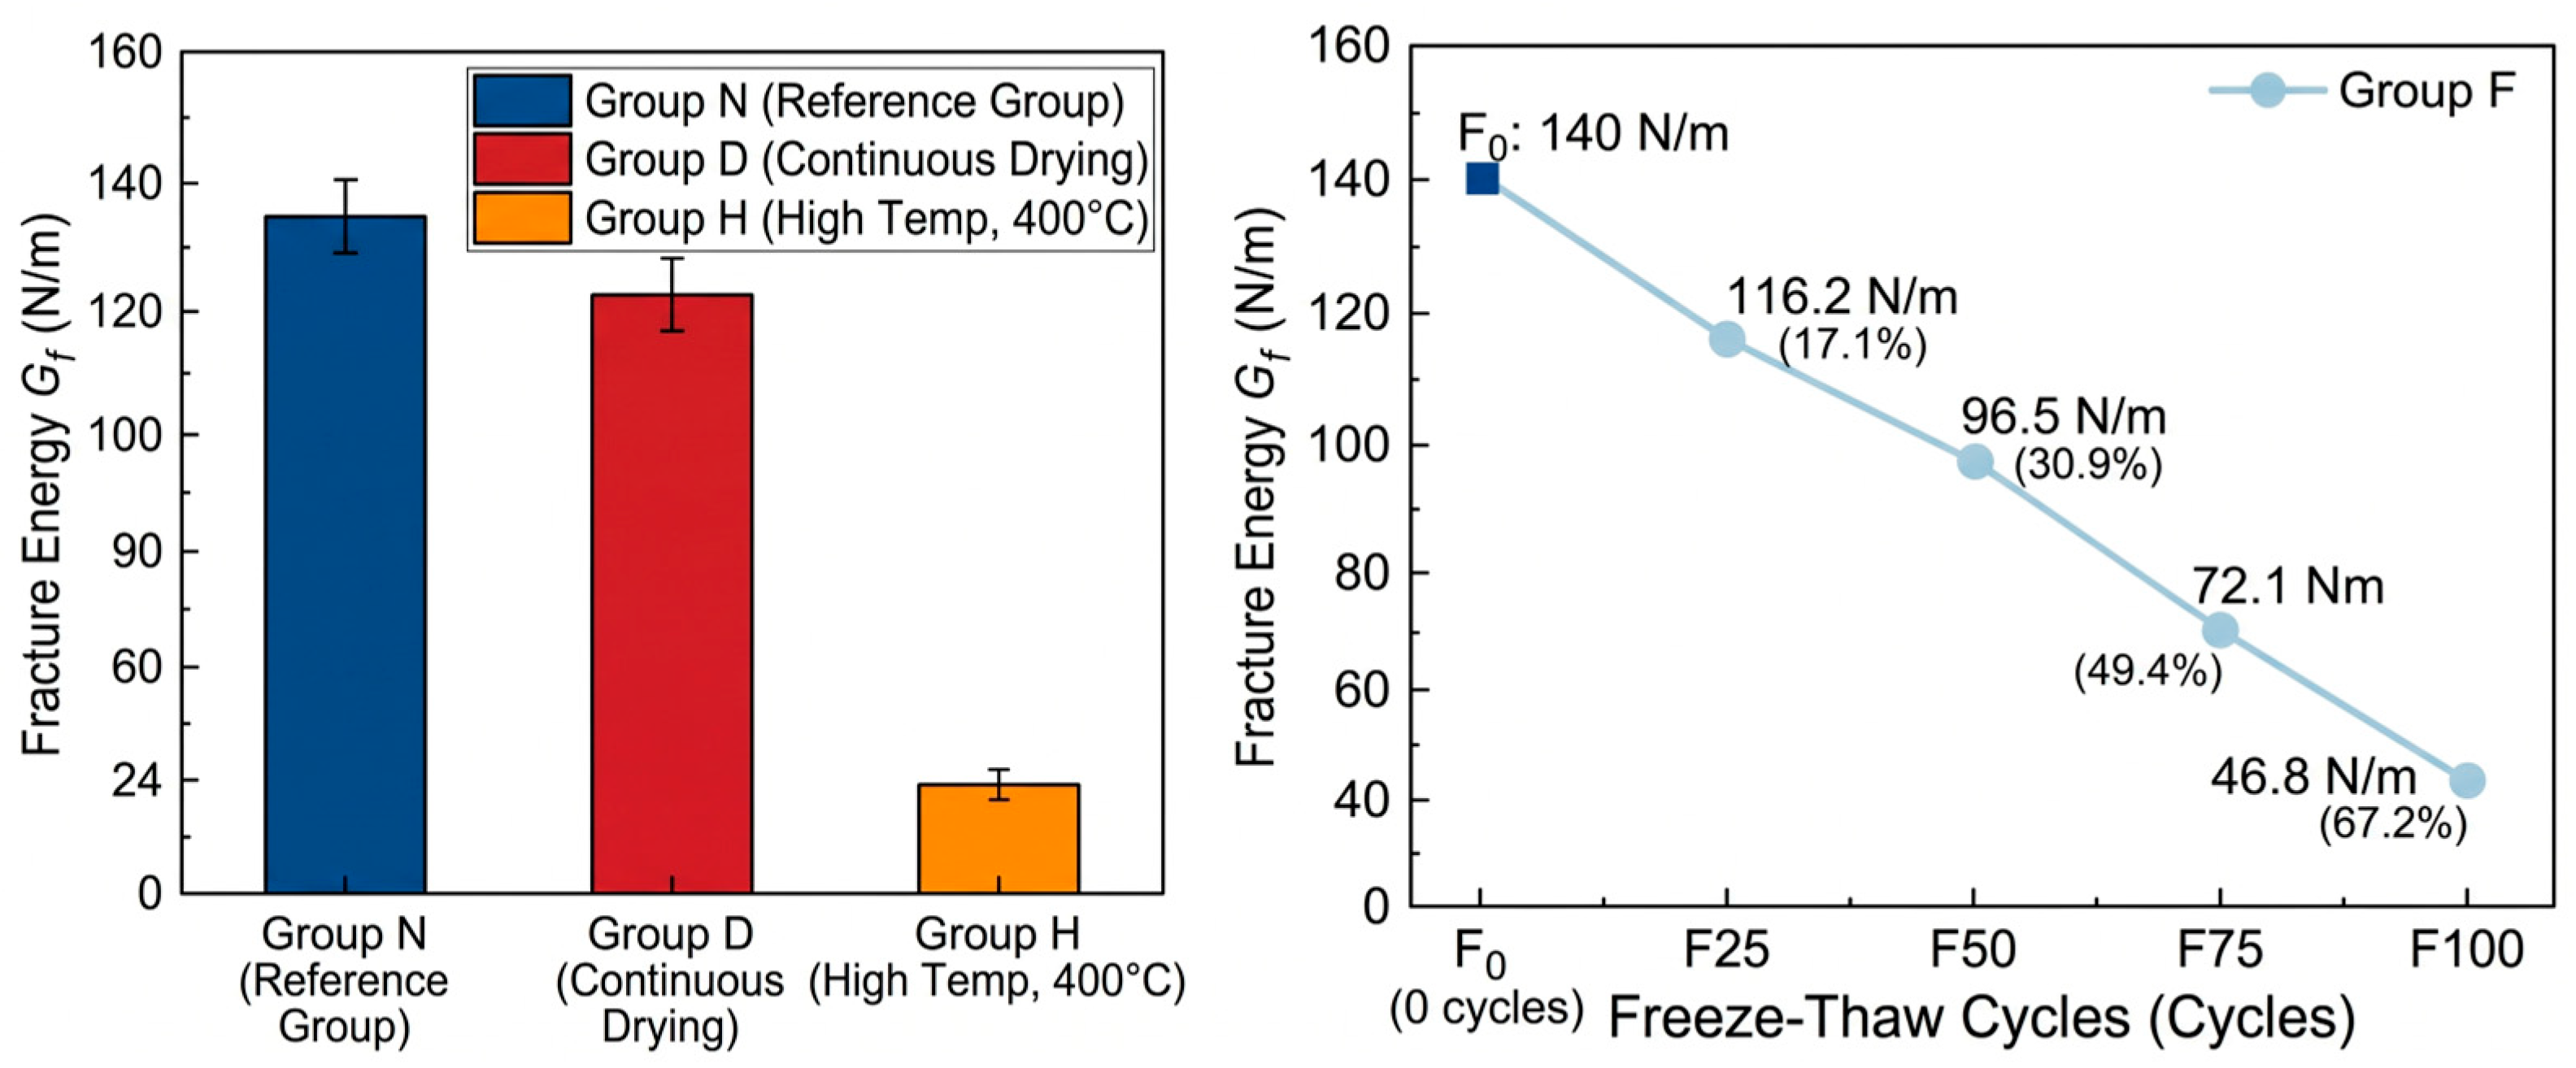
The evolution of fracture energy Gf of cementitious materials under each environmental exposure condition is shown in Figure 4. Total energy dissipation during the complete penetration of cracks through the ligament section is reflected by fracture energy, which demonstrates higher sensitivity to internal phase decomposition, pore coarsening, and microcrack damage compared with conventional strength indicators. Overall, varying degrees of attenuation in Gf were caused by environmental damage, and the degradation degree followed the order of: high-temperature environment (H) > freeze–thaw cycling environment (F) > continuous drying environment (D).
Figure 4.
Evolution of concrete fracture energy (Gf) under different environmental exposure conditions.
The highest fracture energy was exhibited by specimens in the benchmark group (N), with an average measured value of 142.6 N/m. After continuous drying for 28 d, Gf of Group D decreased to 126.8 N/m, corresponding to a minor reduction of 11.1% compared with the benchmark group. This relatively small drop indicates that continuous drying at room temperature caused limited deterioration to the energy dissipation capacity of the material. Although drying shrinkage microcracks were initiated, the bulk matrix and interfacial bonding maintained sufficient mechanical integrity to resist crack propagation (as shown in Figure 2b), as quantitatively confirmed by the microstructural and interfacial characterizations in Section 4.
A destructive drop in fracture energy was triggered by extreme high-temperature exposure (H, 400 °C), where Gf was measured at only 24.3 N/m, plummeting by 83.0% compared with the benchmark group. This drastic deterioration is mainly attributed to two aspects: first, the intrinsic loss of microscopic bonding force in the matrix was caused by the desorption of interlayer water in C-S-H gel and the chemical dehydration decomposition of CH crystals; second, a dense network of microcracks was torn inside the material by high thermal stresses arising from the incompatible thermal deformation between aggregates and the hardened paste during the heating and cooling processes. During propagation, the main crack could unstably penetrate along existing thermal defects with almost no need to overcome lattice fracture and crack-tip plastic shielding resistance, leading to severely restricted energy dissipation.
Under rapid freeze–thaw cycling conditions, a distinct nonlinear accelerated attenuation characteristic was exhibited by Gf with the number of freeze–thaw cycles Nf. The measured fracture energies of Groups F25, F50, F75, and F100 were 118.2 N/m, 98.5 N/m, 72.1 N/m, and 46.8 N/m, which were reduced by 17.1%, 30.9%, 49.4%, and 67.2%, respectively, compared with the benchmark group. In the initial freeze–thaw regime (Nf ≤ 50), the reduction in fracture energy was relatively moderate. However, once the exposure exceeded 50 cycles (Nf > 50), the degradation rate of Gf accelerated markedly, manifesting as an increasingly steep downward slope. This two-stage macroscopic attenuation directly corresponds to the progressive accumulation of internal damage. This severe degradation regime is morphologically captured in the representative terminal freeze–thaw micrograph (Group F100, Figure 2d), which shows noticeable ITZ debonding and expanded voids. The detailed physical drivers behind these trends are quantitatively characterized via pore dilation, interfacial nanomechanical degradation, and microcrack connectivity in Section 4.
3.3. Failure Characteristics
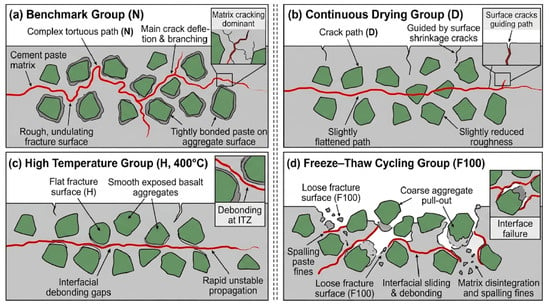
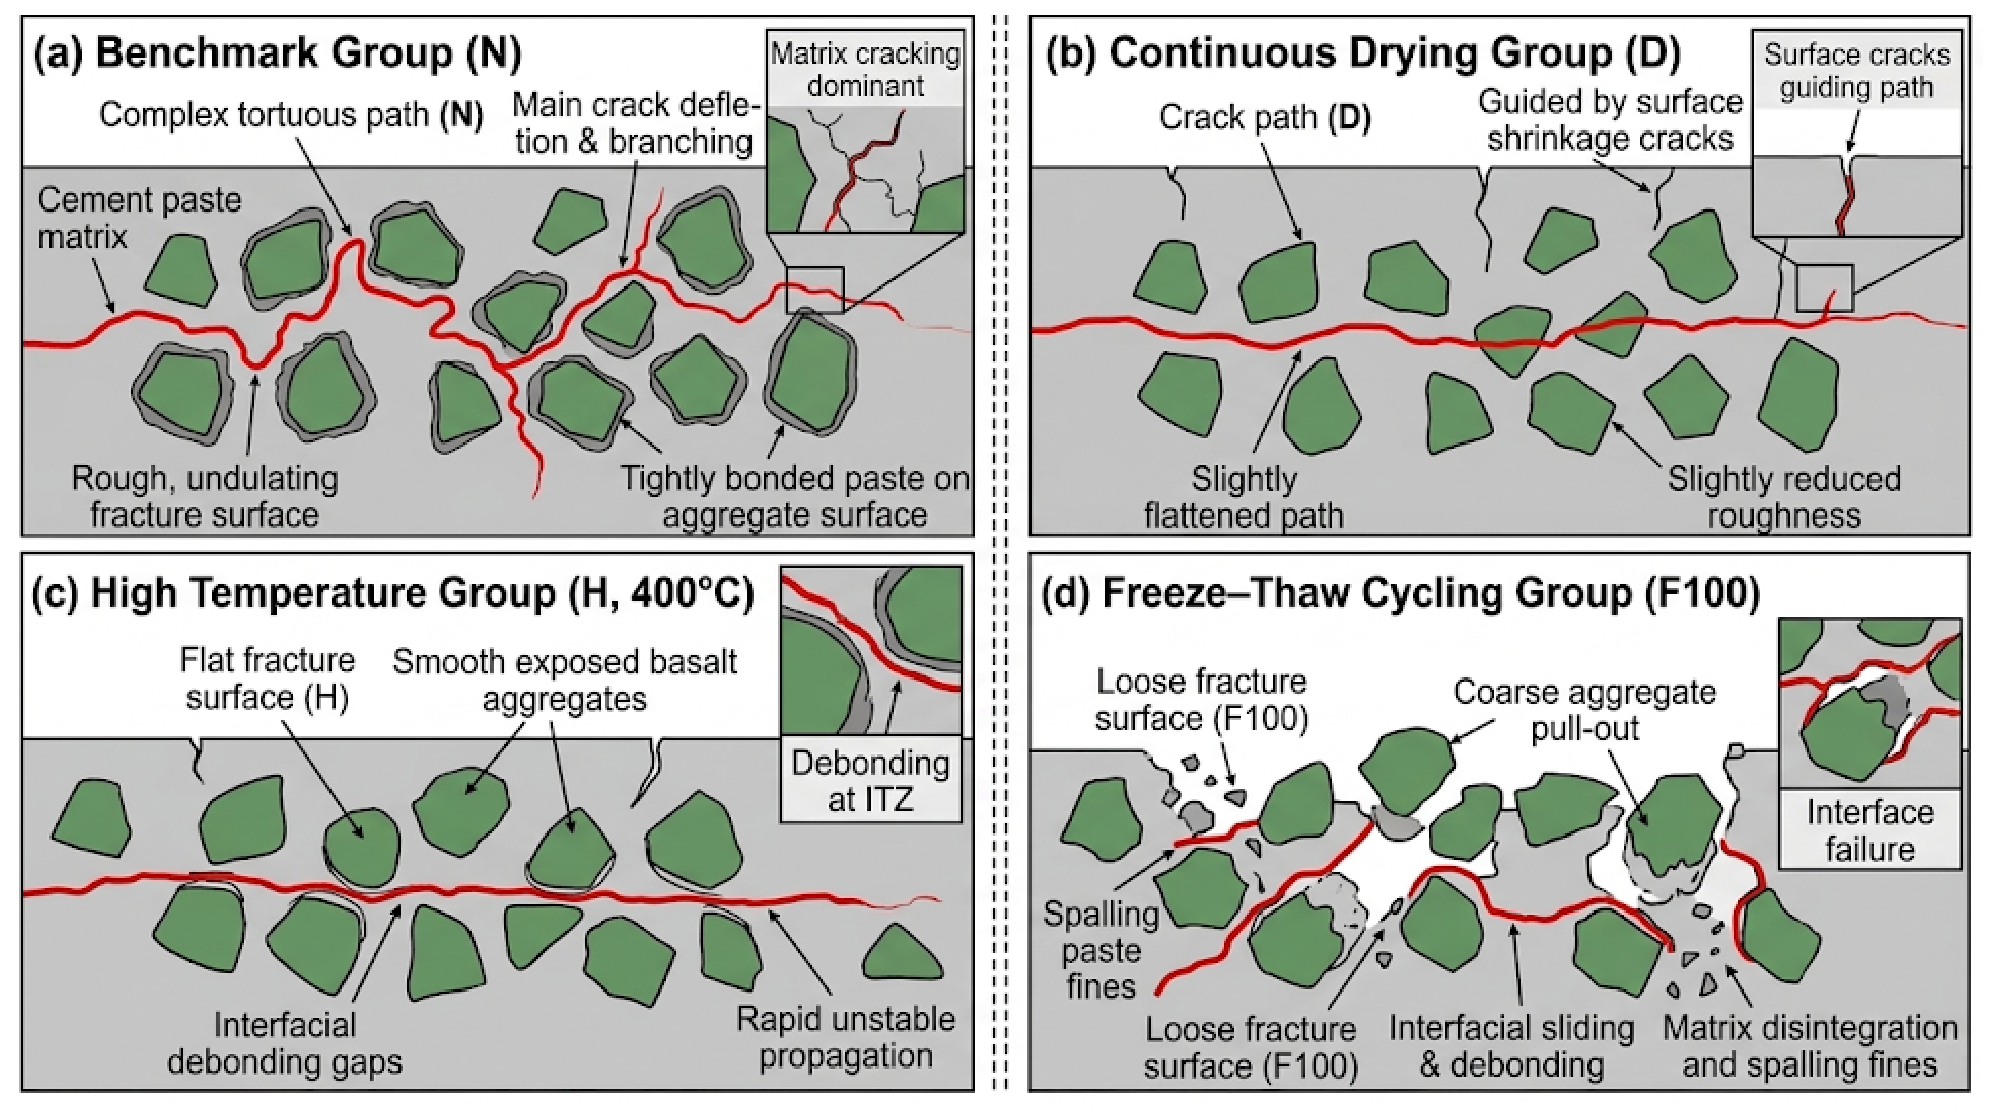
Schematic diagrams of macroscopic fracture morphology and crack propagation paths of the specimens after different environmental exposures are shown in Figure 5, which are directly synthesized and abstracted from the post-fracture specimen observations and the microstructural SEM damage characteristics presented in Figure 2. A strong environmental dependence is exhibited by the macroscopic crack propagation mode, which directly reflects the competition of propagation resistance between the matrix and the interfaces. Specifically, the progressive shift from tortuous crack deflection around tightly bonded aggregates (Group N) to circumferential debonding gaps (Group H) and aggregate pull-out (Group F100) depicted in Figure 5 physically corresponds to the microcrack propagation and ITZ deterioration patterns revealed in Figure 2.
Figure 5.
Schematic diagrams of macroscopic fracture morphology and crack propagation paths of specimens after different environmental exposures (mechanistically synthesized based on the experimental SEM observations in Figure 2 and physical fracture surface analysis).
A typical tortuous propagation path was exhibited by the benchmark group (N). Significant deflection and branching of the main crack were observed upon encountering dense basalt aggregates, resulting in a rough and undulating fracture surface. Hardened paste was tightly coated on most aggregate surfaces, with matrix cracking and partial interfacial debonding as the dominant failure modes. The effective fracture area was increased by this tortuous propagation and the mechanical interlocking effect of aggregates, providing the physical basis for maintaining high fracture energy. The fracture path of the continuous drying group (D) was similar to that of the benchmark group, but the roughness of the fracture surface was slightly reduced, and the main crack was slightly flattened under the guidance of surface drying shrinkage cracks.
Low-energy brittle fracture characteristics were presented by both the extreme high-temperature group (H, 400 °C) and the severe freeze–thaw cycling group (F100):
High-temperature group (H): A relatively flat fracture surface was observed, with basalt aggregates mostly exposed in a smooth state. Obvious circumferential debonding gaps were formed between aggregates and paste, and the macroscopic crack propagated unstably and rapidly along severely damaged interfaces as the preferred path.
Freeze–thaw cycling group (F): Macroscopic failure shifted from aggregate self-locking interlocking to interfacial sliding and debonding with increasing freeze–thaw cycles. In Groups F75 and F100, coarse aggregates were mostly pulled out completely from the matrix, leading to a loose fracture surface accompanied by the spalling of paste fines.
It is confirmed by macroscopic failure characteristics that the attenuation of fracture energy driven by environmental deterioration is essentially dominated jointly by matrix embrittlement and severe debonding and weakening of the aggregate–paste interfacial transition zone (ITZ), providing macroscopic verification for the subsequent analysis of local nanomechanical degradation of the ITZ.
4. Pore, ITZ and Microcrack Evolution
4.1. Pore Structure Evolution
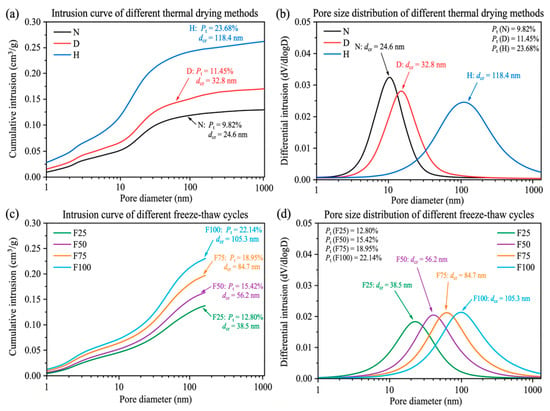
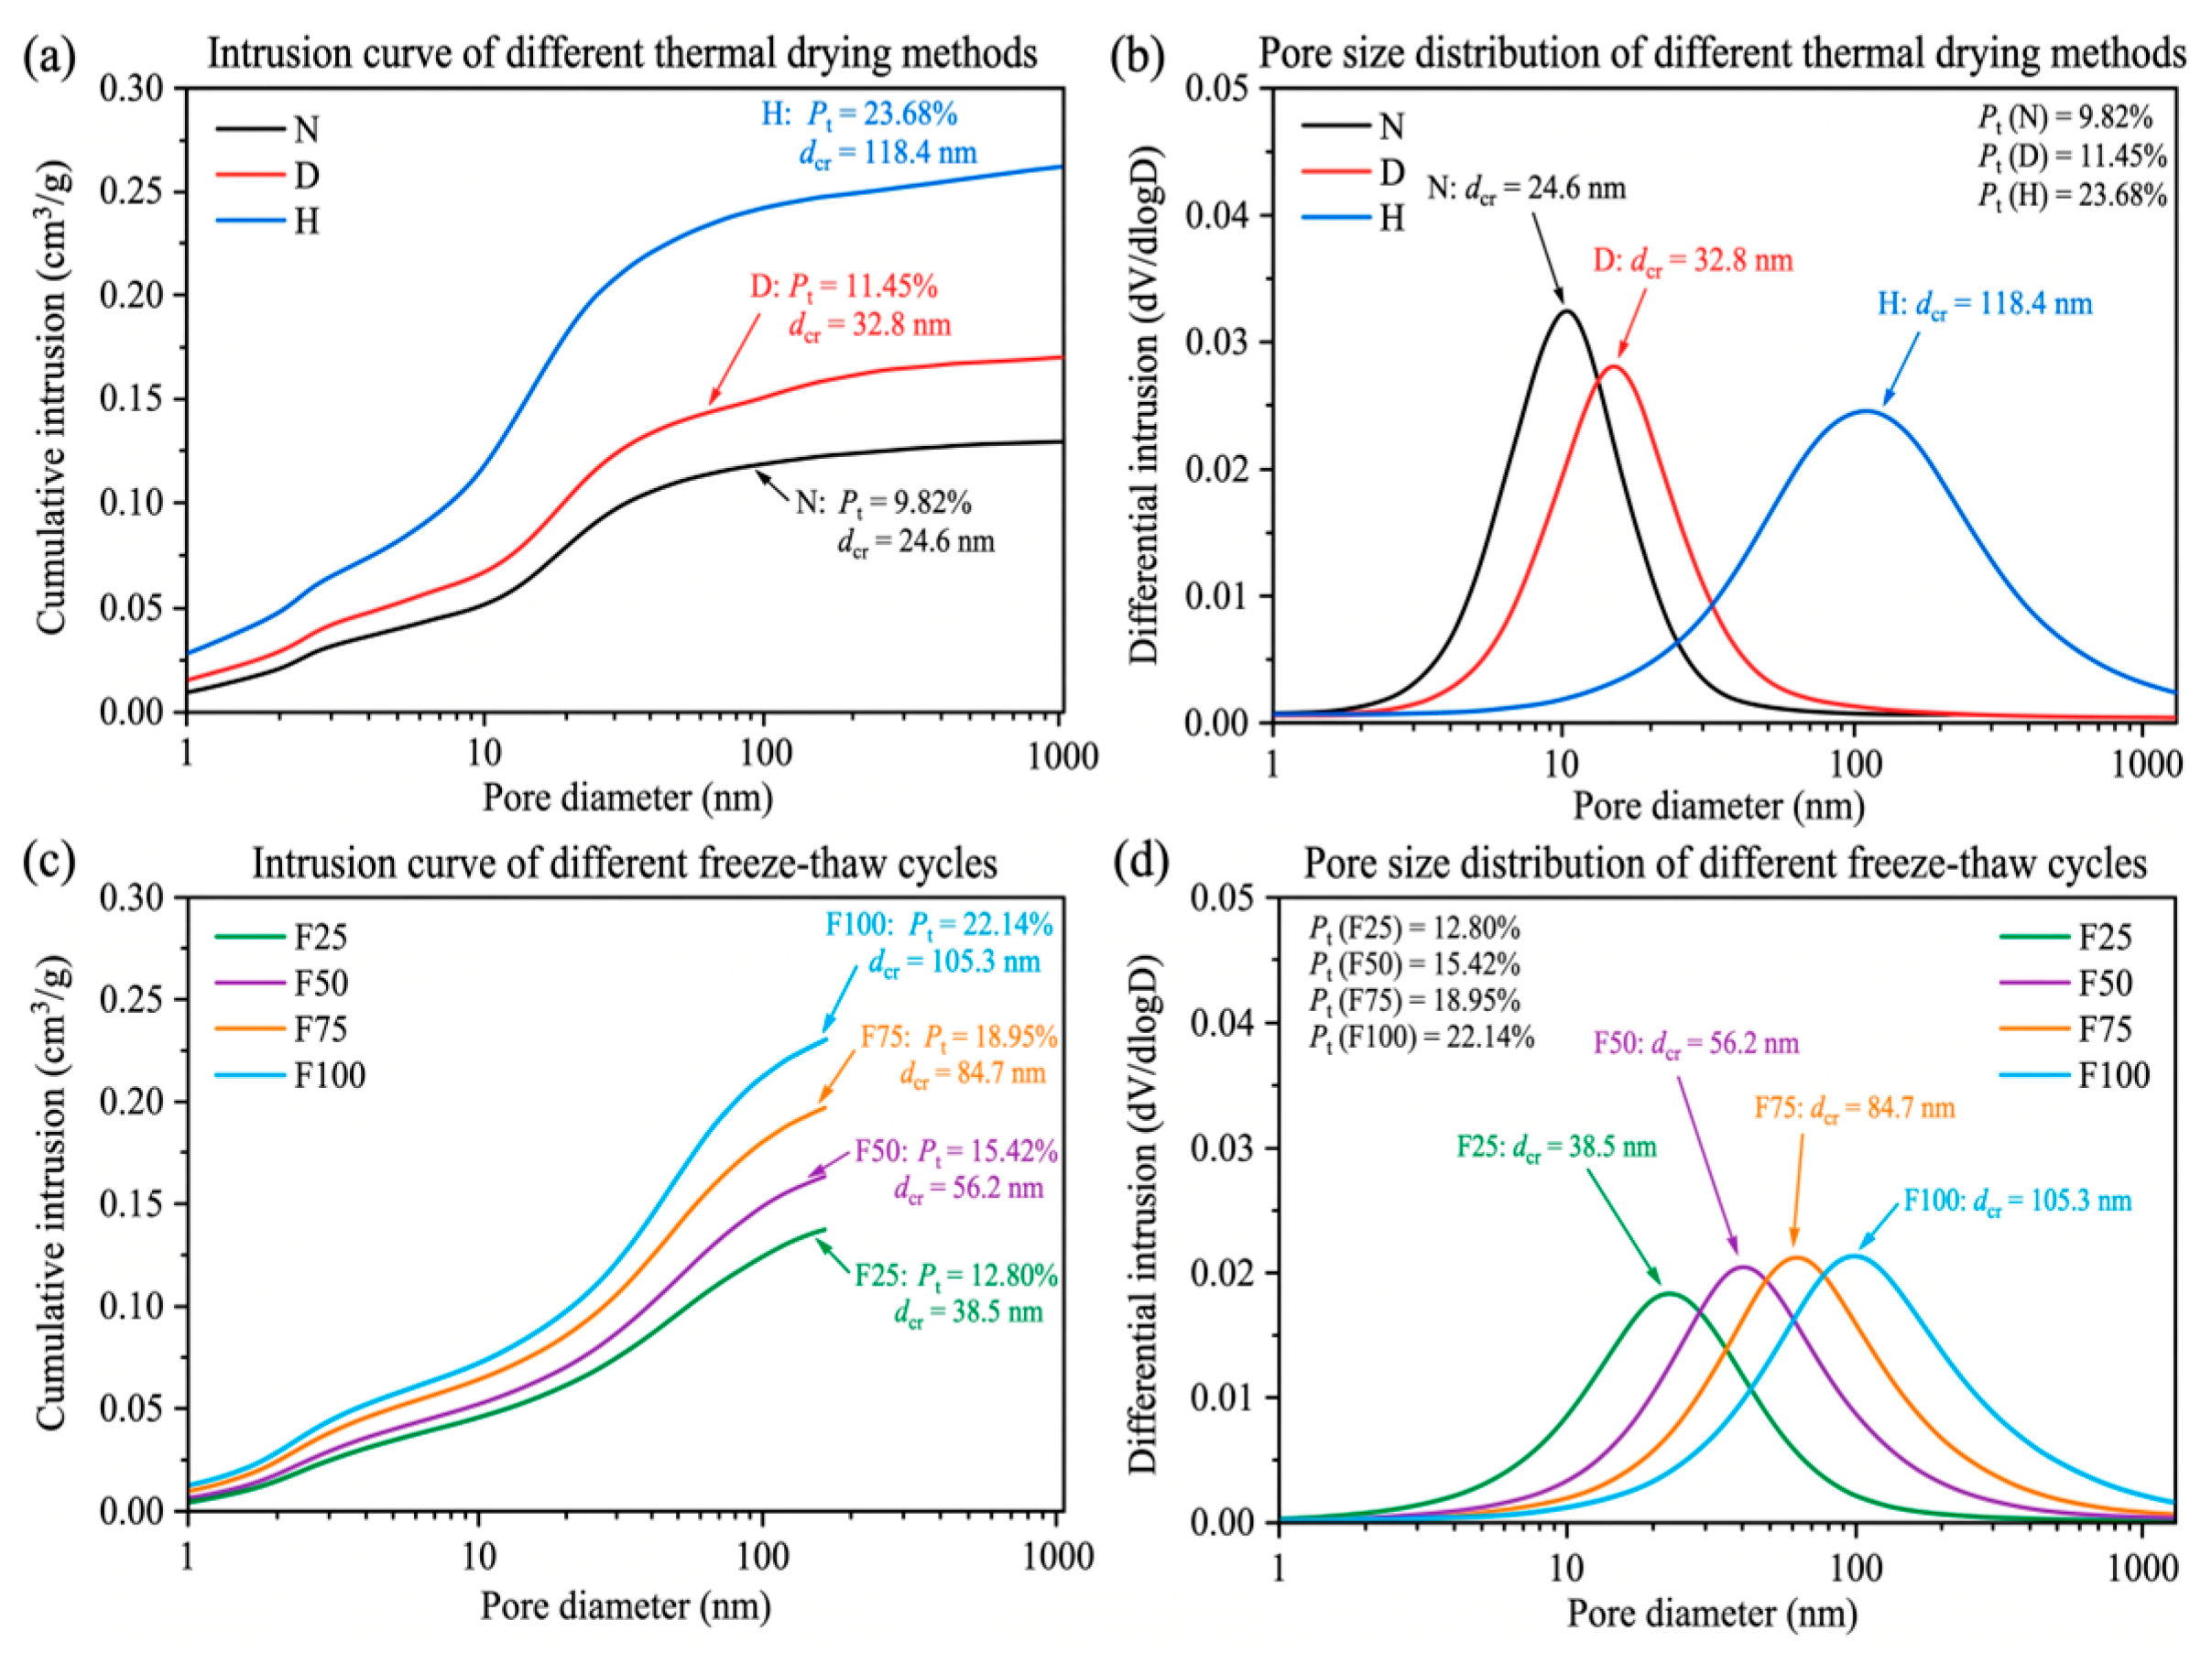
Mercury intrusion porosimetry (MIP) test results of cementitious materials under each environmental exposure condition are shown in Figure 6. Pore size distributions are generally classified into harmless gel pores (<10 nm), less harmful transitional pores (10–50 nm), harmful capillary pores (50–200 nm), and severely harmful macropores (>200 nm). Pore coarsening and the climb in total porosity Pt induced by environmental deterioration serve as the primary physical mechanisms governing the decline in material fracture load-bearing capacity.
Figure 6.
Pore structure evolution under different environmental conditions. (a) Intrusion curve of different thermal drying methods; (b) pore size distribution of different thermal drying methods; (c) intrusion curve of different freeze-thaw cycles; (d) pore size distribution of different freeze-thaw cycles.
A dense microscopic pore characteristic was exhibited by the benchmark group (N), where the total porosity Pt was measured at only 9.82%, the most probable pore diameter (the critical pore diameter dcr corresponding to the peak mercury intrusion rate on the differential curve) was located at 24.6 nm, and the proportion of gel and transitional pores (<50 nm) exceeded 72.5%, indicating sufficient hydration and dense spatial packing of the cementitious matrix. After continuous drying (D) exposure, Pt slightly increased to 11.45%, and the critical pore diameter shifted rightward to 32.8 nm; the increase in pore volume was mainly concentrated in the range of 30–100 nm, originating from localized drying shrinkage cracking of the gel skeleton induced by the dissipation of free water and partial capillary water.
Severe coarsening and unstable reconstruction of the pore system were caused by extreme high-temperature exposure (H, 400 °C). The total porosity Pt of the specimens increased sharply to 23.68% (an increase of 141.1% compared with Group N), the most probable pore diameter was drastically coarsened to 118.4 nm, and the volume fraction of harmful macropores (>100 nm) soared from 16.2% in the benchmark group to 58.7%. A broad peak characteristic was exhibited by the differential mercury intrusion curve, which was mainly attributed to the dehydration and collapse of the interlayer structure of C-S-H gel as well as the thermal decomposition of CH crystals, forming extensive connected micropores and dehydration channels.
A multistage pore expansion law increasing with the number of cycles was exhibited under rapid freeze–thaw cycles (F):
Total porosity increased monotonically: total porosity Pt in Groups F25, F50, F75, and F100 increased to 12.86%, 15.42%, 18.95%, and 22.14%, respectively.
The most probable pore diameter shifted rightward in a stepwise manner: the critical pore diameter dcr sequentially increased to 38.5 nm, 56.2 nm, 84.7 nm, and 105.3 nm.
The pore size distribution shifted toward severely harmful macropores: during the early freeze–thaw stage (F25–F50), original capillary pores were progressively expanded under the driving force of periodic hydrostatic and osmotic pressures from pore water phase transitions, manifested as a continuous enlargement in the integrated area of harmful capillary pores (50–200 nm); upon entering the severe freeze–thaw stage (F75–F100), pore walls were ruptured by cumulative fatigue tensile stress, and extensive microcracks evolved into connected ruptured voids, triggering a surge in the volume fraction of severely harmful macropores (>200 nm). A highly consistent microscopic correspondence was thus formed between this evolutionary trend and the steep drop in the macroscopic softening stage as well as the attenuation of fracture energy.
4.2. Nanoscratch Response of ITZ
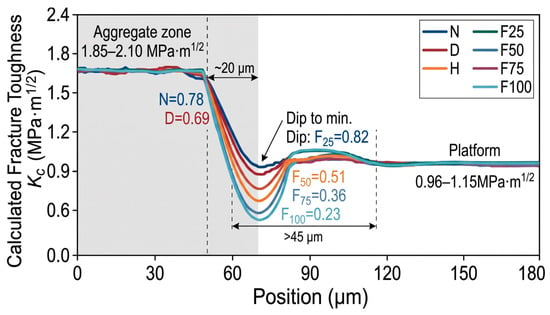
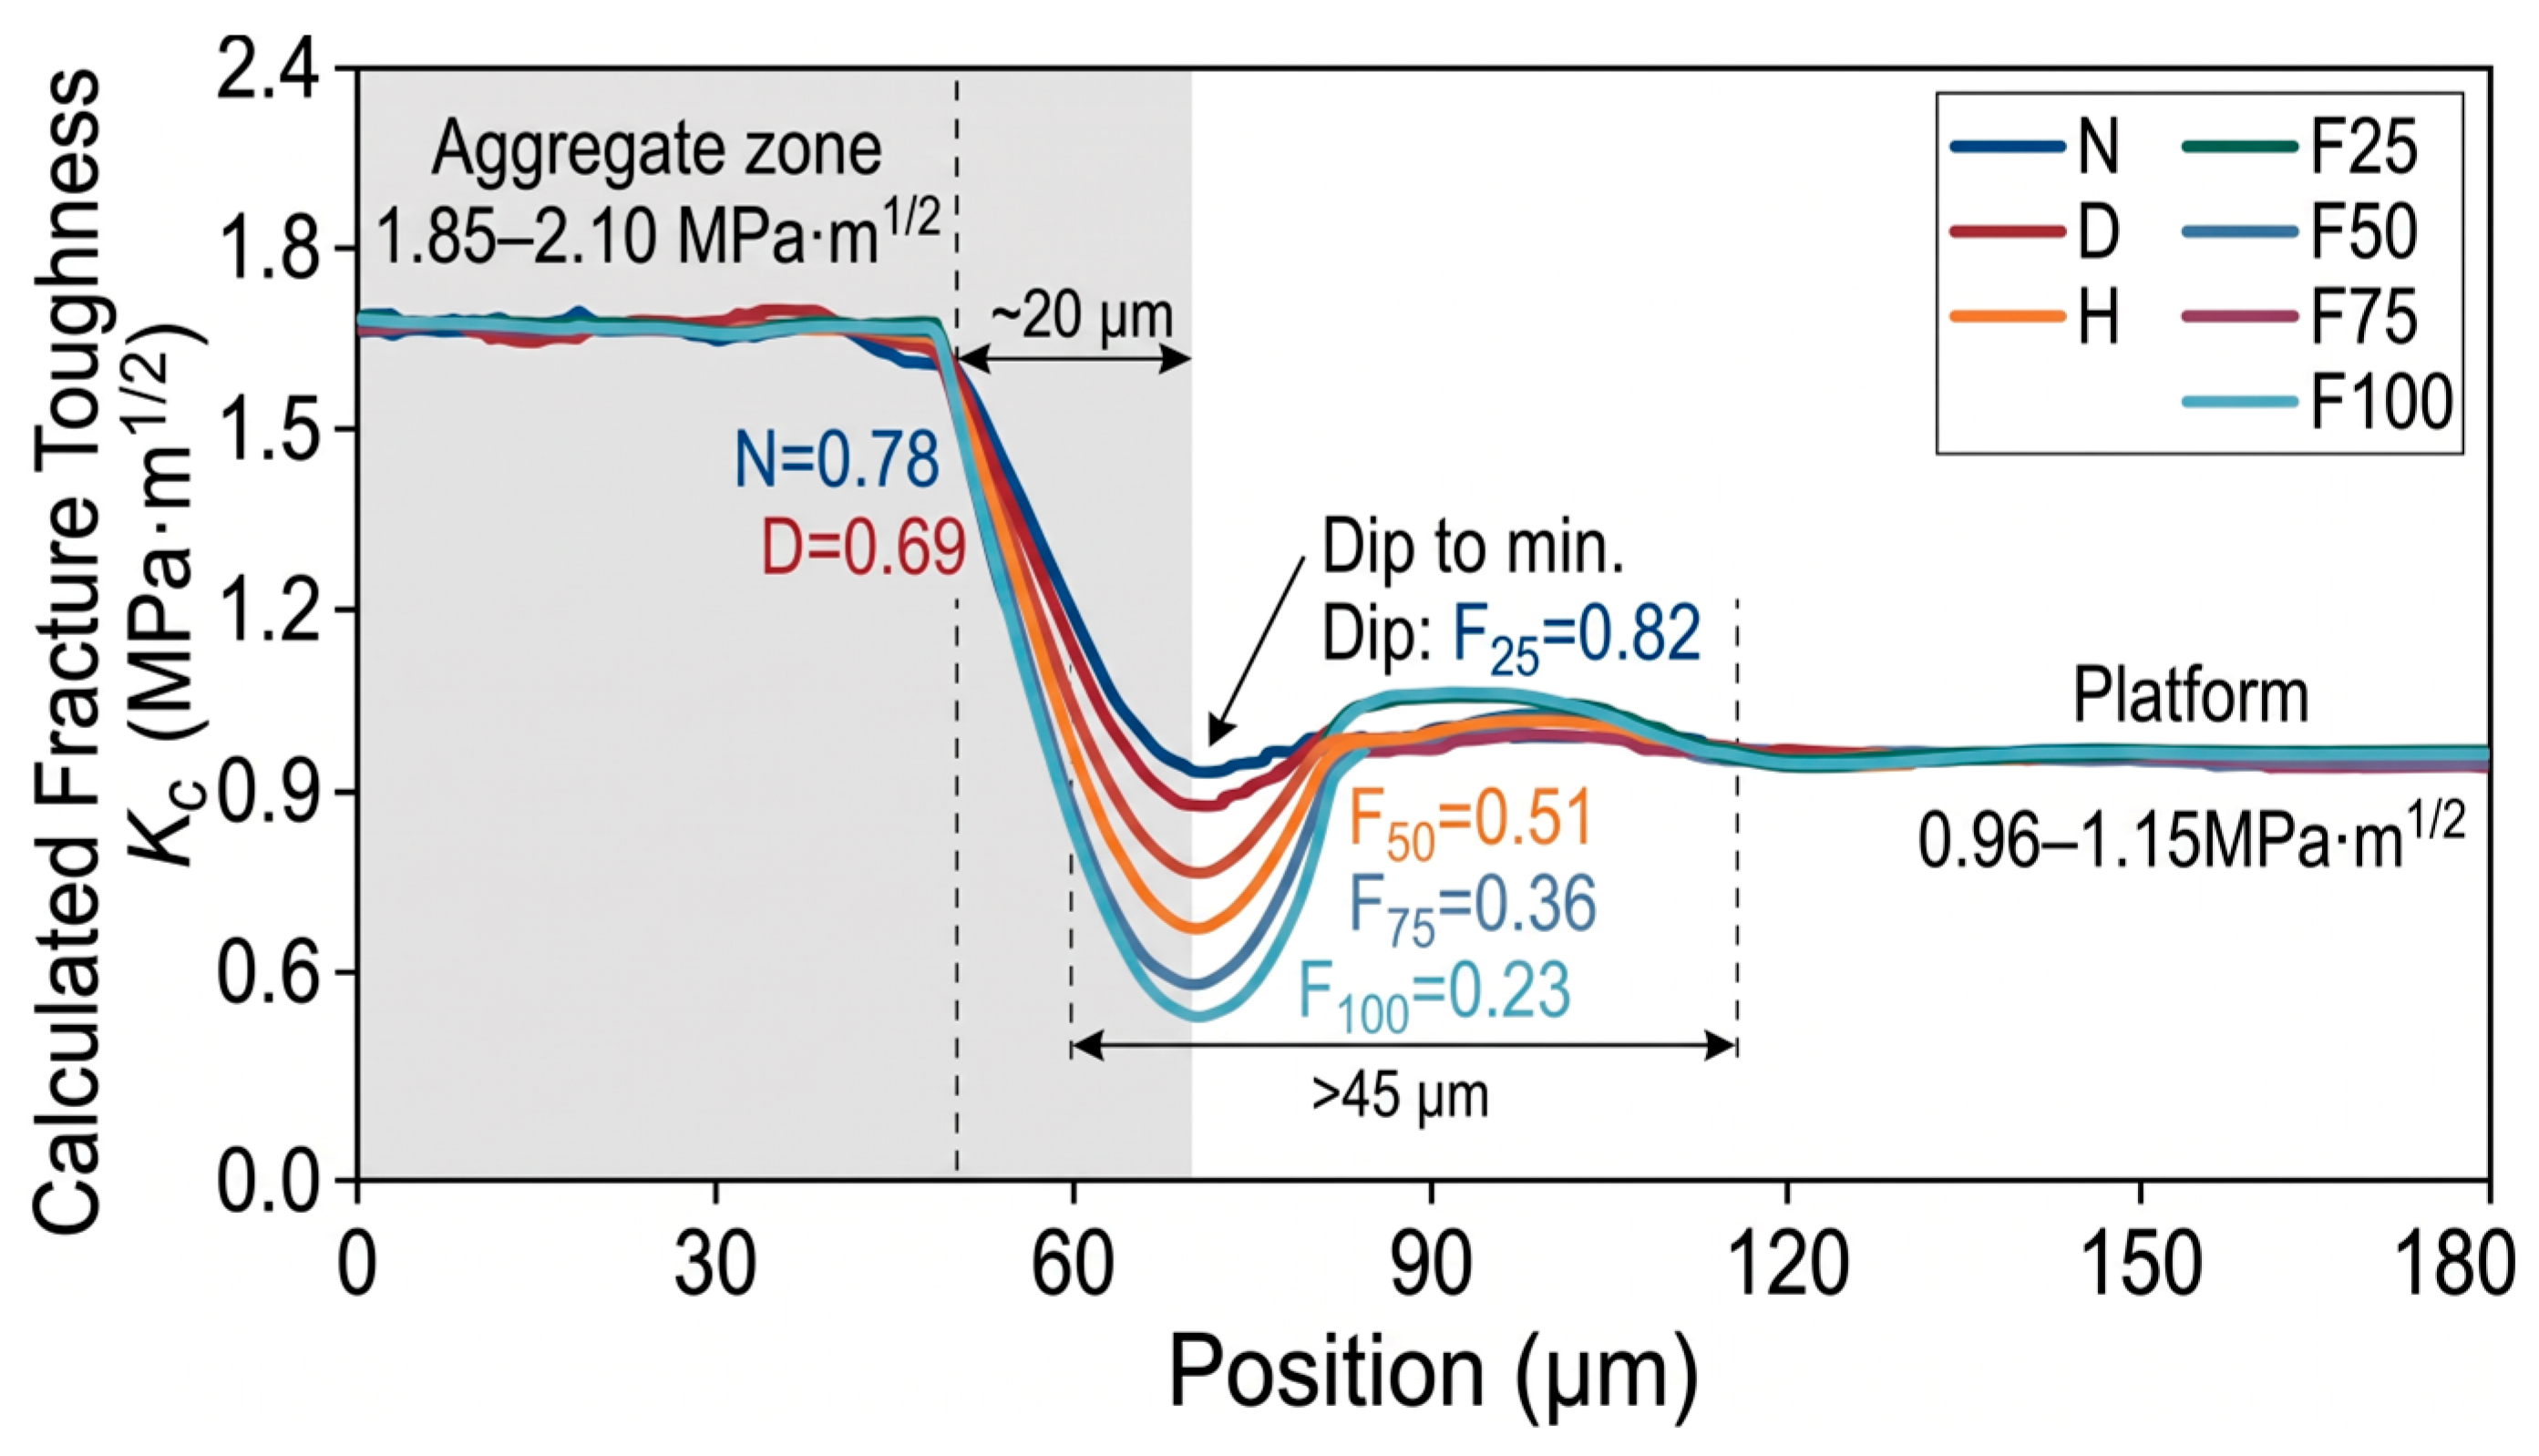
Typical profile of the calculated fracture toughness KC across the “aggregate–ITZ–cement paste matrix” are shown in Figure 7. In the aggregate region (−50 to 0 μm), extremely shallow scratch depths were recorded (d < 120 nm), with KC maintained at 1.85–2.10 MPa⋅m1/2. Upon entering the ITZ (0 to 35 μm), an abrupt surge in penetration depth and the formation of a pronounced trough were induced by the porous microstructure and oriented CH crystals, causing KC to drop to a global minimum. As the indenter traversed into the bulk cement paste matrix (>35 μm), KC recovered to a plateau of 0.95–1.15 MPa⋅m1/2, demonstrating a distinct gradient transition.
Figure 7.
Fracture toughness evolution across the “Aggregate–ITZ–cement paste” interface under different environmental conditions.
Significant weakening of the local critical fracture toughness and broadening of the damaged interfacial zone were induced by environmental damage:
Benchmark Group (N) and Continuous Drying Group (D): Sound interfacial bonding was exhibited by Group N, with and an ITZ trough width of approximately 20 μm. After continuous drying (Group D), influenced by drying shrinkage microstresses, decreased to 0.69 MPa⋅m1/2 (a reduction of 11.5%), while the softened bandwidth expanded to approximately 26 μm.
Extreme High-Temperature Group (H, 400 °C): Puncture-like sinking of the indenter was triggered in the ITZ due to thermal mismatch cracking and CH dehydration decomposition (peak penetration depth > 850 nm), resulting in a plunge of to 0.18 MPa⋅m1/2 (a drop of 76.9%), accompanied by a softened bandwidth exceeding 45 μm, indicating almost complete loss of crack resistance.
Freeze–Thaw Cycling Groups (F25–F100): Accelerated damage accumulation was exhibited with increasing cycle numbers. values for Groups F25, F50, F75, and F100 were degraded to 0.62, 0.51, 0.36, and 0.23 MPa⋅m1/2, respectively (reductions of 20.5% to 70.5%). At F75 and beyond, continuous interconnection of interfacial microcracks was driven by repeated frost heave of pore water, manifested as severe fluctuations in scratch resistance and continuous broadening of the trough bottom.
It is demonstrated by nanoscratch testing that the embrittlement and debonding tendency of the ITZ as a microscopic weak phase were exacerbated by environmental deterioration. The local toughness attenuation of the ITZ serves as a critical contributing factor closely associated with the degradation of macroscopic fracture energy Gf, reflecting the progressive weakening of localized interfacial resistance alongside matrix damage.
4.3. Microcrack Evolution
Quantitative statistics of the microcrack area ratio C under each condition after different environmental exposures are listed in Table 5. The initiation of nascent microcracks was accelerated by environmental damage, which further drove the evolution of internal defects from locally isolated distributions into highly interconnected fracture networks.
A dense matrix structure was exhibited by the benchmark group (N), where extremely fine and short microcracks (crack width < 0.5 μm) were only occasionally observed locally due to hydration autogenous shrinkage, with tight aggregate bonding and a microcrack area ratio C of merely 0.28%. After continuous drying (D) exposure, non-uniform drying shrinkage of the paste was induced by internal capillary negative pressure; microcracks propagated along capillary pores and gradually extended close to the aggregate boundaries, with C increasing to 0.84% (a 200% increase), although the crack tips remained mostly blunted without developing into through-going channels.
The densest thermal cracking network was triggered by extreme high-temperature exposure (H, 400 °C). Driven by the deformation mismatch between aggregate thermal expansion and the thermal decomposition shrinkage of the cementitious phase, severe cracking was induced by the decomposition of CH crystals at the interface. Microcracks not only formed circumferential tearing zones up to 2.0–5.5 μm wide along the ITZ, but also interconnected radially deep into the paste, causing the microcrack area ratio C to soar to 4.65% (reaching 16.6 times that of the benchmark group). The large-scale division of the microscopic load-bearing effective cross-section directly led to a drastic loss of macroscopic tensile stiffness and a catastrophic drop in peak load.
A distinct fatigue damage accumulation pattern was exhibited under rapid freeze–thaw cycles (F):
Microcrack density climbed monotonically: the microcrack area ratio C sequentially increased to 0.95%, 1.68%, 2.74%, and 3.82% for Groups F25, F50, F75, and F100, respectively.
Crack propagation migrated from interfaces toward through-matrix connectivity: during the early freeze–thaw stage (F25–F50), the mechanically weak ITZ was predominantly damaged by periodic frost heave pressure, with microcracks mostly appearing as arc-shaped/crescent cracks adhering to aggregate contours; during the middle-to-late freeze–thaw stage (F75–F100), microcracks were driven by fatigue damage to propagate unstably out of the interfaces into the hardened matrix and undergo bridge-linking between adjacent aggregates, ultimately evolving into high-density stepped crack networks.
It is confirmed by the quantitative evolution of the microcrack area ratio C that the exacerbation of internal geometric damage occurred synchronously with the climb in total porosity Pt and the degradation of interfacial nanoscale fracture toughness , thereby establishing the critical geometric boundary governing the nonlinear deterioration of macroscopic fracture energy Gf.
5. Pore–ITZ–Crack Synergistic Control Mechanism
5.1. Pore Structure and Fracture Energy
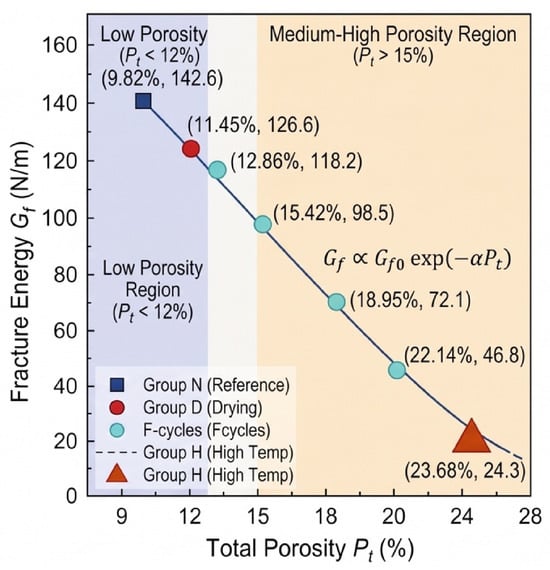
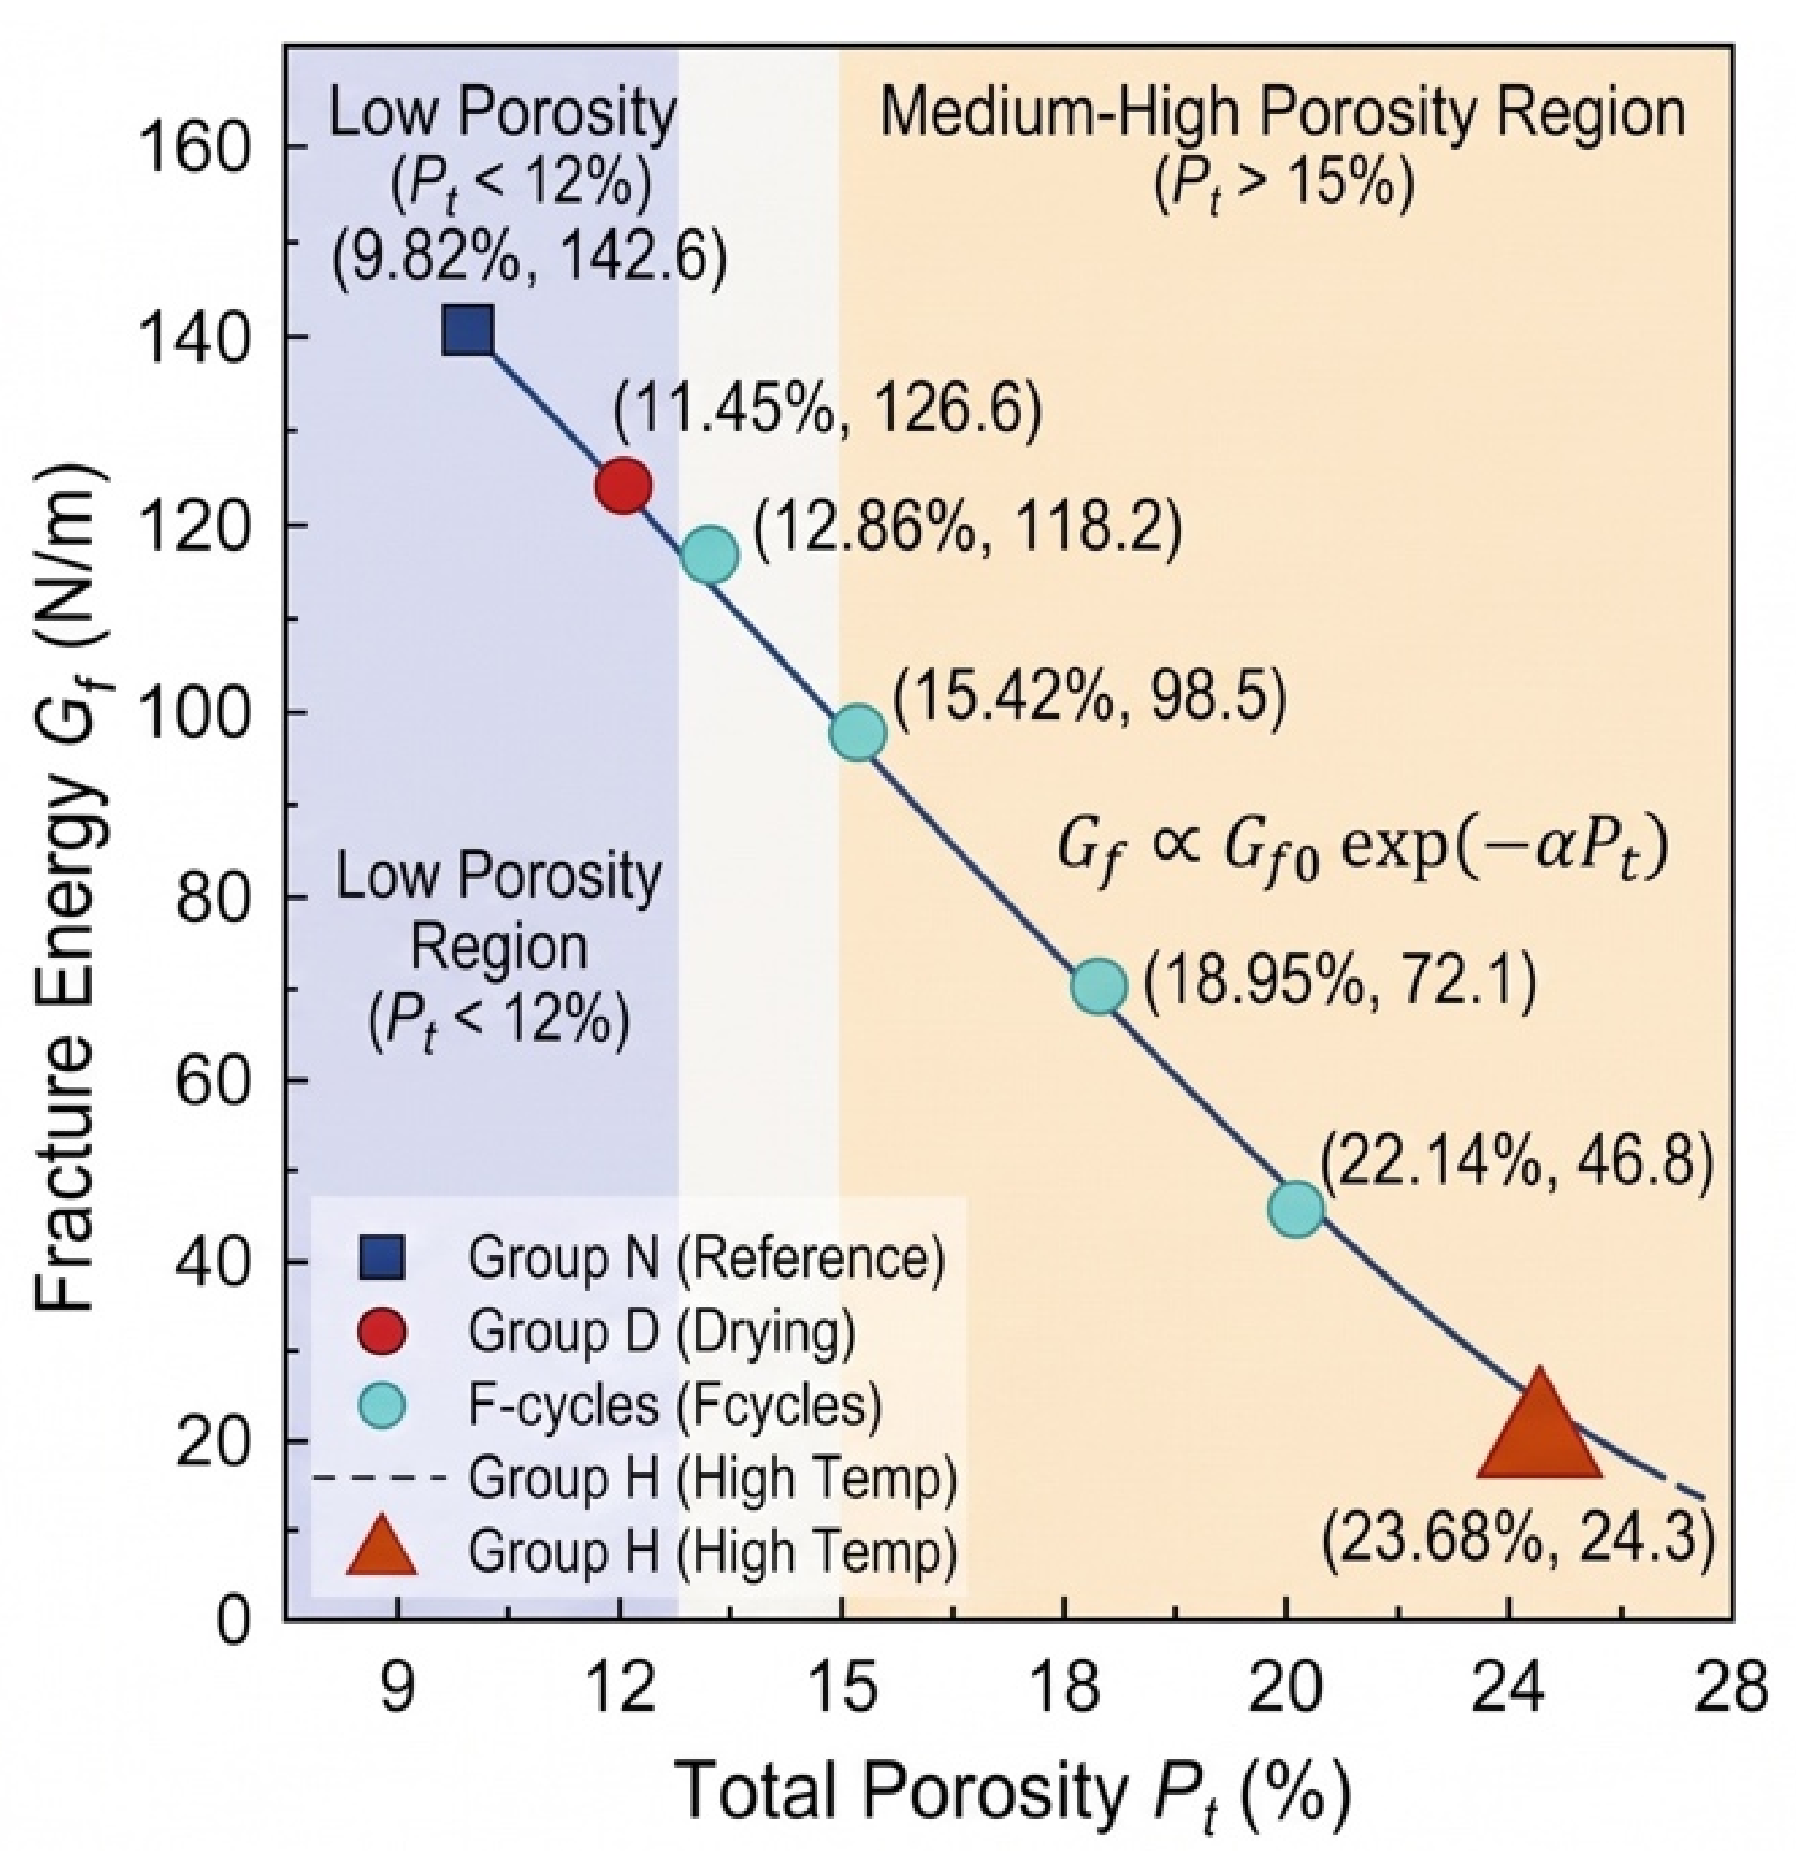
The macroscopic fracture energy Gf of the material is essentially determined by the chemical bond energy to be overcome per unit crack propagation area, lattice friction, and plastic deformation energy dissipation at the crack tip, whereas the volume fraction and size distribution of the internal micropore system directly govern the effective solid volume and the degree of localized stress concentration. A correlation analysis between the total porosity Pt measured in Section 4.1 and the macroscopic fracture energy Gf is performed, with the results depicted in Figure 8.
Figure 8.
Correlation analysis between total porosity (Pt) and macroscopic fracture energy (Gf) under multiple environmental conditions.
A pronounced nonlinear attenuation trend of Gf is exhibited with increasing total porosity Pt. In the low-porosity regime (Pt < 12%, corresponding to Groups N and D), high continuity of the calcium silicate hydrate (C-S-H) gel matrix is retained, with micropores dominated by harmless gel pores and less harmful transitional pores (<50 nm). In this regime, the net load-bearing cross-section is only slightly reduced locally by pores, and shearing through abundant continuous cementitious phases is still required for crack propagation, allowing the fracture energy to remain at a relatively high benchmark level (>125 N/m).
When the porosity transitions into the medium-to-high regime (Pt > 15%, corresponding to the severe freeze–thaw groups F75–F100 and high-temperature group H), an accelerated plunge in Gf occurs. The sharp climb in total porosity (reaching 23.68% in Group H) drastically diminishes the density of solid atomic bonding bonds per unit fracture area, causing a substantial contraction in the solid strain energy that must practically be overcome to tear during nominal macroscopic crack propagation.
According to the linear elastic microcrack initiation theory, the initial energy threshold for crack nucleation is lowered by coarse voids, which further causes the thin walls between micropores to undergo tensile-shear yielding and coalescence under low external loads, thereby driving an exponential or power-law decay of fracture energy:
where Gf0 represents the ultimate intrinsic fracture energy of the material in an ideal dense state, and α denotes the pore morphology sensitivity coefficient.
Gf∝Gf0exp(−αPt)
However, the deterioration of fracture energy under extreme exposure conditions cannot be fully linearly predicted by relying solely on the single macroscopic indicator Pt. For instance, while the total porosities of Group F100 (Pt = 22.14%) and Group H (Pt = 23.68%) are extremely close, the residual fracture energy of Group H (24.3 N/m) is merely about half of that of Group F100 (46.8 N/m). This significant deviation demonstrates that porosity reflects solely the volume-loss effect of the porous continuum, whereas the macroscopic fracture process exhibits a much stronger local dependence on the localized resistance of the aggregate interface and the initial microcrack connectivity. Consequently, introducing multi-scale coupling corrections via interfacial nanoscale toughness and microcrack density is urgently required.
5.2. ITZ Performance and Fracture Energy
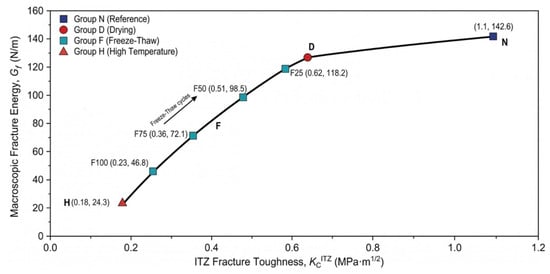
The aggregate–paste interfacial transition zone (ITZ), serving as the mechanically most fragile phase in cementitious composites, possesses a micro–nanoscale fracture toughness that directly governs the critical resistance against microcrack initiation and propagation along the interface. The mapping correlation between and the macroscopic fracture energy Gf under various environmental exposures is depicted in Figure 9. Experimental results demonstrate that Gf exhibits a distinct synergistic positive correlation with the degradation of , and their correspondence reveals the energy dissipation competition mechanism during macroscopic fracture processes.
Figure 9.
Mapping correlation between ITZ micromechanical fracture toughness () and macroscopic fracture energy (Gf) under diverse environmental conditions.
Under baseline and slightly damaged states (Groups N and D), high shear and crack-arrest toughness were retained in the ITZ region (). Because the local interfacial strength approached that of the hardened cement paste matrix, the main crack could not readily cut into the interface to induce debonding as it advanced toward the aggregate; instead, it was forced to undergo severe deflection, twisting, and branching under the obstruction of aggregates. This process markedly activated mechanical interlock and self-locking between rough crack faces, along with matrix frictional bridging mechanisms in the crack wake, thereby sustaining an exceptionally high fracture energy macroscopically (Gf > 125 N/m).
With the deepening of environmental deterioration, the abrupt plunge in interfacial nanoscale toughness directly triggered a short-circuit effect in the macroscopic energy dissipation pathway:
Enhanced interfacial adherence of crack propagation paths: During the rapid freeze–thaw stage (F25–F100), continuously deteriorated from 0.62 MPa⋅m1/2 to 0.23 MPa⋅m1/2. According to the strain energy release rate criterion, the crack tip invariably propagates along the path that minimizes energy dissipation. When falls significantly below the matrix toughness (), the energy barrier for primary crack propagation completely collapses at the interface, causing the crack to shift toward preferential slipping and coalescence along the weakened circumferential aggregate interface (debonding).
Dimensional reduction and degradation of energy dissipation: Under extreme high-temperature conditions (Group H), dropped to a minimum of 0.18 MPa⋅m1/2. At this stage, the ITZ lost its interfacial bonding stiffness required to transmit tensile and shear stresses, degrading the original three-dimensional solid shear-yielding dissipation into low-resistance two-dimensional interfacial slipping and debonding. The macroscopic fracture surface exhibited a smooth, stripped aggregate morphology, and the multiple cracking shielding effects within the fracture process zone (FPZ) were entirely lost, directly causing Gf to plummet drastically to 24.3 N/m.
While the current experimental observations primarily confirm a strong co-evolutionary correlation between interfacial properties and macroscopic fracture parameters, a mechanistic formulation can be proposed to represent the sensitivity of Gf to localized interfacial degradation. When remains high, fracture energy is sustained by combined matrix deformation and aggregate crack deflection; once drops below a critical threshold, interfacial debonding becomes the energetically favorable failure pathway. Within this analytical framework, the relative interfacial contribution can be phenomenologically described by:
where β denotes the aggregate geometric interlock coefficient, and γ represents the interfacial sensitivity exponent (with fitted values γ > 1.0). This further confirms that relying solely on macroscopic porosity Pt cannot fully capture the destructive impact of local low-resistance weak phases, demonstrating the necessity of incorporating nanoscale into the synergistic predictive framework for fracture energy.
5.3. ITZ Performance and Microcrack Development
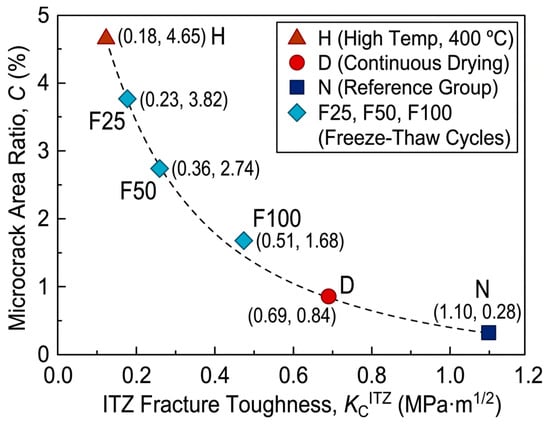
The networking of internal microcracks does not occur in isolation; rather, it exhibits an intensive intrinsic feedback loop with the degradation of the aggregate–paste interfacial transition zone (ITZ) nanomechanical properties. The dynamic mapping and synergistic failure mechanisms between the microcrack area ratio C and the interfacial fracture toughness under various environmental exposures are illustrated in Figure 10. A highly self-consistent, inverse nonlinear coupling relationship is manifested between the two, collectively unveiling the physical evolutionary pathway governing the material’s transition from “tough deflection cracking” to “low-resistance brittle slipping.”
Figure 10.
Mapping correlation between microcrack area ratio (C) and ITZ fracture toughness () under different environmental exposures.
During the initial damage stage (benchmark Group N and drying Group D), the elevated interfacial fracture toughness () establishes a compact mechanical barrier against microcrack initiation. When discrete microcracks induced by pristine autogenous shrinkage or mild drying shrinkage approach the aggregate surfaces, the critical interfacial cracking resistance exceeds the localized stress concentration peaks; consequently, the crack tips are forced to undergo passive deflection, twisting, or localized blunting and arrest. Throughout this stage, the microcrack area ratio is effectively confined to an exceptionally low level (C ≤ 0.84%), and the existing internal damage remains in a spatially discrete, uncoalesced, and stable state.
Once environmental deterioration drives the system below the interfacial cracking resistance threshold, a pernicious positive feedback loop of “interfacial weakening–crack coalescence” is triggered between the micromechanical properties and the meso-microstructure:
Stress redistribution and abrupt plunge in microcrack nucleation threshold: During rapid freeze–thaw cycles (F25 → F100), the cyclic phase-change expansion of pore water drives a stepwise degradation of (plummeting from 0.62 to 0.23 MPa⋅m1/2). The mechanical softening of the interface substantially impairs the strain energy shielding limit around the aggregates, driving microcracks to preferentially initiate and tear along the circumferential ITZ, which propels the C value from 0.95% to 3.82%. Concomitant with the propagation of interfacial debonding gaps, the stress transfer efficiency from the aggregates to the matrix is lost, forcing the undamaged matrix to sustain elevated localized shear stresses. This in turn accelerates the mutual penetration and bridge-linking of microcracks between adjacent aggregates.
Interphase decoupling and macroscopic unstable breakthrough: Under extreme high-temperature exposure (Group H), thermal incompatibility mismatch and the thermal decomposition of CH completely collapse to a nadir of 0.18 MPa⋅m1/2. At this point, the interfacial crack-resistance energy dissipation breaks down entirely. The crack tips preferentially select the aggregate contours, where energetic resistance is virtually zero, for rapid debonding and extension, ultimately unleashing a full-scale outbreak of radial microcrack networking (C surges to 4.65%). Under external loading, the macroscopic fracture crack can directly penetrate along the pre-existing interconnected “interface–matrix” microcrack network at an exceptionally high velocity in a brittle manner, resulting in an abrupt, truncated drop in the post-peak softening regime.
In summary, the degradation of exhibits an inverse co-evolutionary trend with the microcrack area ratio C, reflecting the coupled physical processes of localized mechanical weakening and geometric defect accumulation under environmental stress. Rather than representing a unidirectional causal dependency, these observed correlations indicate that microcrack networking and interfacial softening jointly characterize the damage state of the material, providing mutually reinforcing descriptors for the nonlinear decay of macroscopic fracture energy Gf.
5.4. Unified Microscopic Control Mechanism
Based on the decoupled correlation mechanisms between macroscopic fracture energy and pore structure (Section 5.1), interfacial mechanics (Section 5.2), and microcrack density (Section 5.3), the macroscopic fracture energy Gf is not governed by a single microscopic parameter; rather, it is cross-scale dominantly controlled by the synergy of “porous matrix volume deficit (Pt)–microcrack networked defects (C)–interfacial shear crack-arrest barrier ().” To quantitatively characterize the evolution of macro–micromechanical fracture performance under extreme environments, a synergistic predictive model for fracture energy that comprehensively incorporates three-dimensional microstructural damage variables was developed:
where Gf0, Pt0, and denote the measured fracture energy (142.6 N/m), total porosity (9.82%), and interfacial fracture toughness (0.78 MPa⋅m1/2) of the benchmark group (N), respectively; α represents the pore coarsening attenuation coefficient, characterizing the exponential shrinkage effect of the effective load-bearing ligament in the porous continuum; λ is the geometric damage factor of the microcrack network, reflecting the direct cutting effect of interconnected microcracks on the stress concentration and premature instability within the crack-tip process zone; and γ signifies the nonlinear contribution exponent of the interfacial transition zone, capturing the energy short-circuit sensitivity as the primary crack propagation path degrades from three-dimensional tortuous deflection to two-dimensional interfacial debonding.
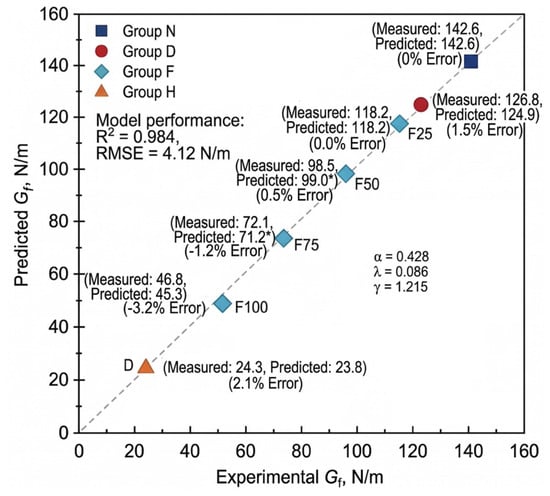
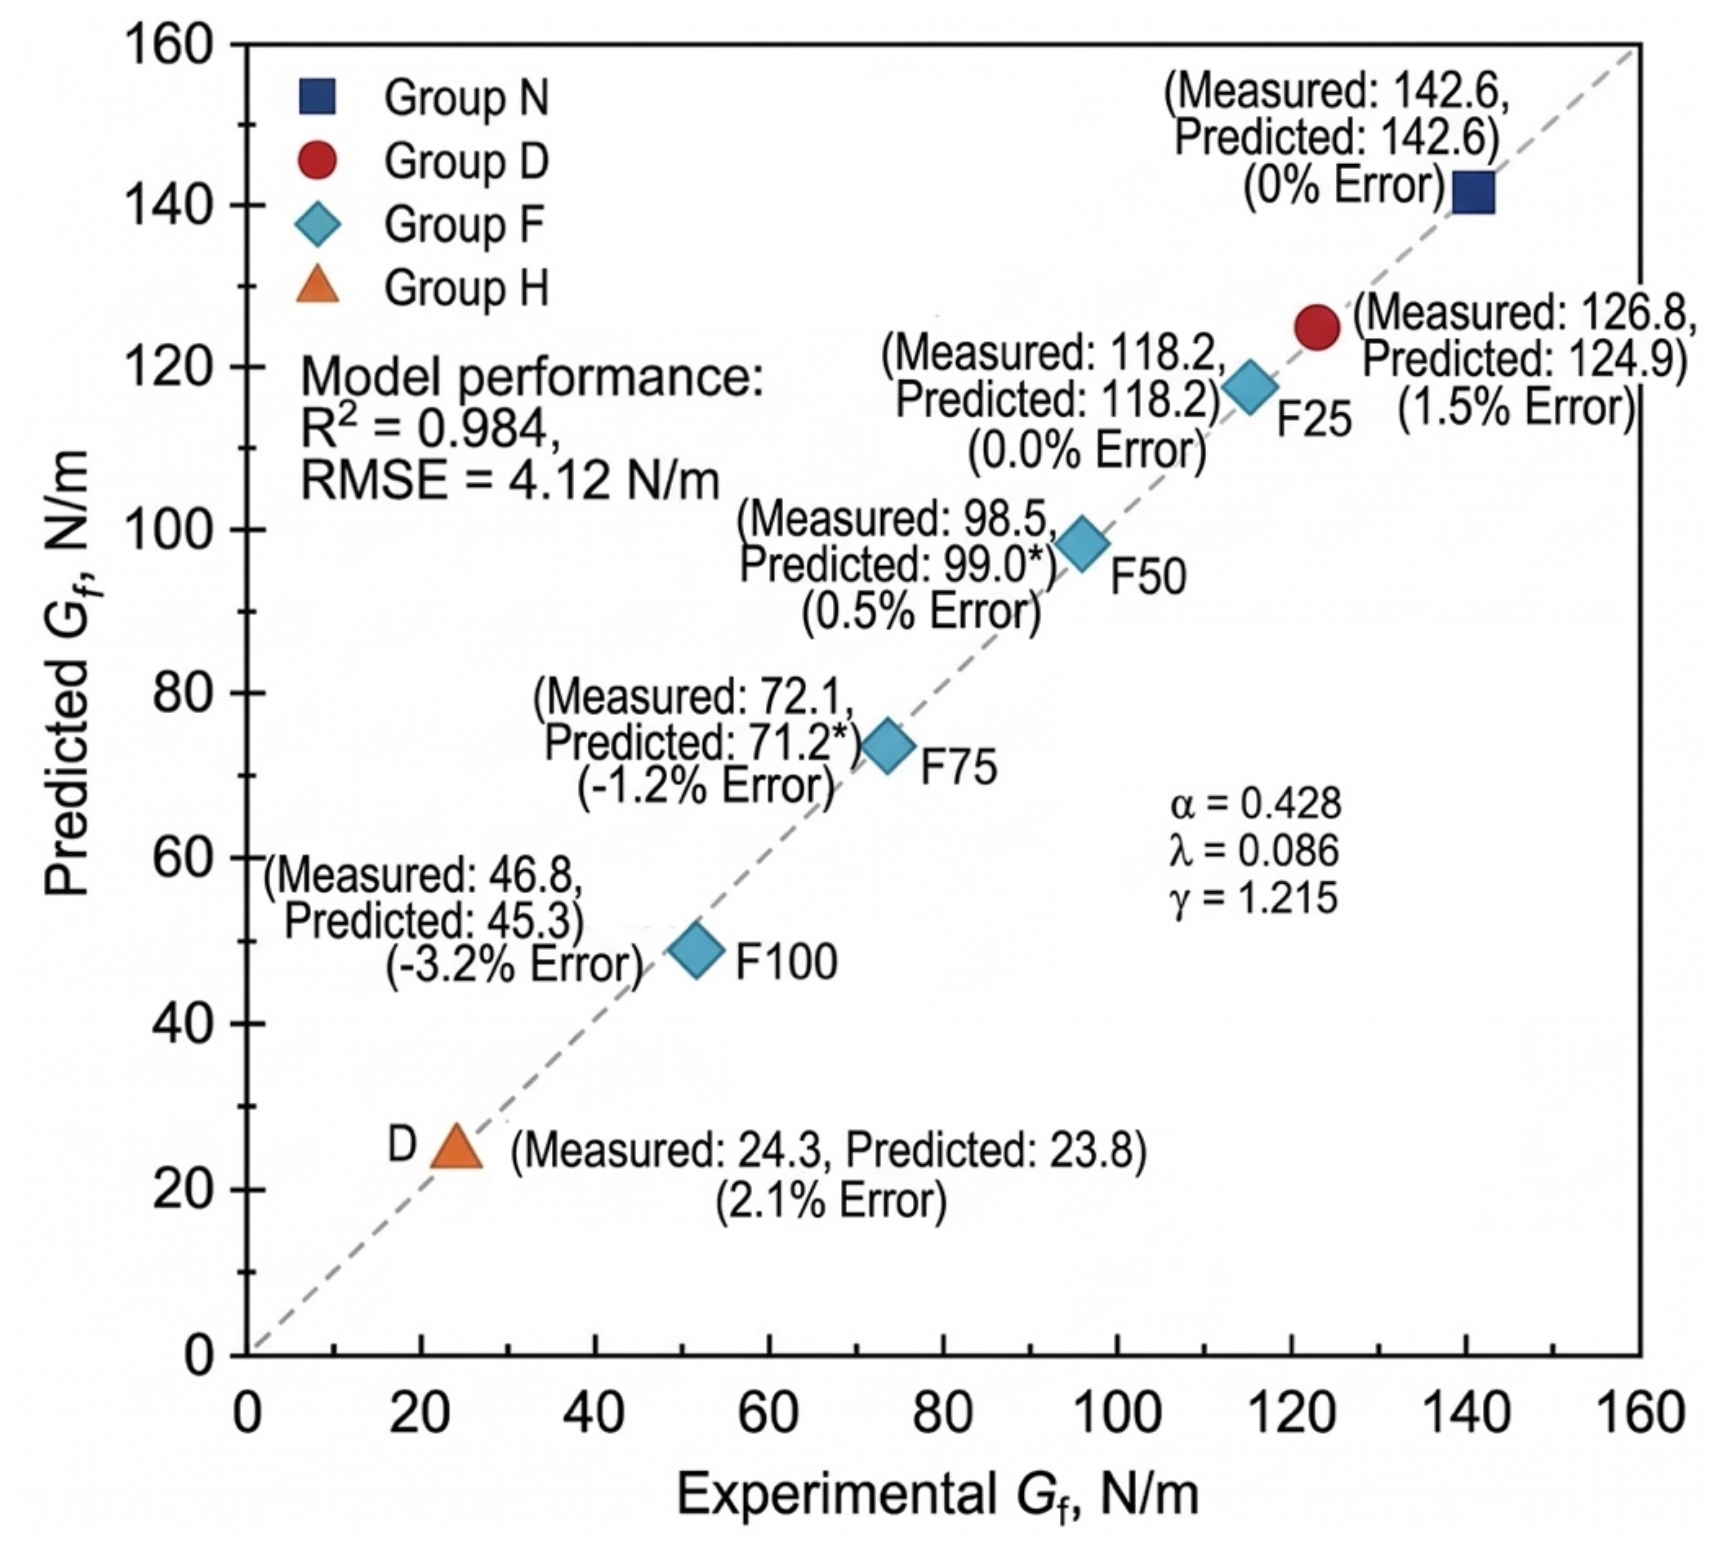
The model parameters were determined using the Levenberg–Marquardt non-linear least-squares algorithm based on the 7 independent environmental exposure regimes (where each condition represents the statistical average of four replicate beam specimens). The calibrated parameters and their associated uncertainty estimates are α = 0.428 ± 0.041 (95% confidence interval [CI]: [0.314, 0.542]), λ = 0.086 ± 0.012 (95% CI: [0.053, 0.119]), and γ = 1.215 ± 0.118 (95% CI: [0.887, 1.543]). All parameters exhibit high statistical significance (p < 0.01). The comparative evaluation between the calibrated model predictions and experimentally measured values is presented in Figure 11. Across the full calibration dataset, the model achieves a goodness-of-fit of R2 = 0.984 with a root-mean-square error (RMSE) of 4.12 N/m.
Figure 11.
Comparison and validation between experimental and model-predicted macroscopic fracture energy (Gf) based on the cross-scale synergistic predictive model. Values marked with an asterisk (*) are predicted using empirical damage-correction factors for intermediate freeze-thaw stages.
The comparative validation between model-predicted and experimentally measured values under each condition is presented in Figure 11. Across the full calibration dataset, the model achieves a goodness-of-fit of the model reaches R2 = 0.984, with a root-mean-square error (RMSE) of merely 4.12 N/m:
Drying condition (D): Although microcracks initiated slightly and Pt rose moderately, retained a high barrier of 0.69 MPa⋅m1/2; consequently, the model-predicted value (124.9 N/m) exhibited excellent agreement with the experimental value (126.8 N/m), yielding an error of only 1.5%.
Freeze–thaw cycles (F25–F100): The model accurately captured the accelerated attenuation regime of fracture energy triggered by falling below the critical threshold and the cross-scale bridge-linking of microcracks C during the middle-to-late freeze–thaw stages (predicted value of 45.3 N/m versus measured value of 46.8 N/m for F100).
Extreme high-temperature condition (H): The predictive insensitivity encountered by the single-porosity model between Groups F100 and H in Section 5.1 was effectively resolved. By explicitly accounting for the severe interphase decoupling effect—manifested by plunging to 0.18 MPa⋅m1/2 and C soaring to 4.65%—the model accurately captured the catastrophic plunge in fracture energy under high-temperature (predicted value of 23.8 N/m versus measured value of 24.3 N/m, with an error of merely 2.1%).
Because the model calibration was performed using the 7 exposure conditions, evaluating model performance strictly on the same calibration dataset reflects fitting fidelity rather than independent out-of-sample validation. To rigorously examine whether the model suffers from overfitting given the limited sample size (N = 7) and to assess its generalization capability, a Leave-One-Out Cross-Validation (LOOCV) procedure was performed. In each iteration, one environmental condition was withheld as an independent test set while the remaining six conditions were utilized to recalibrate the model parameters. The resulting out-of-sample cross-validation evaluation yielded and RMSECV = 6.35 N/m. The minimal performance degradation between the calibration goodness-of-fit (R2 = 0.984) and cross-validation score () demonstrates that the proposed formulation possesses robust predictive stability across diverse damage regimes without artificial overparameterization.
Furthermore, a local parametric sensitivity analysis was conducted by applying a ±10% perturbation to each calibrated parameter. The results indicate that the model exhibits the highest sensitivity to the ITZ exponent γ, inducing an average shift of 14.2% in predicted Gf (reaching up to 16.8% under extreme thermal damage in Group H), whereas identical ±10% perturbations in α and λ lead to average shifts of 4.1% and 3.5%, respectively. This sensitivity ranking quantitatively confirms that interfacial shear barrier degradation serves as the primary governing driver dictating the catastrophic collapse of macroscopic fracture energy.
In summary, these calibration, cross-validation, and sensitivity evaluations confirm that the formulated synergistic predictive model successfully bridges the cross-scale mechanical mapping chain from nano mechanics and micro-geometric defects to macroscopic structural toughness and energy dissipation, exhibiting strong numerical stability and clear physical significance.
6. Conclusions
This study systematically investigated the effects of benchmark curing (N), continuous drying (D), extreme high-temperature (H, 400 °C), and rapid freeze–thaw cycles (F25–F100) on the fracture properties of cementitious materials. By integrating mercury intrusion porosimetry (MIP), nanoscratch testing, and digital image processing techniques, the evolutionary mechanisms of microstructural parameters were elucidated, and a cross-scale synergistic predictive model for fracture energy was formulated. The principal conclusions are drawn as follows:
- Macroscopic fracture properties exhibited pronounced environmental sensitivity and nonlinear degradation characteristics. Continuous drying induced a minor reduction in fracture energy Gf (11.1%); extreme high-temperature triggered a catastrophic plunge in macroscopic load-bearing capacity and energy dissipation capacity, with Pmax and Gf diminishing by 83.9% and 83.0%, respectively, manifesting typical brittle fracture; rapid freeze–thaw cycles induced progressive fatigue damage, causing Gf to exhibit an attenuation trend characterized by “mild initial deterioration followed by accelerated decay” (with a 67.2% reduction at F100). The macroscopic fracture morphology transitioned from tortuous deflection and aggregate mechanical interlock in the benchmark group to smooth aggregate exposure and low-resistance interfacial debonding in the deteriorated groups.
- Microstructural and localized phase damage unveiled the physical drivers of material embrittlement. Environmental exposures led to a substantial climb in total porosity Pt accompanied by a coarsening and rightward shift in critical pore diameter dcr. Nanoscratch testing confirmed that the aggregate–paste interfacial transition zone (ITZ) consistently exhibited the lowest localized fracture resistance within the composite, where underwent substantial degradation under extreme high-temperature and prolonged freeze–thaw cycles (falling to a minimum of 0.18 MPa⋅m1/2). The experimental trends demonstrate a synchronized evolution among pore coarsening, ITZ softening, and microcrack networking, which collectively account for the macroscopic transition toward low-resistance interfacial failure.
- An intrinsic positive feedback loop and synergistic mechanisms governing multiscale mechanical deterioration were revealed. A cross-scale synergistic predictive model for fracture energy was established, quantitatively incorporating the porous matrix volume deficit (Pt), microcrack network geometric segmentation (C), and interfacial crack-arrest shear barrier (). This model successfully eliminated the predictive insensitivity inherent to single-porosity indicators under extreme conditions such as high temperatures and severe freeze–thaw cycles. The predicted values exhibited excellent agreement with the experimental data (R2 = 0.984, RMSE = 4.12 N/m), thereby providing a theoretical foundation for durability evaluation and crack-resistant toughening design of cementitious materials in extreme service environments.
Author Contributions
Conceptualization, J.L. and X.H.; methodology, J.L. and X.H.; software, J.L. and S.Z.; validation, J.L., S.Z., S.C. and W.K.; formal analysis, J.L. and S.Z.; investigation, J.L. and S.C.; resources, X.H.; data curation, J.L. and S.Z.; writing—original draft preparation, J.L.; writing—review and editing, X.H. and W.K.; visualization, J.L. and S.Z.; supervision, X.H.; project administration, X.H. All authors have read and agreed to the published version of the manuscript.
Funding
This research received no funding.
Data Availability Statement
Data available on request from the authors.
Conflicts of Interest
The authors declare that they have no known competing financial interests or personal relationships that could have appeared to influence the work reported in this paper.
References
- Zeng, M.H.; Wu, Z.M.; Zheng, J.J.; Yu, R.C. A mesoscopic numerical method for fracture energy of concrete. Fatigue Fract. Eng. Mater. Struct. 2023, 46, 2380–2395. [Google Scholar] [CrossRef] [Scilit]
- Yin, Y.; Hu, S.; Lian, J.; Liu, R. Fracture properties of concrete exposed to different sulfate solutions under drying-wetting cycles. Eng. Fract. Mech. 2022, 266, 108406. [Google Scholar] [CrossRef] [Scilit]
- Chen, W.; Peng, L.; Yang, H.; He, X. Residual fracture energy of natural and recycled aggregate concrete after exposure to high temperatures. Struct. Concr. 2023, 24, 1879–1892. [Google Scholar] [CrossRef] [Scilit]
- Wan, Y.; Wang, R.; Liu, Y.; Zhou, S.; Cai, H.; Gu, M.; Li, D.; Li, W. Non-fitting theoretical models for the fracture properties of concretes subjected to high temperature. J. Build. Eng. 2023, 68, 106086. [Google Scholar] [CrossRef] [Scilit]
- He, J.; Wang, H.; Yu, Q. Flexural fracture behavior of ultra-high performance concrete after high-temperature exposure. Constr. Build. Mater. 2025, 481, 141544. [Google Scholar] [CrossRef] [Scilit]
- Kucharczyková, B.; Šimonová, H.; Kocáb, D.; Topolář, L. Advanced evaluation of the freeze-thaw damage of concrete based on the fracture tests. Materials 2021, 14, 6378. [Google Scholar] [CrossRef] [Scilit] [PubMed]
- Fan, B.; Gao, Z.; Song, L.; Wu, W.; Guo, B.; Su, K.; Li, T. Investigation on the effect of freeze–thaw cycles on damage characteristics of concrete under mixed mode I-II load conditions. Theor. Appl. Fract. Mech. 2024, 133, 104562. [Google Scholar] [CrossRef] [Scilit]
- Borowska, S.; Kosior-Kazberuk, M. Application of fracture energy for the assessment of frost degradation of high-strength concretes. Bud. Archit. 2021, 20, 57–68. [Google Scholar] [CrossRef] [Scilit]
- Han, X.; Zhao, Q.; Jia, B.; Liu, J.; Li, Q.; Zhang, Q. A method for determining the fracture toughness of shotcrete materials subjected to freeze–thaw cycles. Materials 2025, 18, 171. [Google Scholar] [CrossRef] [Scilit] [PubMed]
- Müller, M.; Ludwig, H.-M.; Hasholt, M.T. Salt frost attack on concrete: The combined effect of cryogenic suction and chloride binding on ice formation. Mater. Struct. 2021, 54, 189. [Google Scholar] [CrossRef] [Scilit]
- Jin, S.; Zhao, X.; Tai, Y.; Zhou, J. Multiscale model for the scale effect of tensile strength of hardened cement paste based on pore size distribution. Constr. Build. Mater. 2022, 325, 126775. [Google Scholar] [CrossRef] [Scilit]
- Moini, R.; Baghaie, A.; Rodriguez, F.B.; Zavattieri, P.D.; Youngblood, J.P.; Olek, J. Quantitative microstructural investigation of 3D-printed and cast cement pastes using micro-computed tomography and image analysis. Cem. Concr. Res. 2021, 147, 106493. [Google Scholar] [CrossRef] [Scilit]
- Rao, F.; Zhang, Z.; Ye, G.; Liu, J.; Han, J. Mesostructure of foamed cement paste and its influence on macromechanical behavior. J. Mater. Civ. Eng. 2021, 33, 04021114. [Google Scholar] [CrossRef] [Scilit]
- Guo, P.; Meng, W.; Bao, Y. Automatic identification and quantification of dense microcracks in high-performance fiber-reinforced cementitious composites through deep learning-based computer vision. Cem. Concr. Res. 2021, 148, 106532. [Google Scholar] [CrossRef] [Scilit]
- Ševčík, R.; Adámková, I.; Vopálenský, M.; Martauz, P.; Šmilauer, V. Microcrack and porosity development in sealed cement mortars measured with micro-computed tomography. Materials 2024, 17, 3239. [Google Scholar] [CrossRef] [Scilit] [PubMed]
- Kinda, J.; Bourdot, A.; Charpin, L.; Michel-Ponnelle, S.; Benboudjema, F. Investigation of drying shrinkage of cement-based materials assisted by digital image correlation. J. Mater. Civ. Eng. 2022, 34, 04021477. [Google Scholar] [CrossRef] [Scilit]
- Segawa, M.; Aili, A.; Maruyama, I. Comparison of shrinkage and mass change of hardened cement paste under gradual drying and rapid drying. Cement 2022, 10, 100047. [Google Scholar] [CrossRef] [Scilit]
- Shen, J.; Li, W.; Xu, Q.; Wang, S.; Qian, P. Initial microcrack characteristics of concrete interfacial transition zone and cement paste. J. Mater. Civ. Eng. 2023, 35, 04023446. [Google Scholar] [CrossRef] [Scilit]
- Korouzhdeh, T.; Eskandari-Naddaf, H.; Kazemi, R. The ITZ microstructure, thickness, porosity and its relation with compressive and flexural strength of cement mortar; influence of cement fineness and water/cement ratio. Front. Struct. Civ. Eng. 2022, 16, 191–201. [Google Scholar] [CrossRef] [Scilit]
- Huang, Y.; Hu, X.; Shi, C.; Wu, Z. Review on the formation and improvement of interfacial transition zone between cement paste and aggregate in concrete. Mater. Rep. 2023, 37, 21050009. [Google Scholar]
- Li, W.; Luo, Z.; Gan, Y.; Wang, K.; Shah, S.P. Nanoscratch on mechanical properties of interfacial transition zones (ITZs) in fly ash-based geopolymer composites. Compos. Sci. Technol. 2021, 214, 109001. [Google Scholar] [CrossRef] [Scilit]
- Wei, Y.; Kong, W.; Wang, Y.; Sha, A. Multifunctional application of nanoscratch technique to characterize cementitious materials. Cem. Concr. Res. 2021, 140, 106318. [Google Scholar] [CrossRef] [Scilit]
- Liu, J.; Zuo, F.; Liu, C. A trans-scale Young’s modulus calculation model of ITZ based on void shape randomness and calcium hydroxide enrichment. Adv. Mater. Sci. Eng. 2020, 2020, 9430875. [Google Scholar] [CrossRef] [Scilit]
- Zou, C.; Long, G.; Zeng, X.; Ma, K.; Xie, Y. Hydration and multiscale pore structure characterization of steam-cured cement paste investigated by X-ray CT. Constr. Build. Mater. 2021, 282, 122629. [Google Scholar] [CrossRef] [Scilit]
- Kong, W.; Wei, Y.; Wang, Y.; Sha, A. Development of micro and macro fracture properties of cementitious materials exposed to freeze-thaw environment at early ages. Constr. Build. Mater. 2021, 271, 121502. [Google Scholar] [CrossRef] [Scilit]

Disclaimer/Publisher’s Note: The statements, opinions and data contained in all publications are solely those of the individual author(s) and contributor(s) and not of MDPI and/or the editor(s). MDPI and/or the editor(s) disclaim responsibility for any injury to people or property resulting from any ideas, methods, instructions or products referred to in the content. |
© 2026 by the authors. Licensee MDPI, Basel, Switzerland. This article is an open access article distributed under the terms and conditions of the Creative Commons Attribution (CC BY) license.