


Abstract
To address the limitations of traditional timber mortise-and-tenon joints, particularly their low pull-out resistance and rapid stiffness degradation under cyclic loading, this study proposes a novel integrated sleeve mortise-and-tenon steel–timber composite beam–column joint. Building upon prior experimental validation and numerical model verification, a comprehensive parametric study was conducted to systematically investigate the influence of key geometric parameters on the seismic performance of the joint. The investigated parameters included beam sleeve thickness (1–10 mm), sleeve length (150–350 mm), bolt diameter (4–16 mm), and the dimensions and thickness of stiffeners. The results indicate that a sleeve thickness of 2–3 mm yields the optimal overall performance: sleeves thinner than 2 mm are prone to yielding, while those thicker than 3 mm induce stress concentration in the timber beam. A sleeve length of approximately 250 mm provides the highest initial stiffness and a ductility coefficient exceeding 4.0, representing the best seismic behavior. Bolt diameters within the range of 8–10 mm produce full and stable hysteresis loops, effectively balancing load-carrying capacity and energy dissipation; smaller diameters lead to pinching failure, whereas larger diameters trigger premature plastic deformation in the timber. Furthermore, stiffeners with a width of 40 mm and a thickness of 2 mm effectively enhance joint stiffness, promote a uniform stress distribution, and mitigate local damage. The optimized joint configuration demonstrates excellent ductility, stable hysteretic behavior, and a high load capacity, providing a robust technical foundation for the design and practical application of advanced steel–timber composite connections.
1. Introduction
Traditional Chinese timber structures are fundamentally based on mortise-and-tenon joints, reflecting the classical design principle of “strong joints, weak members,” which exemplifies ancient engineering ingenuity. However, this traditional design faces significant challenges in meeting modern seismic performance standards. The inherent anisotropy of timber creates critical limitations in conventional mortise-and-tenon connections, particularly manifested as inadequate pull-out resistance and accelerated stiffness degradation under cyclic loading conditions. The strategic integration of steel components offers a viable solution to these limitations, leveraging their high strength and superior ductility characteristics. Steel–timber composite joints capitalize on the complementary properties of both materials, achieving synergistic structural performance that maintains traditional craftsmanship while significantly improving seismic resilience. Consequently, these hybrid connections have become a focal point in contemporary research on sustainable and resilient timber construction systems.
Extensive research has been conducted on steel–timber composite joints in recent years, with notable progress in understanding their mechanical behavior and performance characteristics. Wang et al. [1] systematically evaluated the rotational deformation capacity of bolted steel-plate timber joints using combined experimental and numerical methods, demonstrating the significant impact of bolt diameter on joint stiffness characteristics. Sun et al. [2] experimentally characterized the load-carrying capacity of beam–column connections reinforced with self-tapping screws, developing a theoretical calculation model for performance prediction. Luo [3] optimized the configuration of bolted timber joints with embedded steel plates, analyzing corresponding variations in flexural stiffness and strength. Zhou et al. [4] employed three-dimensional finite element modeling to predict embedment strength in dowel-type connections and validated model accuracy against test data. Thomas et al. [5] analyzed the force transfer mechanism in steel-plate-reinforced bolted joints and verified the applicability of European yield theory. Masaeli et al. [6] studied the effect of bolt arrangements on the performance of LVL double-beam connectors and developed an interaction model to capture load-sharing behavior. Wang et al. [7,8,9] experimentally and theoretically evaluated the initial rotational stiffness of unstiffened end-plate connections and discussed the implications of semi-rigid behavior on internal force distribution in joints. Fang et al. [10] conducted shear tests on steel–timber composite connections, examining the effects of bolt spacing and timber thickness on shear capacity. Tong et al. [11] explored the cyclic performance of cast-steel beam–column connectors and reported excellent energy dissipation characteristics. Keipour et al. [12] demonstrated through testing that steel–timber hybrid systems exhibit notable ductility and seismic resilience. Kaliyanarul et al. [13] investigated the behavior of single-bolt double-shear steel–timber joints under large deformations and used finite element analysis to predict failure modes. Le et al. [14] evaluated the fire resistance of I-section steel beams encased in timber with bolted connections, confirming their favorable performance under elevated temperatures. Krzywon [15] studied the flexural behavior of timber beams strengthened with various composites at high temperatures, identifying the superior efficacy of CFRP and SRP strips. Dong et al. [16] showed via shake-table tests that buckling-restrained steel braces can significantly enhance both load capacity and energy dissipation in steel–timber hybrid frames. Lu et al. [17] investigated mortise-and-tenon joints retrofitted with steel energy-dissipating bracket sets, proposing strategies to improve joint stiffness and strength. Luo [18] conducted low-cycle reversed loading tests on a novel channel-section steel-reinforced steel–timber composite joint, evaluating its mechanical and seismic performance.
Building upon the aforementioned research, this study presents a novel integrated sleeve mortise-and-tenon steel–timber composite beam–column joint system. This prefabricated connection system consists of timber beams, timber columns, and a steel sleeve, all manufactured off-site. Its on-site assembly involves only bolt fastening, providing substantial benefits in terms of construction efficiency and quality assurance. In prior research [19], the authors experimentally investigated and numerically simulated the joint’s behavior under four reinforcement scenarios: unreinforced, structural adhesive, angle-steel-stiffened, and 4/6 mm steel-sleeve-reinforced configurations. Comprehensive analysis was conducted on key parameters including failure mechanisms, moment–rotation (M-θ) relationships, tenon pull-out displacements, and strain distribution patterns. Based on measured timber material properties and actual connection details, numerical models were developed in ABAQUS 2021, and the close agreement between simulated and experimental results confirmed the reliability of the finite element approach.
Given the high economic costs, time constraints, and limitations in experimental facilities, conducting extensive experimental campaigns with multiple parameter variations is impractical. To overcome these limitations, this study utilizes a finite element simulation based on prior experimental data and numerical models to systematically investigate the mechanical performance of the novel integrated sleeve mortise-and-tenon steel–timber composite beam–column joint under low-cycle reversed loading conditions. This investigation involves varying the length and thickness of the beam sleeve, the diameter of the bolts, and the thickness and size of the stiffeners.
2. Finite Element Modeling
A comparative analysis of prior experimental and numerical data demonstrated that under monotonic loading conditions, the timber beam, steel sleeve, and stiffeners collectively bear a substantial proportion of internal stresses, which significantly influences the load-carrying capacity of the reinforced joint. Notably, extensive localized damage was observed in the timber beam surrounding the bolt holes, with the severity of damage exhibiting a strong correlation with the bolt diameter.
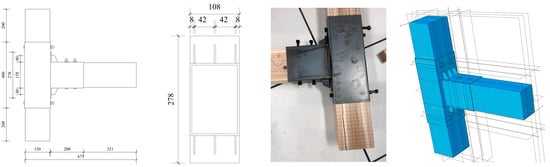
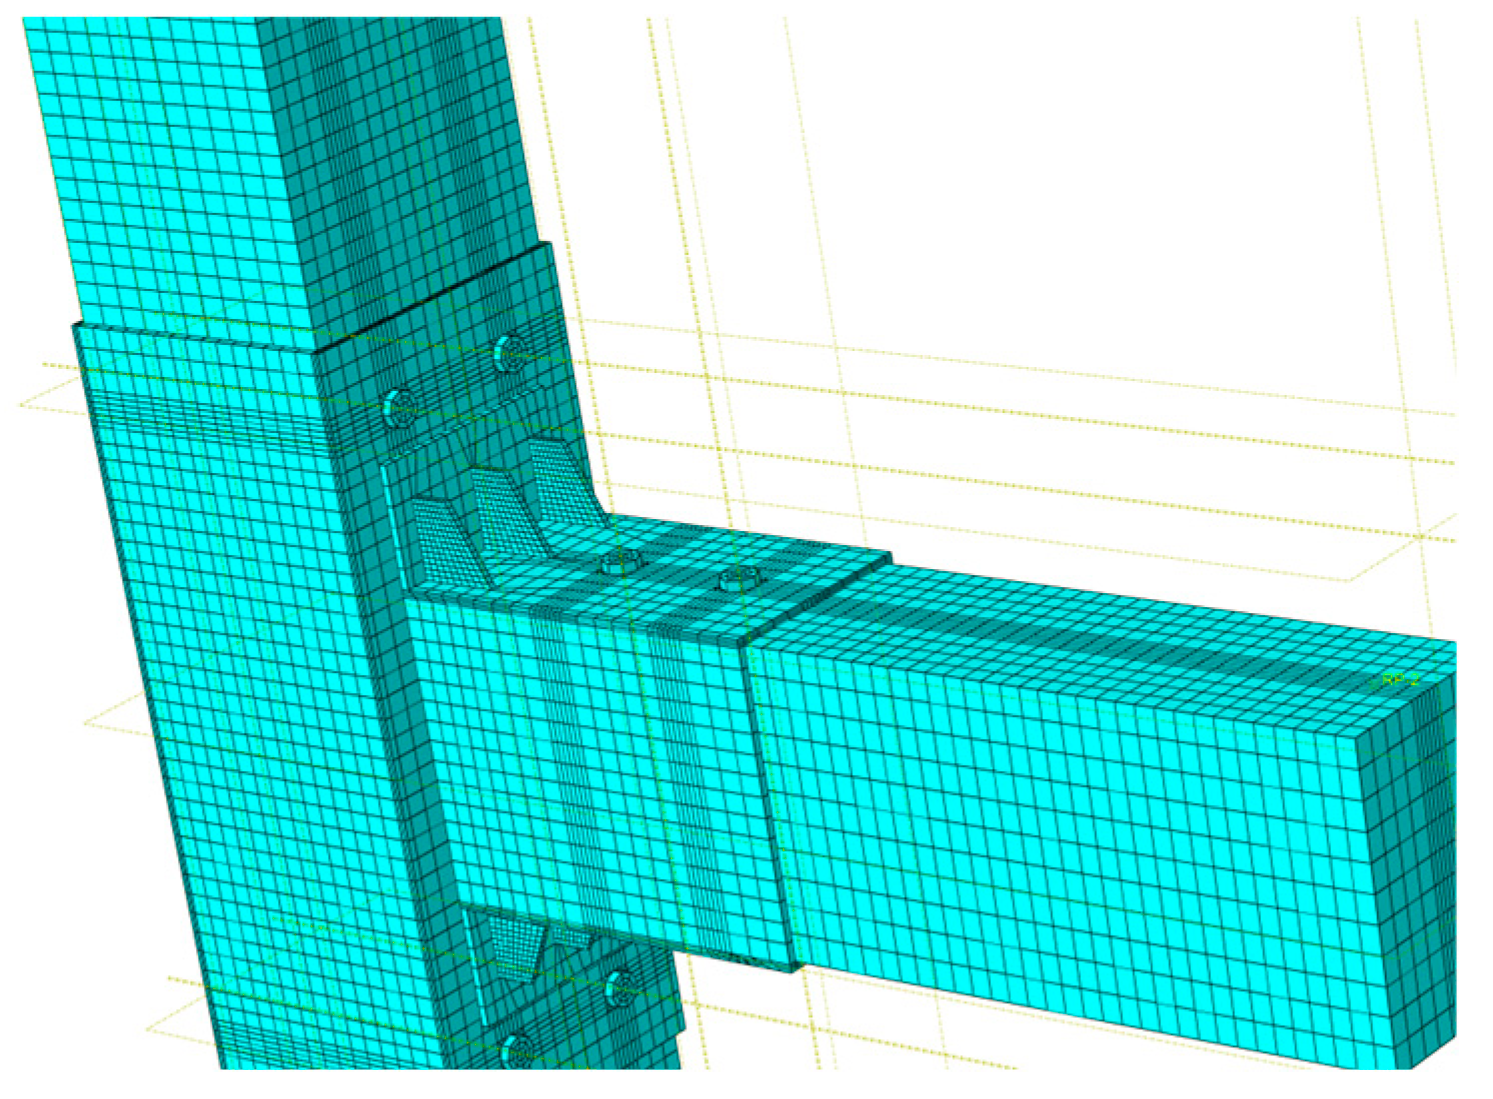
The experiment design included two types of joints. The wooden columns in the joints have a cross-sectional dimension of 150 mm × 150 mm, and the beams have a cross-sectional dimension of 100 mm × 150 mm. In the new integrated sleeve design, Q235 steel is used, with the steel sleeves for the beam and column having thicknesses of 4 mm and 6 mm, respectively. The stiffening ribs are 3 mm thick, and six high-strength bolts of grade 10.9 M12 are selected for the connections [19]. Other relevant dimensions are shown in Figure 1.
Figure 1.
An integrated sleeve mortise-and-tenon steel–timber composite beam–column joint.
Building upon the experimentally validated findings, this study presents a systematic finite element parametric analysis of the novel integrated sleeve mortise-and-tenon steel–timber composite beam–column joint’s hysteretic behavior under simulated low-cycle reversed loading conditions. The parametric study investigates the effects of key geometric parameters—including beam sleeve thickness (1–10 mm), sleeve length (150–350 mm), bolt diameter (4–16 mm), and stiffener dimensions (width and thickness) (see Table 1 for details)—on critical seismic performance indicators: initial stiffness, ductility, energy dissipation capacity, and failure modes.
Table 1.
Summary Table of Joint Parameters.
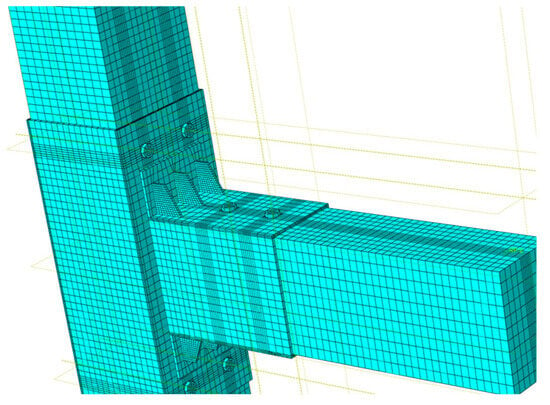
All numerical simulations were conducted using the commercial finite element software ABAQUS, with model configurations and material constitutive relationships calibrated against experimental data to ensure predictive accuracy and reliability. The corresponding finite element model and critical component nodes are illustrated in Figure 1.
2.1. Constitutive Models of Materials
2.1.1. Material Properties of Chinese Fir
- (1)
- Material Orientation
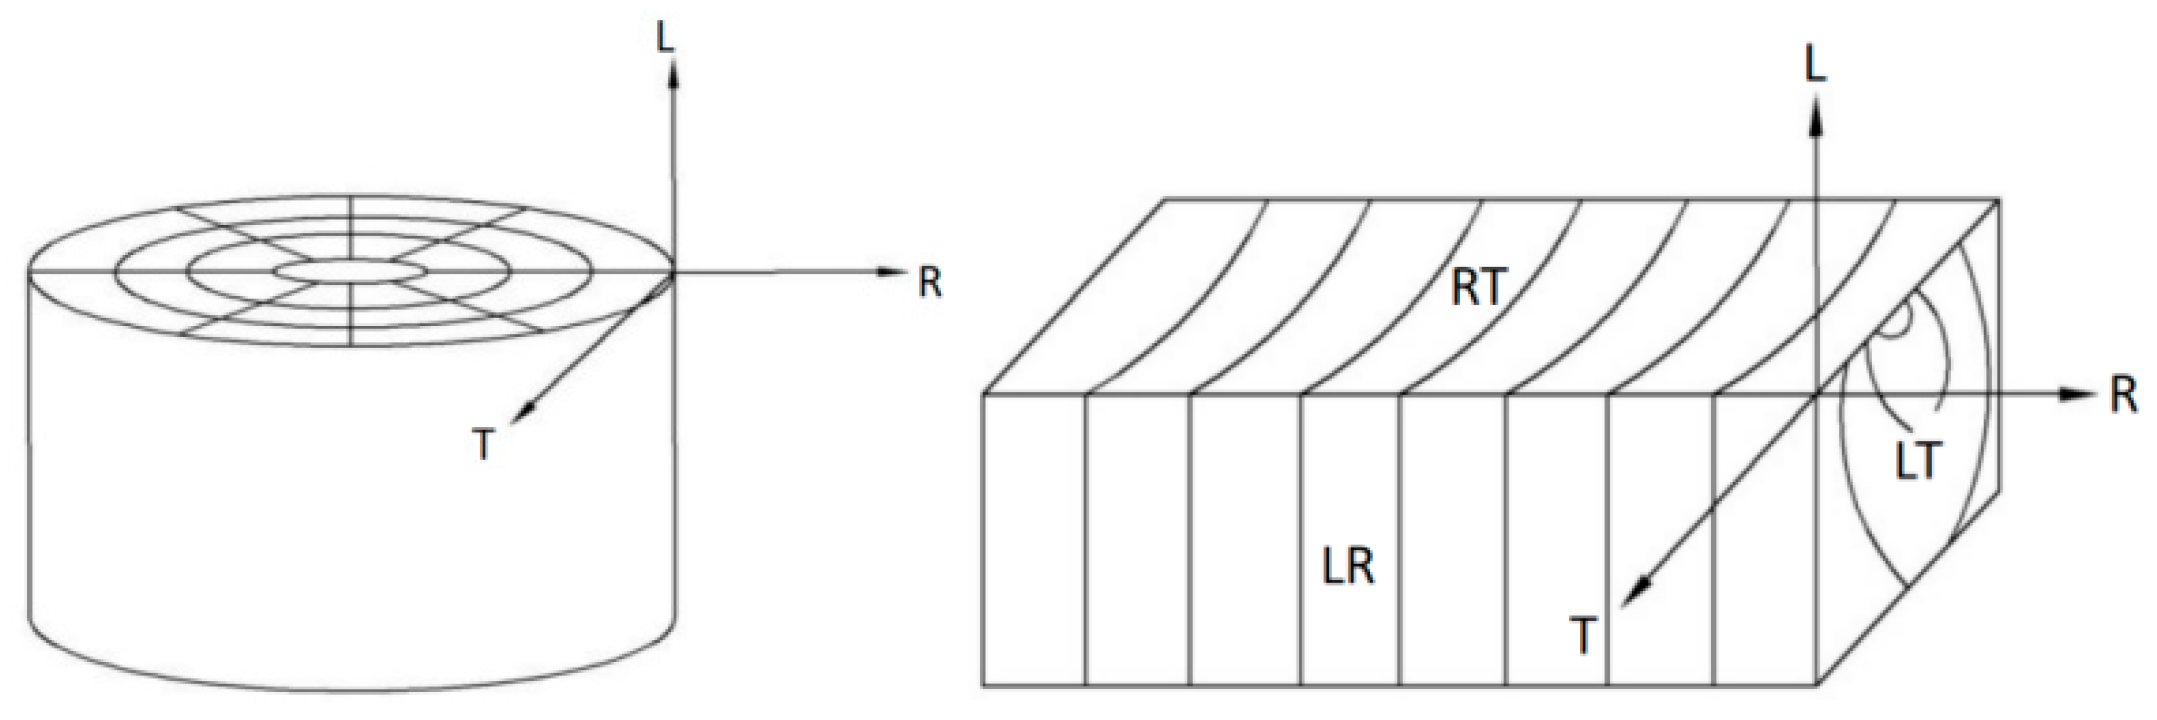
The longitudinal direction (L) of Chinese fir is defined as parallel to the wood fiber orientation, while the radial (R) and tangential (T) directions represent the two mutually perpendicular transverse directions. A schematic representation of these three orthogonal material axes is presented in Figure 2.
Figure 2.
Schematic diagram of material orientation.
- (2)
- Elastic Properties of Chinese Fir
The elastic properties of Chinese fir in the linear elastic range were derived using a constitutive model for wood proposed in Ref. [20], which was calibrated against experimental data from the physical and mechanical tests on Chinese fir reported in Ref. [21]. These properties are summarized in Table 2.
Table 2.
Elastic properties of Chinese fir in the elastic stage.
- (3)
- Yield Strength in the Plastic Stage
The plastic behavior of Chinese fir is characterized by Hill’s anisotropic yield criterion [22,23,24]. The reference yield strength σ0 is defined based on the compressive strength parallel to the fiber direction. The directional yield stresses (σij) are normalized with respect to σ0 through dimensionless coefficients Rij. The corresponding yield strength parameters are summarized in Table 3.
Table 3.
Yield strength values of Chinese fir in the plastic stage.
2.1.2. Steel Material Properties
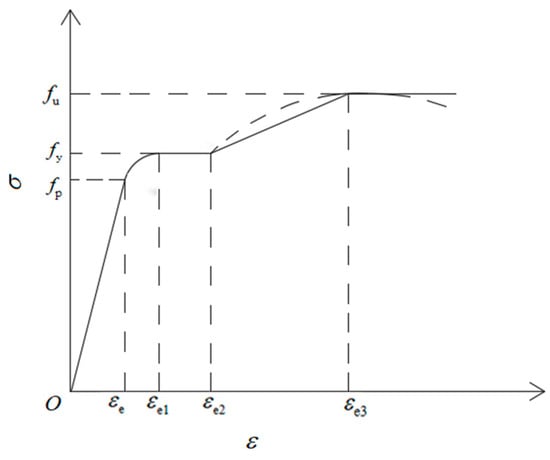
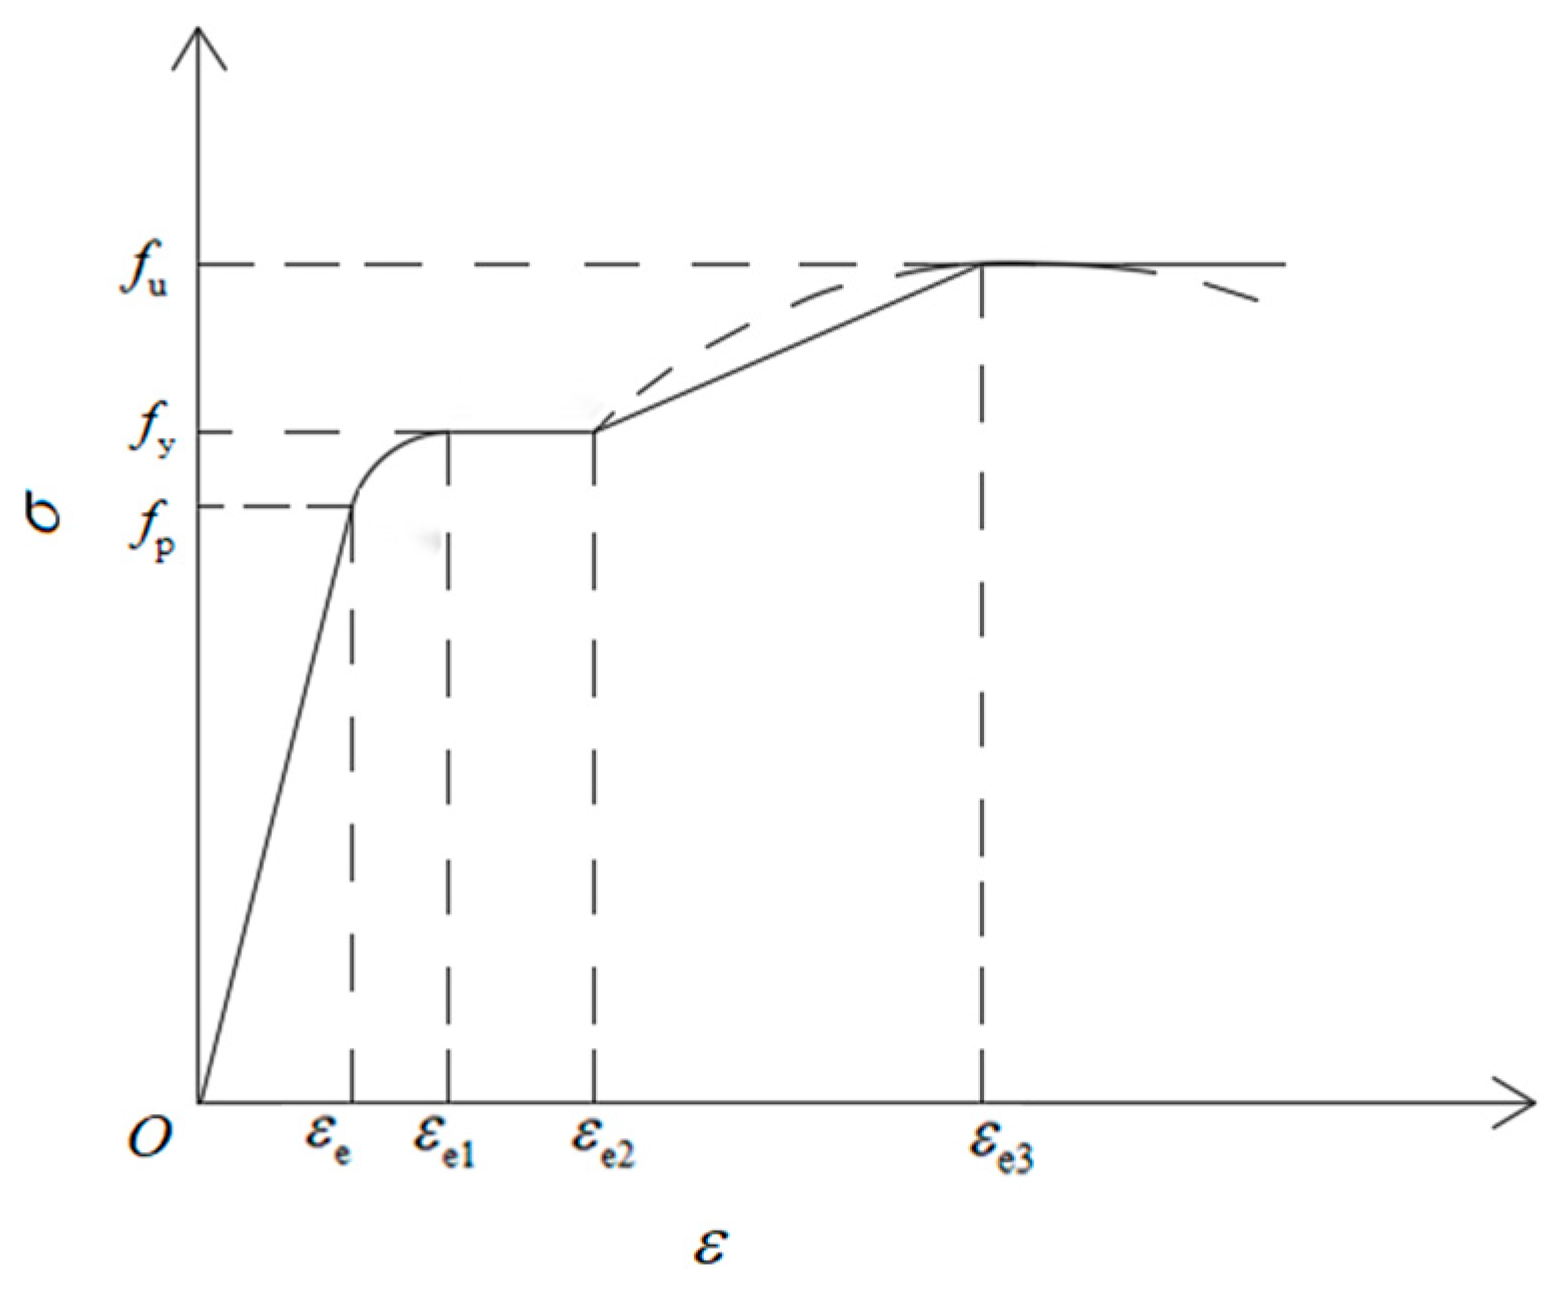
The structural steel employed is Q235B, characterized by a density of 7800 kg/m3, an elastic modulus E = 2.1 × 10⁵ MPa, and a Poisson’s ratio ν = 0.3. The constitutive behavior of Q235B is modeled using the von Mises yield criterion in conjunction with kinematic hardening [25]. The uniaxial stress–strain relationship is presented in Figure 3 and mathematically represented by Equation (1):
Figure 3.
Stress–strain curve of structural steel.
2.2. Mesh Discretization and Element Selection
The accuracy of finite element analysis is critically dependent on the selection of meshing strategies and element formulations. In this study, all components are discretized using eight-node linear brick elements with reduced integration and hourglass control (C3D8R). This element formulation demonstrates robustness against mesh distortion and effectively suppresses shear locking in bending-dominated scenarios [26]. ABAQUS offers three meshing techniques: free meshing, swept meshing, and structured meshing. Structured meshing was selected for primary components due to its ability to generate uniformly distributed, high-quality elements with minimal distortion, aligning with the computational methodology employed in this study [27].
To achieve an optimal balance between simulation accuracy and computational efficiency, multiple preliminary mesh trials were conducted, considering factors including contact interaction accuracy. The final element sizes were specified as follows: 12 mm for the column, 10 mm for the beam, 15 mm for the steel sleeve, 3 mm for the stiffeners, and 5 mm for the bolts, as shown in Figure 4. Localized mesh refinement was implemented around the bolt holes to maintain mesh quality in regions with complex deformation behavior, achieved through swept hexahedral elements with mesh seeding in the local area and three node controls along curved edges to ensure high-quality curved surface mesh generation.
Figure 4.
Schematic diagram of mesh generation.
2.3. Interaction Definitions and Boundary Conditions
The simulation incorporates two primary contact interaction types: (1) wood–wood contact between the tenon and mortise, and (2) wood–steel contact at timber–steel interfaces. A “general contact” algorithm is implemented across the beam–column joint model, with contact properties governed by “normal behavior” and “tangential behavior.” Normal behavior is defined as “hard contact” to prevent interpenetration, while tangential behavior employs a penalty-based friction formulation. Friction coefficients are determined according to reference [28]: 0.4 for wood–wood interfaces, 0.35 for wood–steel interfaces, and 0.3 for steel–steel interfaces. High-strength through bolts are connected using “tie” constraints to ensure full kinematic compatibility. Multi-point constraint (MPC) couplings are implemented at the top column section, beam-end loading zone, and bottom column section to simulate the experimental load transfer mechanisms. During the physical test, the column base was rigidly clamped while the column top was restrained by a long rod connected to a top-fixing frame. Correspondingly, in the ABAQUS model, the base is fully fixed (in which all degrees of freedom are restrained), and lateral displacements in the global X and Y directions (U1 and U2) are constrained at the top of the column.
2.4. Loading Protocol
The finite element model adopts the same loading protocol as the experimental test: monotonic displacement control applied at the beam tip. The numerical simulation comprises three analysis steps: Step—initial, Step 1, and Step 2. In Step—initial, boundary conditions are applied to establish a geometrically stable system. In Step 1, a constant vertical load of 20 kN is applied at the coupled reference point RF-1 to simulate gravity loads from upper structural levels. This loading strategy prevents artificial stress concentrations that might lead to premature local failure. In Step 2, a horizontal displacement load with a maximum amplitude of 100 mm is imposed at reference point RF-2. Geometric nonlinearity (NLGEOM = ON) is activated in both Step 1 and Step 2 to capture large deformations associated with the semi-rigid mortise-and-tenon joint, steel sleeve, and curved energy-dissipating plates.
3. Parametric Finite Element Analysis
A comparative analysis of prior experimental and finite element results reveals that under monotonic loading, the timber beam, beam sleeve, and stiffeners bear significant internal stresses, critically influencing the load-carrying capacity of the reinforced joint. Importantly, severe damage localizes around bolt holes in the timber beam, with the damage severity strongly correlated to the bolt diameter. Leveraging this validated foundation, a parametric finite element investigation is conducted to assess the seismic performance of the novel integrated sleeve mortise-and-tenon steel–timber composite beam–column joint under simulated low-cycle reversed loading. The systematic variation in key geometric parameters—including beam sleeve length/thickness, bolt diameter, and stiffener thickness/dimensions—enables an evaluation of their influence on the joint’s hysteretic behavior, stiffness, ductility, energy dissipation capacity, and failure characteristics.
3.1. Parametric Analysis of Beam Sleeve Thickness
Seven variants of the integrated sleeve mortise-and-tenon steel–timber composite beam–column joint with beam sleeve thicknesses (δ) of 1 mm, 2 mm, 3 mm, 4 mm, 6 mm, 8 mm, and 10 mm were analyzed using finite element simulations. All other geometric parameters—including sleeve length, tenon–mortise dimensions, bolt configuration, and stiffener details—were kept constant across the models.
3.1.1. Deformation Patterns of the Joint
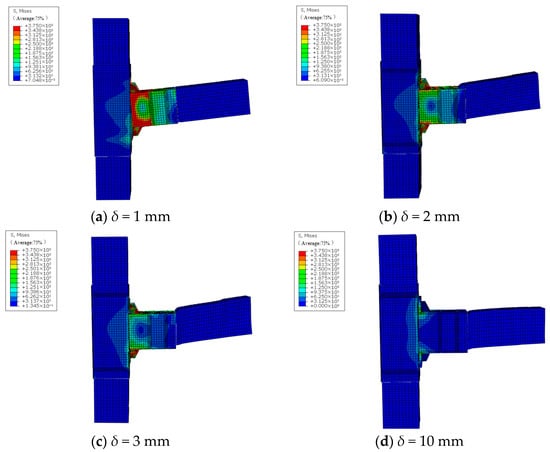
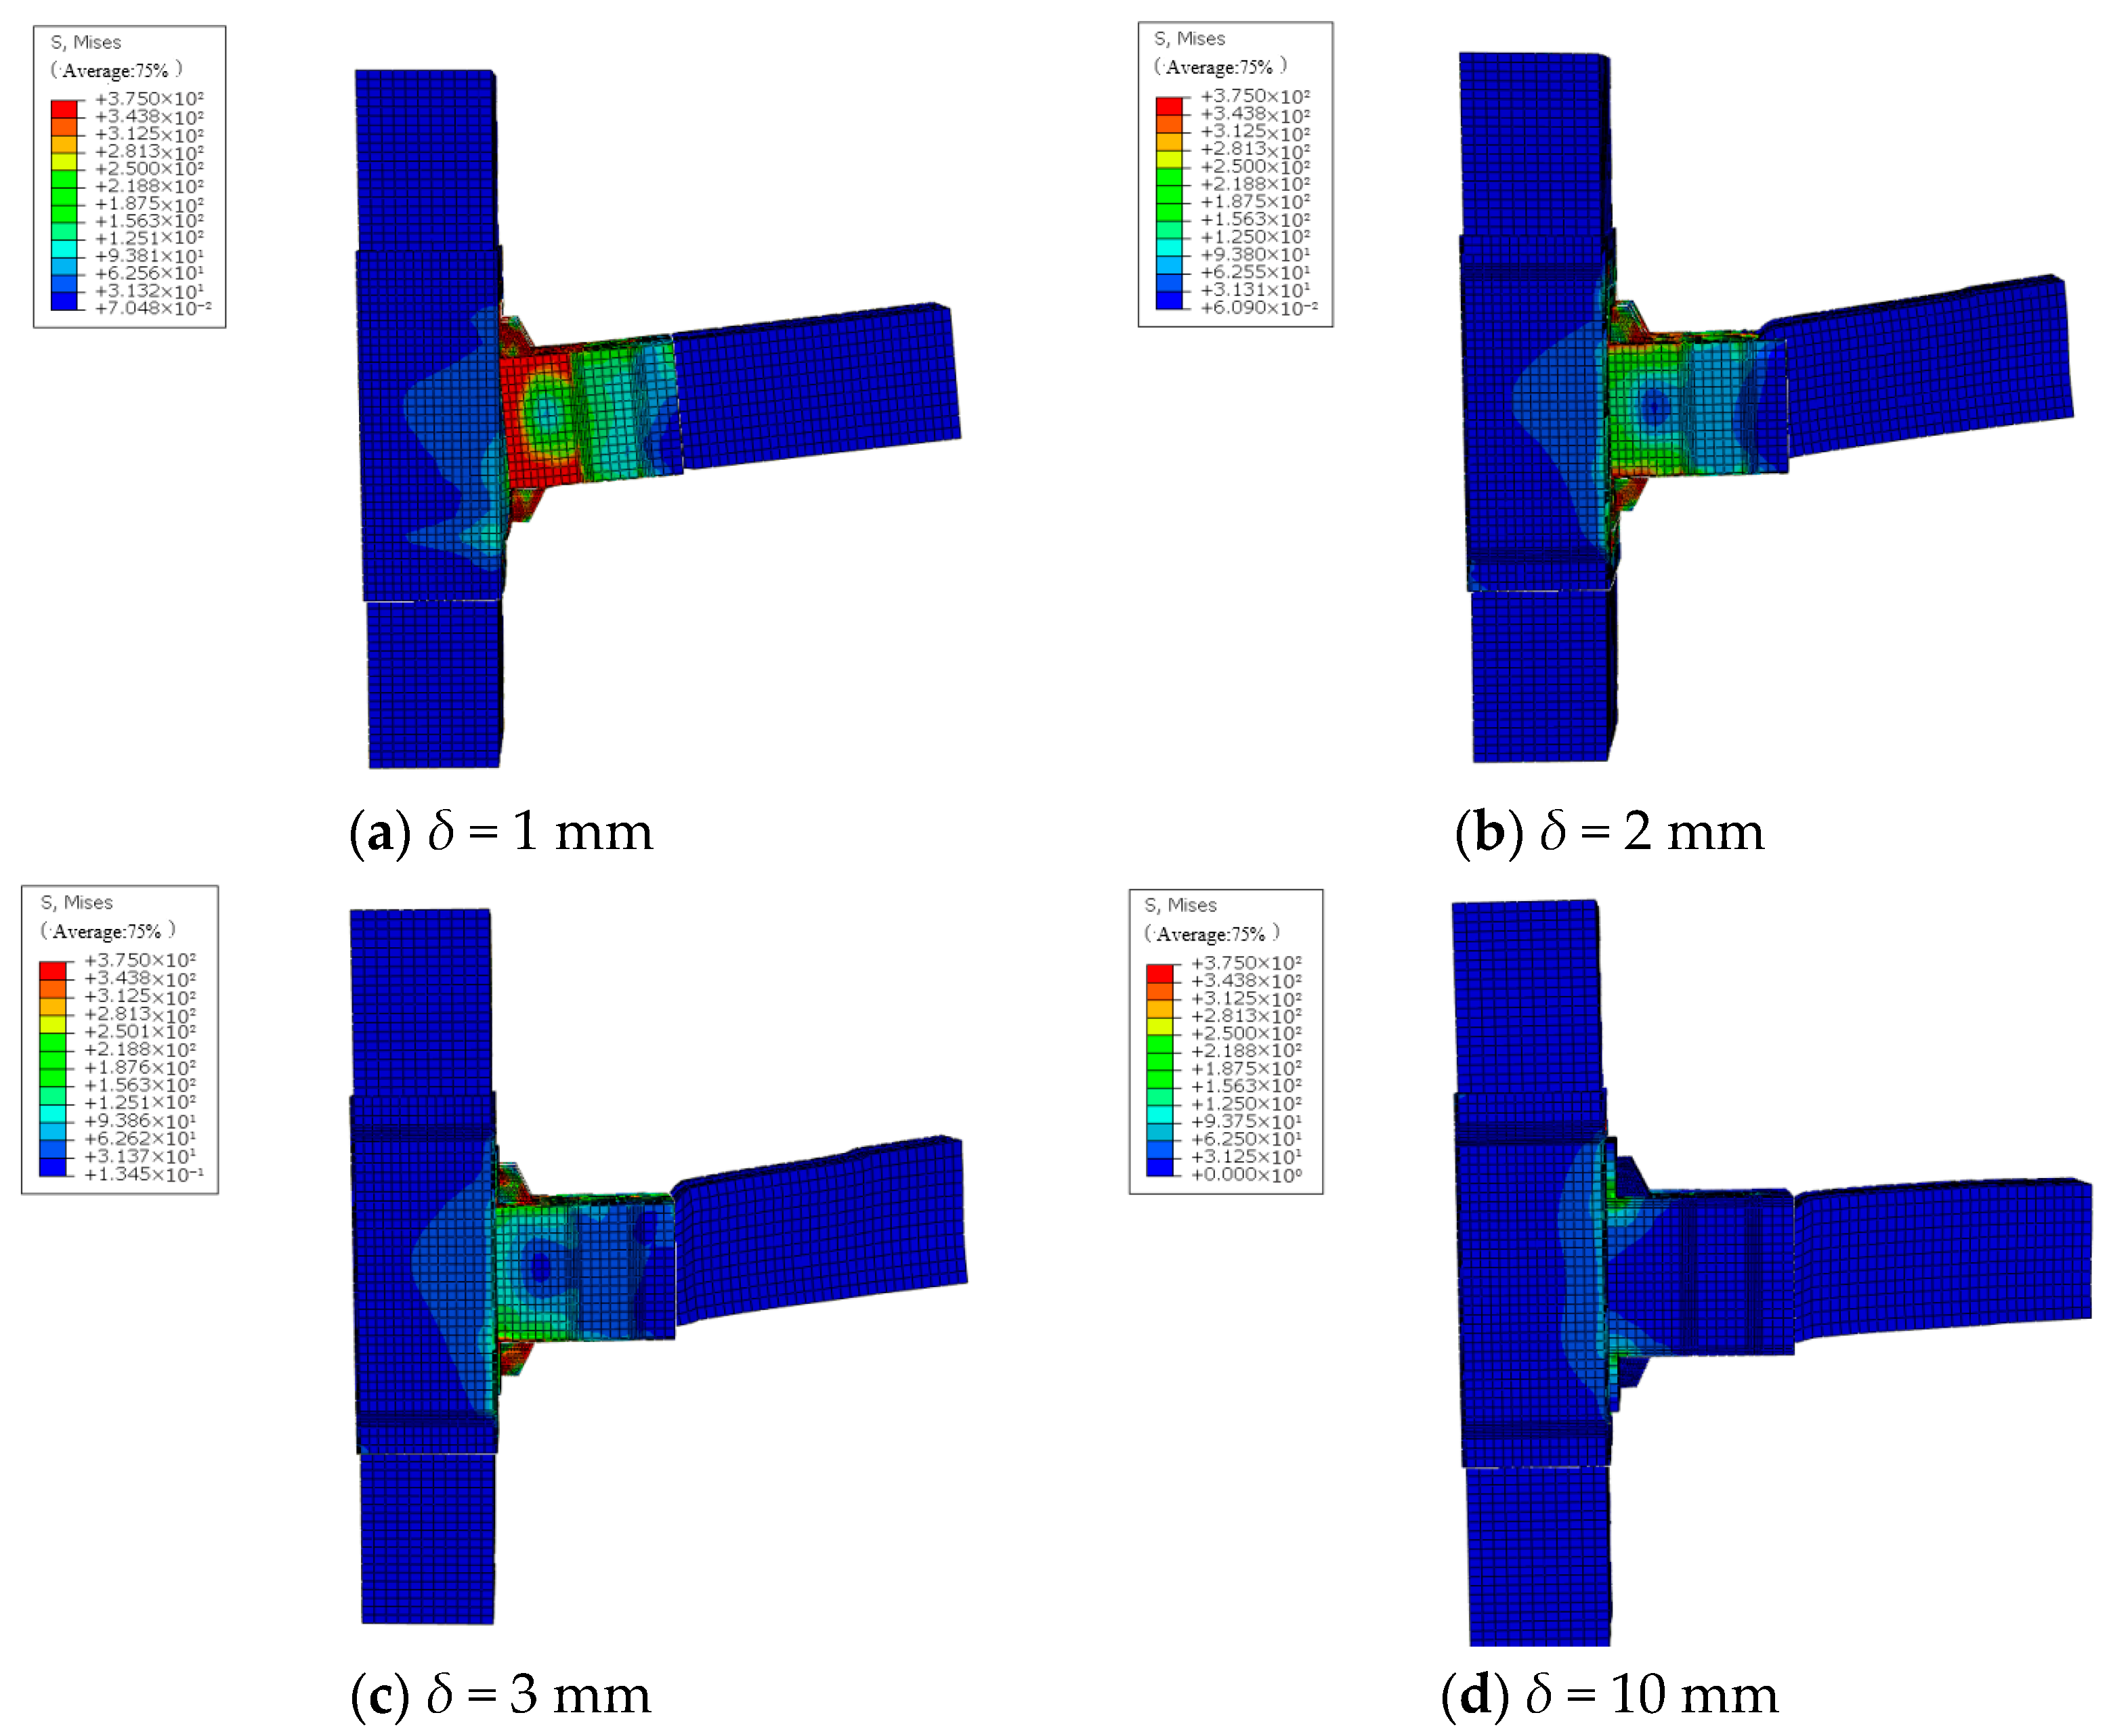
As shown in Figure 5, the deformation states of the seven joints were compared at a lateral displacement of 70 mm. The results indicate that joints with a beam sleeve thickness ≤ 2 mm exhibit significant failure indicators: excessive steel sleeve deformation with minimal timber beam bending. Conversely, for thicknesses > 2 mm, sleeve stiffness enhancement progressively shifts the load distribution to the timber beam, inducing pronounced compressive and flexural deformation in the wood. Simultaneously, sleeve deformation and damage severity decrease with increasing thickness. Critically, when the sleeve thickness exceeds 3 mm, the joint behavior transitions toward a nearly rigid connection, with the timber beam becoming the primary deformation component.
Figure 5.
Overall deformation diagram of each node of different beam sleeve thicknesses (unit: mm).
3.1.2. Stress Distribution in Beam Sleeve and Timber Beam
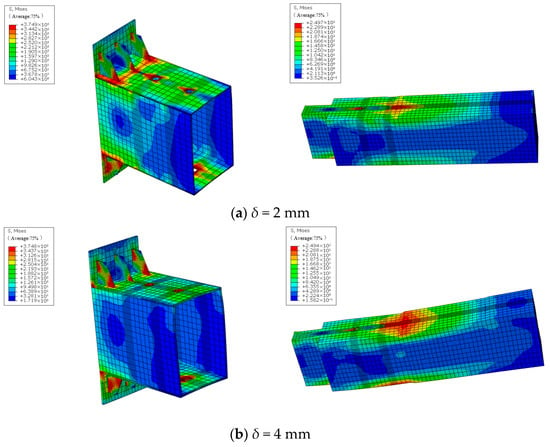
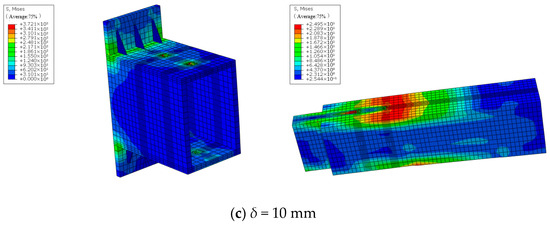
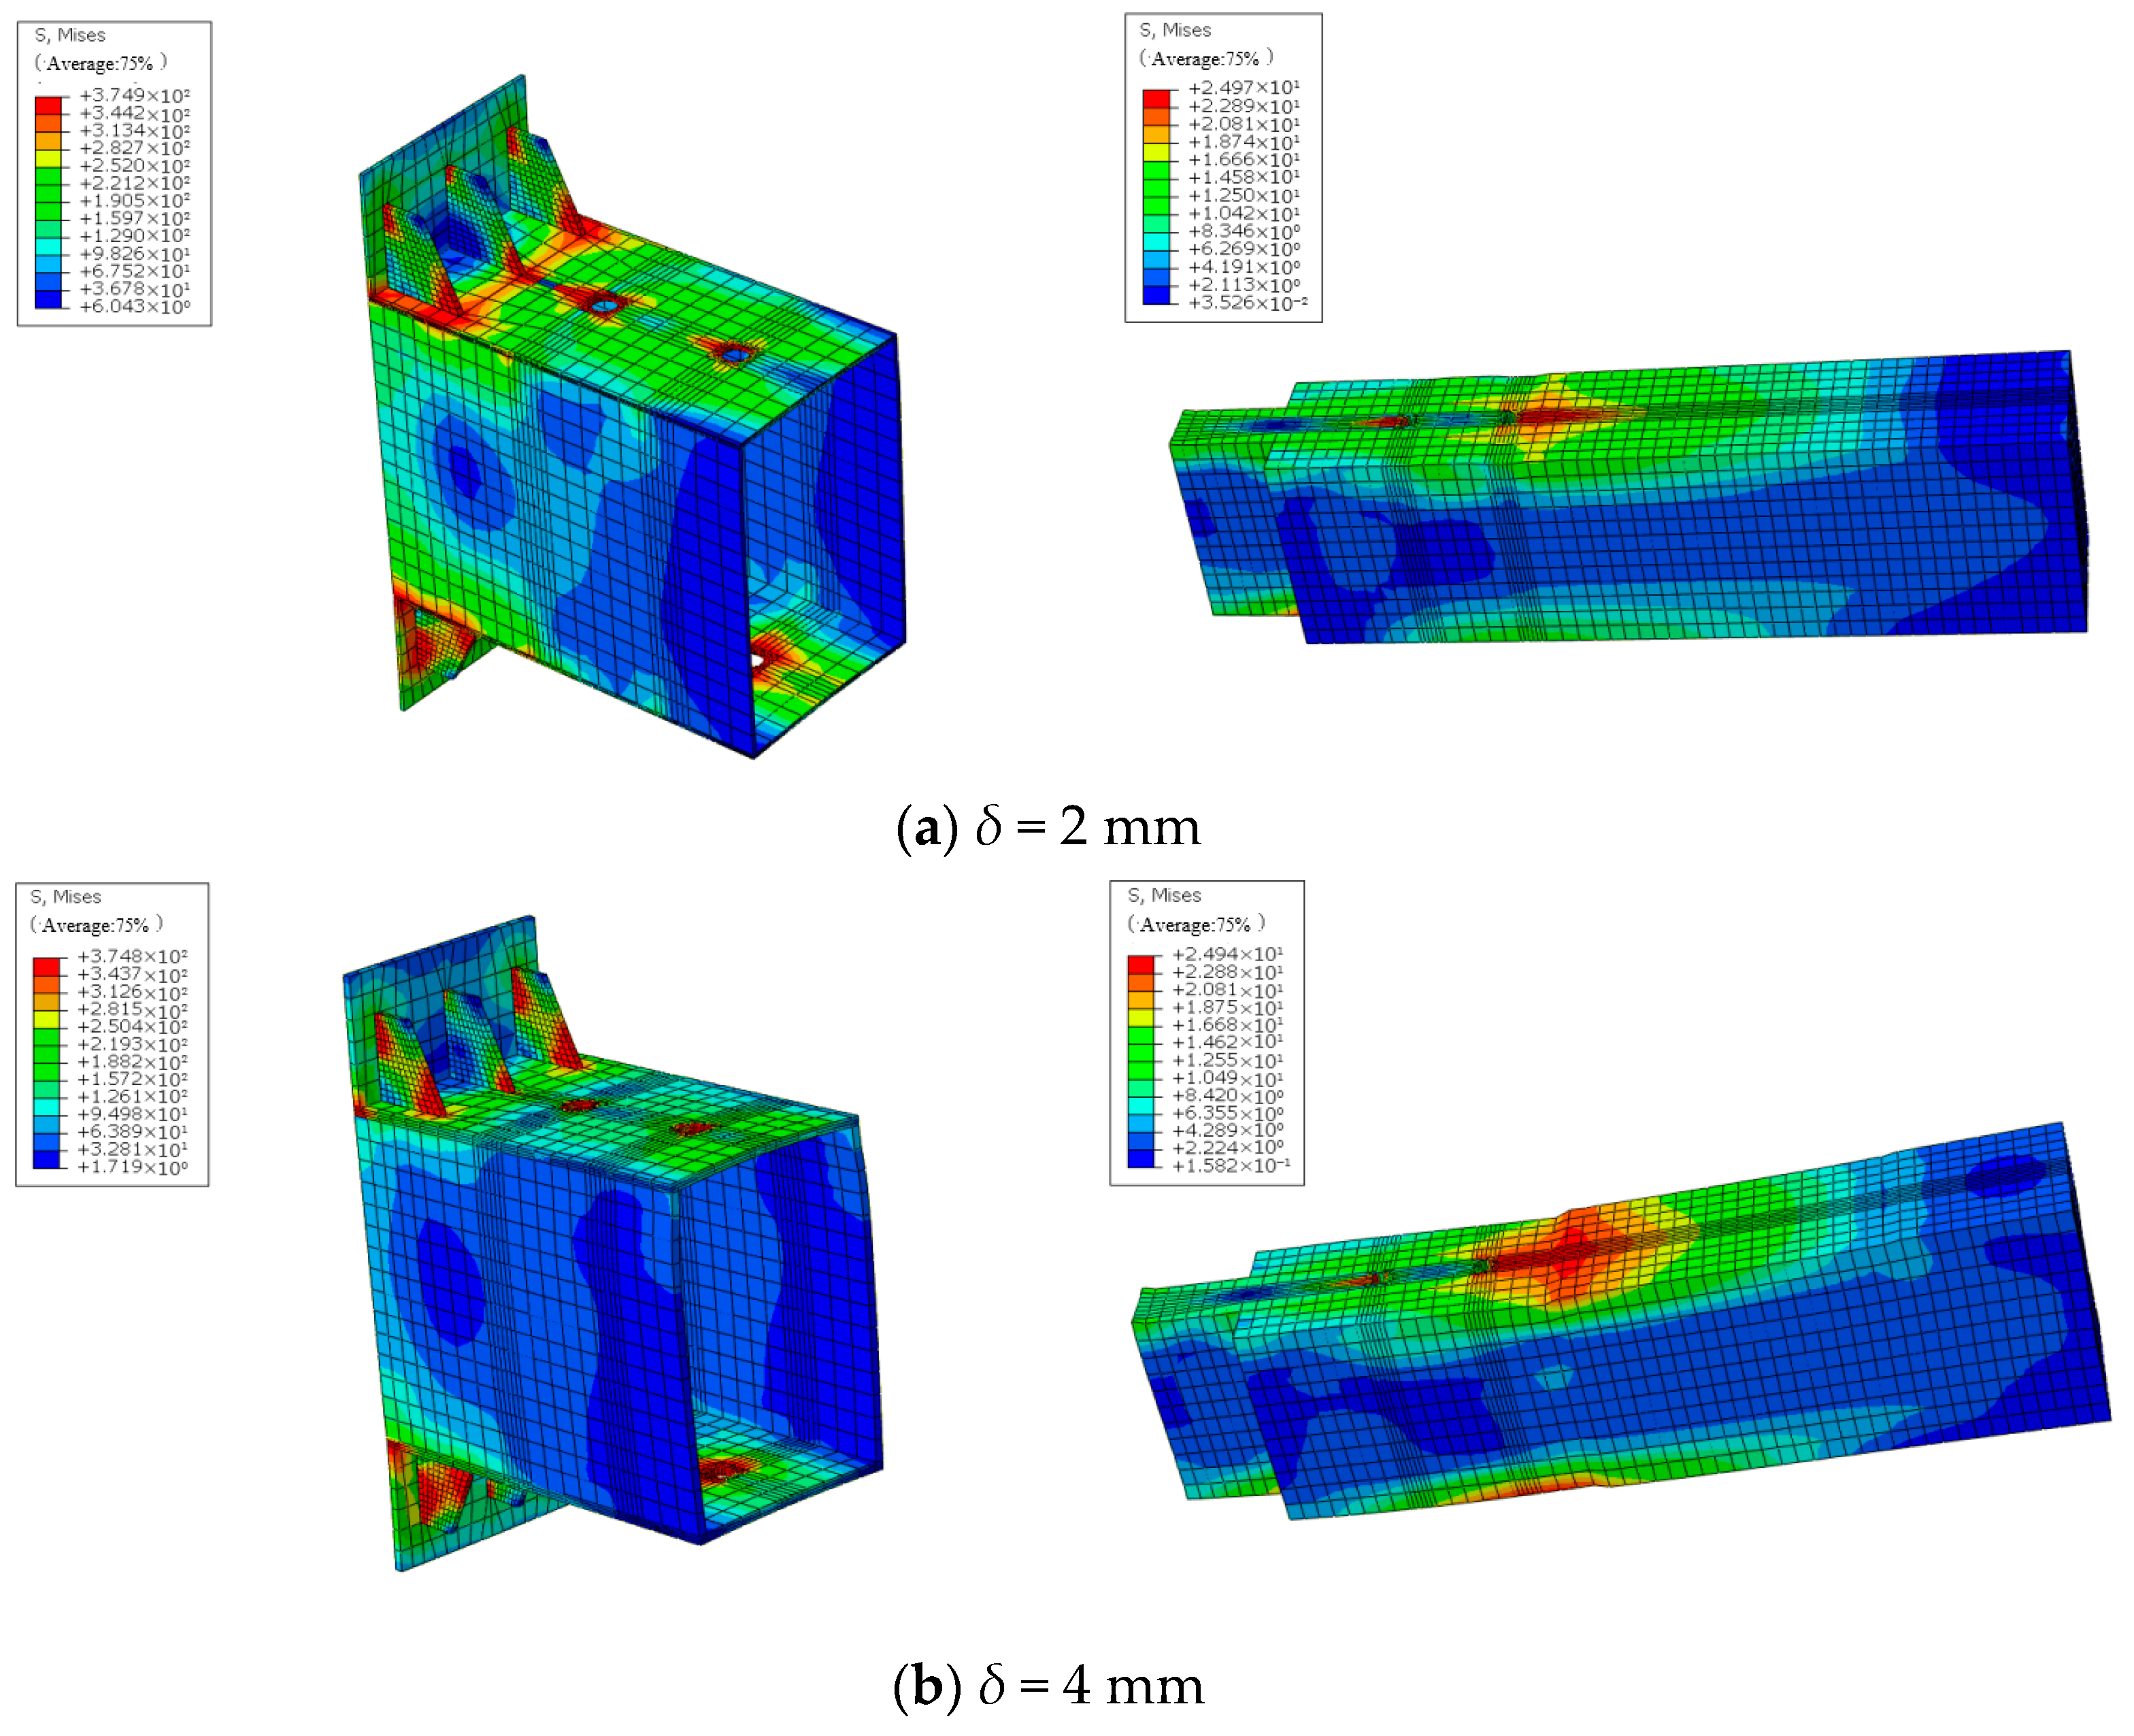
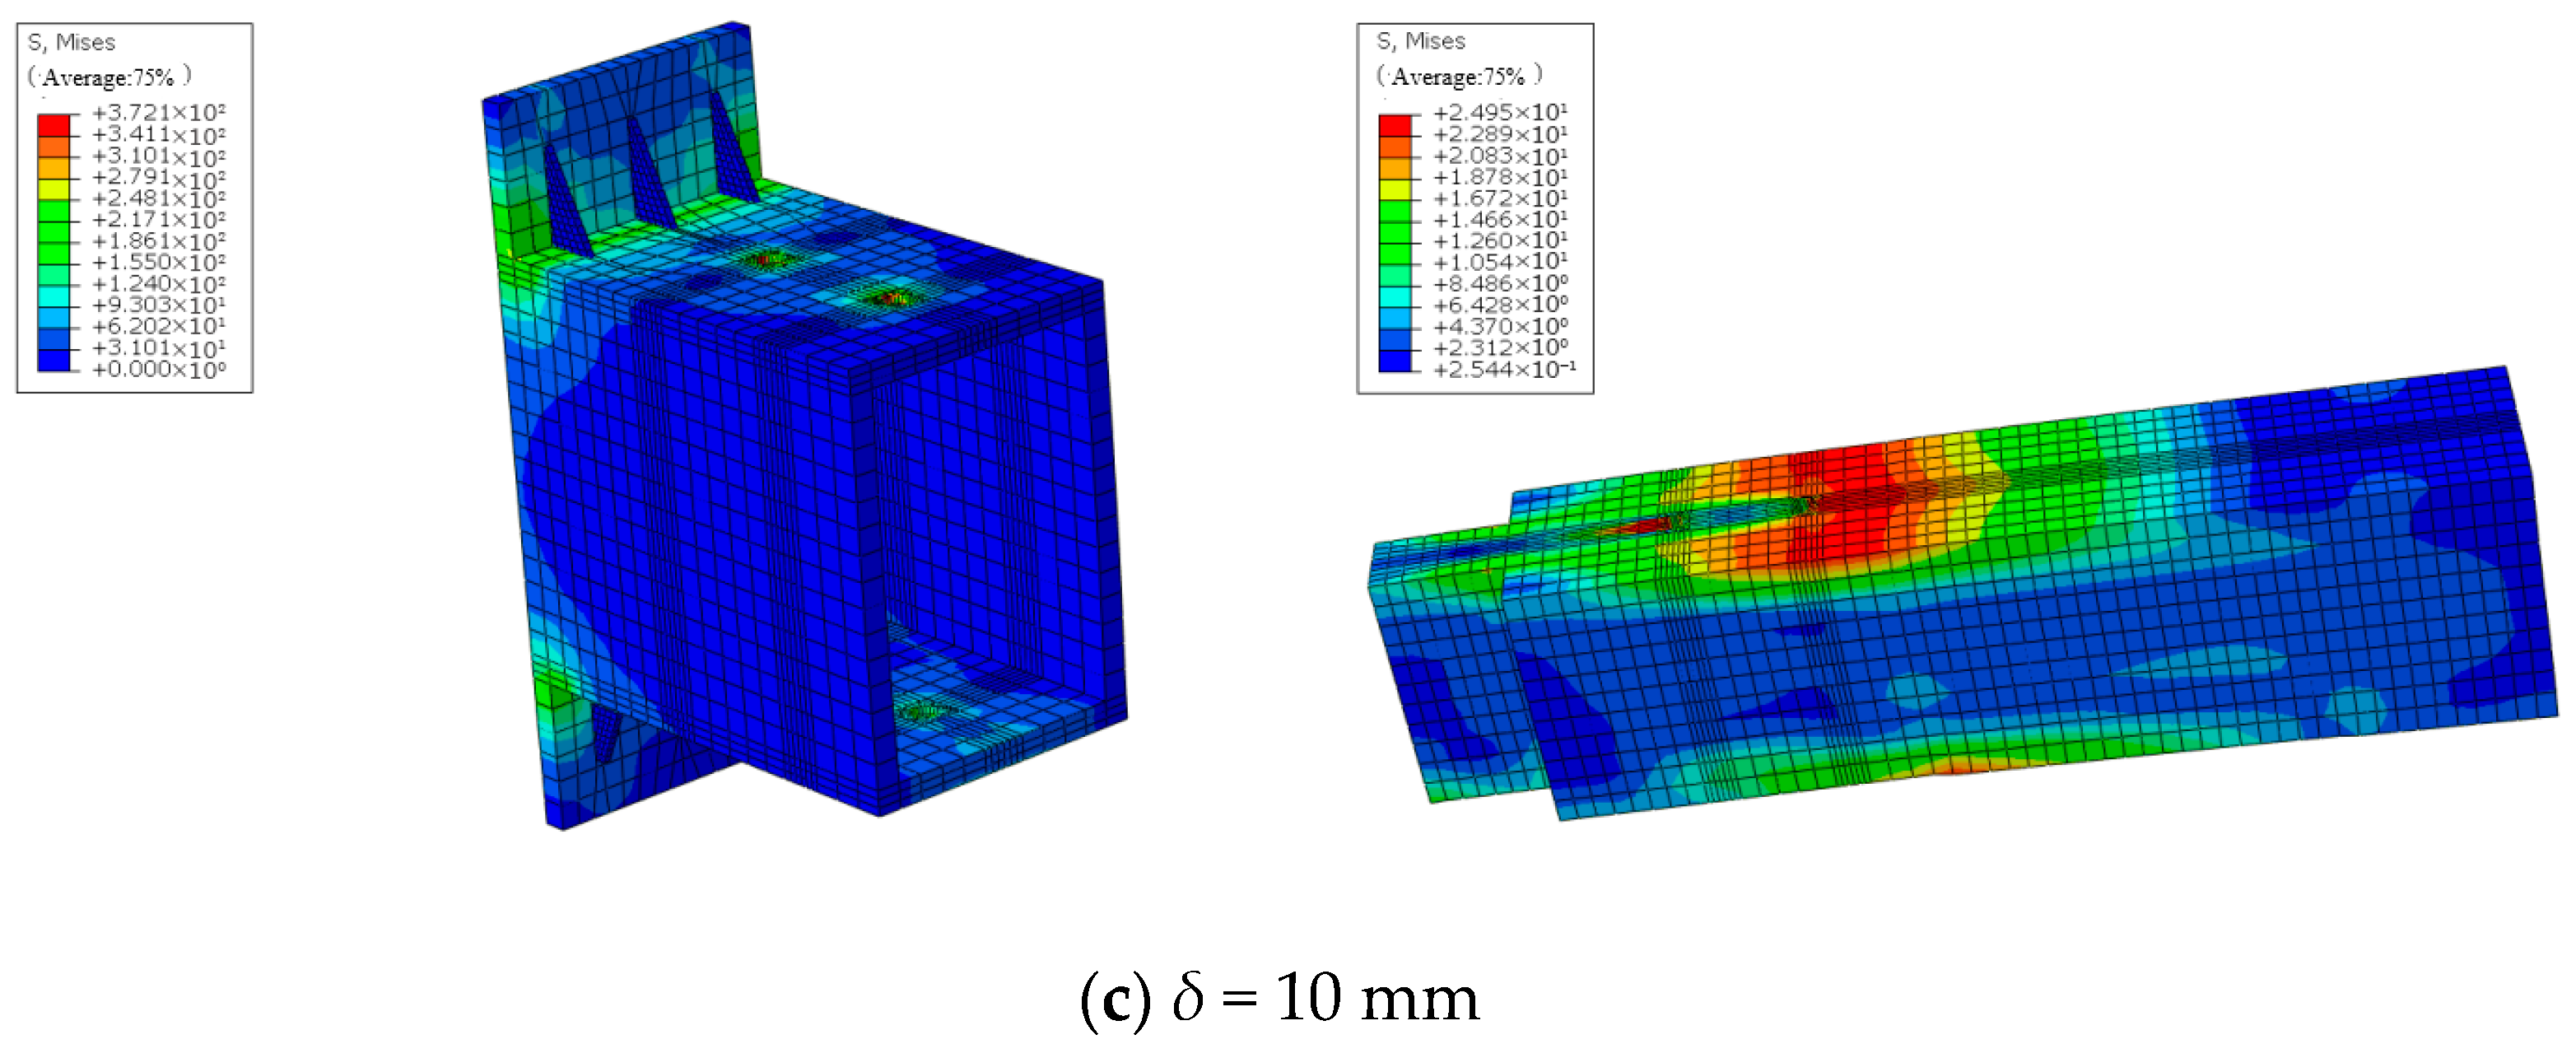
As shown in Figure 6, stress concentrations in the 2 mm beam sleeve primarily localize at weld zones connecting to stiffeners, with negligible stress concentration in the timber beam. At a thickness of 4 mm, high-stress regions concentrate at sleeve flange–stiffener interfaces, accompanied by notable stress concentrations in the stiffeners and measurable stress development in the timber beam mid-section. Here, the sleeve bending stiffness surpasses that of the stiffeners, transferring elevated stresses to the latter. For the 10 mm thickness, sleeve over-stiffness causes minimal deformation in both the sleeve and stiffeners, redirecting stress accumulation to the timber beam, which propagates toward the tenon area. This suggests that excessive sleeve thickness induces adverse stress redistribution, risking timber component integrity degradation.
Figure 6.
Stress distribution diagrams of beams and beam sleeves of different beam sleeve thicknesses (unit: MPa).
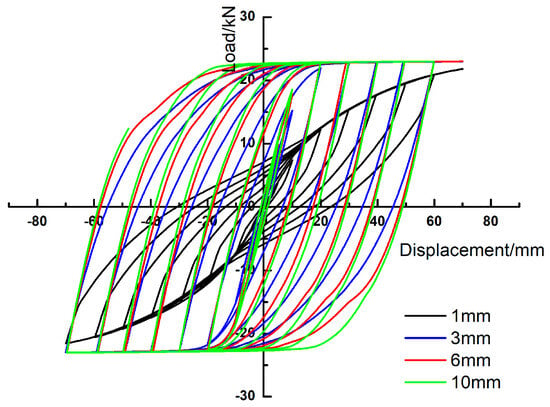
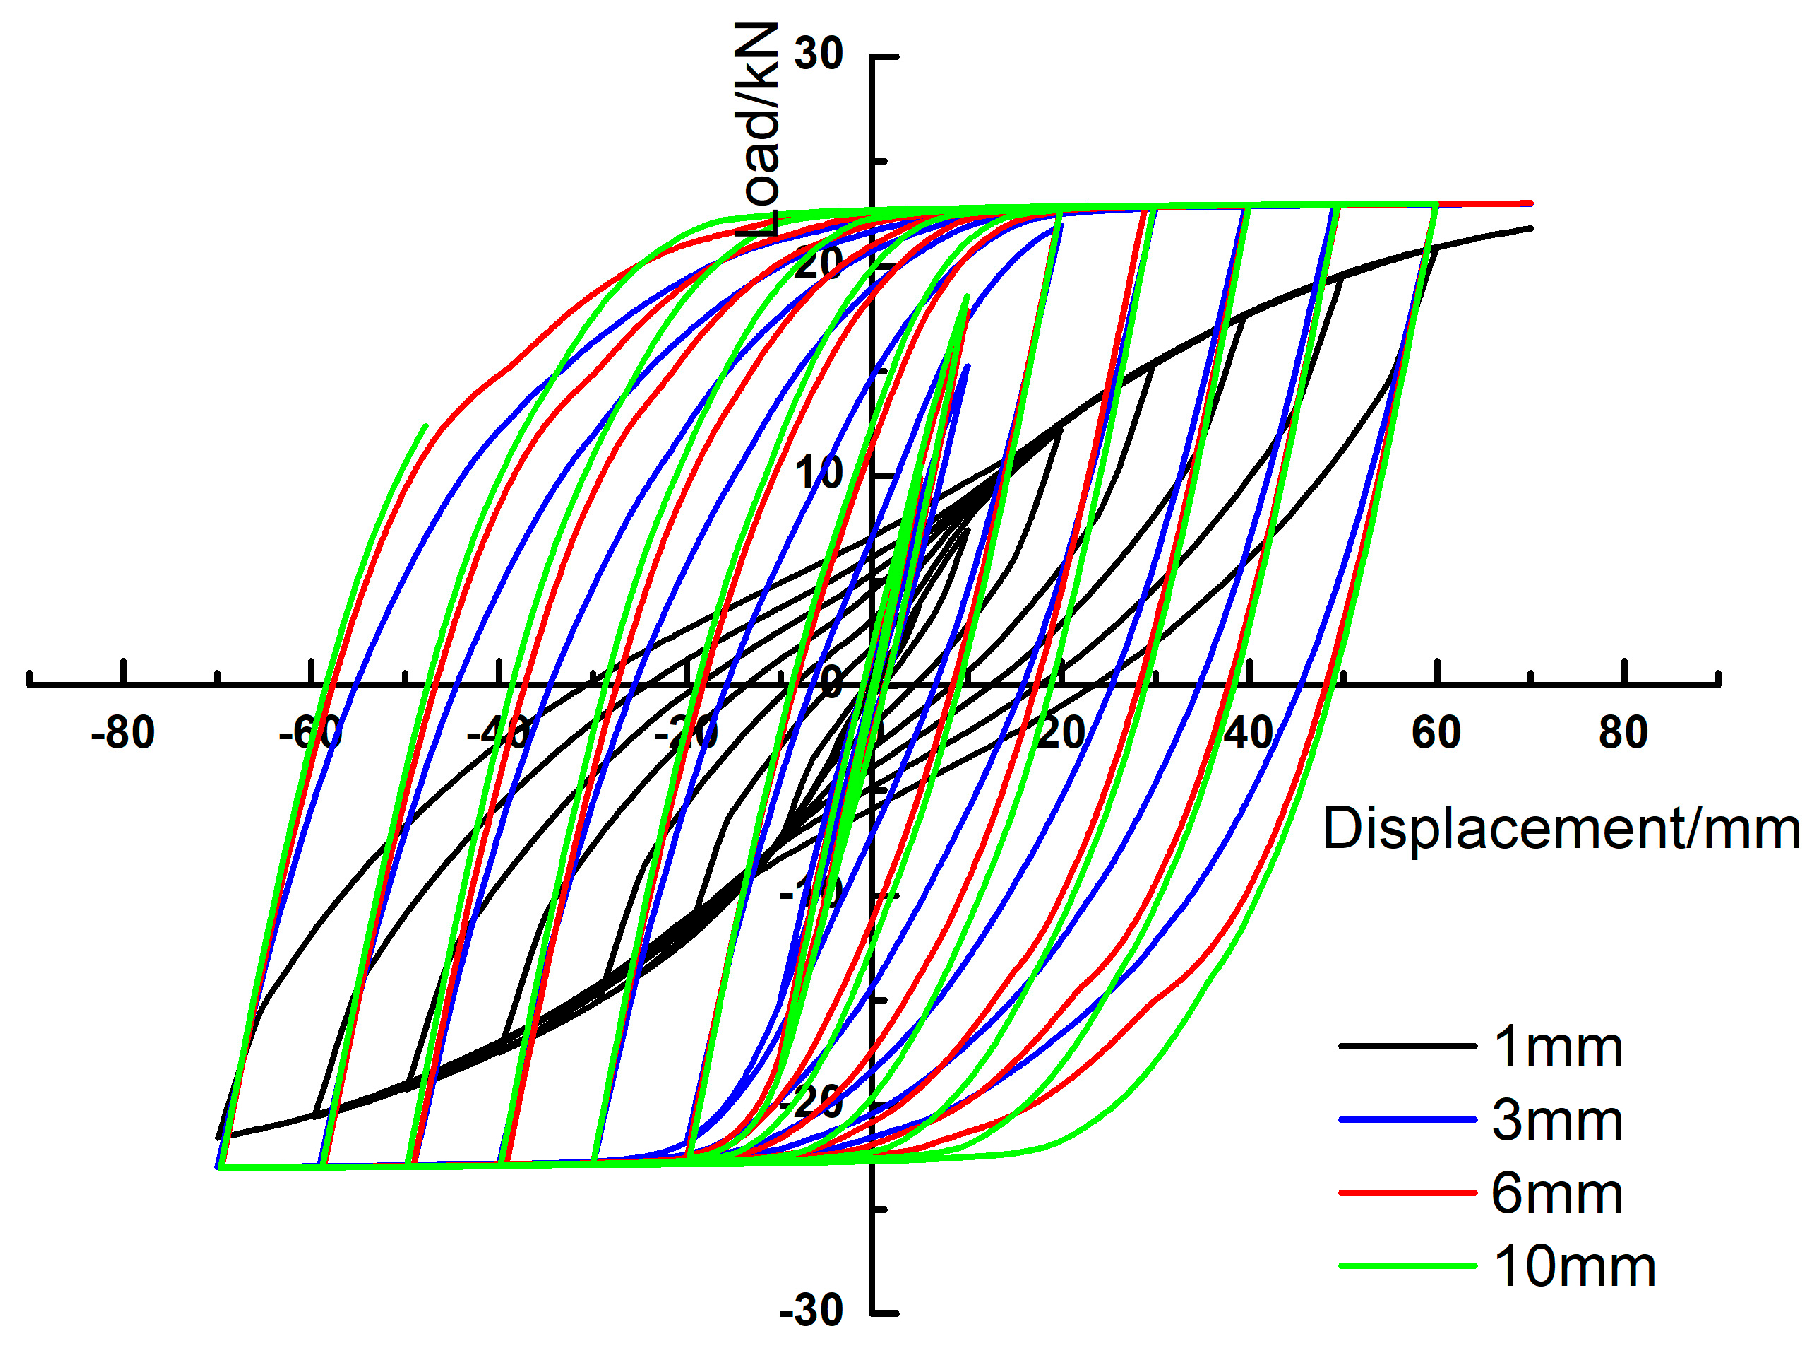
3.1.3. Load–Displacement Hysteresis Curves
Load–displacement hysteresis curves (Figure 7) serve as critical indicators for evaluating the seismic performance of integrated sleeve mortise-and-tenon steel–timber composite beam–column joints, characterizing force–deformation relationships under cyclic loading. The 1 mm sleeve thickness exhibits a severe pinching effect with arch-shaped hysteresis loops featuring narrowed centers, indicating dominant shear force transmission and compromised seismic safety. This correlates with stress distribution patterns showing weld zone shear failure between the beam sleeve flanges and column sleeve. A comparative analysis of the hysteresis curves reveals that increasing sleeve thickness transforms the loop morphology from pinched shapes to more fusiform profiles, with enhanced fullness indicating improved plastic deformation resistance and superior seismic performance. However, thicknesses exceeding 4 mm yield marginal improvements in loop fullness, suggesting diminishing returns for seismic and energy dissipation enhancements beyond this threshold.
Figure 7.
Comparison of hysteresis curves for joints with different sleeve thicknesses.
3.1.4. Skeleton Curve Analysis
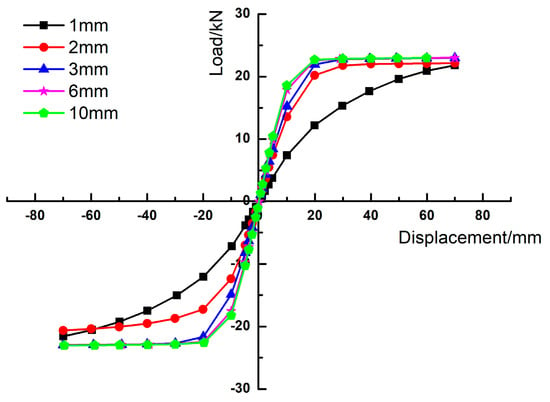
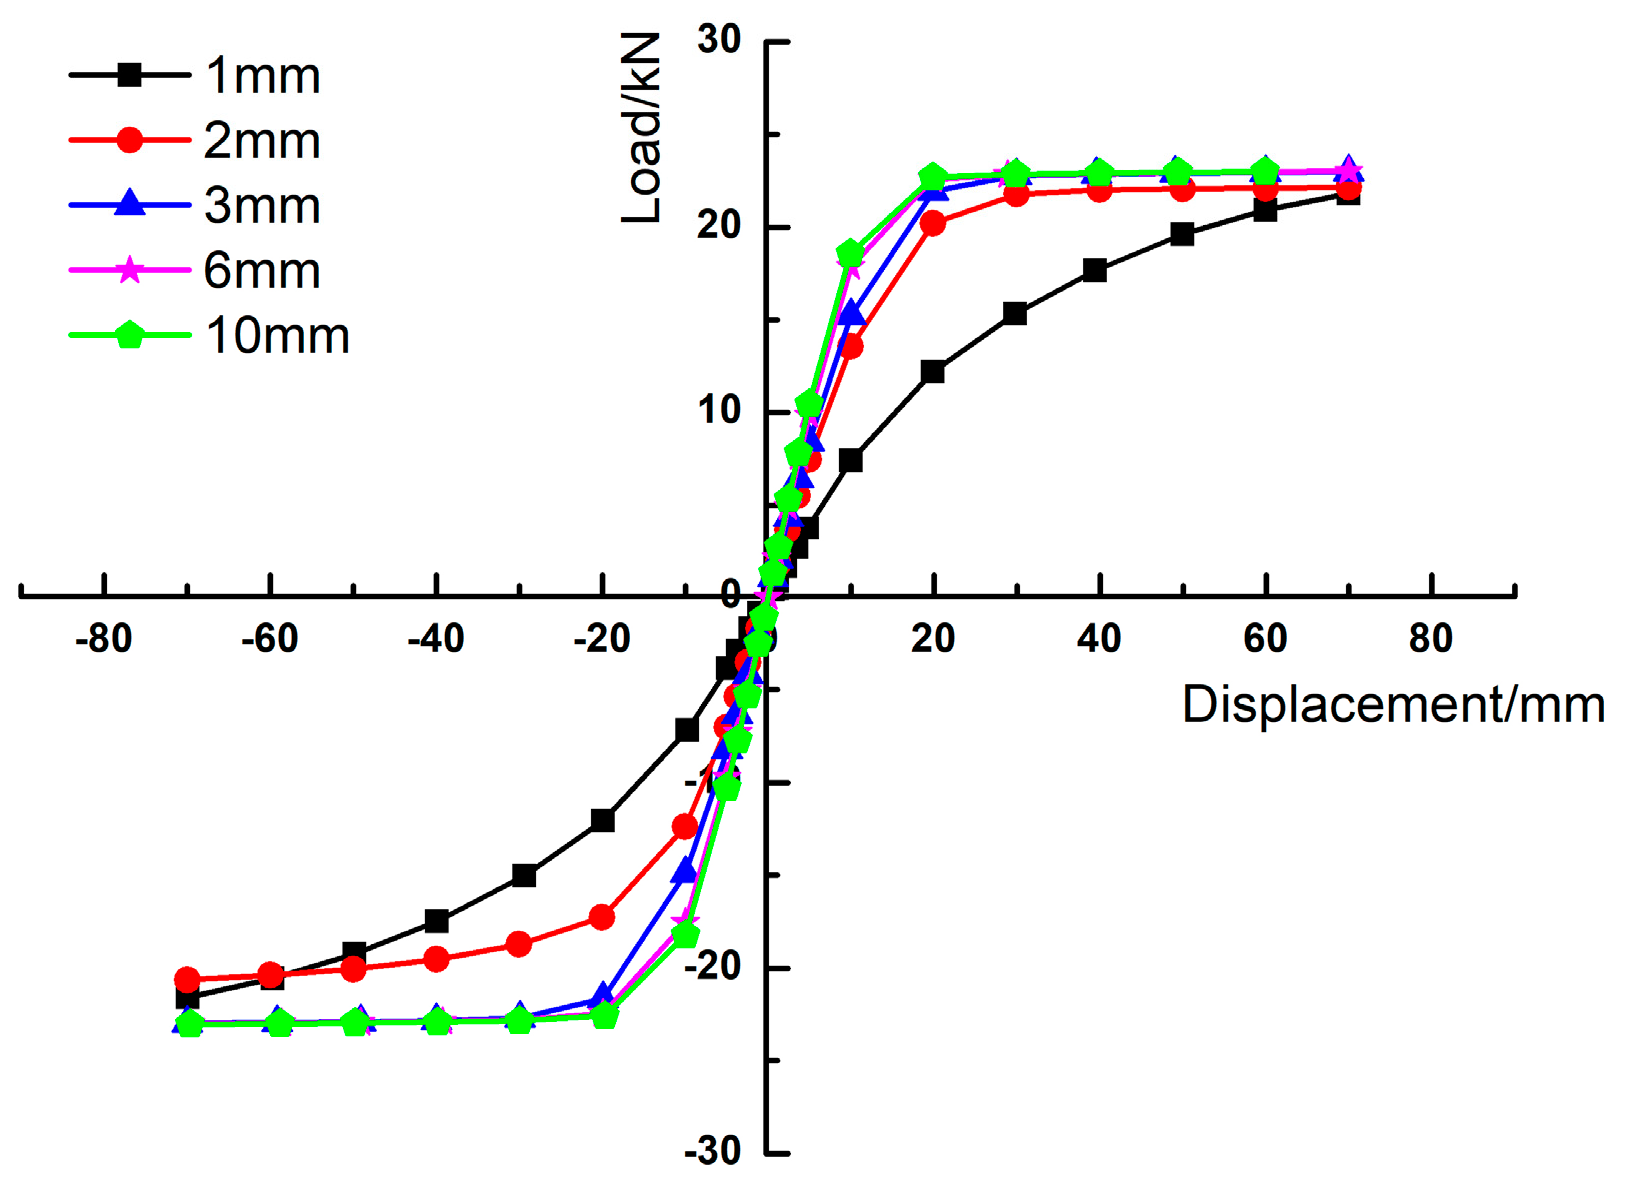
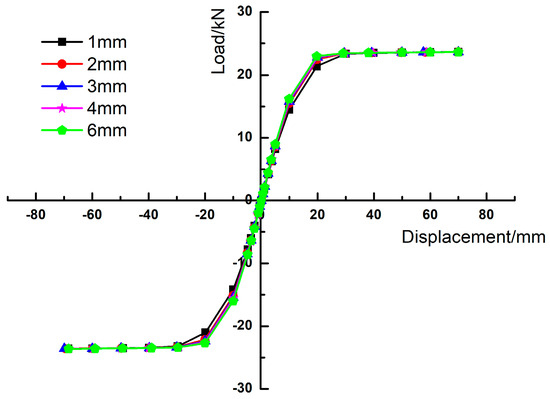
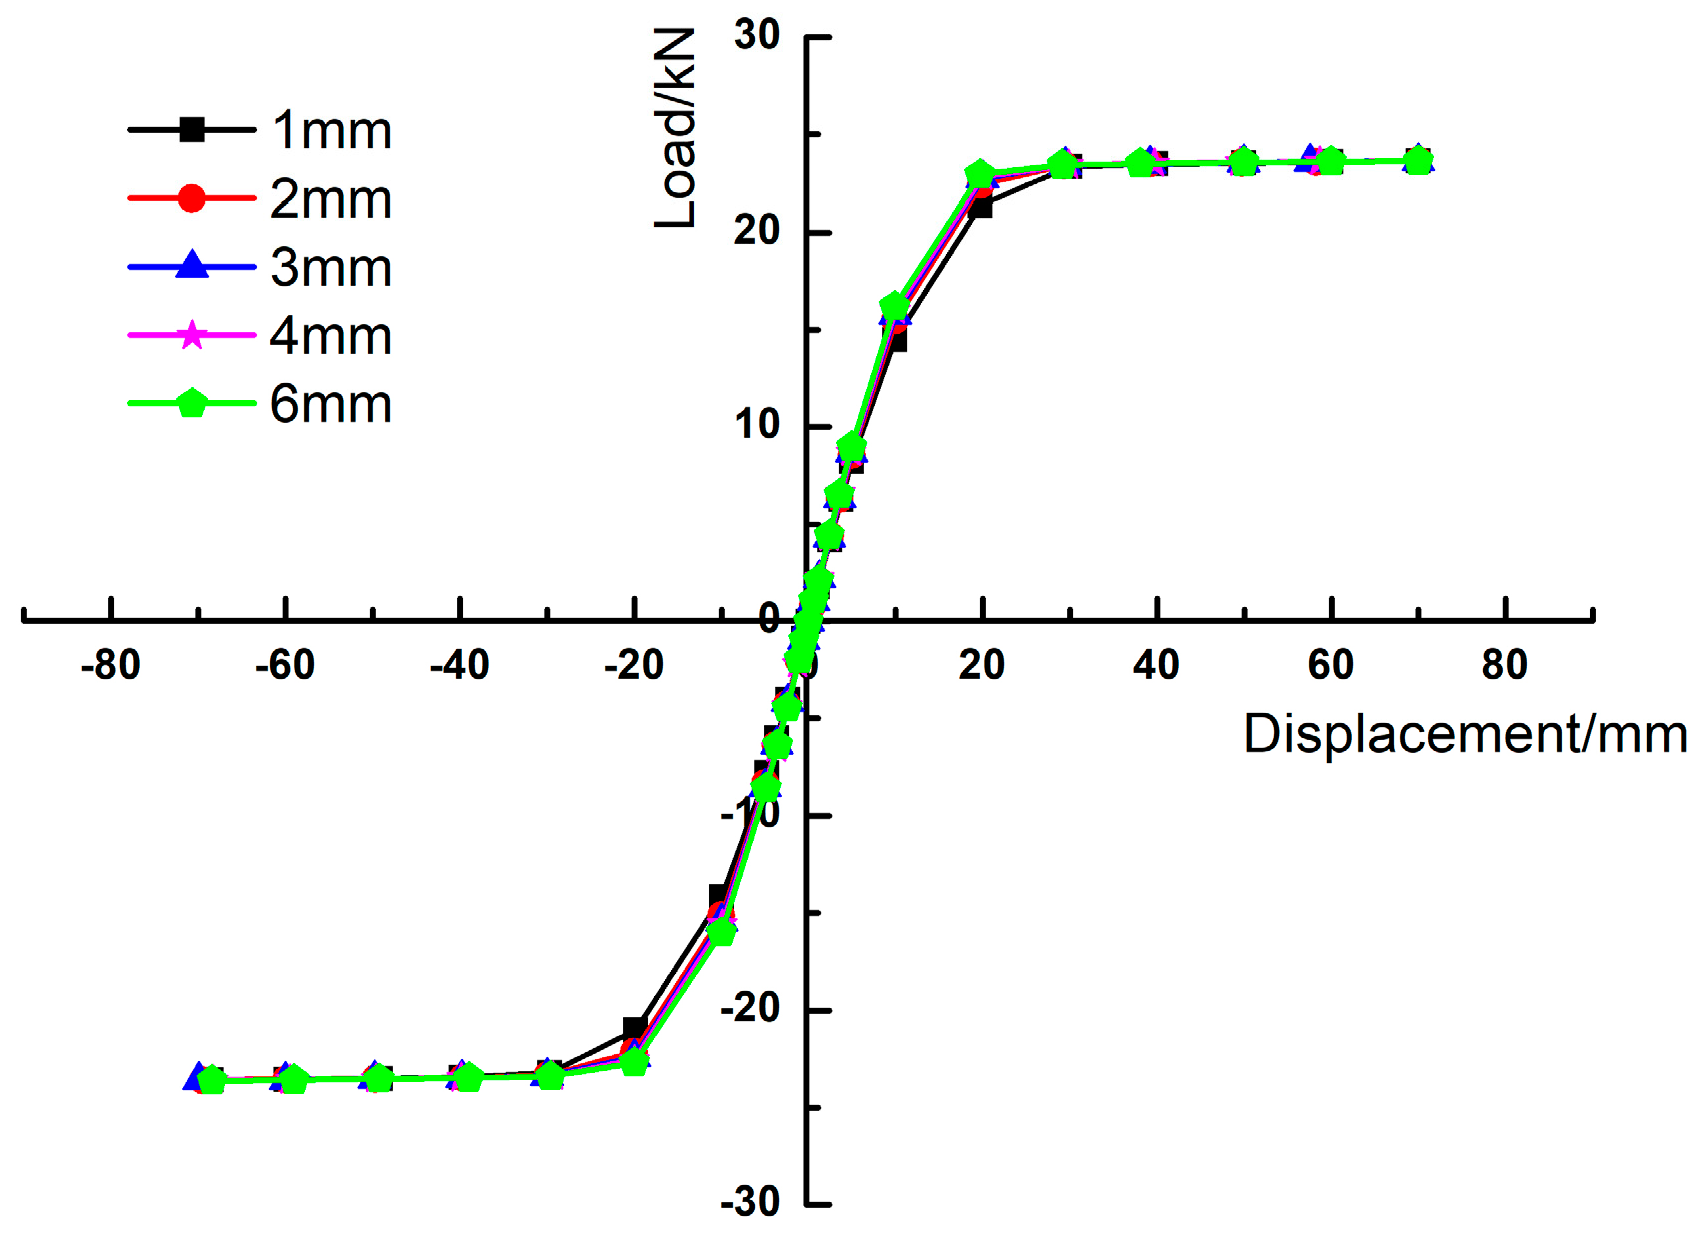
The skeleton curve is derived by sequentially connecting the peak load points of each hysteresis loop in the load–displacement hysteresis response, forming an outer envelope that encapsulates critical structural properties, including load-carrying capacity, stiffness, and ductility. This envelope provides a comprehensive framework for evaluating mechanical performance, with further analysis enabling the quantification of essential strength parameters such as yield load and ultimate load capacity.
As illustrated in Figure 8, the skeleton curves for integrated sleeve mortise-and-tenon steel–timber composite beam–column joints exhibit distinct performance variations depending on the beam sleeve thickness. The joint with a 1 mm sleeve thickness demonstrates a significantly reduced load capacity compared to thicker counterparts, primarily due to insufficient stiffness that fails to adequately restrain the timber beam. This inadequacy leads to the premature yielding of the steel sleeve, which compromises the structural integrity of the joint. All curves follow a consistent developmental pattern: an initial elastic ascending phase, followed by an elasto-plastic transitional plateau, a strain-hardening stage with a slight load capacity increase, and finally a post-peak degradation phase indicating progressive structural damage.
Figure 8.
Comparison of skeleton curves for joints with different sleeve thicknesses.
Between displacements of 15 mm and 20 mm, all specimens experience stiffness degradation caused by stiffener yielding and the compressive deformation of the timber beam, resulting in a gradual decline in load capacity. Notably, increasing the sleeve thickness to 2 mm or 3 mm significantly enhances the load capacity; however, further increments beyond 4 mm yield negligible performance improvements. This suggests an optimal thickness range of 2–3 mm that balances structural efficiency and material economy, while thicker sleeves provide diminishing returns due to other limiting factors in the system, such as timber compressive strength or stiffener yield limits.
3.1.5. Ductility of the Joint
Ductility is quantified by the ductility coefficient μ, defined as the ratio of the ultimate displacement (Δu) to the yield displacement (Δy), μ = Δu/Δy. For all finite element models of joints with varying sleeve thicknesses, the ultimate displacement Δu is uniformly taken as 70 mm.
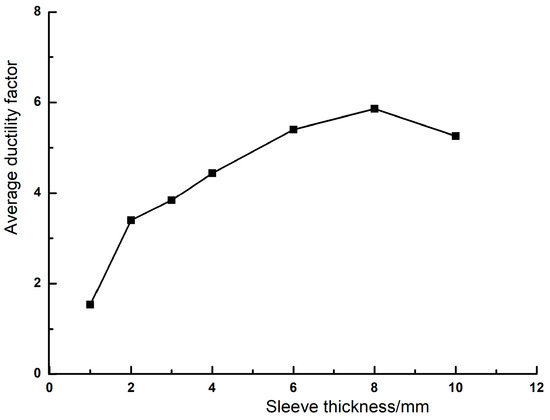
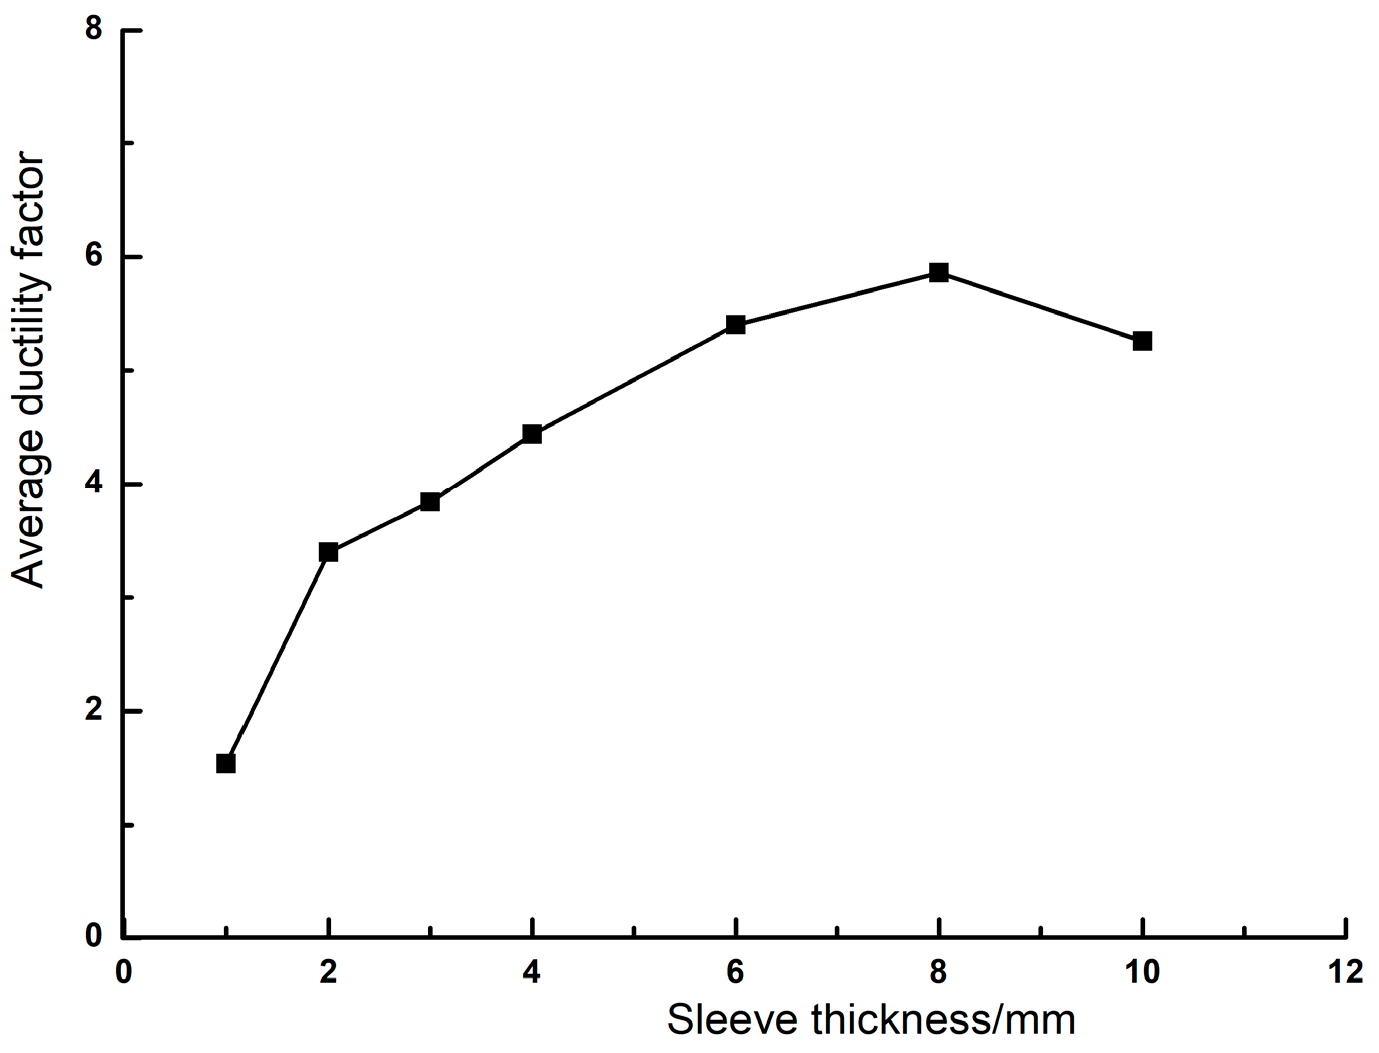
For joints with sleeve thicknesses exceeding 3 mm, the skeleton curves exhibit clear inflection points, enabling the direct identification of the yield displacement Δy. In contrast, joints with thicknesses less than 3 mm lack distinct inflection points, necessitating the use of the “equal-energy method” to determine Δy. The resulting ductility coefficients for different thicknesses are summarized in Figure 9.
Figure 9.
Diagram of ductility coefficients for joints with different sleeve thicknesses.
Overall, the average ductility coefficient generally increases with beam sleeve thickness. However, at a thickness of 10 mm, the ductility coefficient slightly decreases compared to that of the 8 mm specimen. The joint with a 1 mm sleeve exhibits the lowest ductility (μ ≈ 1.54), indicating an inadequate load-carrying capacity and stability once the plastic deformation is initiated. In contrast, all joints with sleeve thicknesses exceeding 2 mm achieve ductility coefficients greater than 3.0, demonstrating that steel sleeve reinforcement substantially enhances the ductility and overall seismic performance of the timber beam–column joint.
3.1.6. Stiffness Degradation of the Joint
The stiffness of a joint is a critical parameter for evaluating its load-carrying durability and energy dissipation capacity. In this study, the secant stiffness is adopted as the metric for structural stiffness, defined as the ratio of the maximum horizontal load to its corresponding displacement in each loading cycle. Mathematically, the secant stiffness Ki can be calculated using Equation (2):
where Pij is the peak load in the j-th cycle under the i-th load level, Δij is the corresponding peak displacement in the j-th cycle under the i-th load level, and n denotes the total number of cycles.
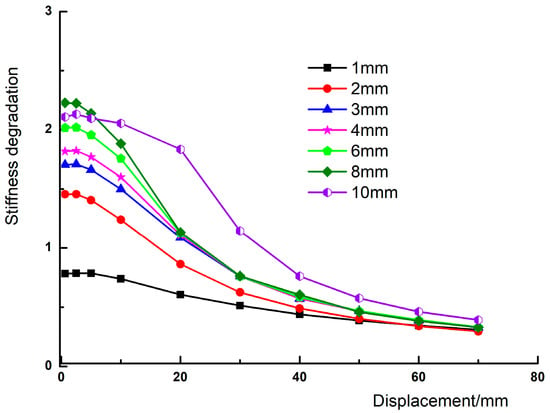
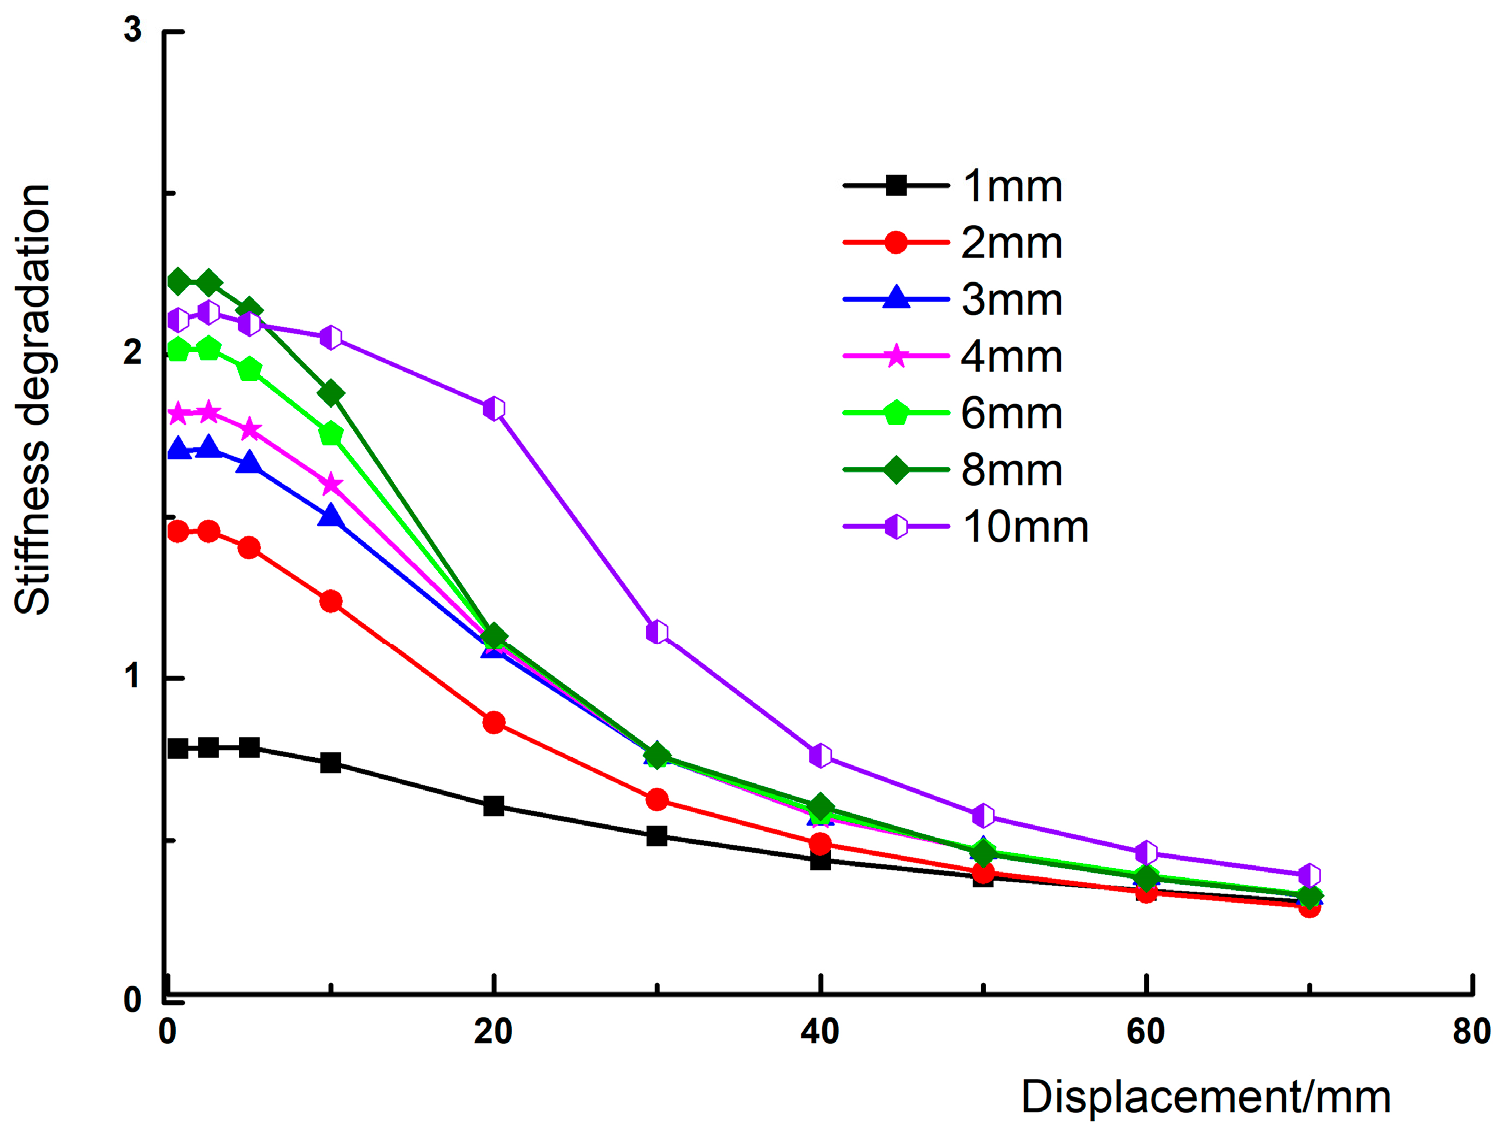
Figure 10 presents the stiffness degradation curves of integrated sleeve mortise-and-tenon steel–timber composite beam–column joints with varying sleeve thicknesses under successive loading levels. As shown, the flexural stiffness of all joints exhibits a progressive decline as the applied displacement amplitude increases, reflecting cumulative damage from cyclic loading. Notably, the joint with a 2 mm sleeve thickness demonstrates relatively mild stiffness degradation, indicating a superior load-carrying capacity and seismic performance. This behavior suggests effective composite action between the timber beam and the steel sleeve at this thickness, enabling efficient load transfer and deformation coordination.
Figure 10.
Stiffness degradation curve of each node.
According to the above analysis, when the sleeve thickness exceeds 3 mm, the excessively high stiffness of the steel sleeve becomes mismatched with that of the timber beam, leading to localized stress concentrations and excessive plastic deformation in the wood during cyclic loading. Conversely, joints with sleeve thicknesses below 2 mm exhibit insufficient bending resistance, resulting in inadequate rotational stiffness and premature stiffness degradation. These findings highlight the importance of optimizing sleeve thickness to balance structural stiffness compatibility between the steel and timber components, ensuring both strength and ductility under dynamic loading conditions.
3.2. Parametric Analysis of Beam Sleeve Length
Based on the findings from the parametric study on beam sleeve thickness, a sleeve thickness of 3 mm—identified as optimal—was selected for further investigation into the influence of sleeve length on the seismic performance of the integrated sleeve mortise-and-tenon steel–timber composite beam–column joint. Five models with beam sleeve lengths of l = 150 mm, 200 mm, 250 mm, 300 mm, and 350 mm were analyzed using finite element simulation, while keeping all other parameters—sleeve thickness, tenon–mortise dimensions, bolt configuration, and stiffener details—unchanged.
3.2.1. Deformation Patterns of the Joint
Figure 11 presents the deformation patterns of the five reinforced joints at a lateral displacement of 70 mm. The failure mode remains consistent across all sleeve lengths. For the steel sleeve, increasing its length does not significantly alter the overall deformation pattern; the primary deformation zones remain concentrated in the welded stiffener regions and the upper surface of the sleeve. In contrast, the timber beam exhibits a shift in the compressive deformation location with varying sleeve lengths, with high-compression zones consistently occurring at the overlapping contact interface between the beam and the sleeve.
Figure 11.
Overall deformation diagram of each node of different beam sleeve lengths (unit: mm).
3.2.2. Stress Distribution in Beam Sleeve and Timber Beam
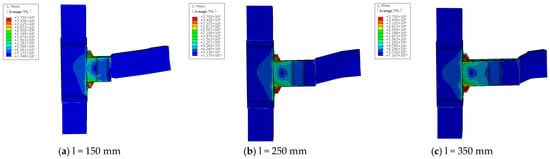
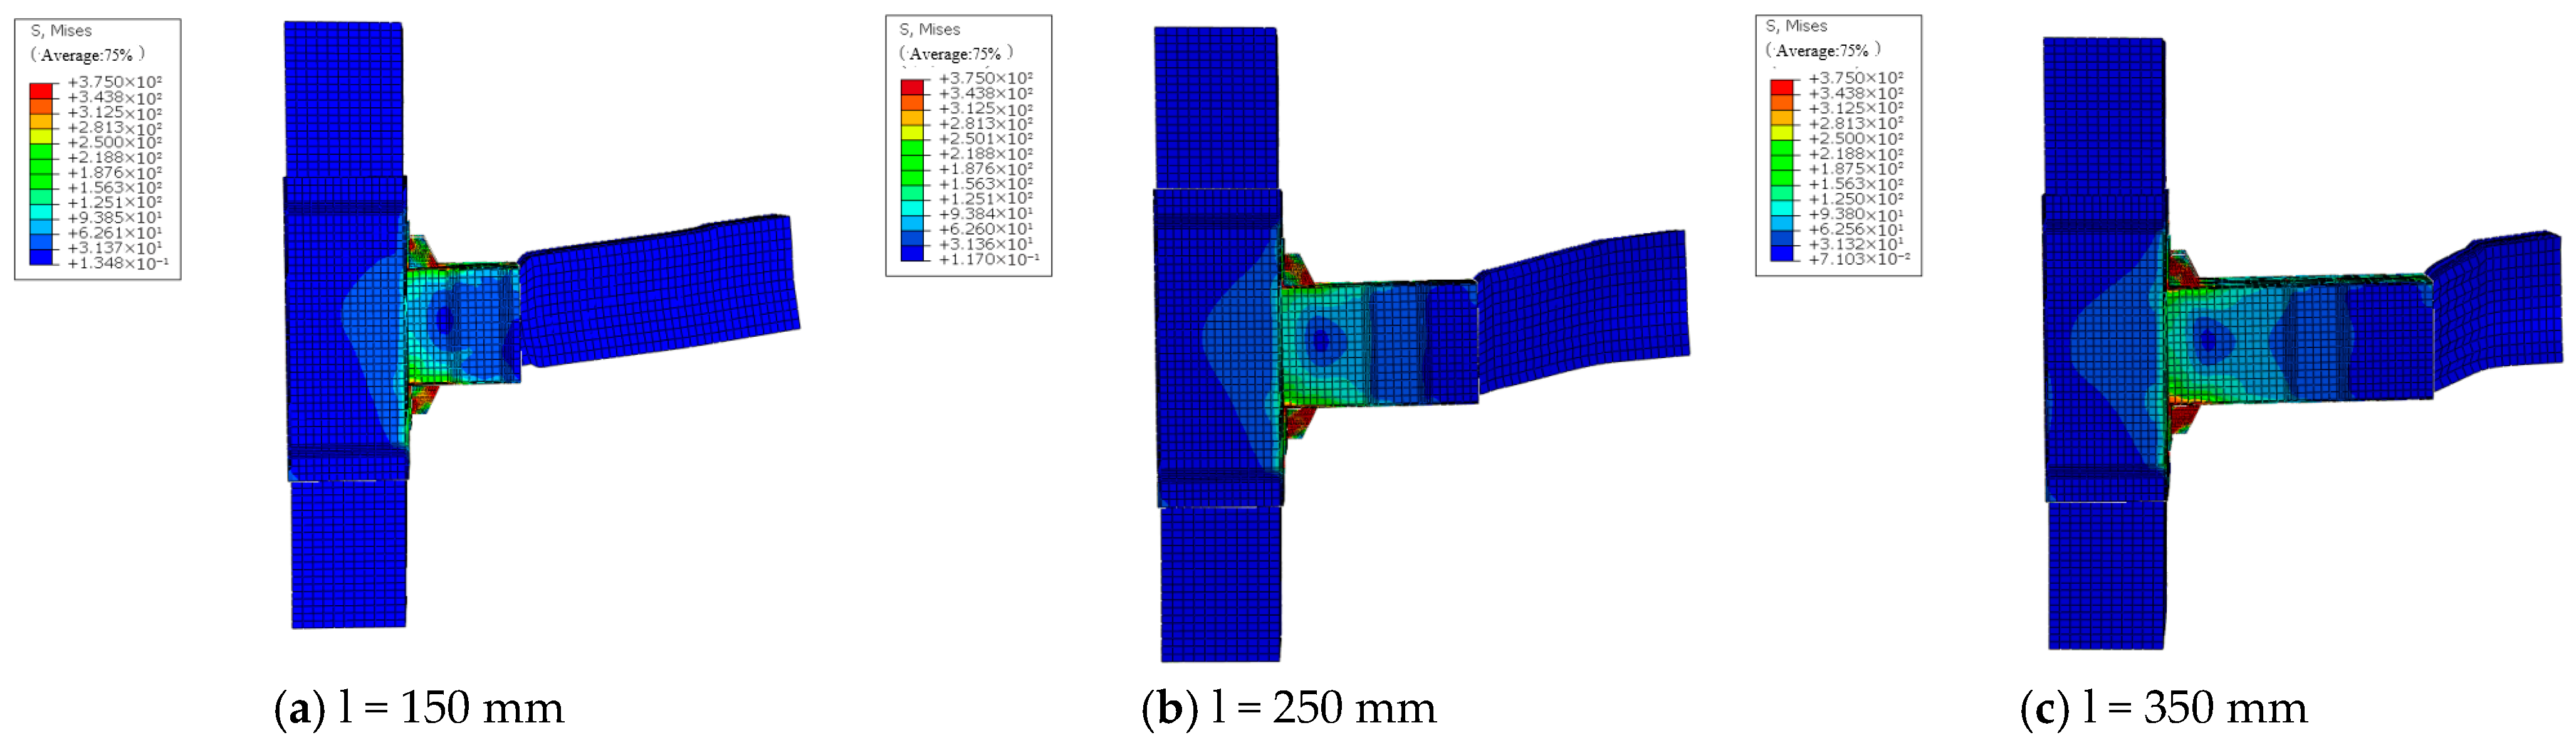
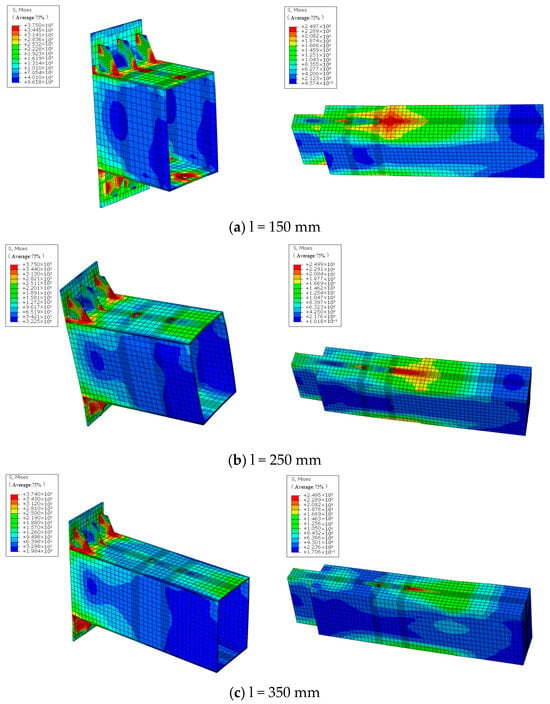
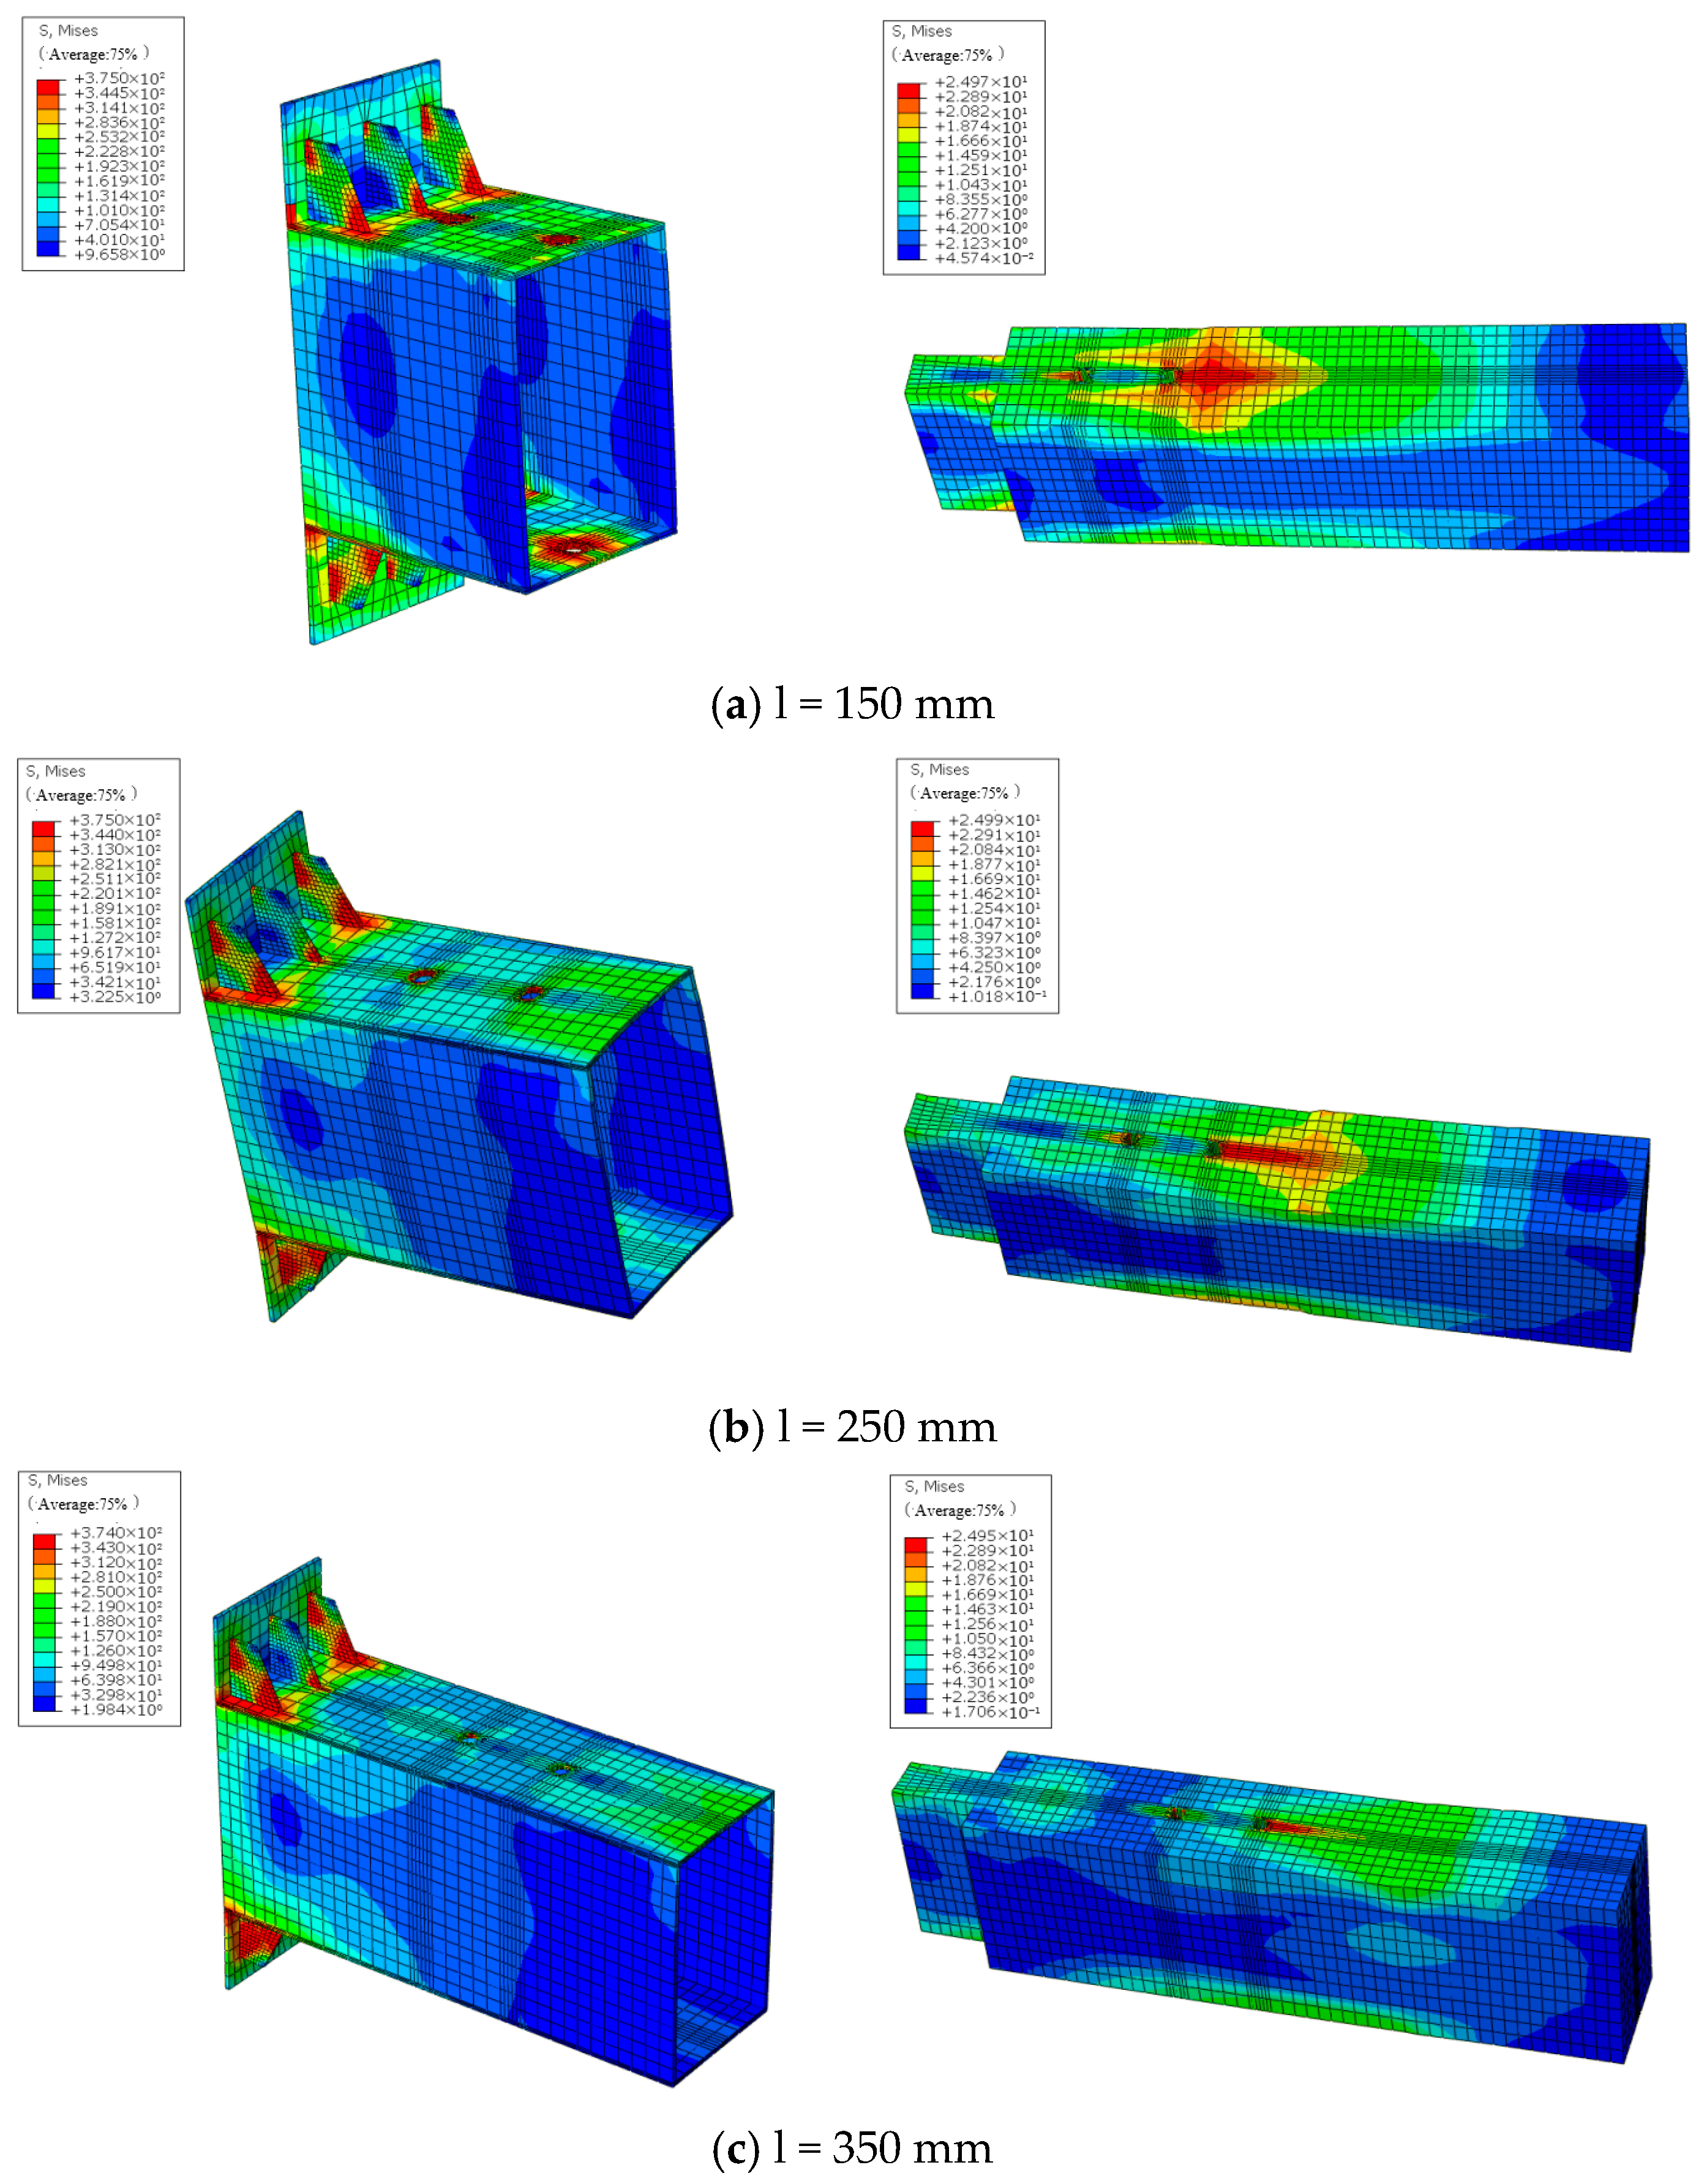
Figure 12 illustrates the stress distribution (in MPa) at a displacement of 20 mm. For the 150 mm sleeve, extensive stress concentrations develop in both the upper and lower flanges due to an insufficient length, which hinders effective stress diffusion. In contrast, sleeves ≥ 200 mm exhibit localized high-stress regions near the ends, with stress concentrations diminishing as the length increases. Concurrently, the stress on the timber beam at the beam–sleeve interface decreases with increasing sleeve length. This phenomenon arises because the high-compressive stress zone shifts farther from the tenon, allowing the mid-span region—where the bending moment dominates over the shear force—to carry a greater load. Additionally, the expanded contact area between the beam and sleeve enhances the beam’s flexural capacity.
Figure 12.
Stress nephogram of each joint beam and beam sleeve of different beam sleeve lengths (unit: MPa).
3.2.3. Load–Displacement Hysteresis Curves
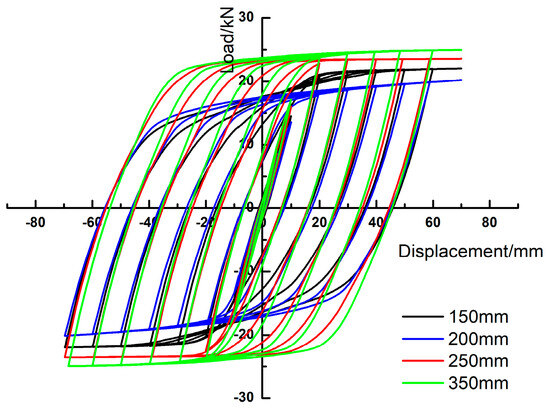
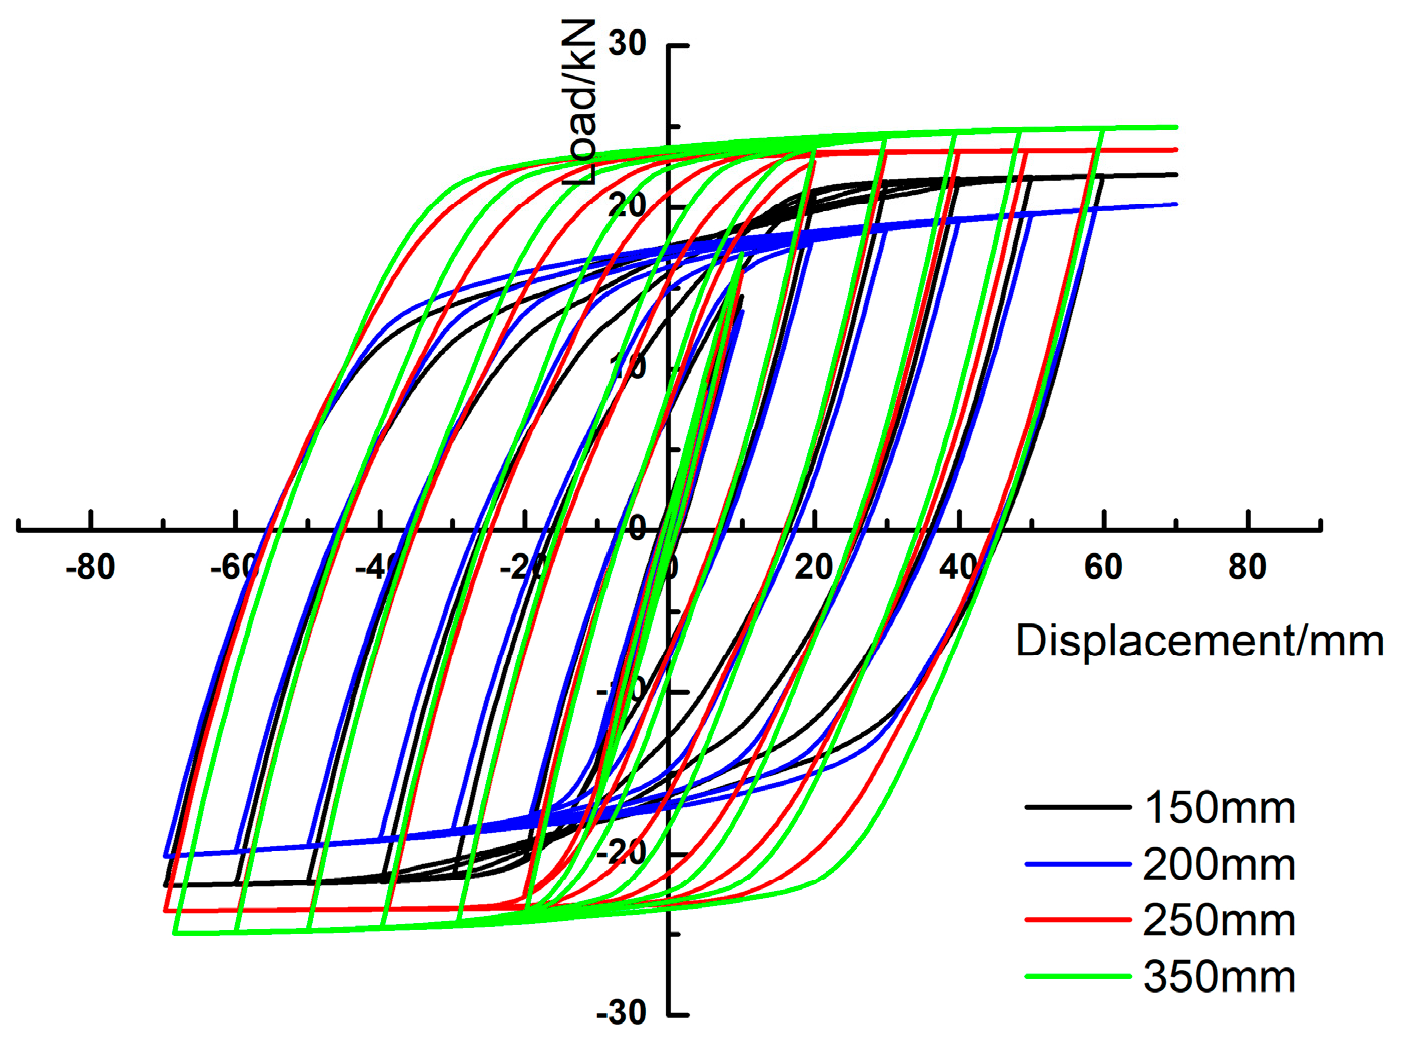
The hysteresis curves under low-cycle reversed loading for the five sleeve lengths are shown in Figure 13. Our key observations include the following:
Figure 13.
Comparison of hysteresis curves for joints with different sleeve lengths.
Joints with 150 mm and 200 mm sleeves exhibit pronounced “pinching” effects, characterized by bow-shaped curves with narrowed centers. This indicates significant shear influence, consistent with shear-type damage observed in the sleeve flange stress diagrams. At 250 mm, the hysteresis curve transitions to a fuller “fusiform” shape, reflecting reduced shear dominance, an enhanced plastic deformation capacity, and improved energy dissipation and seismic performance. Beyond 250 mm, further increases in length yield negligible improvements in curve fullness or peak load values.
The 200 mm sleeve joint shows the lowest peak load among all cases. This is attributed to the closer proximity of the compression zone to the bolts in the 150 mm sleeve, allowing the bolts to share part of the bending resistance and resulting in slightly higher peak loads than those of the 200 mm sleeve. Conversely, sleeves ≥ 300 mm benefit from larger beam–sleeve contact areas, enhancing end moment resistance and producing higher peak loads compared to the 200 mm joint.
3.2.4. Skeleton Curve Analysis
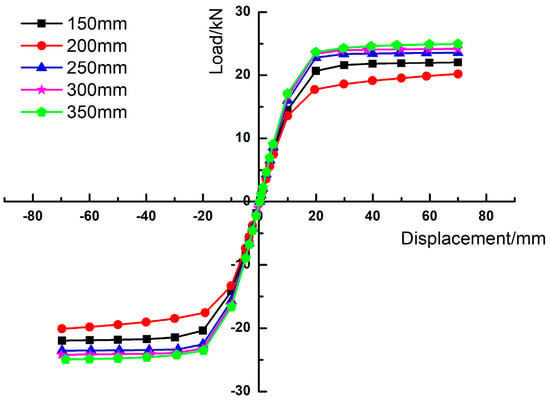
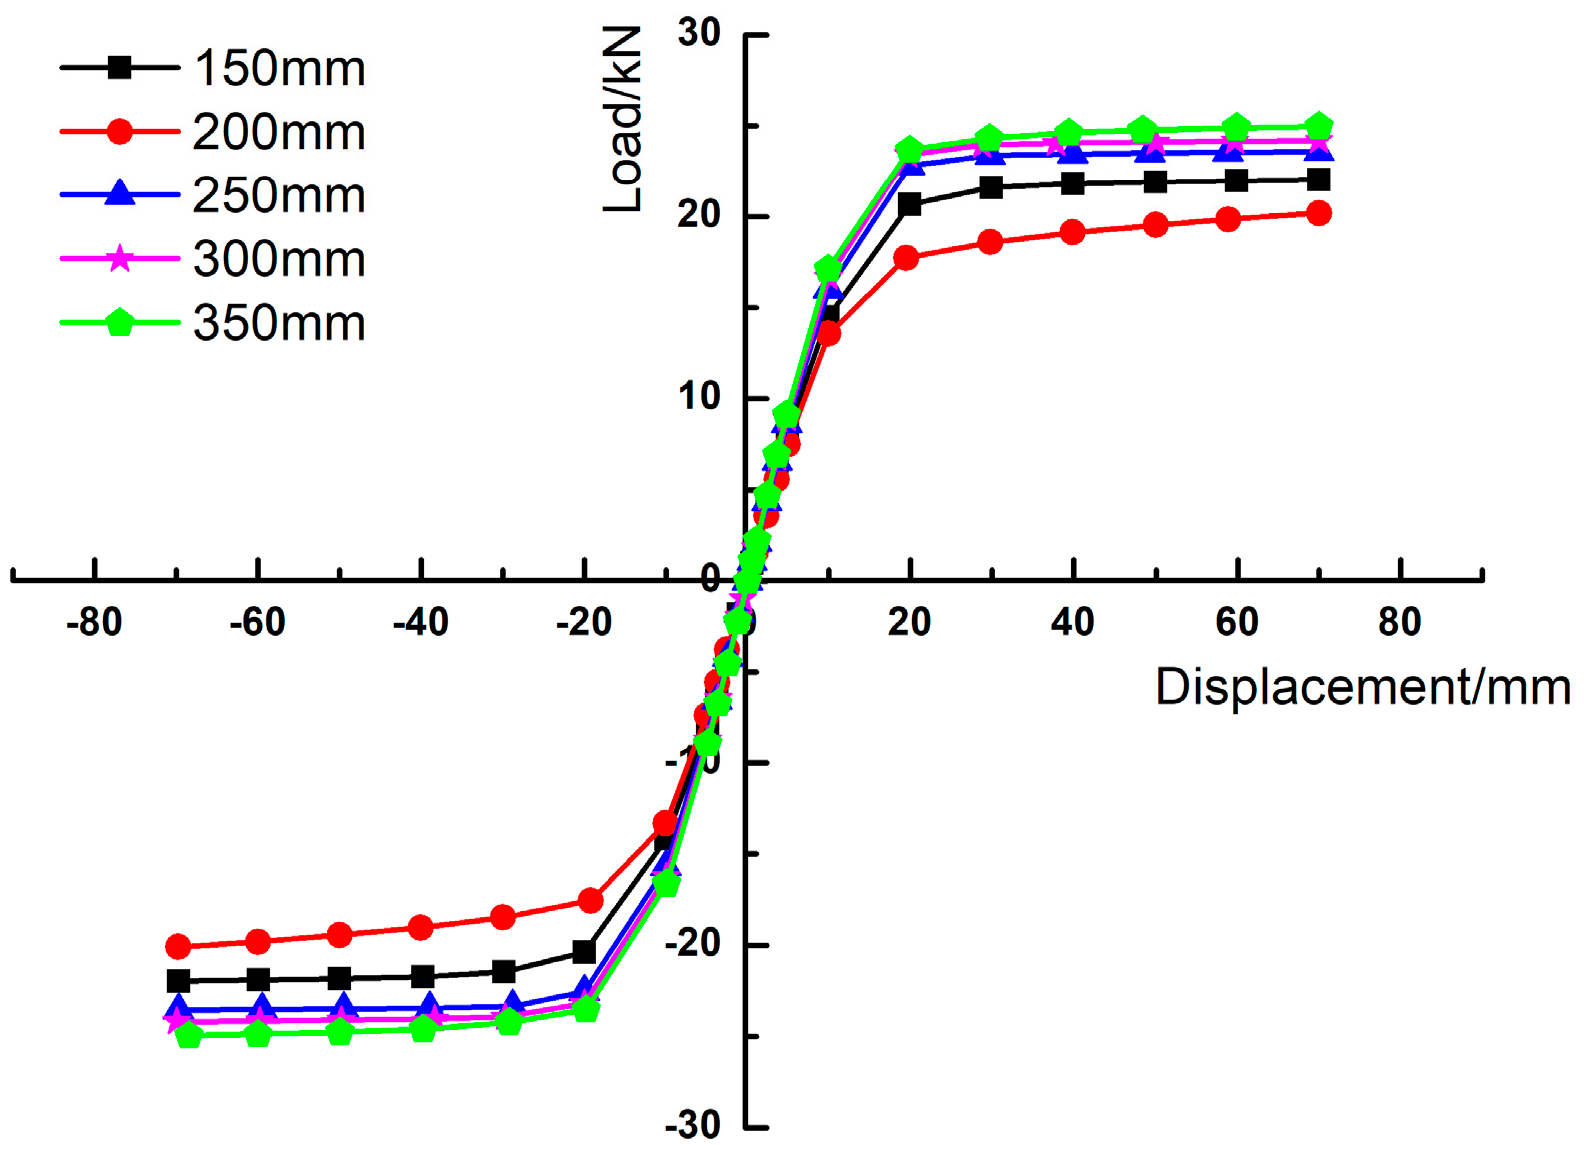
Figure 14 displays the skeleton curves for varying sleeve lengths. All joints achieve ultimate loads between 18 kN and 25 kN, with significant increases observed as the length increases from 150 mm to 250 mm, beyond which improvements plateau. All curves follow a four-stage development pattern: elastic ascending → elasto-plastic plateau → strain hardening (load increase) → post-peak degradation. Initially, all curves rise linearly with a similar initial stiffness. Between a displacement of 15 mm and 20 mm, stiffener yielding and timber compression induce stiffness divergence as joints enter the elasto-plastic phase. At ~30 mm displacement, the joints transition into the hardening stage due to moment resistance. Finally, beam splitting causes stiffness loss and strength degradation. While the 150 mm joint exhibits a slightly higher strength than that of the 200 mm joint, its short length and bolt proximity to the edge make it an outlier. Overall, increasing sleeve length minimally affects the initial stiffness but significantly enhances stiffness and flexural capacity in the elasto-plastic and failure stages—though these benefits diminish beyond 250 mm.
Figure 14.
Comparison of skeleton curves of nodes with different lengths.
3.2.5. Ductility Coefficients
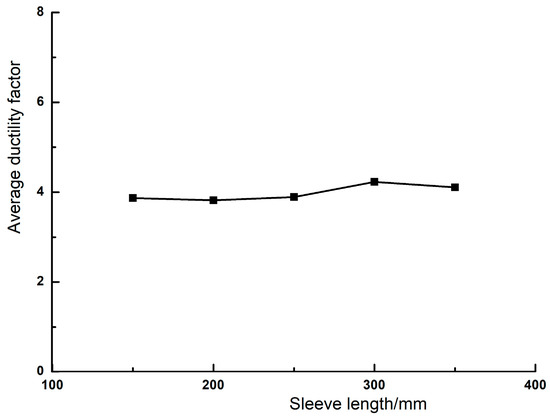
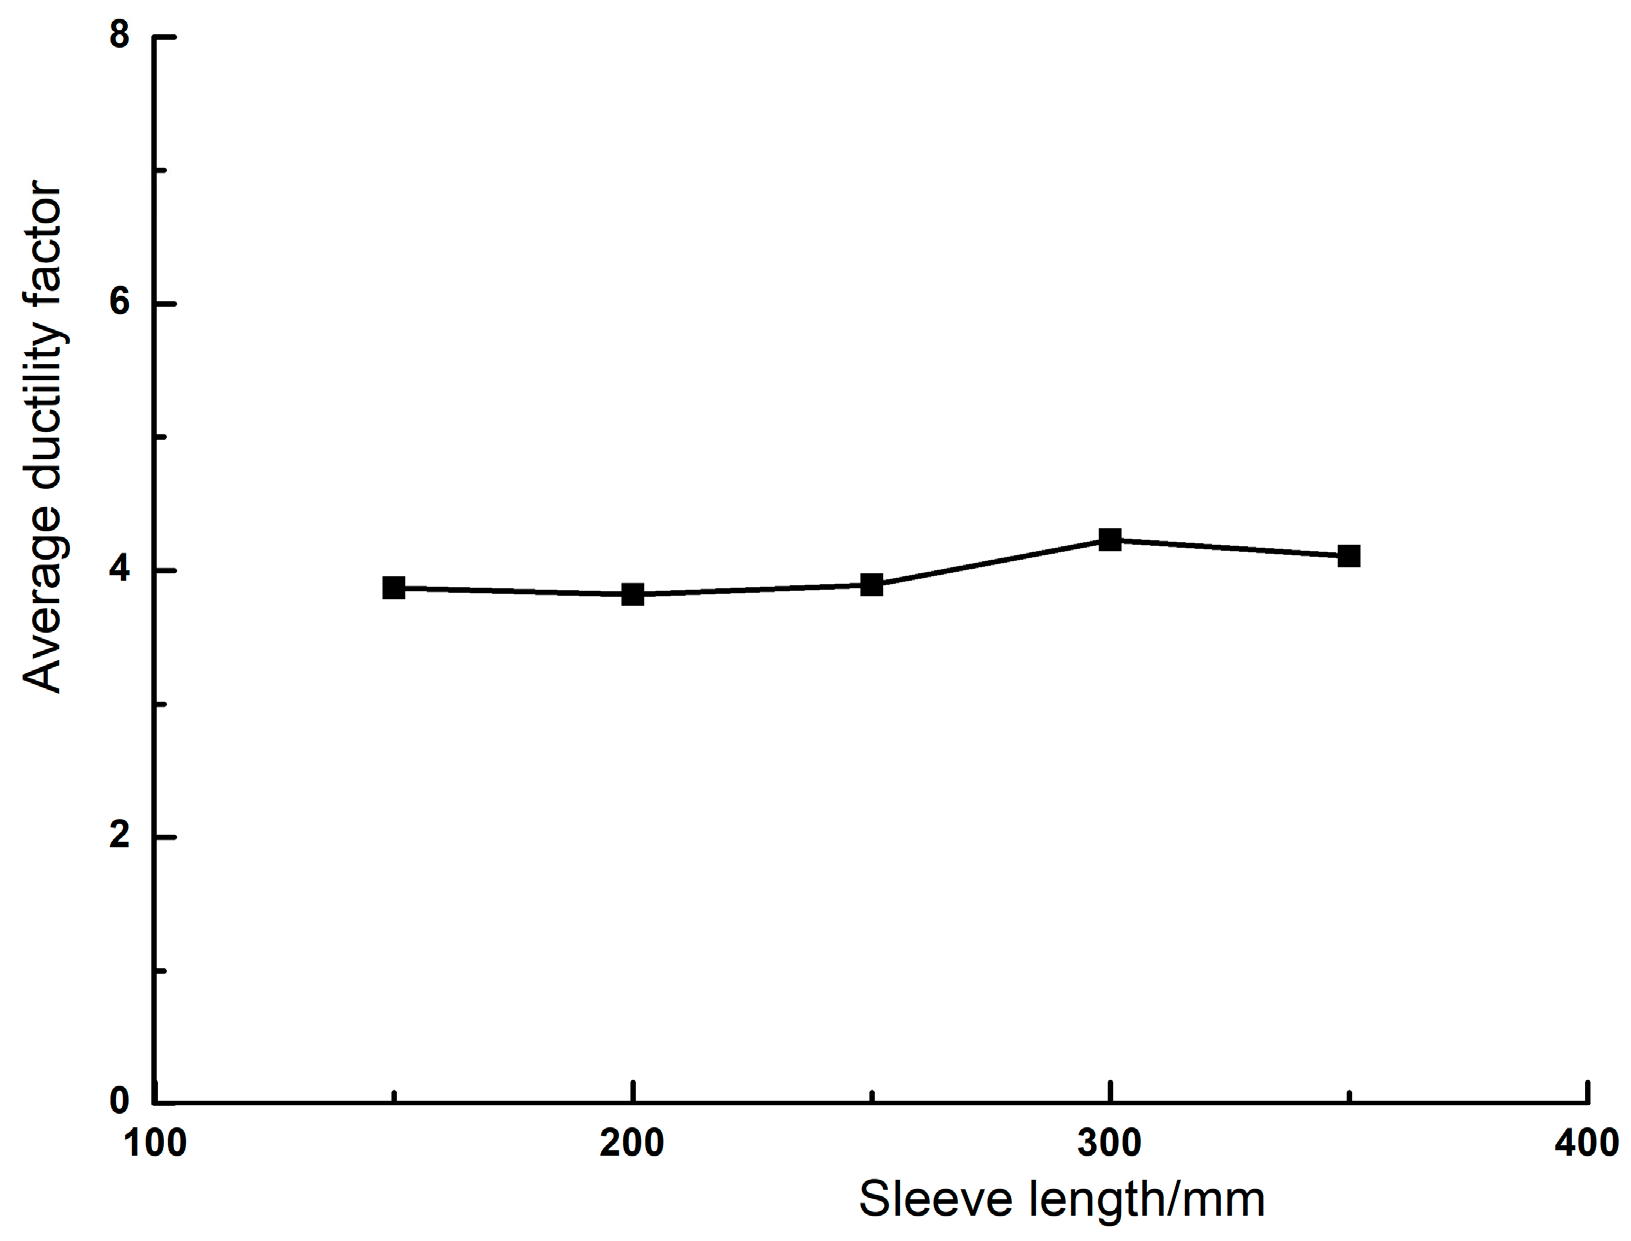
As shown in Figure 15, ductility coefficients (μ = Δu/Δy, with Δu = 70 mm) range from 3.8 to 4.2, confirming high ductility across all specimens. The steel sleeve effectively sustains high loads even after yielding, enabling efficient energy absorption and dissipation during earthquakes. However, excessively short sleeves concentrate shear forces, impairing energy dissipation and hysteresis behavior, while overly long sleeves reduce joint stiffness and flexural capacity. Moreover, when μ exceeds 4.0, the deformation becomes predominantly plastic, which may compromise seismic safety. Therefore, sleeve lengths of 200–250 mm yield the best balance of ductility, strength, and energy dissipation.
Figure 15.
Ductility coefficients of joints with different sleeve lengths.
3.2.6. Stiffness Degradation
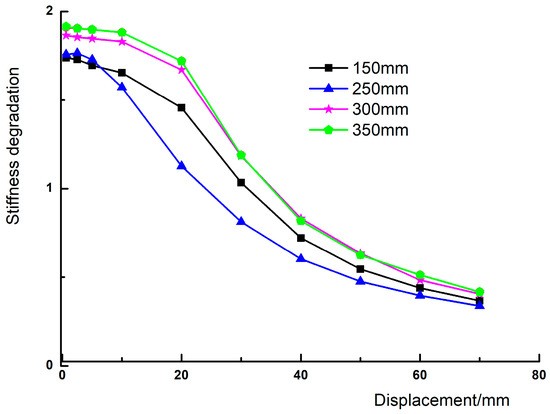
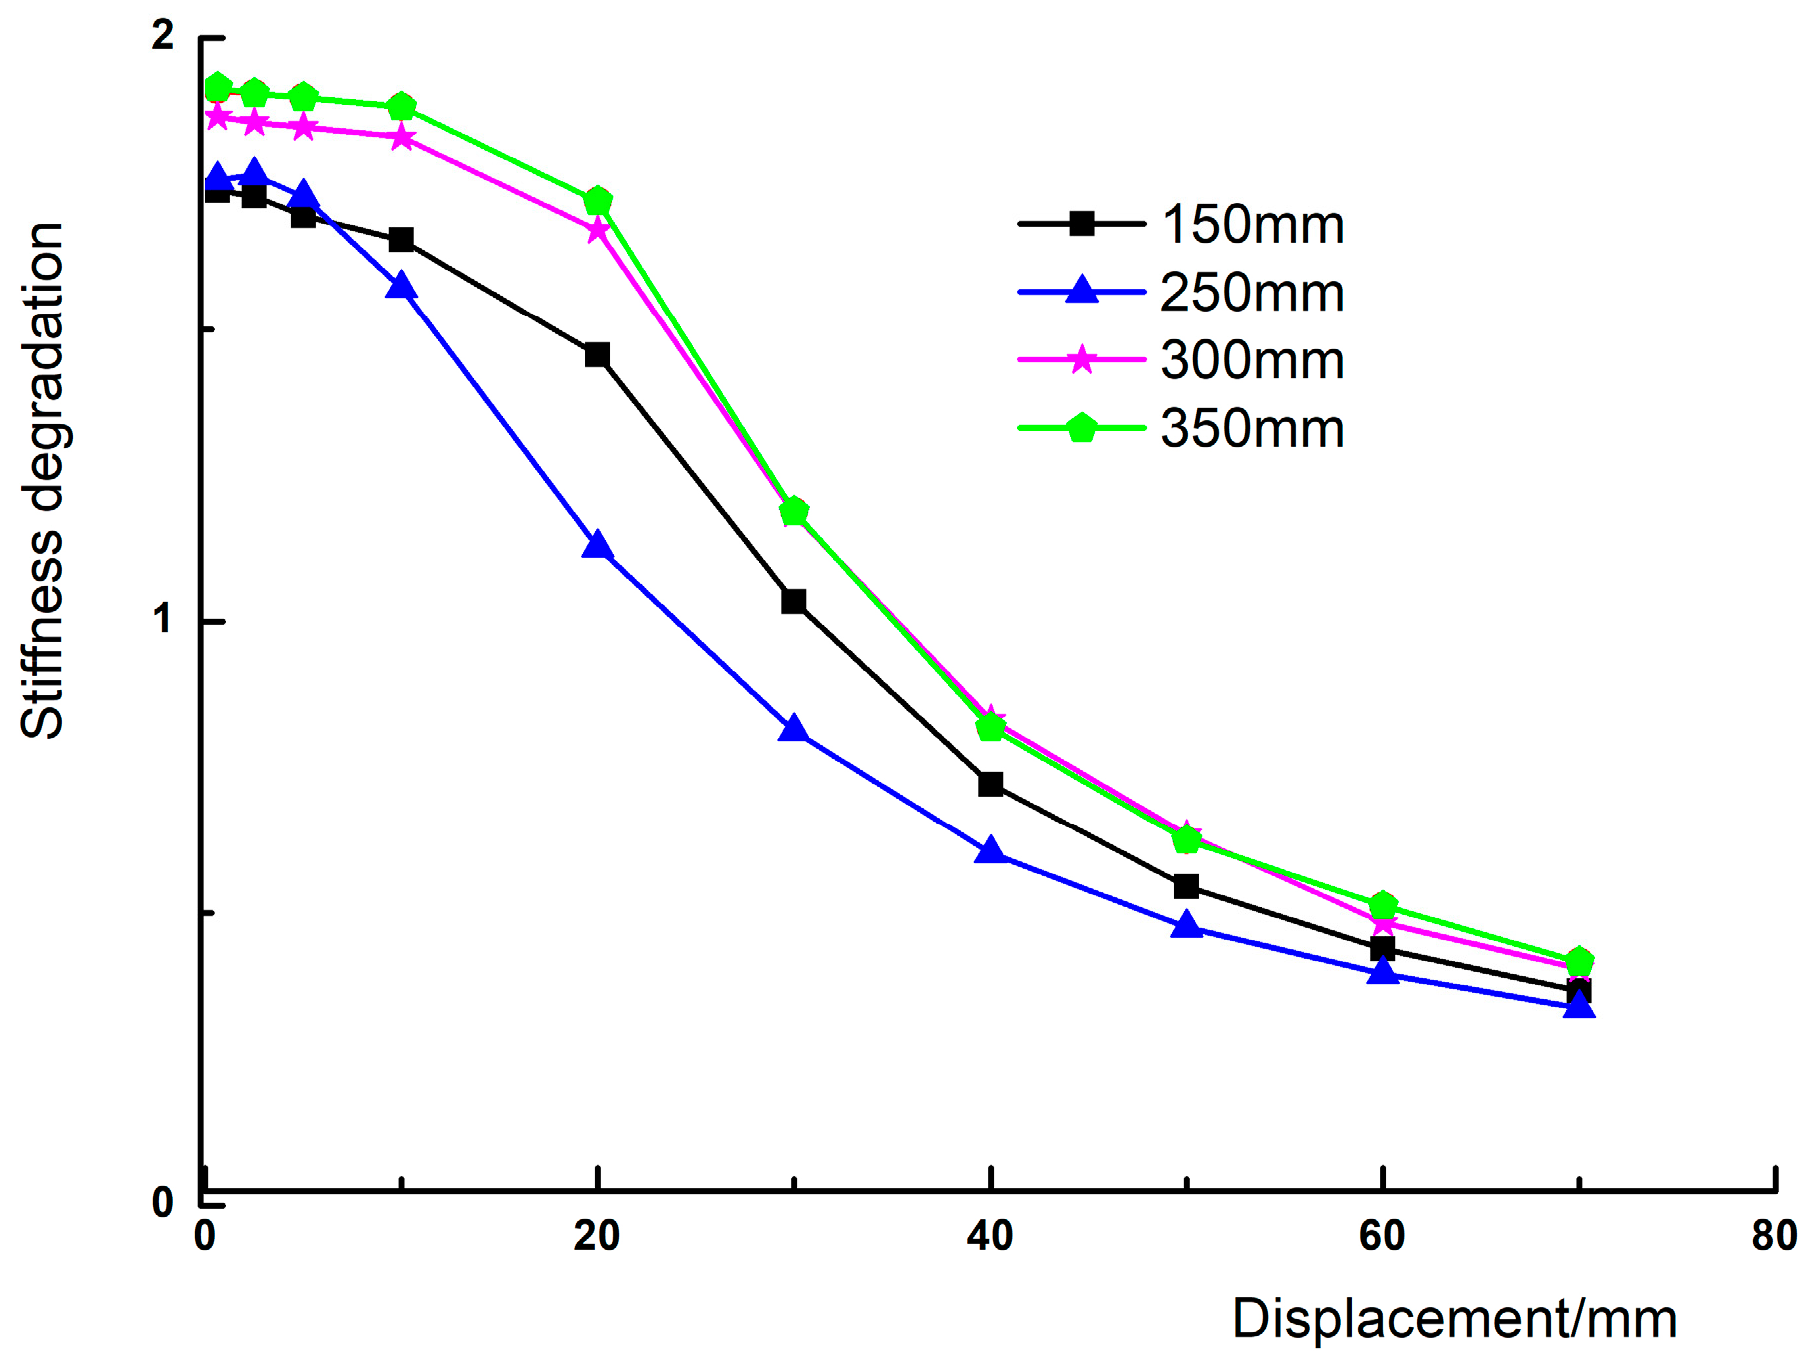
Figure 16 illustrates the secant stiffness degradation curves. The initial elastic lateral stiffness of the 200 mm and 250 mm joints differs by only 3.2%. At 20 mm displacement, the 200 mm joint exhibits 35.31% greater stiffness compared to the 150 mm reference. At 70 mm displacement, this gap narrows. Before steel yielding, the stiffness differences are notable; they converge during elasto-plastic deformation, with the 250 mm joint maintaining a slightly higher stiffness. Joints with lengths > 250 mm show similar initial stiffness and degradation trends, consistently outperforming the 150 mm and 200 mm cases.
Figure 16.
Stiffness degradation curves of all joints.
According to the above analysis, an appropriate sleeve length enhances seismic performance, but an excessive length reduces stiffness and deformation resistance, while an insufficient length leads to premature shear-dominated failure in the timber beam. Therefore, under the current cross-sectional configuration and a 3 mm sleeve thickness, a beam sleeve length of approximately 250 mm is deemed optimal.
3.3. Parametric Analysis of Bolt Diameter
Based on the parametric studies of sleeve thickness and length, a reference joint configuration with a beam sleeve thickness of 3 mm and length of 250 mm was selected to investigate the influence of bolt diameter on seismic performance. Seven finite element models were analyzed, featuring bolt diameters of Φ = 4 mm, 6 mm, 8 mm, 10 mm, 12 mm, and 14 mm, while keeping all other parameters—sleeve dimensions, mortise–tenon geometry, and stiffener configuration—unchanged.
3.3.1. Stress Distribution in Sleeve, Stiffeners, Timber Beam, and Bolts
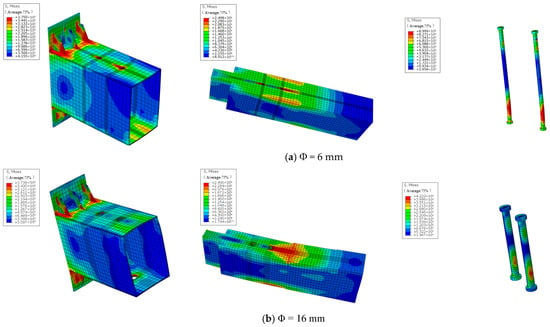
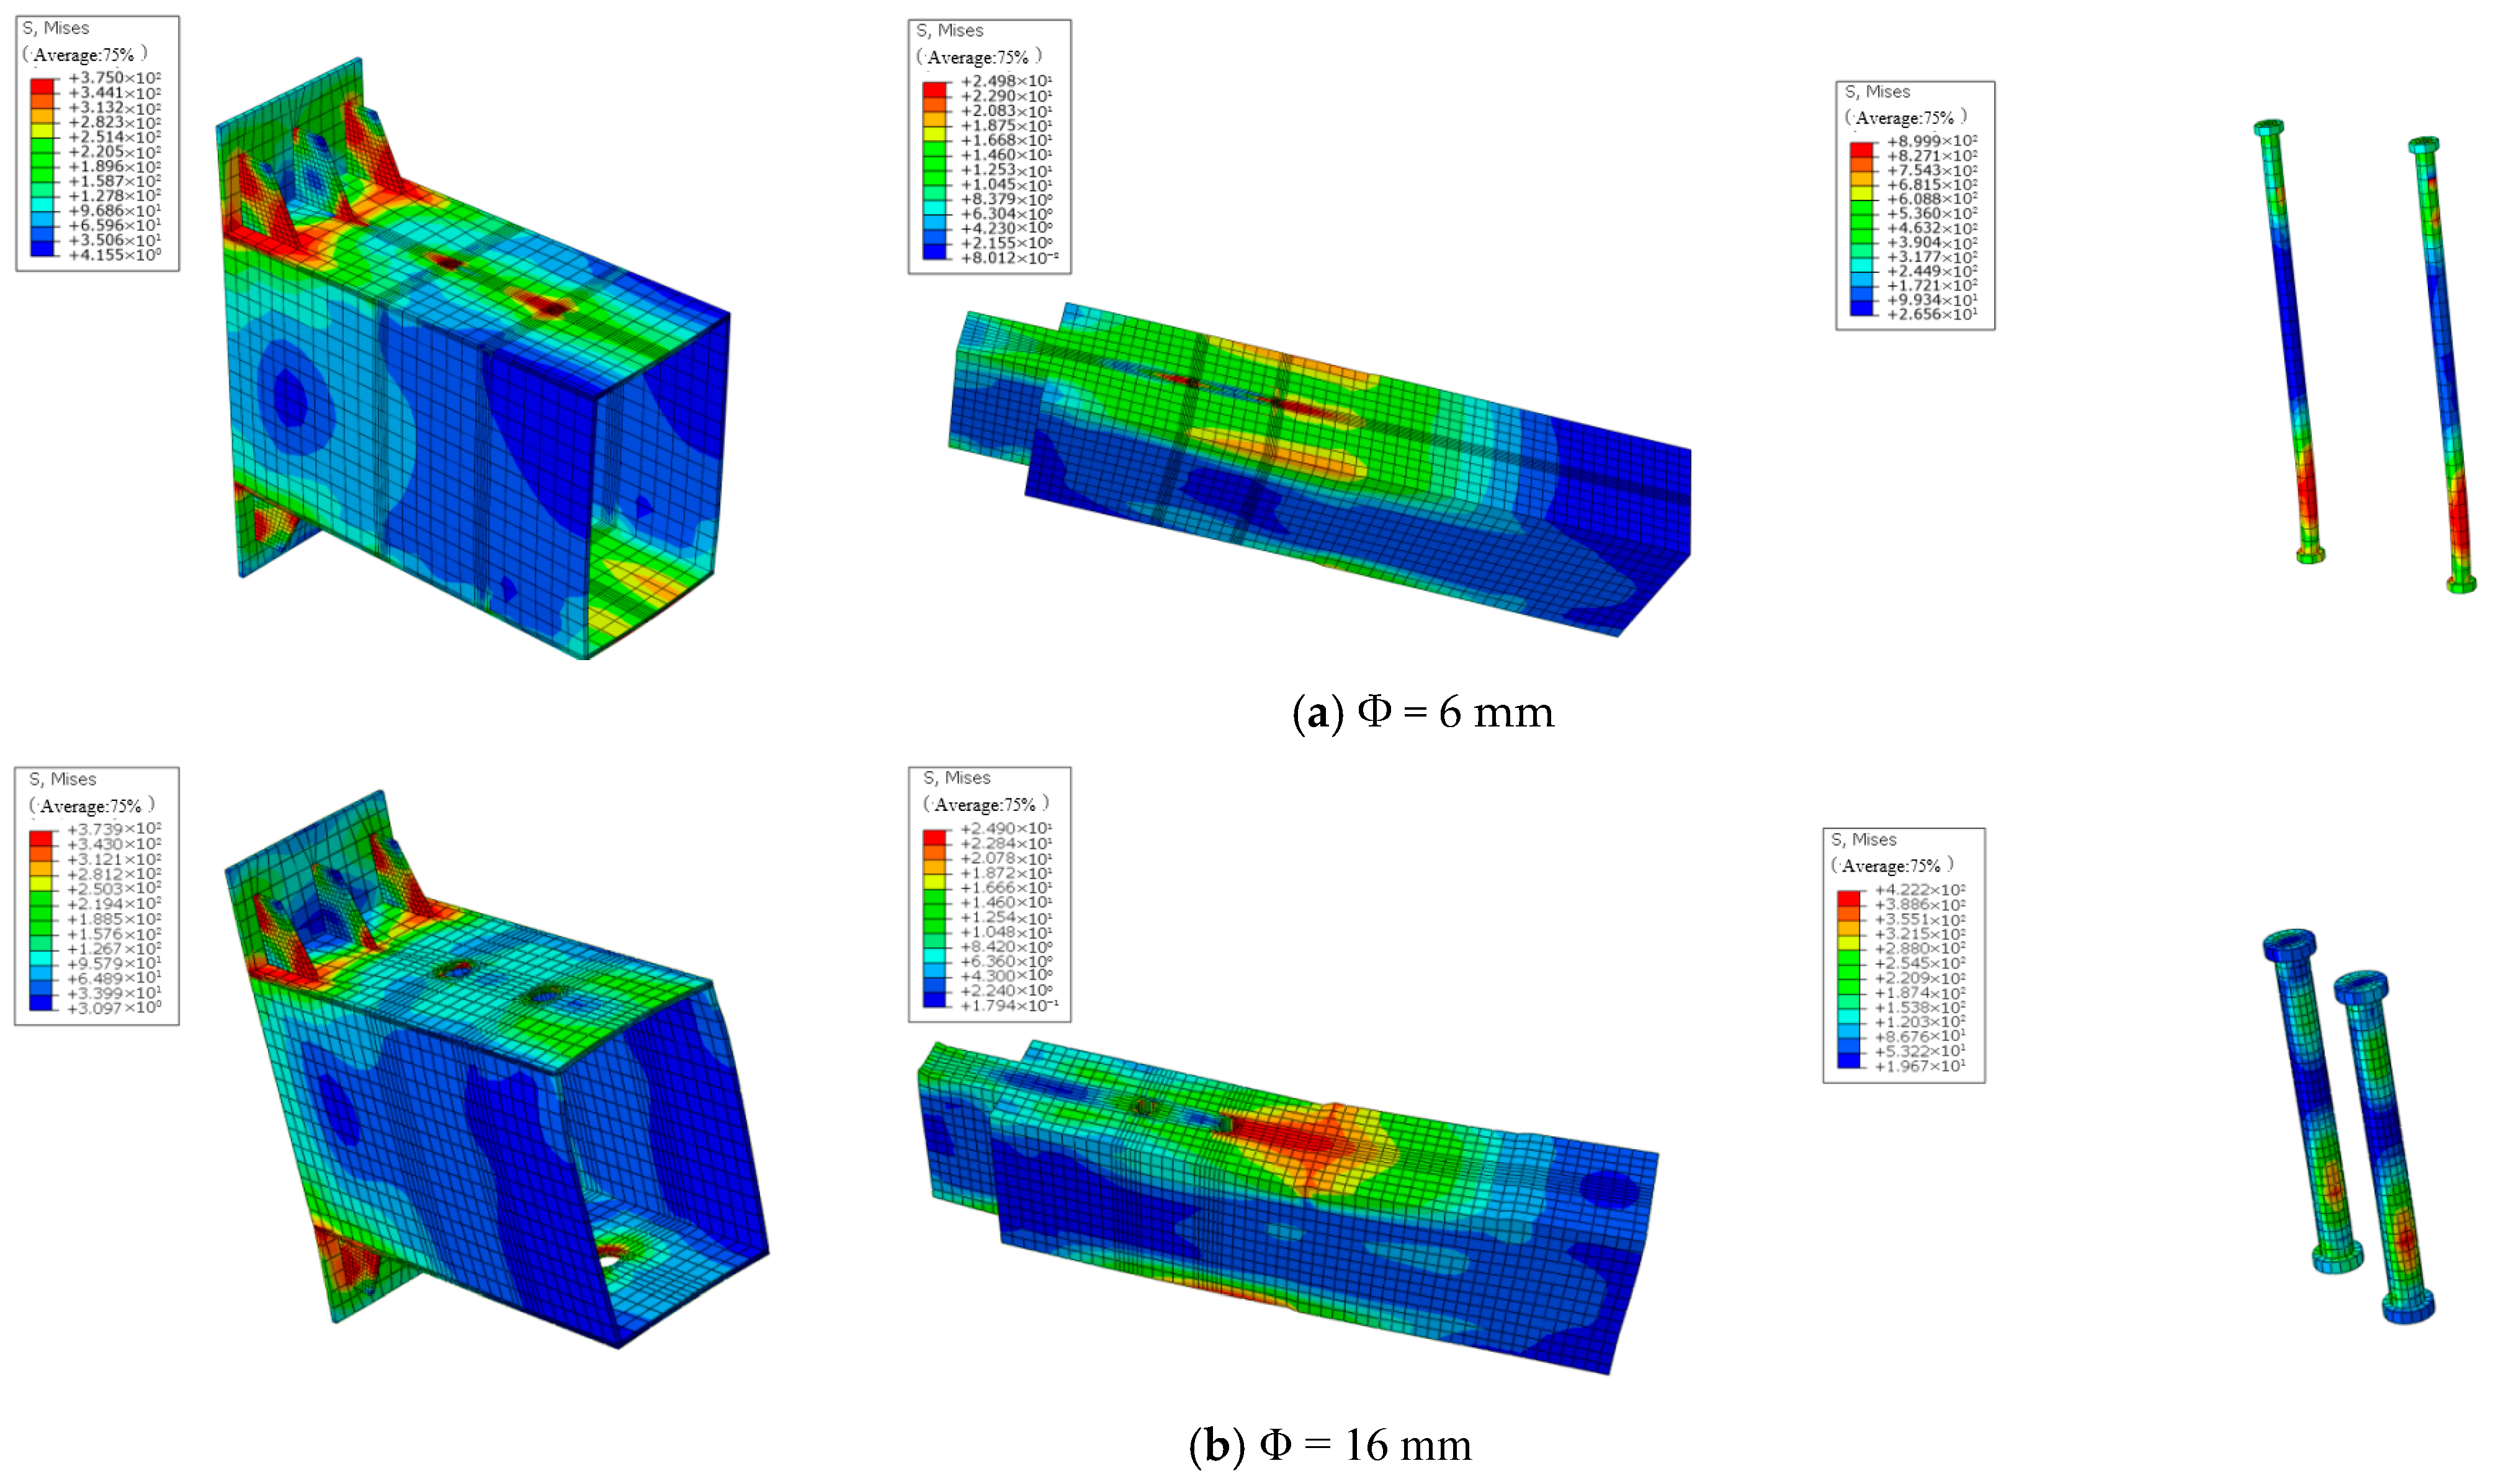
Figure 17 presents stress contour plots at a displacement of 20 mm. The stress distribution analysis reveals that high-strength bolts are positioned near the center of the sleeve, where the flexural stiffness is greatest, resulting in elevated stress concentrations at the sleeve ends. Increasing the bolt diameter enhances bolt rigidity and mitigates the stress concentration around the bolt shank. For the timber beam, larger bolt diameters amplify the stiffness mismatch between steel and wood, causing the stress concentration zones around the bolt holes to expand toward the beam–sleeve overlap region.
Figure 17.
Stress contour plots of all joints with different bolt diameters (unit: MPa).
Bolt diameter directly influences joint flexural stiffness: when the diameter is less than 6 mm, the bolt stiffness is comparable to that of the sleeve, leading to stress concentration at threaded holes; when the diameter exceeds 8 mm, the bolt stiffness significantly surpasses that of the sleeve, rendering bolt failure unlikely. These findings underscore the critical role of selecting an appropriate bolt diameter to optimize joint performance.
3.3.2. Load–Displacement Hysteresis Curves
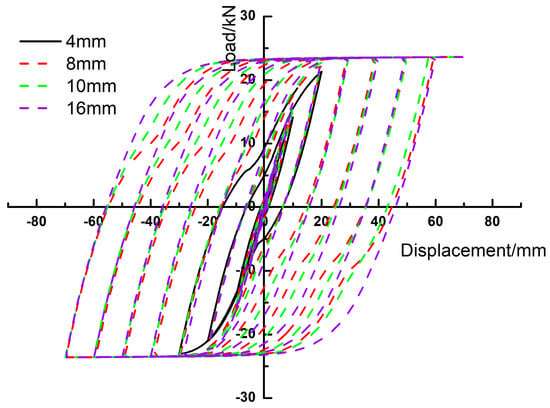
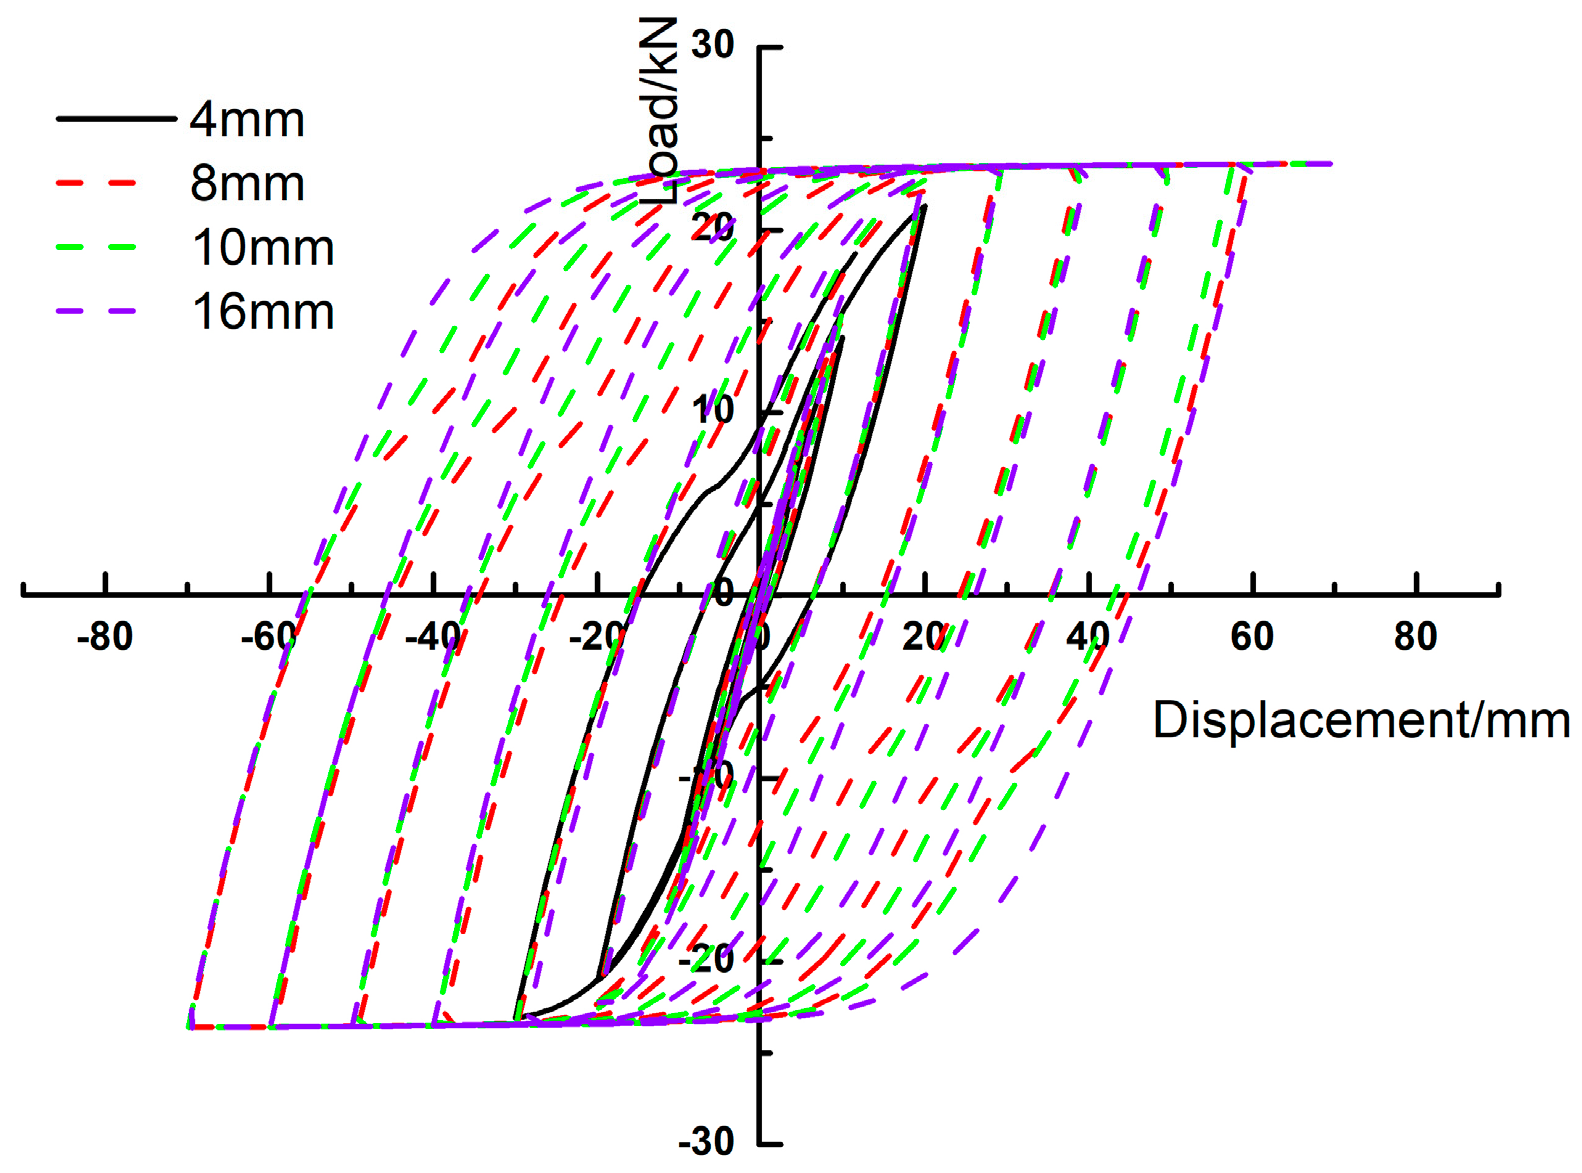
Figure 18 compares hysteresis curves under low-cycle reversed loading. The 4 mm bolt joint exhibits severe “pinching” and rapid degradation, indicating premature bolt loosening or pull-out, leading to early joint failure. For 6 mm and 8 mm bolts, the joints show an initial stiffness drop followed by a partial recovery under large displacements—attributed to the initial bolt damage that reduced their stiffness, while the undamaged bolts continue to provide residual resistance after yielding.
Figure 18.
Comparison of hysteresis curves for all joints with different bolt diameters.
Joints with bolt diameters ≥ 6 mm develop full “fusiform” hysteresis loops, reflecting a robust plastic deformation capacity and effective energy dissipation. However, beyond 10 mm, further increases in diameter yield negligible improvements in loop fullness, suggesting diminishing returns in seismic performance enhancement.
3.3.3. Skeleton Curve Analysis
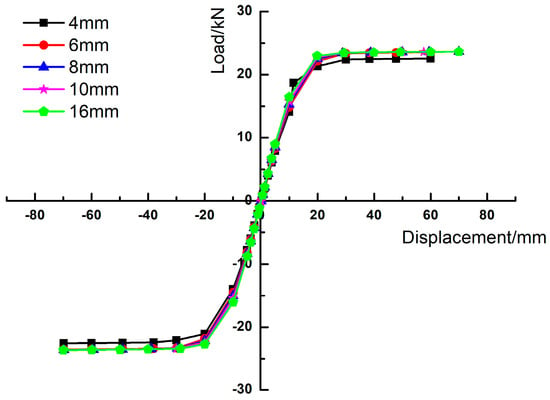
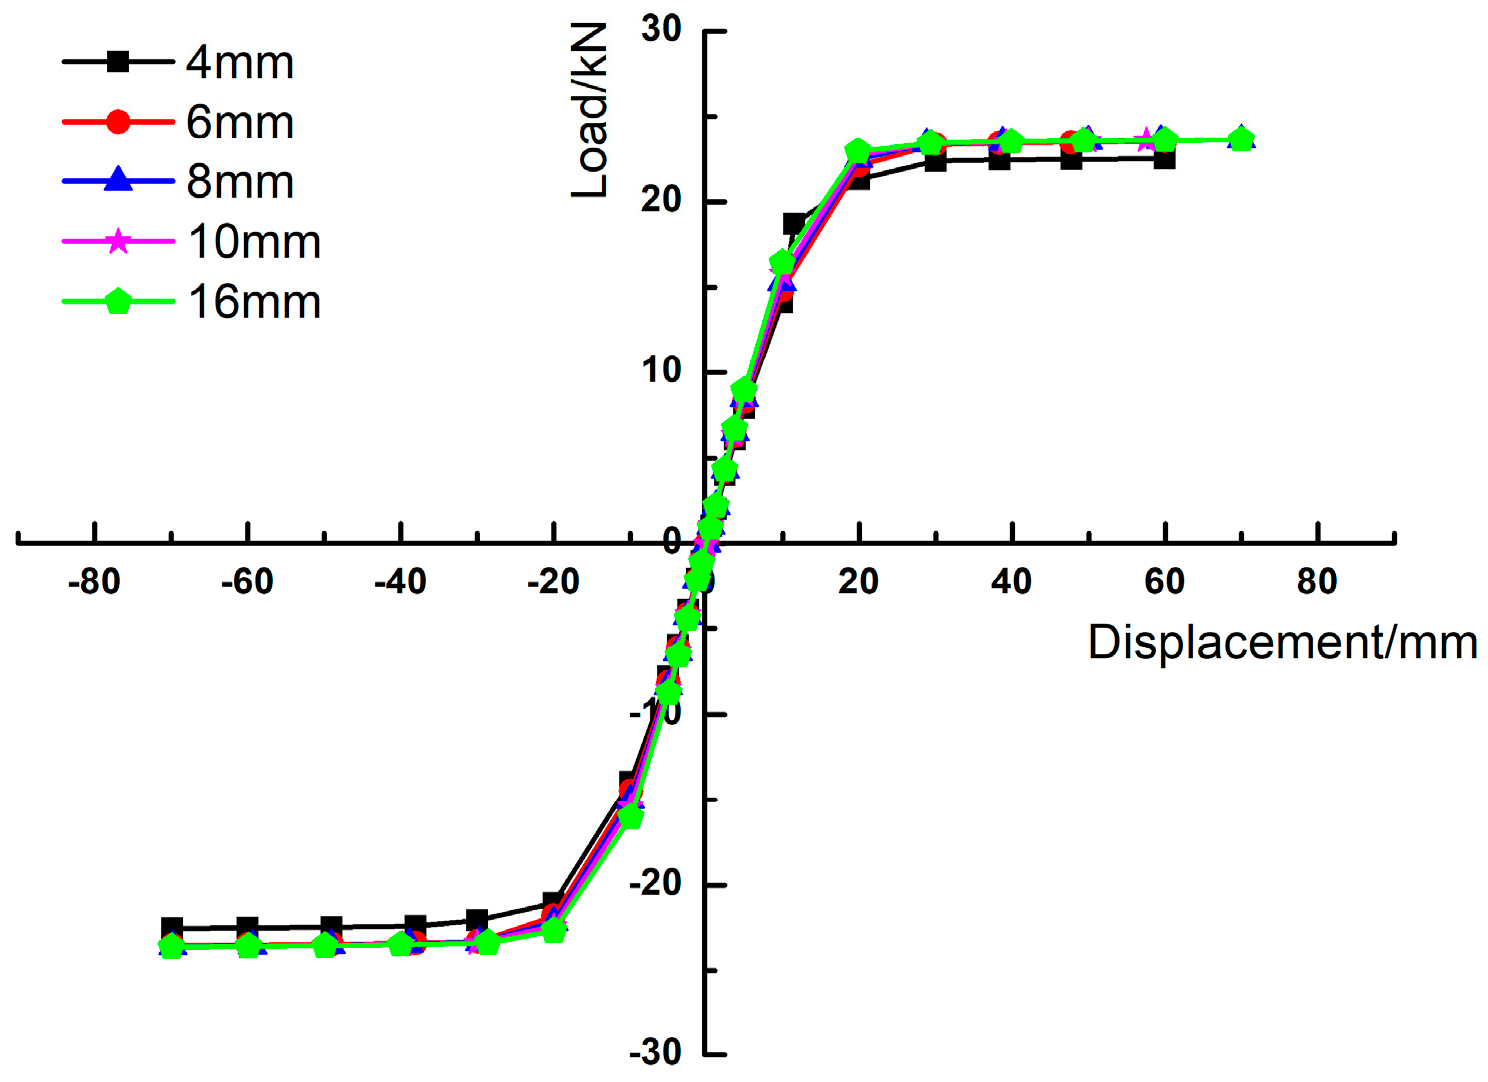
Figure 19 illustrates the skeleton curves for all seven models. All curves follow a consistent four-stage pattern: elastic ascending → elasto-plastic plateau → strain hardening (load increase) → post-peak degradation. The similarity across curves indicates the minimal influence of the bolt diameter on overall load–displacement behavior. Ultimate positive loads range from 20 kN to 23 kN, and negative loads range from −20 kN to −23 kN, forming a nearly antisymmetric response. This suggests low variability due to timber heterogeneity and highlights the dominant role of the sleeve and stiffeners in load bearing.
Figure 19.
Comparison of skeleton curves for all joints with different bolt diameters.
Furthermore, the curves confirm that bolts primarily serve as connectors rather than primary load-bearing elements: even the 4 mm bolt joint exhibits only modest reductions in stiffness and strength during inelastic phases.
3.3.4. Ductility Coefficients
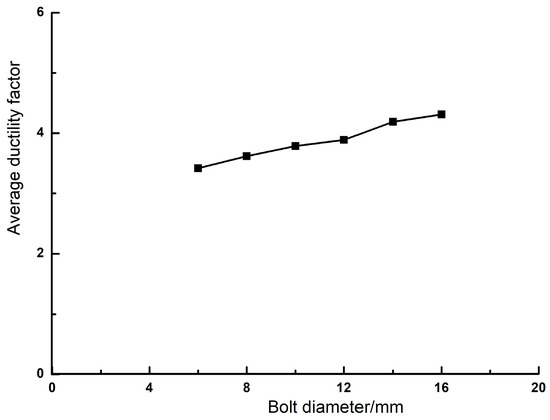
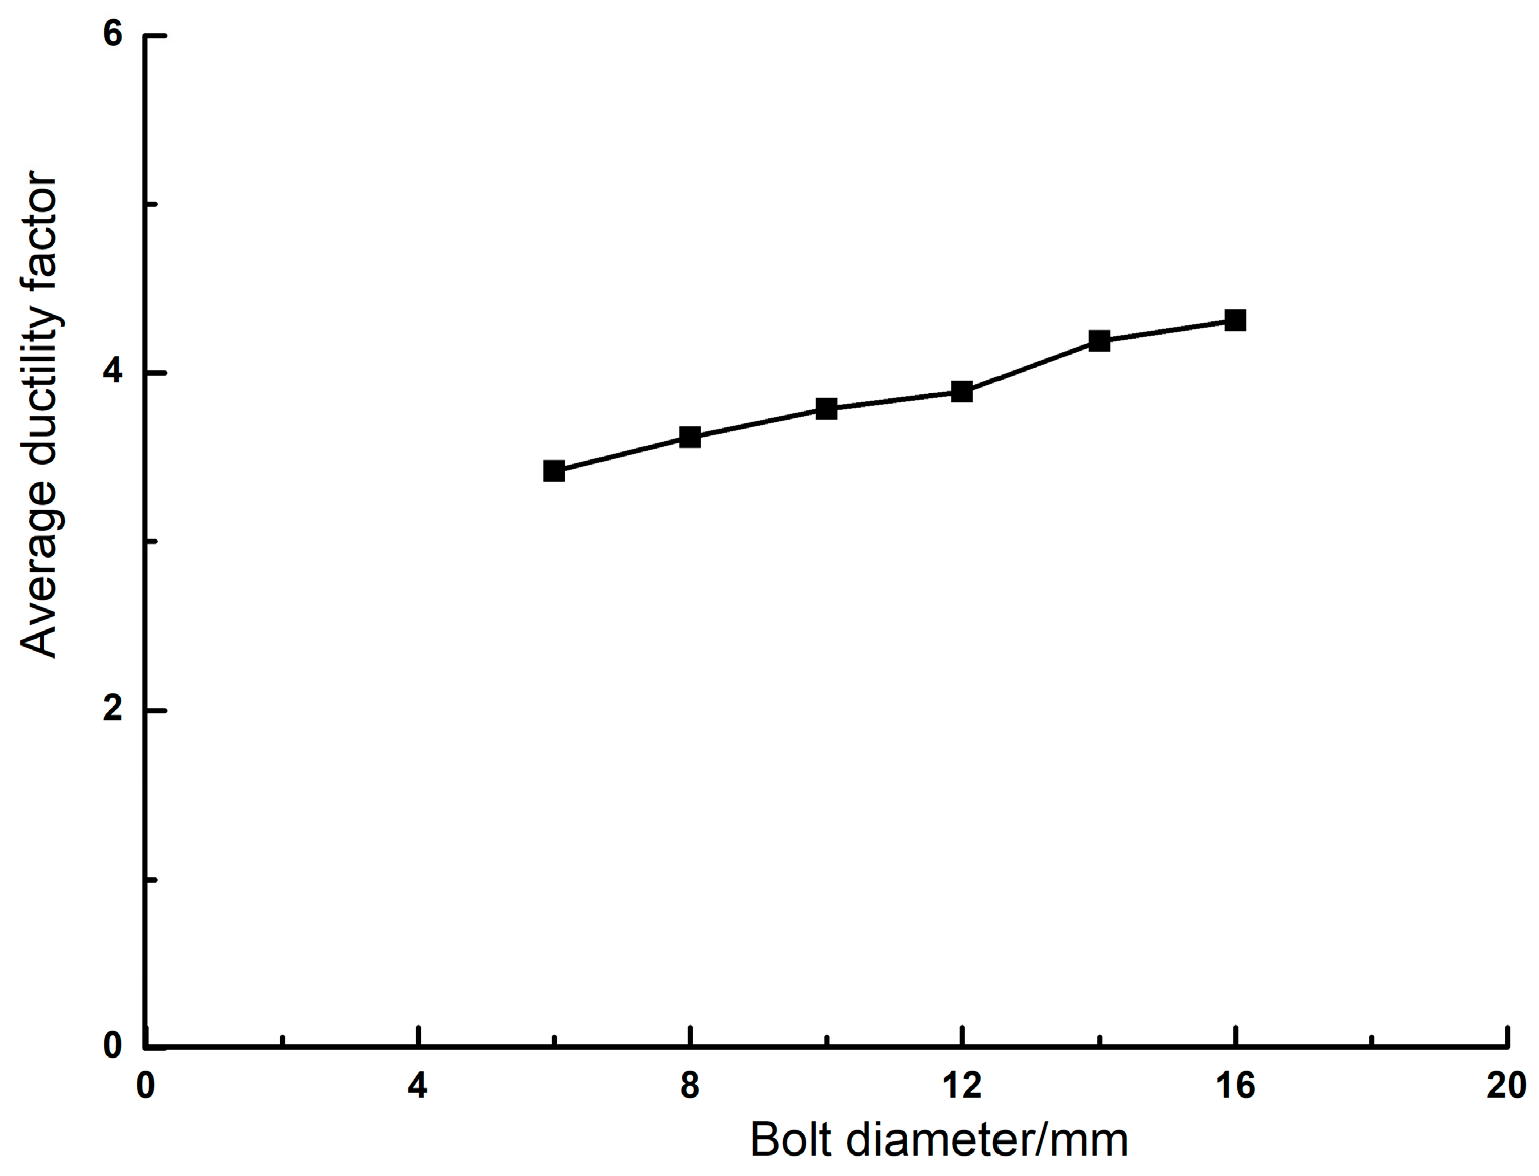
By analyzing skeleton curves and calculating the yield points and ductility coefficients of the integrated sleeve mortise-and-tenon steel–timber composite beam–column joints with seven different bolt diameters (Figure 20), the following trends emerge:
Figure 20.
Comparison of ductility coefficients for all joints with different bolt diameters.
As bolt diameter increases, the ductility coefficient generally rises. For joints with diameters < 12 mm, the average ductility coefficient ranges between three and four, indicating a moderate ratio of elastic to plastic deformation, consistent with design criteria for mortise-and-tenon joints. However, for diameters > 12 mm, the ductility coefficient exceeds four, signifying a higher proportion of plastic deformation that deviates from design requirements.
According to the above analysis, bolts of appropriate diameters serve to prevent extensive damage to the sleeve and timber beam: insufficient diameters result in inadequate stiffness, while excessive diameters induce premature plastic deformation in the timber beam, compromising seismic performance. Therefore, under the current cross-sectional configuration, sleeve thickness, and length conditions, the optimal bolt diameter for such joints should be within the range of 8 mm to 10 mm.
3.4. Parametric Analysis of Stiffener Size
Given the consistent high stress and deformation experienced by stiffeners throughout loading, their role in structural performance warrants further investigation. Building on prior findings, a baseline joint with a 3 mm sleeve thickness, 250 mm sleeve length, and 10 mm bolt diameter was selected for analysis. Four stiffener sizes (l = 20 mm, 40 mm, 45 mm, and 50 mm) were evaluated via finite element analysis, with all other parameters kept constant.
3.4.1. Overall Deformation Patterns
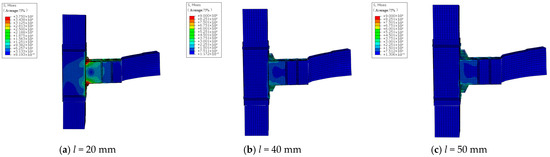
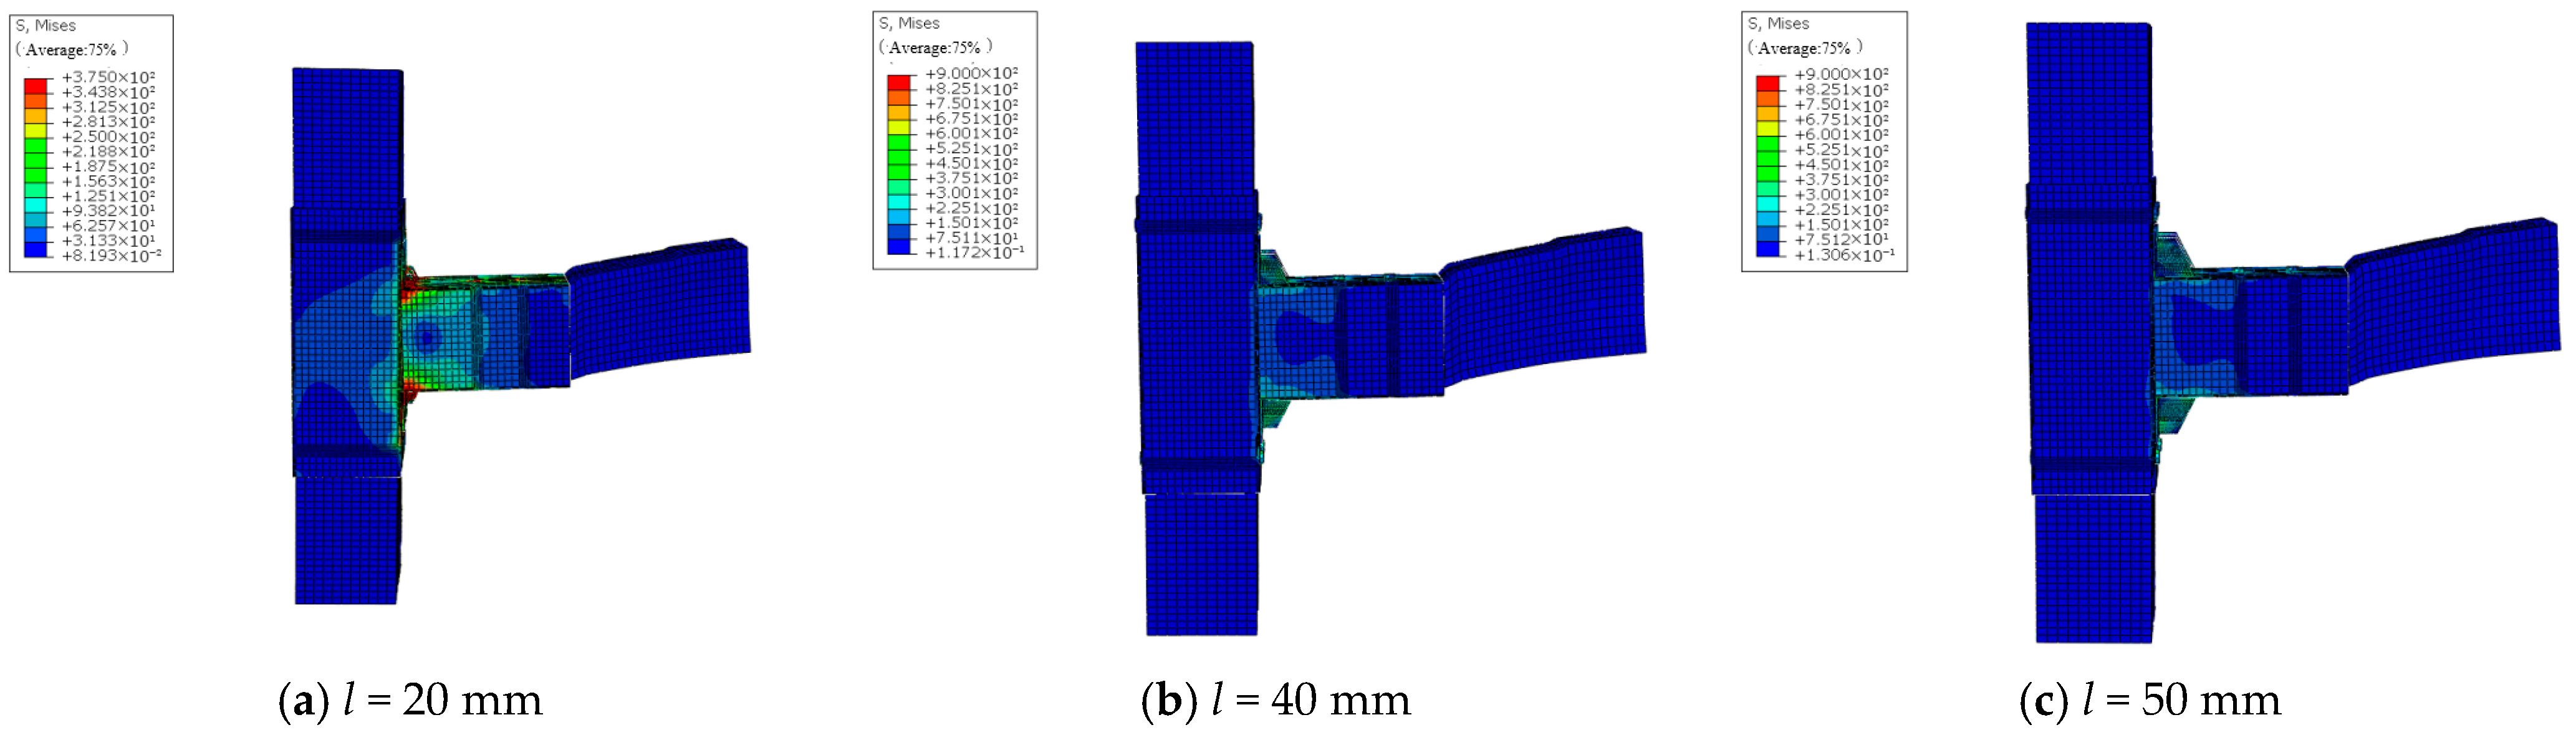
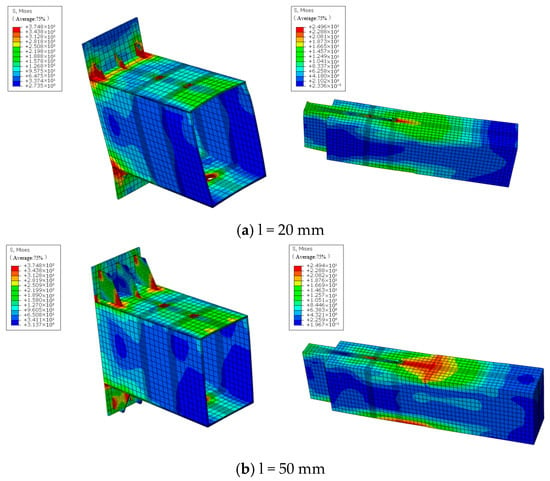
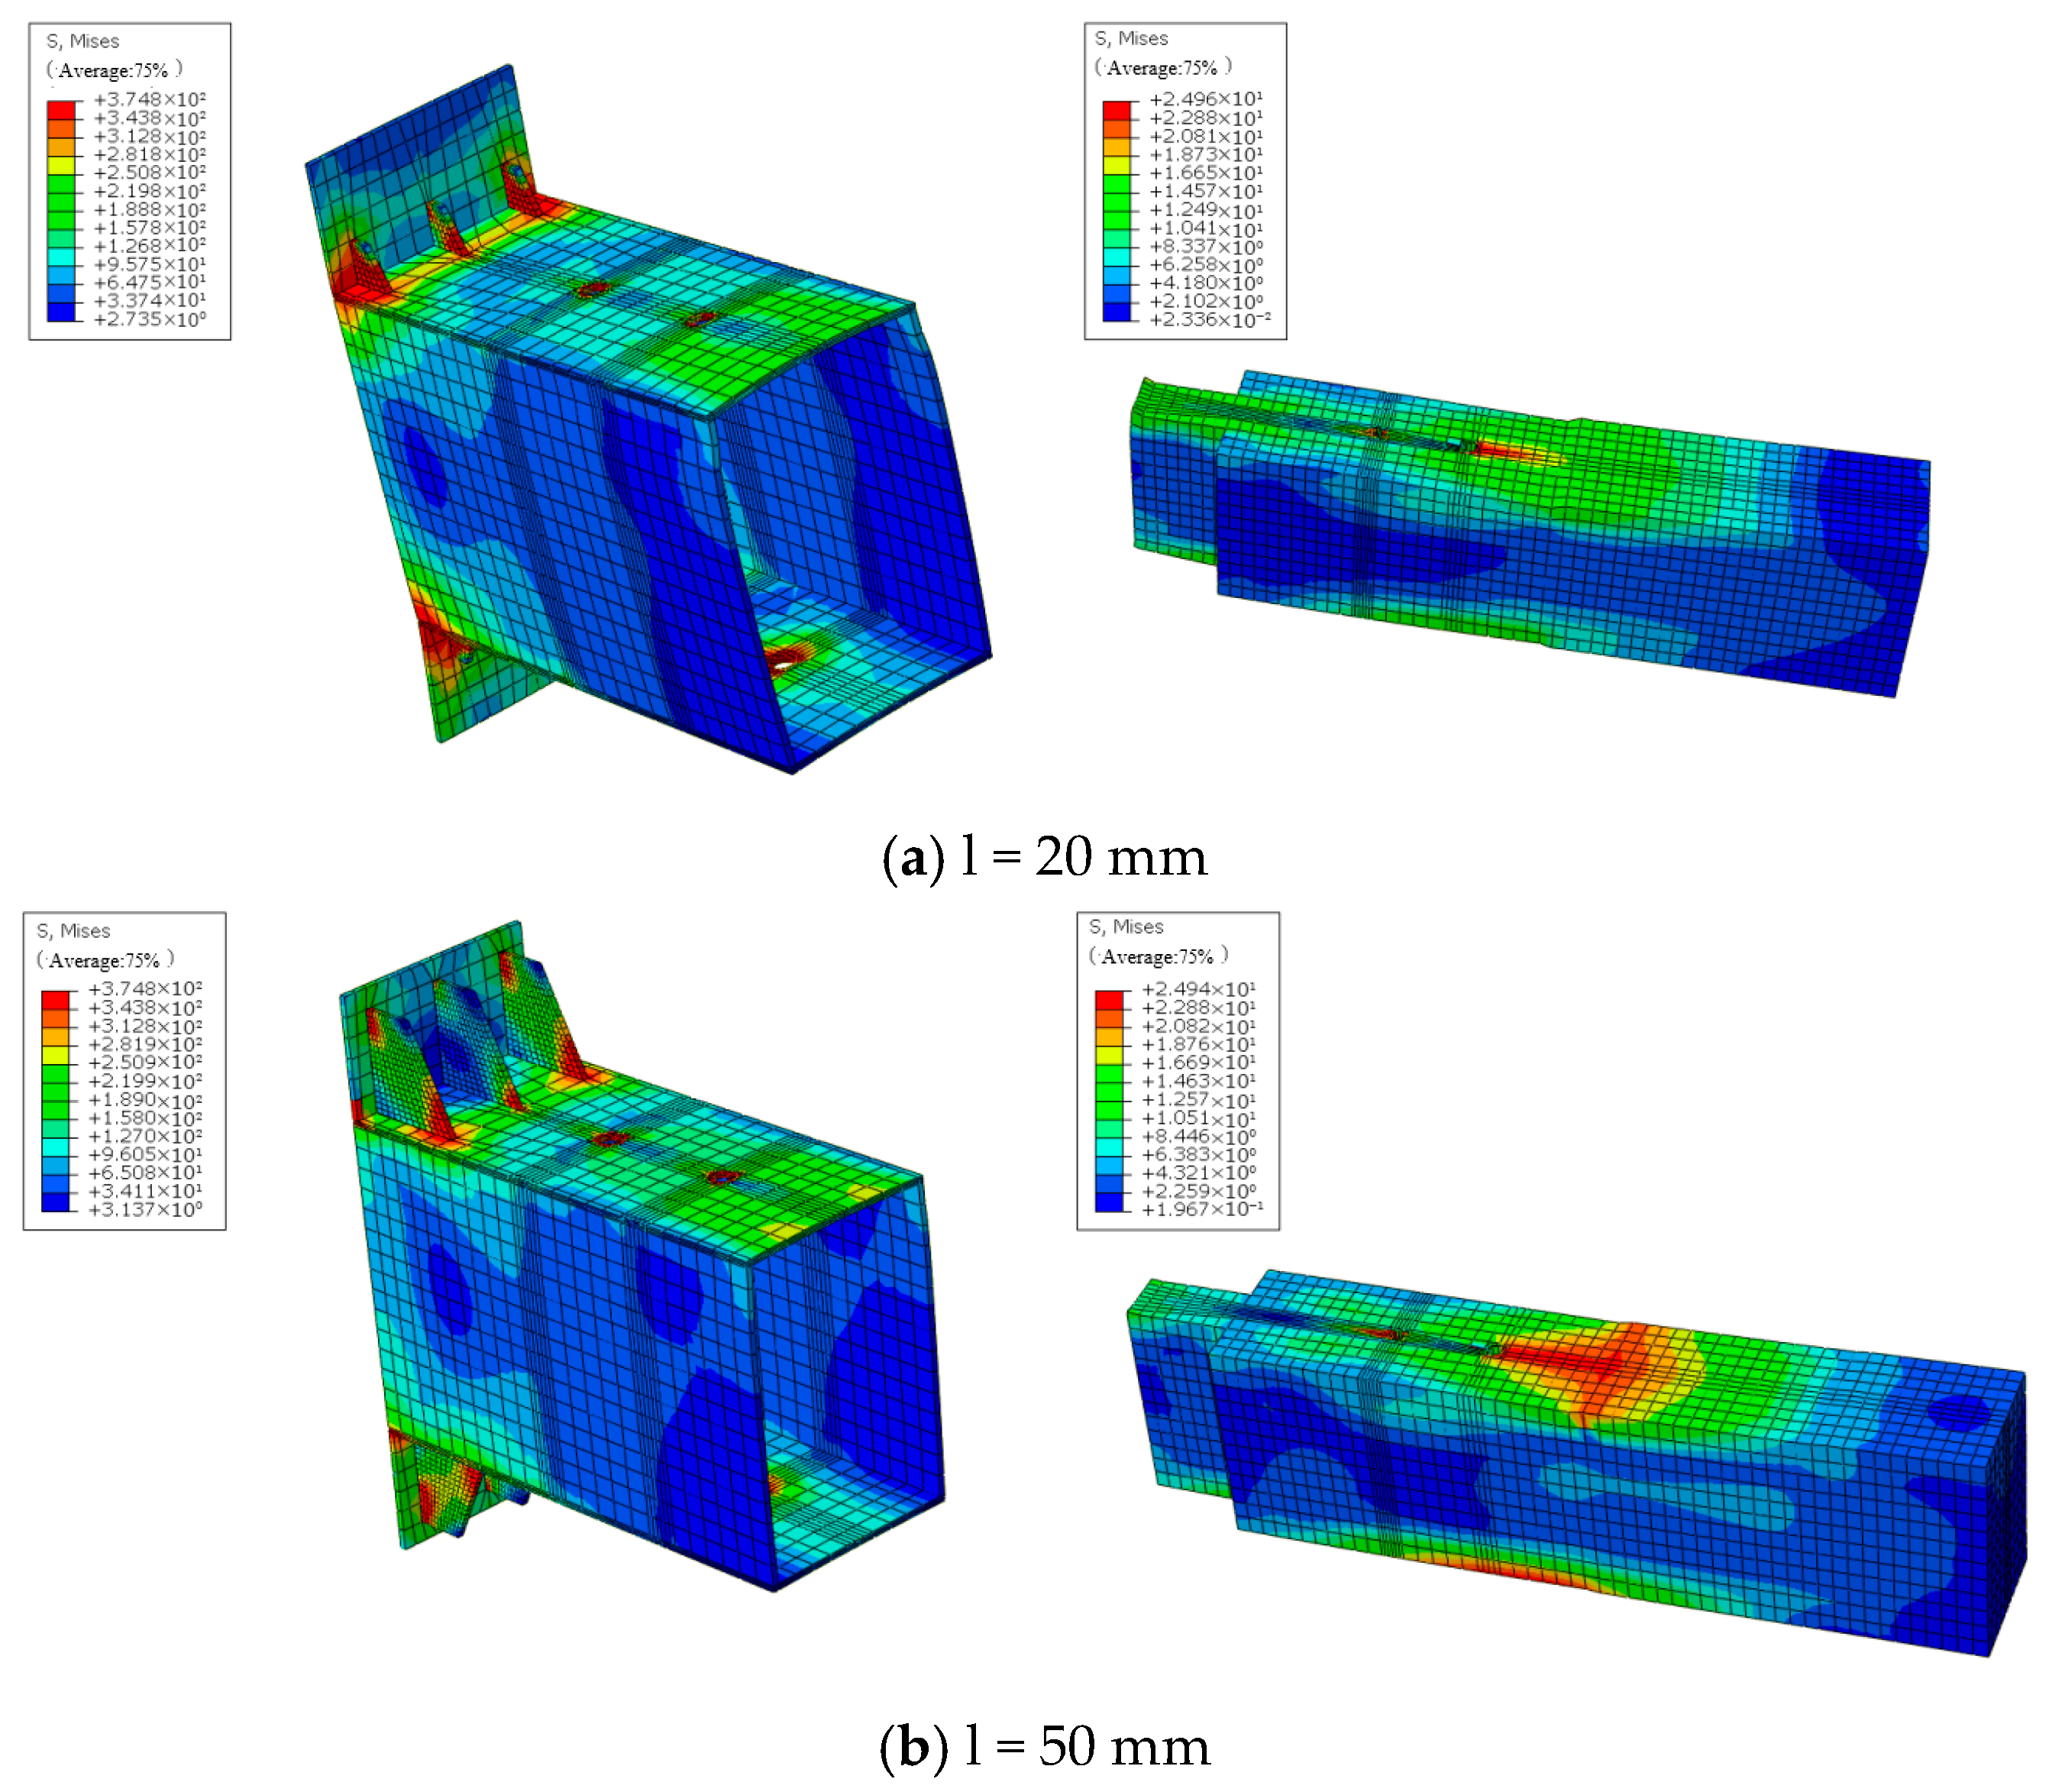
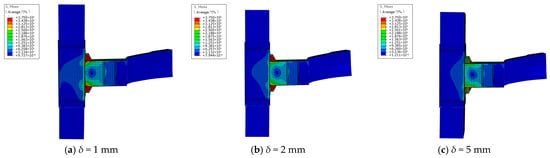
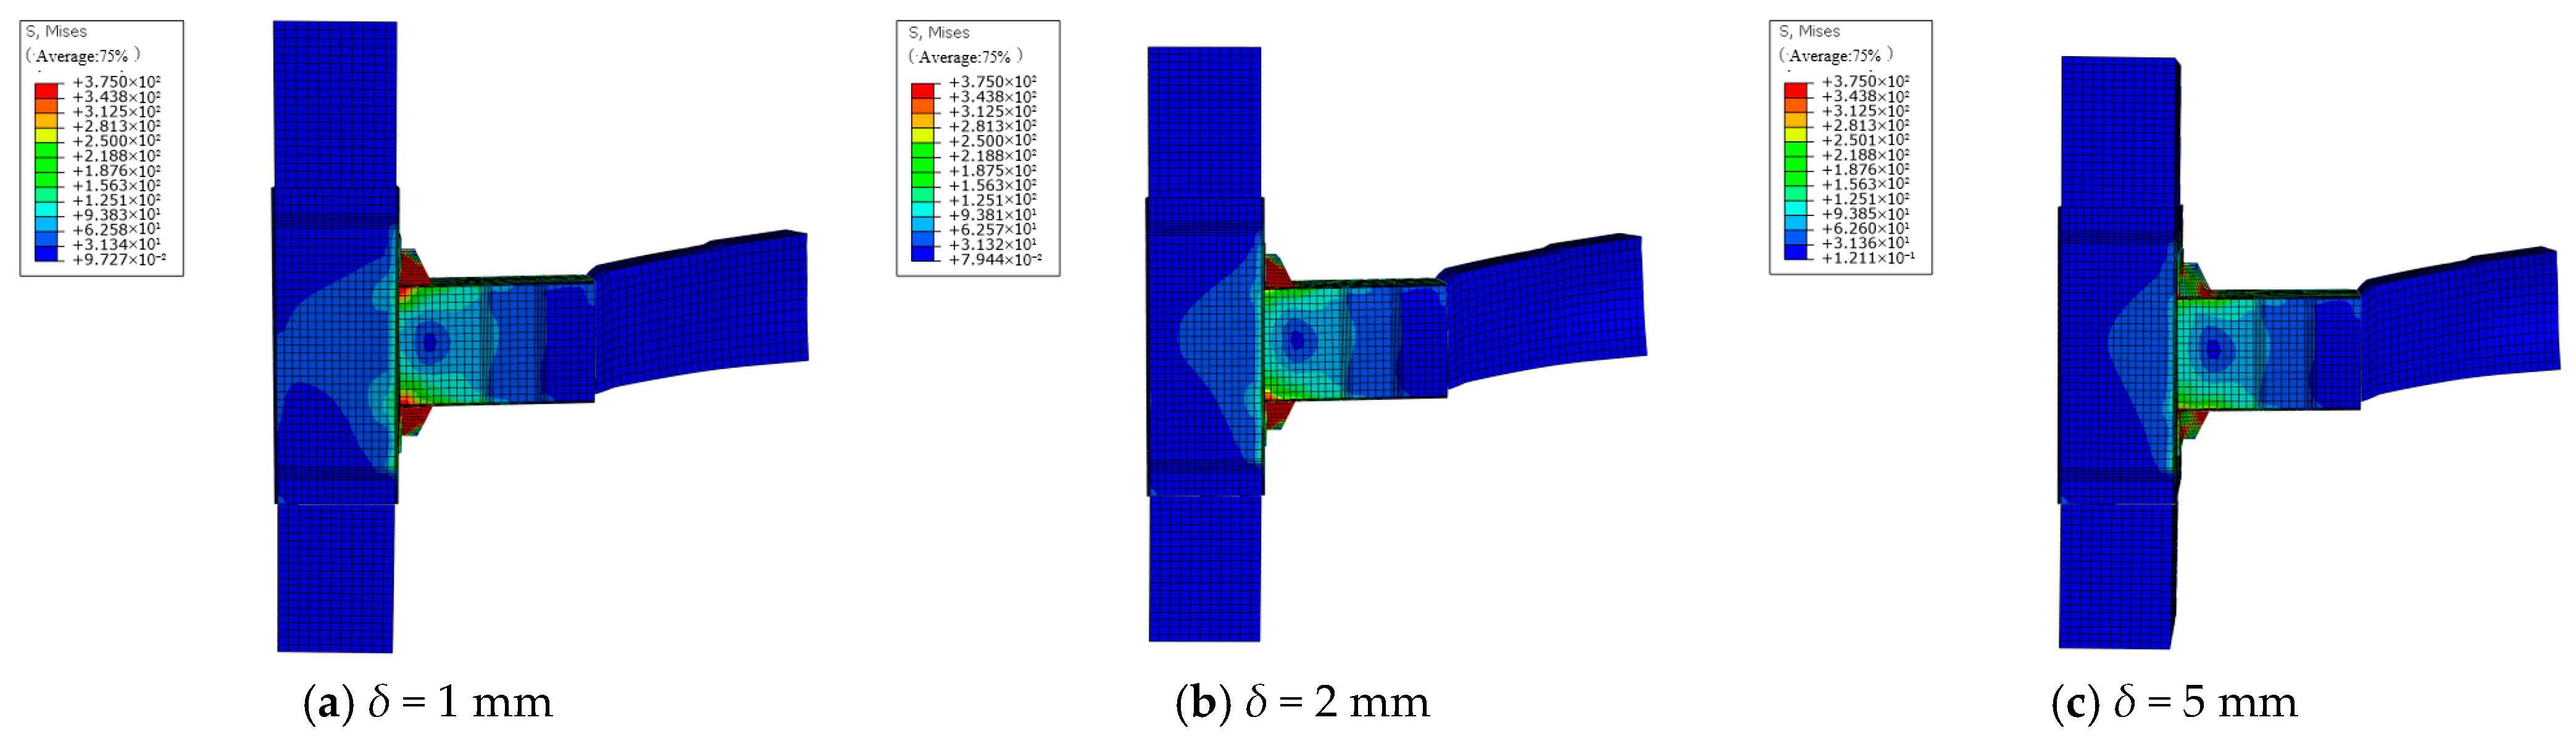
At 70 mm displacement (Figure 21), deformation is localized at the stiffener–sleeve weld zones near the upper and lower flange corners. Stiffeners effectively reduce shear demand on the sleeve, delaying premature failure and enhancing seismic capacity. For joints with 20 mm stiffeners, the limited contact area fails to distribute stress adequately, resulting in a pronounced stress concentration in the sleeve.
Figure 21.
Overall deformation plots of all joints with different stiffener sizes (unit: mm).
3.4.2. Stress Distribution in Sleeve and Timber Beam
Figure 22 presents stress distributions at 20 mm displacement. The 20 mm stiffener joint exhibits peak stresses at the stiffener and its welded corner, indicating stiffness imbalance and potential fracture risk under increasing drift. This imbalance could trigger tenon failure during cyclic loading. As stiffener size increases, the stress concentrations on both the stiffener and sleeve diminish, remaining localized primarily at weld zones.
Figure 22.
Stress contour plots of timber beams and sleeves for all joints with different stiffener sizes (unit: MPa).
For the timber beam, minimal stress is observed with 20 mm stiffeners; however, when the stiffener size exceeds 20 mm, stress concentration emerges at the beam–sleeve interface. This concentration intensifies with larger stiffeners, reflecting amplified stiffness mismatch between steel and wood components.
3.4.3. Load–Displacement Hysteresis Curves
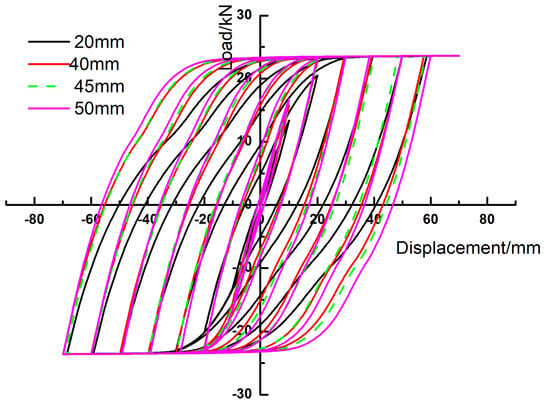
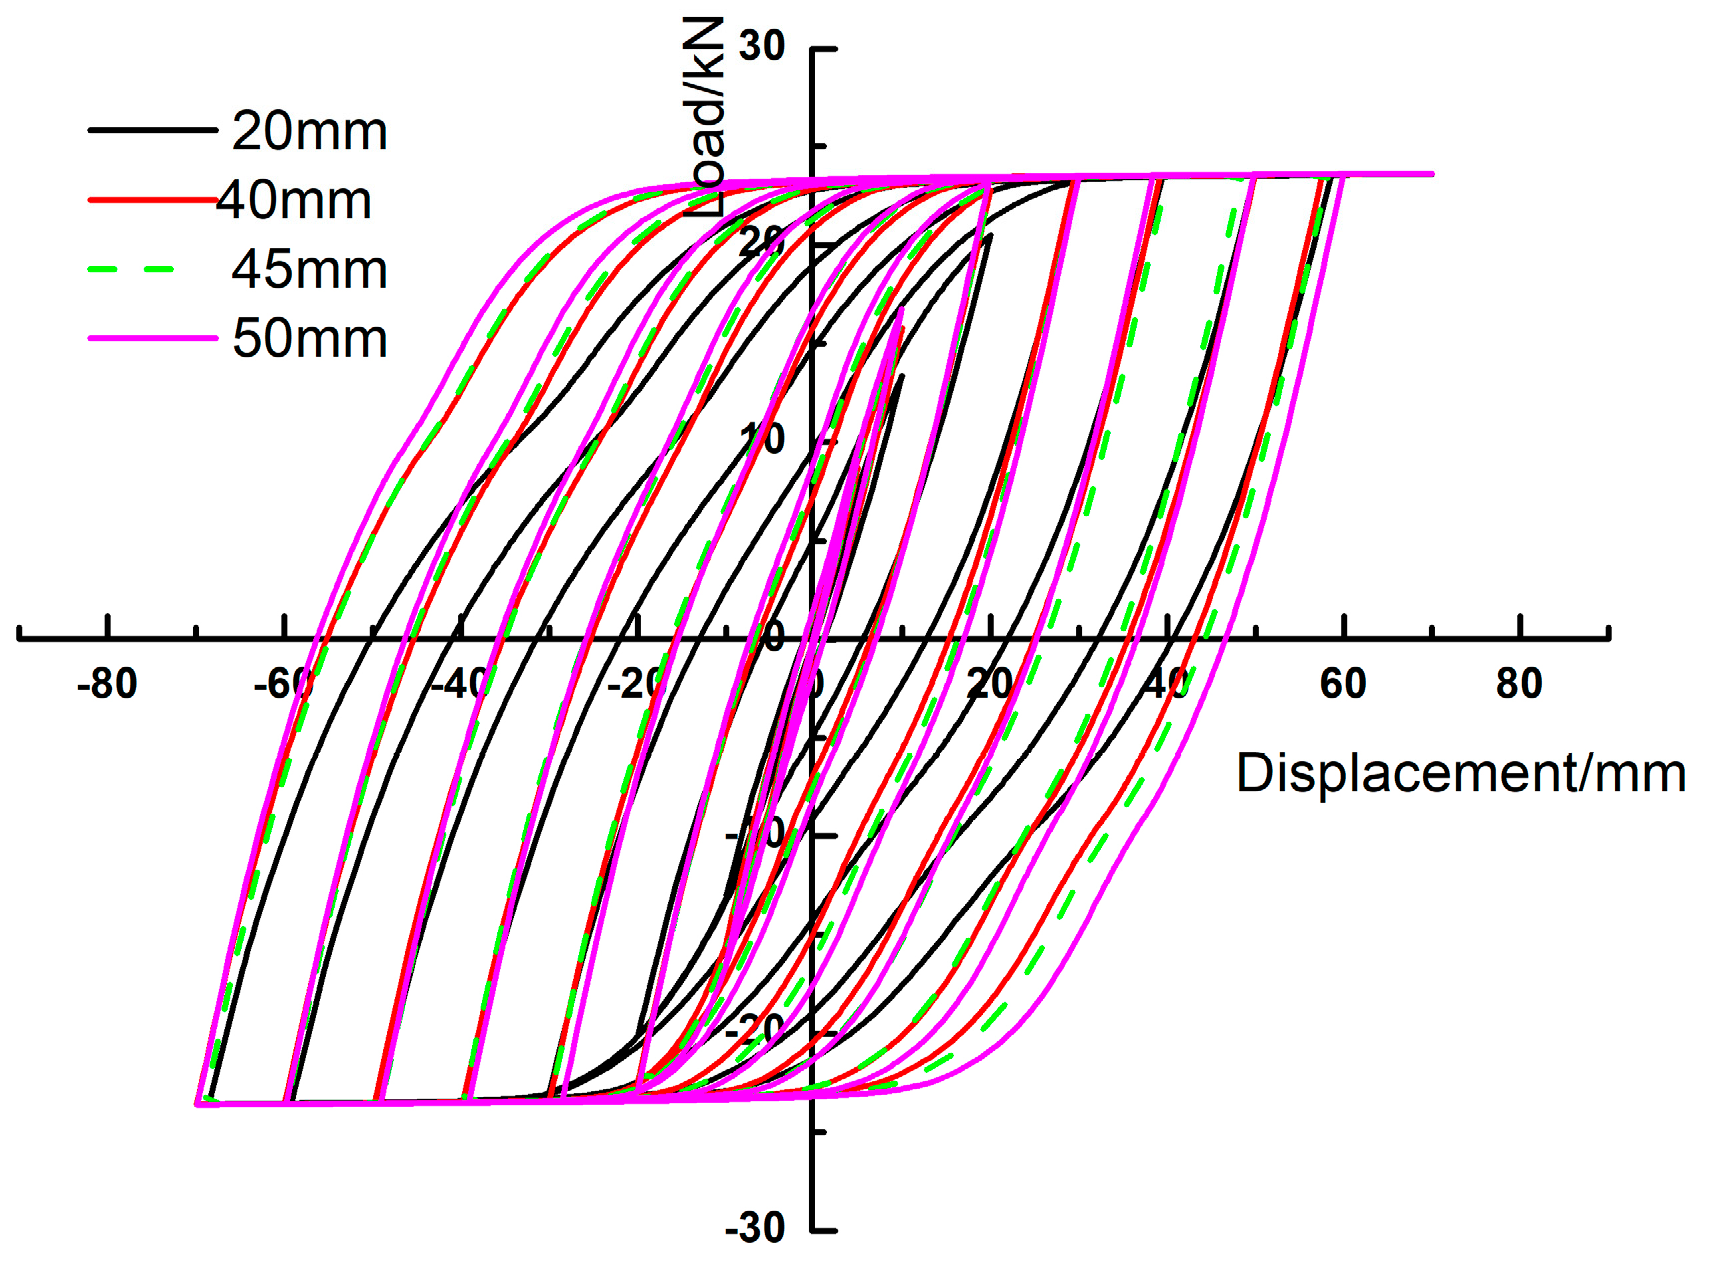
Figure 23 compares the hysteresis curves for all stiffener configurations. Stiffener size has negligible influence on ultimate load capacity, confirming its role as an energy-dissipating rather than load-carrying component. Increasing stiffener size from 20 mm to 40 mm significantly enlarges the hysteresis loop area, indicating improved energy dissipation and seismic performance. Further increases to 45 mm or 50 mm yield marginal gains, with 40 mm identified as the optimal size—beyond which the performance plateaus.
Figure 23.
Comparison of hysteresis curves for all joints with different stiffener sizes.
Additional analyses reveal that stiffener size has minimal effects on skeleton curve shape, ductility, and stiffness degradation. However, it significantly influences flexural stiffness: the initial stiffness rises from 1.47 kN/mm (20 mm) to 1.74 kN/mm (40 mm). While differences narrow in the post-peak phase, the 40 mm stiffener provides superior lateral resistance during elasto-plastic deformation. Ductility coefficients range from μ = 3.42 (20 mm) to μ = 3.79 (40 mm)—all within the desirable 3 ≤ μ ≤ 4 range. Thus, a 40 mm stiffener is recommended for an optimal balance of stiffness, ductility, and energy dissipation.
According to the above analysis, the stiffener dimensions should not be too small, as this would reduce the stiffness at critical regions of the joint and diminish the reinforcing effect of the sleeve. A stiffener size of 40 mm represents a critical threshold: at this dimension, the joint exhibits excellent mechanical performance, and further increases beyond 40 mm yield only marginal improvements. Therefore, a stiffener size of 40 mm is the most appropriate and preferred choice.
3.5. Parametric Analysis of Stiffener Thickness
Building upon the established 40 mm stiffener size from the prior analysis, the effect of stiffener thickness (δ = 1–6 mm) was investigated using the same baseline joint configuration (a 3 mm sleeve thickness, 250 mm sleeve length, and 10 mm bolt diameter).
3.5.1. Overall Deformation Patterns
At 70 mm displacement (Figure 24), the failure mode remains consistent across all thicknesses. Deformation is localized at stiffeners, adjacent sleeve weld zones, and beam–sleeve interfaces. Thicker stiffeners effectively reduce local damage, with the most significant improvement observed between δ = 1 mm and δ = 2 mm.
Figure 24.
Overall deformation diagram of each node with different stiffener thicknesses.
3.5.2. Hysteresis Curves
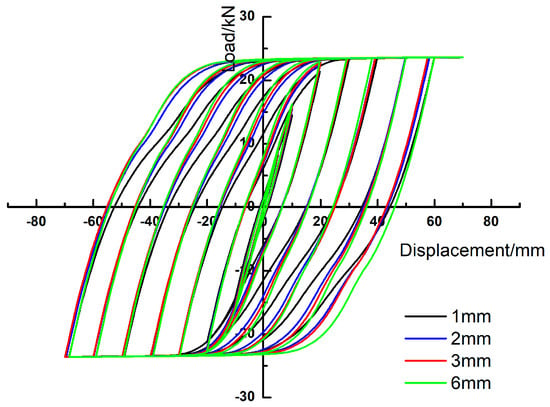
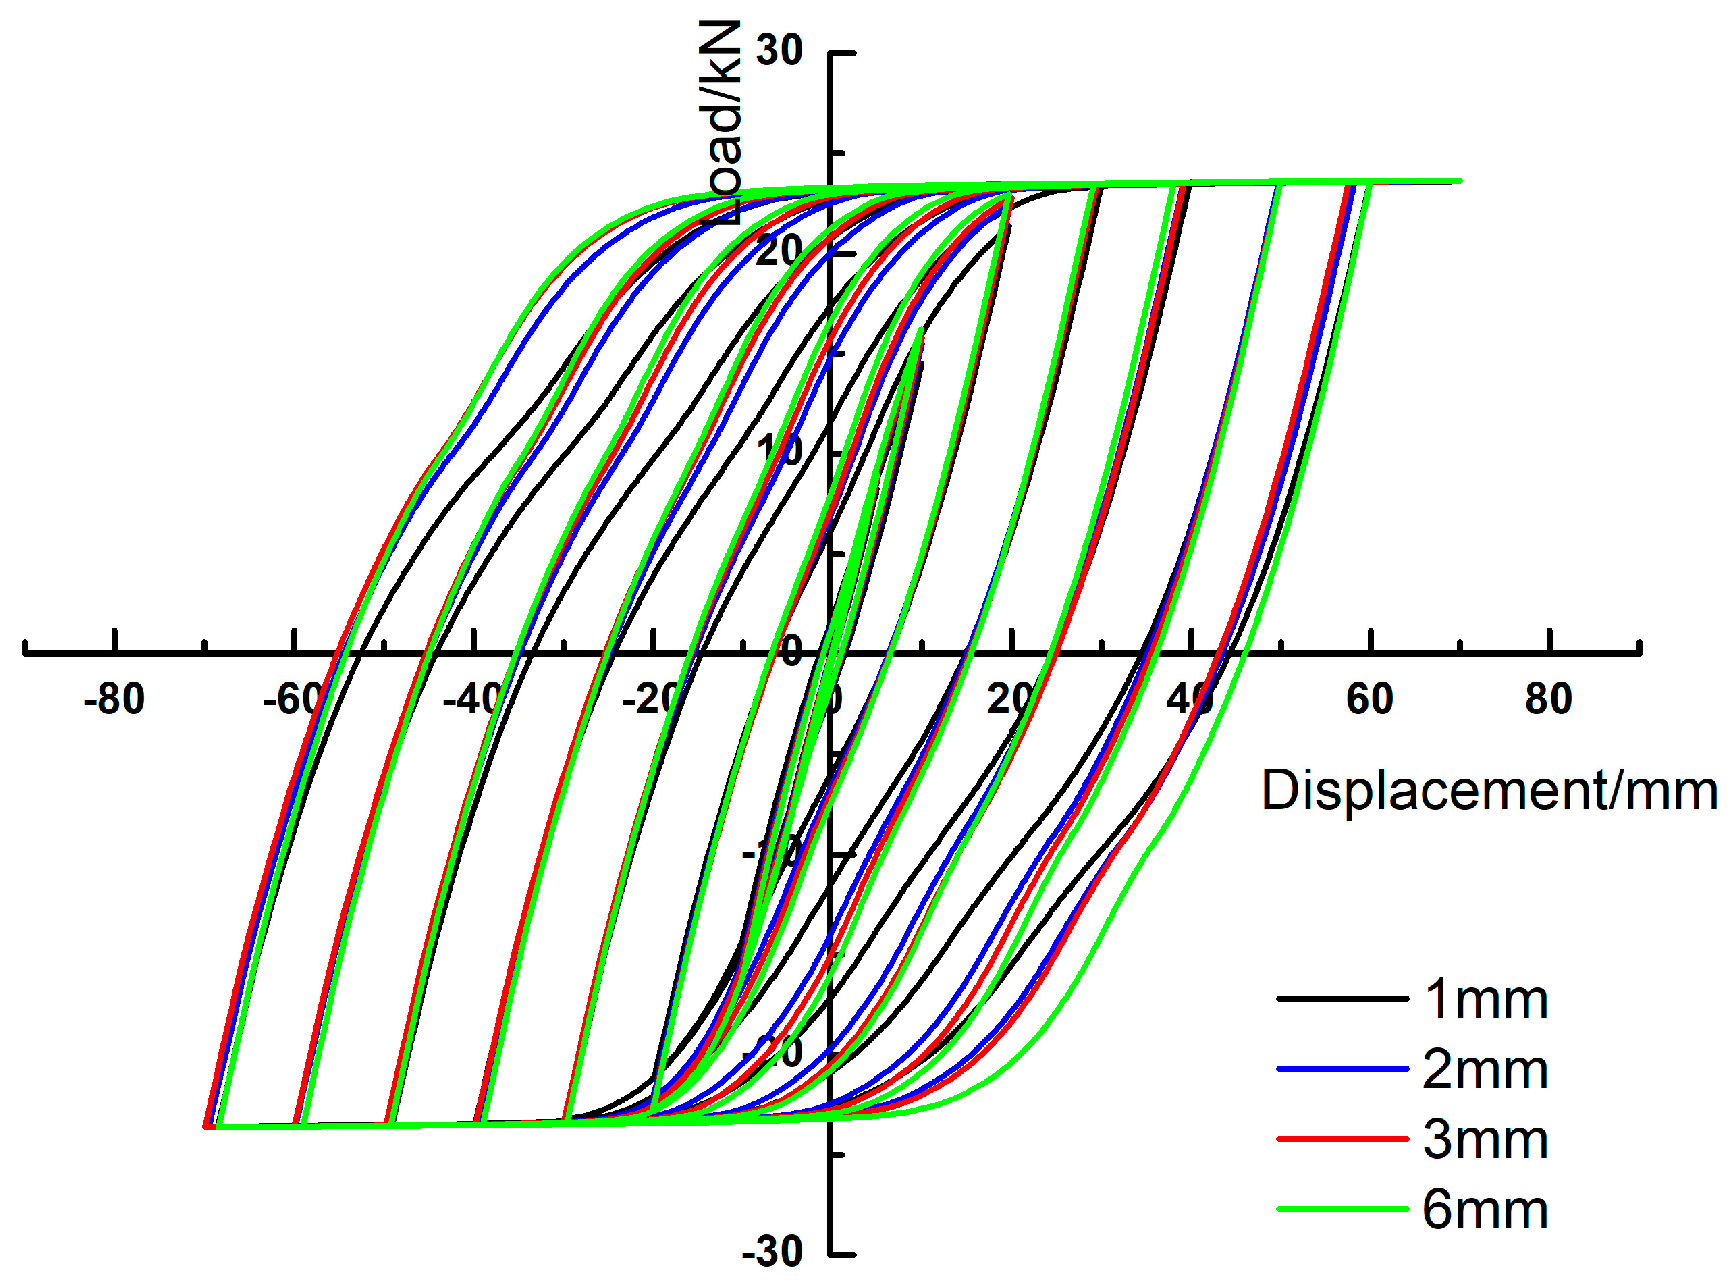
Figure 25 shows that joints with δ = 1–2 mm stiffeners achieve plasticity the earliest and degrade rapidly, exhibiting inconsistent hysteresis loop areas. In contrast, configurations with δ = 2–6 mm produce stable, full loops with minimal degradation. Crucially, stiffener thickness has a negligible influence on ultimate load capacity. Considering both seismic performance and cost efficiency, a δ = 2 mm stiffener thickness is identified as optimal—providing robust hysteresis behavior without excessive material usage.
Figure 25.
Comparison of hysteresis curves for all nodes with different stiffener thicknesses.
3.5.3. Skeleton Curves
Figure 26 illustrates that stiffener thickness minimally alters the overall skeleton curve trend. During elasto-plastic and hardening phases, δ = 1 mm stiffeners exhibit the lowest stiffness, while the δ = 2 mm and δ = 3 mm stiffeners show nearly identical responses. All curves converge in the degradation phase, reaffirming that stiffeners primarily influence connection stiffness rather than global seismic response.
Figure 26.
Comparison of skeleton curves for nodes with different stiffener thicknesses.
Based on the above analysis and the parametric study results regarding stiffener dimensions, the joint with a 40 mm stiffener size and a thickness of 3 mm exhibits a ductility coefficient (μ) of approximately 3.79. It is therefore reasonable to infer that reducing the stiffener thickness to 2 mm would still maintain the ductility coefficient within the range of three to four, which satisfies the structural design requirements. Consequently, a 2 mm thick stiffener is recommended, as it ensures good seismic performance while meeting the design criteria.
4. Conclusions
Based on experimental and finite element analyses, this study investigated the mechanical performance of an integrated sleeve mortise-and-tenon steel–timber composite beam–column joint under low-cycle reversed loading using numerical simulations. Parameters including sleeve length and thickness, bolt diameter, and stiffener size and thickness were systematically optimized. Key findings are summarized as follows:
- (1)
- Moderately increasing the sleeve thickness can enhance the seismic performance of the joint to a certain extent; however, thicker is not always better. When the sleeve becomes excessively thick, its overly high stiffness is mismatched with that of the timber beam, leading to excessive plastic deformation in the wood during loading—a condition indicative of over-strengthening. Conversely, if the sleeve is too thin, it lacks sufficient resistance to bending stresses, resulting in the inadequate rotational stiffness of the joint, which reflects insufficient protection of the component. Therefore, under the current cross-sectional configuration, a sleeve thickness between 2 mm and 3 mm is most appropriate for this type of joint.
- (2)
- An appropriate sleeve length can improve the joint’s seismic performance to some degree, but again, longer is not necessarily better. An excessively long sleeve struggles to resist large bending and shear deformations due to limited inherent stiffness, thus failing to carry additional stress or maintain stability effectively. On the other hand, an overly short sleeve causes the timber beam to bear excessive shear forces prematurely, resulting in significant shear deformation and preventing the sleeve from fulfilling its protective role. Hence, under the current cross-sectional form and sleeve thickness, a sleeve length of approximately 250 mm is optimal for this joint type.
- (3)
- Bolts serve solely as connectors, and an appropriate bolt diameter helps prevent extensive damage to both the sleeve and timber beam within the joint. If the diameter is too small, the bolt may lack sufficient stiffness and sustain significant damage together with the sleeve, compromising seismic performance. Conversely, if the diameter is too large, the substantial stiffness mismatch between the bolt and the bolt hole can induce premature plastic deformation in the timber, adversely affecting seismic behavior. Therefore, under the current cross-sectional configuration, sleeve thickness, and length, a bolt diameter between 8 mm and 10 mm is recommended.
- (4)
- Stiffeners significantly influence the stress distribution and stiffness of the joint, although they have minimal impact on overall load-carrying capacity. However, the stiffener dimensions and thickness should not be too small; otherwise, the stiffness at critical joint regions will be insufficient, greatly diminishing the reinforcing effect of the sleeve. Similarly, excessively large or thick stiffeners create a stiffness mismatch among the stiffener, steel sleeve, and timber beam, which also severely mitigates the sleeve’s strengthening contribution. Thus, a stiffener size of 40 mm is considered optimal.
In summary, for this specific beam–column cross-sectional configuration, the recommended optimal ranges for key reinforcement components are as follows: sleeve length: 200–250 mm, sleeve thickness: 2–3 mm, stiffener size: 40 mm, stiffener thickness: 2 mm, and bolt diameter: 8–10 mm.
Author Contributions
Conceptualization, Z.W. and J.S.; methodology, Z.W. and J.S.; software, J.S. and Z.G.; validation, Z.W. and J.S.; formal analysis, Z.W. and J.S.; investigation, Z.W. and J.S.; resources, Z.W. and J.S.; data curation, Z.W. and J.S.; writing—original draft preparation, Z.G. and Z.W.; writing—review and editing, J.S. and W.Y.; visualization, J.S.; supervision, Z.W.; project administration, Z.W.; funding acquisition, Z.W. All authors have read and agreed to the published version of the manuscript.
Funding
This work was financially supported by The Integrated Construction Project of Disciplines, Majors and Platform Teams during the “14th Five-Year Plan” of Kaili University (YTH-PT202403), the Science and Technology Program of Qiandongnan Prefecture (Grant No. Qiandongnan Kehe Jzi [2023]03), and the National Natural Science Foundation of China (Grant No. 12462010).
Data Availability Statement
The original contributions presented in this study are included in the article. Further inquiries can be directed to the corresponding author.
Conflicts of Interest
The authors declare no conflicts of interest.
References
- Wang, M.; Song, X.; Gu, X.; Zhang, Y.; Luo, L. Research on rotational performance of bolt—Steel filler plate joints of glued laminated timber beams and columns. J. Build. Struct. 2014, 35, 141–150. [Google Scholar]
- Sun, H.; Lu, W.; Zhao, K.; Fan, N. Calculation of flexural bearing capacity of bolted joints of glued laminated timber beams and columns enhanced by self—Tapping screws. Struct. Eng. 2015, 31, 46–50. [Google Scholar]
- Hu, L.E. Research on Mechanical Properties of Bolted Joints with Built—In Steel Plates in Wooden Reticulated Shells. Master’s Thesis, Harbin Institute of Technology, Harbin, China, 2015; pp. 70–71. [Google Scholar]
- Zhou, T.; Guan, Z.W. A new approach to obtain flat nail embedding strength of double—Sided nail plate joints. Constr. Build. Mater. 2011, 25, 598–607. [Google Scholar] [CrossRef] [Scilit]
- Bader, T.K.; Schweigler, M.; Hochreiner, G.; Serrano, E.; Enquist, B.; Dorn, M. Dowel deformations in multi—Dowel LVL—Connections under moment loading. Wood Mater. Sci. Eng. 2015, 10, 216–231. [Google Scholar] [CrossRef] [Scilit]
- Masaeli, M.; Karampour, H.; Gilbert, B.P.; Talebian, N.; Behnia, A. Numerical assessment of the interaction between shear and moment actions in LVL bolted connections. J. Build. Eng. 2022, 55, 104695. [Google Scholar] [CrossRef] [Scilit]
- Wang, Y.; Li, H.; Li, J. Initial Stiffness of Semi-Rigid Beam-To-Column Connections and Structural Internal Force Analysis. Eng. Mech. 2003, 20, 65–69. [Google Scholar]
- Wang, Y.; Liu, X.L.; Lan, T. Experimental Research and Mechanical Behavior Analysis of Semi-Rigid Connections in Steel Structures. In Proceedings of the 2004 Civil Engineering Forum, Adelaide, Australia, 8–10 December 2004; pp. 64–75. [Google Scholar]
- Wang, Y.; Ma, Q.; Yang, S. Mechanical Properties of Beam-Column Connection Joints UsingInner Sleeve Composite Bolts in Fabricated Steel Structure. J. Tianjin Univ. (Sci. Technol.) 2016, 49, 73–79. [Google Scholar]
- Fang, C. Static Performance Research of Steel-Wood Composite Connections. Master’s Thesis, Beijing Jiaotong University, Beijing, China, 2015. [Google Scholar]
- Tong, L.; Chen, Y.; Chen, Y.; Fang, C. Cyclic behaviour of beam-to-column joints with cast steel connectors. J. Constr. Steel Res. 2016, 116, 114–130. [Google Scholar] [CrossRef] [Scilit]
- Keipour, N.; Valipour, H.R.; Bradford, M.A. Steel-timber composite beam-to-column joints: Effect of connections between timber slabs. J. Constr. Steel Res. 2018, 151, 132–145. [Google Scholar] [CrossRef] [Scilit]
- Kaliyanda, A.R.; Rammer, D.R.; Rowlands, R.E. Three-dimensional nonlinear finite-element analysis of wood-steel bolted joints subjected to large deformations. J. Struct. Eng. 2019, 145, 04019108. [Google Scholar] [CrossRef] [Scilit]
- Le, T.D.H.; Tsai, M.T. Behavior of timber-steel composite with dowel connection under fire. Key Eng. Mater. 2019, 803, 195–199. [Google Scholar] [CrossRef] [Scilit]
- Krzywon, R. FRP strengthening of timber structures under the elevated temperature. IOP Conf. Ser. Mater. Sci. Eng. 2019, 471, 052049. [Google Scholar] [CrossRef] [Scilit]
- Dong, W.; Li, M.; Chin-Long, L.; Gregory, M.; Anthony, A. Experimental testing of fill-scale frames with buckling restrained braces. Eng. Struct. 2020, 222. [Google Scholar]
- Lu, W.; Jiang, W.; Zhang, K.; Xu, F.; Liu, X.; Liu, W. Experimental study on seismic performance of mortise-tenon joints with QueTi damper. J. Build. Struct. 2021, 42, 213–221. [Google Scholar]
- Luo, P. Research on Seismic Performance of New Steel-Wood Composite Beam-Column Joints. Master’s Thesis, Central South University of Forestry and Technology, Changsha, China, 2022. [Google Scholar]
- Wang, Z.; Yang, W.; Gao, Z.; Shao, J.; Li, D. Experimental and Numerical Simulation Study on the Mechanical Properties of Integrated Sleeve Mortise and Tenon Steel–Wood Composite Joints. Buildings 2025, 15, 137. [Google Scholar] [CrossRef] [Scilit]
- GB 50005-2003; Code for Design of Timber Structures. Standardization Administration of China: Beijing, China, 2003.
- Wang, Z.; Shi, A.; Wang, T.; Shao, J. Research on the Physical and Mechanical Properties of Chinese Fir in Southeast Guizhou. Fujian Archit. Constr. 2020, 6, 87–91. [Google Scholar]
- Xu, D.; Xue, J.; Qi, L.; Chen, J.; Xu, Y. Research on seismic performance of hook mortise joints of column-and-tie timber structures. J. Build. Struct. 2024, 45, 187–196. [Google Scholar]
- Cao, L. Simulation Study on Seismic Performance of Single- and Double-Span Timber Structures. Master’s Thesis, Taiyuan University of Technology, Taiyuan, China, 2017. [Google Scholar]
- Xue, J.; Liang, X.; Song, D.; Wu, C. Experimental Research and Finite Element Analysis on the Eccentric Compression Performance of Bracket Sets of the Capital. J. Build. Struct. 2022, 43, 199–209. [Google Scholar]
- GB/T 1927.1-2021; Test Methods for Physical and Mechanical Properties of Clear Small-Sized Wood Specimens—Part 1: Collection of Test Materials. Standardization Administration of China: Beijing, China, 2021.
- Wang, T. Research on Mechanical Properties and Fire Resistance of Joints of Ethnic Timber Structures in Southeast Guizhou. Master’s Thesis, Jiangsu University of Science and Technology, Zhenjiang, China, 2021. [Google Scholar]
- Li, Y.; Cheng, X.; An, Y.; Yang, X.; Lu, G.; Liu, J. Experimental and Finite Element Analysis on the Seismic Performance of the Cantilever Section of a New Stepped Joint. 2024. Available online: https://link.cnki.net/urlid/23.1235.T.20240201.1230.002 (accessed on 1 July 2025).
- Gan, S. Experimental Research and Engineering Demonstration on the Seismic Performance of Traditional Timber Structure Mortise-Tenon Joints Strengthened with Viscoelastic Dampers. Master’s Thesis, Kunming University of Science and Technology, Kunming, China, 2023. [Google Scholar]

Disclaimer/Publisher’s Note: The statements, opinions and data contained in all publications are solely those of the individual author(s) and contributor(s) and not of MDPI and/or the editor(s). MDPI and/or the editor(s) disclaim responsibility for any injury to people or property resulting from any ideas, methods, instructions or products referred to in the content. |
© 2026 by the authors. Licensee MDPI, Basel, Switzerland. This article is an open access article distributed under the terms and conditions of the Creative Commons Attribution (CC BY) license.