


Abstract
Cities in India experience distinct seasons, including summer, winter and monsoons. the understanding of thermal comfort within modern houses throughout the different seasons is pivotal for determining a passive design strategy for residences, towards carbon neutrality. Long-term investigations were conducted within five typical houses in the warm–humid climate of Kharagpur, India, spanning three seasons from July 2023 to July 2024. These included air temperature (AT), relative humidity (RH), indoor wind speed and globe temperature for calculating standard effective temperature (SET*). The SET* was used in thermal comfort evaluation, focusing on the cooling effects of elevated wind speeds. The results showed that indoor ATs were well stabilized among the houses, ranging from 27 to 32 °C in monsoon, 20 to 23 °C in winter and 30 to 32 °C in summer on average, due to the effects of high thermal mass structure with relatively small openings. Overall, both the house-wise differences (1–2 °C) and diurnal differences (0.5–3 °C) were much smaller than the seasonal differences. It was found that the resultant indoor operative temperatures (OTs) did not fall within the required comfort levels during the summer and monsoons, whereas those of the winter months met the required standard. The current modern Indian houses of high thermal mass structure prevented flexible adaptations to the dynamic seasonal changes as well as changes within a day. The occupants tended to reduce the SET* by increasing the wind speeds with the assistance of mechanical air circulation, thus reducing the perceived AT by 5 °C in summers. Separate design strategies should be adopted seasonally and in different parts of the day, to maintain a thermally comfortable environment for the occupants.
1. Introduction
Urbanization in developing countries is accelerating rapidly, leading to substantial increase in residential energy demand, particularly for space cooling [1,2]. In many parts of the Global South, the combination of urban heat island effects and global warming intensifies ambient temperatures, driving greater reliance on mechanical systems like air conditioners (ACs) and electric fans [3]. This growing dependence on mechanical cooling contributes significantly to rising energy consumption and carbon emissions, posing major challenges to sustainable development [4]. India, the most populous country in this region, accounts for approximately 17% of the world population [5]. The country spans five major climatic zones: hot–dry, warm–humid, composite, cold and temperate. Each of the climatic zones is characterized by distinct seasonal variations in temperature, humidity and precipitation, significantly impacting the built environment [6]. These diverse climatic conditions pose considerable challenges in achieving thermal comfort within residential buildings throughout the year.
India, having varied climatic zones, has vernacular and traditional houses in each of these zones, which were constructed in response to the specific climate. For example, traditional buildings in a warm–humid climate often used alluvial soil as a building material, which acted as good thermal insulation from the high temperature and humidity [7]. The local materials like bamboo, mud blocks and baked bricks were also used. Protection from solar radiation was provided by overhangs from the roof, window or door shadings. As the humidity remained quite high, proper air circulation was also needed [8]. In the northeastern part of India, the composite climatic zones often had houses with mud architecture, having high thermal mass and very low glazing ratio [9]. The houses were in such an orientation, which made the surface of the building exposed to wind circulation, enhancing heat loss and natural ventilation. They had wooden panels with selective opening features for the occupants, which would allow only diffused solar radiation to enter indoors, while enjoying daylight [10,11]. The rooms had false ceilings, which formed a buffer between the pitched roof and the rooms to create thermal insulation for both summer and winter. Ventilators were also provided at the rooftop for releasing hot air [9]. Trees would block the evening sun on the north-western side of the buildings, which would make certain rooms cooler than others, making them usable by the occupants [12].
However, apart from the region-specific designs and adaptive behavior of the occupants, modern residential construction has largely shifted towards standardized and enclosed designs, often ignoring region-specific climate needs [13,14]. This shift has led to increased discomfort and reliance on energy-intensive cooling solutions [1]. In warm–humid climates such as those found in the Global South, and thus in most of India, achieving thermal comfort is complex due to the simultaneous effects of high air temperature (AT) and relative humidity (RH) [15]. Thermal comfort in residential buildings is a critical factor influencing both occupant well-being and energy use [16,17].
Several studies have been conducted in the Global South, especially in the tropical regions, to determine the thermal conditions of modern residential buildings and the occupants’ response to such situations. Feriadia et al. (2004) concluded that when the occupants in the warm and humid climate of Indonesia had the freedom to modify the environment, they could compensate for the less comfortable thermal environment [18]. Field studies in the residential buildings of Malaysia by Djamila et al. (2013) and Li et al. (2019) revealed that occupants in naturally ventilated residences had a high tolerance level as they had higher behavioral thermoregulatory adjustments than other types of buildings [19,20]. Similar results were obtained from residential buildings in hot–humid climates [21], the building envelope-design optimization of high-rise buildings [22] and air-conditioned dormitories in China [23]. Mori et al. (2020) and Apriliyanthi et al. (2024) noticed that in warm–humid climates, occupants often used fans, opened windows or adjusted clothing insulation to achieve thermal comfort in naturally ventilated or mixed-mode residences [24,25]. The behavioral adjustments include drinking water, changing clothing insulations, changing eating and taking a swim as they preferred much cooler indoor thermal conditions [18,26,27]. As shown in [28], occupants in the tropics tended to prefer higher air movement, and thus used fans in the afternoon and evening, while keeping the windows open.
Shaeri et al. (2018) concluded that wind induced ventilation could have been one of the important adaptations to increase thermal comfort in the residences of Iran, using a design element called ‘Shenashir’ [29]. Residents in the warm–humid region may have higher acceptability towards higher temperature but might have a want for increased air flow via behavioral adjustments like the use of fans, as stated by Zhang et al. (2018) and Tao et al. (2019) [30,31]. Tucka et al. (2019) investigated the indoor thermal conditions of corner terraced houses of Malaysia and stated that a mixed-mode ventilation strategy was better than free running in achieving thermal comfort in a hot–humid climate [32]. Aqilah et al. (2025) and Daghigh et al. (2015) realized that occupants in the warm–humid climate of Malaysia used both ceiling fans and stand fans for enhancing air movement, as a part of adaptive behavior to enhance thermal comfort [33,34]. Air exchange rates and increased wind speeds contributed to the superior level of thermal comfort. Meanwhile, Kubota et al. (2009) found night ventilation to be one of the efficient methods of decreasing peak indoor AT by 2.58 °C in the modern terraced houses of Malaysia, although it might have led to an increase in RH, which in turn might have increased the standard effective temperature (SET*) [35].
Other passive cooling techniques were also analyzed in tropical regions. For example, Perera et al. (2025) analyzed the effects of window overhangs and window side fins with thick/multiple glazing in high-rise residential buildings [36]. Liu et al. (2022) dealt with painting the external facade with light or white colors [37], whereas Chyee et al. (2015) concluded that the integration of some passive cooling features in modern houses like night ventilation, thermal mass, high solar reflectance surfaces and greenery around the house, might have enhanced the thermal comfort of occupants in hot–humid climates [38]. Kitagawa et al. (2021 and 2023) proposed a combination of ventilative cooling and radiant cooling in Indonesia [39,40]. Furthermore, the effects of microclimate were discussed in [41], whereas the thermal function of a courtyard was analyzed in [42].
In India, studies have been conducted in the composite climate of Hyderabad during the hot summers and the monsoons [43]. It was concluded that the occupants used adaptive environmental controls to achieve thermal comfort in modern apartments, like ceiling fans, air coolers and ACs. The behavioral controls were found particularly in summer like sitting in airy spaces and drinking cold water [43]. Malik et al. (2021) concluded that in affordable apartments in the warm–humid climate of Mumbai, occupants showed more tolerance towards extreme temperatures, due to their socio-economic profile [44]. Air velocity controls were the most preferred method for thermal adaptation. Rangasamy et al. stated that the modern construction of houses in the warm–humid climate of Tamil Nadu resulted in the low thermal comfort and high energy consumption of occupants [45]. However, seasonal changes in thermal conditions within the modern urban houses of warm–humid climates have not yet been studied in detail. Understanding the resultant thermal comfort of the occupants is necessary to determine appropriate adaptive behavior in response to the unique seasonal changes.
This study aims to investigate the indoor thermal conditions of modern urban houses in the warm–humid climate of Kharagpur, across the monsoon, summer and winter seasons, focusing especially on the cooling effects of wind speed on indoor thermal comfort, using SET*. By accounting for the interaction between climate, design and adaptive behavior, this study offers passive design recommendations for achieving thermal comfort in modern Indian residences in the warm–humid climate. The results provide a pathway towards more climate-responsive building design, especially in regions where both high humidity and high temperatures coexist for a significant portion of the year.
2. Methodology
2.1. Study Area
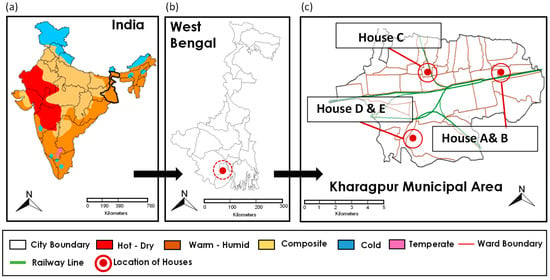
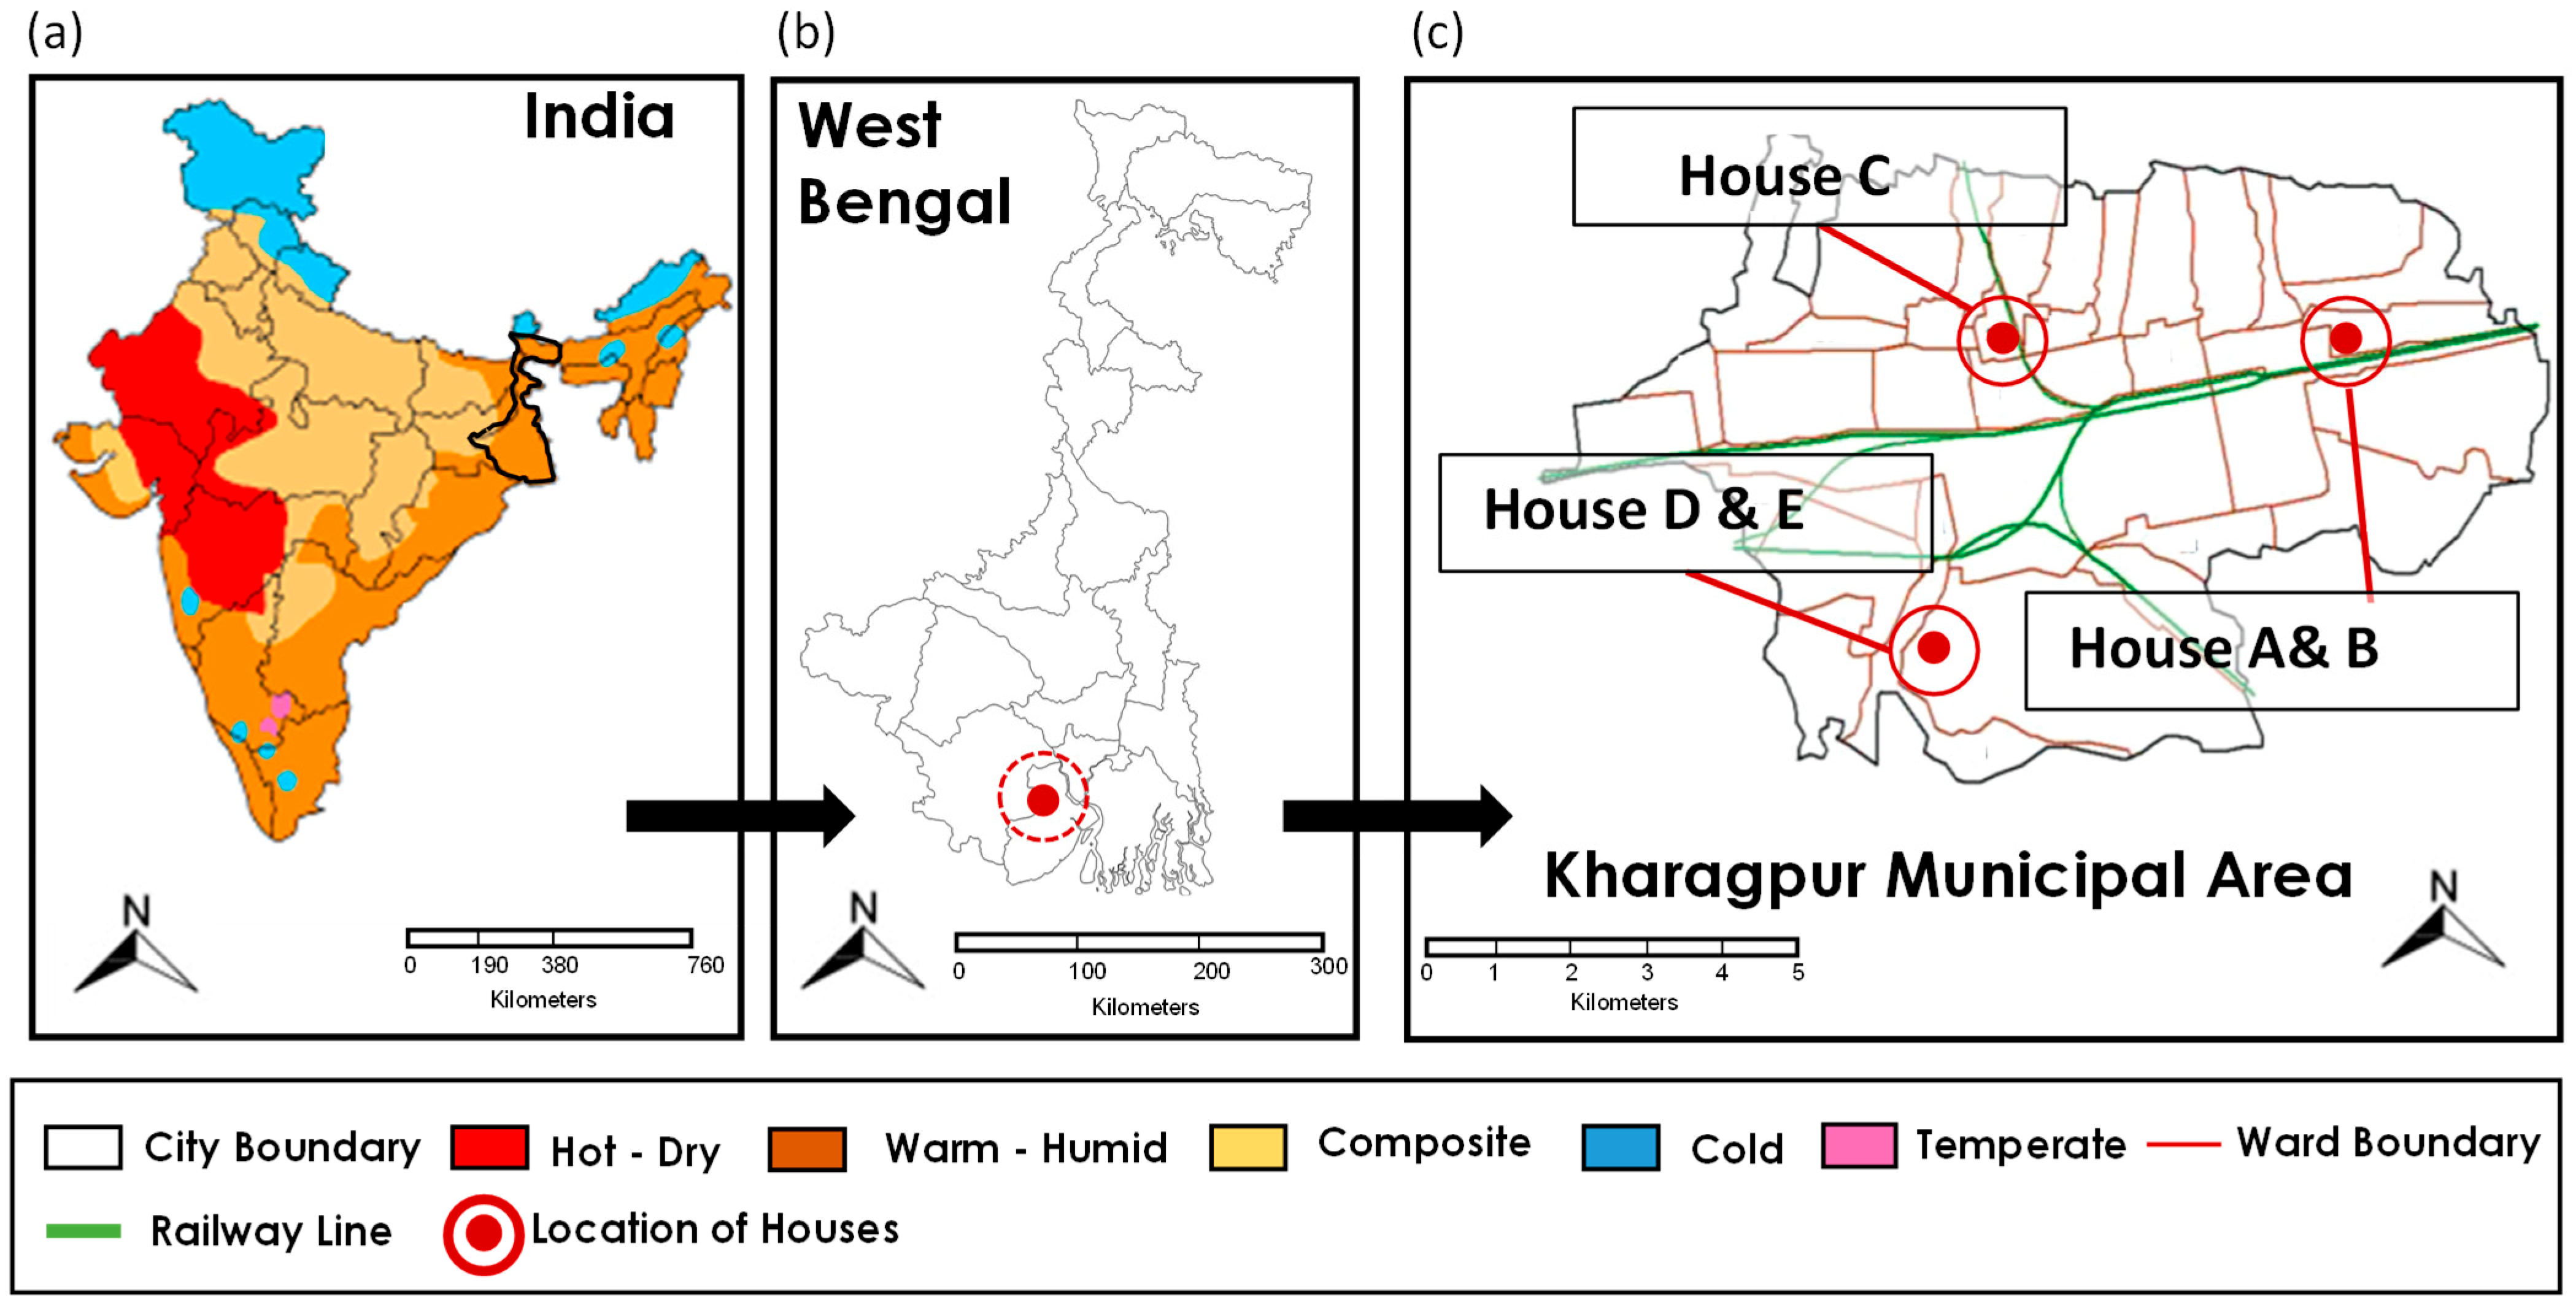
The study was conducted in the eastern part of India, specifically in Kharagpur, West Bengal (Figure 1a,b), which has an average elevation of 39 m, lying close to the Bay of Bengal [46]. The city has a size of 127 km2 with a population of 345 thousand as of 2011 [47]. It has a warm and humid climate based on the National Building Code classification [6]. The region experiences three seasons, including a hot summer with irregular rain (Apr–Jun), a hot and humid monsoon (Jul–Sep) and a mild and comparatively dry winter (Dec–Feb) (Table 1).
Figure 1.
(a) Location of West Bengal in India, (b) location of Kharagpur in West Bengal and (c) location of the case-study houses within Kharagpur.
Table 1.
Annual meteorological data of Kharagpur from 1995 to 2020 (Max °C: Maximum temperature; Min °C: Minimum temperature; Preci: Rainfalls).
2.2. Case-Study Houses
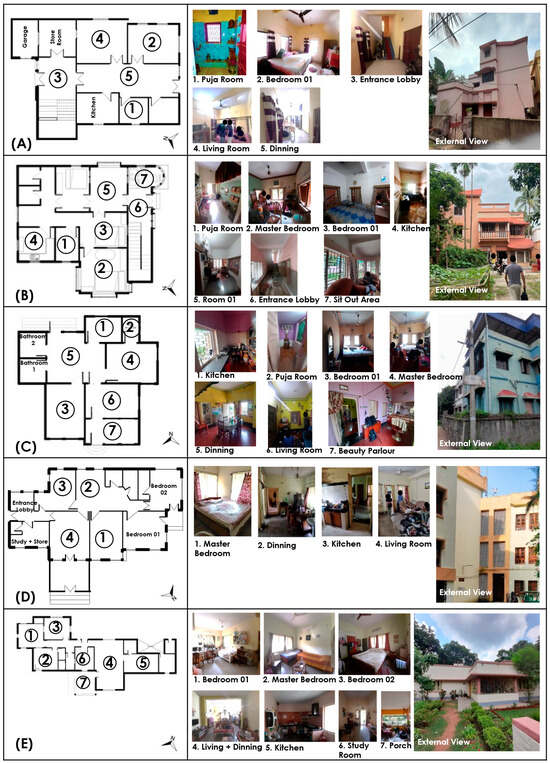
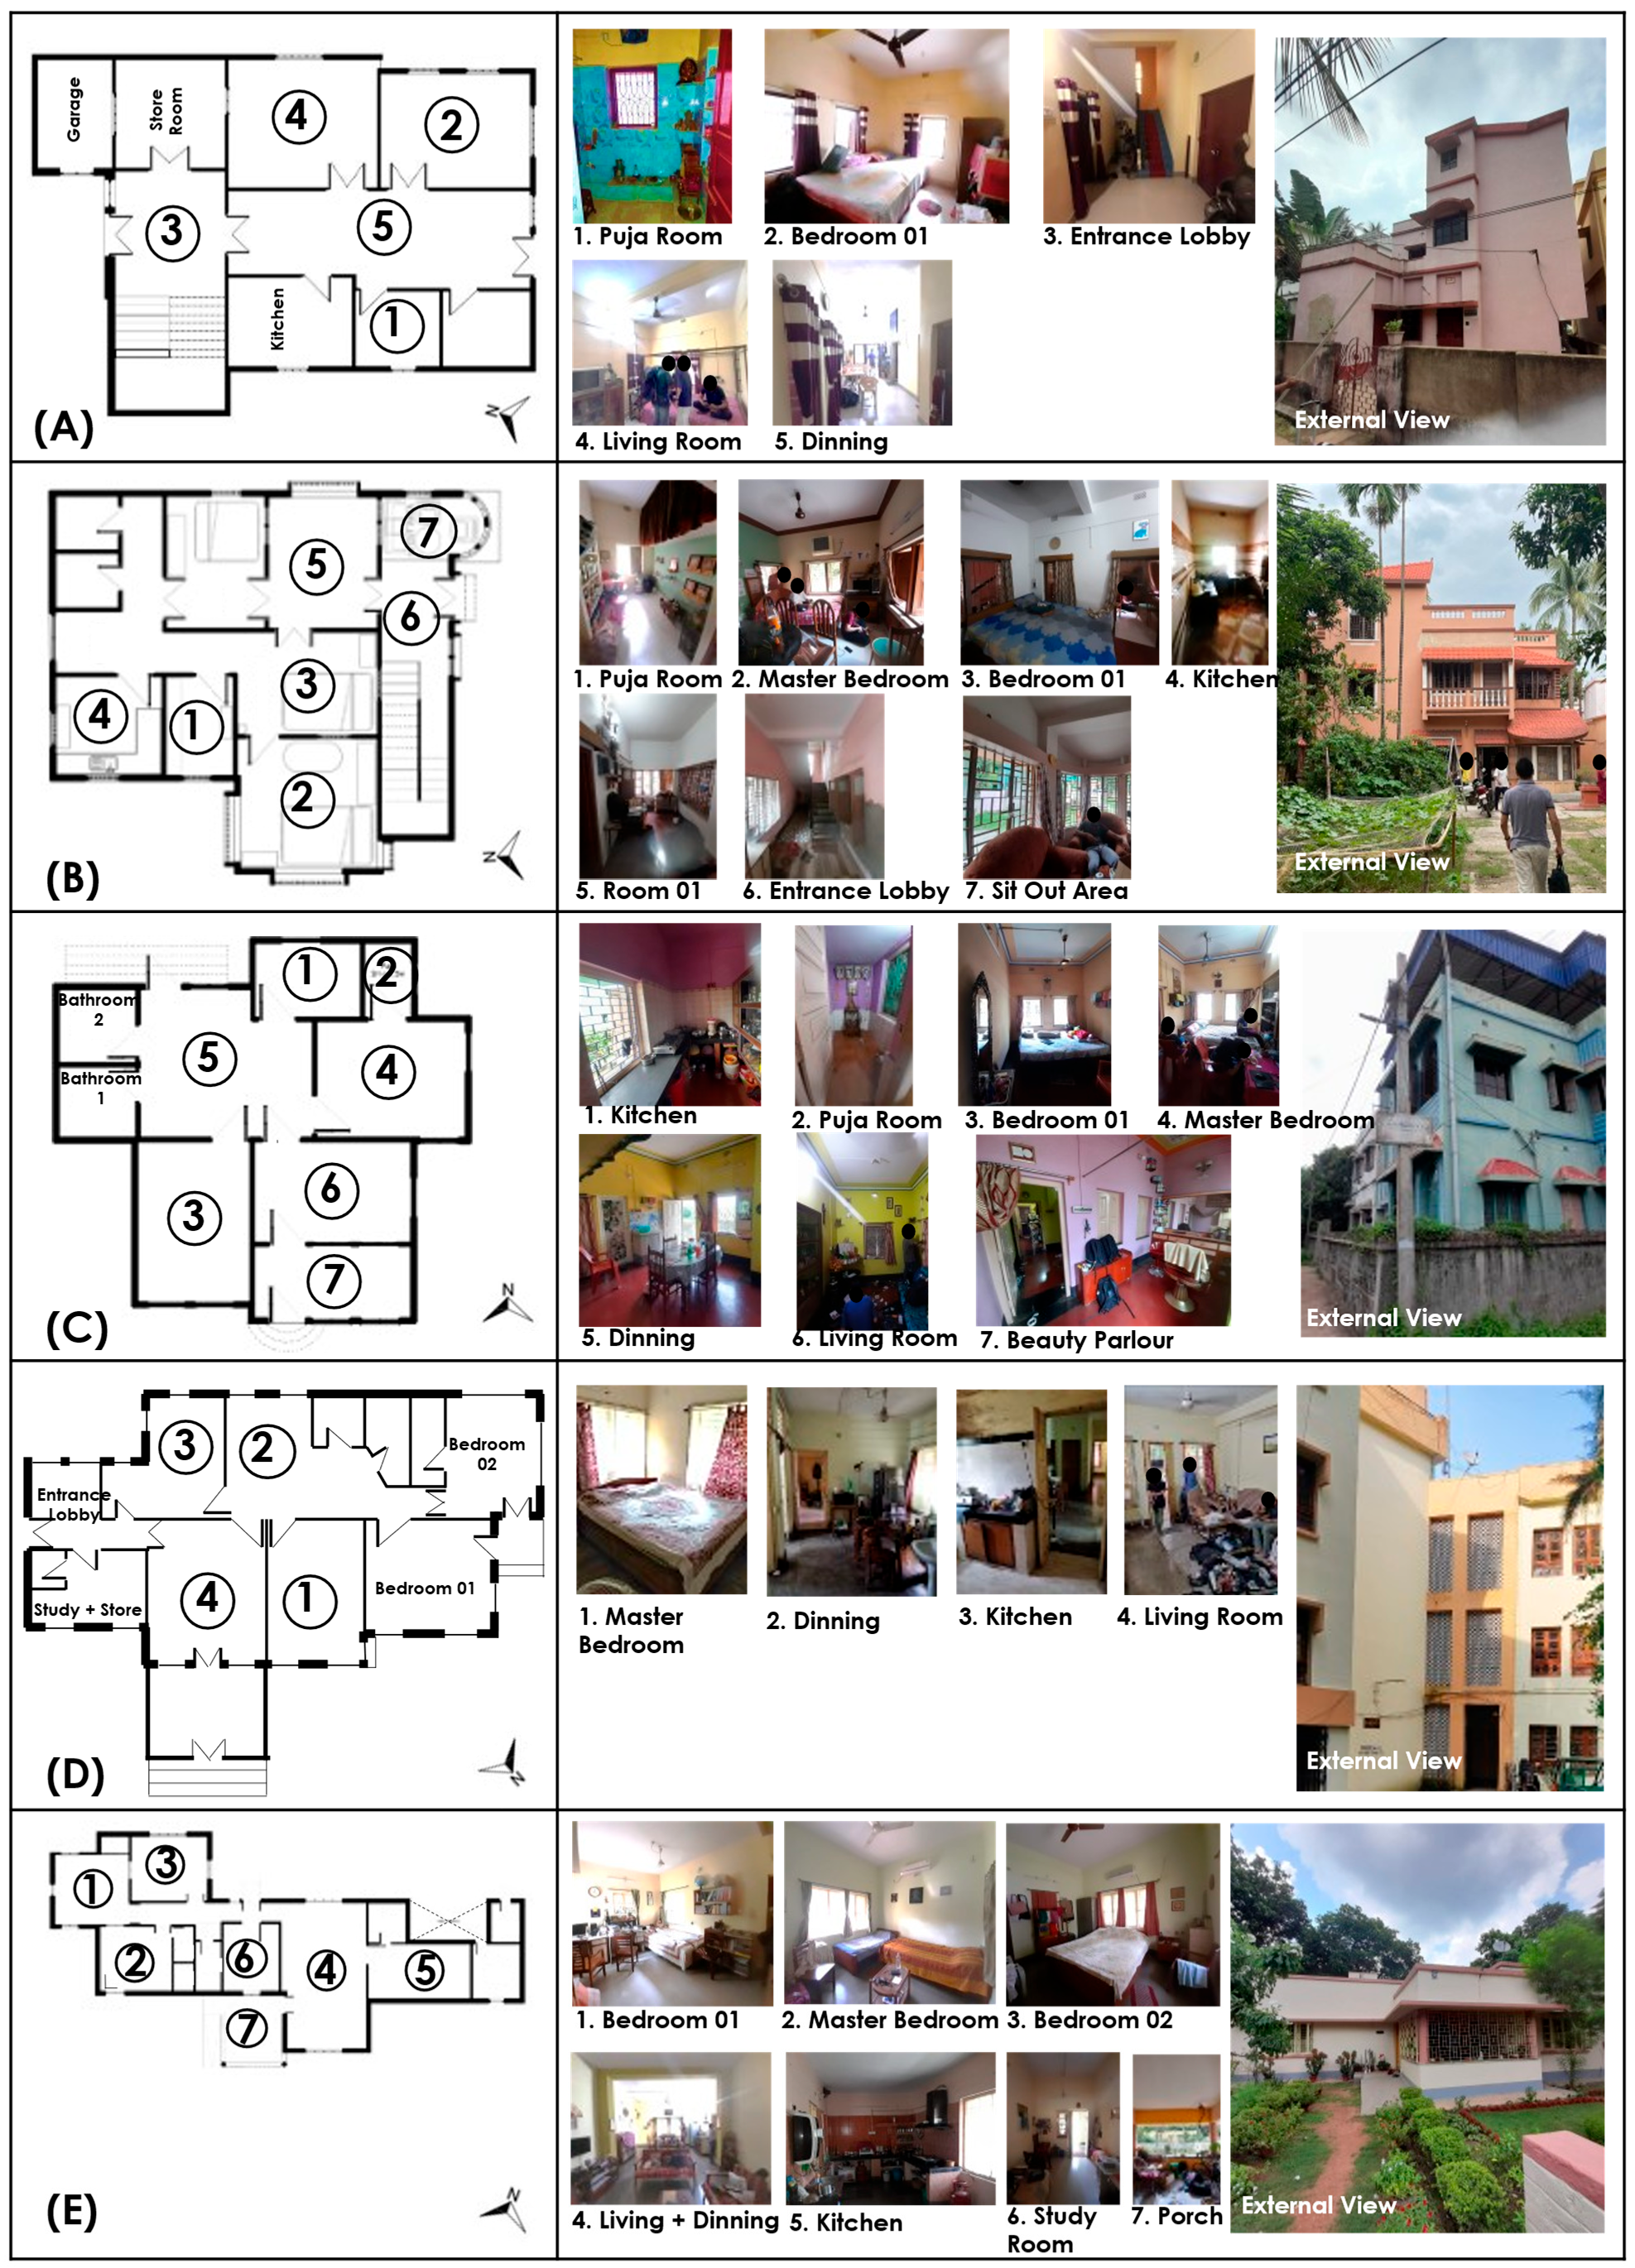
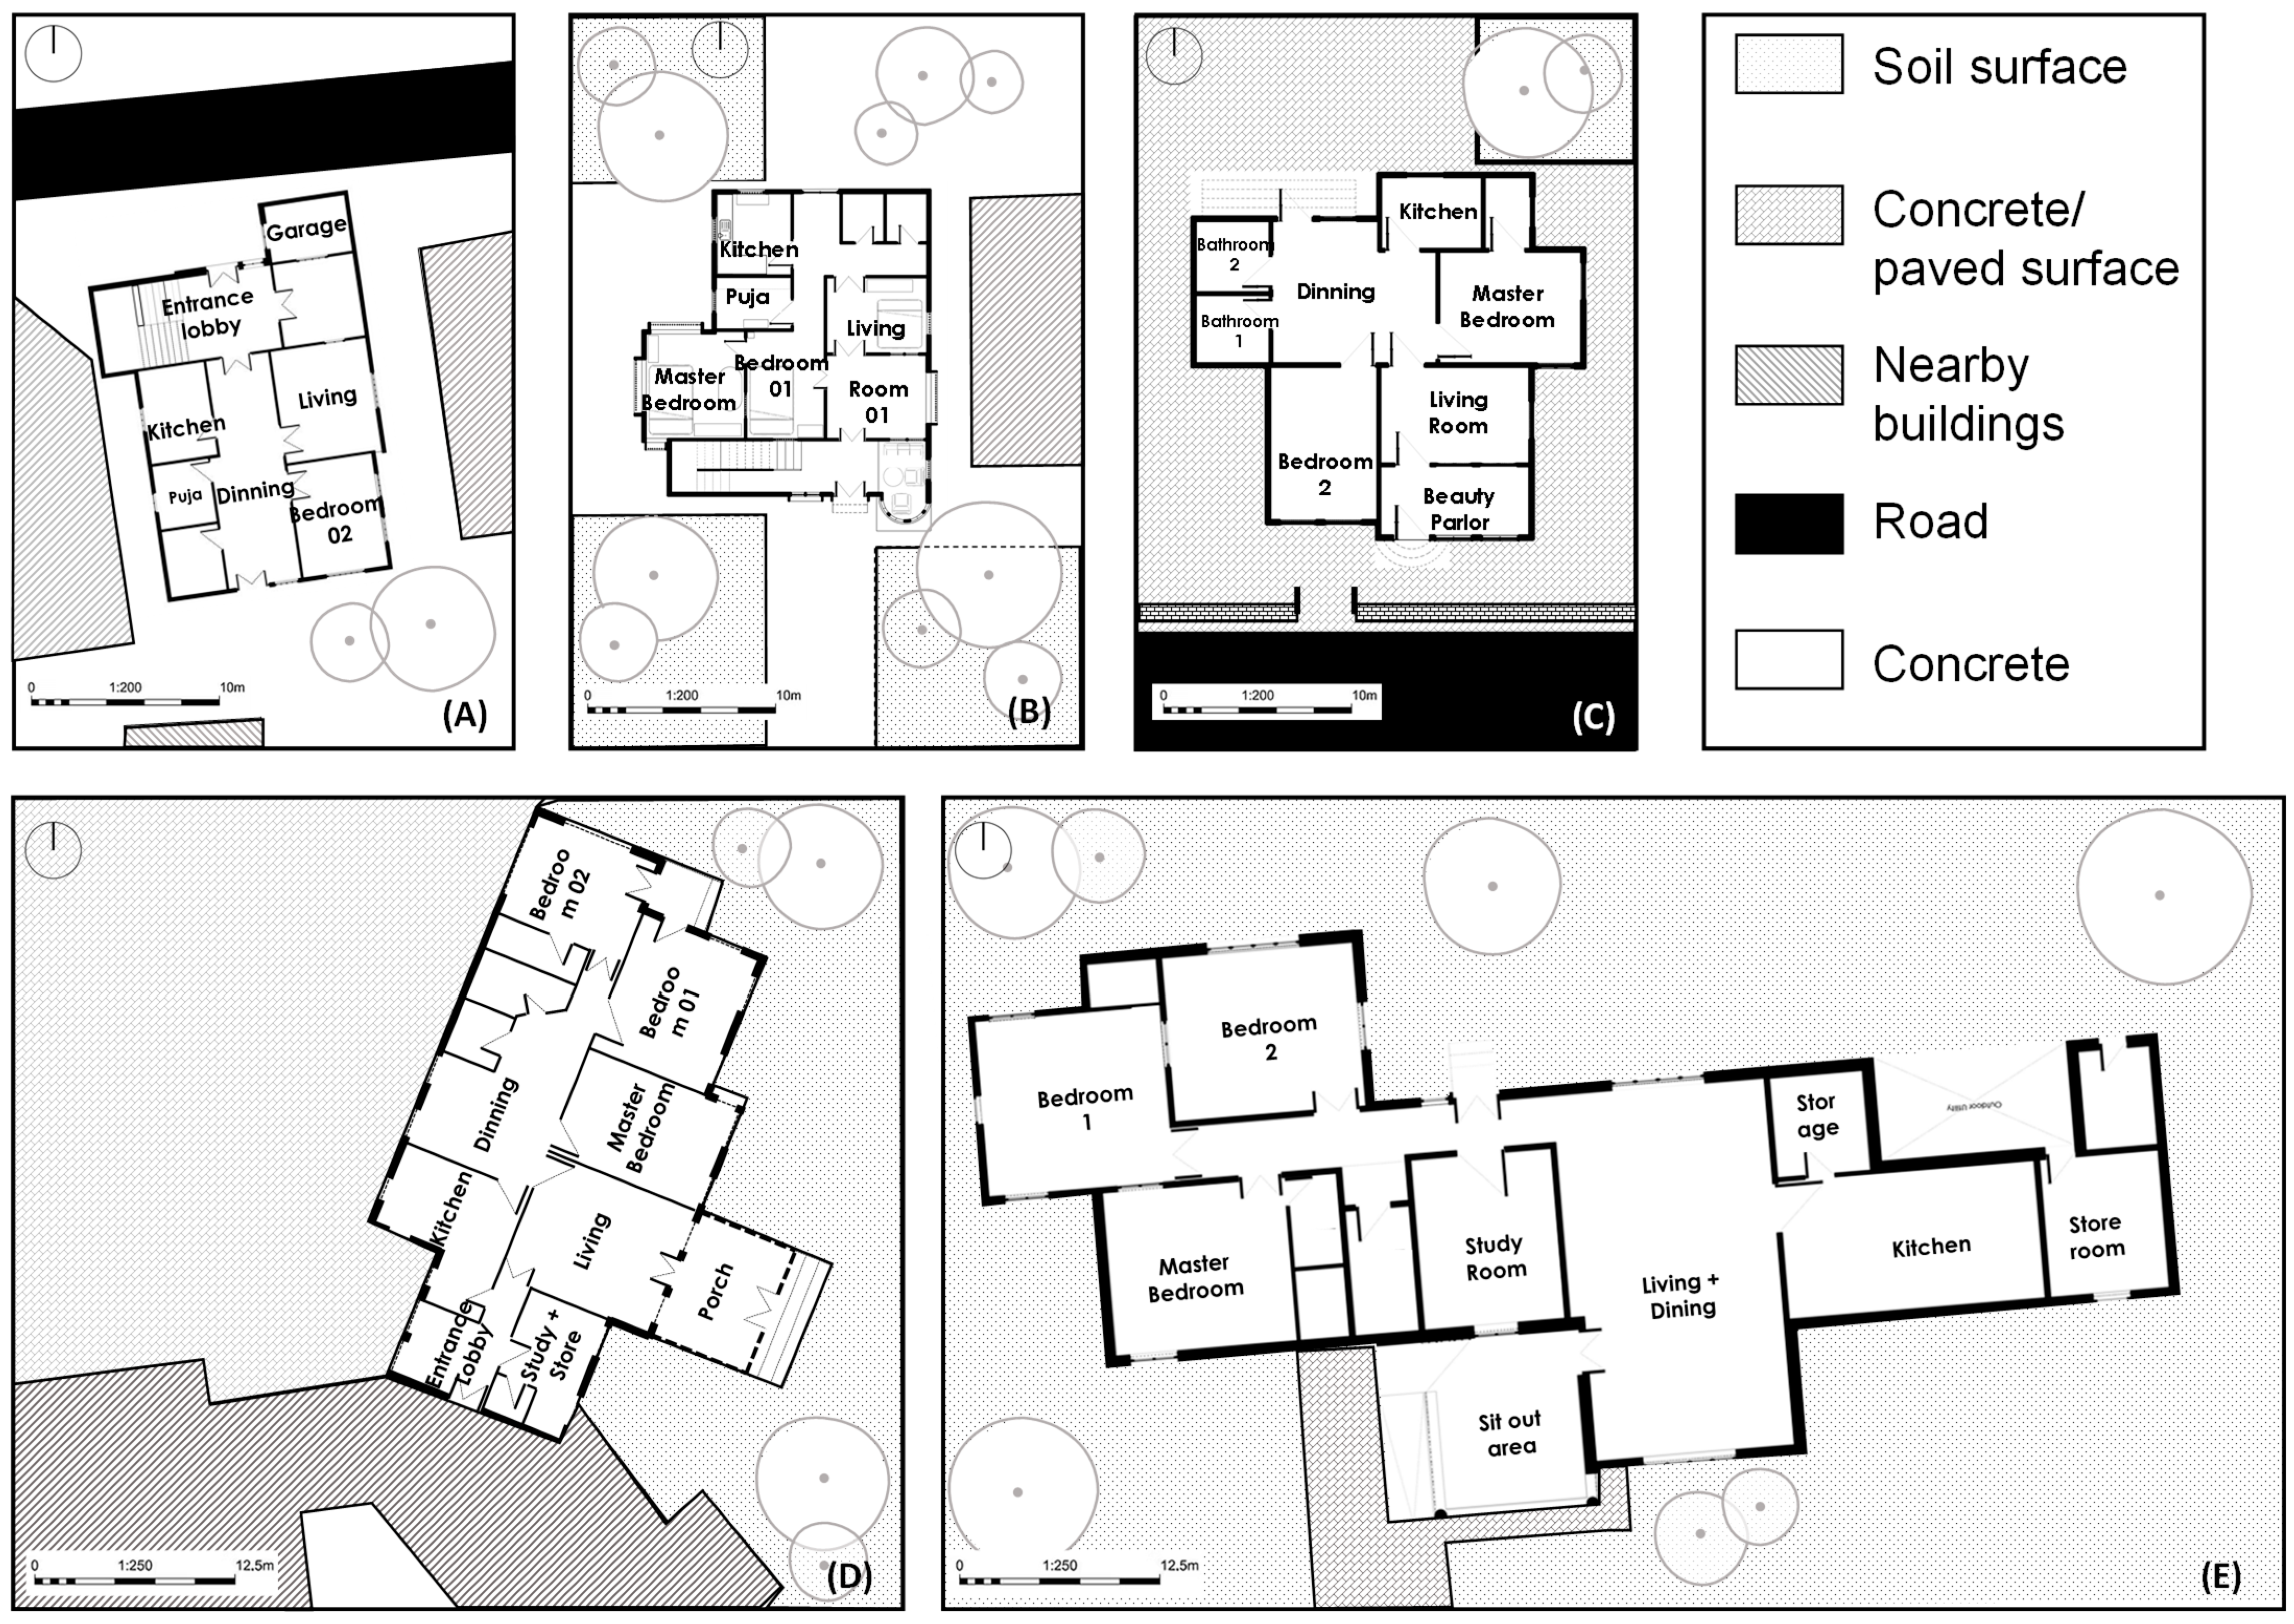
Five modern urban houses were selected in the town to have a detailed measurement of the thermal environmental conditions. These houses were chosen based on various housing typologies of Kharagpur. In this region, the houses back in the 1960s were mud houses with high plinths and central courtyards, which at present have transformed into concrete houses with small semi-open spaces, surrounded by other houses or having small gardens in the front [48]. In Kharagpur, the current housing typologies include (1) the railway staff quarters, (2) the staff quarters of the educational institute and (3) contemporary modern houses. The railway staff quarters have been developed since the 1900s, particularly around the central railway station, and are good examples of colonial architecture. The staff quarters for the large national university, i.e., Indian Institute of Technology, Kharagpur, comprise two types: single-story bungalow style houses (Type 1) and apartment style houses (Type 2). Type 1 has been developed since the 1970s as mass developments, followed by Type 2 since the 1980s, and therefore, the houses in each type are quite homogeneous in terms of building design, orientation and surrounding landscapes. The others can be classified as contemporary modern houses that are found across the city. These housing typologies are the typical style of modern houses, available in the hot–humid climates of India. Figure 1c shows the location of the case-study houses in Kharagpur. As shown, Houses A, B and Houses D, E are close to each other, respectively, while House C is in between the other houses. Figure 2 shows the external view and the interior view of the houses. Houses A, B and C are contemporary modern houses constructed during the 1990s, while House D is a Type 2 style staff quarter and House E is a Type 1 staff bungalow. They were built in the 1970s and 1980s, respectively. The colonial style railway quarters were overlooked, due to its non-representation of modern urban houses in India.
Figure 2.
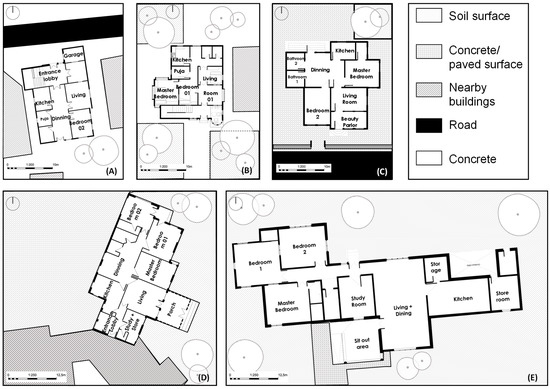
(A) Plan, Interior and exterior views of House A, (B) plan, interior and exterior views of House B, (C) plan, interior and exterior views of House C, (D) plan, interior and exterior views of House D, and (E) plan, interior and exterior views of House E.
House A is a two-story house with an open terrace (Figure 2A and Figure 3A). It has two bedrooms, one on each floor. The entire house has tiles as flooring material. House B is located on the ground floor with a semi-open sit-out area, three bedrooms and a small passageway. It also has a garden in front of it (Figure 2B and Figure 3B). House C consists of an enclosed porch, which was converted into a beauty parlor, along with two bedrooms and a semi-open space at the back. House D is an apartment with a semi-open porch and three bedrooms (Figure 2D and Figure 3D). House E is a single-storey bungalow house with a garden in the front and a small porch with three bedrooms (Figure 2E and Figure 3E).
Figure 3.
Surrounding conditions of case study houses (A) House A, (B) House B, (C) House C, (D) House D, and (E) House E.
Table 2 shows the attributes of all five houses. As shown, House E has the largest building size (137.7 m2) compared with the other houses with an adjacent garden all around the house, whereas House B is the smallest (70.7 m2). Additionally, all houses were found to have similar wall thickness (0.25 m), except for House B (0.125 m). The resultant U-values range from 1.8 to 2.9 W/m2K for external walls and 2.2–3.0 W/m2K for internal walls, respectively. The thermal mass of the entire buildings was calculated at approximately 7700–30,200 kJ/K. The glazing ratios are relatively low (0.1–0.2), except for House D (0.3), where all the selected houses have semi-open spaces and ceiling fans.
Table 2.
Building attributes.
2.3. Long-Term Measurements
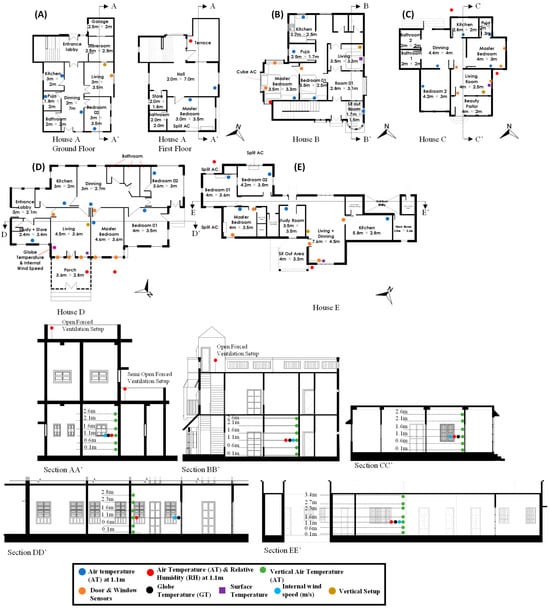
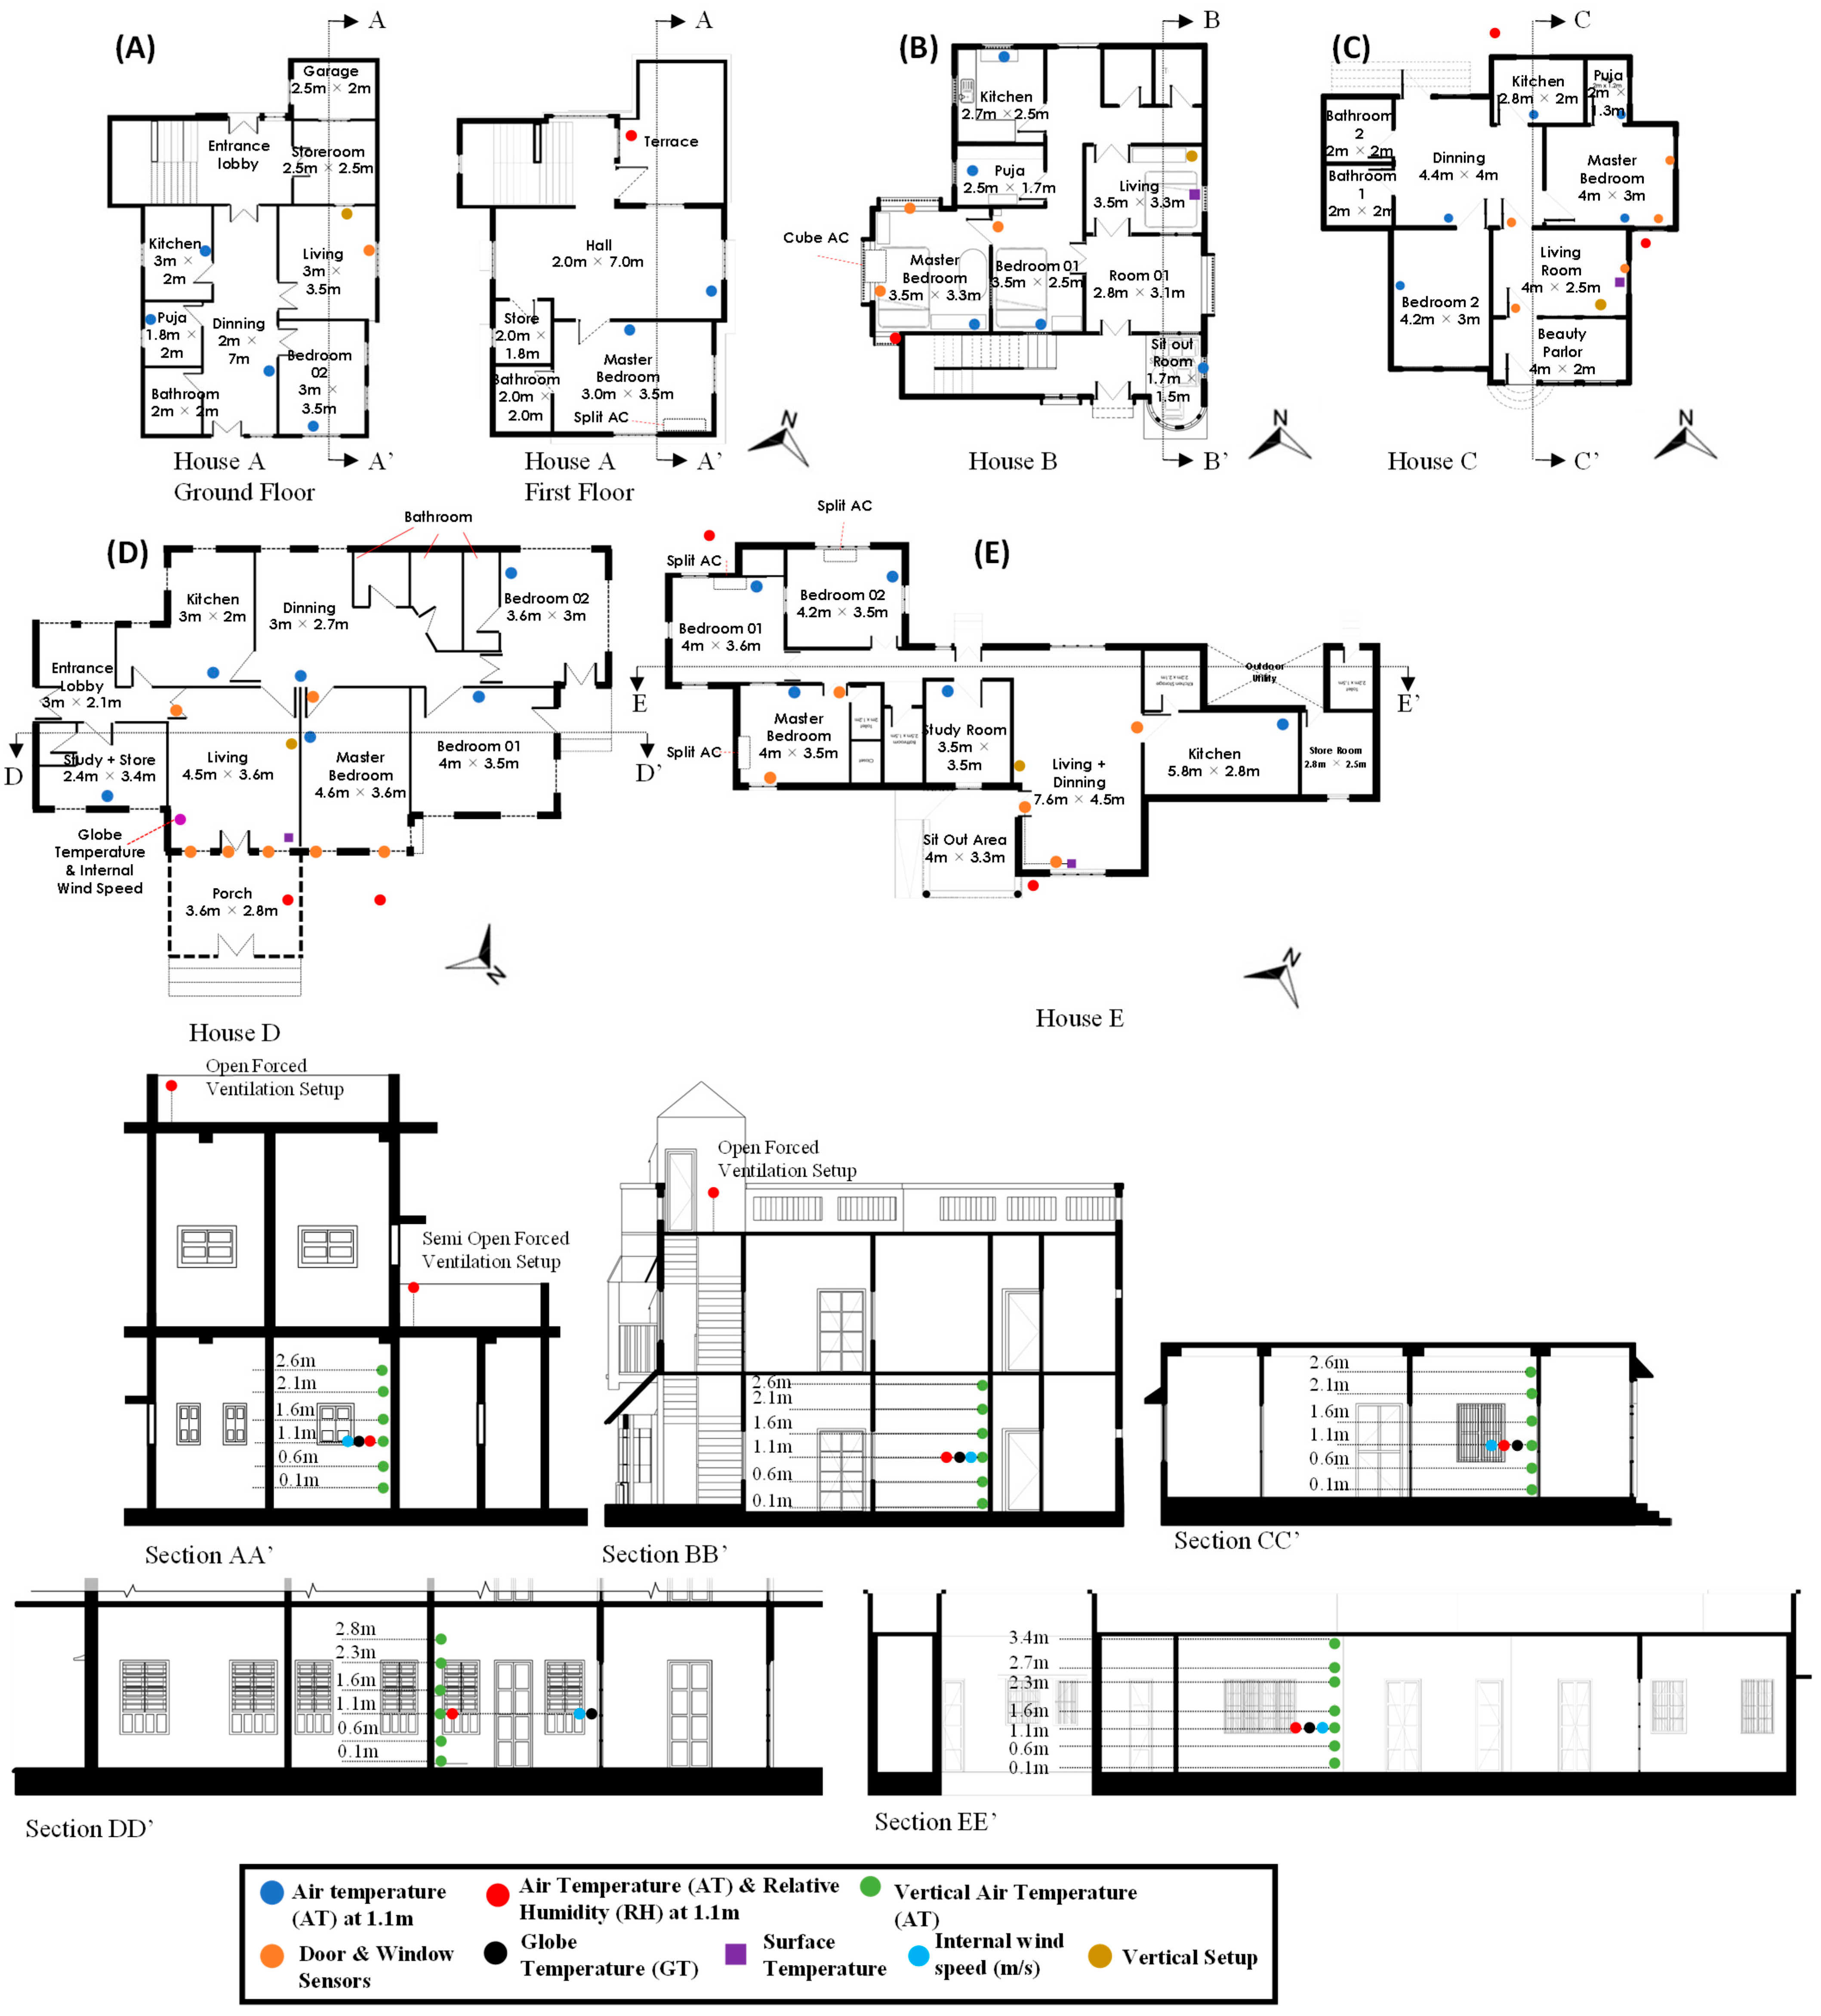
Long-term measurement started from July 2023 until July 2024. Figure 4 shows the placement of measurement points in the five houses. AT and RH were measured at the outdoor open spaces or rooftops. Furthermore, the vertical distribution of AT, indoor wind speed, globe temperature and surface temperature (ST) were measured in the living rooms. Door and window sensors were also placed on the door and window openings of the living rooms. Meanwhile, only AT was measured in different rooms in the houses at 1.1 m height. In the following analysis, all data were averaged to a 10 min interval to make it comparable. Table 3 shows the details of instruments used. Figure 5 shows the images of sensors within the households.
Figure 4.
Measurement plans of the case study houses (A–E).
Table 3.
Sensor specifications.
Figure 5.
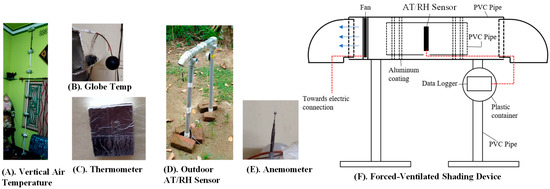
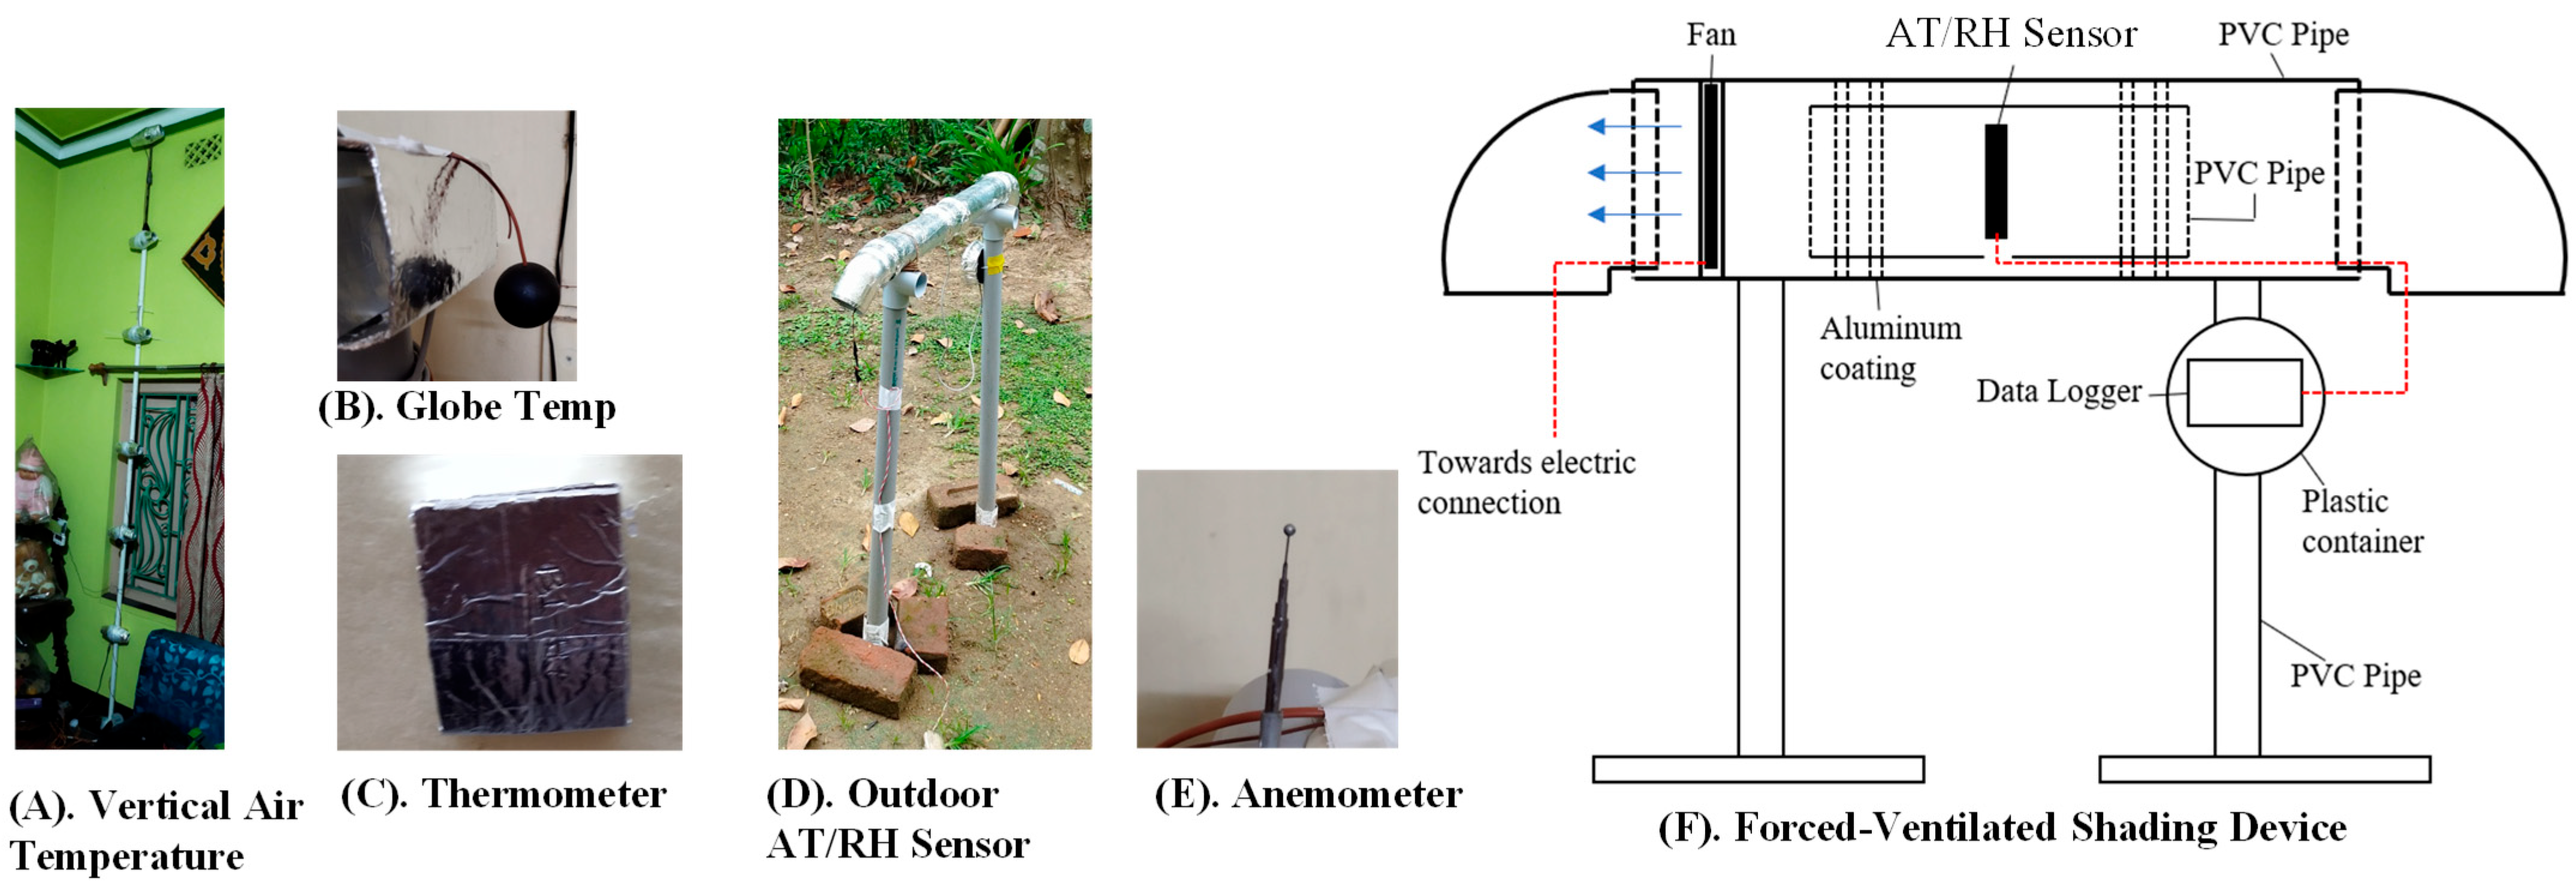
(A–E) Sensor images and (F) Forced-ventilated shading device.
The sensors in the indoor spaces could not be placed at ideal positions within the rooms such as the center of the room, as the houses were occupied. Therefore, most sensors were placed near the walls with radiation shields for the AT sensors (Figure 5C). We installed all the AT sensors with insulation sheets (70 (L) × 70 (W) × 15 mm (H)) to avoid thermal influences from the walls. For the vertical AT distribution, the thermocouple wires were covered using paper cups with aluminum foil for protection from solar radiation (Figure 5A) [49]. However, the thermal influences for globe temperatures still remained as a limitation of our measurements. The AT/RH sensors placed in the outdoor and semi-open spaces were put in a forced-ventilated shading device, where the sensors were placed within double layered PVC pipes coated with aluminum foil (Figure 5F). The above-mentioned low-cost radiation shield using PVC was developed and validated in several previous studies [50,51,52,53,54,55]. The following periods of measured data were used for the analysis, respectively: 1 Jul–30 Sep for monsoon, 1 Dec–29 Feb for winter and 1 Apr–30 Jun for summer.
2.4. Calculation of MRT, SET* and OT
The mean radiant temperature (MRT) was calculated by Equation (1) [17].
where GT refers to the globe temperature (°C) and v refers to the indoor wind speed (m/s).
SET* was determined based on the 2-node model developed by Gagge et al. in 1970 [56]. The purpose was to determine particular combinations of physical conditions producing equal physiological strain [56]. Backed by extensive data from climate-chamber experiments, Gagge claimed that while skin temperature was a good indicator of sensation in cold environments, skin wetness was a better indicator in warm environments where sweating occurred because skin temperature changes were small by comparison [56]. This model represents the human body as two concentric cylinders: a core cylinder and a thin skin cylinder surrounding it. Clothing and sweat are assumed to be evenly distributed over the skin surface [56]. The detailed theoretical bases and algorisms are described by Fountain et al. (1995) [57] and the computer program for the calculation of SET* is provided in ASHRAE [17]. In this study, SET* was calculated using a macro program based on the above-mentioned bases.
AT, indoor wind speed, RH, barometric pressure, GT and the above-calculated MRT were used for the calculation of SET*. Other factors like body weight (70 kg), body surface area (1.8 m2), metabolic rate (58 W/m2) and zero external work were also considered. In the previous studies conducted in the composite climate of India, the average body weight of the respondents was 65–70 kg with a body surface area of 1.6–1.8 m2, and therefore, they were used for the calculation [58]. For the clo values, 0.5 clo was considered for summer and monsoon months and 1.0 clo for winter months. The actual clothing insulations may have varied in accordance with gender or age, but season-wise, the clo values were considered on the basis of the material of clothes according to ASHRAE 55 [17]. The SET* was compared for all five houses only in the living room.
The operative temperature (OT) was calculated by using Equation (2) [59].
where Top is OT (°C) and v is wind speed (m/s).
OT along with absolute humidity (AH) were used for psychometric analysis in the living rooms seasonally.
2.5. Evaluation of Cooling Effect of Elevated Wind Speed Using SET*
To evaluate the cooling effect of the wind speed, the measured AT, RH and calculated MRT were input and the measured indoor wind speeds, which were less than 0.15 m/s, were set at 0.15 m/s, and the SET* results were noted. Then, to equalize the reduced SET* with the previous SET* results, the measured AT was reduced. The reduced AT was subtracted from the measured AT to realize the reduction in AT due to the elevated indoor wind speed, as stated in ASHRAE 55 [17].
2.6. Feedback Interview for Occupants
After the seasonal analysis of case-study houses, interviews were conducted with the occupants of Houses A, B and C, as most hostile conditions could be seen in these houses, especially during the summers. The aspects of the interview consisted of asking the occupants about the steps or measures that they took to sustain themselves within the indoor environment during each season, like the usage of rooms, the daily window-usage patterns and the usage of mechanical cooling devices. Some specific seasonal adaptive behaviors also came to light during these interviews.
3. Results
3.1. Air Temperature, Relative Humidity and Surface Temperature
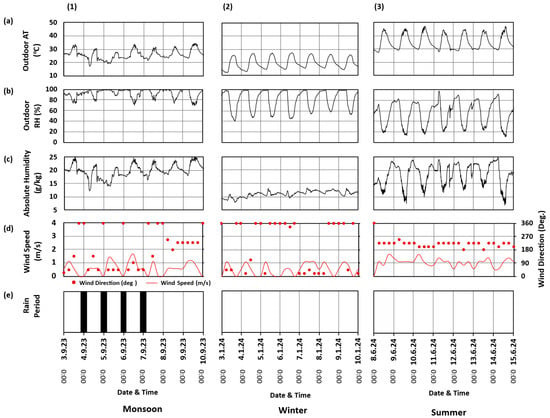
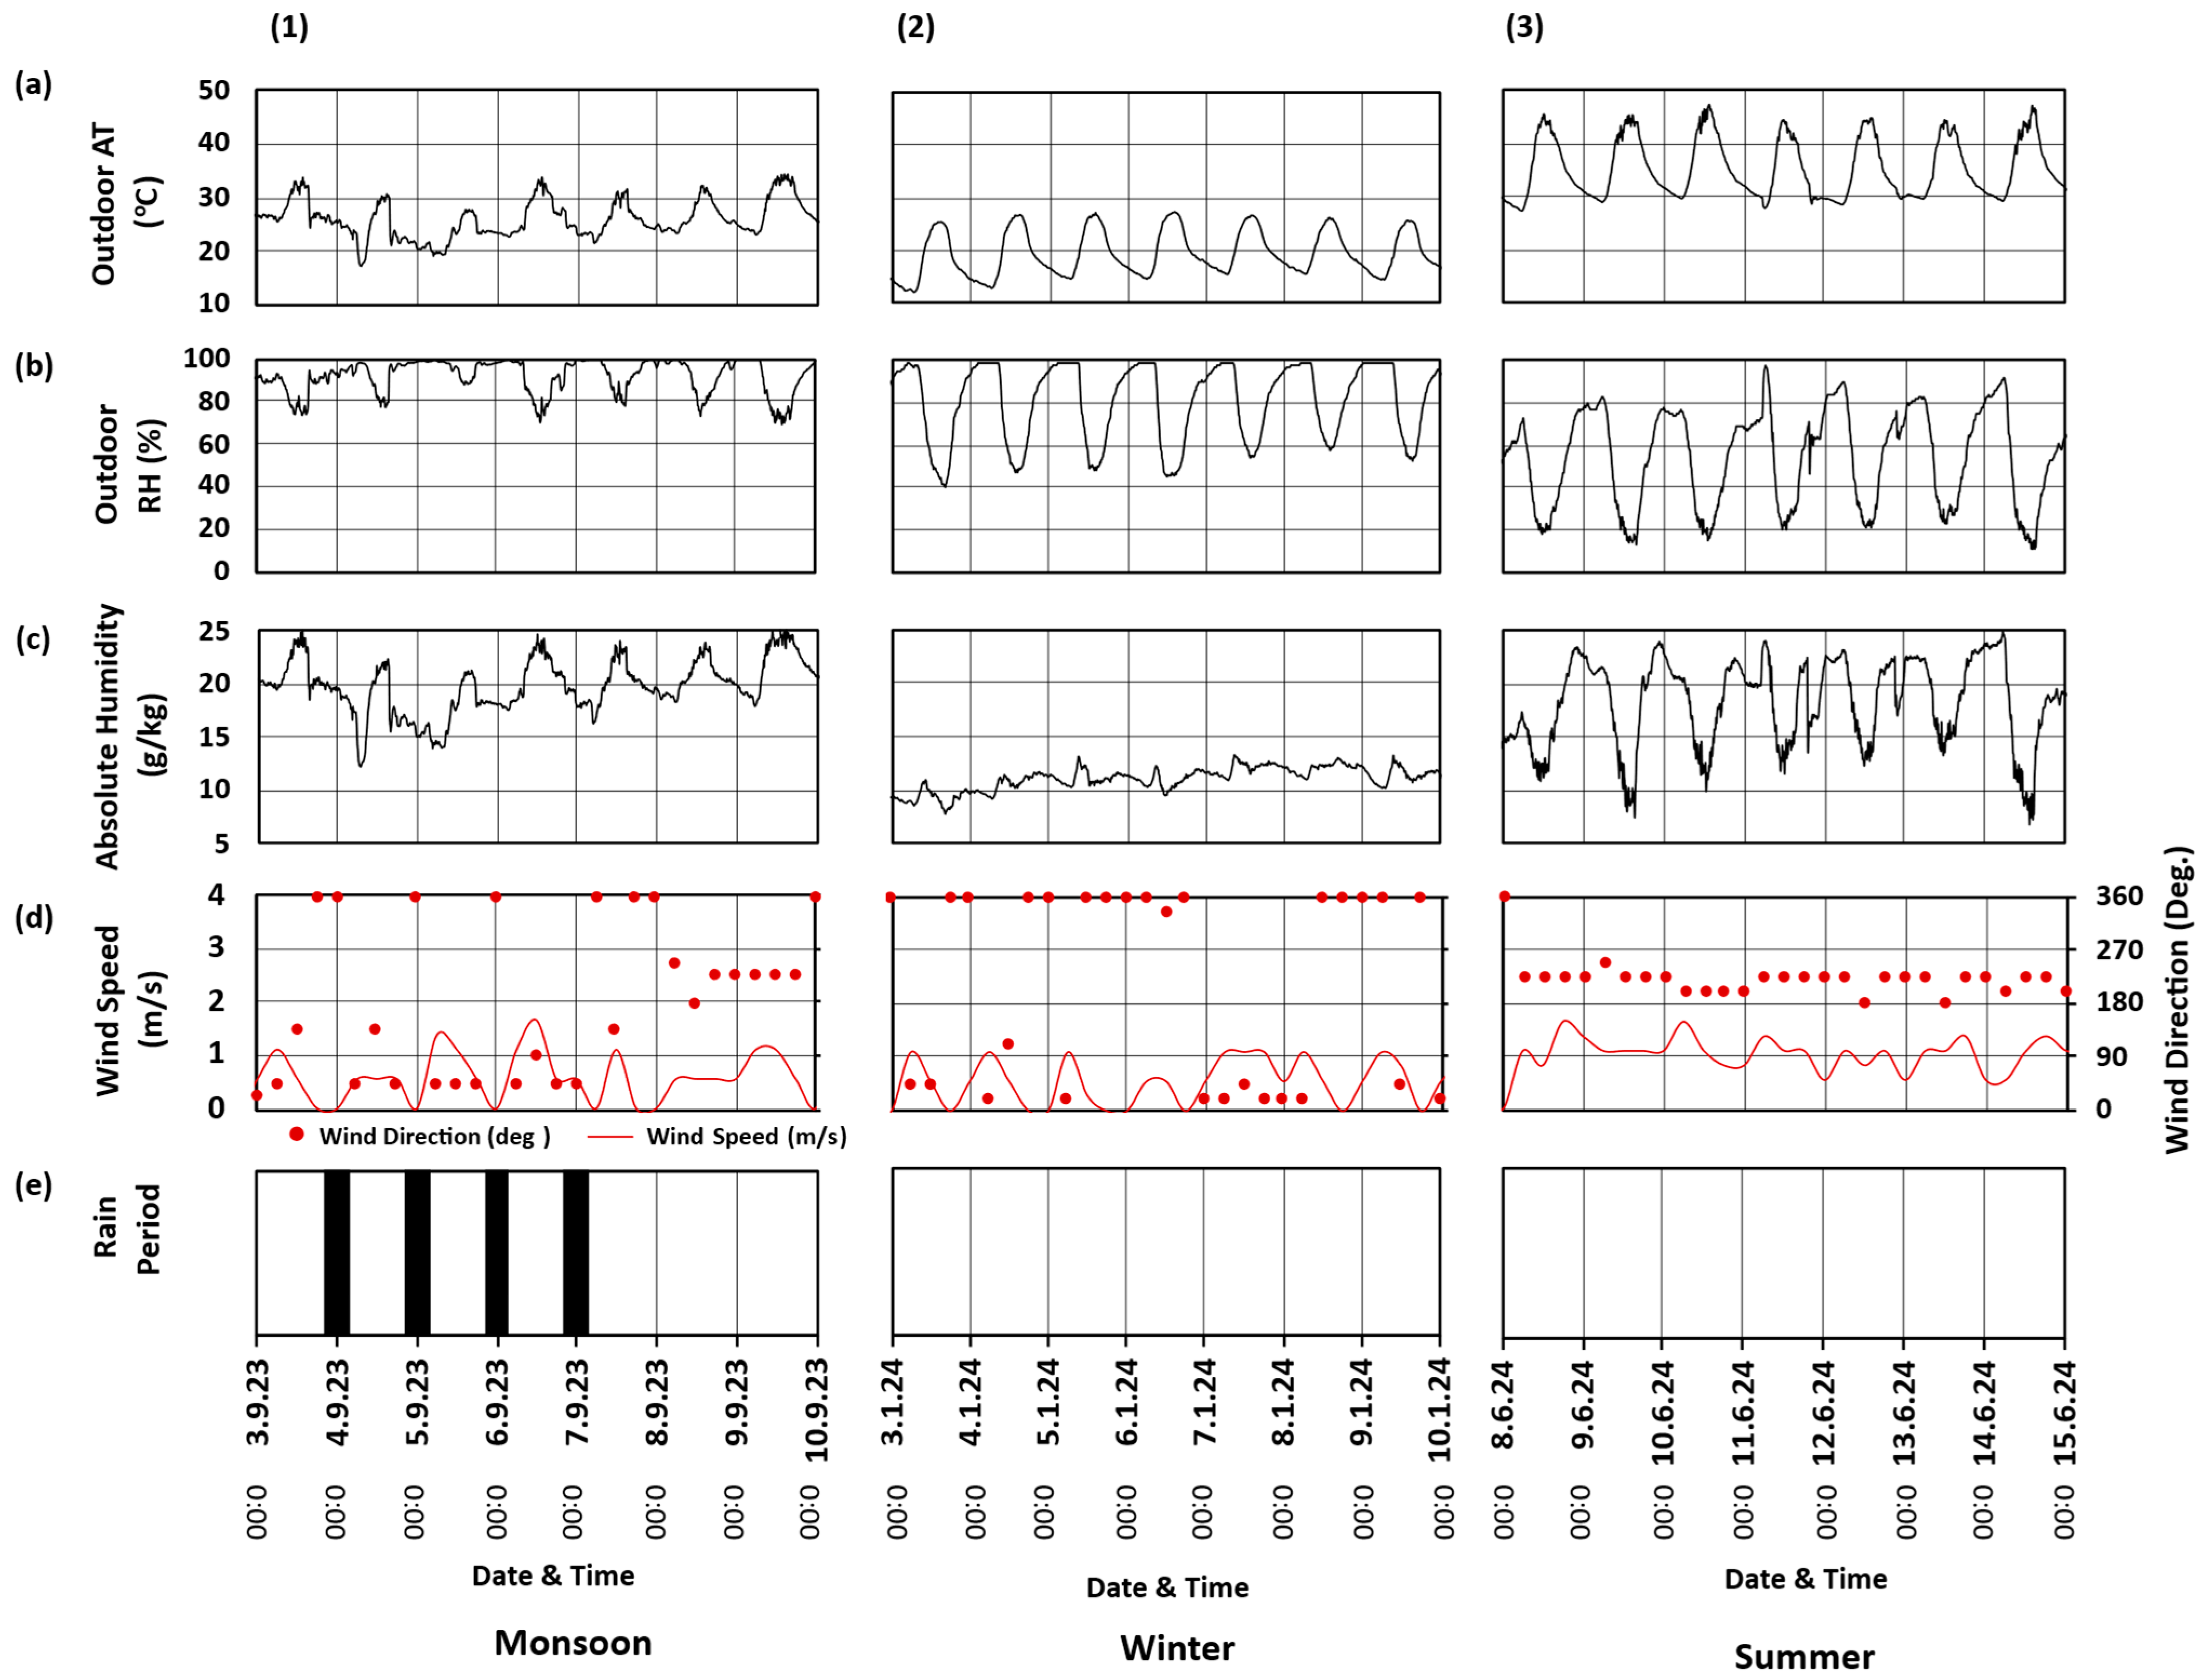
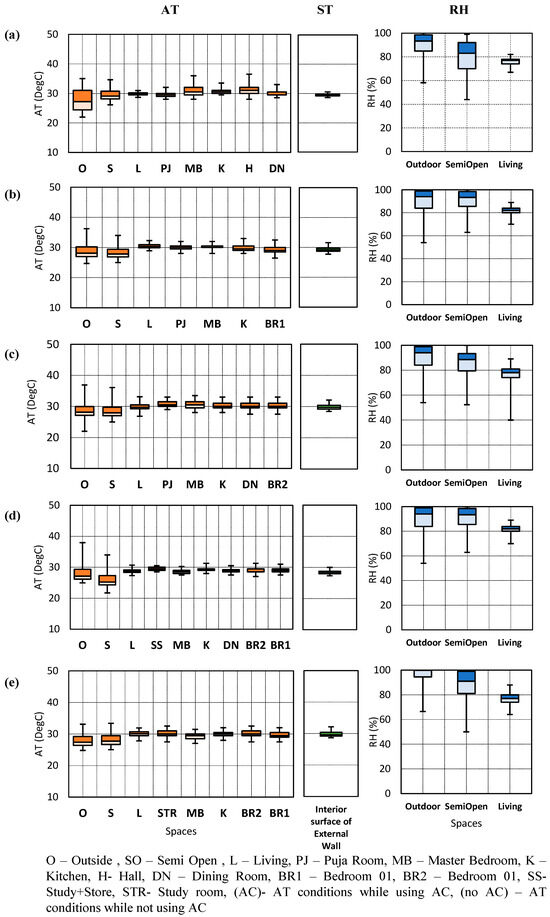
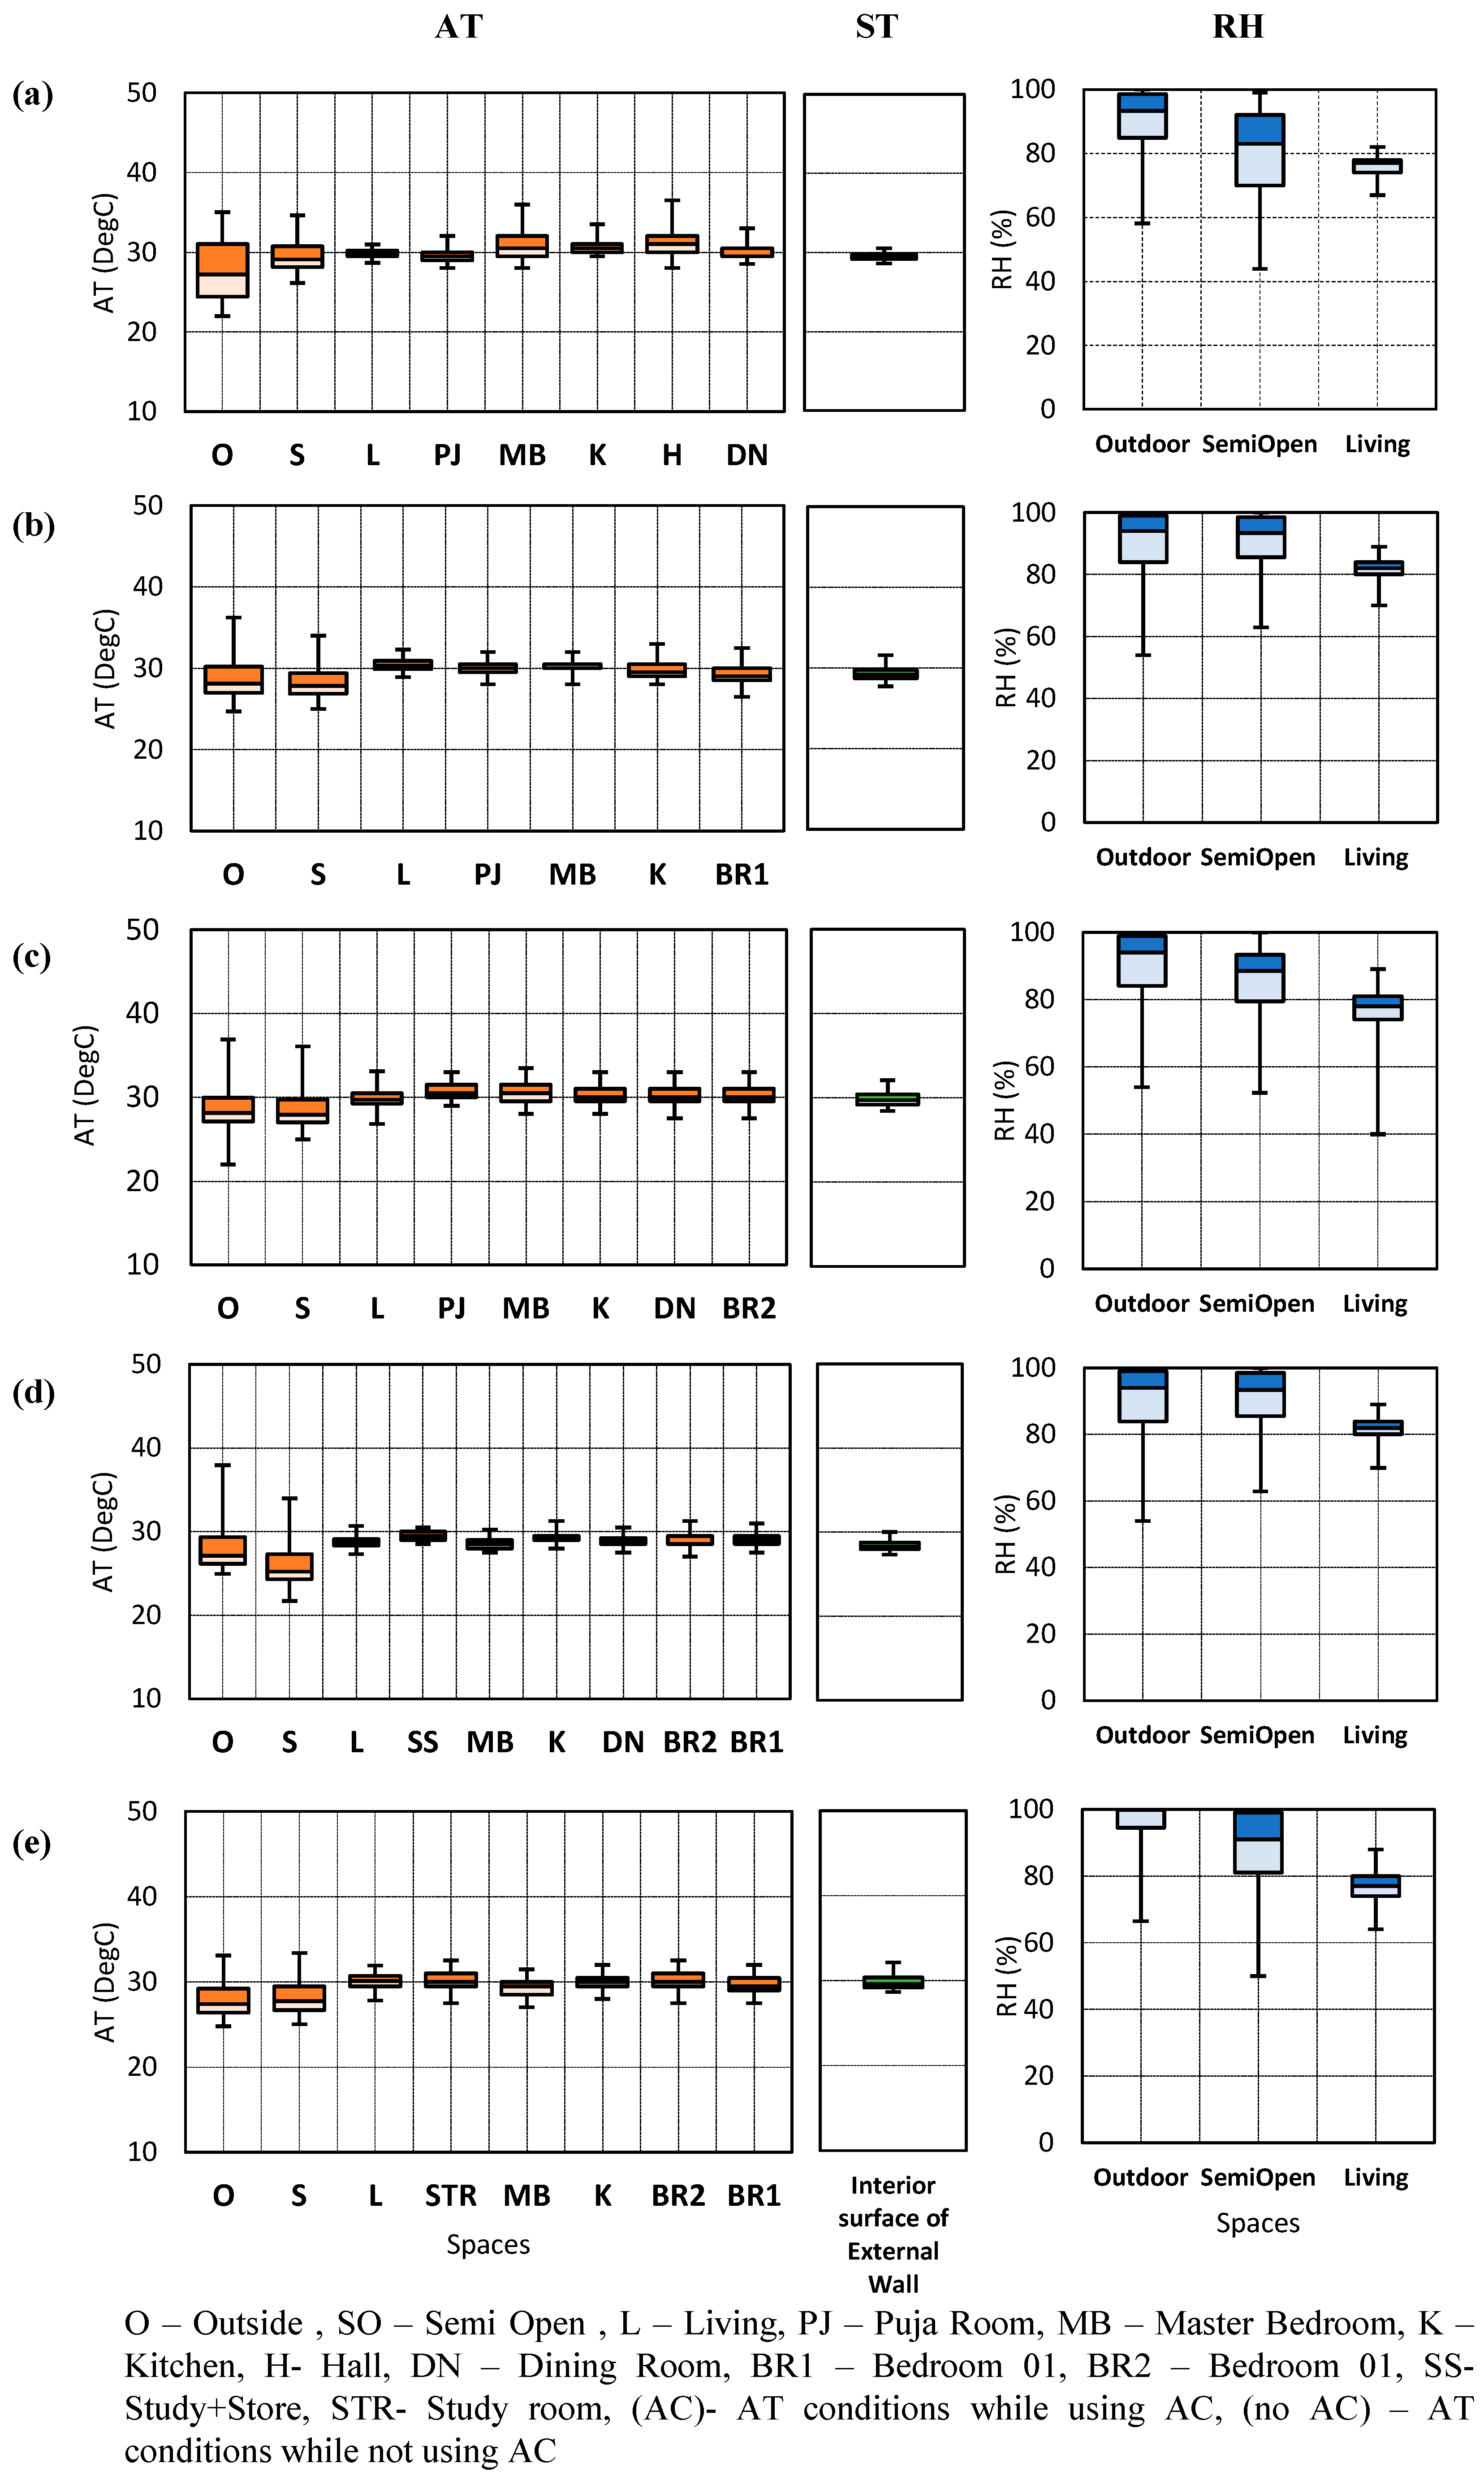
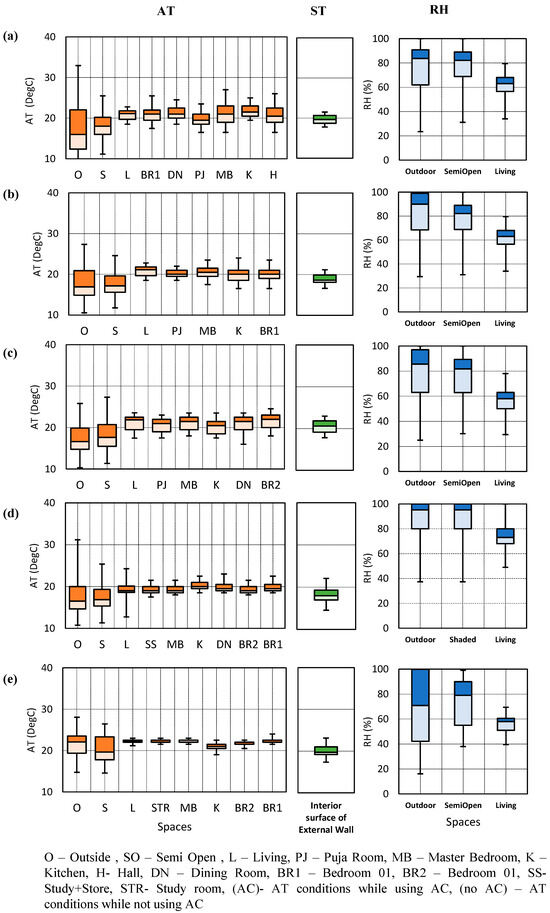
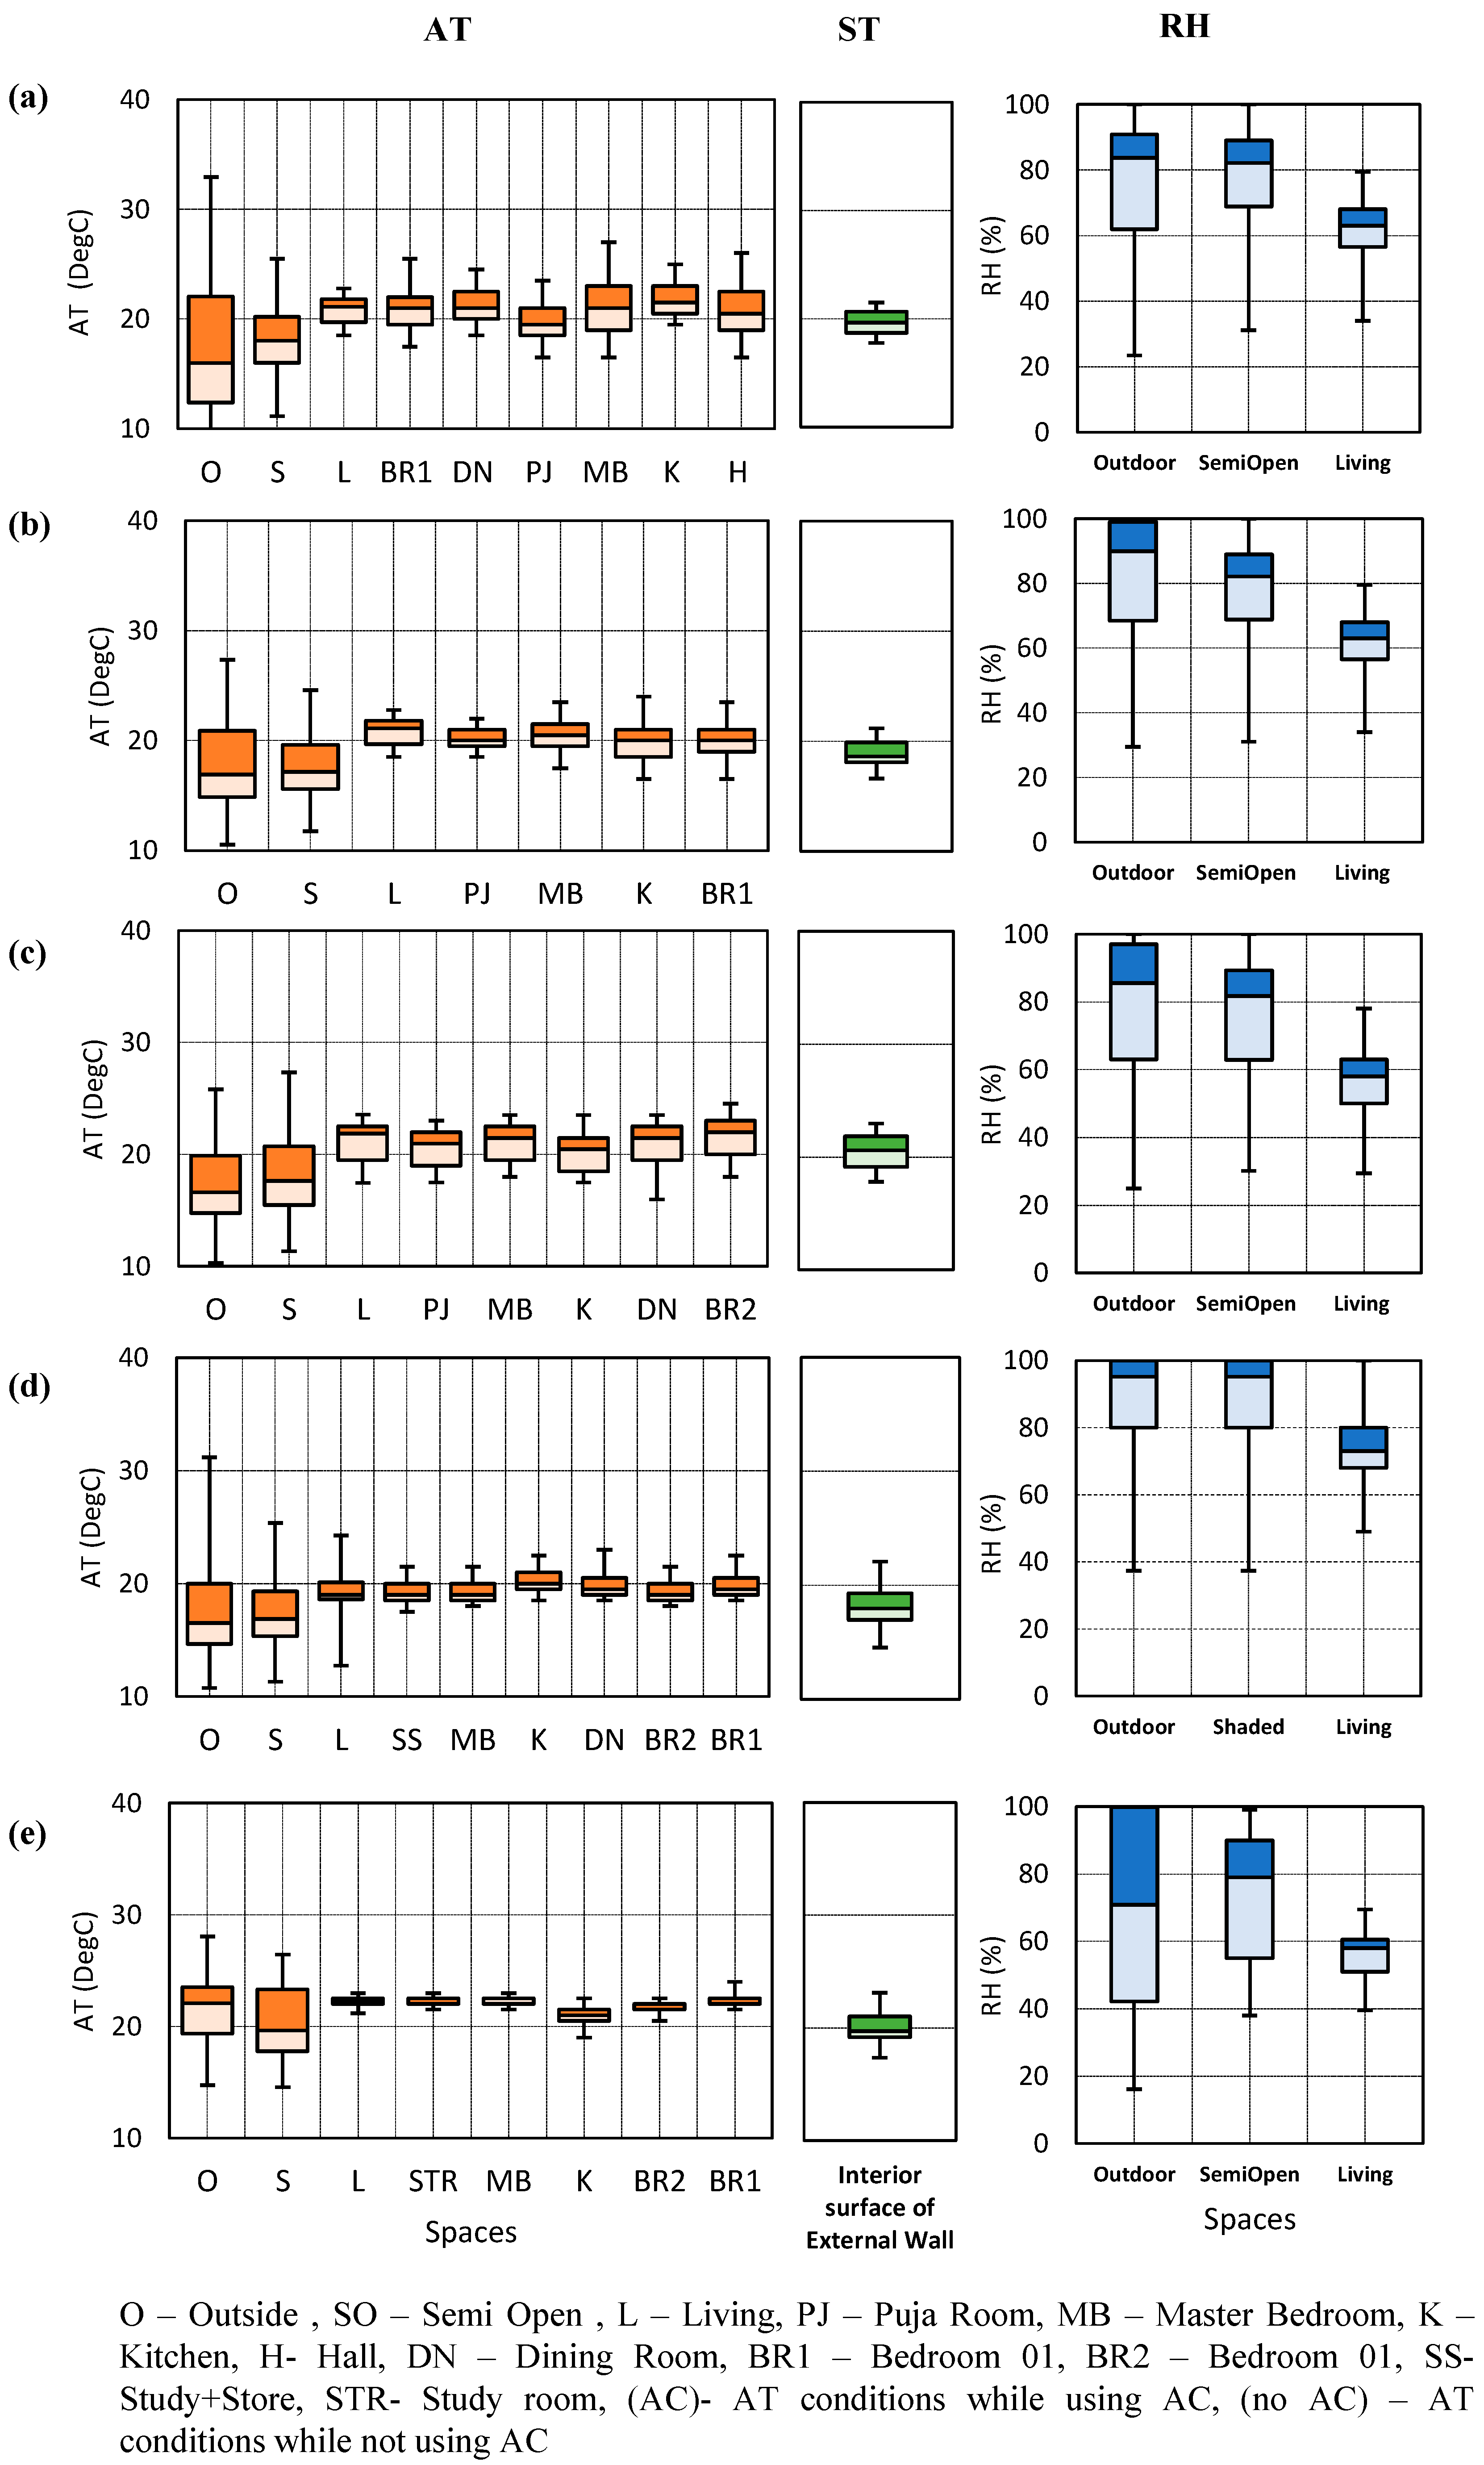
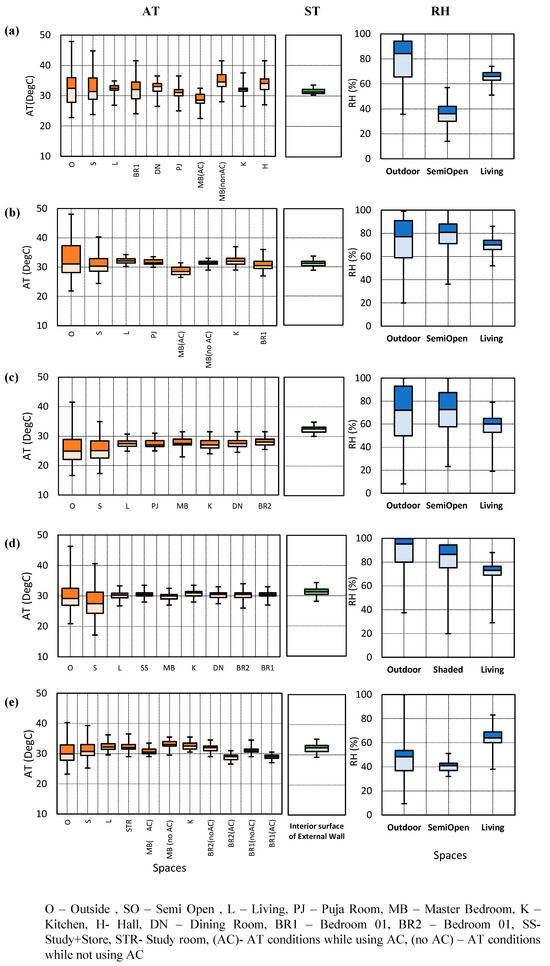
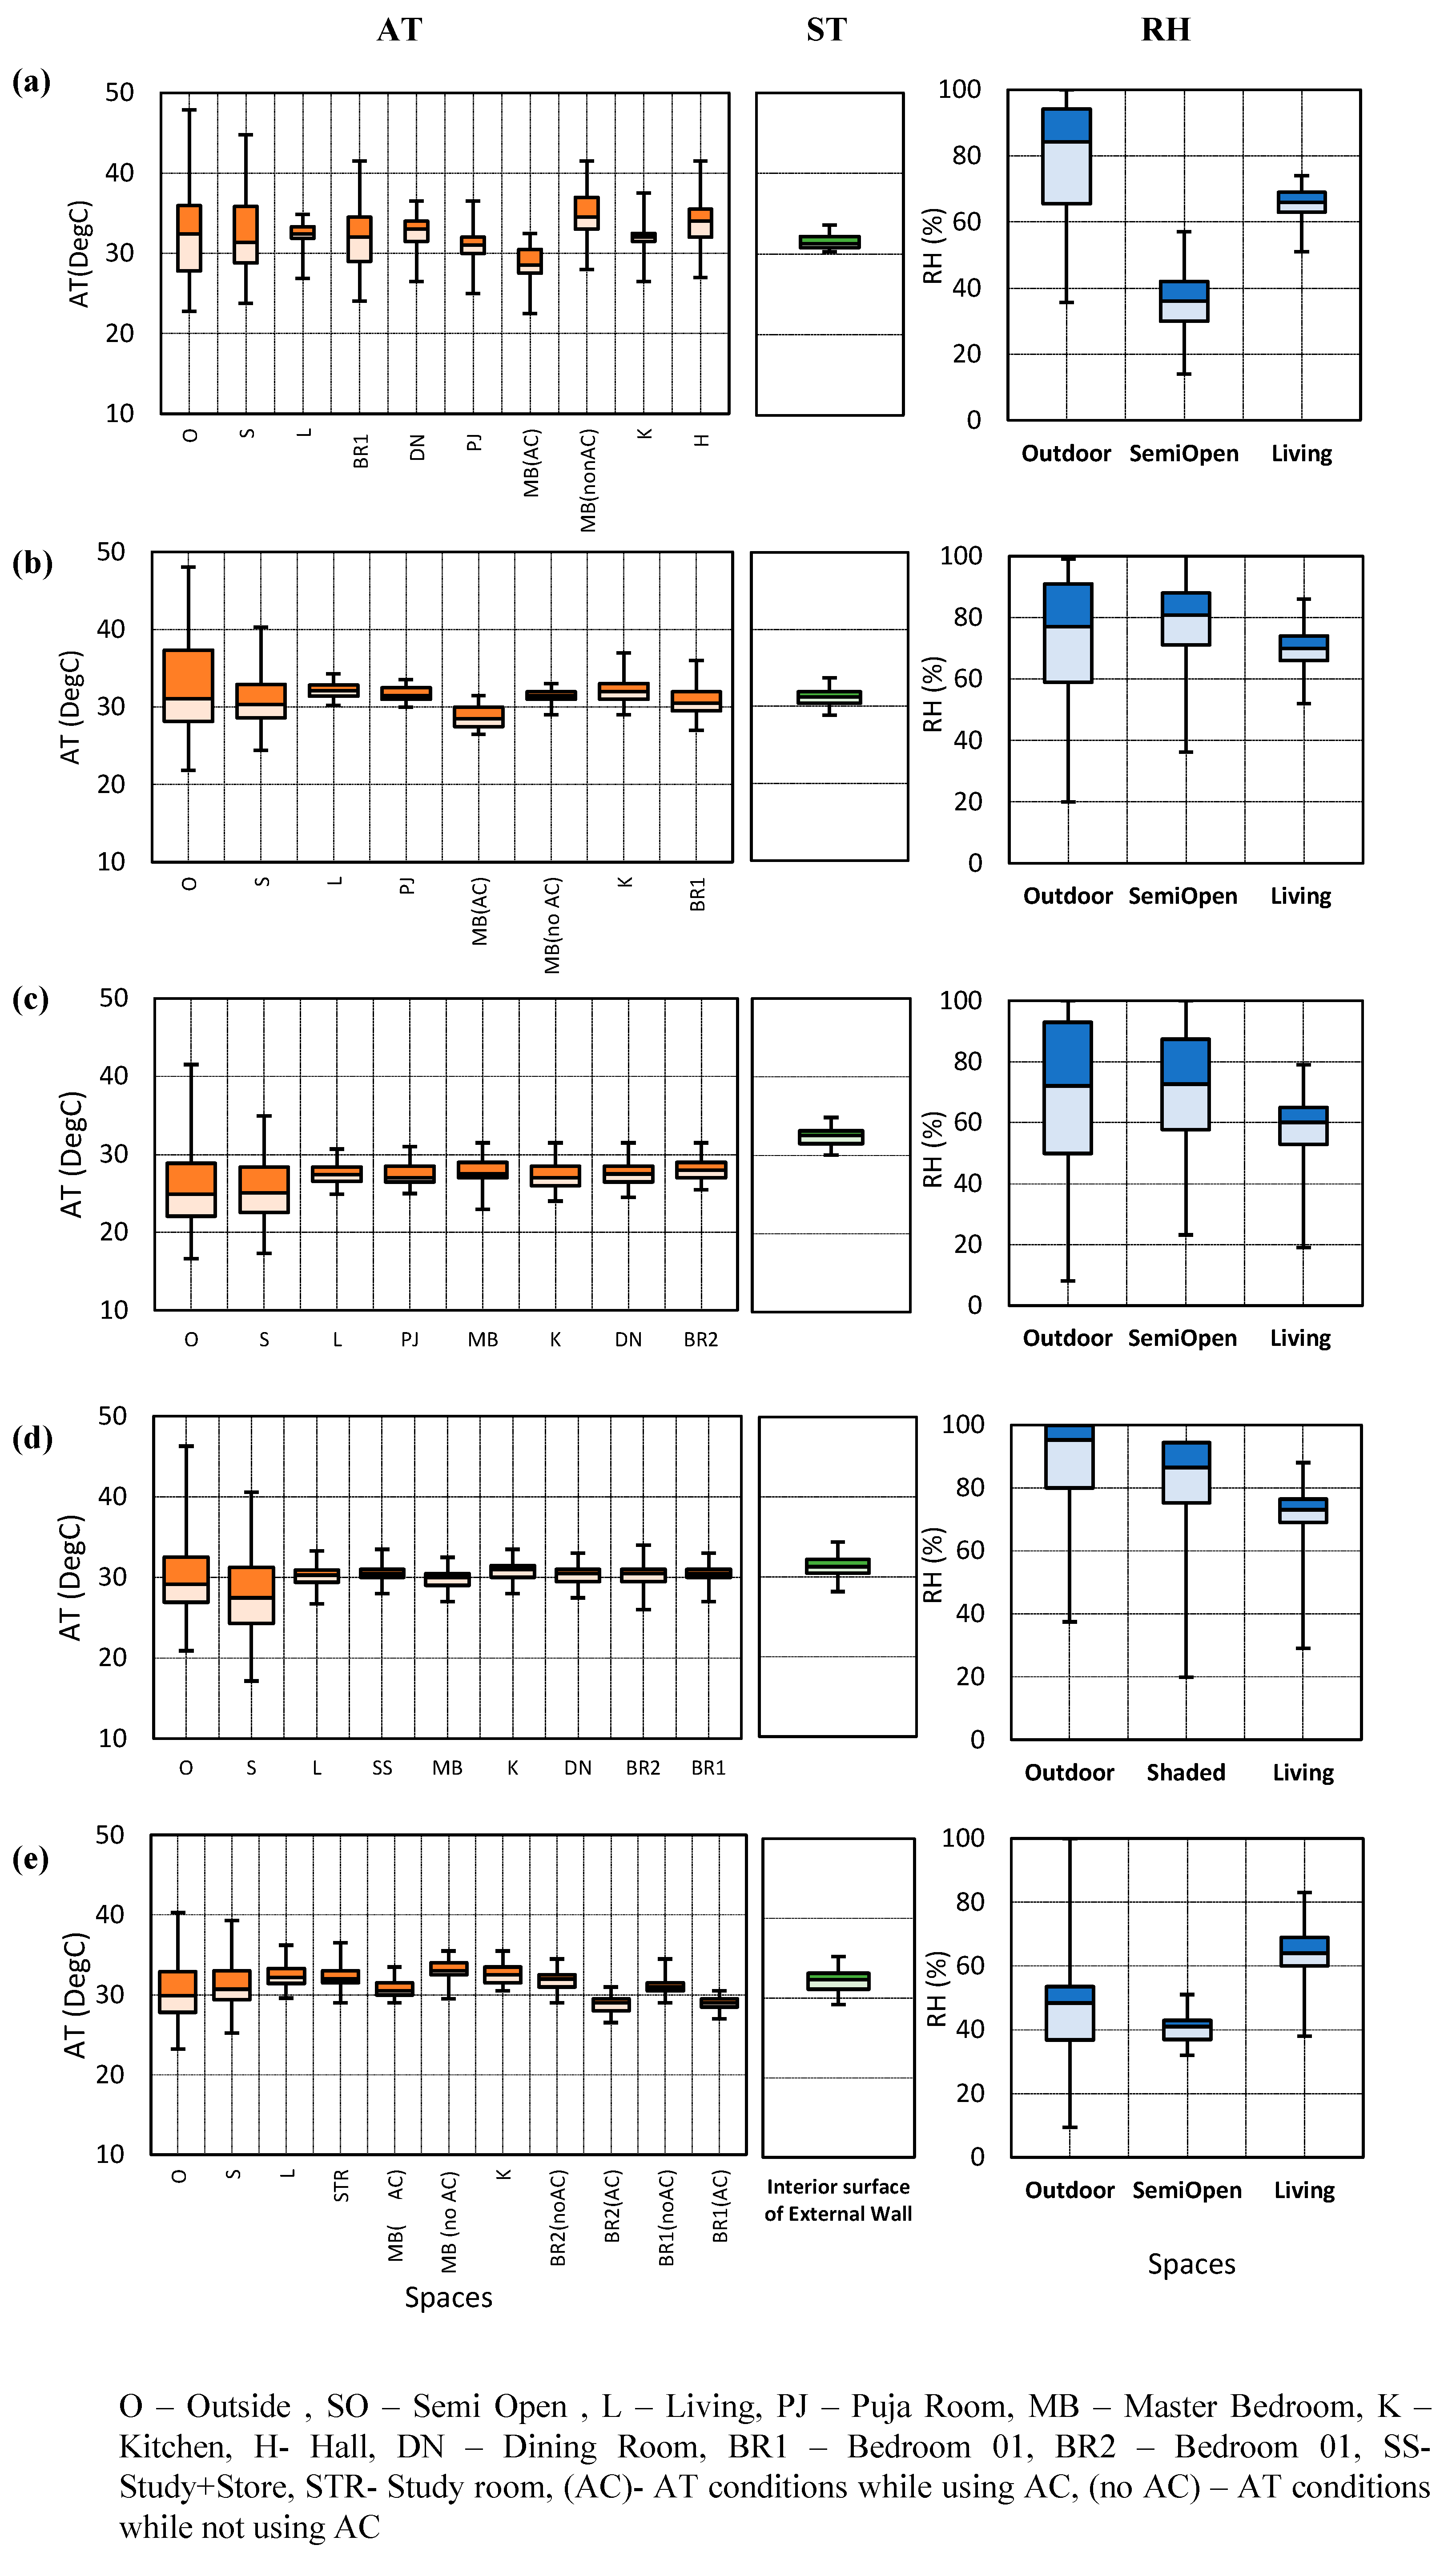
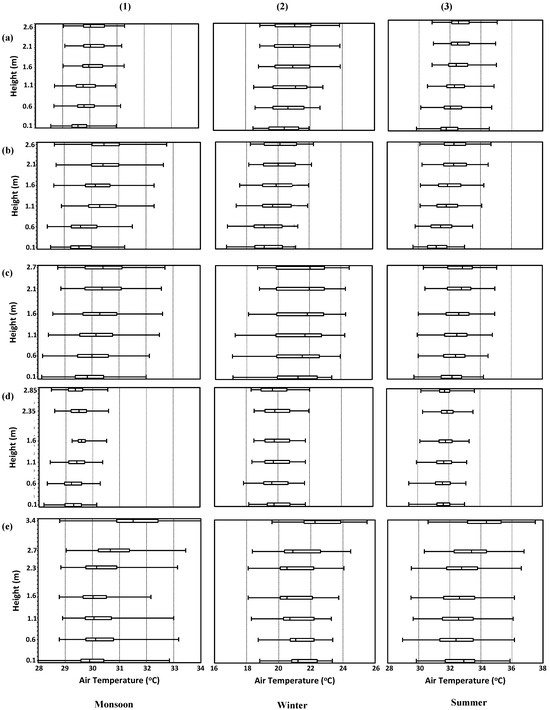
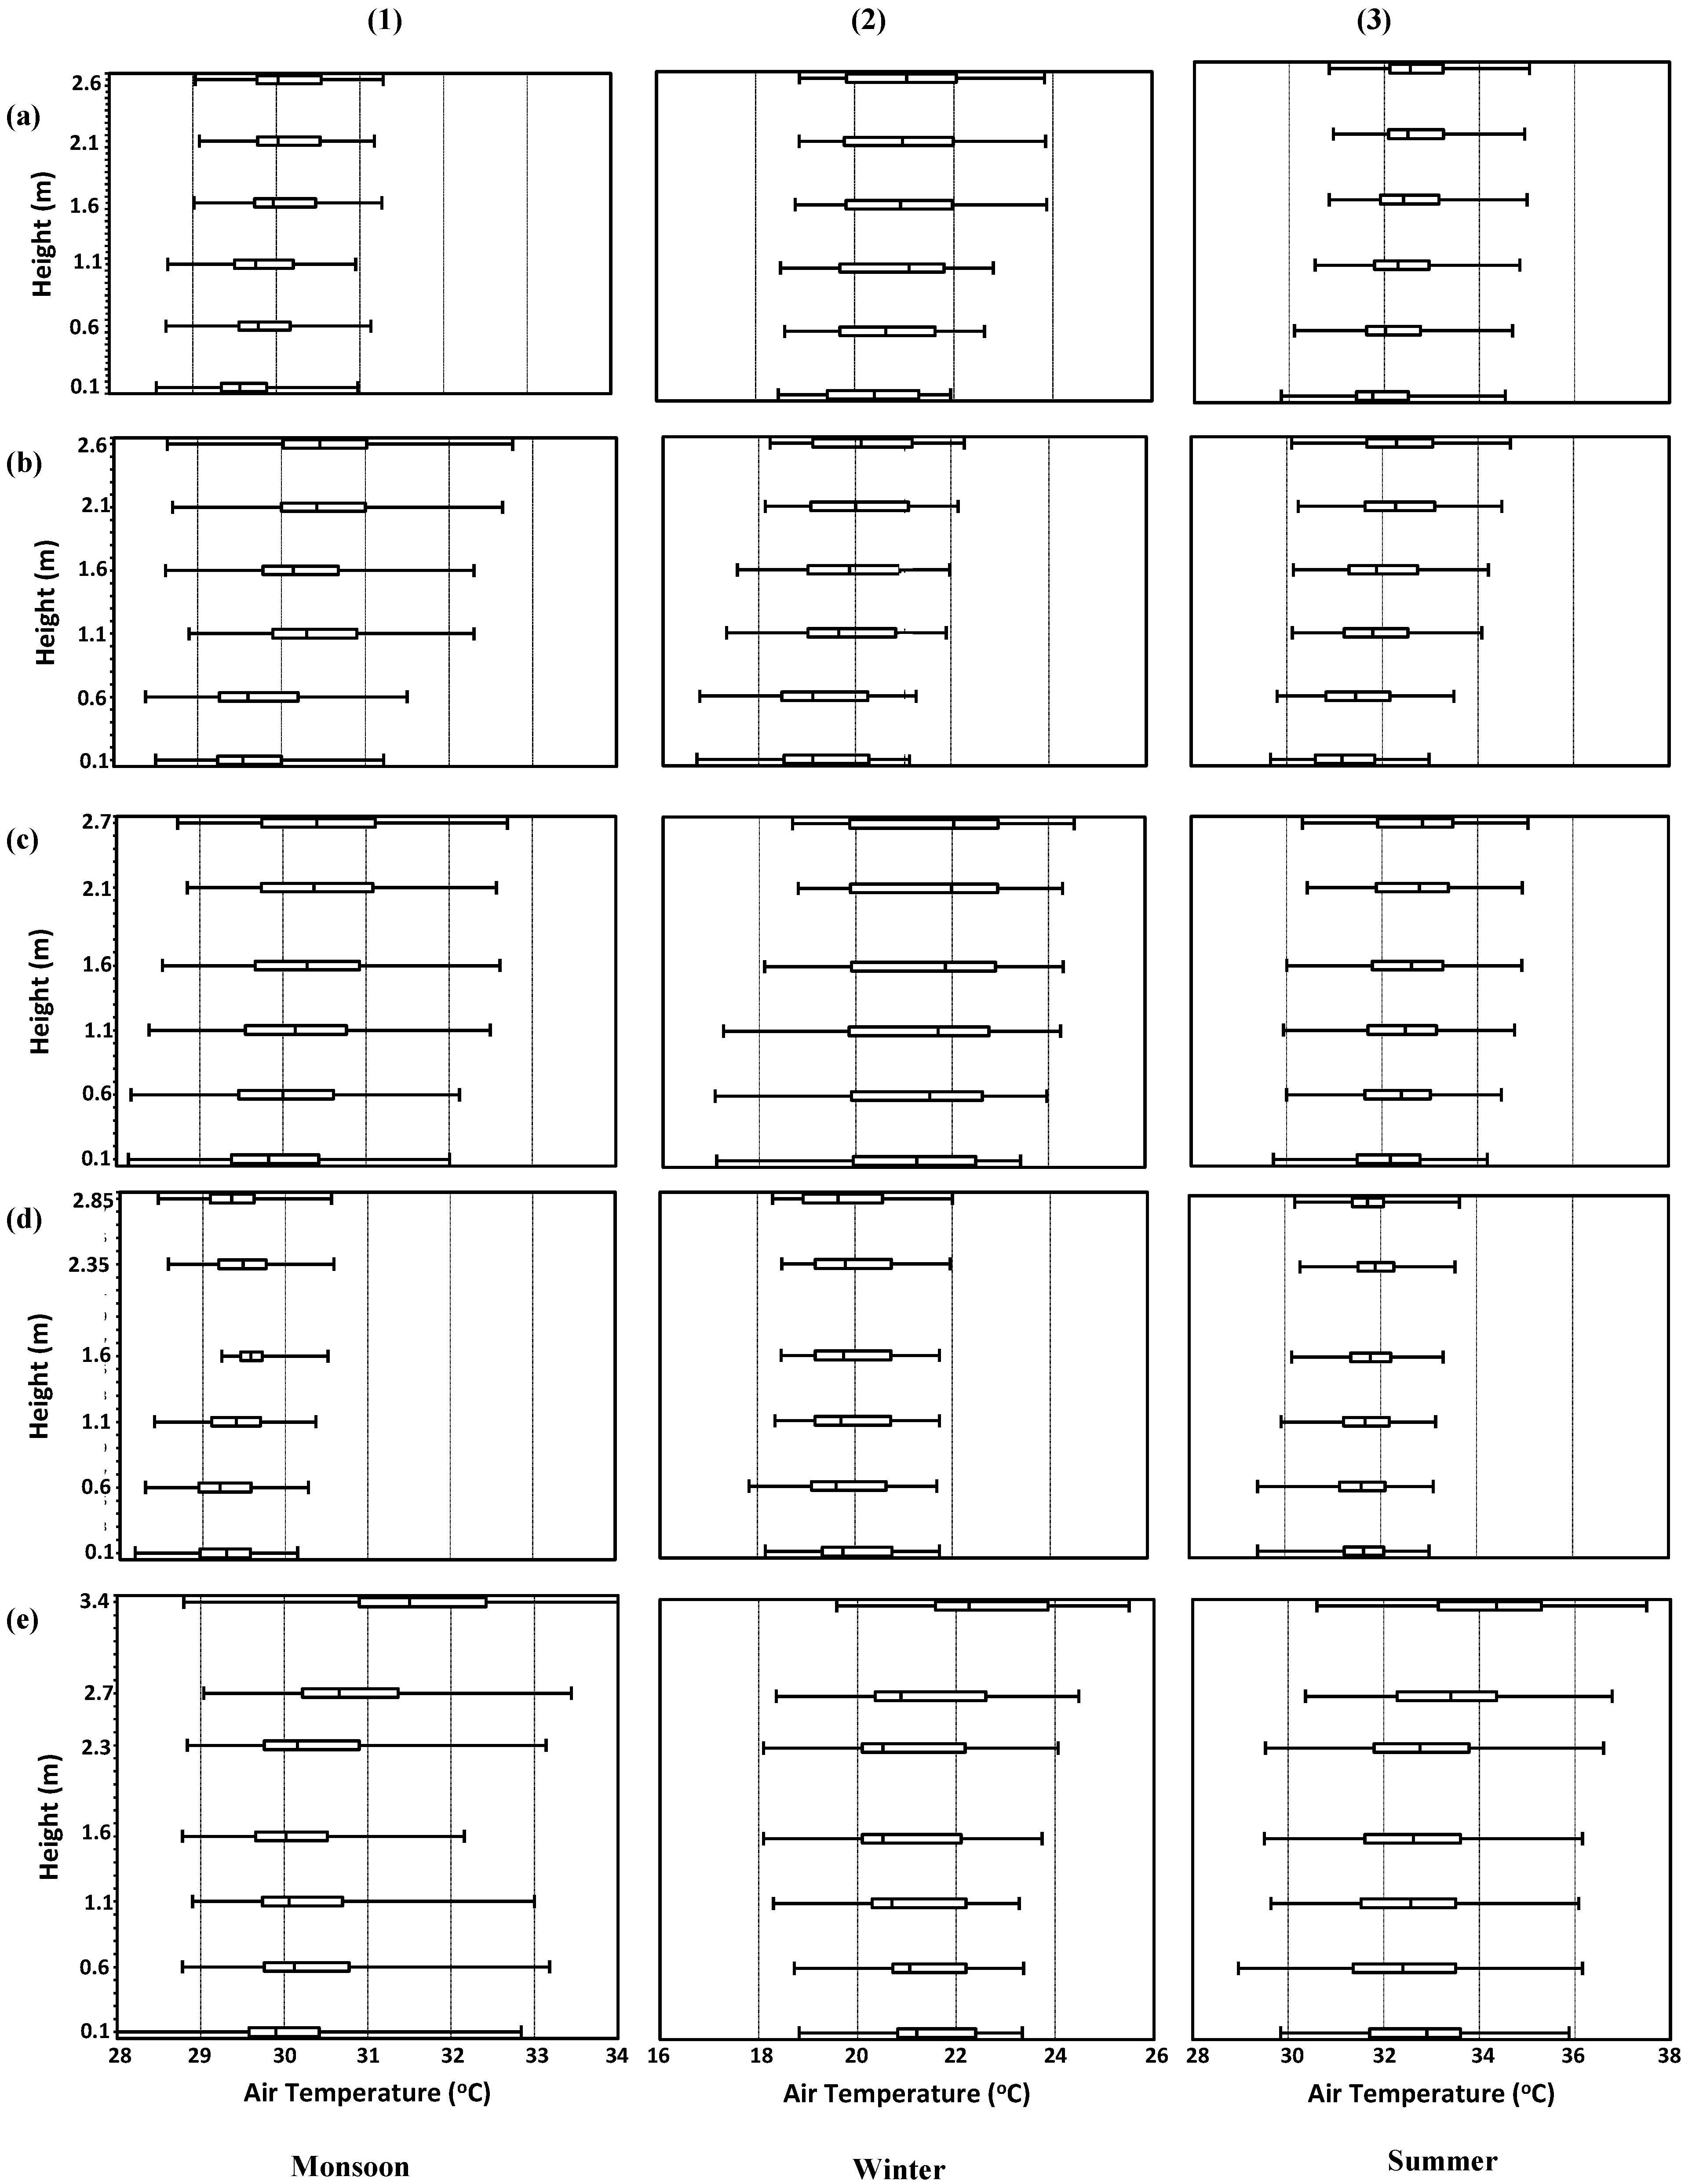
Figure 6 shows typical weather conditions during the measurement periods in the monsoon, winter and summer, respectively, whereas Figure 7, Figure 8 and Figure 9 summarize indoor, semi-outdoor and outdoor thermal conditions of the five case-study houses during the three seasons. Furthermore, Figure 10 summarizes AT at different heights in the living rooms of the five houses seasonally.
Figure 6.
Temporal variations in outdoor conditions in (a1–e1) monsoon, (a2–e2) winter and (a3–e3) summer. (a1–a3) Outdoor air temperature, (b1–b3) Outdoor relative humidity, (c1–c3) Absolute humidity, (d1–d3) wind speed and wind direction, (e1–e3) rainfall periods.
Figure 7.
AT, RH and ST variations in case-study houses (a–e) in monsoon.
Figure 8.
AT, RH and ST variations in case-study houses (a–e) in winter.
Figure 9.
AT, RH and ST variations in case-study houses (a–e) in summer.
Figure 10.
Vertical distribution of air temperature in all case-study houses for (a1–e1) monsoon, (a2–e2) winter and (a3–e3) summer for case study houses (a) House A, (b) House B, (c) House C, (d) House D and (e) House E.
3.1.1. Monsoon
As shown in Figure 6(1) and Figure 7, during the monsoon, outdoor AT rose up to 33 °C during the day while at night, it dropped to 20 °C. On the other hand, outdoor RH fluctuated between 80% and 100%. AT in the living room of House A fluctuated within 32 °C during the day and 28 °C during the night, whereas those in other spaces like the Puja room (room for worship) and dining space fluctuated between 27 and 32 °C throughout the day. In spaces like the master bedroom, AT rose up to 36 °C during the day, primarily because the room was located on the first floor. A similar case can be seen in the adjacent hall. AT in the kitchen rose up to 34 °C, not only during certain points of the day, but also at night, due to cooking activities. Due to the high thermal mass of the house, AT only reduced to 30 °C when not in use. AT in the semi-open space, influenced by the outdoor AT, fluctuated between 34 °C in the daytime and 24 °C during the nighttime. RH in the semi-open space rose to 100% during the nighttime and fell to 87% during the daytime while that in the living room fluctuated between 90% during the day and 80% at night.
Similarly, in House B, AT in the living room fluctuated between 32 °C during the day and 30 °C during the night, and those in other spaces like the Puja room, bedrooms and kitchen fluctuated between 27 and 32 °C. AT in the semi-open space also showed similar profiles with those in House A. The temporal variations in RH also showed similar ranges with those in House A. Meanwhile, House C experienced slightly lower outdoor AT, ranging from 26 to 32 °C, while AT in the semi-open space ranged between 26 and 30 °C. Indoor AT mostly varied between 28 and 30 °C, except for the kitchen, where AT only reduced to 29 °C. The kitchen has only one window and no proper exhaust system. House D, on the other hand, experienced an outdoor AT of 35 °C during the day. Accordingly, AT in the semi-open space had variations from 24 to 33 °C, while AT in the living room had quite a narrow range of 28–30 °C. All the other spaces had similar AT variations from 28 to 31 °C. RH in the living room ranged from 80 to 85%. For House E, outdoor AT ranged from 27 to 30 °C, as the house was surrounded by a green space with thick trees, creating a cool microclimate as seen in [38]. The semi-open AT was between 27 and 31 °C. AT in other indoor spaces ranged from 29 to 31 °C. But as the living room was south-facing, AT went down to just 30 °C at night. Outdoor RH increased to 100% at night and reduced to 90% during the day.
As shown above, overall, in the monsoon, outdoor AT averaged at 24–36 °C with a high RH of approximately 80–100%. Houses A and B had one AC each in their master bedrooms, though Houses C and D did not have ACs. Meanwhile, House E had ACs in all three bedrooms. However, none of the ACs were used during the monsoon. Indoor AT was well stabilized due to the high thermal mass of the houses. As shown in Table 2, all the houses are constructed of brick and concrete, and therefore have a high thermal mass of 7737–30,211 kJ/K. Residents tend to close windows due to the rain and maintain a stable indoor AT, ranging from 24 to 32 °C in all the houses. ST of the walls was further stabilized than the ambient AT, ranging from 28 to 31 °C across the five houses. AT in semi-open spaces was slightly lower in House D compared with other houses as the house was surrounded by trees. However, indoor AT differences among houses were negligible, up to 2 °C. Extremely high humidity conditions prevailed across all the houses during the monsoon. House A had a lower range of RH than the other houses, due to the absence of green spaces around the house (Figure 3A).
Similar temperature gradients can be seen in the vertical distributions of AT in all houses except for House D (Figure 10(1)). In particular, AT near the ceiling was relatively high with an average of 32 °C in House E as the house was a single-story bungalow, indicating relatively poor insulation performance of the roof construction. The living room of House D was well shaded by the semi-outdoor space, i.e., porch. The east-facing porch as well as upstairs played a role as thermal buffers to help maintain relatively lower indoor AT throughout the season. Furthermore, House D has a relatively large thermal mass of 16,267 kJ/K, but it has relatively large openings with the glazing ratio of 0.3. This could be a reason for the reduced vertical gradient while maintaining relatively lower AT in House D.
3.1.2. Winter
As shown in Figure 6(2) and Figure 8a, in the winter, outdoor AT of House A fluctuated from 23 °C during the day to 12 °C at night, while the semi-open space had AT variations between 16 and 20 °C. Corresponding to that, AT in the living room had no abrupt fluctuations, averaging at 20–23 °C. The rooms on the first floor had AT between 19 and 24 °C, while spaces on the ground floor had AT variations between 20 and 23 °C, except for the kitchen, which was 20–24 °C due to cooking activities. Outdoor RH was 90% at night, while it was about 60% during the day. Semi-open RH fluctuated between 70 and 87%, and RH in the living room averaged at 55–75%. AT in the living room was between 20 and 22 °C at a height of 2.6 m (Figure 10(a2)). In House B (Figure 8b), AT in the living room rose to 24 °C during the day at 1.1 m, while at night, it reduced to 20 °C, while the surface temperature ranged between 18 and 20 °C. At the same time, AT at 2.6 m height remained at 22 °C (Figure 10(b2)). Bedroom 1 had a relatively stable temperature from 21 to 23 °C due to the lack of openings to the outdoors. In the kitchen, due to cooking activities, AT rose up to 24 °C during the day. In House B, RH in the outdoor and semi-open space was almost the same as House A, ranging between 65 and 70%.
House C experienced a slightly lower outdoor AT of 20 °C during the daytime and 15 °C at night as indicated in Figure 8c. Corresponding to that, the other spaces had AT variations between 19 and 23 °C, while AT at 2.7 m in the living room rose to 26 °C (Figure 10(c2)). Outdoor RH ranged from 62 to 97%. RH in the living room was comparatively lower than that of the former two houses, ranging between 50% and 62%. For House D (Figure 8d), outdoor AT went down to 14 °C at night due to the presence of greenery on all three sides. AT in the semi-open space varied from 15 to 19 °C. The other spaces in the house had minimal variations between 19 and 20 °C. Due to greater ceiling height and the quick dissipation of the hot air, AT at 2.85 m in the living room ranged between 18 and 20 °C (Figure 10d). The surface temperature of the wall also went down to 17.4 °C. RH in both outdoor and semi-open spaces fluctuated between 80% and 100%; in the living room, it averaged between 65% and 80%. House E had the same outdoor AT fluctuations, as shown in Figure 8e. Semi-open AT ranged from 24 °C during the daytime to 17 °C during the nighttime, while the other indoor spaces had AT ranging from 22 to 24 °C. Outdoor RH went down to 40% at nighttime, and RH in the living room ranged between 55 and 60. Like House D, House E had huge lawns and trees at the end of the garden on the northern side; thus, AT was reduced to about 14 °C at night.
Overall, outdoor AT averaged at 16–20 °C in the winter with a high RH of approximately 40–100% (Figure 6(2) and Figure 8). During this season, the houses did not use ACs and ceiling fans. Like the monsoon season, indoor AT was well stabilized due to the high thermal mass and low glazing ratios. The residents tend to close windows at night. Indoor AT had quite a narrow range between 20 and 23 °C in all houses. AT in open spaces was slightly lower in Houses D and E compared with other houses due to the presence of the surrounding trees and shrubs. In the vertical distributions (Figure 10(2)), AT ranges are lower than those of the monsoon, but the vertical AT profiles among the five houses are almost the same as those of the monsoon.
3.1.3. Summer
As shown in Figure 6(3) and Figure 9a, during the summer, in House A, outdoor AT alarmingly increased up to 45 °C during the daytime, while at night, it reduced to 25 °C, as the house was closely surrounded by buildings on all sides. AT in the semi-open space fluctuated between 28 and 43 °C. AT in the living room was steady between 32 and 35 °C. ST of the walls fluctuates between 31 and 32 °C, but at times, it goes up to 33.5 °C. The other spaces on the ground floor had AT between 30 and 32 °C. AT of the rooms on the first floor rose to 36 °C. AT in the master bedroom went down to 26 °C during the day due to the use of AC in the room, although the ceiling fans were not used during the daytime (Figure 9a). Outdoor RH during the summer varied between 60% and 90%, semi-open RH varied between 75% and 85% and in the living room, it fluctuated between 55% and 65%. In House B, semi-open AT varied between 28 and 40 °C. Unlike House A, in House B, AT in the living room was as high as 32–34 °C, with an ST of 30–32 °C. In the other rooms, AT ranged between 30 and 32 °C, while AT in the master bedroom went down to 28 °C due to the use of AC (Figure 9b). AT in bedroom 1 also went down to 28 °C while the occupants used the cube AC in the master bedroom, by keeping the doors and windows open between the two rooms. In the living room, RH ranged between 70% and 75%. In House C, outdoor AT fell to 28 °C, due to the floor and the surrounding walls being completely lined with cement, having a high thermal mass. In the semi-open space, AT varied between 27 and 34 °C, while the other spaces had relatively higher AT, ranging between 32 and 34 °C. Outdoor RH ranged between 45 and 80%, while in the living room, RH ranged from 60 to 75. D had an indoor AT of 29–30 °C, except for the kitchen, where AT rose to 32 °C. Outdoor RH varied from 40 to 100%, while in the semi-open space, RH varied from 75 to 90% and RH in the living room ranged from 60 to 70%.
On the other hand, House E showed a different condition, where outdoor AT rose to 35 °C during the day and reduced to 25 °C at night, which was 4 °C lower than the other houses, due to the presence of trees around the houses (Figure 9e). Semi-open AT varied between 30 and 33 °C, whereas that in the living room varied between 31 and 33 °C, the walls of which had ST ranging between 31 and 34 °C. The other indoor spaces in House E generally experienced 32–33 °C, except AT in the master bedroom, which dropped to 28 °C due to the use of AC. In the other rooms with ACs, AT dropped down to 26 °C while they were in use. Outdoor RH increased to 100% at night but reduced to 40% in the daytime. RH in semi-open spaces and the living room generally varied between 60 and 80%.
Summer showed a fluctuating condition where the range of outdoor AT averaged at 25–45 °C with a high RH of approximately 40–100% (Figure 6(3) and Figure 9). The houses used the ACs and ceiling fans during this season, both at times. Indoor AT was well stabilized due to the thermal mass effects. The residents tend to close windows during the day to keep indoor AT lower, but at night when not using the AC, open the windows. Indoor AT has resulted in quite a narrow range of 30–32 °C in all houses. The master bedroom of all the houses, at the hottest times of the day, went down to 24–28 °C due to the use of AC and ceiling fans. In House A, AT in the living room, at times, went down to 25 °C due to the use of the air cooler inside the room while it was occupied. House E had a higher thermal mass than all the other houses, which led to its indoor AT ranging between 32 and 33 °C.
As most occupants closed windows during the daytime to avoid the extreme hot outdoor air from entering, indoor ATs were further stabilized throughout the day as shown in the vertical distributions (Figure 10(3)). High ceilings are considered to be an effective passive design option to thermally stratify the indoor air to secure relatively lower AT at the occupied level, i.e., around 1.1 m above the floor, but the summer conditions do not allow indoor ATs to maintain the comfort levels sufficiently.
3.2. Psychrometric Analysis
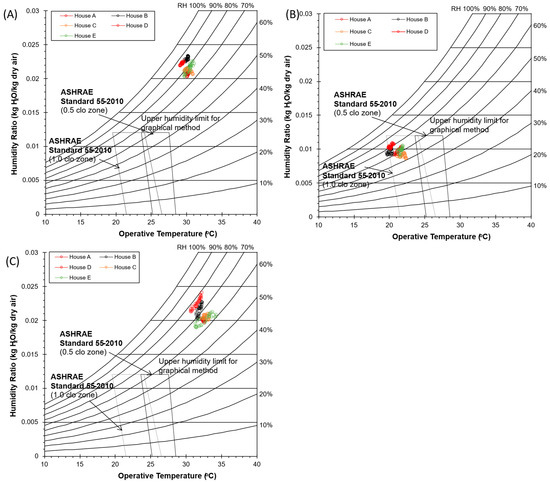
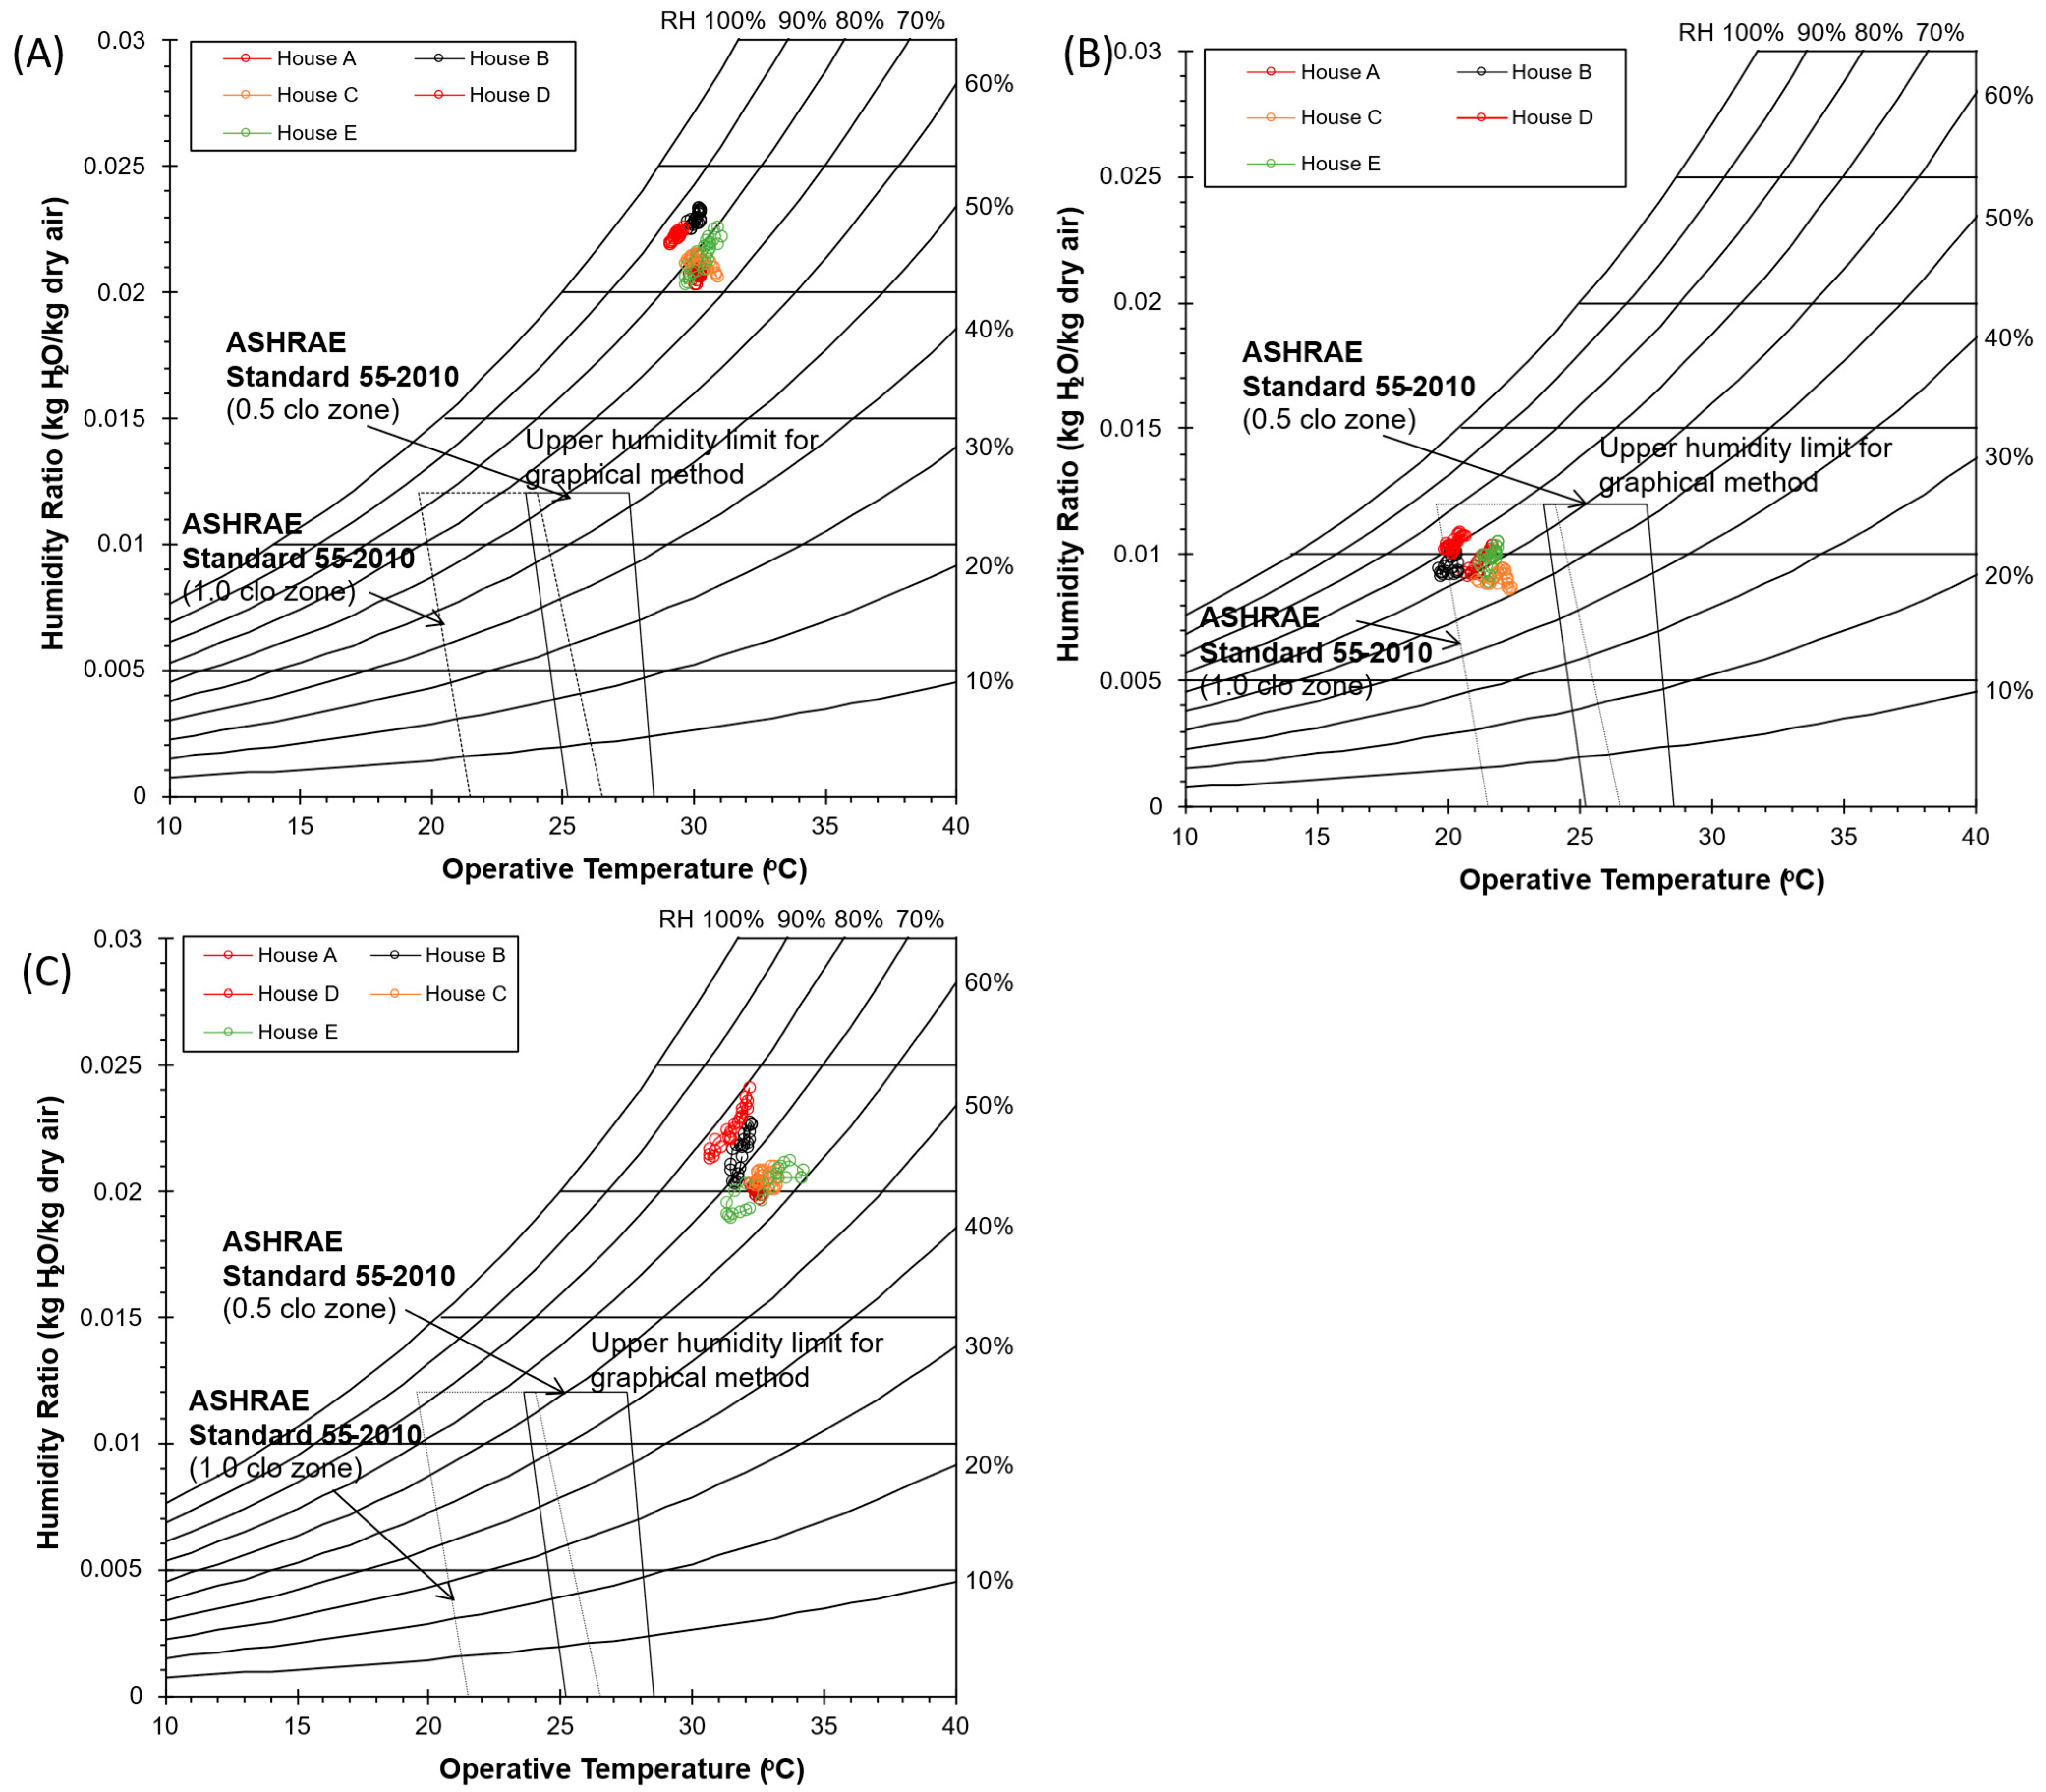
We conducted the thermal comfort evaluation in two steps. Figure 11 presents the results of psychrometric analysis for the living rooms of the five houses in three seasons. Hourly average OT was used for the thermal comfort evaluation, where the comfort zone with 0.5 clo and 1.0 clo are portrayed. As OT is used, the effects of sweat-evaporation primarily enhanced by the increased wind speed are not taken into account in the thermal comfort evaluation for the first step.
Figure 11.
Psychrometric analysis for (A) monsoon, (B) winter and (C) summer in the living room of all the houses.
As shown, overall, both the house-wise differences and diurnal differences are much smaller than the seasonal differences. The house-wise differences in OT were approximately 1–2 °C throughout the three seasons, whereas the diurnal differences ranged from 0.5 to 3 °C on average. Nevertheless, the indoor and outdoor thermal conditions significantly vary, depending on the seasons.
During the monsoon, outdoor AT fluctuated between 24 and 33 °C, and thus, indoor AT ranged from 28 to 32 °C throughout the day. Rain prevails during this season, and therefore, AH was very high in both outdoors and indoors, ranging from 0.02 to 0.025 kg/kg′ with continuous high RH levels of 80–100% (Figure 11A). As a result, thermal conditions of all houses are far from the ASHRAE comfort zone (0.5 clo) throughout the day. Sufficient air movement is required to compensate the thermal comfort instead of these hot and humid conditions. It is also important to consider the potentials of dampness and health effects caused by the continuous humid conditions.
Outdoor AT dropped to approximately 12–23 °C in the winter and OT of all the houses were lowered accordingly, ranging from 19 to 25 °C with RH of 40–60% (Figure 11B). Thus, OT of all houses almost fully falls within the 1.0 clo comfort zone throughout the day. This implies that the stabilized indoor thermal conditions in the current modern houses of high thermal mass are generally able to achieve thermal comfort without relying on mechanical means under the moderate winter climate. The National Building Code of India suggests an indoor AT of between 21 and 23 °C in winters [6]. Thus, indoor AT within the houses come within the range of this threshold at certain times of the day.
During the summer, as outdoor AT increased rapidly, indoor OT of all houses increased to 30–35 °C with an RH of 60–80% (Figure 11C). This resulted in far beyond the comfort zone (0.5 clo). During the daytime peak hours, indoor OT was generally 5–7 °C lower than the outdoors in all the houses with closing windows due to the structural cooling effects caused by the high thermal mass. However, the resultant indoor OT was still too high to reach the required comfort levels, requiring additional cooling via either passive or active means. Such structural cooling could worsen the thermal conditions during the nighttime instead. OT ranged from approximately 30–32 °C during the nighttime in all the houses, which were about 2–4 °C higher than the outdoors. According to the National Building Code of India, the indoor air temperature should range between 23 and 26 °C for all climatic zones in summer [6]. In this case, indoor AT of the houses exceeds far beyond this threshold.
4. Discussion
4.1. Thermal Comfort Evaluation Using SET*
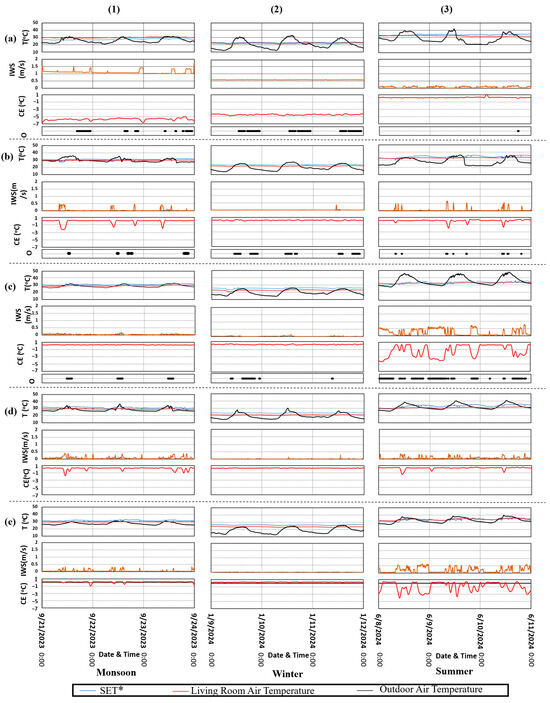
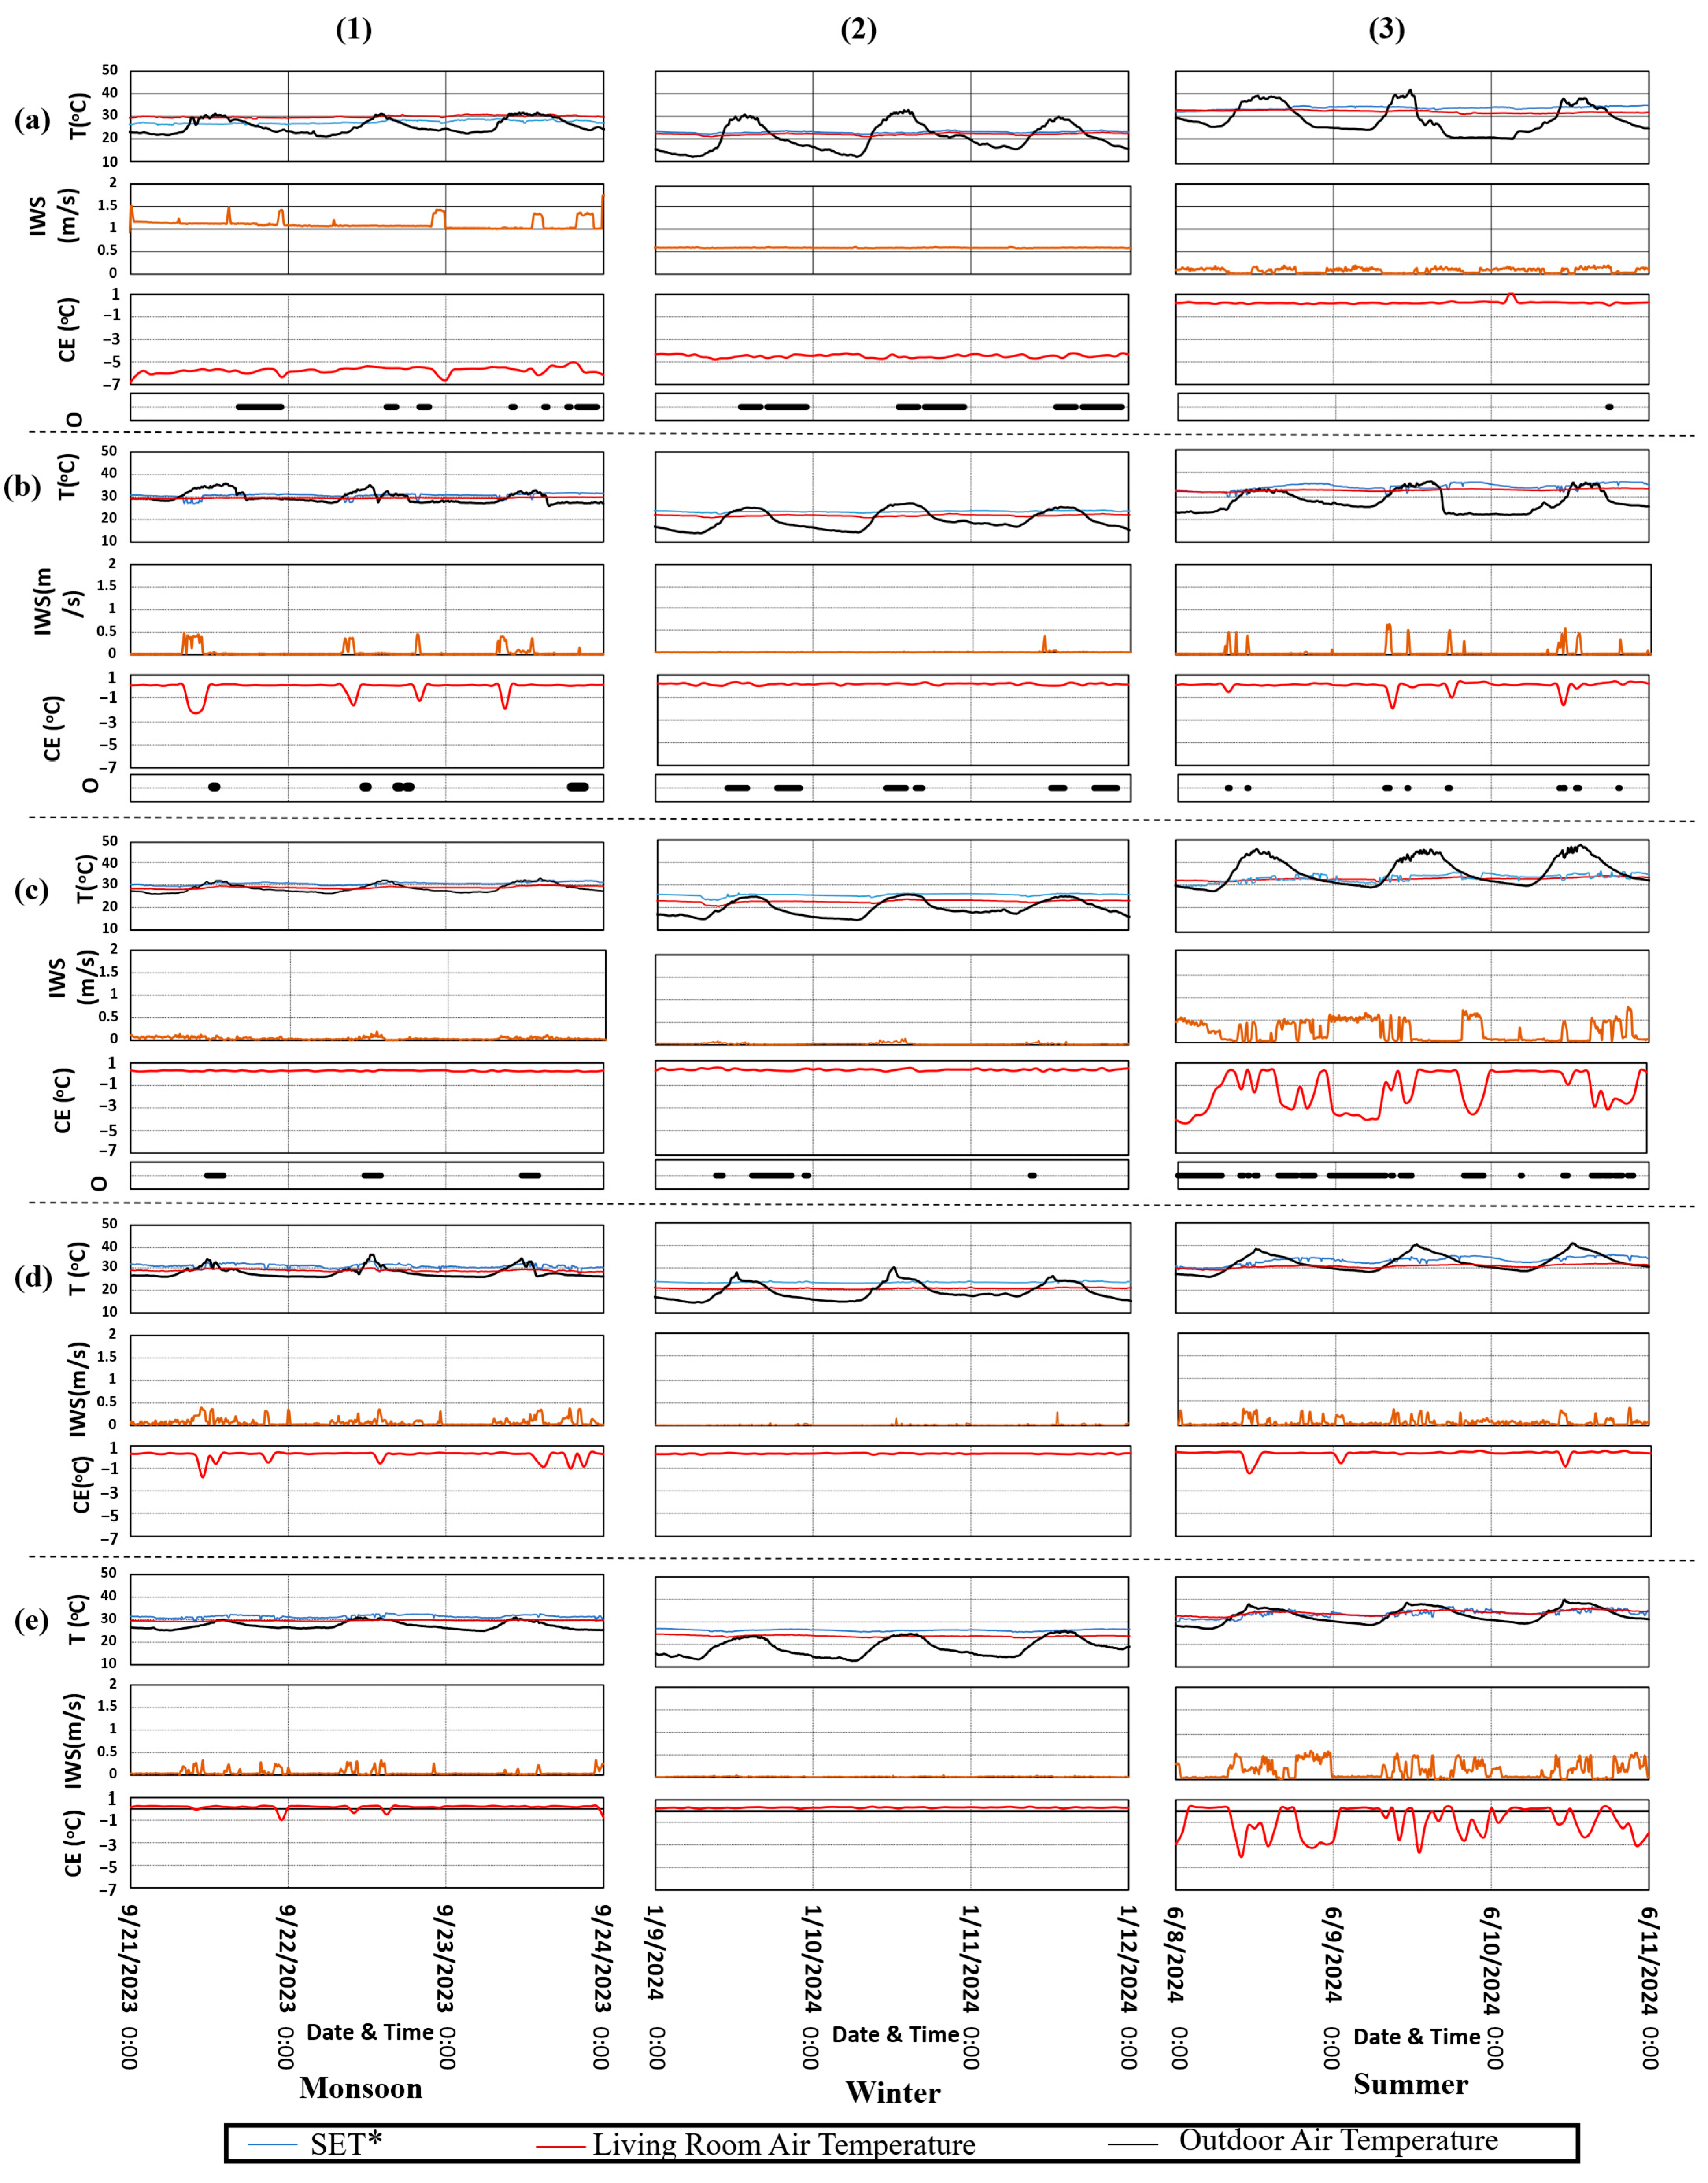
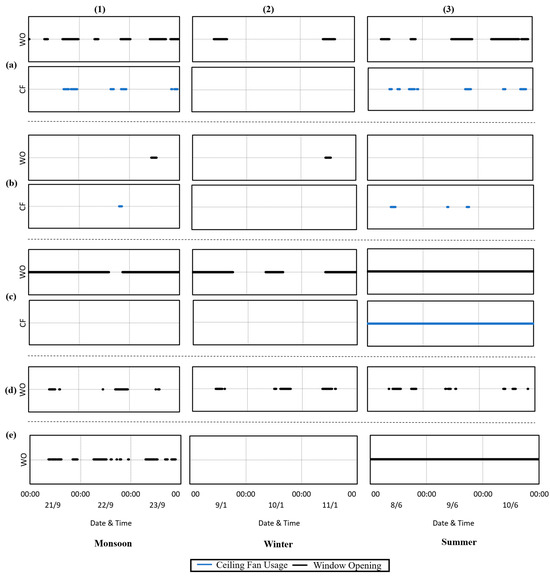
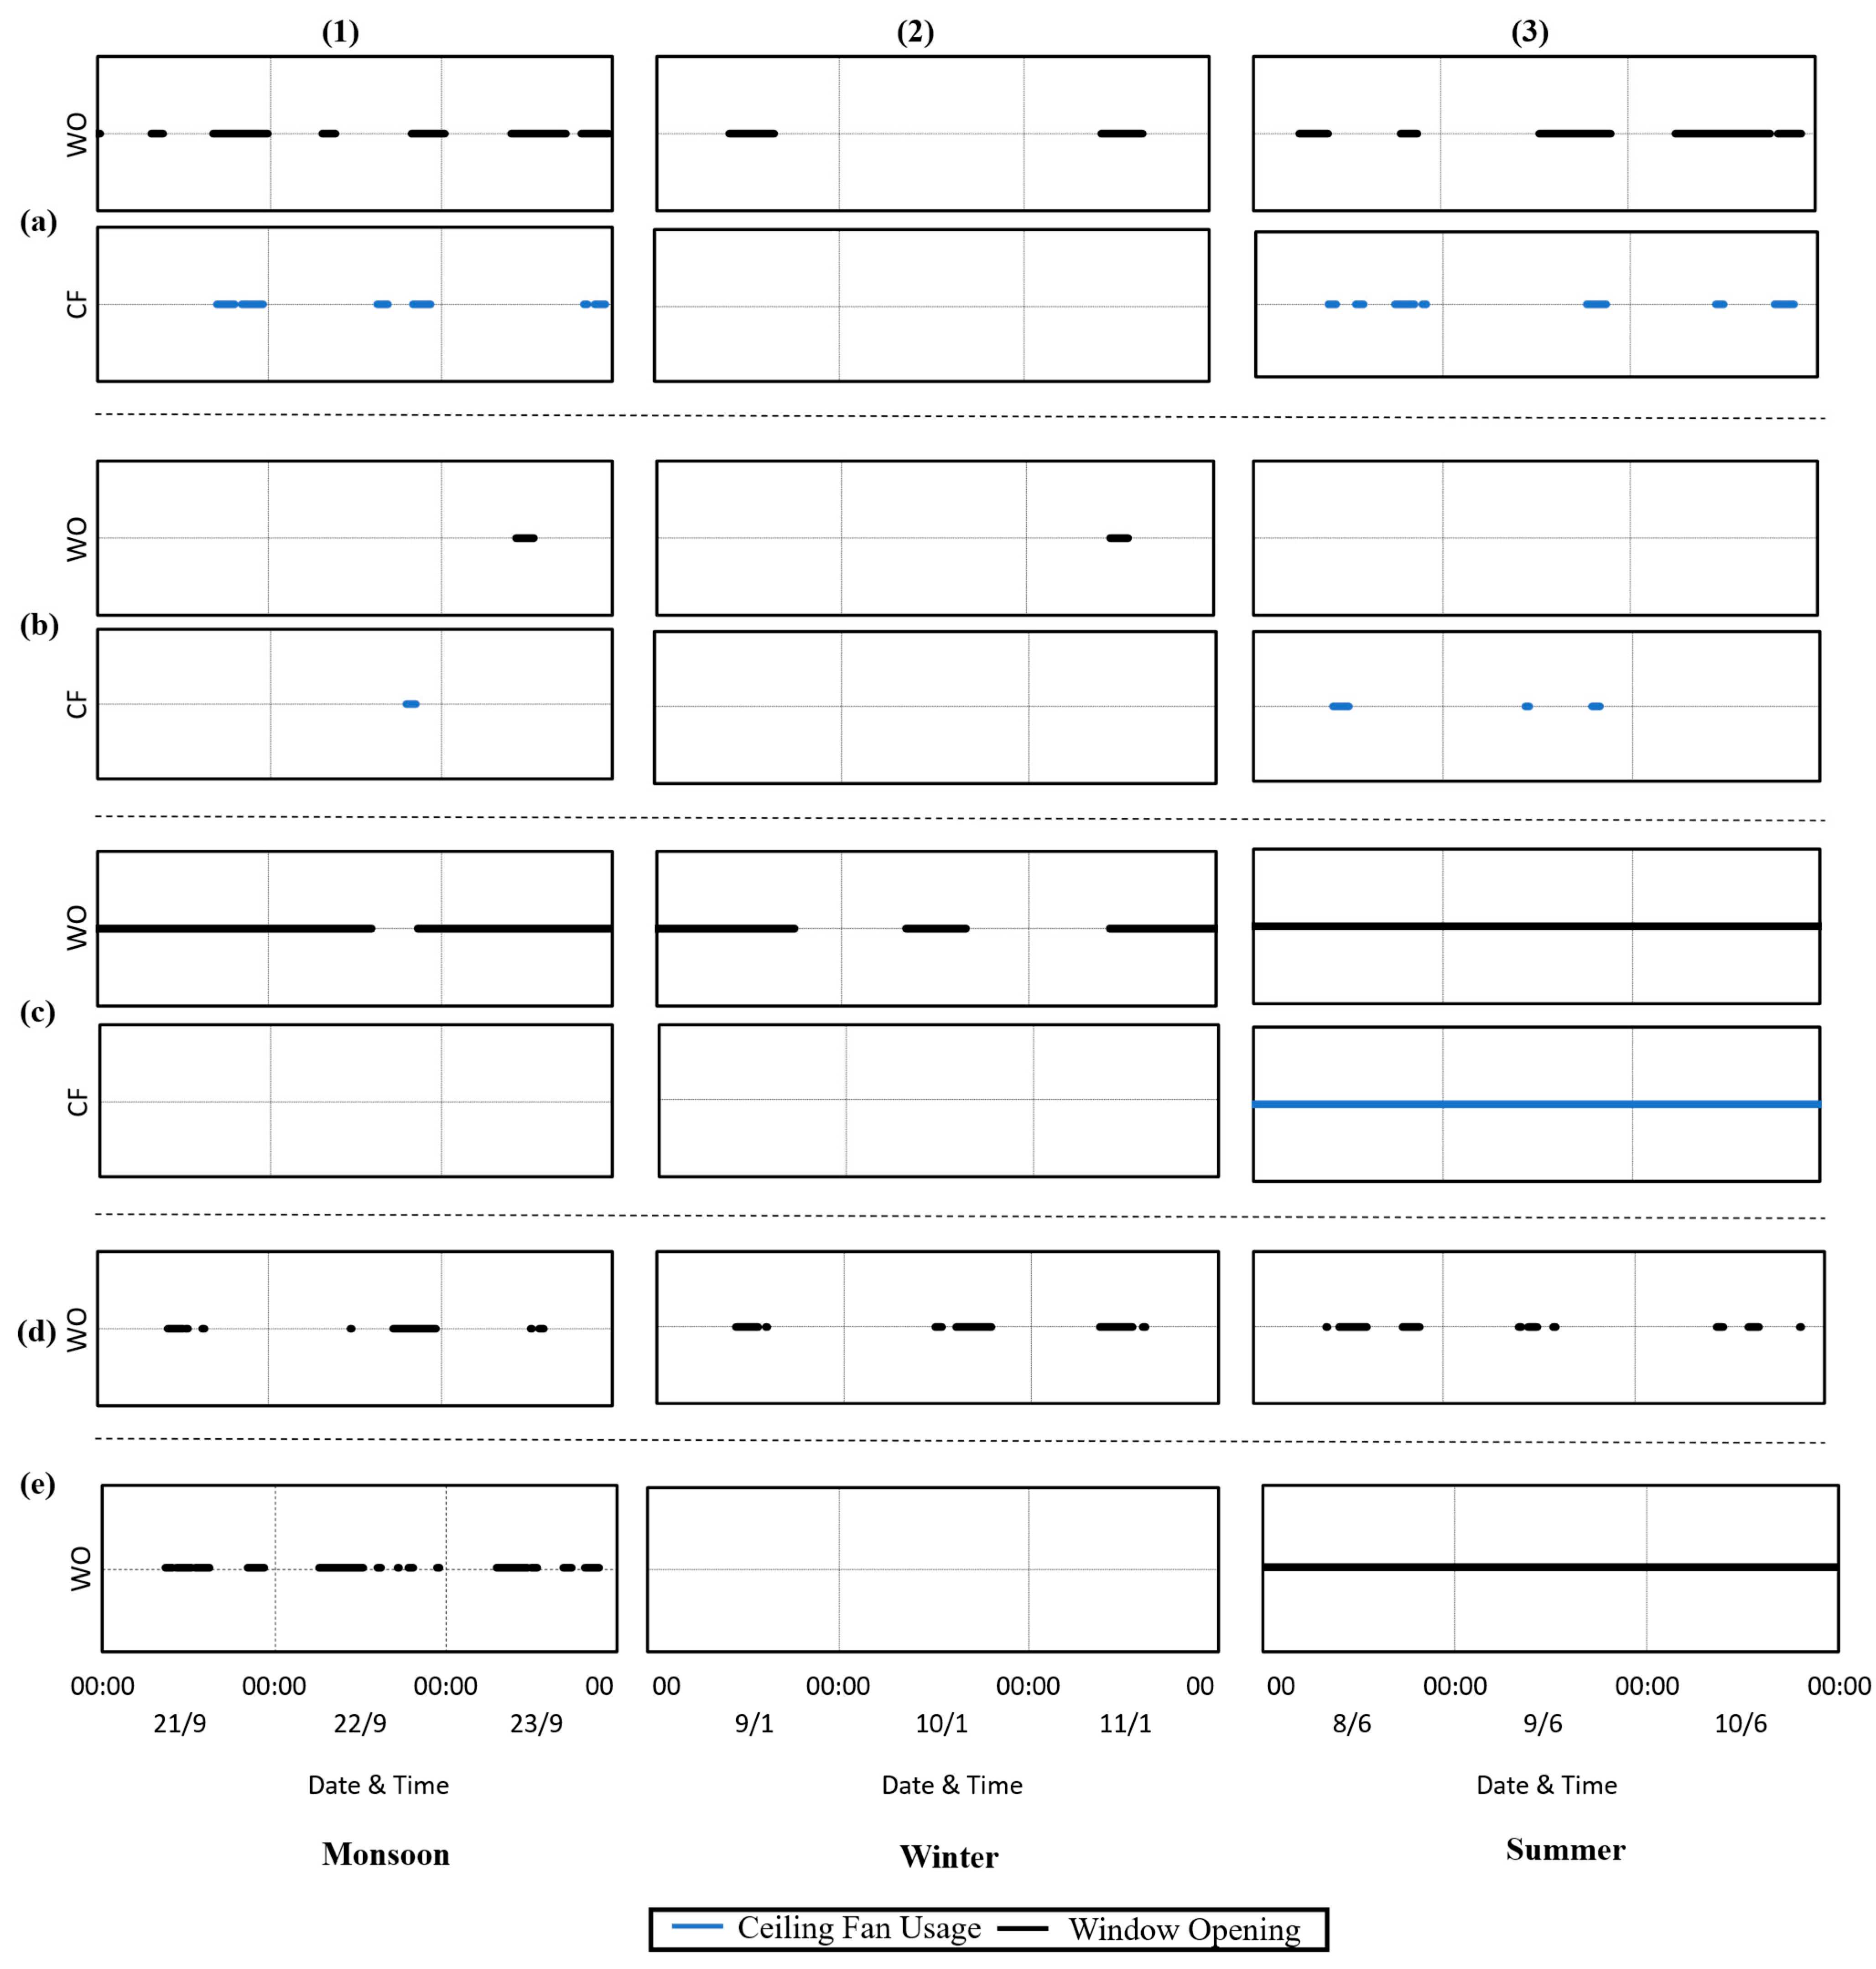
As the second step of the thermal comfort evaluation, Figure 12 presents the variations in SET* over the typical consecutive three days across different houses and seasons, illustrating how the increased air speeds influenced indoor thermal comfort. Figure 13 shows the occupant behavior of window and ceiling fan usage variations during the same periods seasonally.
Figure 12.
Temporal variations in SET* with AT in the outdoors and living room, indoor wind speed (IWS), the cooling effect (CE) of the elevated wind speed and occupancy (O) in (1) monsoon, (2) winter and (3) summer for houses (a–e). Occupancy data is only available for Houses A, B and C.
Figure 13.
Window opening (WO) and ceiling fan (CF) usage patterns for all the case-study houses for monsoon (a1–e1), for winters (a2–e2) and for summers (a3–e3).
4.1.1. Monsoon
As shown in Figure 12(1), during the monsoon, House A experienced SET* between 25 and 30 °C, as the indoor wind speed was between 1 and 1.5 m/s due to the continuous use of air coolers and the intermittent use of ceiling fans at the same time within the living room. The elevated wind speeds reduced the SET* by 5 to 6 °C. The windows were also open during the evening and nighttime, promoting structural cooling (Figure 13a(1)). Previous studies confirmed that the night ventilation could be effective in reducing daytime indoor temperature of the next day even in hot–humid climates such as in Malaysia [35]. In House B, the SET* varied between 30 and 33 °C, but during certain times of the day, it reduced to 28 °C due to the increased indoor wind speed to 0.5 m/s by the ceiling fans (Figure 12b(1)). Thus, the elevated wind speed at those parts of the day helped decrease the SET* by 2 °C. The living room in House C experienced SET* like that in House B. However, compared with other houses, the air speed remained constant at less than 0.2 m/s due to not using the ceiling fan, mainly due to non-occupancy. Thus, the cooling effect is rarely seen in the room, at times increasing the SET* within the room by 0.2–0.3 °C. The residents rarely occupied the living room in House C due to such conditions, and they mostly continued their activities in the other rooms. The occupants moved to cooler rooms or perhaps semi-outdoor spaces for their activities, as reported in a previous study [12]. In House D, the living room had SET*, ranging between 26 and 30 °C, while AT dropped to 28 °C. As the living room was adjoined to the semi-open space of the house, with proper wind ventilation during the nighttime and occasional use of the ceiling fan, the indoor wind speed varied between 0.2 and 0.5 m/s at specific parts of the day (mainly between 10:00 a.m.–12:00 p.m.), thus having a cooling effect of about 1 °C. In House E, the living room had SET* up to 35 °C. Due to good cross ventilation of the living room, the internal wind speed rose to 0.3 m/s during the nighttime, leading to a reduced SET* by 0.5 °C at times.
The above results suggest that enhanced wind speeds could aid the indoor thermal comfort even in the hot–humid monsoon season. However, the living rooms of most houses, which are typical modern houses, could not fully utilize the wind-driven cross ventilation as the rooms were not equipped with multiple-sided openings. These conditions are contrary to the open-design traditional houses [29]. As seen in House A, mechanical means such as fans and/or air coolers would be required to enhance the indoor wind speeds to achieve the required thermal comfort during this season. Otherwise, well shaded and ventilated semi-open spaces could be a better option for daily activities under the hot–humid conditions.
4.1.2. Winter
As indoor OT was sufficiently lowered until the required comfort levels as shown in Figure 11B, few households used mechanical cooling such as ceiling fans, while occasionally opening their windows during the winter (Figure 13(2)). House A consistently demonstrated a cooling effect due to natural ventilation during the daytime, with wind speeds reaching 0.6 m/s. In contrast, the other houses showed minimal or no indoor air movement, leading to a slightly higher SET* of approximately 1–2 °C than the corresponding AT, also due to the extremely humid conditions. Especially when the windows were closed during this season, indoor AT was stabilized further due to the high thermal mass of the buildings and fell within the comfort range during most periods of the day. A relatively airtight and high thermal mass building could be thermally applicable for the given winter conditions, although dampness and relevant health problems should be considered, on the other hand.
Building dampness is one of the causes of indoor-air-quality (IAQ) problems in various countries [49,60,61,62,63]. IAQ problems have been thoroughly associated with numerous adverse health symptoms, particularly of the respiratory system, including (1) aggravation of asthma; (2) increased occurrence of wheezing, coughing and other respiratory symptoms; (3) increased rate of upper respiratory infections and (4) irritation of airways [60]. Intermediate flood incidents and high humid weather conditions are often ideal for indoor mold growth, imposing severe concerns about the possible adverse direct and indirect health effects associated with indoor mold exposure [64].
4.1.3. Summer
In summer, the living room in House A had nominal usage, where the ceiling fan and air cooler were not used, but occupants opened windows at night or late evening, leading to an indoor wind speed of 0.3 m/s at specific parts of the day (Figure 12a(3) and Figure 13a(3)). Correspondingly, the SET* increased by 0.5–1 °C compared with the corresponding AT, resulting in 30–35 °C. House B had the same range of SET*. However, during the occupancy of the living room, the ceiling fan was used, thus increasing the indoor wind speed to 0.5 m/s. At those times of the day, the SET* was reduced by 1–1.5 °C (Figure 12b(3)). Similar SET* results can be seen in House C, where the increase in indoor wind speed of 0.5 m/s using the ceiling fan resulted in the reduction in SET* by 3–5 °C. In House D, the ceiling fan was used during the occupancy, and the indoor wind speed varied between 0 and 0.4 m/s, leading to SET* being reduced by 1–2 °C. In House E, the SET* remained between 30 and 33 °C, where two ceiling fans were used (Figure 12e(3)) with the wind speed up to 0.5 m/s, resulting in the reduction in SET* by 3–4 °C. As discussed before, few occupants used the living rooms, except for House C, because of the severe indoor climates (Figure 12(3)). Most occupants moved to cooler rooms. Even when mechanical cooling such as fans were used, daytime SET* rarely dropped to 30 °C during this season.
4.2. Cooling Effects of Wind Speed
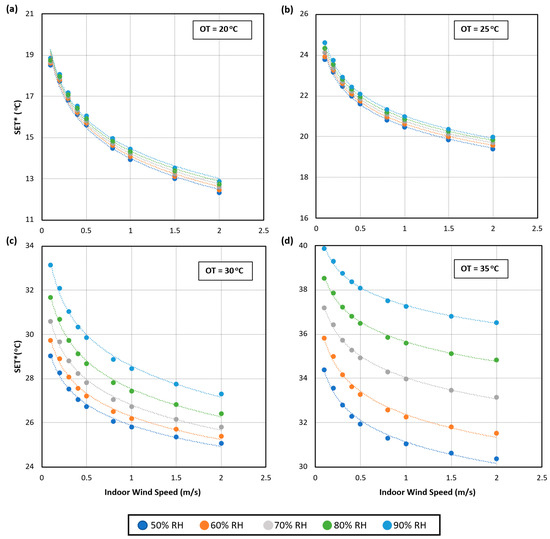
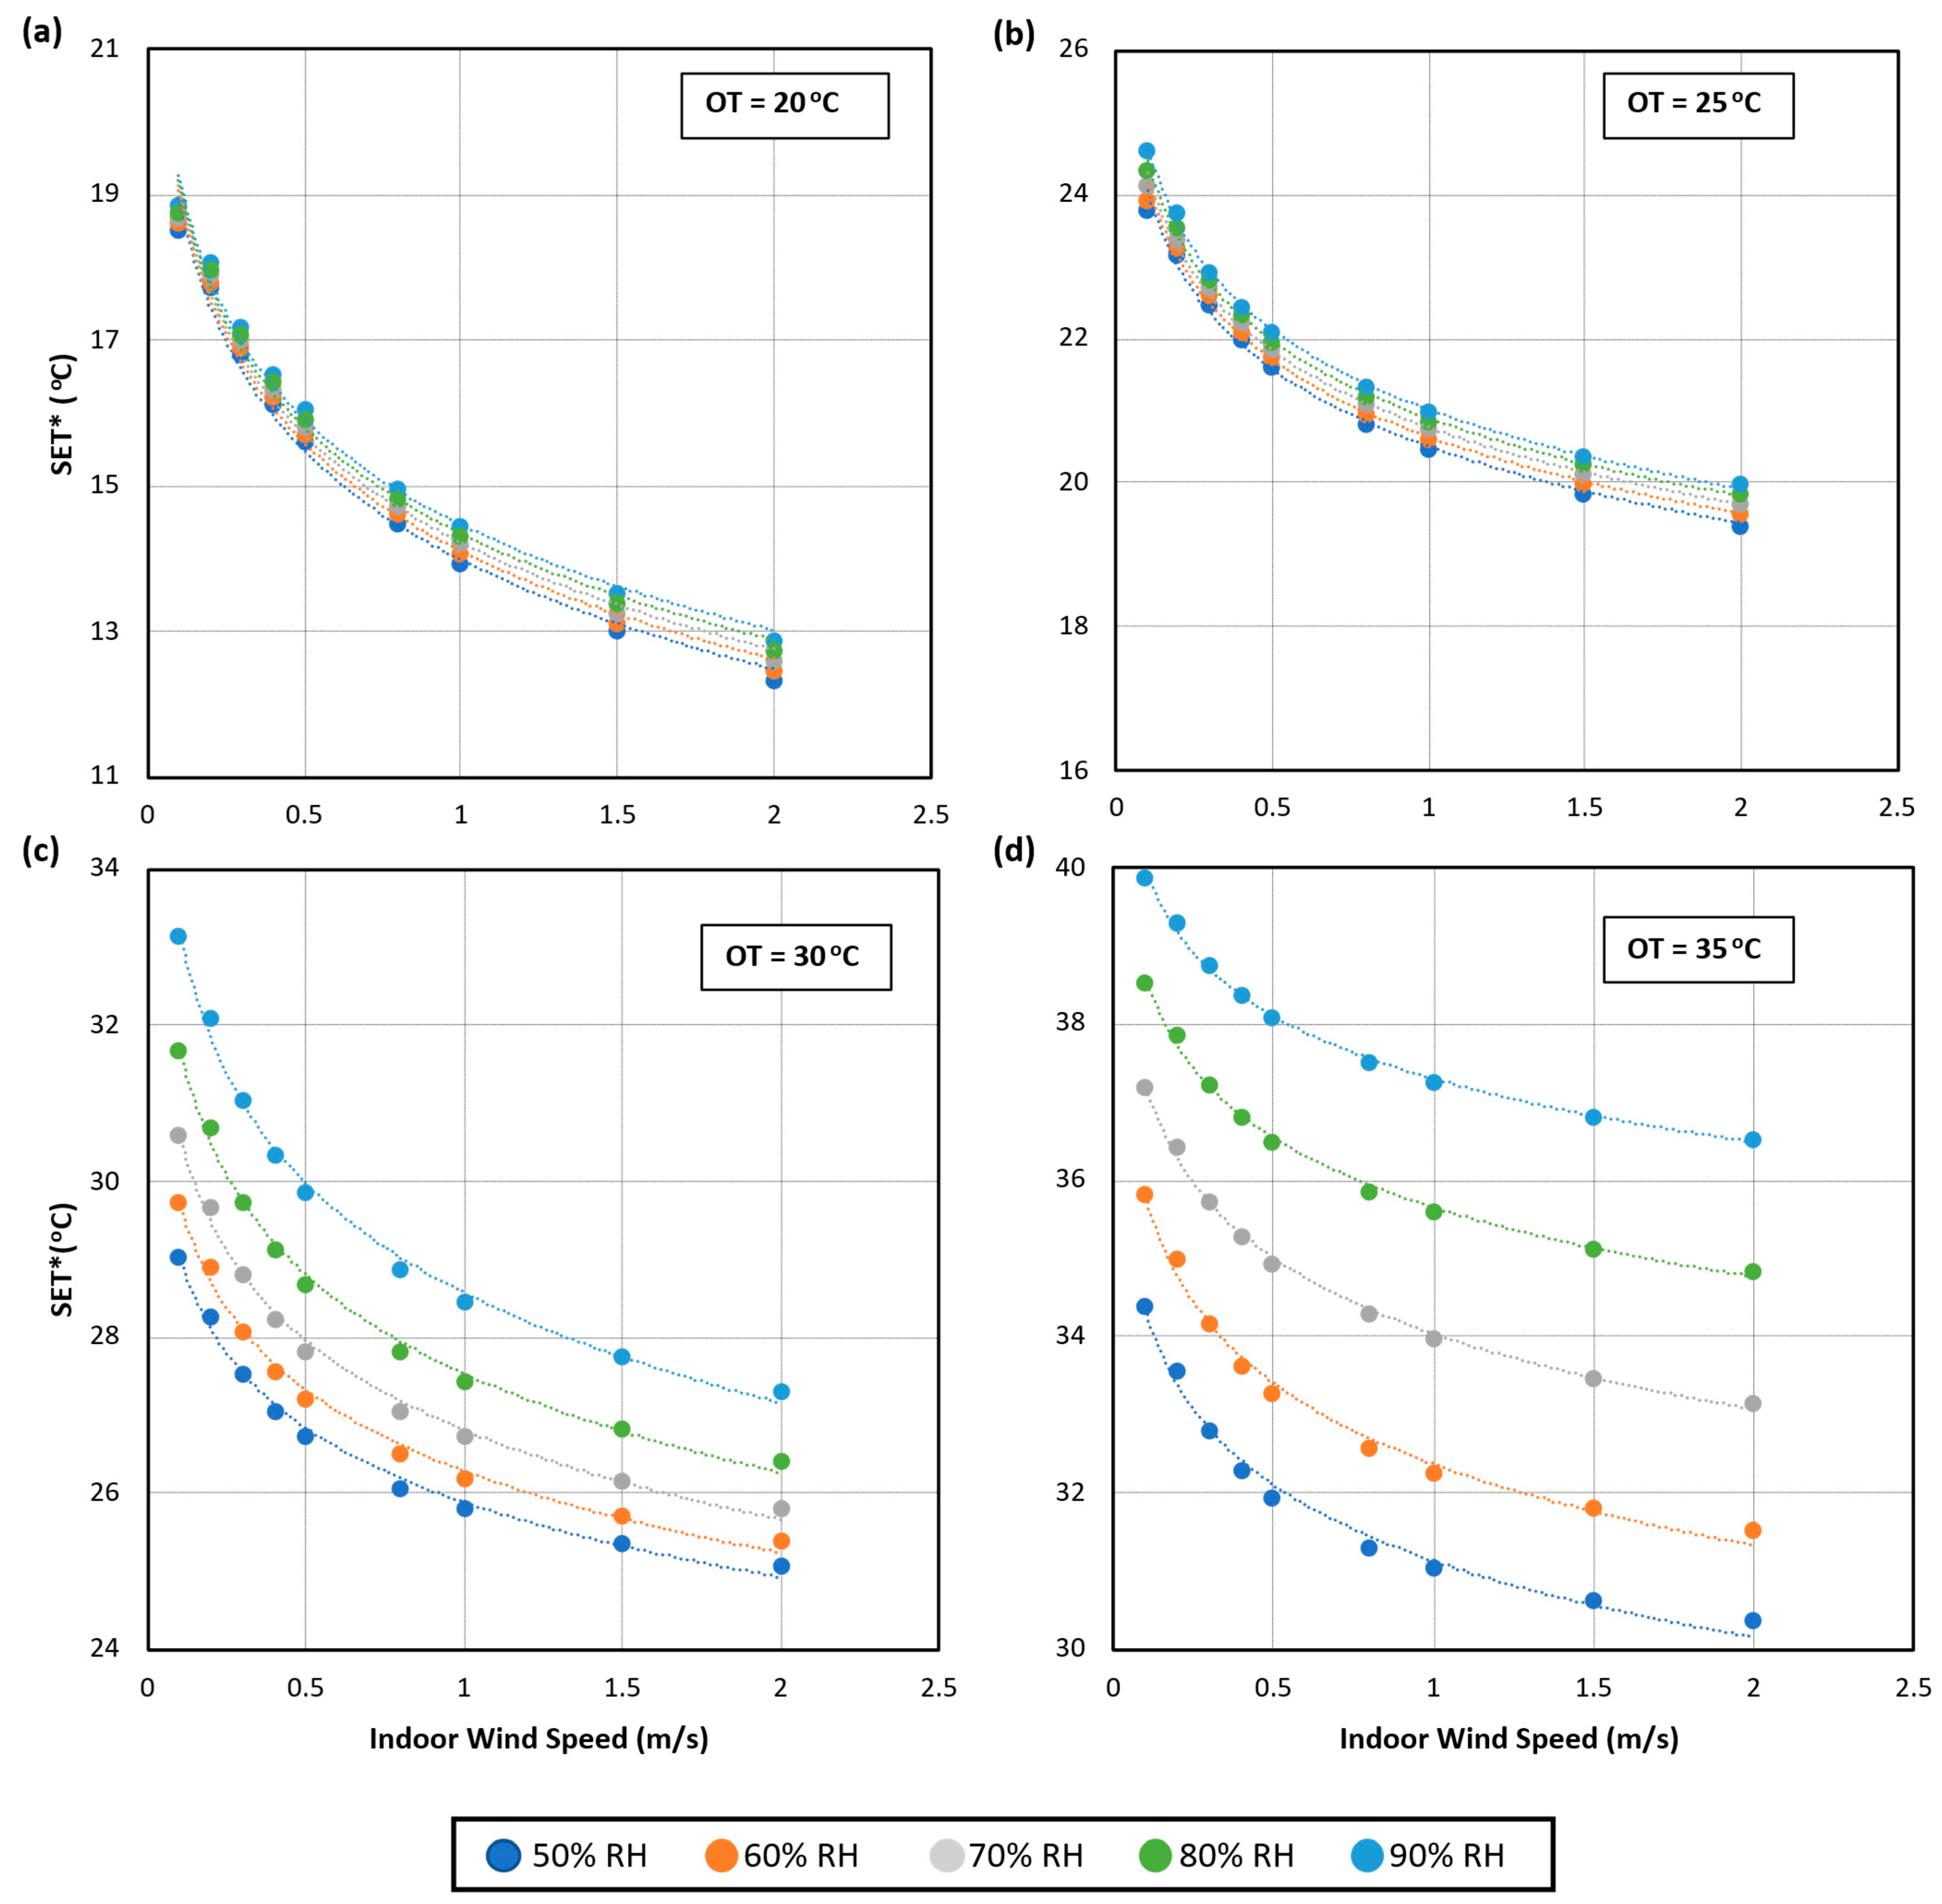
Figure 14 illustrates the relationship between SET* and indoor wind speed across a range of RH levels. As demonstrated, an increase in indoor air speed substantially reduces SET*, especially under high RH conditions, as reported in a previous study [35]. For example, at an OT of 30 °C, which resembles the typical conditions of the monsoon, raising air speed from 0.1 to 0.6 m/s can decrease SET* by as much as 3 °C at 90% RH. This explains the significance of indoor wind enhancements during the hot–humid monsoon season for achieving thermal comfort. Nevertheless, when indoor OT exceeds 30 °C such as during the summer, the increase in wind speed alone is not able to achieve thermal comfort, although the effects of winds were further increased. For the extremely hot conditions during the summer, mechanical convectional cooling such as an AC would be necessary to achieve thermal comfort. In that case, it would be necessary to improve the thermal insulation for the envelope as well as increase the air-tightness, at least for the specific air-conditioning spaces.
Figure 14.
Relationship between the SET* and indoor wind speed (m/s) at various RH (50–90%) when operative temperature (OT) is (a) 20 °C (b) 25 °C (c) 30 °C and (d) 35 °C (clo: 0.5, metabolic rate: 1 met).
4.3. Feedbacks from the Respondents
The results of the feedback interviews are summarized in Table 4. As shown, seasonal changes can be seen not only in the usage of cooling devices but also in their adaptive behaviors such as changing rooms, internal seasonal migrations, changes in posture and sitting styles, bed cloths and even daily routines.
Table 4.
Results of the feedback interviews.
4.4. Design Recommendations
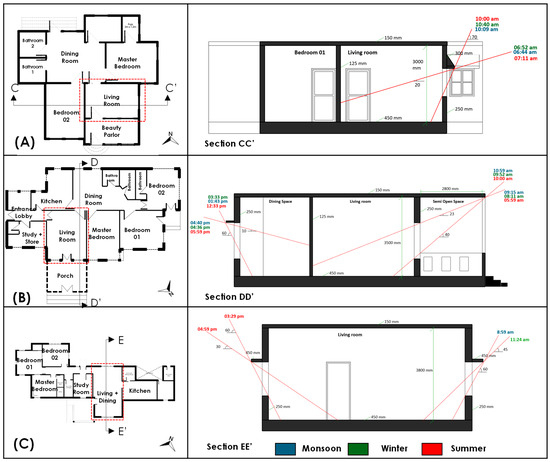
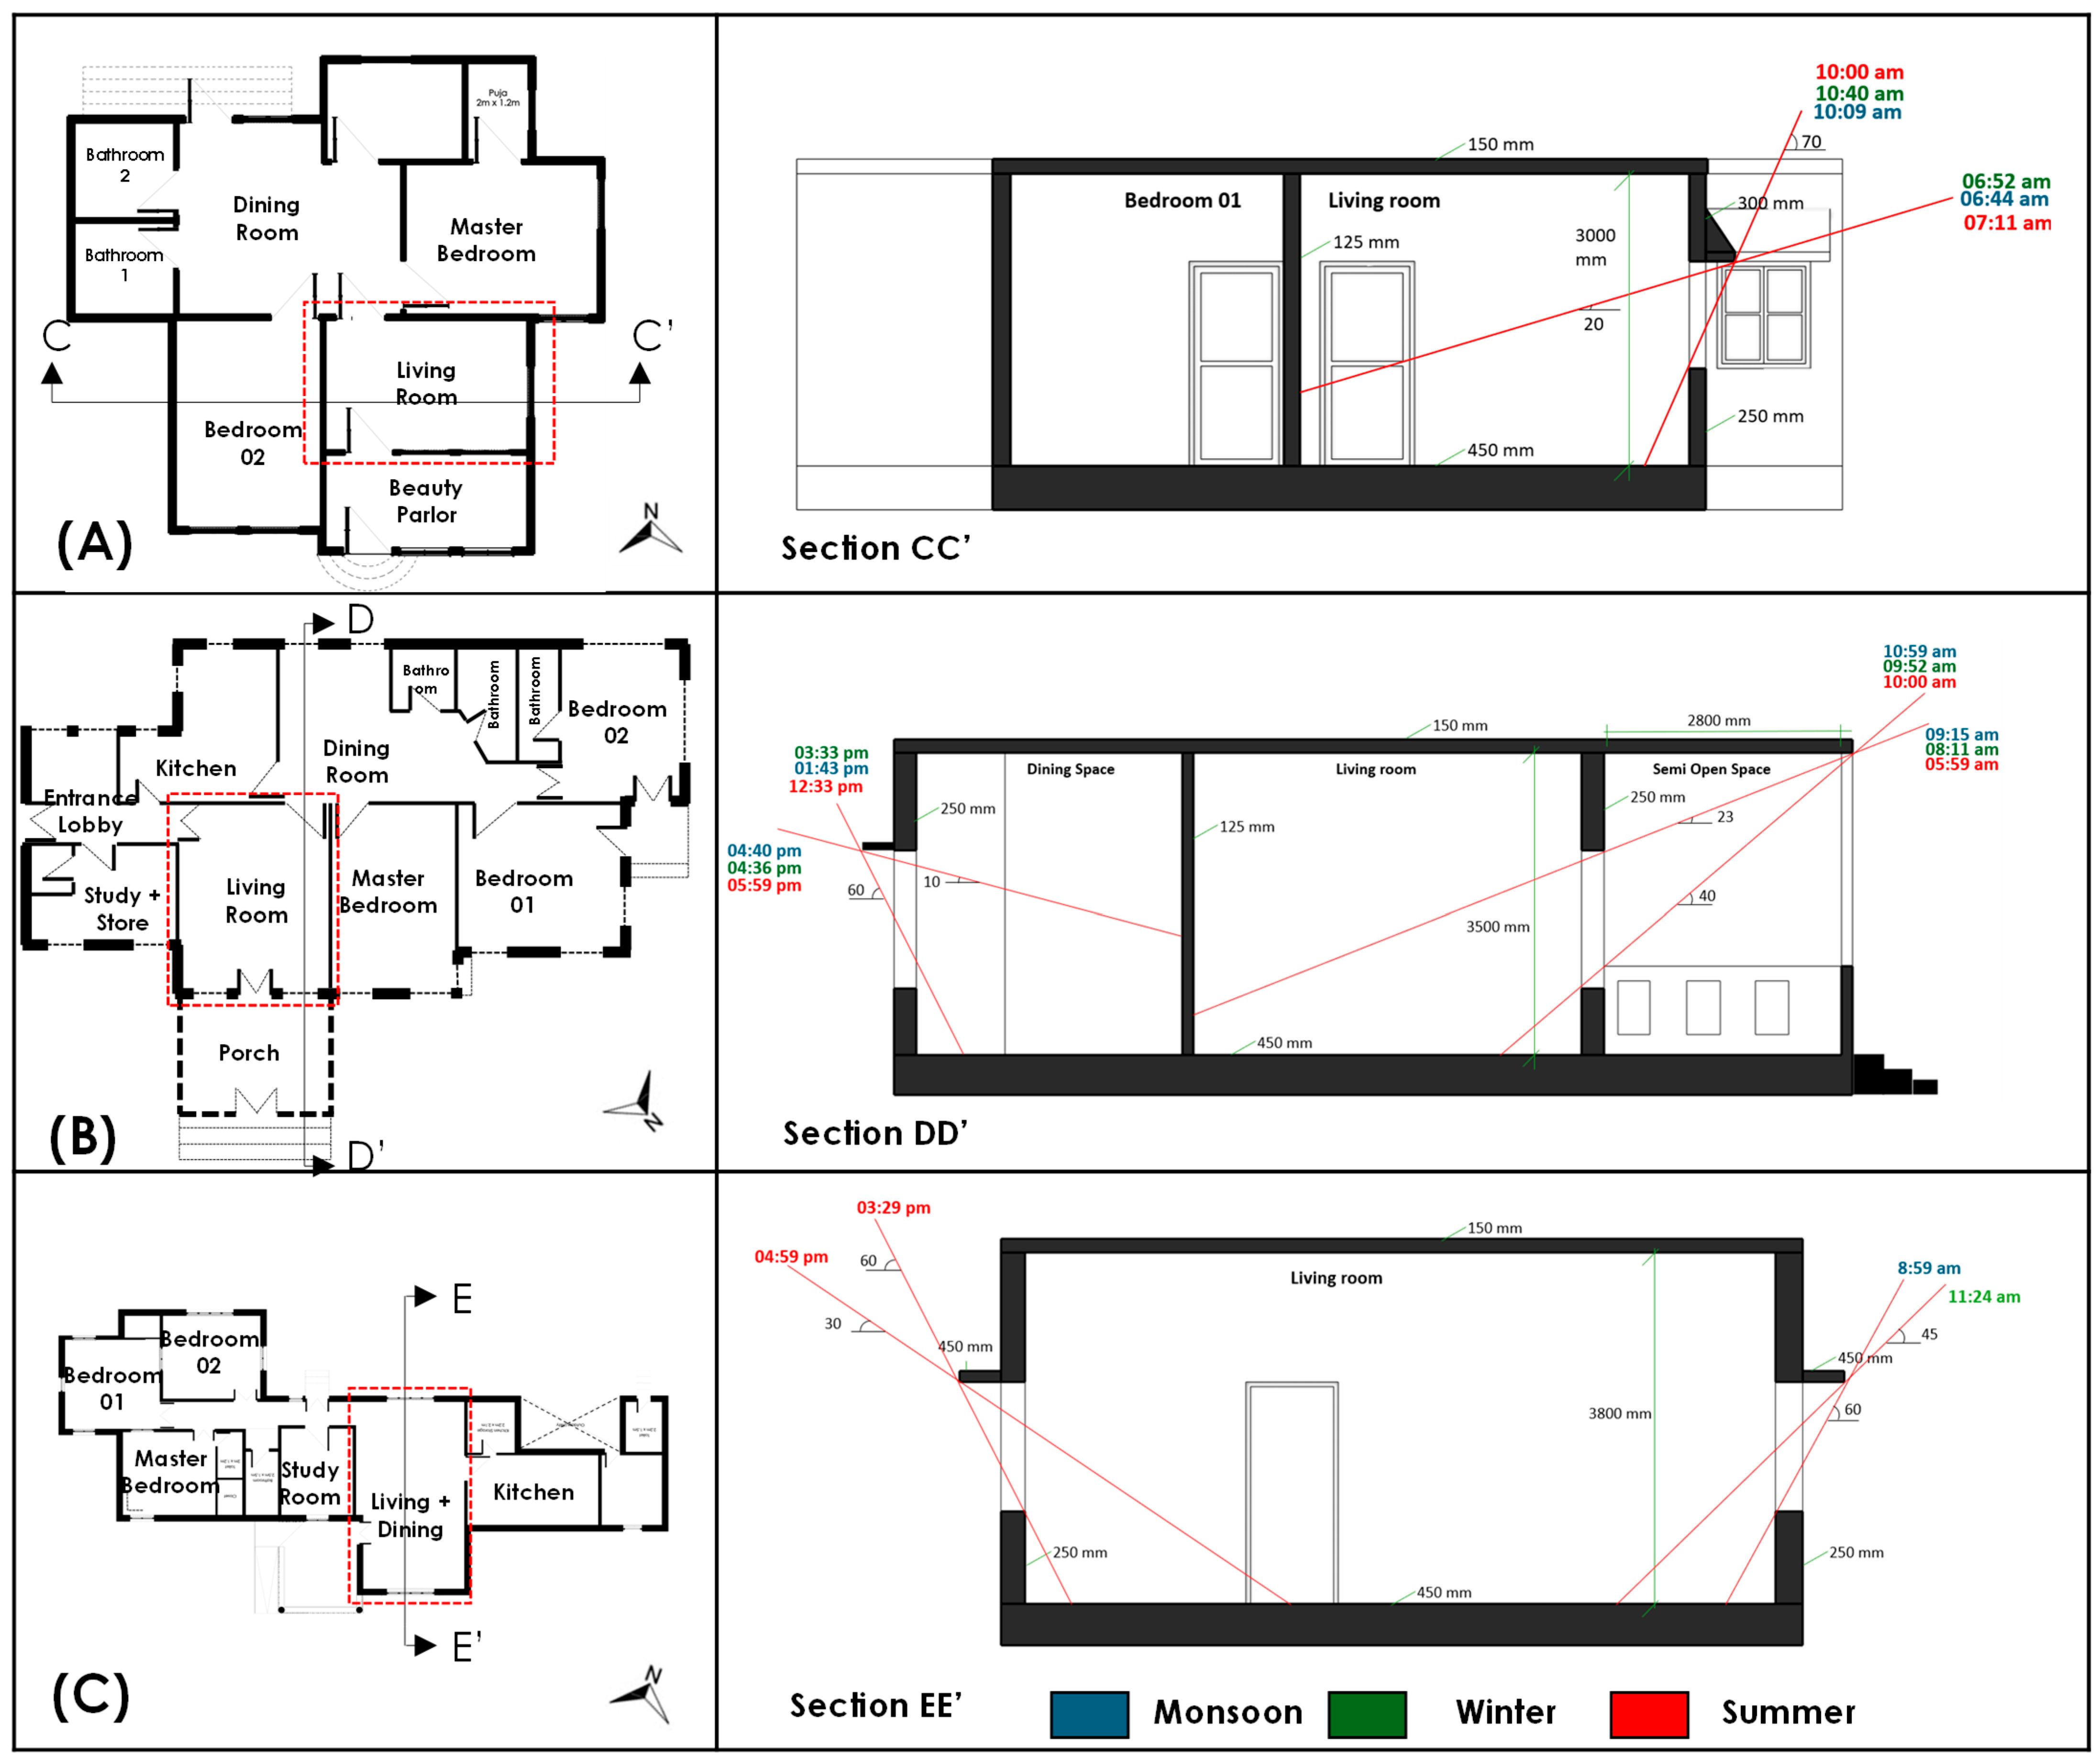
Solar shading and heat preventions should be particularly prioritized for the extremely hot summer conditions, where daytime outdoor AT can be as high as 45 °C. Figure 15 shows the effects of shadings in the living rooms of Houses C–E as examples. As shown in Figure 3 and Figure 4, most houses avoid the west-facing façades for the living rooms, except for House E, to refuse the hot afternoon sun. Furthermore, eaves and semi-open spaces are often used to cut off solar radiation (see Figure 15). Hence, the current modern houses of high thermal mass structure with solar controls are considered to be climatically adaptive for such extreme summer conditions. However, except for the semi-open spaces, which were commonly seen in the case-study houses, modern houses in India pose quite uniform indoor climates with homogeneous thermal properties within the houses. This prevents flexible adaptations to the dynamic seasonal changes as well as even changes within a day. For example, the above-mentioned high thermal mass structures can lower the daytime peak indoor AT significantly more than the outdoors but increase the nocturnal indoor AT, on the other hand.
Figure 15.
Effects of solar shadings in (A) Houses C, (B) House D and (C) House E in monsoon, winter and summer (Houses A and B have nearby buildings).
In fact, vernacular architecture often had various spaces with different thermal attributes within the houses such as courtyards and shaded corridors, and people migrated internally to find more thermally comfortable places within the houses seasonally and even within a day [65,66]. Therefore, it can be recommended for the modern houses to adopt separate design strategies seasonally and in different parts of the day, to maintain a thermally comfortable environment for the occupants. In the monsoons, sufficient cross ventilation with proper solar shading is recommended during the daytime. Structural cooling with a high thermal mass structure can be effective in reducing daytime AT, but rather low thermal mass structures could be better options for nighttime use, as nocturnal outdoor AT can be as low as 25 °C. Hence, a hybrid structure with different thermal properties can be an option to solve the trade-off between daytime and nighttime. In addition, extremely hot summer conditions would require the use of mechanical cooling such as ACs for at least the specific occupied rooms. It might be necessary to provide well-insulated AC room(s) separately for seasonal use, despite the current envelope insulation not being sufficient with approximate U-values of 1.8–2.9 W/m2K (see Table 2). Nocturnal outdoor AT can drop to about 30 °C even during the summer. Therefore, light thermal mass structures, such as timber structures or even semi-open spaces like a courtyard, can be a better option during summer night. Furthermore, the superior microclimate around House E, moderated by greenery, underscores the value of integrating external landscape design to reduce the indoor cooling load and to reduce the overall heat stress [38,67].
It can be concluded that modern urban houses should comprise various spaces with different thermal functions in and around the house in response to the unique seasonal changes in the warm–humid climates of India. As discussed before, a highly insulated airtight room could be recommended for the daytime-use rooms, like a living room equipped with mechanical cooling such as an AC. Once AC is used, the trade-off between thermal comfort and energy-savings would arise. Therefore, it is still important to adopt passive cooling strategies even for the air-conditioning space and other spaces wherever possible to reduce the cooling loads. For example, phase-change materials (PCMs) can be adopted to further increase the thermal mass of the rooms, as seen in previous studies [39,40]. Still, multiple-sided windows should be designed to ensure cross ventilation when necessary, such as during the monsoons.
Meanwhile, night-use rooms such as bedrooms can be constructed of lightweight materials like timber structures to reduce nocturnal indoor temperatures as much as possible. The indoor wind speed can be increased when necessary such as during extreme hot summers with the assistance of ceiling fans, and therefore, mixed-mode ventilation can also be recommended [68]. As seen in the vernacular houses, daily-use living spaces should be surrounded or incorporated with semi-open spaces. These semi-open spaces play a role as thermal buffers and even provide social-gathering spaces to the occupants. A microclimate should be carefully designed around the house for pre-cooling. In a dense urban setting, it might be difficult to secure such semi-open spaces around the houses. In that case, at least the ground floor façade should be set back to ensure semi-open spaces instead.
5. Conclusions
This study investigated the seasonal variations in indoor thermal conditions of five typical modern urban houses in Kharagpur, India, characterized by a warm–humid climate, focusing especially on the effects of elevated wind speed and thermal mass on thermal comfort across monsoon, winter and summer seasons. The key findings are summarized as follows:
- All the case-study houses were constructed of bricks and concrete with relatively low glazing ratios of about 0.1–0.3. As they were enclosed and high thermal mass structures, indoor ATs were well stabilized among the houses. Overall, both the house-wise differences and diurnal differences were much smaller than the seasonal differences. The house-wise differences in OT were approximately 1–2 °C throughout the three seasons, whereas the diurnal differences in OT were approximately 0.5–3 °C on average. Nevertheless, the indoor and outdoor thermal conditions significantly varied between the seasons.
- If the cooling effects by sweat-evaporation were not considered in the thermal comfort evaluation using OT, the resultant indoor thermal conditions did not fall within the required comfort levels during the summer and monsoons, whereas those of the winter months met the required standard with 1.0 clo.
- The cooling effects of enhanced wind speeds were evident during the hot–humid monsoon season and the extremely hot summer season. As natural ventilation was not necessarily sufficient due to the enclosed design in most houses, the residents tended to rely on mechanical means such as ceiling fans to increase the wind speeds for thermal comfort. Still, as daytime indoor AT was as high as 35 °C during the summer, further mechanical and/or passive cooling was required to reach the comfort levels in summer.
- It was seen that the current modern houses of high thermal mass structure were considered to be climatically adaptive for such extreme summer daytime conditions. However, except for the semi-open spaces, modern houses in India pose quite uniform indoor climates with homogeneous thermal properties within the houses. This prevented flexible adaptations to the dynamic seasonal changes as well as changes within a day. Consequently, the burden fell on the occupants to use mechanical cooling during the hot periods or some adaptive behavior, which changed seasonally, as realized in the feedback interviews of the occupants.
- It was recommended for the modern houses to adopt separate design strategies seasonally and in different parts of the day, to maintain a thermally comfortable environment for the occupants. In the monsoons, sufficient cross ventilation with proper solar shading was recommended during the daytime. Structural cooling with a high thermal mass structure can be effective in reducing daytime AT, but rather low thermal mass structure could be a better option for nighttime use. Hence, a hybrid structure with different thermal properties can be an option to solve the trade-off between daytime and nighttime. In addition, the extremely hot summer conditions would require the use of mechanical cooling such as an AC for at least the specific occupied rooms. It might be necessary to provide well-insulated AC room(s) separately for seasonal use. Nocturnal outdoor AT can drop to about 30 °C even during the summer. Therefore, light thermal mass structure, such as timber structures or even semi-open spaces like a courtyard, can be a better option during the summer night.
Occupant adaptive behavior is one of the possible adaptations, which could be incorporated even in the building design and its operations. We will investigate such adaptive behaviors in detail through field surveys in the future study. Occupancy of the living rooms was investigated as shown in Figure 12 for Houses A–C. However, the impacts of occupancy as well as other internal heat sources such as home appliances on the thermal conditions were not analyzed in the present paper, except for cooking activities. These impacts will be further analyzed in the above-mentioned behavioral surveys.
A male adult was used as a standard representative person in the thermal comfort evaluation using SET* based on the previous study. In particular, gender differences should be considered in the future study.
Author Contributions
S.M.: software, formal analysis, investigation, data curation, writing—original draft preparation and visualization. N.K.; methodology, formal analysis, investigation, data curation and writing—review and editing. T.K.: conceptualization, methodology, validation, resources, writing—review and editing, visualization, supervision, project administration and funding acquisition. S.P.B.: validation and resources. H.A.S.: writing—review and editing and visualization. T.A.: validation and writing—review and editing. All authors have read and agreed to the published version of the manuscript.
Funding
This research received no external funding.
Data Availability Statement
The data presented in this study are not readily available because the data are part of an ongoing study. Requests to access the datasets should be directed at the corresponding author.
Acknowledgments
This study was conducted with the help of the Department of Architecture and Regional Planning, Indian Institute of Technology, Kharagpur, and we would like to express our sincere thanks to the faculty staffs and PhD scholars who supported our study.
Conflicts of Interest
The authors declare no conflicts of interest.
Abbreviations
The following abbreviations are used in this manuscript:
| AT | Air Temperature |
| RH | Relative Humidity |
| OT | Operative Temperature |
| AH | Absolute Humidity |
| SET* | Standard Effective Temperature |
| IWS | Indoor Wind Speed |
| CE | Cooling Effect |
| O | Occupancy |
| ST | Surface Temperature |
| MRT | Mean Radiant Temperature |
| CF | Ceiling Fan |
| WO | Window Opening |
References
- Kubota, T. Introduction. In Sustainable Houses and Living in the Hot-Humid Climates of Asia; Springer: Berlin/Hamburg, Germany, 2018; pp. 1–10. [Google Scholar]
- Zou, Y.; Wu, Z.; Li, B.; Jia, Y. Cooling Energy Challenges in Residential Buildings During Heat Waves: Urban Heat Island Impacts in a Hot-Humid City. Buildings 2024, 14, 4030. [Google Scholar] [CrossRef] [Scilit]
- Santamouris, M. On the Energy Impact of Urban Heat Island and Global Warming on Buildings. Energy Build 2014, 82, 100–113. [Google Scholar] [CrossRef] [Scilit]
- International Energy Agency. World Energy Outlook 2023; IEA—International Energy Agency: Paris, France, 2023. [Google Scholar]
- India Population (2025)—Worldometer Population Projection of India. Available online: https://www.worldometers.info/world-population/india-population/ (accessed on 6 October 2025).
- Kisan, M.; Sangathan, S. SP 7: Group 1 (2005): NATIONAL BUILDING CODE OF INDIA 2005 GROUP 1 [CED 46: National Building Code]; (2nd Revision); 2005; Available online: https://law.resource.org/pub/in/bis/S03/is.sp.7.1.2005.pdf (accessed on 9 December 2025).
- Chandel, S.S.; Sharma, V.; Marwah, B.M. Review of Energy Efficient Features in Vernacular Architecture for Improving Indoor Thermal Comfort Conditions. Renew. Sustain. Energy Rev. 2016, 65, 459–477. [Google Scholar] [CrossRef] [Scilit]
- Singh, M.K.; Mahapatra, S.; Atreya, S.K. Bioclimatism and Vernacular Architecture of North-East India. Build. Environ. 2009, 44, 878–888. [Google Scholar] [CrossRef] [Scilit]
- Bajracharya, S.B. TUTA/IOE/PCU The Thermal Performance of Traditional Residential Buildings in Kathmandu Valley. J. Inst. Eng. 2014, 10, 172–183. [Google Scholar] [CrossRef] [Scilit]
- Singh, M.K.; Mahapatra, S.; Atreya, S.K. Solar Passive Features in Vernacular Architecture of North-East India. Sol. Energy 2011, 85, 2011–2022. [Google Scholar] [CrossRef] [Scilit]
- Choudhury, A.S.D.; Chettry, V. Investigation of Bioclimatic Design Features in Vernacular Architecture of Northeast India: Case Studies of Assam-Type Houses and Stilt Houses (Chang Ghar) in Assam, India. Indian J. Tradit. Knowl. 2023, 22, 664–673. [Google Scholar] [CrossRef] [Scilit]
- Singh, M.K.; Mahapatra, S.; Atreya, S.K. Thermal Performance Study and Evaluation of Comfort Temperatures in Vernacular Buildings of North-East India. Build. Environ. 2010, 45, 320–329. [Google Scholar] [CrossRef] [Scilit]
- Szokolay, S.V. Introduction to Architectural Science the Basis of Sustainable Design, 3rd ed.; Routledge: Oxfordshire, UK, 2014. [Google Scholar]
- Henna, K.; Saifudeen, A.; Mani, M. Resilience of Vernacular and Modernising Dwellings in Three Climatic Zones to Climate Change. Sci. Rep. 2021, 11, 9172. [Google Scholar] [CrossRef] [Scilit]
- Mallick, F.H. Thermal Comfort and Building Design in the Tropical Climates. Energy Build. 1996, 23, 61–167. [Google Scholar] [CrossRef] [Scilit]
- van Hoof, J. Forty Years of Fanger’s Model of Thermal Comfort: Comfort for All? Indoor Air 2008, 18, 182–201. [Google Scholar] [CrossRef] [Scilit]
- ASHRAE. Thermal Environmental Conditions for Human Occupancy; ASHRAE: Peachtree Corners, GA, USA, 2013. [Google Scholar]
- Feriadi, H.; Wong, N.H. Thermal Comfort for Naturally Ventilated Houses in Indonesia. Energy Build. 2004, 36, 614–626. [Google Scholar] [CrossRef] [Scilit]
- Djamila, H.; Chu, C.M.; Kumaresan, S. Field Study of Thermal Comfort in Residential Buildings in the Equatorial Hot-Humid Climate of Malaysia. Build. Environ. 2013, 62, 133–142. [Google Scholar] [CrossRef] [Scilit]
- Li, B.; Du, C.; Tan, M.; Liu, H.; Essah, E.; Yao, R. A Modified Method of Evaluating the Impact of Air Humidity on Human Acceptable Air Temperatures in Hot-Humid Environments. Energy Build. 2018, 158, 393–405. [Google Scholar] [CrossRef] [Scilit]
- Han, J.; Zhang, G.; Zhang, Q.; Zhang, J.; Liu, J.; Tian, L.; Zheng, C.; Hao, J.; Lin, J.; Liu, Y.; et al. Field Study on Occupants’ Thermal Comfort and Residential Thermal Environment in a Hot-Humid Climate of China. Build. Environ. 2007, 42, 4043–4050. [Google Scholar] [CrossRef] [Scilit]
- Mirrahimi, S.; Mohamed, M.F.; Haw, L.C.; Ibrahim, N.L.N.; Yusoff, W.F.M.; Aflaki, A. The Effect of Building Envelope on the Thermal Comfort and Energy Saving for High-Rise Buildings in Hot-Humid Climate. Renew. Sustain. Energy Rev. 2016, 53, 1508–1519. [Google Scholar] [CrossRef] [Scilit]
- He, Y.; Li, N.; Peng, J.; Zhang, W.; Li, Y. Field Study on Adaptive Comfort in Air Conditioned Dormitories of University with Hot-Humid Climate in Summer. Energy Build. 2016, 119, 1–12. [Google Scholar] [CrossRef] [Scilit]
- Apriliyanthi, S.R.; Sakoi, T.; Kubota, T.; Nakaya, T.; Koerniawan, M.D.; Alfata, M.N.F.; Aziiz, A.D.; Suhedi, F.; Fathuna, I.S.; Takiguchi, T. Relationship Between Occupants’ Adaptive Behaviors, Air-Conditioning Usage, and Thermal Acceptability Among Residences in the Hot–Humid Climate of Indonesia. Buildings 2025, 15, 73. [Google Scholar] [CrossRef] [Scilit]
- Mori, H.; Kubota, T.; Antaryama, I.G.N.; Ekasiwi, S.N.N. Analysis of Window-Opening Patterns and Air Conditioning Usage of Urban Residences in Tropical Southeast Asia. Sustainability 2020, 12, 10650. [Google Scholar] [CrossRef] [Scilit]
- Daniel, L. ‘We like to Live in the Weather’: Cooling Practices in Naturally Ventilated Dwellings in Darwin, Australia. Energy Build. 2018, 158, 549–557. [Google Scholar] [CrossRef] [Scilit]
- Gou, Z.; Gamage, W.; Lau, S.S.Y.; Lau, S.S.Y. An Investigation of Thermal Comfort and Adaptive Behaviors in Naturally Ventilated Residential Buildings in Tropical Climates: A Pilot Study. Buildings 2018, 8, 5. [Google Scholar] [CrossRef] [Scilit]
- Wong, N.H.; Feriadi, H.; Lim, P.Y.; Tham, K.W.; Sekhar, C.; Cheong, K.W. Thermal Comfort Evaluation of Naturally Ventilated Public Housing in Singapore. Build. Environ. 2002, 37, 1267–1277. [Google Scholar] [CrossRef] [Scilit]
- Shaeri, J.; Yaghoubi, M.; Aflaki, A.; Habibi, A. Evaluation of Thermal Comfort in Traditional Houses in a Tropical Climate. Buildings 2018, 8, 126. [Google Scholar] [CrossRef] [Scilit]
- Zhang, Z.; Zhang, Y.; Jin, L. Thermal Comfort in Interior and Semi-Open Spaces of Rural Folk Houses in Hot-Humid Areas. Build. Environ. 2018, 128, 336–347. [Google Scholar] [CrossRef] [Scilit]
- Tao, Y.; Ao, Y.; Long, Y.; Martek, I. Thermal Performance of Post-Disaster Housing and Its Impact on Occupant Comfort: An Integrated ML-ABM Approach. Build. Environ. 2025, 281, 113205. [Google Scholar] [CrossRef] [Scilit]
- Tuck, N.W.; Zaki, S.A.; Hagishima, A.; Rijal, H.B.; Zakaria, M.A.; Yakub, F. Effectiveness of Free Running Passive Cooling Strategies for Indoor Thermal Environments: Example from a Two-Storey Corner Terrace House in Malaysia. Build. Environ. 2019, 160, 106214. [Google Scholar] [CrossRef] [Scilit]
- Aqilah, N.; Rijal, H.B.; Zaki, S.A. Indoor Thermal Environment and Effect of Air Movement on Comfort Temperature in Malaysian Naturally Ventilated Dwellings. J. Build. Eng. 2025, 104, 112151. [Google Scholar] [CrossRef] [Scilit]
- Daghigh, R. Assessing the Thermal Comfort and Ventilation in Malaysia and the Surrounding Regions. Renew. Sustain. Energy Rev. 2015, 48, 681–691. [Google Scholar] [CrossRef] [Scilit]
- Kubota, T.; Chyee, D.T.H.; Ahmad, S. The Effects of Night Ventilation Technique on Indoor Thermal Environment for Residential Buildings in Hot-Humid Climate of Malaysia. Energy Build. 2009, 41, 829–839. [Google Scholar] [CrossRef] [Scilit]
- Perera, U.S.; Weerasuriya, A.U.; Zhang, X.; Ruparathna, R.; Tharaka, M.G.I.; Lewangamage, C.S. Selecting Suitable Passive Design Strategies for Residential High-Rise Buildings in Tropical Climates to Minimize Building Energy Demand. Build. Environ. 2025, 267, 112177. [Google Scholar] [CrossRef] [Scilit]
- Liu, C.; Xie, H.; Ali, H.M.; Liu, J. Evaluation of Passive Cooling and Thermal Comfort in Historical Residential Buildings in Zanzibar. Buildings 2022, 12, 2149. [Google Scholar] [CrossRef] [Scilit]
- Toe, D.H.C.; Kubota, T. Comparative Assessment of Vernacular Passive Cooling Techniques for Improving Indoor Thermal Comfort of Modern Terraced Houses in Hot-Humid Climate of Malaysia. Sol. Energy 2015, 114, 229–258. [Google Scholar] [CrossRef] [Scilit]
- Kitagawa, H.; Asawa, T.; Kubota, T.; Trihamdani, A.R.; Sakurada, K.; Mori, H. Optimization of Window Design for Ventilative Cooling with Radiant Floor Cooling Systems in the Hot and Humid Climate of Indonesia. Build. Environ. 2021, 188, 107483. [Google Scholar] [CrossRef] [Scilit]
- Kitagawa, H.; Asawa, T.; Hirayama, Y. Optimum Window-Opening Control for Naturally Ventilated Buildings with Phase Change Materials in the Hot and Humid Climate of Indonesia. Build. Environ. 2023, 245, 110898. [Google Scholar] [CrossRef] [Scilit]
- Khoukhi, M.; Shaaban, A.K.; Khatib, O. Al Passive Environmental Design of an Eco-House in the Hot-Humid Climate of the Middle East: A Qualitative Approach. Cogent. Eng. 2020, 7, 1837410. [Google Scholar] [CrossRef] [Scilit]
- Rajapaksha, I.; Nagai, H.; Okumiya, M. A Ventilated Courtyard as a Passive Cooling Strategy in the Warm Humid Tropics. Renew. Energy 2003, 28, 1755–1778. [Google Scholar] [CrossRef] [Scilit]
- Indraganti, M. Behavioural Adaptation and the Use of Environmental Controls in Summer for Thermal Comfort in Apartments in India. Energy Build. 2010, 42, 1019–1025. [Google Scholar] [CrossRef] [Scilit]
- Malik, J.; Bardhan, R. Thermal Comfort Perception in Naturally Ventilated Affordable Housing of India. Adv. Build. Energy Res. 2022, 16, 385–413. [Google Scholar] [CrossRef] [Scilit]
- Vadugapalayam Rangasamy, L.; Sivananthan, S.; Muthu, R. A Study on the Residential Building Construction Information, Thermal Sensation and the Behavior of Households in Tamilnadu State—A Questionnaire Survey. Energy Sources Part A Recovery Util. Environ. Eff. 2025, 47, 231–251. [Google Scholar] [CrossRef] [Scilit]
- Mishra, A.K.; Ramgopal, M. Thermal Comfort in Undergraduate Laboratories—A Field Study in Kharagpur, India. Build Environ. 2014, 71, 223–232. [Google Scholar] [CrossRef] [Scilit]
- Mishra, A.K.; Ramgopal, M. A Thermal Comfort Field Study of Naturally Ventilated Classrooms in Kharagpur, India. Build Environ. 2015, 92, 396–406. [Google Scholar] [CrossRef] [Scilit]
- Ray, B.; Shaw, R. Changing Built Form and Implications on Urban Resilience: Loss of Climate Responsive and Socially Interactive Spaces. Procedia Eng 2018, 212, 117–124. [Google Scholar] [CrossRef] [Scilit]
- Takaoka, M.; Norback, D. The Home Environment of Japanese Female University Students—Association with Respiratory Health and Allergy. Indoor Built Environ. 2011, 20, 369–376. [Google Scholar] [CrossRef] [Scilit]
- Yang, J.; An, Q.; Liu, Q.; Tan, M.; Jiang, L. Development of a Radiation Shield for Atmospheric Temperature Measurement System. Measurement 2024, 229, 114399. [Google Scholar] [CrossRef] [Scilit]
- Trumbo, B.A.; Wise, L.M.; Hudy, M. Influence of Protective Shielding Devices on Recorded Air Temperature Accuracy for a Rugged Outdoor Thermal Sensor Used in Climate Change Modeling. Nat. Environ. Sci. 2012, 3, 42–50. [Google Scholar]
- Thomas, C.K.; Smoot, A.R. An Effective, Economic, Aspirated Radiation Shield for Air Temperature Observations and Its Spatial Gradients. J. Atmos. Ocean Technol. 2013, 30, 526–537. [Google Scholar] [CrossRef] [Scilit]
- Tarara, J.M.; Hoheisel, G.-A. Low-Cost Shielding to Minimize Radiation Errors of Temperature Sensors in the Field. HortScience 2007, 42, 1372–1379. [Google Scholar] [CrossRef] [Scilit]
- Teichmann, F.; Pichlhöfer, A.; Sulejmanovski, A.; Korjenic, A. Measurement Errors When Measuring Temperature in the Sun. Sensors 2024, 24, 1564. [Google Scholar] [CrossRef] [Scilit]
- Fuchs, M.; Tanner, C.B. Radiation Shields for Air Temperature Thermometers. J. Appl. Meteorol. 1965, 4, 544–547. [Google Scholar] [CrossRef] [Scilit]
- Gagge, A.P.; Stolwijk, J.A.J.; Nishi, Y. An Effective Temperature Scale Based on a Simple Model of Human Physiological Regulatiry Response. Available online: https://eprints.lib.hokudai.ac.jp/repo/huscap/all/37901/13Suppl_21-36.pdf (accessed on 3 January 2026).
- Fountain, M.; Huizenga, C. A Thermal Sensation Model for Use by the Engineering Profession; Center for the Built Environment: Berkeley, CA, USA, 1995. [Google Scholar]
- Indraganti, M. Thermal Comfort in Naturally Ventilated Apartments in Summer: Findings from a Field Study in Hyderabad, India. Appl. Energy 2010, 87, 866–883. [Google Scholar] [CrossRef] [Scilit]
- Wang, Y.; Liu, Y.; Song, C.; Liu, J. Appropriate Indoor Operative Temperature and Bedding Micro Climate Temperature That Satisfies the Requirements of Sleep Thermal Comfort. Build Environ. 2015, 92, 20–29. [Google Scholar] [CrossRef] [Scilit]
- Gsvej, S. Dampness and Mould; World Health Organization Regional Office for Europe: Copenhagen, Denmark, 2009. [Google Scholar]
- Wang, L.; Qu, F.; Zhang, Y.; Weschler, L.B.; Sundell, J. Home Environment in Relation to Allergic Rhinitis among Preschool Children in Beijing, China: A Cross-Sectional Study. Build Environ. 2015, 93, 54–63. [Google Scholar] [CrossRef] [Scilit]
- Sundell, J. Reflections on the History of Indoor Air Science, Focusing on the Last 50 Years. Indoor Air 2017, 27, 708–724. [Google Scholar] [CrossRef] [Scilit]
- Bornehag, C.-G.; Sundell, J.; Sigsgaard, T. Dampness in Buildings and Health (DBH): Report from an Ongoing Epidemiological Investigation on the Association between Indoor Environmental Factors and Health Effects among Children in Sweden. Indoor Air 2004, 14, 59–66. [Google Scholar] [CrossRef] [Scilit]
- Sani, H.; Kubota, T.; Sumi, J.; Surahman, U. Impacts of Air Pollution and Dampness on Occupant Respiratory Health in Unplanned Houses: A Case Study of Bandung, Indonesia. Atmosphere 2022, 13, 1272. [Google Scholar] [CrossRef] [Scilit]
- Shastry, V.; Mani, M.; Tenorio, R. Evaluating Thermal Comfort and Building Climatic Response in Warm-Humid Climates for Vernacular Dwellings in Suggenhalli (India). Arch. Sci. Rev. 2016, 59, 12–26. [Google Scholar] [CrossRef] [Scilit]
- Dili, A.S.; Naseer, M.A.; Varghese, T.Z. Passive Environment Control System of Kerala Vernacular Residential Architecture for a Comfortable Indoor Environment: A Qualitative and Quantitative Analyses. Energy Build. 2010, 42, 917–927. [Google Scholar] [CrossRef] [Scilit]
- Chen, S.; Xu, R.; Wong, N.H.; Tong, S.; Wang, J.; Santamouris, M. A Probabilistic Framework for Predicting Spatiotemporal Intensity and Variability of Outdoor Thermal Comfort. Build Environ. 2026, 289, 114102. [Google Scholar] [CrossRef] [Scilit]
- Lei, Y.; Zhan, S.; Chong, A. Sustainable Cooling in the Tropics with Mixed-Mode Ventilation and Thermal Adaptation. Build. Environ. 2025, 284, 113339. [Google Scholar] [CrossRef] [Scilit]

Disclaimer/Publisher’s Note: The statements, opinions and data contained in all publications are solely those of the individual author(s) and contributor(s) and not of MDPI and/or the editor(s). MDPI and/or the editor(s) disclaim responsibility for any injury to people or property resulting from any ideas, methods, instructions or products referred to in the content. |
© 2026 by the authors. Licensee MDPI, Basel, Switzerland. This article is an open access article distributed under the terms and conditions of the Creative Commons Attribution (CC BY) license.