


Abstract
The strength of cement paste backfill (CPB) is crucial for ensuring the safe and efficient operation of the horizontal layered approach backfill mining method. To effectively improve CPB strength, a series of experiments were carried out to systematically examine the effects of nano-SiO2 (NS) on the mechanical properties, hydration process, setting time, and microstructure of CPB. The results show that at a content of 1.5%, NS fully utilizes its pozzolanic, filling, and nucleation effects, accelerating cement hydration, filling internal pores, and thereby increasing matrix density and CPB strength. Conversely, at 2.5%, severe agglomeration of NS into large-sized aggregates weakens these three effects of NS, increases specimen porosity, reduces matrix density, and consequently impairs the mechanical properties of CPB. This study clarifies the mechanism by which an appropriate amount of NS improves CPB mechanical properties, as well as the intrinsic reasons for the performance degradation caused by NS overdosage. The findings provide a theoretical basis and experimental support for the rational application of NS in mine backfill.
1. Introduction
In deep mineral resource development, complex geological environments and extreme conditions—such as high pressure and temperature—pose severe challenges to continuous and efficient mining operations. These challenges are particularly evident in poor working stability and difficulties in resource recovery [1,2,3]. As an underground mining method, the efficiency and safety of the horizontal sublevel caving with backfilling technique largely depend on the early strength of the backfill material. However, the brief exposure time of the side walls in this method results in insufficient self-stabilization capacity; traditional backfill often struggles to achieve the mechanical properties necessary to support efficient mining and maintain longwall stability within a short timeframe [4,5]. Therefore, developing techniques to regulate the strength of backfill materials to adapt to high-efficiency mining has become a critical issue that must be urgently addressed for the safe extraction of deep-level resources [6,7,8].
Cement paste backfill (CPB) is a specialized cementitious material that differs significantly from conventional concrete. It characterized by low cement content, high tailings content, and a relatively high overall porosity [9,10,11]. In terms of service environment, CPB operates under complex underground stresses. For deep mining applications, CPB must meet stricter early-strength requirements to accommodate the short-cycle exposure inherent in horizontal layered backfilling. These specific characteristics result in strength development patterns and performance regulation mechanisms for CPB that differ from those of conventional cementitious materials. To address the urgent demand for early strength in backfill materials for deep, high-efficiency mining while minimizing cement consumption, performance enhancement technologies are essential [12].
Among various material modification approaches, nanomaterials have garnered significant attention due to their unique surface and size effects [13,14]. Common nanomaterials include carbon nanotubes (CNTs), nano-Al2O3 (NA), nano-CaCO3 (NC), and nano-SiO2 (NS). While CNTs, NA, and NS can significantly improve the performance of cement-based materials [3,15,16], CNTs and NA are expensive, and CNTs application requires ultrasonic dispersion equipment. Some studies also suggest that NC may reduce the mechanical properties of cement-based materials in practice [17,18]. A comprehensive comparison indicates that NS is better aligned with cost considerations and application conditions in mining scenarios.
Extensive research on the modifying effects of NS in ordinary concrete and high-cement systems has confirmed its ability to significantly enhance macroscopic properties of materials through nucleation, pozzolanic, and micro-filling effects [19,20,21]. However, CPB possesses unique compositional and structural properties, meaning the modification mechanisms and effects observed in ordinary concrete may not be directly applicable to CPB systems.
This research focuses on the practical requirements of deep-mine backfilling, aiming to systematically investigate the influence of NS on the mechanical properties of low-cement, high-tailings CPB systems and to reveal the underlying microstructural modification mechanisms. Additionally, it addresses a critical design issue in mining engineering practice: how to achieve controlled enhancement of early-stage CPB strength through NS admixture under low-cement conditions, thereby meeting the specific strength development timing required by deep-level, high-efficiency mining processes. The findings will provide theoretical support and design references for the application of nanomaterials in deep-mine backfilling, contributing significantly to ensuring mining safety, enhancing resource recovery rates, and advancing green mining practices.
2. Experimental Design and Methods
2.1. Experimental Materials
2.1.1. Tailings
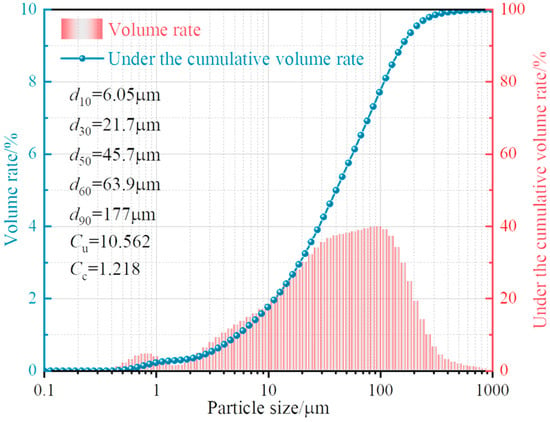
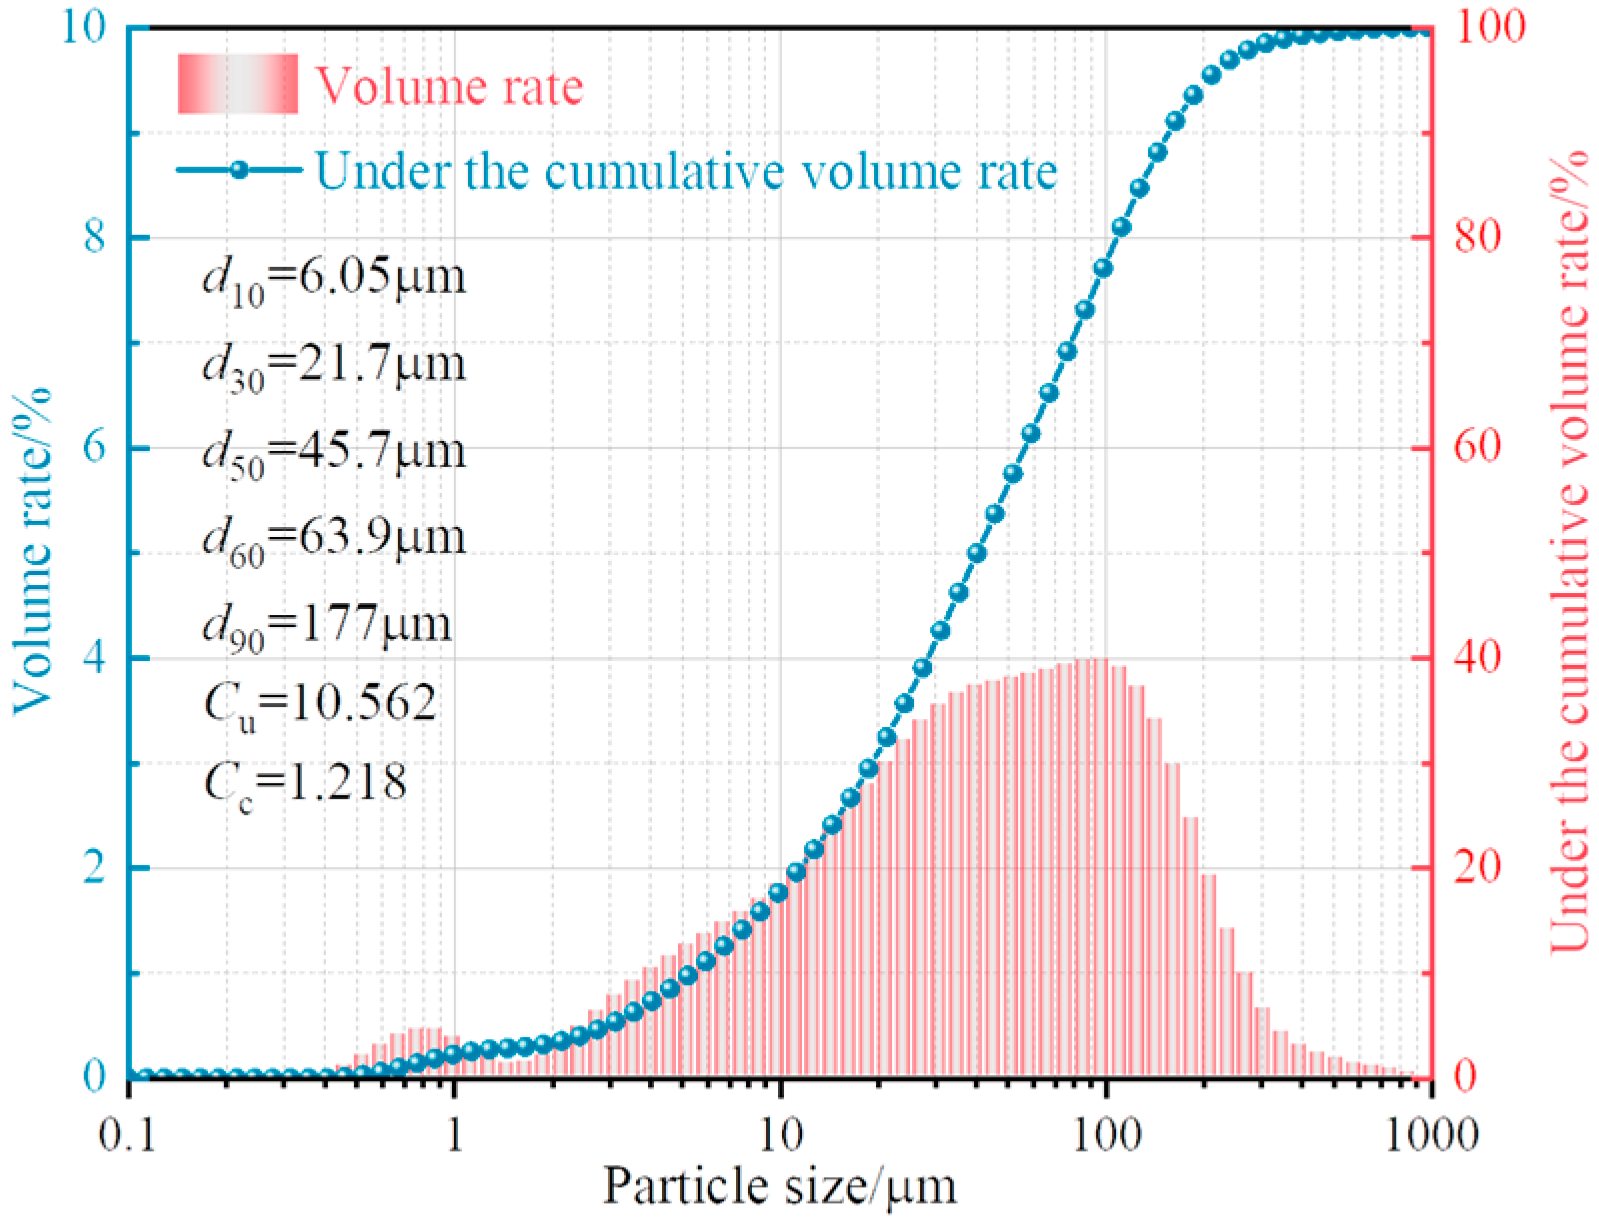
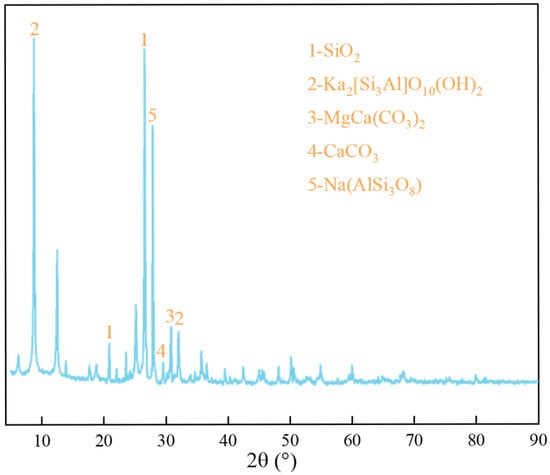
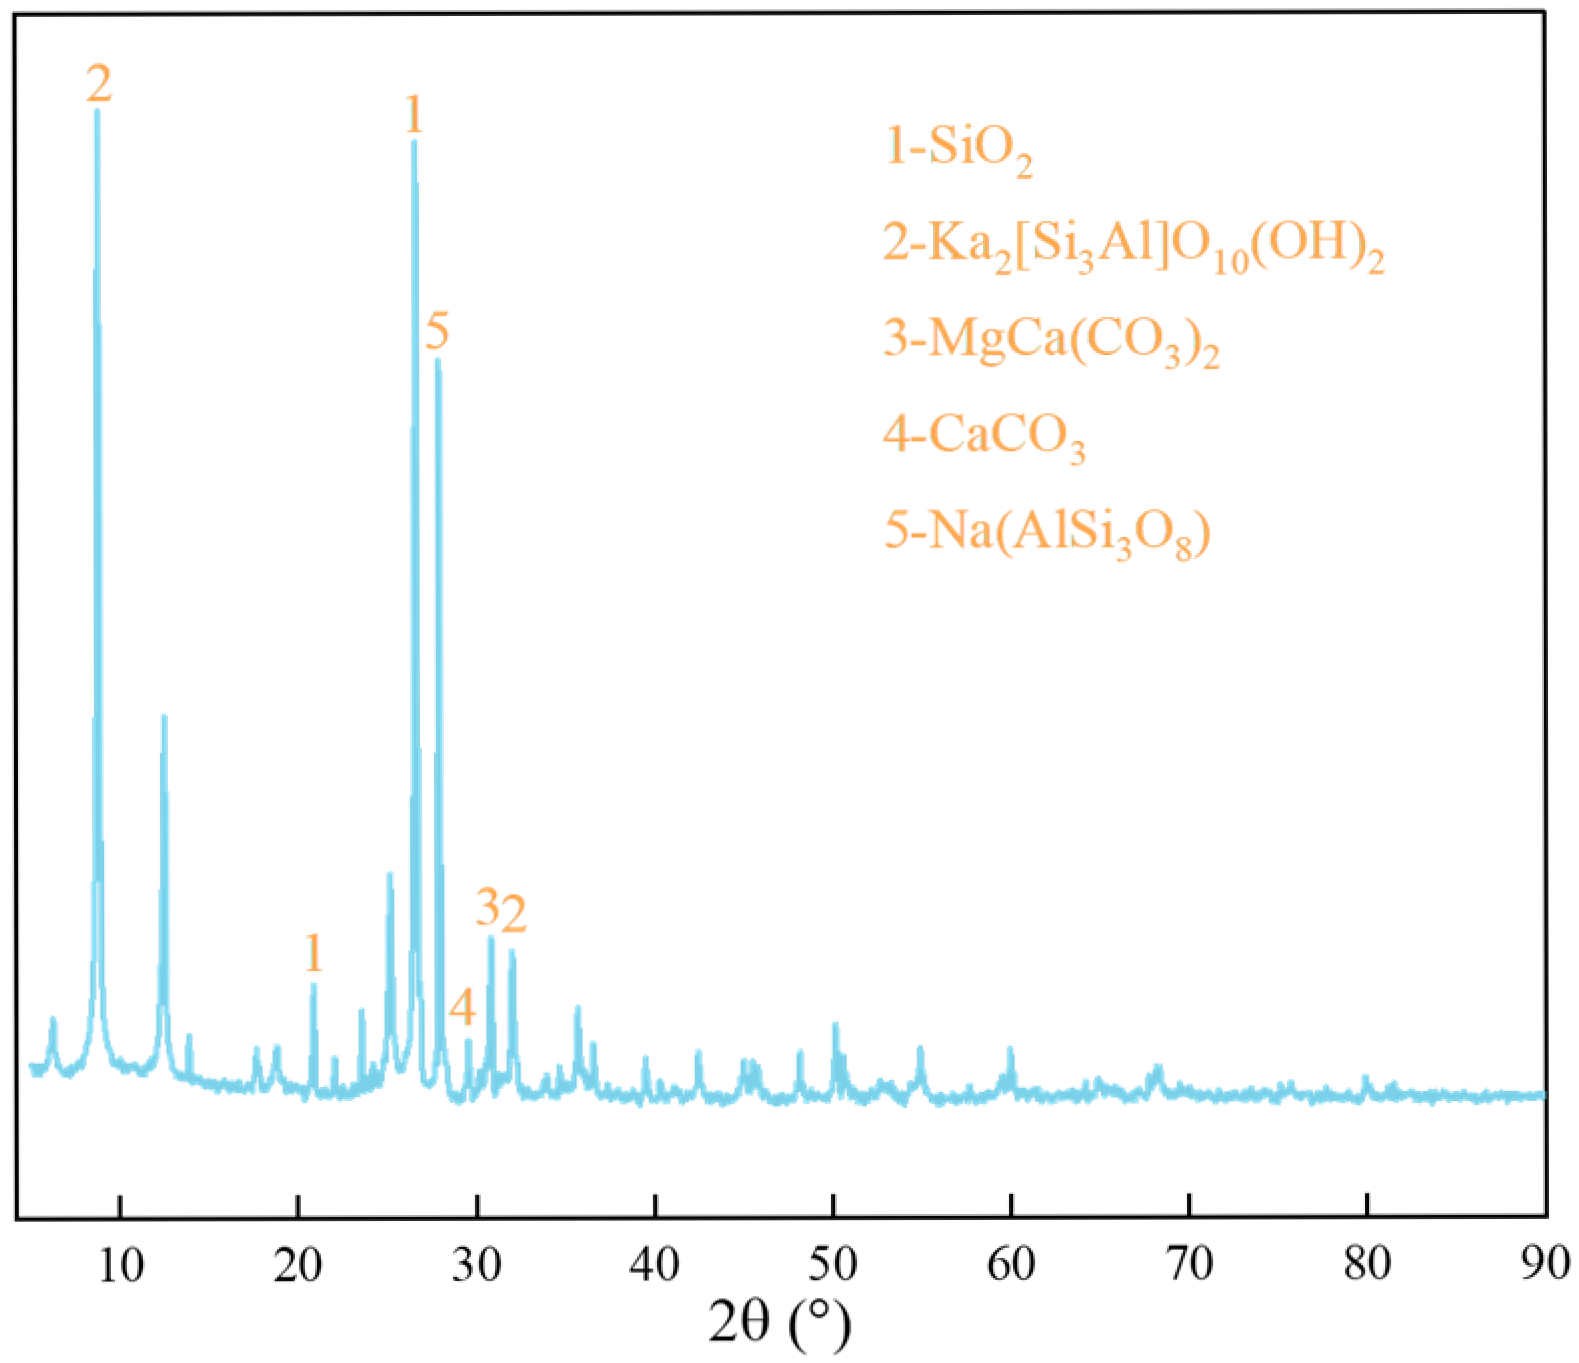
The tailings used in the study were taken from a deep copper mine in Yunnan Province. The particle size distribution and accumulation curve of the tailings are shown in Figure 1. The cumulative proportion of tailings particles smaller than 6.05, 21.7, and 63.9 μm reached 10%, 30%, and 60%, respectively. Calculations yield the unevenness coefficient Cu = d60/d10 = 10.562 and the curvature coefficient Cc = d302/(d10 × d60) = 1.218, which reveals that the tailings gradation is good and the density is high [22]. The tailings were analyzed by X-ray diffraction (XRD) and X-ray fluorescence spectroscopy (XRF), and the results are shown in Table 1 and Figure 2. The tailings primarily consist of CaO and Fe2O3, with respective contents reaching 67.00% and 12.29%.
Figure 1.
Tailings particle size distribution and accumulation curve.
Table 1.
Chemical composition of tailings.
Figure 2.
Tailings XRD analysis results.
2.1.2. Cementing Materials and Water
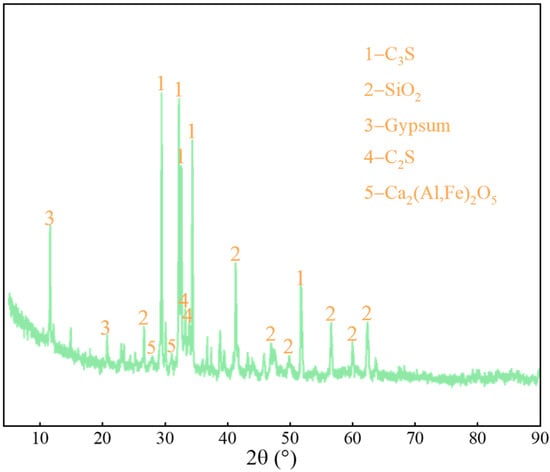
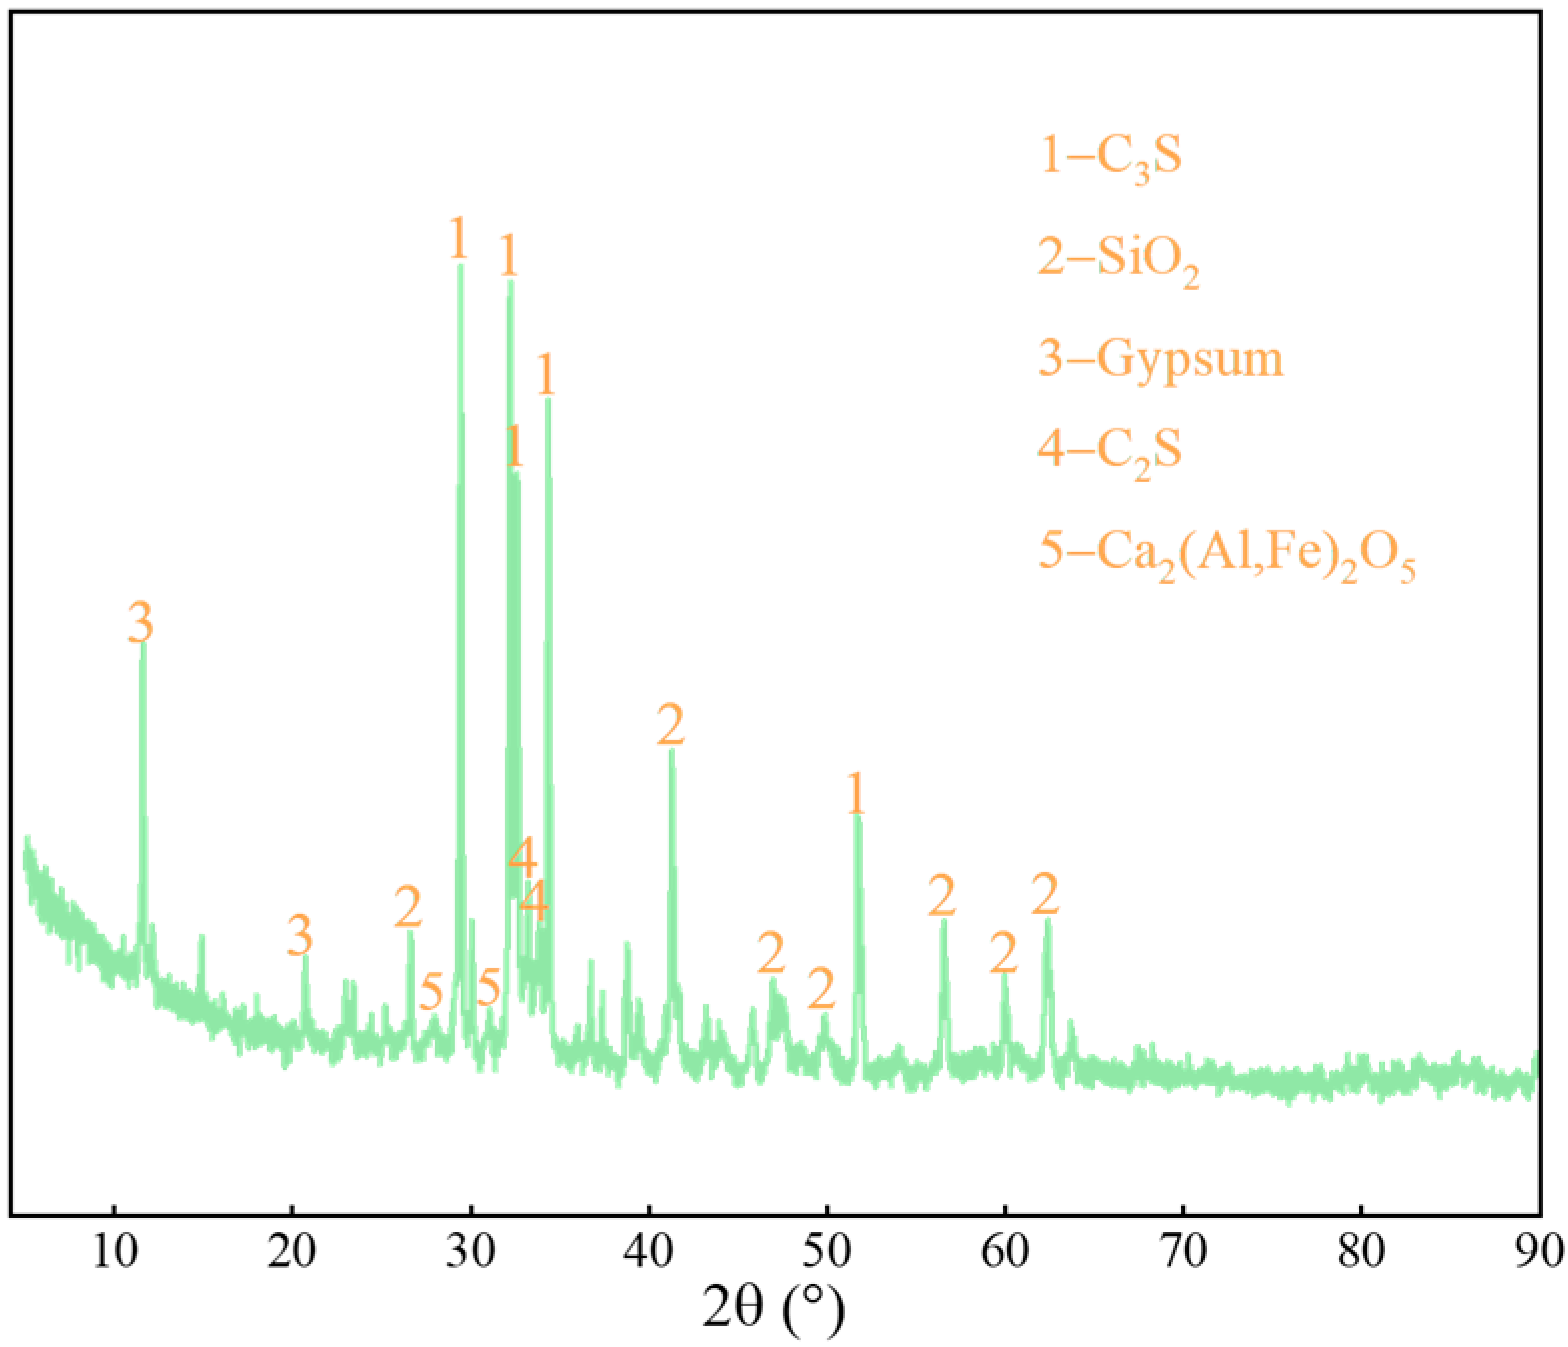
The cementitious material used in the experiment is PO·42.5 ordinary Portland cement (Jiu-qi Building Materials, Linyi, China). The results of the XRD and XRF analyses are shown in Figure 3 and Table 2, respectively. Except for the TEM experiment, which used pure water, the other experiments used tap water. Nanoparticles have extremely small particle sizes. During TEM experiments, to observe the dispersion state of nanoparticles, extremely high magnification (10,000×) is required. When using tap water during experiments, it is impossible to estimate the impact of impurities in the water on nanoparticle dispersion. Therefore, pure water is used to conduct the relevant experiments.
Figure 3.
XRD analysis results of cement.
Table 2.
Chemical composition of cement.
2.1.3. Nano-SiO2
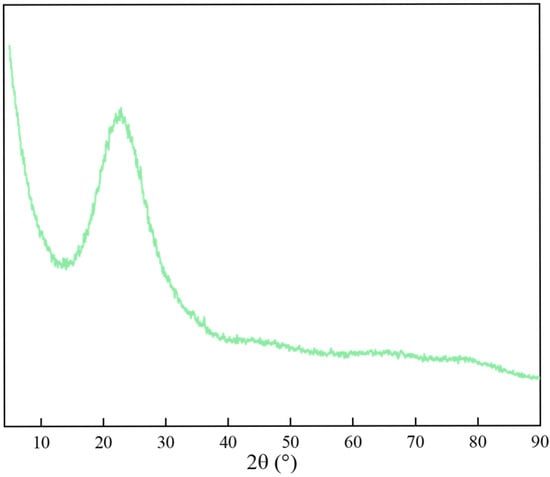
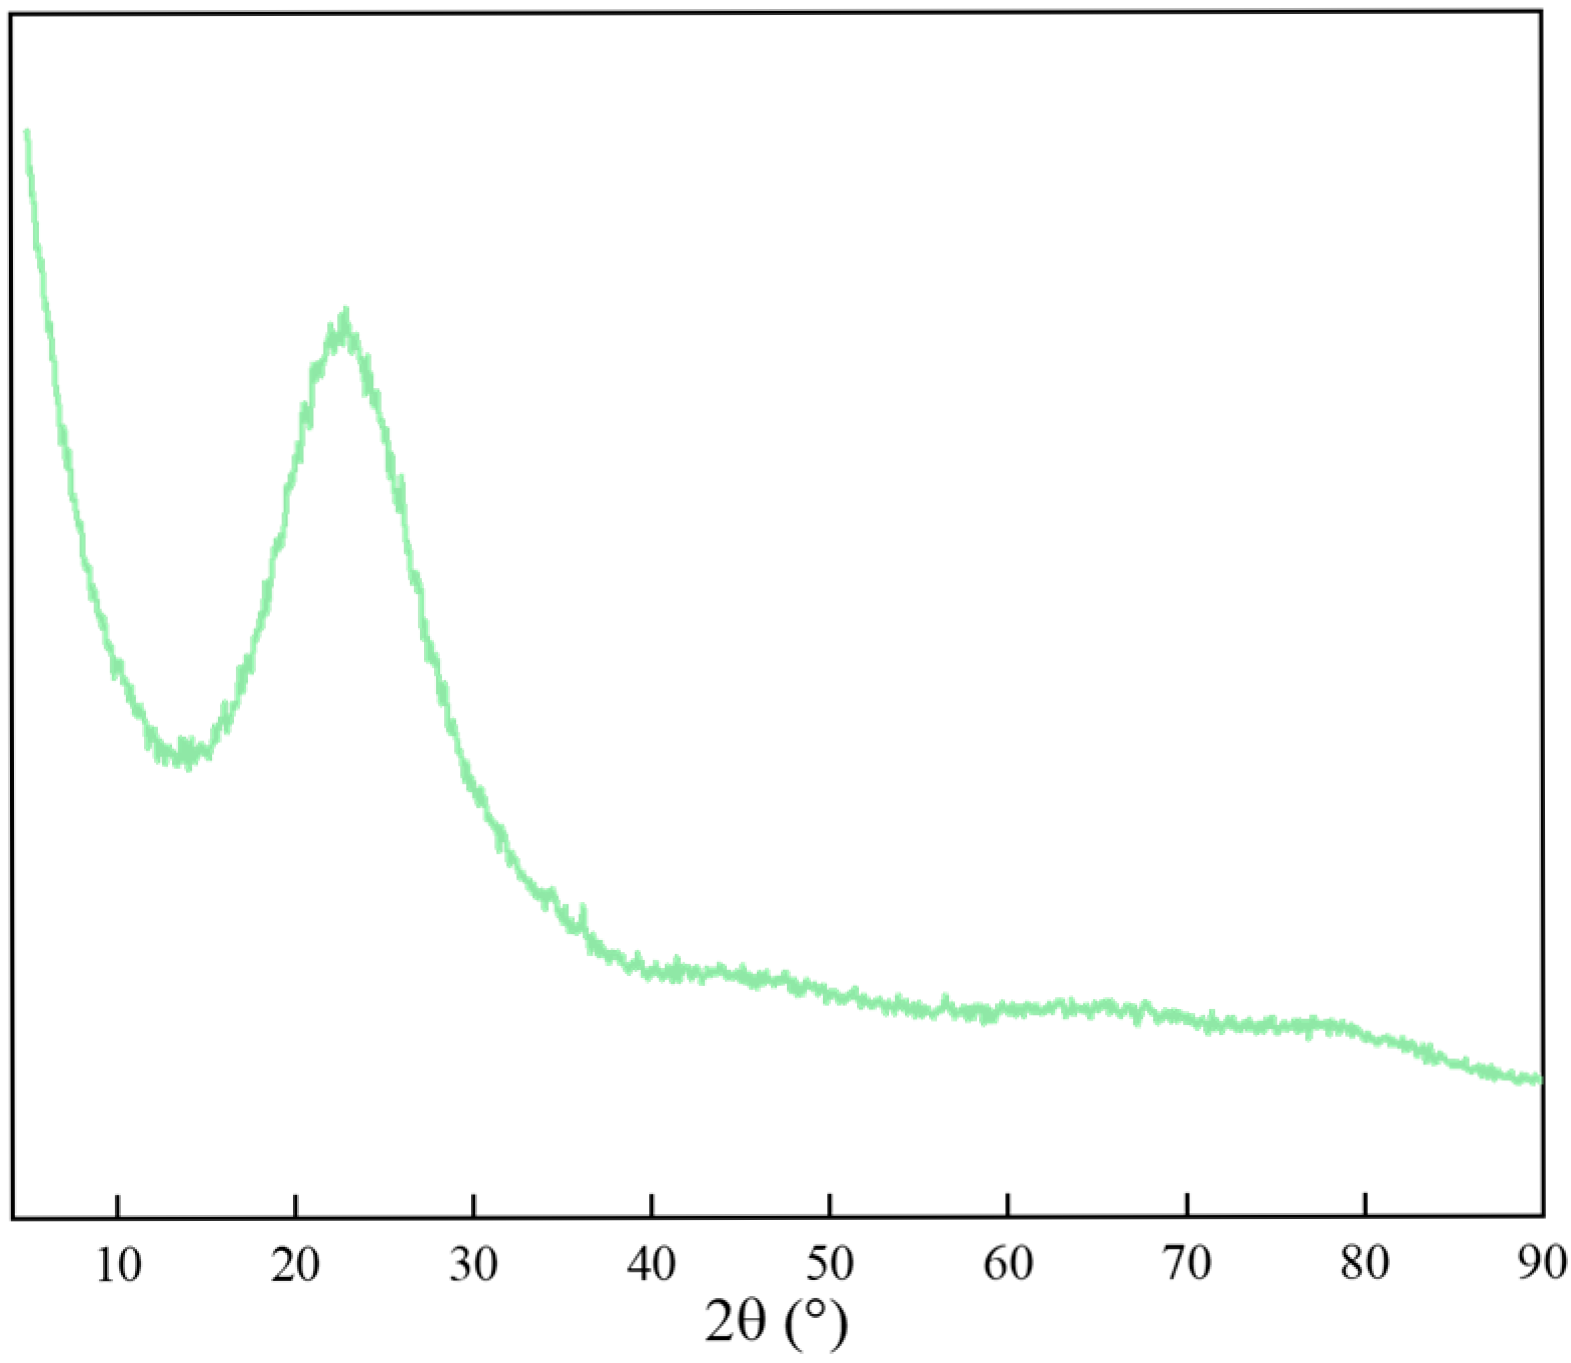
The NS used in the experiment was provided by Zhejiang Wanjing Co., Ltd. (Hangzhou, China), in the form of a white powder. It has a purity of 99%, a particle size of 25~35 nm, and a specific surface area of 175~225 m2/g. The XRD pattern of NS, presented in Figure 4, shows only a weak, broad scattering peak with no obvious crystalline peaks in the spectrum, confirming its amorphous nature [23].
Figure 4.
XRD analysis results of nano SiO2.
2.2. Experiment
2.2.1. Experimental Design
Based on preliminary exploratory tests and the backfill requirements of a deep mine in Yunnan, the mix design was formulated to ensure both adequate strength and optimal rheological properties for placement into underground goafs. The NS content was set at 0%, 0.5%, 1.0%, 1.5%, 2.0%, and 2.5% (by mass of cement). Due to the poor dispersibility of NS, was first thoroughly stirred with water to obtain a uniformly dispersed solution, which was then mixed with the solid material and stirred to form a homogeneous slurry.
A portion of the prepared slurry was taken for rheological testing. The remaining slurry was poured into a triple-cube mold 70.7 mm × 70.7 mm × 70.7 mm. After indoor standing for 24 h, the specimens were demolded and subjected to standard curing at a relative humidity of 95 ± 2% and a temperature of 20 ± 2 °C. The curing ages were set as 3, 7, and 28 days, respectively. The naming convention is as follows: NS1.5 represents CPB with 1.5% NS content; NS2.5-3d denotes CPB with 2.5% NS content and a curing age of 3 d, etc. The detailed mix proportions are shown in Table 3.
Table 3.
Experimental ratio.
2.2.2. Experimental Methods and Procedures
Based on the mix proportions in Table 3, the following tests were conducted: cement hydration heat test, setting time, transmission electron microscope (TEM), electron microscope, uniaxial compressive strength (UCS), thermogravimetric–differential thermogravimetric (TG–DTG), scanning electron microscope–energy spectrum analysis (SEM–EDS), and mercury intrusion porosimetry (MIP).
- (1)
- Cement hydration heat test. The test was conducted in accordance with GB/T 12959-2024 [24], using an eight-channel isothermal calorimeter (TAM AIR). The test temperature was set at 20 °C (instrument accuracy: ±20 µW) to monitor the heat release of the fresh backfill slurry over 140 h of hydration.
- (2)
- Setting time determination. The initial and final setting times were measured in accordance with GB/T 1346-2024 [25]. For the initial set, the test was repeated immediately upon the sample reaching the relevant state; consistency between two results confirmed the initial set. For the final set, two additional points on the sample were tested; agreement among the results confirmed the final set.
- (3)
- TEM observation. NS and Pure water were weighed according to Table 3. To ensure NS dispersion, the NS-water mixture was treated ultrasonically with an ultrasonic device for 10 min. A droplet of the solution was placed on a metal film using a dropper, and the dispersion state of NS was observed using a high-resolution field-emission transmission electron microscope (Tecnai G2 F30 S-twin).
- (4)
- UCS experiment. The experiment was conducted in accordance with the standard JGJ/T 70 “Test Methods for Basic Properties of Building Mortar” [26]. Since the specimen strength was significantly below 5 MPa, the loading rate was set to 20 N/s. Each group was tested in triplicate. The average of the three results was taken as the UCS value for the group, provided the maximum error among the specimens was within 15%.
- (5)
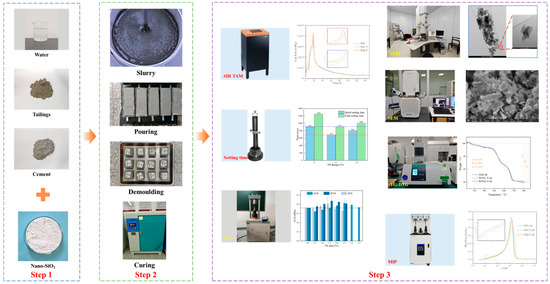
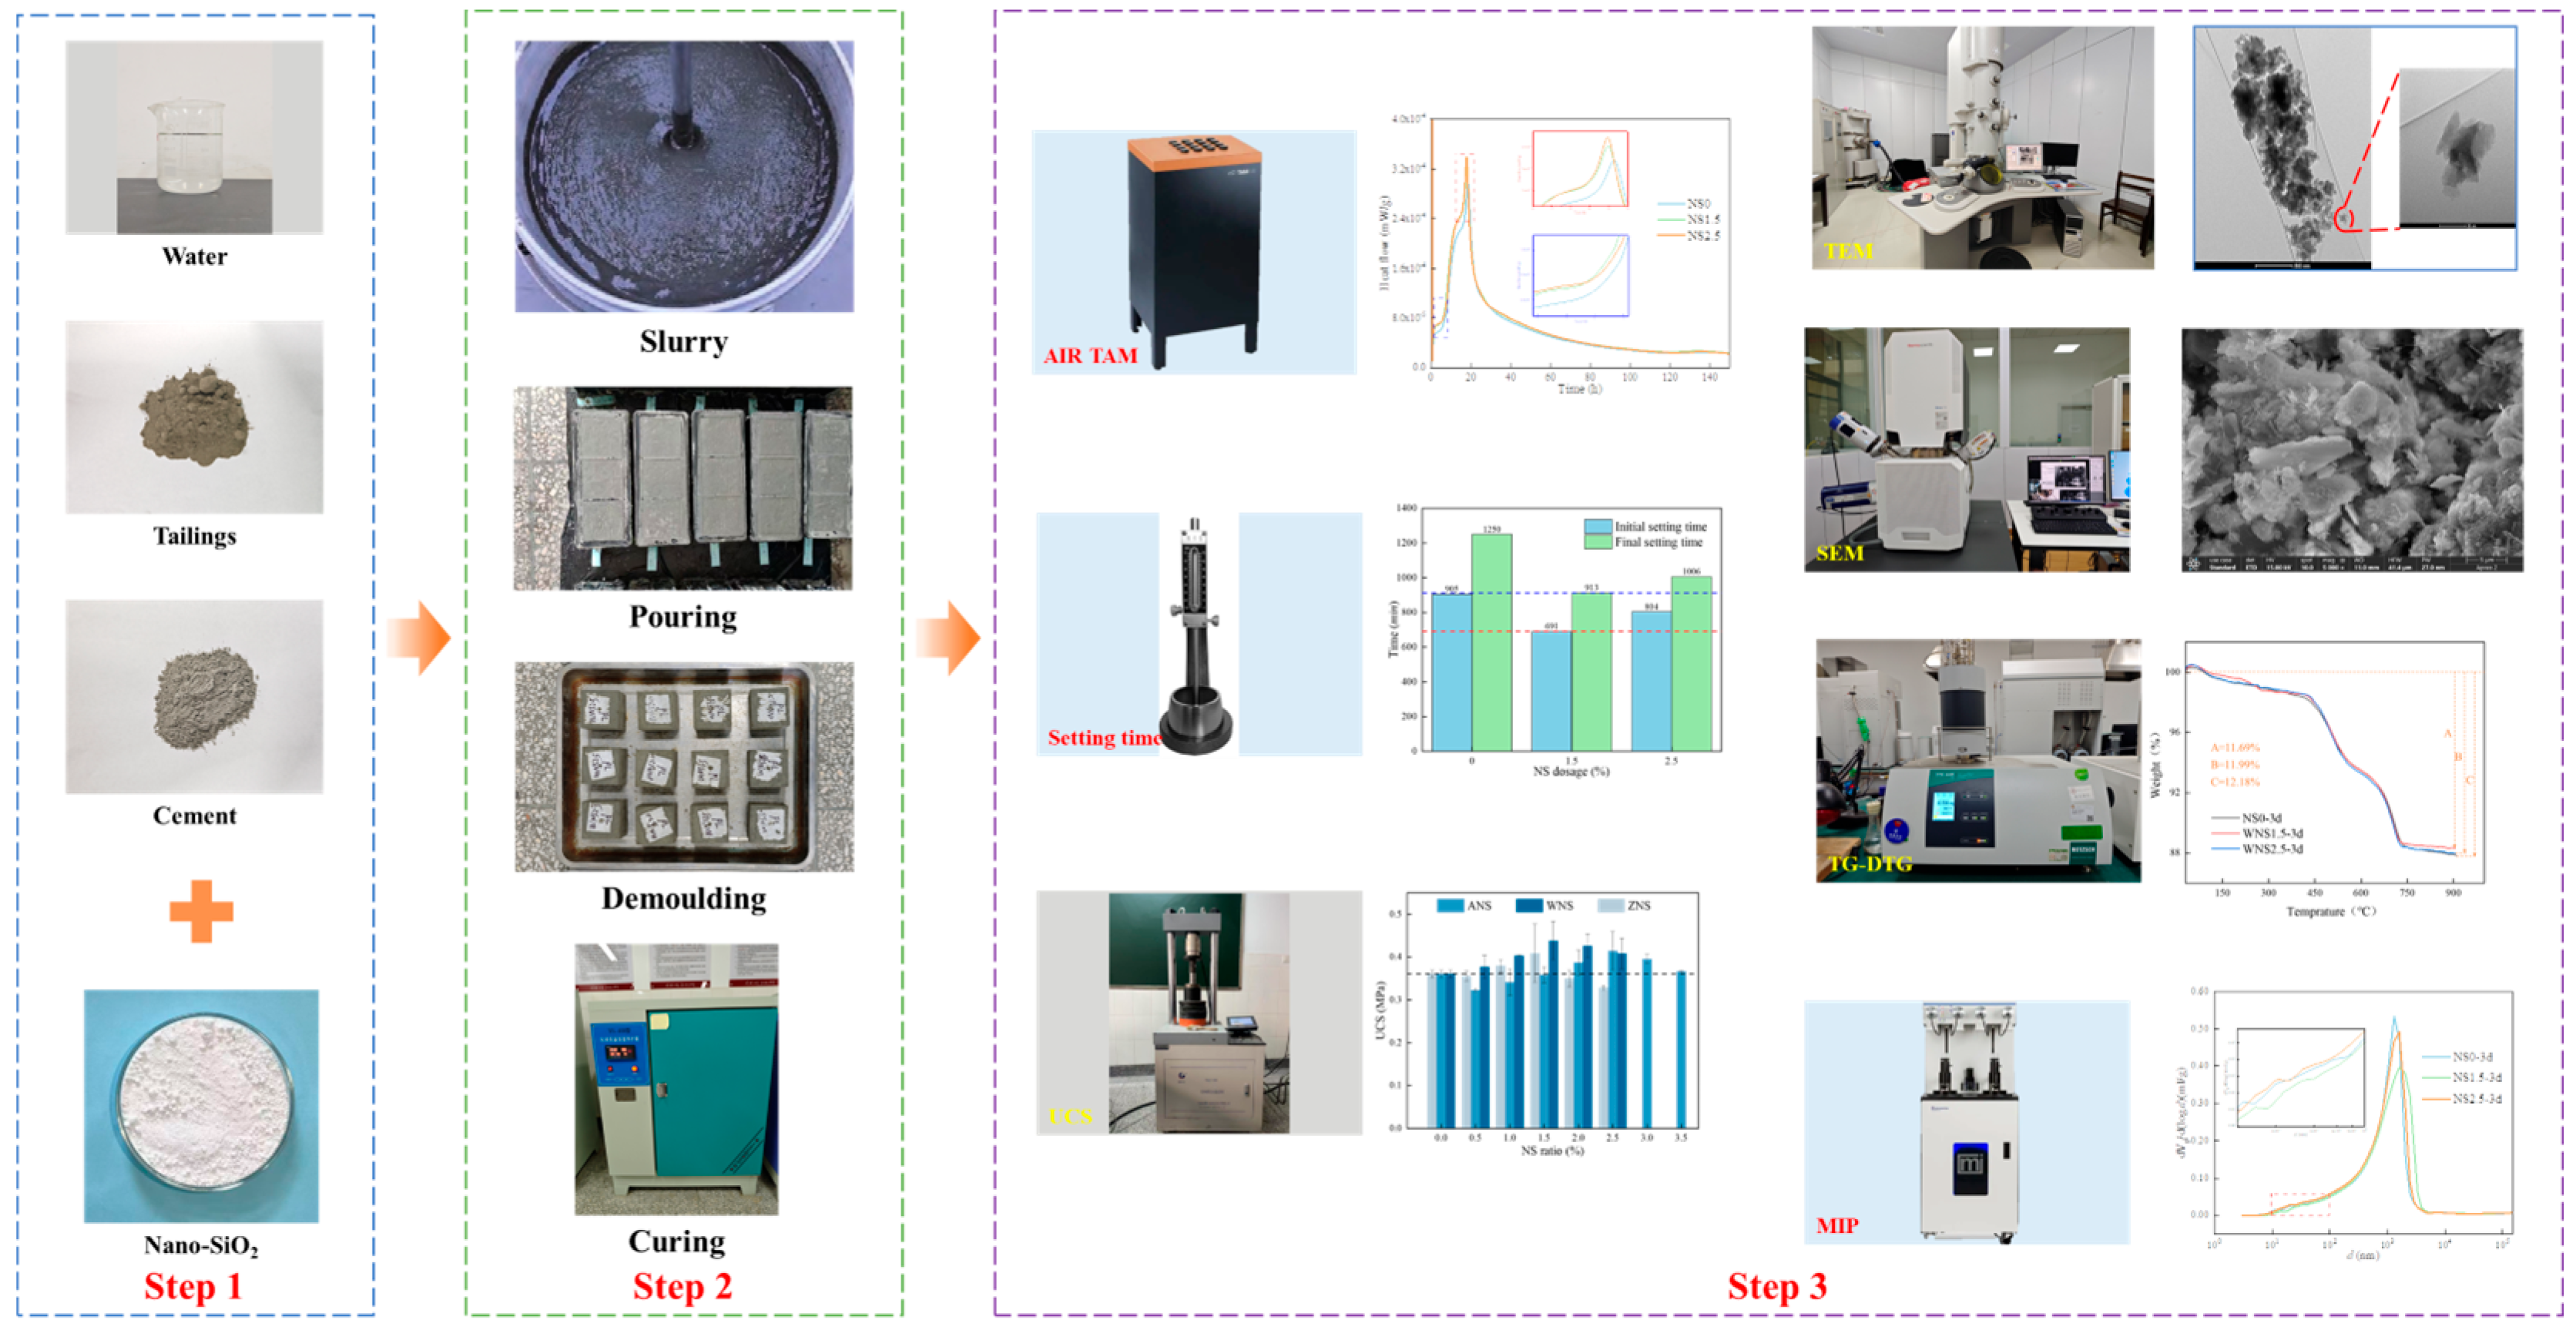
- Microscopic analysis. TG–DTG, SEM–EDS, and MIP analyses were performed. After UCS testing, specimens were broken into small pieces using a hammer. A well-formed fragment from the specimen core was selected, its hydration was terminated using anhydrous ethanol, and it was dried at a constant temperature of 40 °C for 24 h. The effects of NS on the pore structure and microstructure of CPB were analyzed based on MIP and SEM–EDS tests. Prior to SEM, the fragments were platinum-coated to enhance conductivity. The MIP test was performed using a Micromeritics AutoPore V 9620 (Norcross, GA, USA) with a test aperture range of 3 nm to 800 µm. SEM–EDS was conducted using a Thermo Scientific Apreo 2 S (Waltham, MA, USA) at 15 kV voltage and 5000 times magnification. In addition, the central fragment from the UCS test was ground into powder in an agate mortar, sieved through a 200-mesh sieve, and 100 g of the screened powder was used for the TG–DTG experiment (Ata 449). The test temperature range was 30 °C ~ 900 °C with a heating rate of 10 °C/min. The experimental flowchart is shown in Figure 5.Figure 5. Experimental flowchart. (The chart results in Figure 5 are detailed below).
3. Analysis of Effect
3.1. UCS Analysis
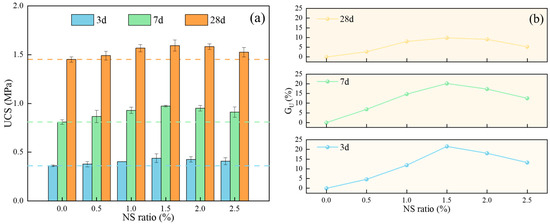
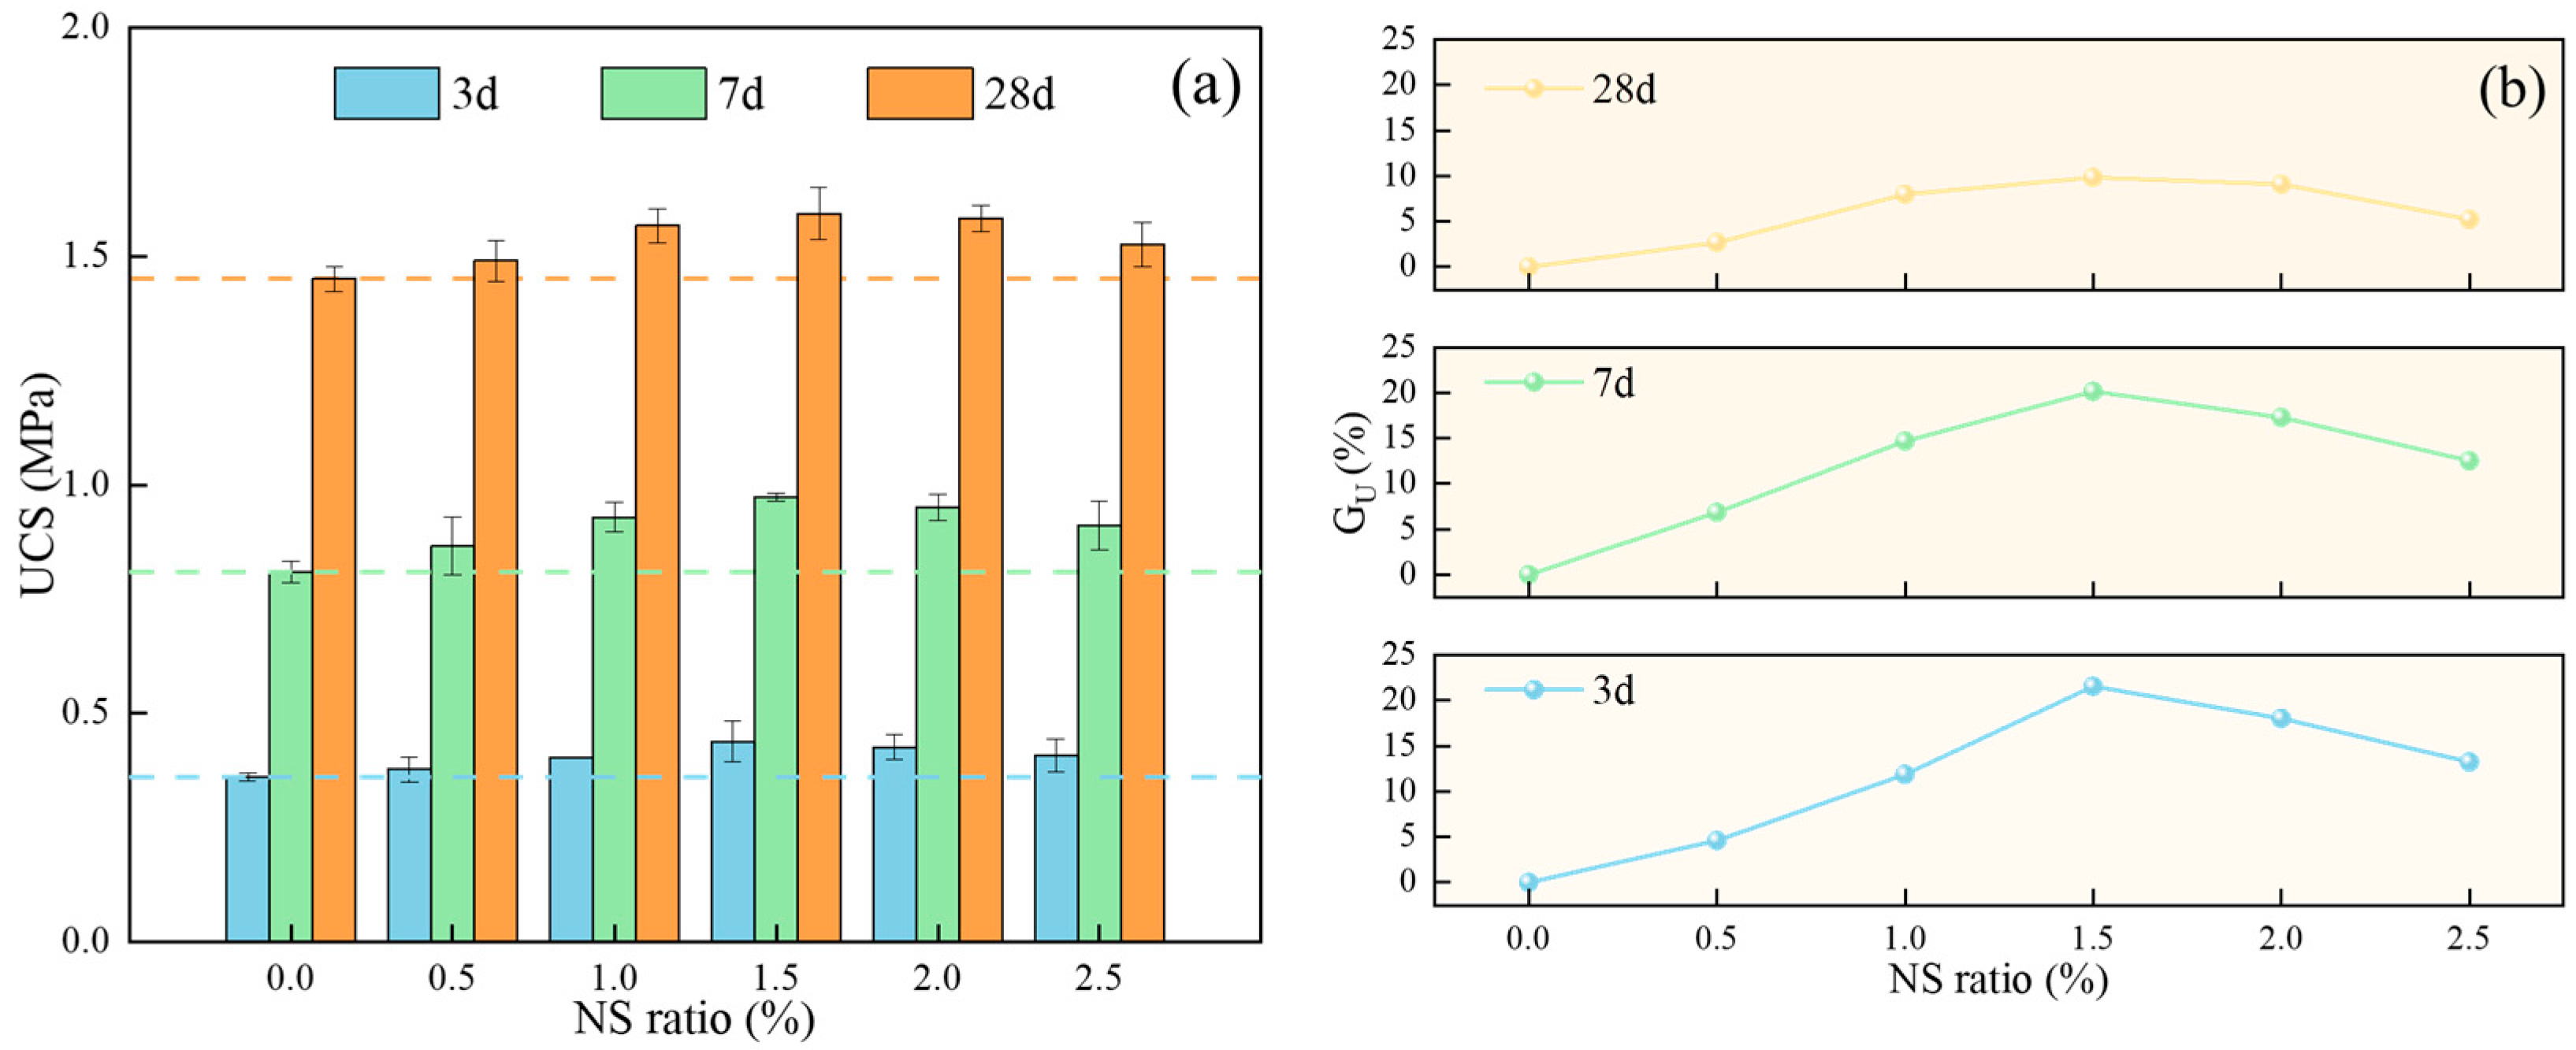
The UCS and UCS growth rate (GU) of CPB with different dosages of NS are shown in Figure 6. The GU is calculated as:
where UCSNS and UCS0 are the uniaxial compressive strengths (MPa) of the NS-modified and control (0% NS) groups, respectively.
Figure 6.
The relationship between CPB strength and NS content: (a) UCS; (b) GU.
The influence of NS dosage on the strength of CPB is shown in Table 4. The UCS values for the control group (NS0) at curing ages of 3, 7, and 28 days were 0.361 MPa, 0.810 MPa, and 1.451 MPa, respectively. With increasing curing age, the growth rate of UCS between adjacent curing ages in the control group decreased from 124.38% to 79.14%. Samples with other NS contents exhibited similar growth rate trends. This shows that for a constant NS content, the UCS of CPB increases with curing age, while GU gradually slows down with curing age. Table 4 is the influence of NS dosage on CPB strength
Table 4.
The influence of NS dosage on CPB strength.
At a given curing age, the UCS of the samples initially increased and then decreased with increasing NS content, reaching a maximum at 1.5% NS (Figure 6). This shows that a dosage of 1.5% can improve the UCS of CPB, while a dosage of 2.5% has a negative impact. In addition, the UCS increase from 3 to 7 days was 0.449 MPa for NS0 and 0.535 MPa for NS1.5, respectively. From 7 to 28 days, the increase was 0.641 MPa for NS0 and 0.621 MPa for NS1.5, respectively. This shows that NS has a more pronounced effect on the early-age strength development of CPB compared to its long-term strength contribution.
Statistical analysis of UCS results indicates that both NS dosage and curing age significantly influence the mechanical properties of CPB. Two-way ANOVA revealed highly significant main effects of NS content (F(5, 72) = 12.34, p < 0.0001) and curing age (F(2, 72) = 1973.1, p < 0.0001) on UCS. However, the interaction between the two factors was not statistically significant (p = 0.0637), suggesting that the enhancing effect of NS remained consistent across different curing ages. As shown in Figure 6, UCS values for all mix designs increased with curing age from 3 to 28 days.
Tukey’s post hoc test showed that the UCS enhancement was statistically significant (p < 0.05) for all NS dosage groups compared to the control. At 1.5% dosage, UCS reached its maximum at all curing ages (3 days: 0.439 MPa, 7 days: 0.974 MPa, 28 days: 1.594 MPa). Beyond 1.5% NS content, UCS exhibited a slight decreasing trend. However, no significant difference was observed between the 1.5% and 2.0% groups (p > 0.05). These results indicate that NS has an optimal dosage of 1.5% for maximizing UCS in CPB.
3.2. Hydration Heat Analysis
Based on UCS test results, within the NS dosage range of 0 to 2.5%, the 1.5% dosage demonstrated the most significant improvement in CPB mechanical properties, while the 2.5% dosage showed a relatively poor effect. To further analyze the impact of these two dosages, their influence on cement hydration heat was examined.
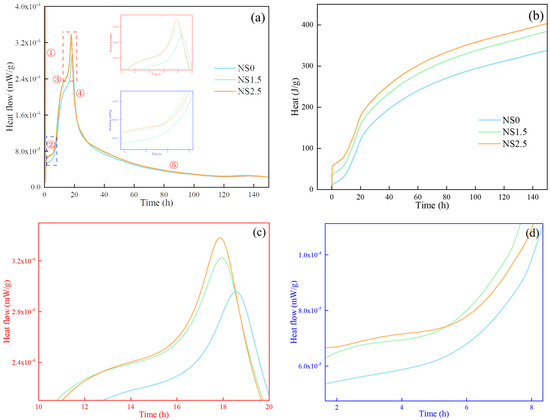
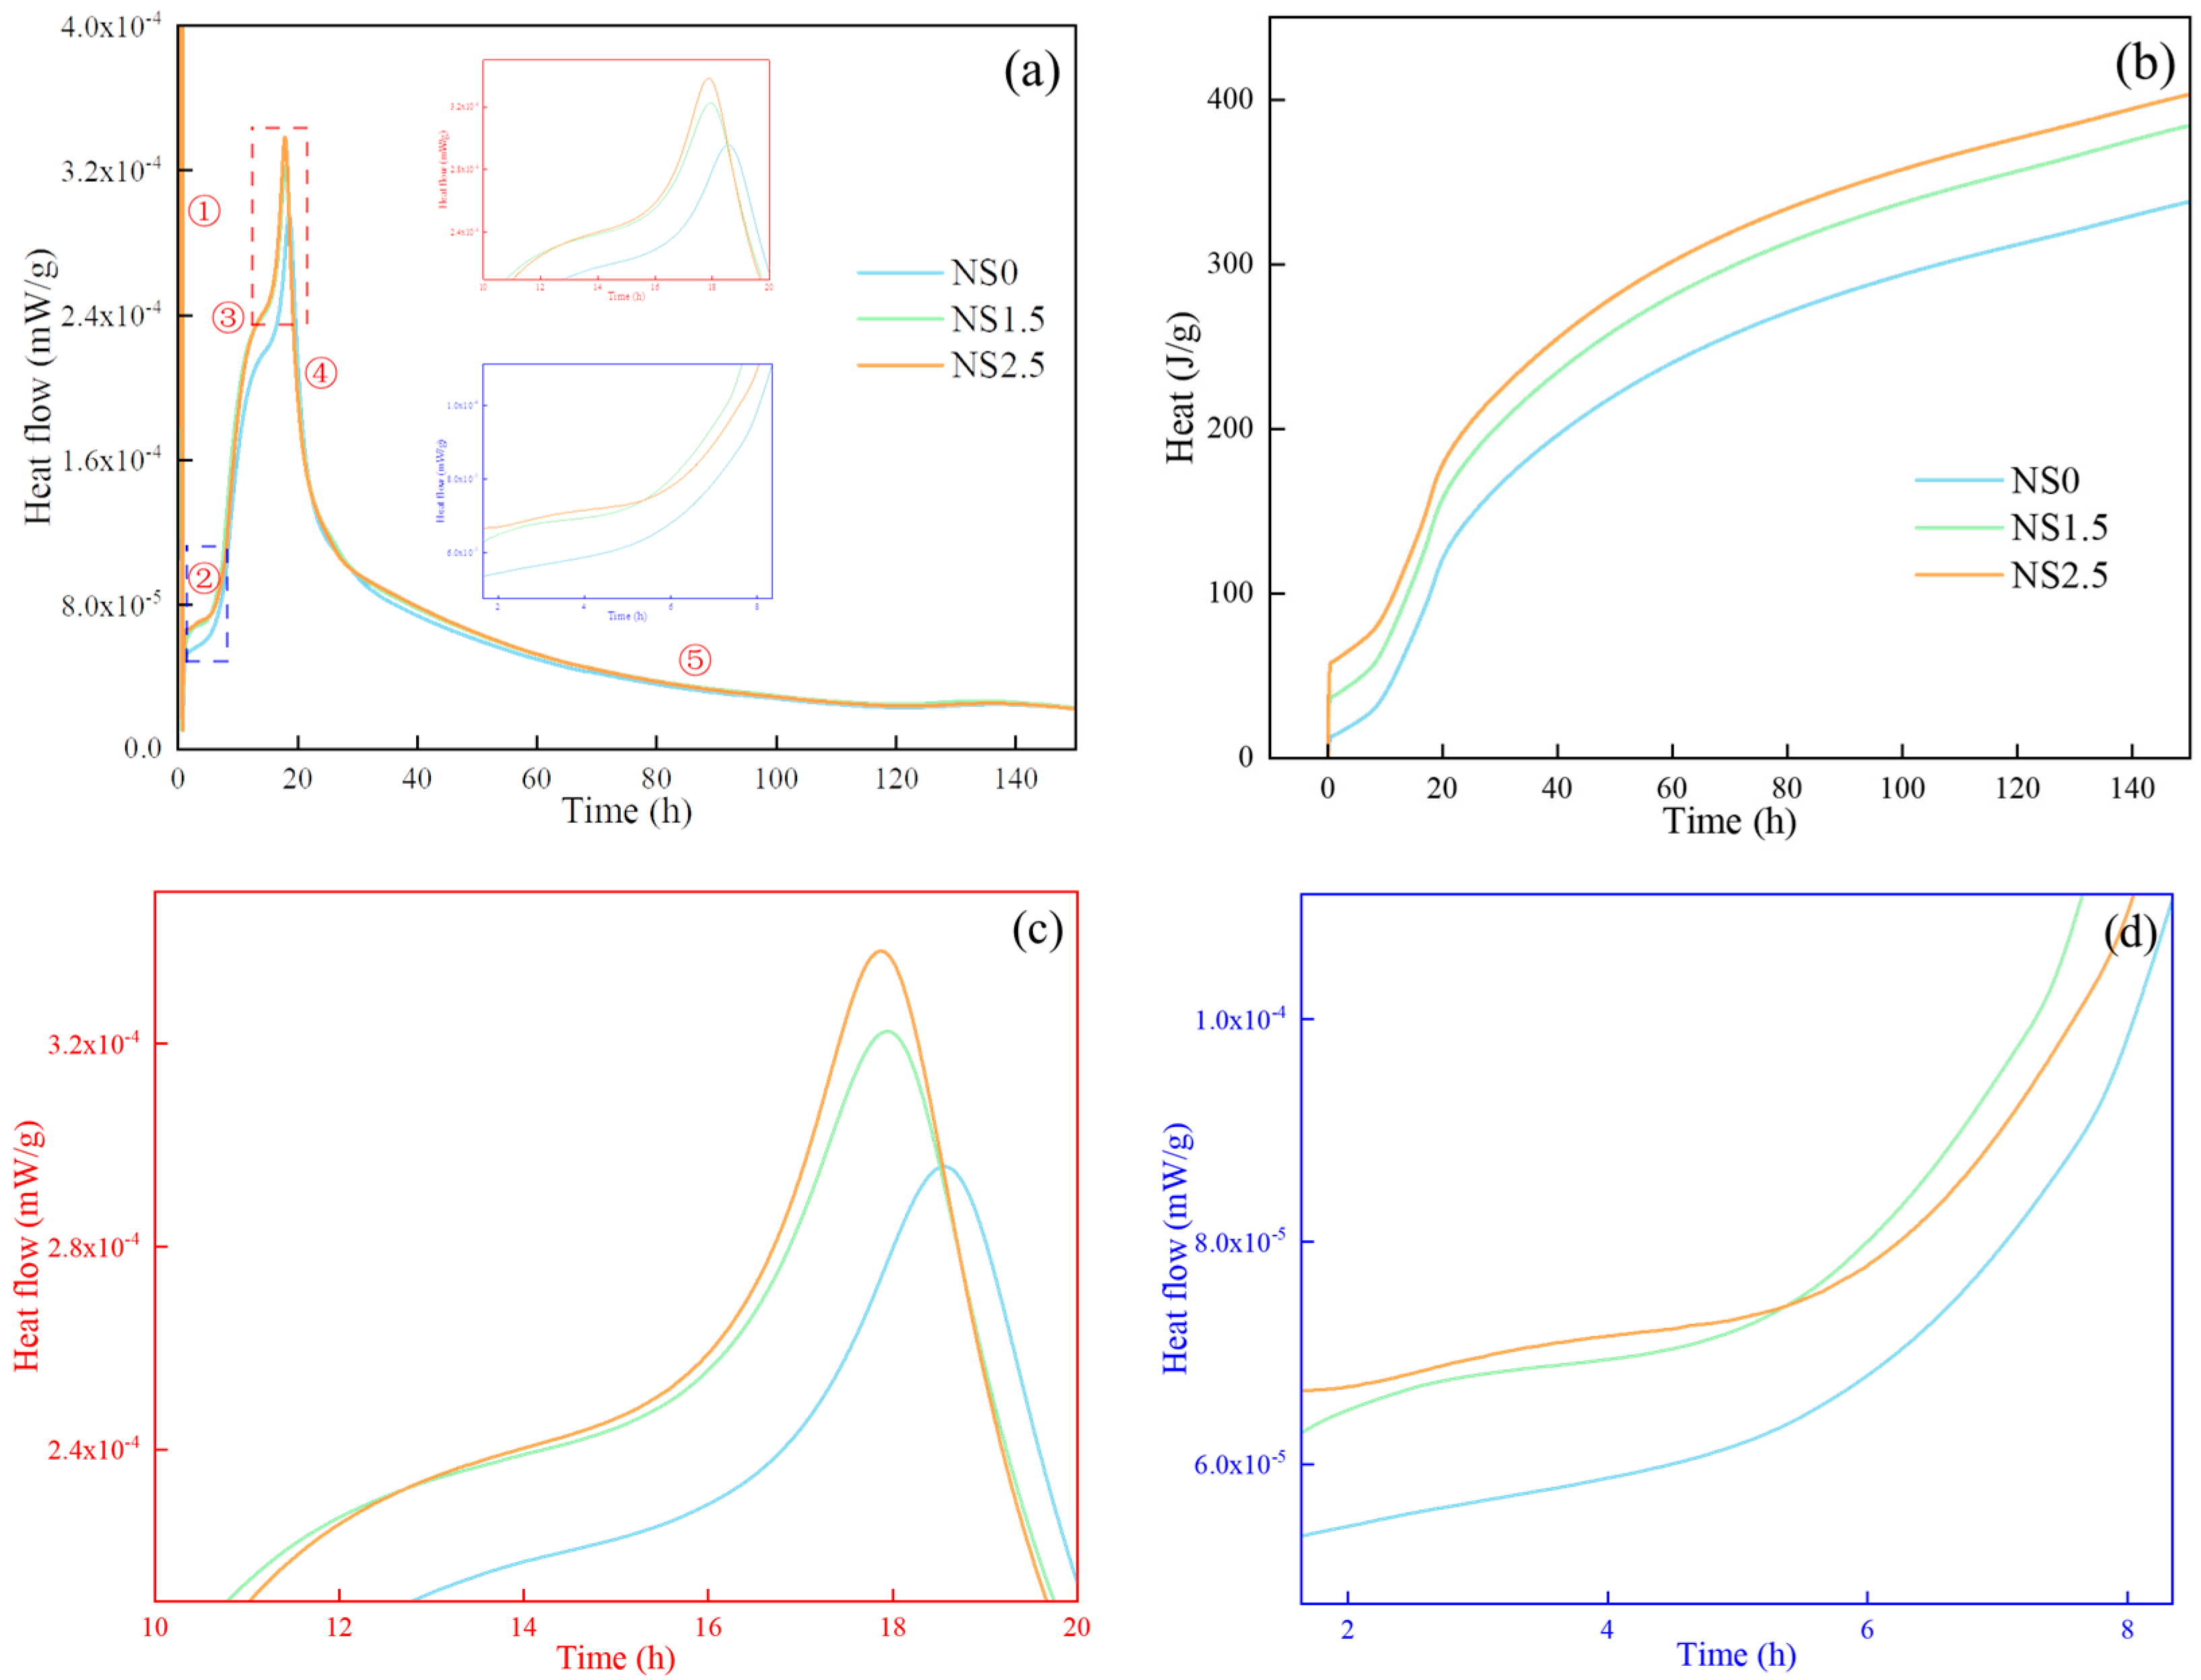
Figure 7a shows the hydration heat release rate as a function of time. The cement hydration process can generally be divided into five stages: rapid reaction, induction, acceleration, deceleration, and attenuation periods. These correspond, respectively, to the initial violent reaction upon water contact, the inactive phase, the rise in the hydration rate, its gradual decline, and its approach to zero. These stages are marked 1 to 5 in Figure 7a. Figure 7b shows the cumulative heat release. The cumulative heat release increased over time, with values from highest to lowest being NS2.5 (445.63 J/g), NS1.5 (429.33 J/g), and NS0 (382.57 J/g).
It can be seen from Figure 7a that the times for NS0, NS1.5, and NS2.5 to reach the exothermic peak of the hydration acceleration period were 18.57 h, 17.98 h, and 17.85 h, respectively. Compared to NS0, the times for NS1.5 and NS2.5 were shortened by 35.4 min and 43.2 min, indicating that the incorporation of NS shortens the induction period. The minor 7.8 min time interval between NS1.5 and NS2.5 indicates that NS content has a negligible effect on the time to reach the hydration acceleration period. In addition, NS1.5 and NS2.5 exhibited greater heat release during the induction period than NS0, indicating NS addition increases the early hydration heat release rate. It can be seen from Figure 7b that NS2.5 exhibits an accelerated hydration heat rate and increased cumulative heat release.
3.3. TEM Analysis
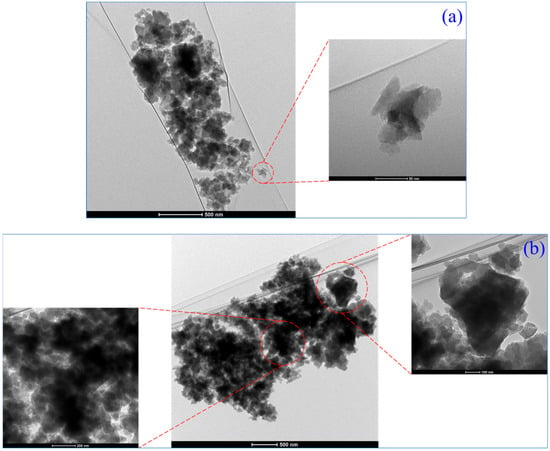
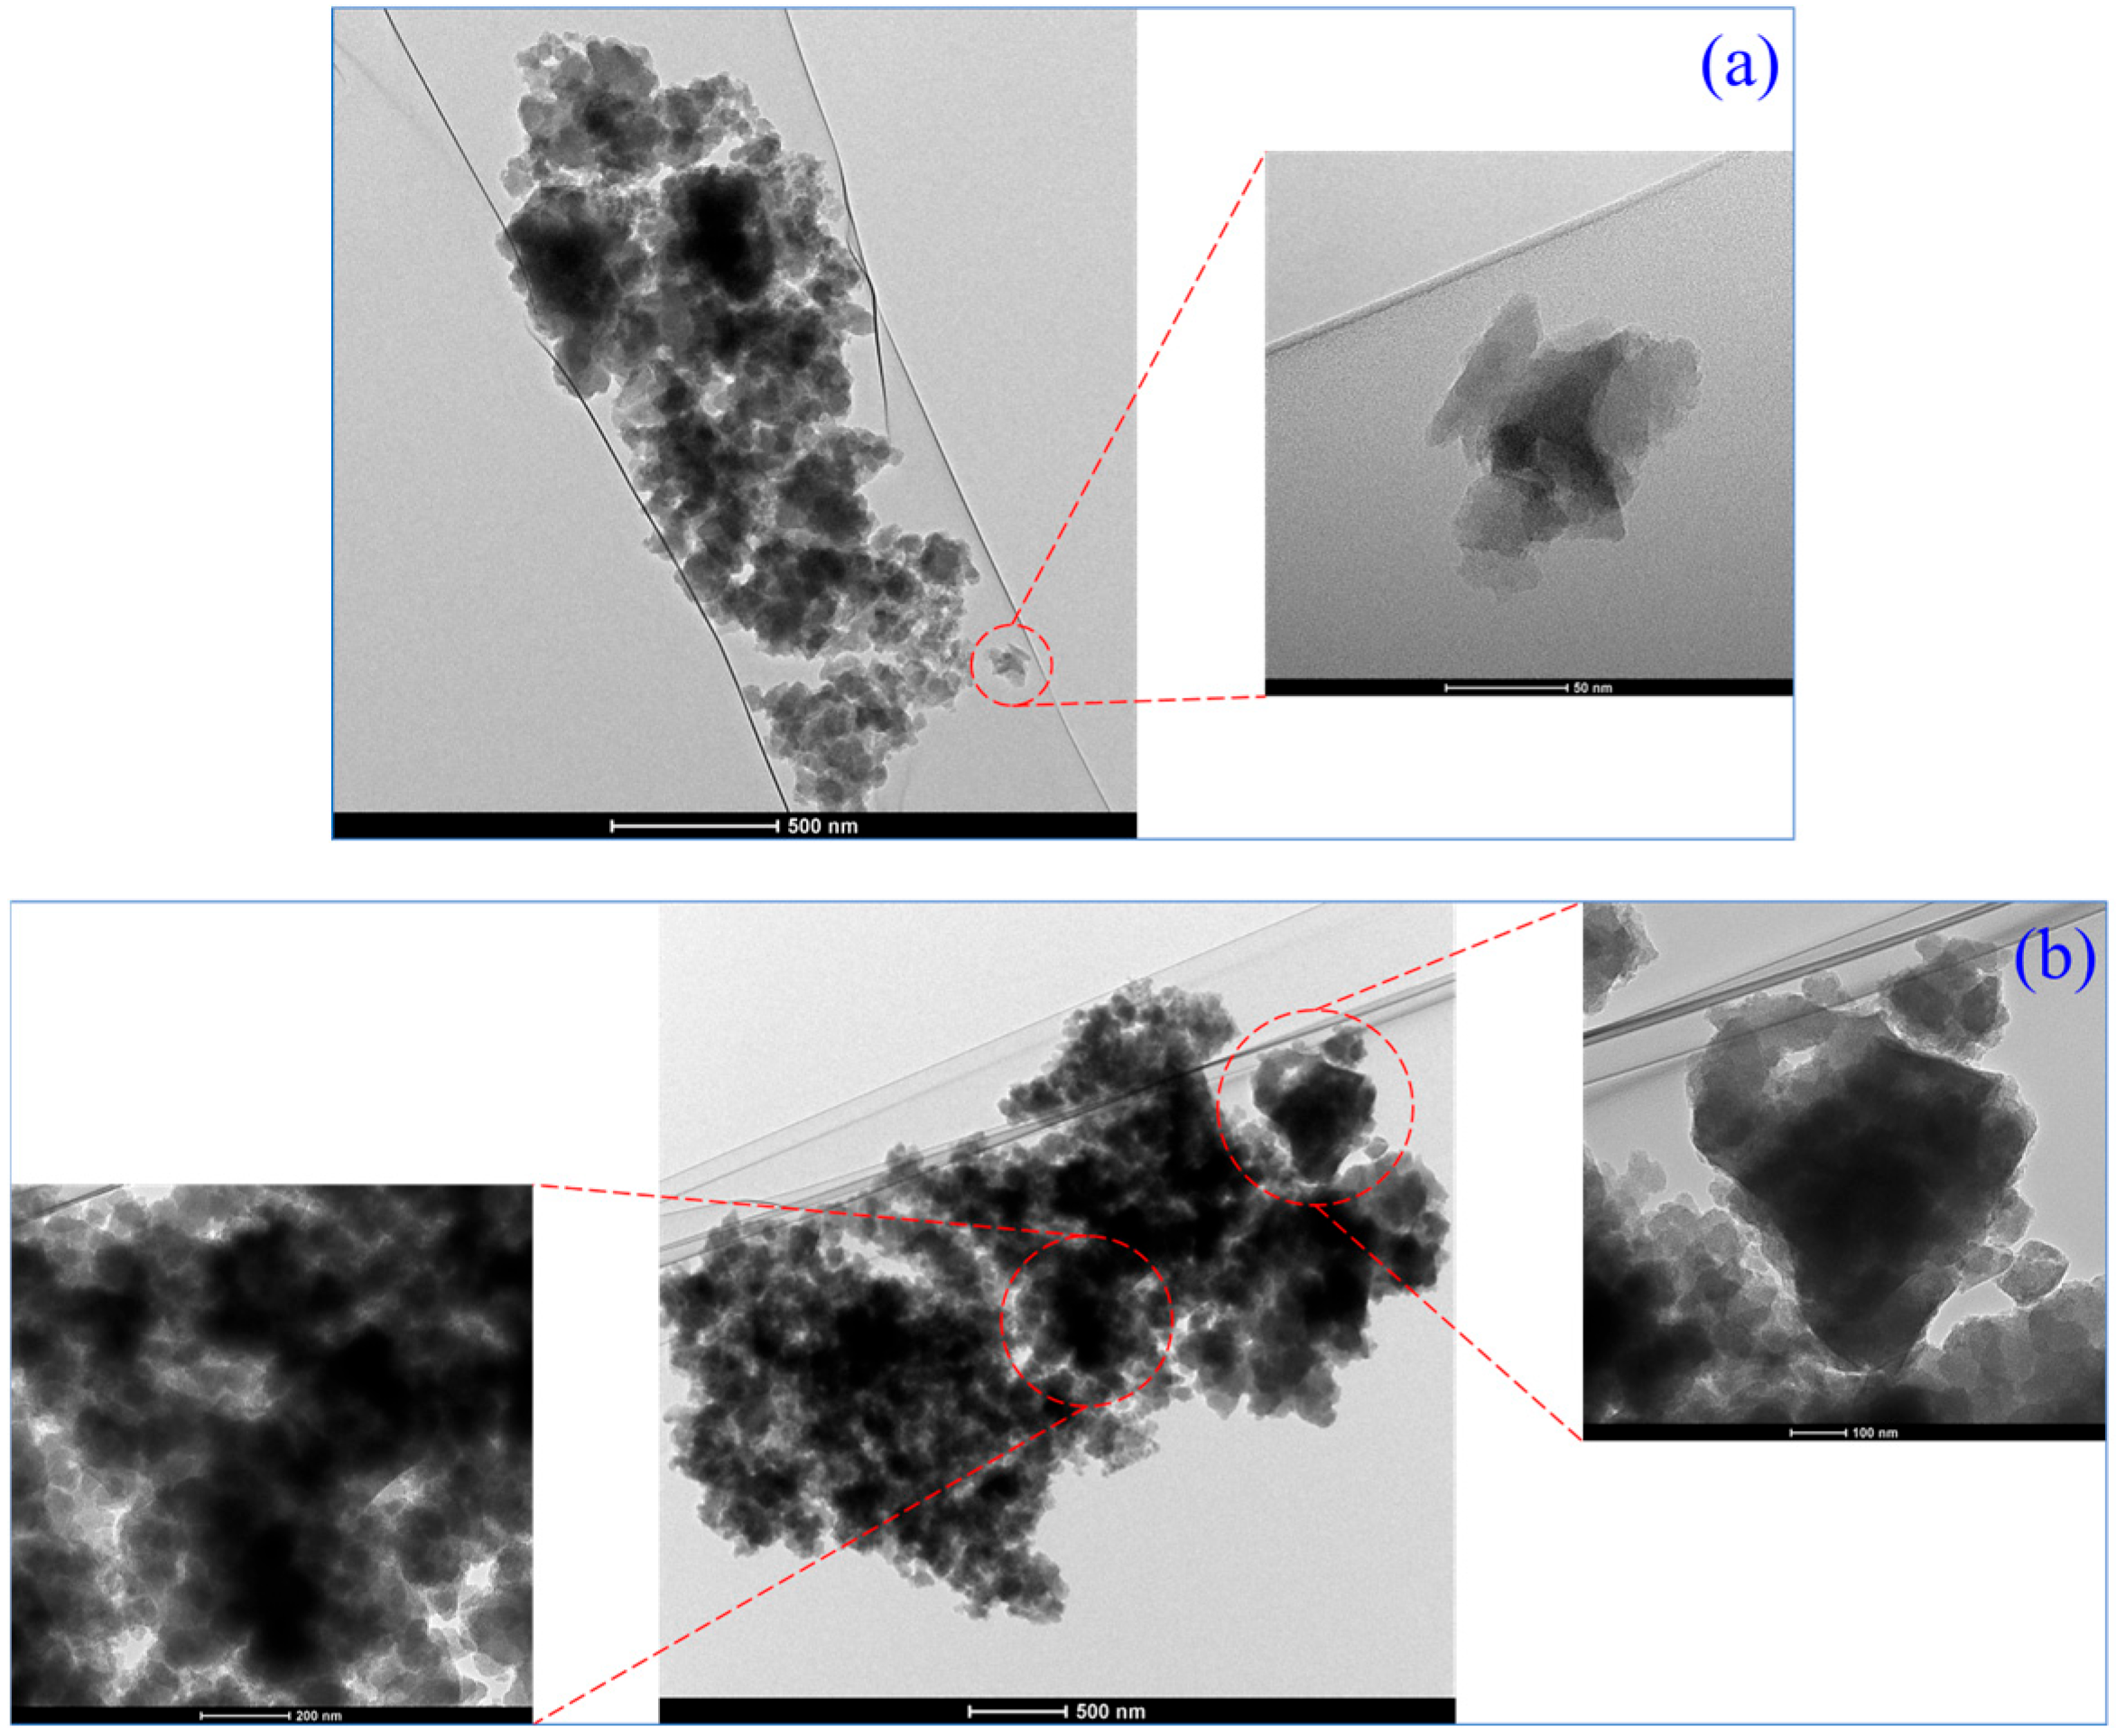
TEM was carried out on dispersion solutions with different NS contents, and the results are shown in Figure 8. The gray areas in the images correspond to regions of stacked NS particles, while the black areas result from the failure of the electron beam to penetrate thick NS aggregates. The stacking phenomenon is caused by particle deposition during water evaporation. Gray areas indicate good dispersion of NS, whereas black areas signify poor dispersion and severe agglomeration. The large size of NS deposits and aggregates caused breakage, curling, and edge warping of the metal film.
Figure 8.
TEM results under different NS content: (a) 1.5% NS; (b) 2.5% NS.
Figure 8a,b show TEM results for NS contents of 1.5% and 2.5%, respectively. At 1.5%, the image is predominantly gray with small black regions; the upper part shows fewer black regions surrounded by gray, and the lower part is dominated by relatively scattered NS particles. At 2.5%, the image is generally black with scattered gray edges, indicating extreme agglomeration. Magnification of the black region in Figure 6b reveals that a large number of NS stacks form opaque black blocks.
3.4. Setting Time Determination
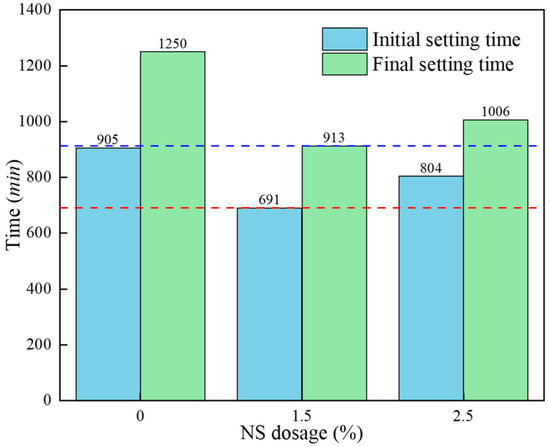
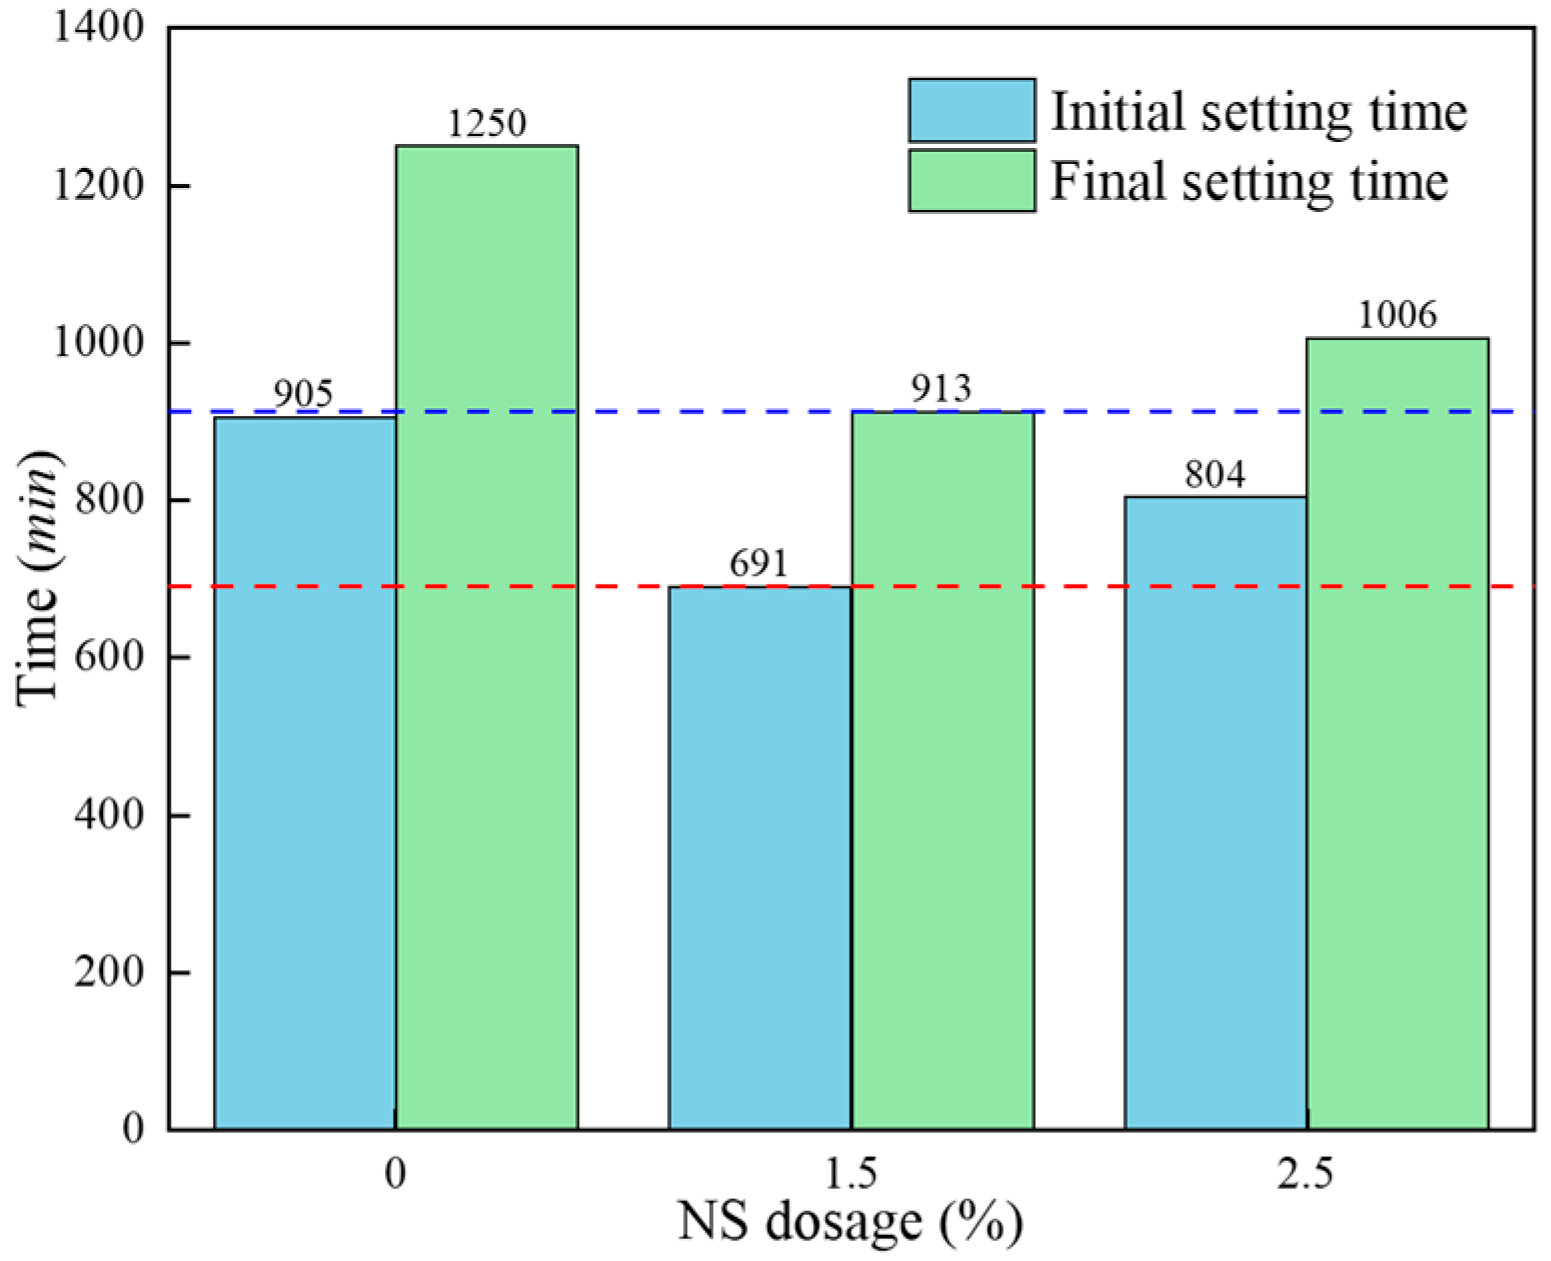
The setting time analysis results are shown in Figure 9. To facilitate comparison of the effect of NS dosage on CPB setting time, red and blue lines have been added to the graph. The red line indicates the initial setting time for NS1.5 (691 min), while the blue line represents the final setting time for NS2.5 (913 min). Compared to NS0, the initial and final setting times of NS1.5 were shortened by 214 min and 337 min, respectively, and those of NS2.5 by 101 min and 244 min, respectively. This confirms that NS incorporation accelerates both the initial and final setting of CPB. NS0 reached initial setting at 905 min, while NS1.5 reached final setting at 913 min. Thus, when NS0 had just achieved initial set, the NS1.5 sample was nearly fully set.
Figure 9.
Determination of setting time.
Combining the hydration heat and TEM results, NS2.5 exhibited the highest hydration heat release rate and cumulative heat release; the setting time was longer yet had a longer setting time than NS1.5. Although NS1.5 showed lower heat metrics than NS2.5, its setting time was shorter. This is attributed to the optimal dispersion of NS at 1.5%, which maximizes the acceleration of the early hydration reaction. In contrast, the 2.5% content leads to particle agglomeration and reduces early hydration efficiency. While cumulative heat release and peak time primarily reflect the overall degree of hydration, the early hydration rate and particle dispersion are the dominant factors controlling setting time.
3.5. Microstructural Analysis
3.5.1. TG-DTG Analysis
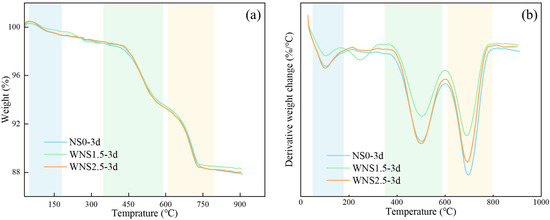
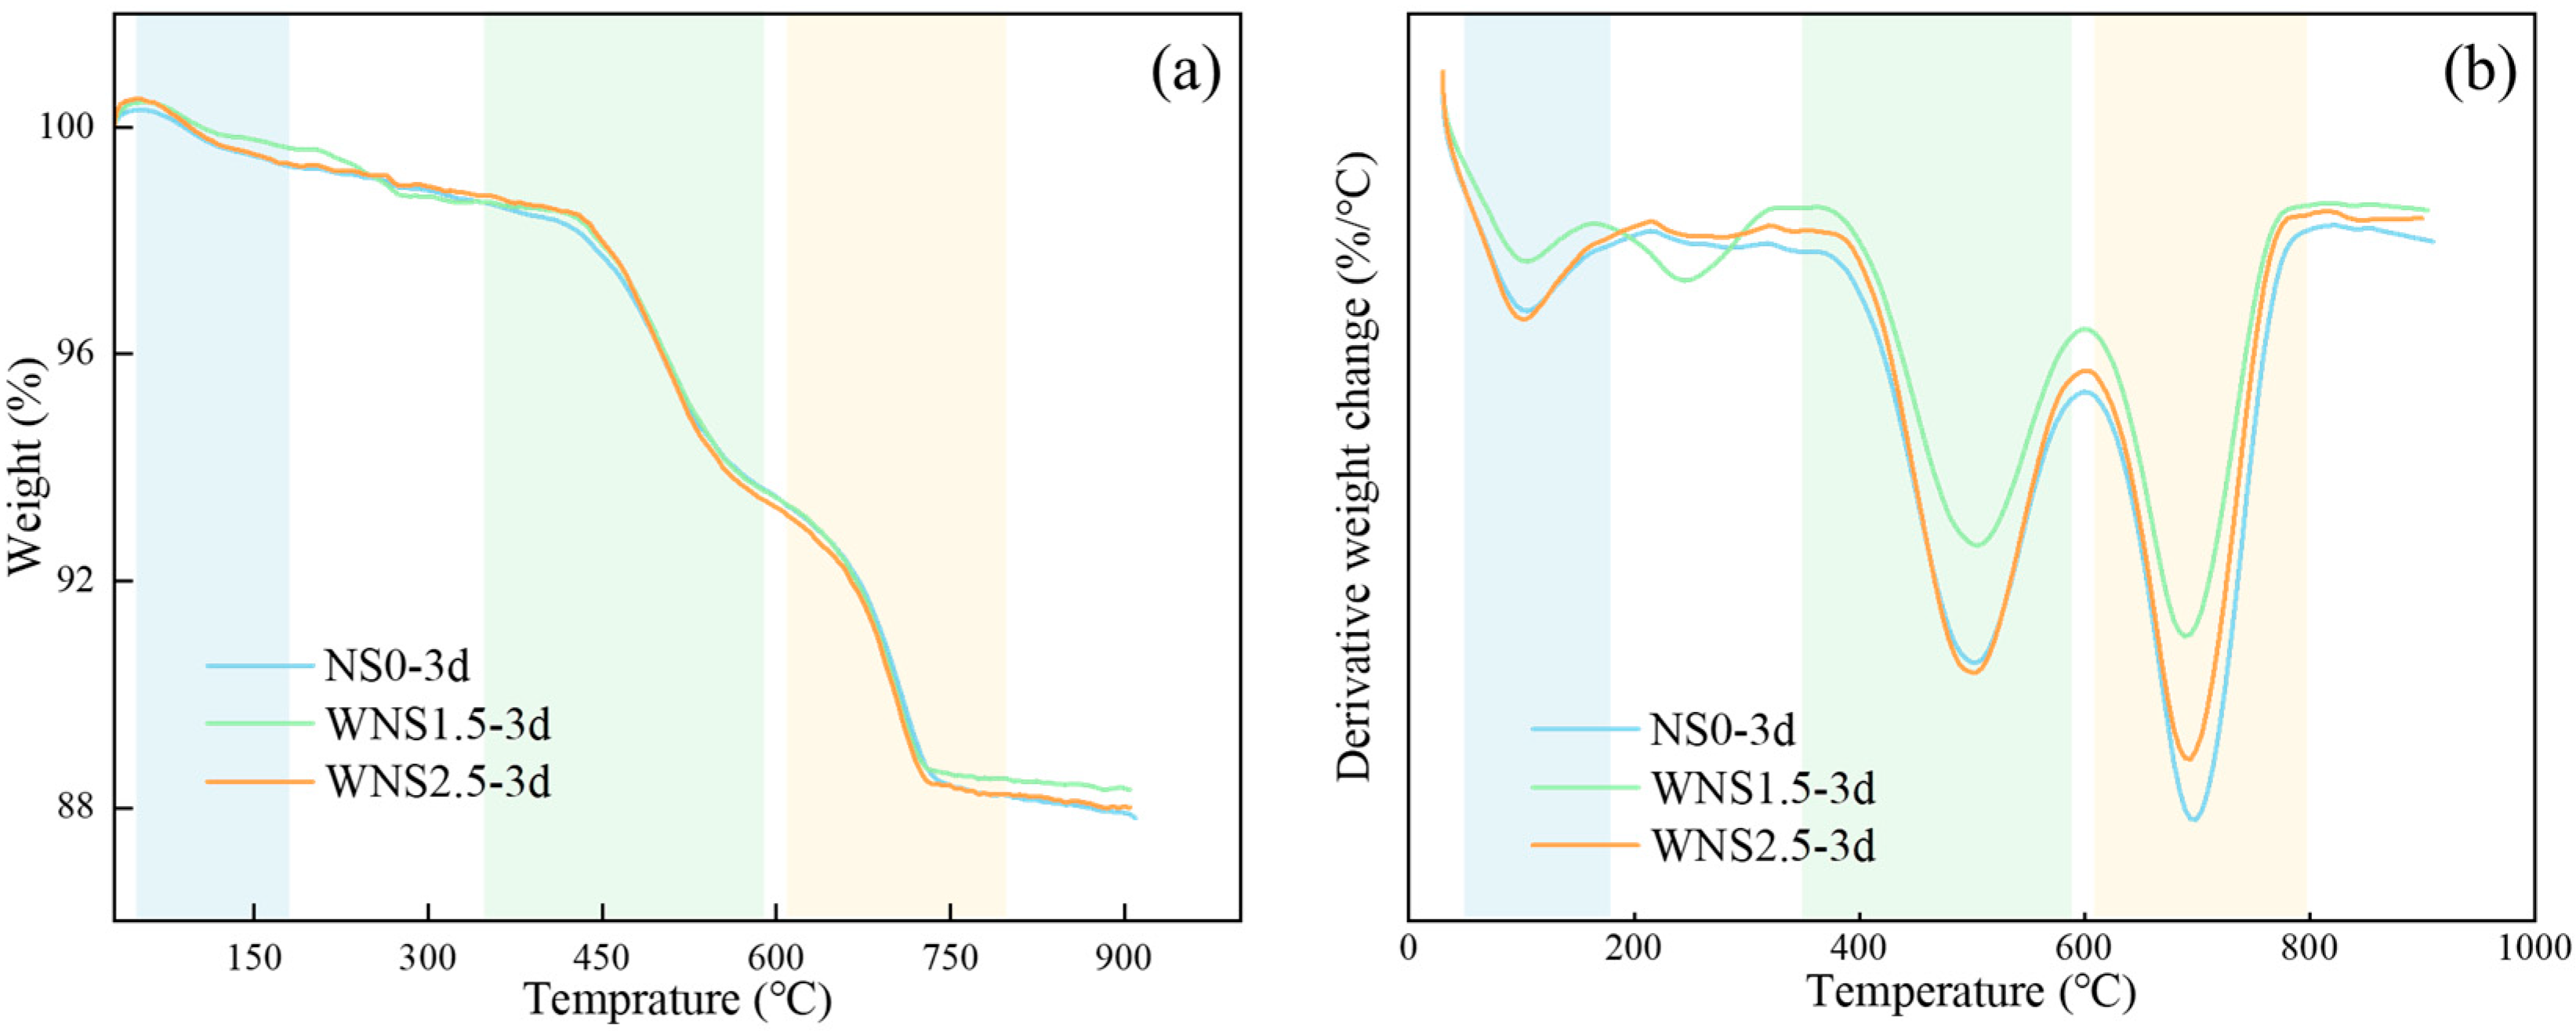
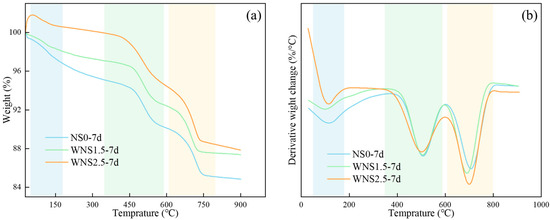
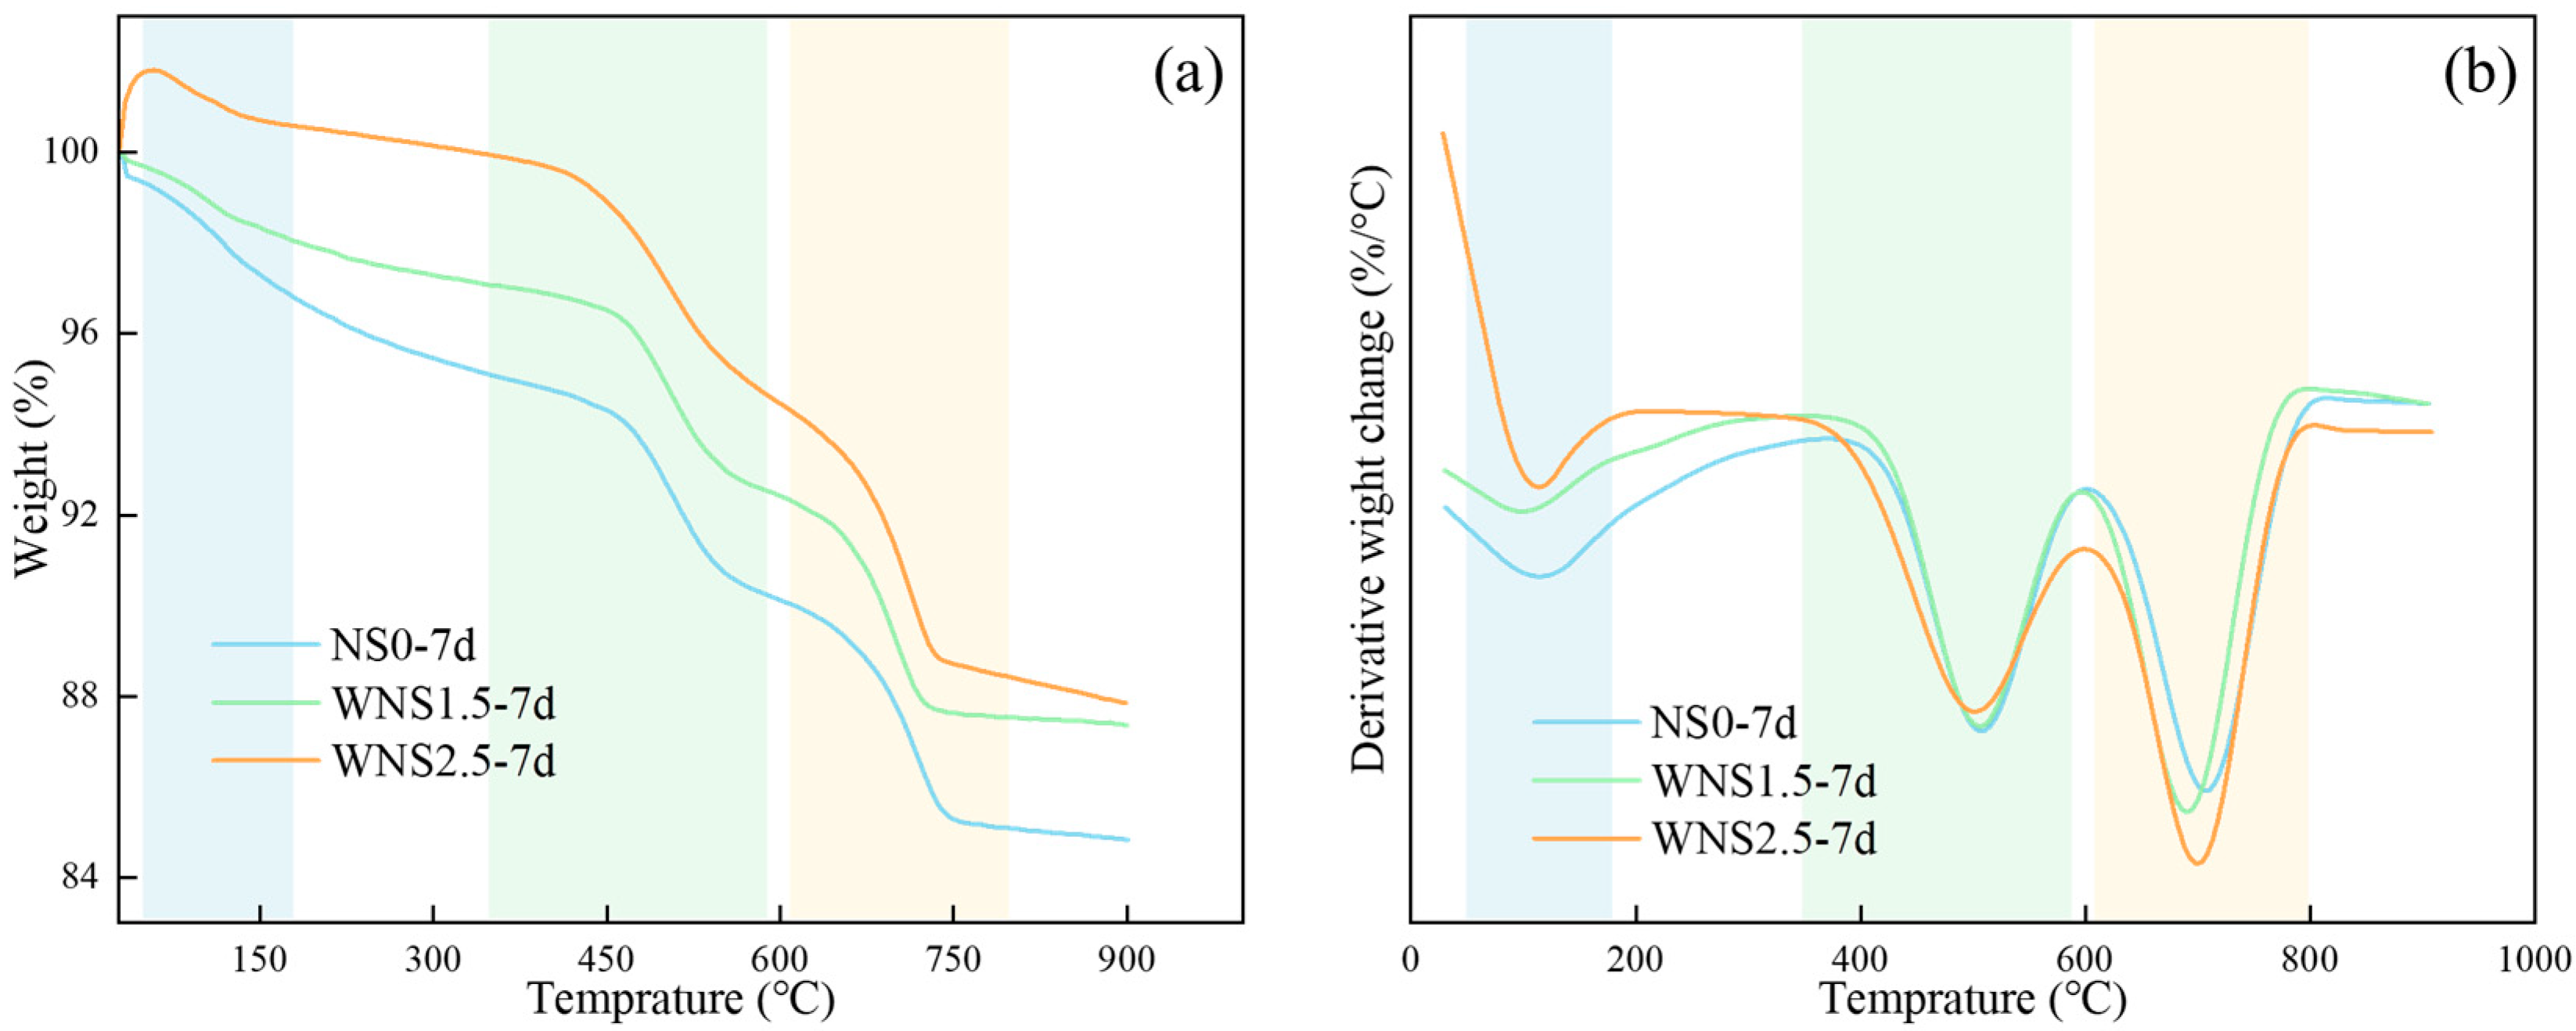
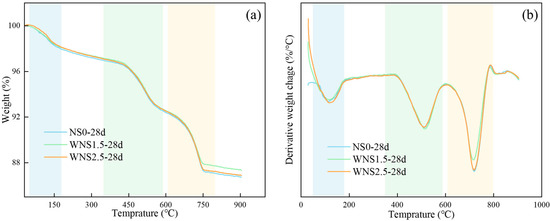
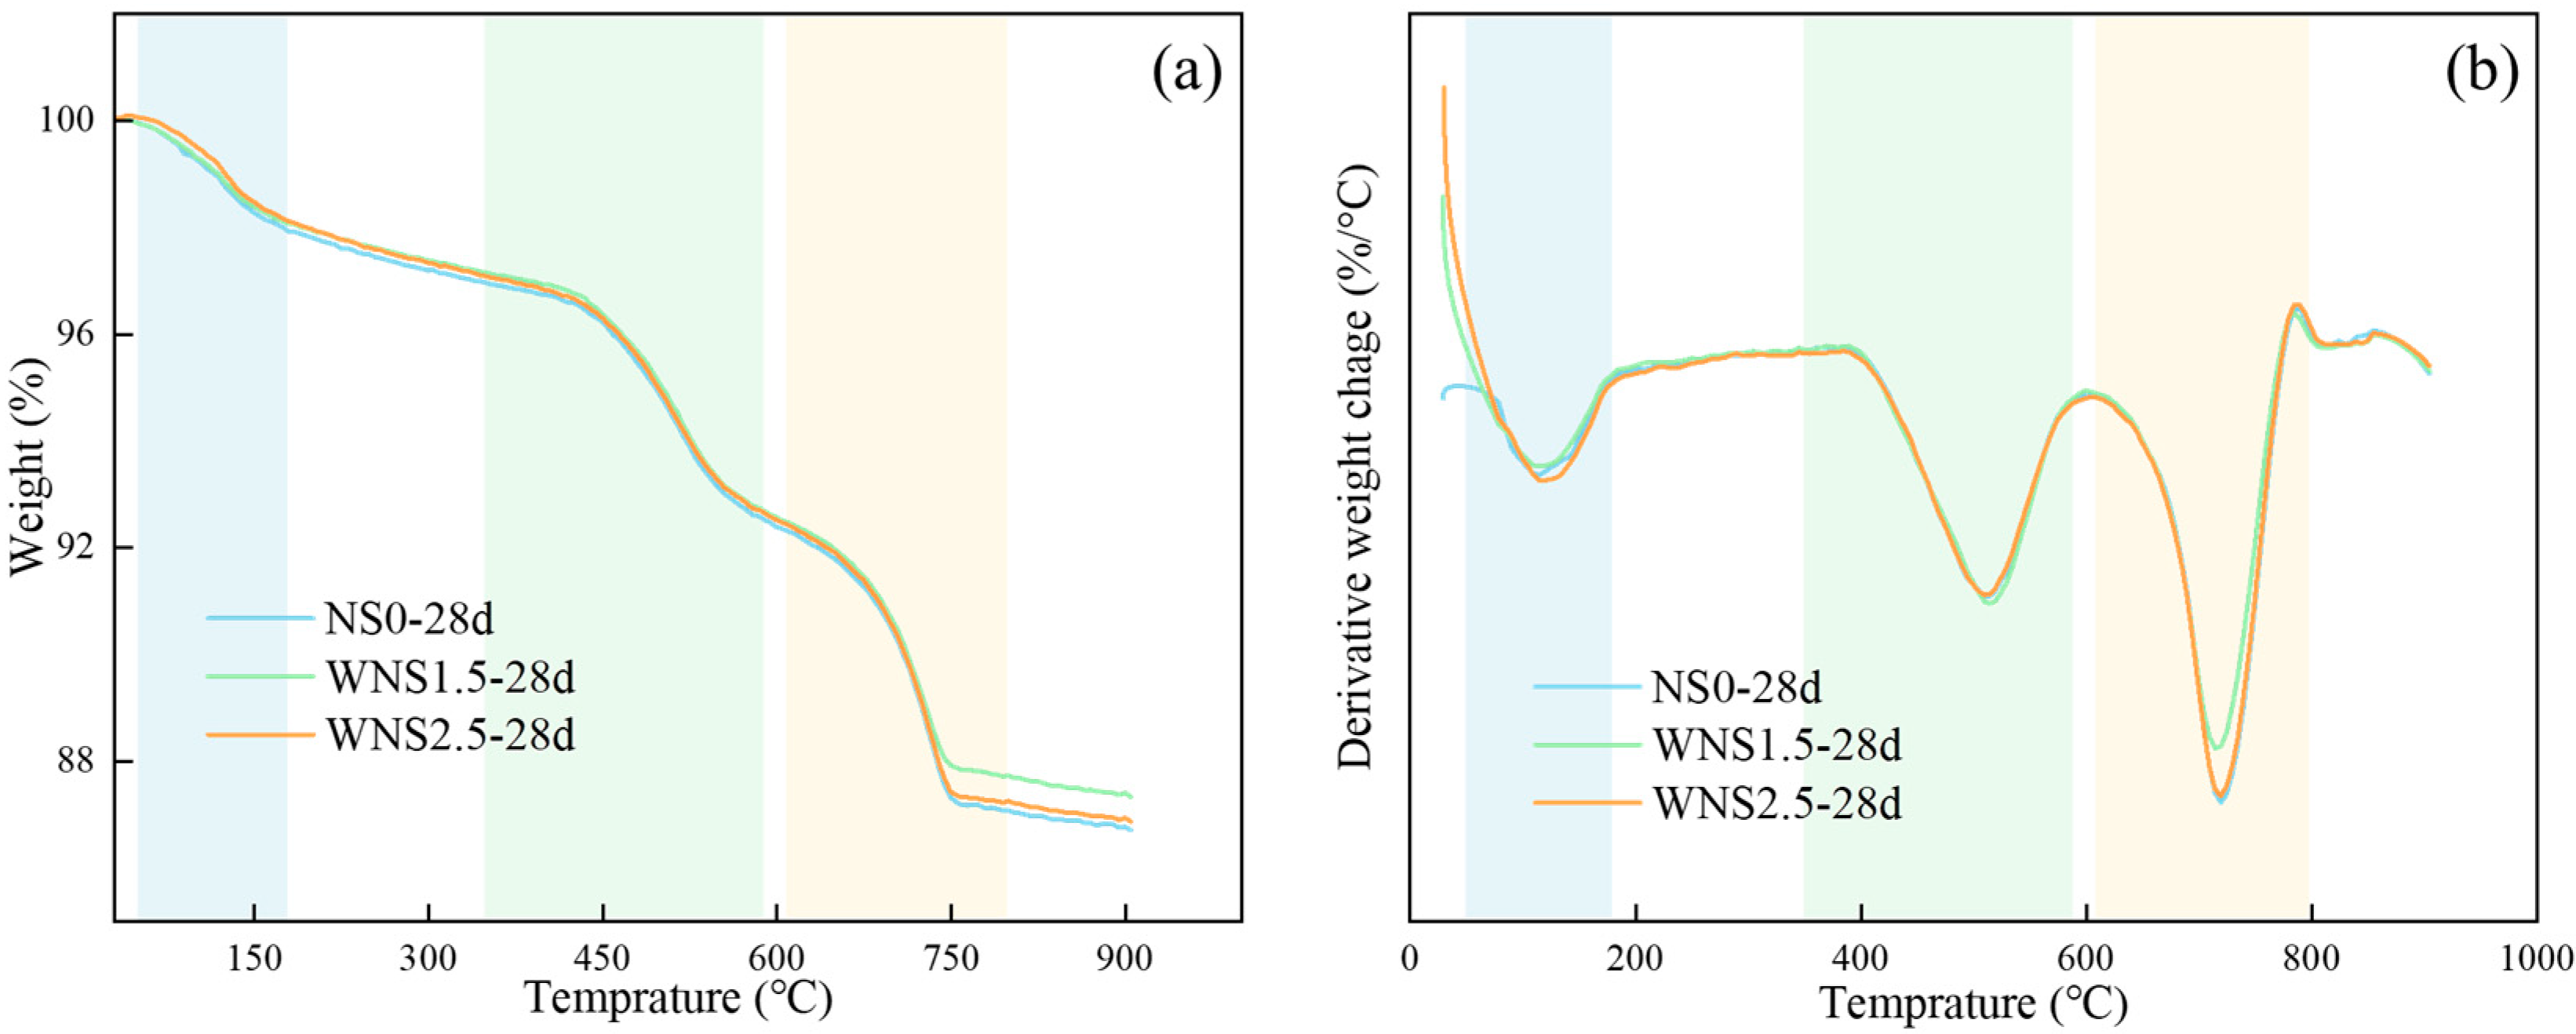
Figure 10, Figure 11 and Figure 12 show the TG–DTG results for samples with different NS contents at curing ages of 3, 7, and 28 days, respectively. The weight loss peaks of CPB mainly appear in three temperature ranges: 50~180 °C (light blue shading), corresponding to the release of crystal water and the evaporation of free water in AFt and C-(A)-S-H gels; 350~590 °C (light green shading), corresponding to the decomposition and dehydroxylation of Ca(OH)2; and 600~800 °C (light yellow shading), corresponding to the decarburization and decomposition of carbon-containing products. Total mass loss values are listed in Table 5.
Figure 10.
TG-DTG results of samples at 3 d curing age: (a) TG; (b) DTG.
Figure 11.
TG-DTG results of samples at 7 d curing age: (a) TG; (b) DTG.
Figure 12.
TG-DTG results of samples at 28 d curing age: (a) TG; (b) DTG.
Table 5.
Total mass loss of specimens.
At three days, the total mass loss was similar for each sample, indicating that the hydration products were not yet fully formed. An obvious DTG peak appeared in the NS1.5 sample between 180 and 350 °C, suggesting that the C-(A)-S-H gel generated at this dosage has a denser structure requiring a higher decomposition temperature.
At seven days, the total mass loss differed among samples, decreasing in the order: NS0, NS2.5, and NS1.5, indicating that NS content affects the amount of hydration products. DTG results further reveal its influence on specific products. In the temperature range corresponding to the dehydration of C-(A)-S-H, NS2.5 showed the strongest weight loss peak. Conversely, in the Ca(OH)2 decomposition range, NS2.5 showed the smallest peak. This suggests a 2.5% NS dosage promotes CH consumption and C-(A)-S-H formation. However, NS2.5 also exhibited the largest weight loss peak in the CaCO3 decomposition region, indicating that this content increases pore structure, leading to more carbonation.
At 28 days, differences in total mass loss diminished again. Compared to three days, the weight loss peaks for all samples shifted towards higher temperatures, indicating the formation of more stable hydration products that decompose at higher temperatures as curing age increases. In addition, NS1.5 showed the smallest weight loss peak in the CaCO3 decomposition region, indicating a 1.5% dosage benefits pore structure refinement and effectively inhibits carbonation. In summary, both NS content and curing age significantly affect hydration product composition and microstructure.
3.5.2. SEM-EDS Analysis
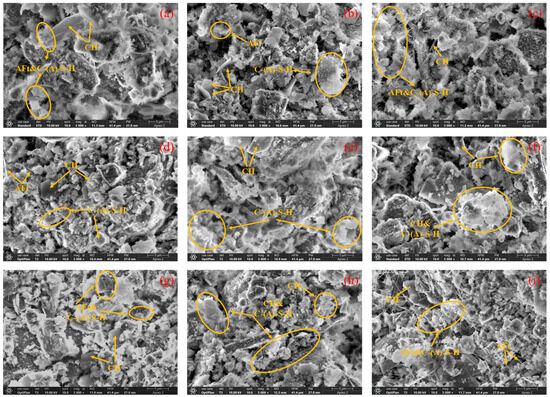
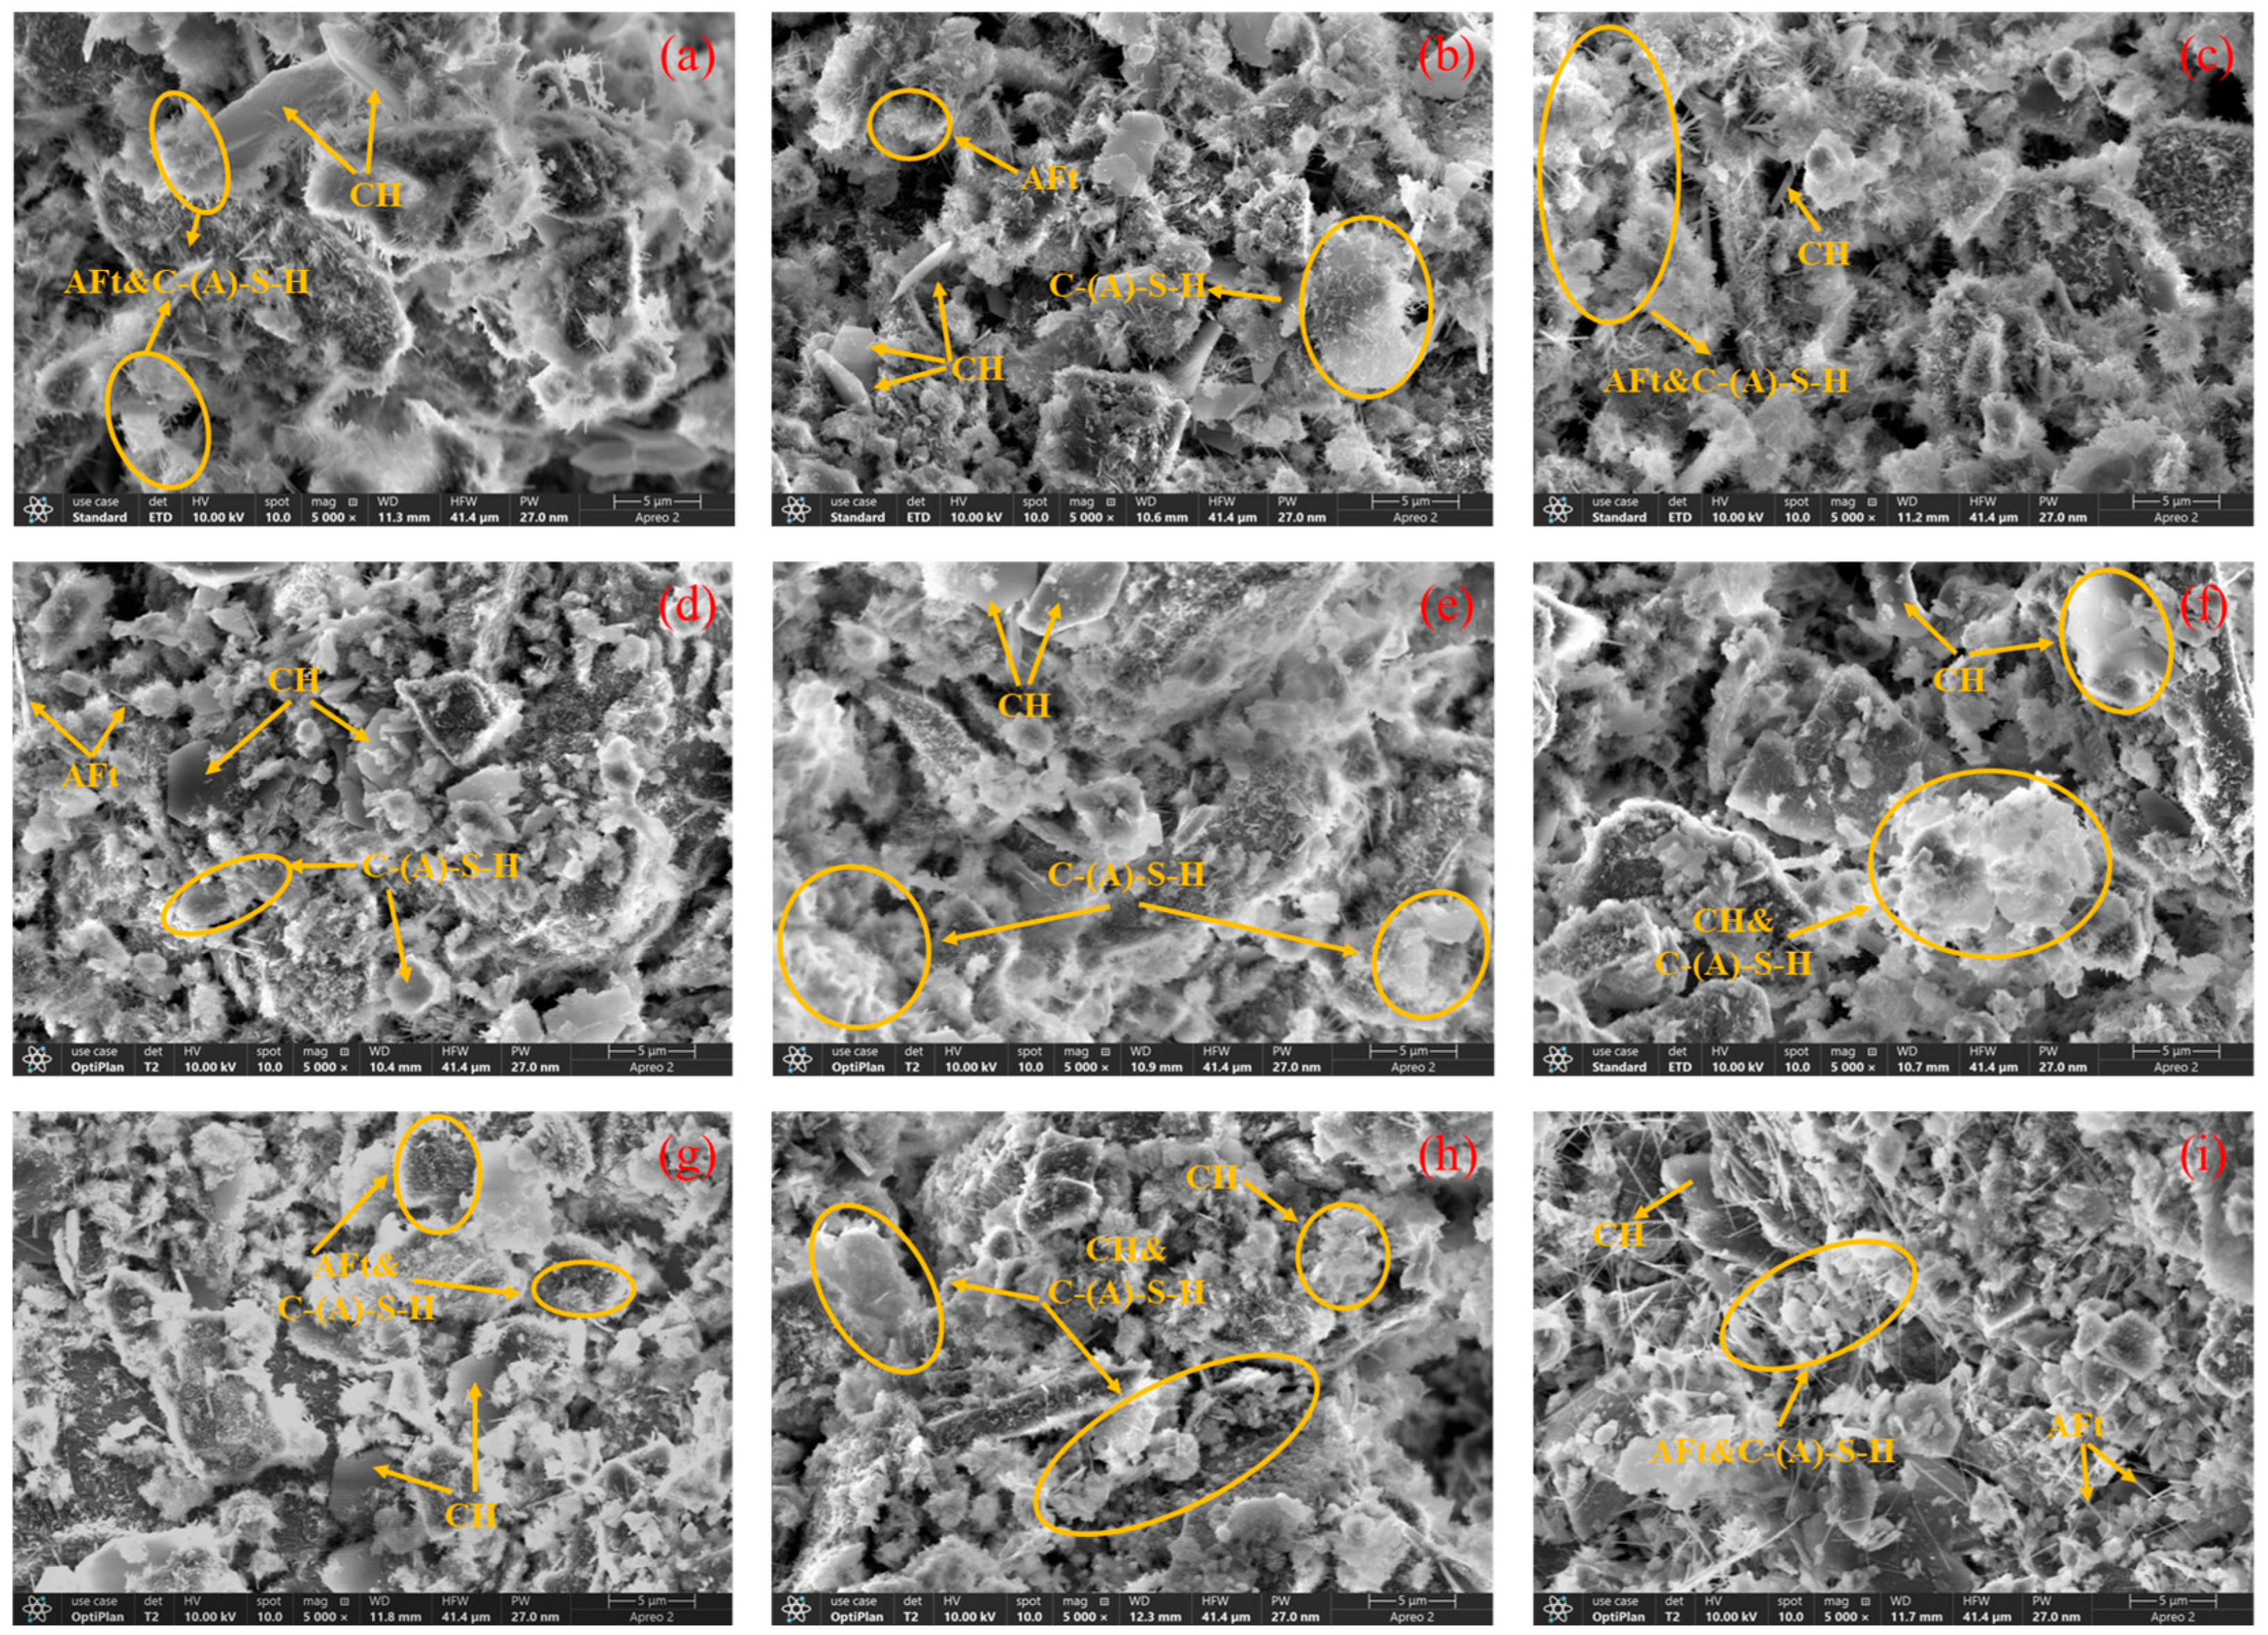
Figure 13 shows the microstructure of CPB samples at different curing ages under 5000× magnification. All microstructures consist of solid particles, hydration products (flocculent C-(A)-S-H, needle-like AFt, and blocky CH crystals), and pores.
Figure 13.
SEM image of sample: (a) NS0-3d; (b) NS1.5-3d; (c) NS2.5-3d; (d) NS0-7d; (e) NS1.5-7d; (f) NS1.5-28d; (g) NS2.5-3d; (h) NS2.5-7d; (i) NS2.5-28d.
For a constant NS content, at three days, samples contained more pores with loosely distributed hydration products. At seven days, pore structure was reduced, hydration products increased and distributed more uniformly, forming a relatively continuous matrix. At 28 days, pore structure was minimal, with C-(A)-S-H covering surfaces. The initially loose C-(A)-S-H gel at seven days evolved into a denser structure, connecting hydration products into a more integrated whole. Microstructural densification progressed with curing age.
Comparing different NS contents, NS0 samples consistently showed poor microstructure with more pores and inferior product distribution, especially at 7-day curing where hydration products were small and poorly distributed. NS1.5 samples exhibited better microstructure: reduced pores, and larger and better-distributed hydration products that interconnected. NS2.5 samples generally had the worst microstructure (except at 7 days), with the most developed pore structure among all NS contents. Compared to NS0, NS2.5 had increased hydration products, but their distribution was chaotic—abundant in some regions and scarce in others—resulting in poor connectivity.
At three days, CH crystals formed, with the greatest amount in NS1.5. Compared to NS0 and NS2.5, the C-(A)-S-H gel in NS1.5 was denser and more abundant, filling internal pores and improving matrix density. At seven days, CH crystals in NS0 were intact blocks, while those in NS1.5 and NS2.5 were blocks with incomplete edges, their surfaces covered with C-(A)-S-H. This is attributed to the consumption of CH crystals and the formation of hydration products such as C-(A)-S-H gel. At 28 days, CH crystal integrity decreased in the order: NS0, NS1.5, and NS2.5. CH in NS1.5 and NS2.5 appeared as small fragments with broken edges, while NS0 had larger, more complete fragments. In NS2.5, filaments with dense and disordered flocs were observed between hydration products. This is attributed to uneven NS distribution at a dosage of 2.5%, resulting in the non-uniform formation of AFt and C-(A)-S-H after CH consumption.
Table 6 shows the EDS analysis results. The distribution of Ca mainly reflects the formation of C-S-H gel and CH crystals, Si reflects hydration products such as C-S-H, and Al reflects the transition from C-S-H to C-(A)-S-H. High coincidence of Si, Al, and Ca indicates substantial C-(A)-S-H gel formation. The distribution of C directly reflects pore structure quality; a dense matrix with fewer pores results in a sporadic and isolated C map.
Table 6.
EDS analysis results.
At three days, the distributions of Si and Ca were best in NS1.5, followed by NS2.5, and were worst in NS0. The higher distribution of Al in NS1.5 indicates that 1.5% NS improves pore structure and promotes the transformation of C-S-H gel into a structurally superior C-(A)-S-H gel.
At seven days, the distribution and quantity of Ca, Si, and other elements in NS2.5 were better than those in NS0. This shows that a dosage of 2.5% can increase the amount of hydration products and promote the formation of C-(A)-S-H gel. Interestingly, at 28 days, the element distribution in NS1.5 appeared poorer. However, UCS results showed improvement at 1.5% dosage, and micro-analysis confirmed increased hydration products. This discrepancy is attributed to the vigorous pozzolanic reaction at this dosage, which consumes a large amount of CH crystals with flat surfaces and generates abundant amorphous C-(A)-S-H gel and needle-like AFt. This alters the microstructure, increasing surface roughness and undulation, which interferes with stable EDS signal acquisition, resulting in a mottled element map.
Compared to other curing ages, the 28-day EDS results showed the best hydration product distribution and formation in NS0, followed by NS1.5, and the worst in NS2.5. NS incorporation affects the surface morphology of NS1.5 and NS2.5 samples, influencing the final element map presentation. At 2.5%, increased nanoparticle agglomeration leads to uneven distribution of hydration products (Figure 13i). The resulting messy and uneven surface affects EDS signal acquisition, producing a scattered element distribution image.
3.5.3. MIP Analysis
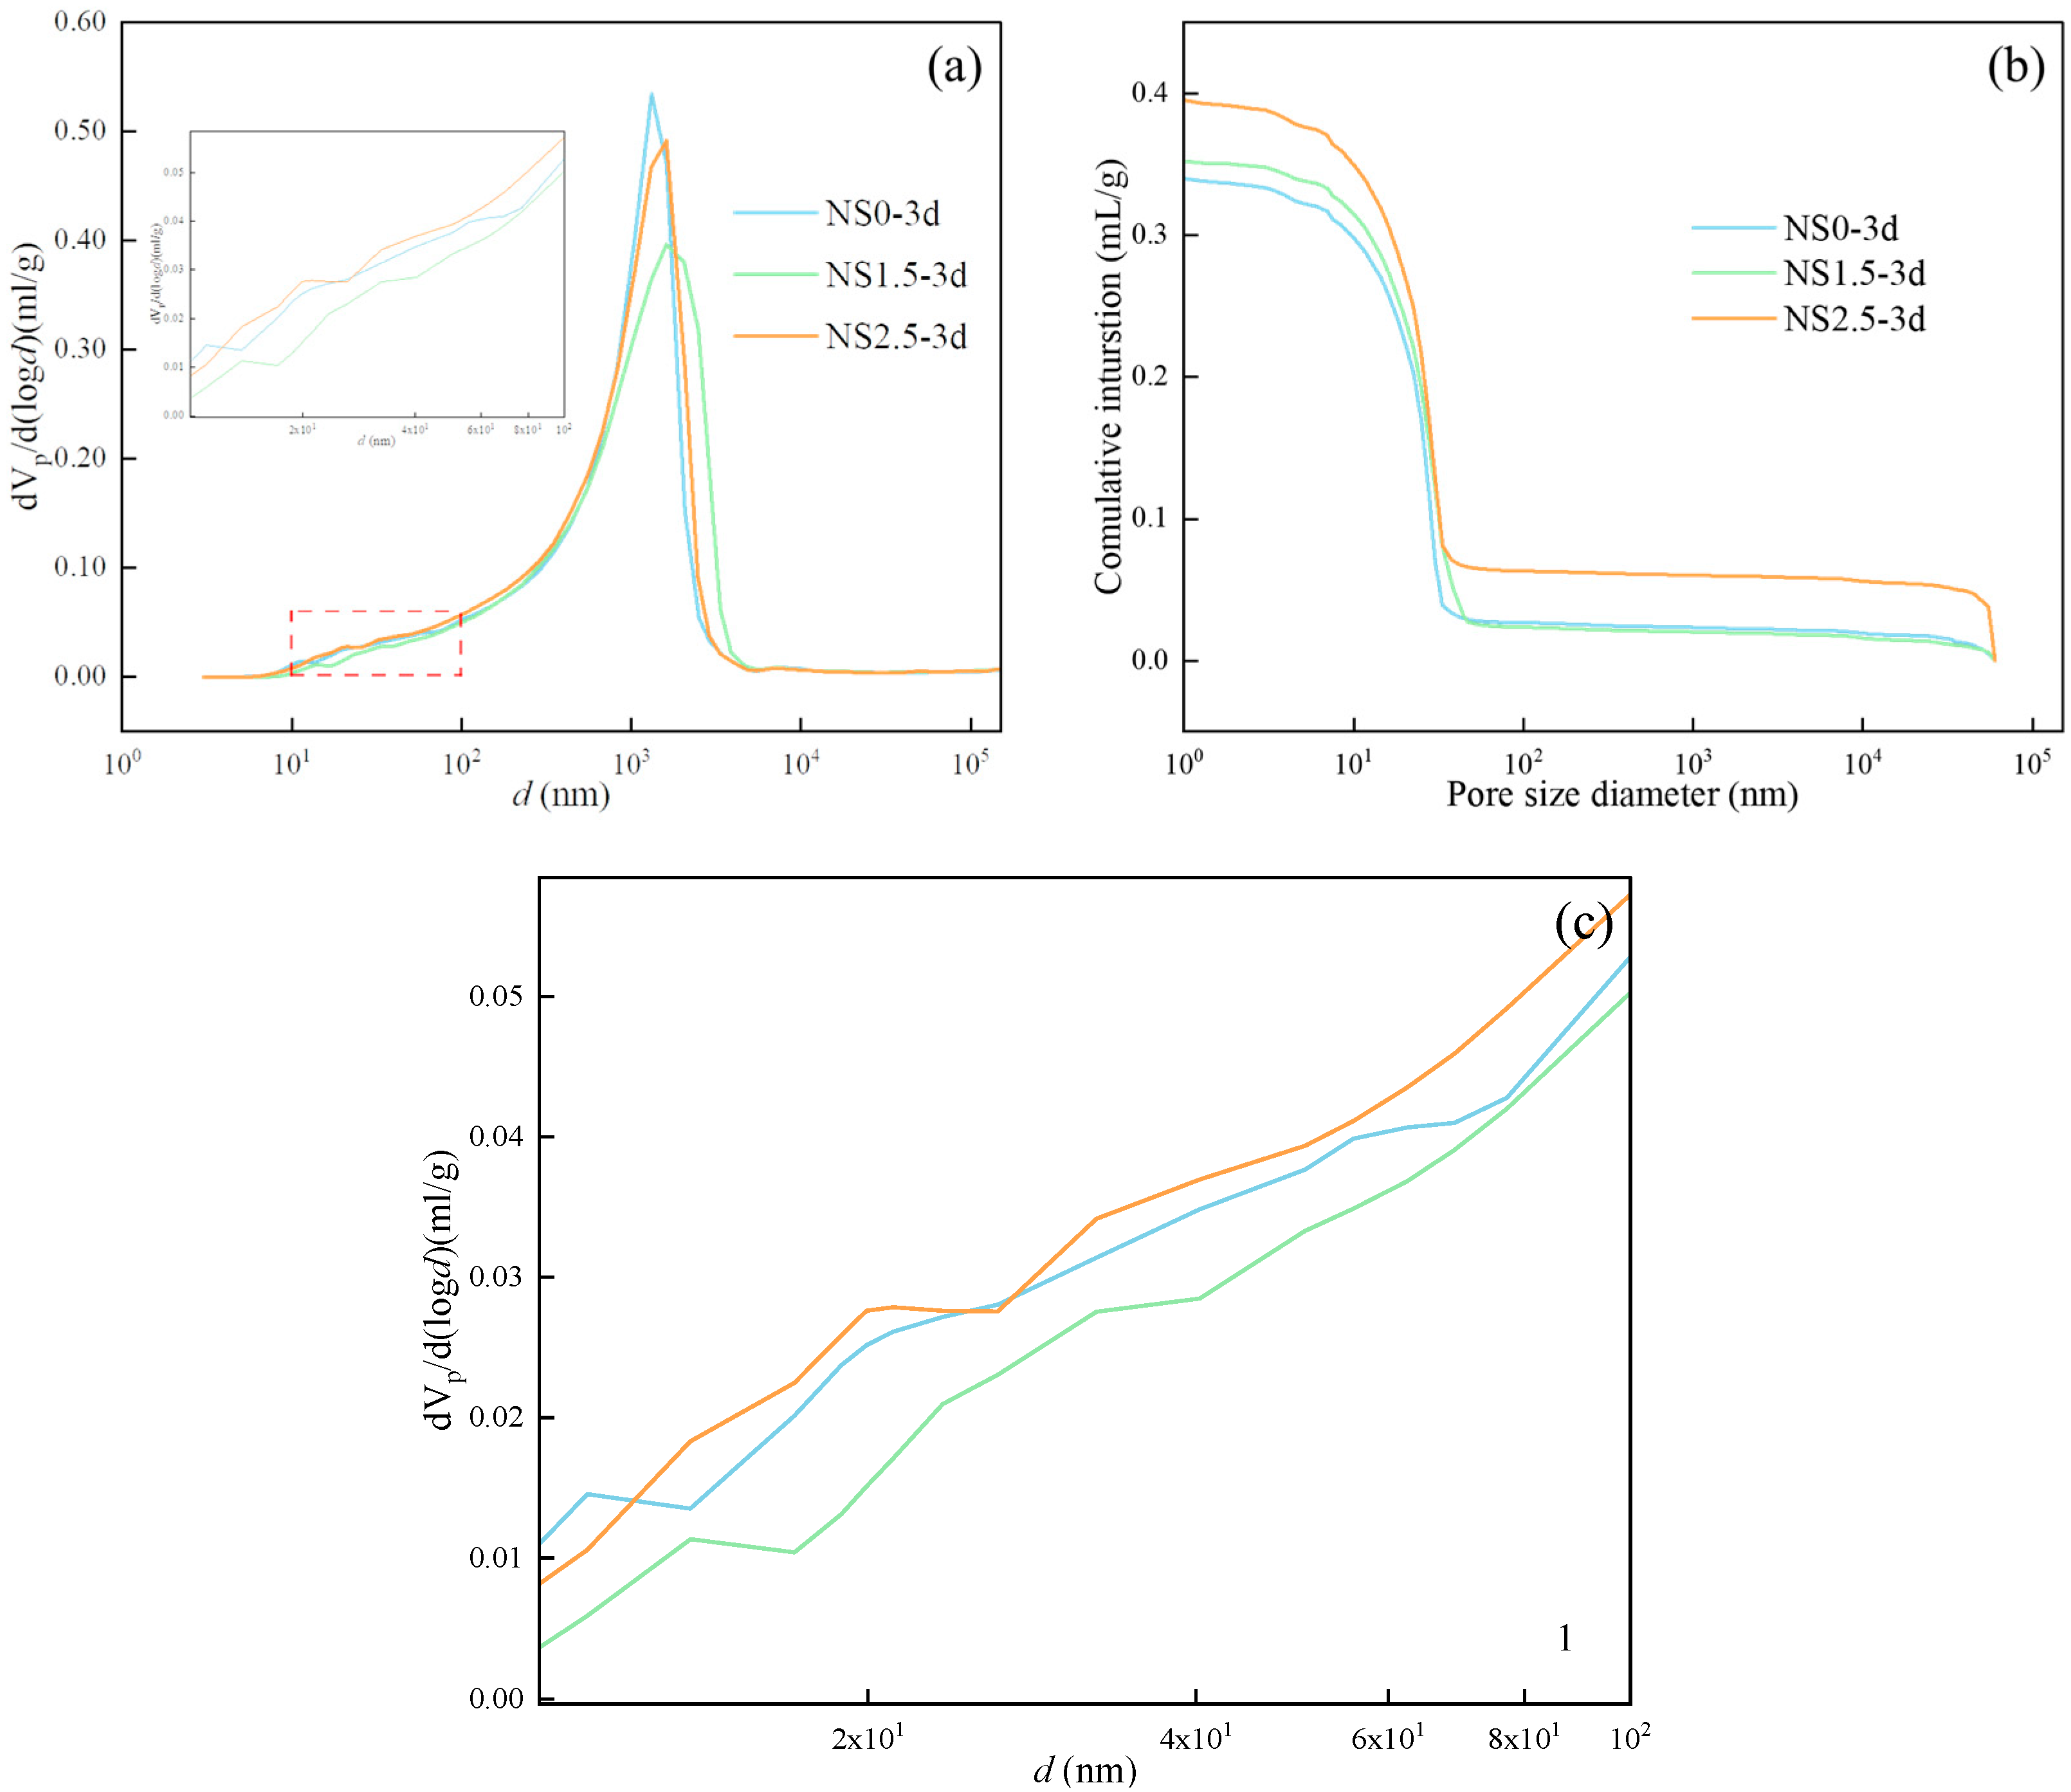
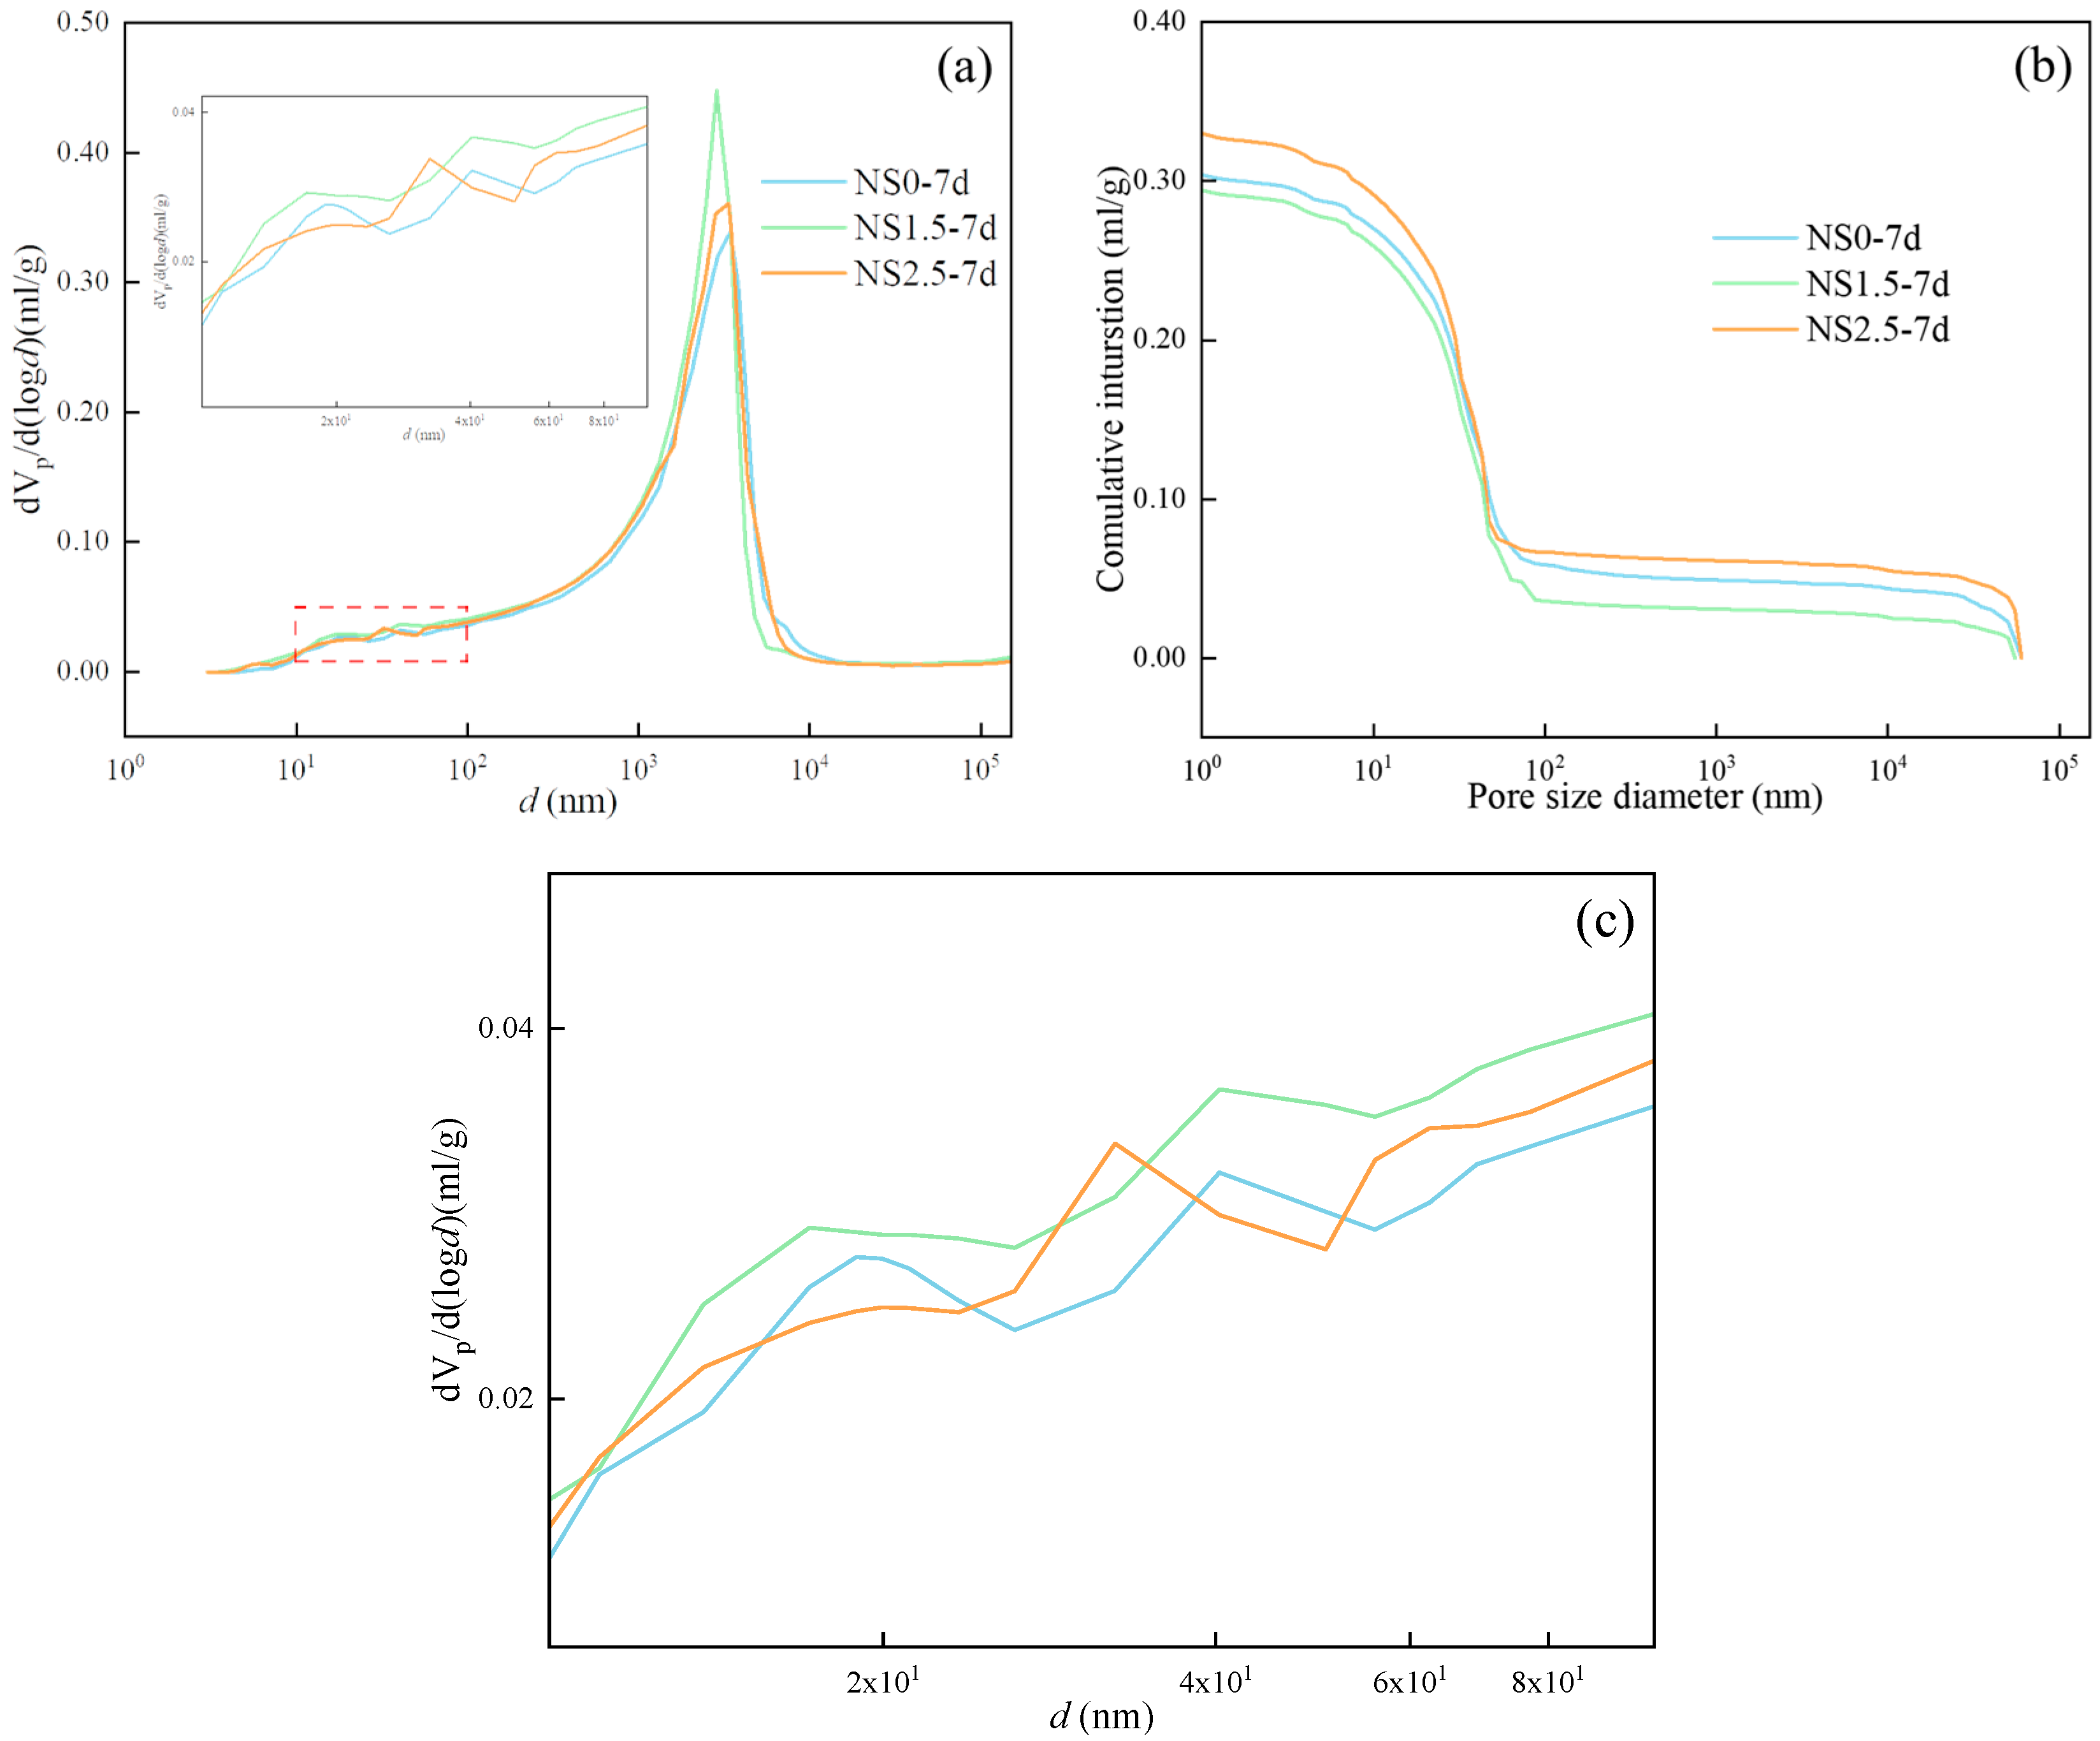
Figure 13, Figure 14 and Figure 15 present MIP results for samples at curing ages of 3, 7, and 28 days, respectively. Pore-size distribution was mainly concentrated between 5 nm and 100 nm. For cement-based materials, pores can be divided into four categories: gel pores (<10 nm), transition pores (10~100 nm), capillary pores (100~1000 nm), and macropores (>1000 nm). Gel and transition pores are usually considered harmless to material properties. Lower cumulative mercury intrusion indicates smaller total pore volume. The porosity and average pore size data are shown in Table 7.
Figure 14.
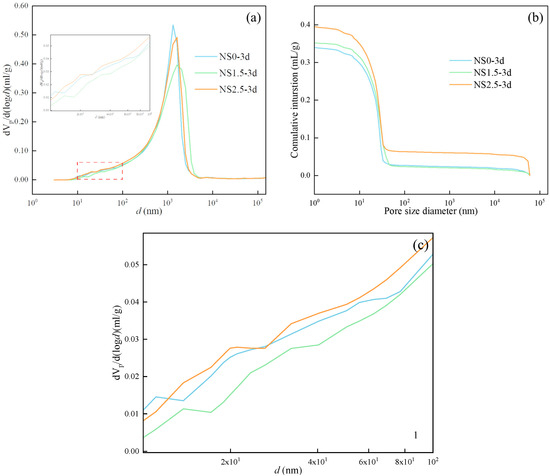
MIP results of samples at 3 d curing age: (a) pore distribution; (b) Mercury intake. (c) Partial enlargement of the red-outlined area in Figure 14a.
Figure 15.
MIP results of samples at 7 d curing age: (a) pore distribution; (b) Mercury intake. (c) Partial enlargement of the red-outlined area in Figure 15a.
Table 7.
Porosity and mean pore size data for each sample.
At three days (Figure 14a), pore-size distribution was mainly in two intervals: 10~100 nm (transition pores) and 100~1000 nm (capillary to macropores). In the range of 10~100 nm, the volume of harmless pores was highest for NS2.5, followed by NS0 and NS1.5. Although NS1.5 had the lowest volume in this range, its macropore volume increased. The cumulative mercury intrusion curve (Figure 14b) shows intrusion increasing from NS0, NS1.5, to NS2.5. Porosity values (Table 7) for NS0 and NS1.5 were similar (47.1479% and 47.8678%, respectively), while NS2.5 had the highest porosity (51.4265%), indicating 2.5% NS increases the total porosity of the specimen. Despite increased macropores at 1.5%, the peak intensity in the 100–1500 nm range was the lowest, indicating an overall refined pore structure.
At seven days (Figure 15a), the pore-size distribution shifted rightward compared to three days, indicating that with increasing curing age, hydration products such as CH crystals continue to form and macropores increase. However, porosity and average pore size decreased compared to 3-day specimens (Table 7), indicating that NS incorporation helps refine pore size and reduce large pore proportion. In the harmless pore range, NS1.5 had the largest micropore volume due to the formation of C-(A)-S-H gel. The volumes for NS0 and NS2.5 alternated but overall difference was insignificant. Cumulative intrusion at seven days (Figure 15b) was highest for NS1.5, followed by NS0 and NS2.5, indicating that 1.5% NS effectively reduces the total pore volume, whereas 2.5% increases it.
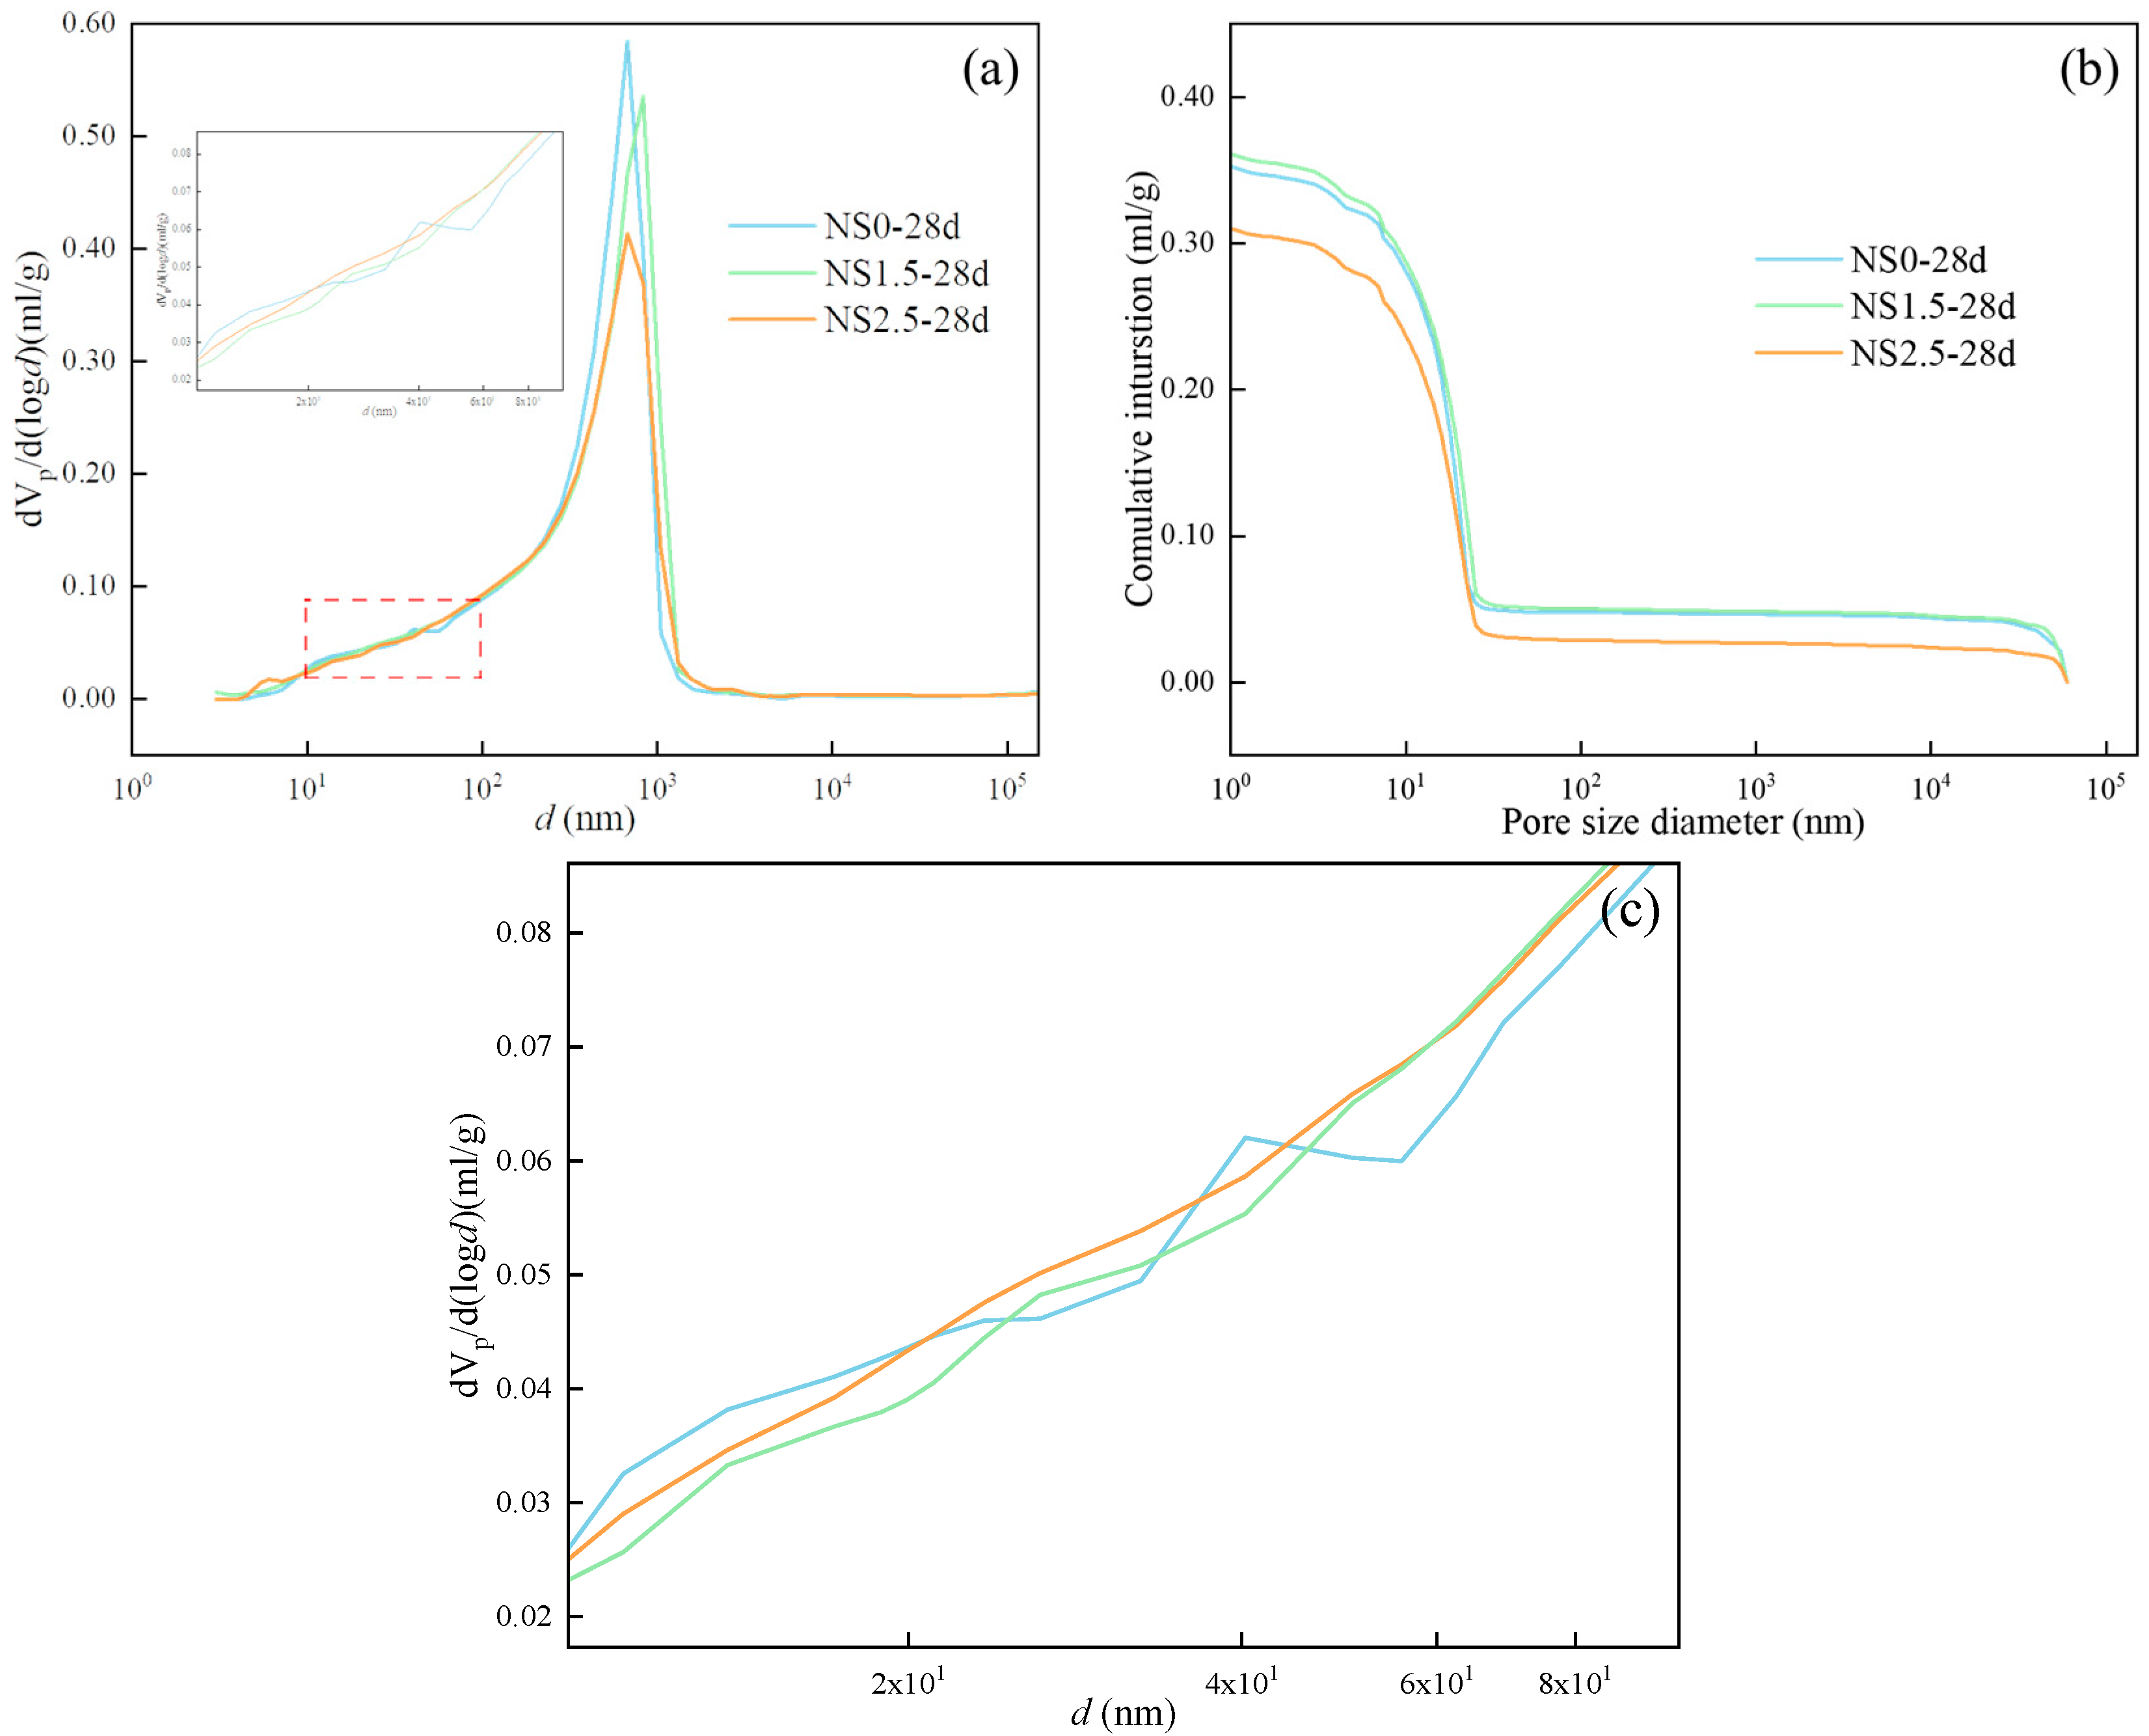
At 28 days (Figure 16a), pore-size distribution shifted leftward, concentrated mainly in 10~1000 nm, indicating further pore filling, increased matrix compactness, and reduced porosity with advanced hydration. The proportion of harmful pores was smallest for NS2.5, followed by NS0 and NS1.5, suggesting that NS generally reduces the proportion of harmful pores. Cumulative intrusion (Figure 16b) was lowest for NS2.5, followed by NS0 and NS1.5. The porosity of NS2.5 was only 43.3484%, lower than that of NS0 and NS1.5, indicating that 2.5% admixture reduced the total pore volume. However, SEM images revealed uneven distribution of hydration products in NS2.5. As shown in Table 7, its average pore size was 231.92 nm, higher than that of NS0 and NS1.5 (114.74 nm for NS1.5). Combined with optimal UCS at 1.5% dosage, this contradictory phenomenon can be explained as follows: MIP reflects the total pore volume but fails to characterize the uniformity of pore distribution; at 2.5%, pores may be concentrated, creating localized weaknesses that degrade macroscopic mechanical properties despite lower total porosity.
Figure 16.
MIP results of samples at 28 d curing age: (a) pore distribution; (b) Mercury intake. (c) Partial enlargement of the red-outlined area in Figure 16a.
4. Discussion
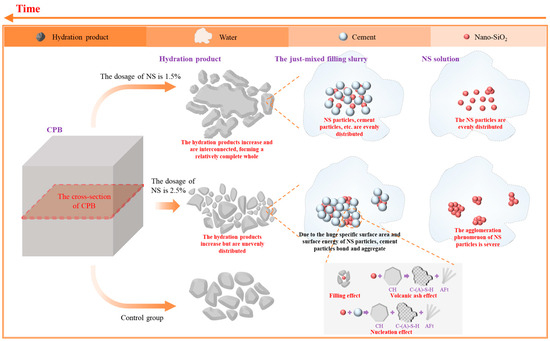
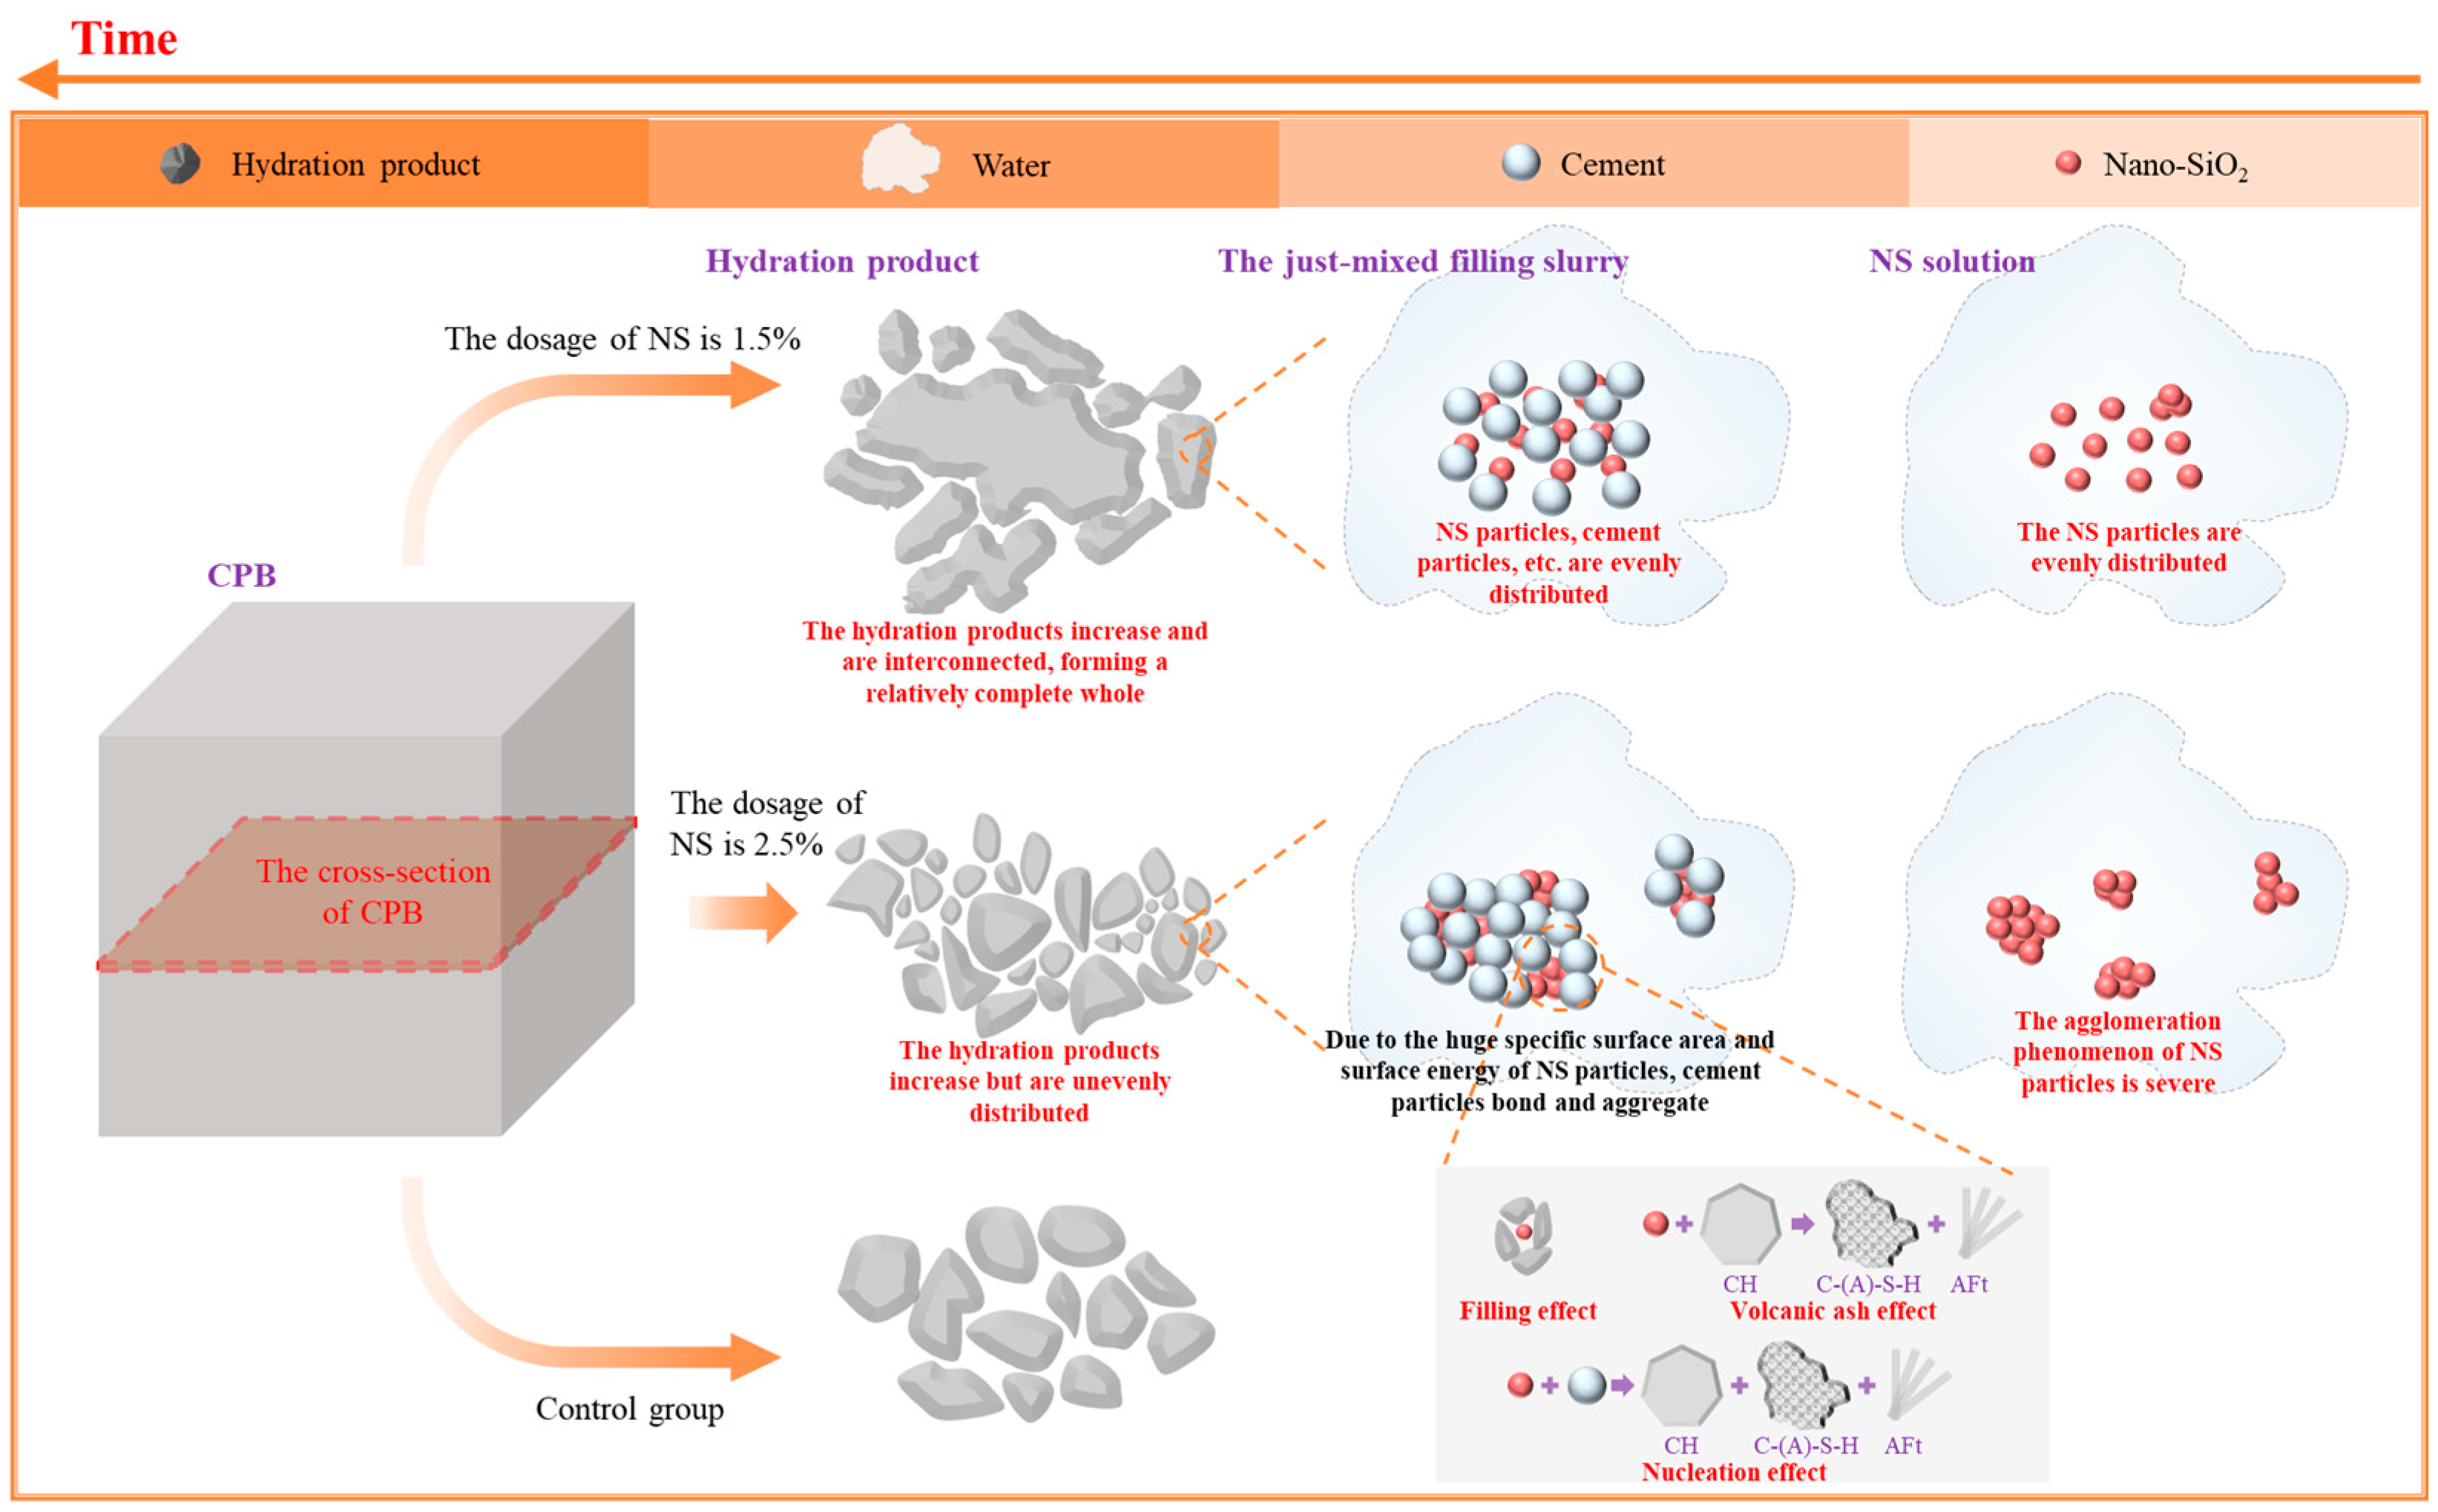
This research systematically investigated the effects of NS on the mechanical properties, hydration process, setting time, and microstructure of CPB, with a focus on elucidating the mechanism of NS in low-water, high-tailings systems and its correlation with the regulation of macroscopic mechanical properties. Based on a comprehensive analysis of multiple test results, including hydration heat, UCS, TG-DTG, SEM, and MIP, a unified mechanism framework for how NS affects CPB performance is established. It particularly clarifies the intrinsic reasons behind early strength enhancement and the decline in strength at excessive dosages. A schematic of this mechanism is illustrated in Figure 17.
Figure 17.
Mechanism diagram of NS affecting CPB performance.
4.1. Optimal Amount of NS
UCS results indicate that NS effectively enhances the early strength of CPB but has a moderate effect on long-term strength improvement. This is because hydration products are not fully formed at 3 days; substantial formation at 7 days leads to significant strength gains per unit time; at 28 days, the formation is relatively limited, resulting in a slower rate of strength increase, though absolute strength is still considerably improved. Adding 1.5% NS enhances early strength (at three and seven days), consistent with the accelerated and elevated early heat-release peaks observed in the hydration heat-release curve. TG-DTG data further indicate that the consumption of CH crystals increases after NS incorporation, suggesting that the pozzolanic effect of NS takes effect early on, converting part of the CH into C-(A)-S-H gel. SEM images reveal more uniform distribution, denser structure, and fewer pores in the 1.5% NS specimen.
The combined evidence reveals that NS primarily enhances early strength development of CPB through a triple synergistic effect: (1) Nucleation effect. The high specific surface area of NS provides abundant nucleation sites for the formation of hydration products, accelerating the generation of hydration products such as C-(A)-S-H and Aft. (2) Pozzolanic effect. NS consumes CH crystals—which contribute little to early strength—generating C-(A)-S-H gel and AFt that enhance mechanical properties, and the finer C-(A)-S-H gel further fills internal pores. (3) Filling effect. The nano-sized NS particles physically fill internal pores of CPB, reducing porosity and enhancing matrix density.
MIP results indicates decreased total porosity and proportion of harmful pores (such as macropores) in 1.5% NS sample, alongside an increased proportion of less harmful and harmless pores. The refinement of this pore structure directly enhances the matrix density, facilitating efficient force-chain transmission, manifesting as significant early strength increase. While similar to the mechanism of NS in ordinary concrete, the effects of pore filling and early-hydration promotion are particularly crucial in low-cement, high-porosity CPB systems, directly addressing the urgent need for early-stage load-bearing capacity in horizontal layered backfilling.
4.2. Excessive NS Amount
At 2.5% NS, UCS decreased, with a particularly limited later-age strength development. MIP results indicate that the total porosity actually increased, with a significant rise in the proportion of harmful pores (>100 nm). Nanoparticles undergo severe agglomeration, forming aggregates ranging in size from 500 nm to 1.5 μm. These aggregates themselves become defects, introducing large pores and disrupting matrix compactness.
A seemingly contradictory phenomenon is observed: hydration heat results indicate that NS2.5 has the highest cumulative heat release, suggesting a greater overall degree of hydration reaction. TG-DTG results indicate that NS2.5 exhibits the largest weight-loss peak in the CaCO3 decomposition region across different curing ages. The formation of CaCO3 is attributed to the carbonation reaction between the specimen and atmospheric CO2 during curing. A higher amount of CaCO3 indicates a greater overall porosity in the specimen. SEM analysis reveals that the spatial distribution of hydration products is non-uniform. This is attributed to two competing factors: non-agglomerated NS particles continue to promote hydration, leading to increased overall heat release; after significant NS agglomeration, the effective specific surface area decreases sharply, reducing both nucleation and pozzolanic efficiency. Furthermore, as physical defects, agglomerates not only diminish the micro-filling effect but also form stress-concentration points within the matrix, disrupting the efficient transmission of force chains.
The decrease in CPB strength under excessive NS is thus the result of competition between chemical promotion and physical degradation. Although total hydration may increase, the deterioration of pore structure and microstructural inhomogeneity (uneven distribution of hydration products) caused by agglomeration play a dominant role, ultimately degrading macroscopic mechanical properties.
Furthermore, the observed NS agglomeration and the resulting degradation of CPB pore structure may induce localized damage and progressive failure in mine backfilling applications. As Long et al. [27]. have noted in their engineering failure analysis, localized defects in materials, or at interfaces, often serve as origins of overall structural failure. Under static or dynamic loading, such defects can manifest as stress concentrations, crack initiation, and crack propagation, ultimately leading to a decline in mechanical properties or functional loss. In the CPB system, NS aggregates act as initial defects that may become crack-initiation points during loading. Under backfilling conditions, these defects can gradually evolve into through-crack damage, thereby compromising the overall stability of the backfill. This understanding bridges laboratory observations with engineering practice, demonstrating that—even with high hydration levels—dominant physical degradation mechanisms can still cause failure if particle dispersion and microstructural uniformity are not controlled.
4.3. Research Highlights
While nanoparticle agglomeration and its adverse effects in cement-based materials are documented [28,29,30], this study is unique in systematically elucidating—for the first time in a low-cement, high-tailings CPB system—how agglomeration specifically influences pore evolution, hydration product distribution, and ultimate macroscopic strength through multi-scale experiments. It clarifies that the weakening of the triple effects of NS and the harmful pores introduced by NS aggregates in the initial high-porosity environment of CPB are key factors leading to the strength transition. This understanding provides direct theoretical support for the precise blending and dispersion control of NS in mine backfilling, addressing the practical question: “Why does NS addition in low-cement CPB have a clear upper limit, and how does excessive addition structurally cause failure?”
In summary, the dosage of NS must be carefully controlled in practical applications to ensure cost-effectiveness while maximizing the mechanical properties of CPB. When NS is added at an optimal dosage (1.5%), its multi-effect synergism enhances early strength and densification. However, excessive addition (2.5%) leads to a dominant agglomeration effect, resulting in coarse pore structure and microstructural non-uniformity, which consequently weakens performance. The multi-method correlation analysis framework established in this study clarifies the complete pathway of action from hydration processes and microstructure to macroscopic properties, providing a solid theoretical foundation for the efficient application of NS in deep mine backfilling.
4.4. Engineering Practice Significance
Currently, tailings generated during mining operations pose numerous challenges worldwide, including massive production, extensive storage needs, and environmental risks [31,32]. Tailings may not only occupy vast land resources but also cause severe pollution to the ecological environment [33,34]. Mine backfilling technology, which reuses this waste material to fill abandoned workings, is an effective countermeasure, benefiting ecological conservation and enhancing mine safety by preventing surface subsidence [6,35]. To address challenges such as poor working-face stability and difficulties in resource recovery during the development of deep mineral resources, this study explores NS-regulated CPB strength technology to solve the problem of backfill strength often failing to meet practical demands. By systematically analyzing micro–macro property regulation under both optimal and excessive NS incorporation, it provides theoretical support and design references for the applicability of NS in deep mine backfilling, contributing significantly to mining safety, resource recovery rates, and green mine development.
4.5. Research Limitations and Future Plans
The current TG-DTG analysis is primarily qualitative. Future work will strengthen quantitative analysis. Specifically, this involves peak-resolution analysis of TG curves and numerical calculation of the contents of CH, C-(A)-S-H, and AFt hydration products at different curing ages and under varying NS dosage levels. Subsequently, the contents of hydration products will be correlated with UCS to reveal the influence patterns of NS dosage and curing age on the formation of hydration products.
Regarding MIP analysis, current evaluations primarily rely on pore-size thresholds established by existing research. Future plans include conducting sensitivity analyses on pore-size classification, with a focus on comparing variations in “harmful pore volume” between 1.5% and 2.5% NS dosage levels.
Furthermore, subsequent research will explore the integration of finite-element and deep-learning methodologies to predict the bond stress–slip behavior of grout under static and dynamic loading conditions. At the same time, we plan to further advance research on bridging the gap between the test-specimen scale and the engineering scale, exploring the mechanical behavior and long-term performance of backfill materials under actual service conditions in deep mining areas.
5. Conclusions
The influence mechanism of NS on the performance of CPB was analyzed from a micro–macro perspective, and the mechanism by which an optimal amount of NS improves the mechanical properties of CPB, as well as the internal reasons for the decrease in CPB performance caused by excessive NS, were clarified. This provides a theoretical basis for the rational application of NS in mine filling. The main conclusions are as follows:
- (1)
- An optimal amount of NS can fully exert its pozzolanic, nucleation, and filling effects. It accelerates cement hydration, fills internal pores, increases matrix density, and enhances CPB strength. Overdosed NS leads to a sharp increase in agglomeration, weakening these three main effects of NS, increasing sample porosity, decreasing matrix density, and reducing CPB strength.
- (2)
- Adding an optimal amount of NS to CPB can improve the distribution of hydration products. The interconnected hydration products facilitate the transfer of force chains, increasing the mechanical properties of CPB. Excessive NS causes uneven distribution of hydration products, and the large aggregates form harmful pores in the matrix, hindering the transmission of force chains, and negatively impacting the mechanical properties of CPB.
- (3)
- In CPB, a low-cement system, the dispersion state of NS and the uniformity of hydration product distribution have a particularly significant effect on the macroscopic properties. In practical applications, close attention must be paid to the agglomeration of nanoparticles in mines.
Author Contributions
Conceptualization, H.L.; Methodology, D.L. (Deng Liu); Software, X.Z.; Validation, D.L. (Dexian Li); Formal analysis, D.L. (Dexian Li); Investigation, S.W.; Resources, H.L.; Data curation, D.L. (Dexian Li); Writing—original draft, D.L. (Deng Liu).; Writing—review & editing, D.L. (Deng Liu).; Visualization, X.Z.; Supervision, H.C.; Project administration, S.W.; Funding acquisition, H.C. All authors have read and agreed to the published version of the manuscript.
Funding
This work was financially supported by the Yunnan Major Scientific and Technological Projects (202403AA080001), the National Natural Science Foundation of China Youth Program (52504128), and the General Project of Yunnan Provincial Department of Science and Technology (202501CF070153).
Data Availability Statement
The data presented in this study are available on request from the corresponding authors.
Conflicts of Interest
The authors declare no conflicts of interest.
References
- Wang, L.; Shao, A.; Qu, F.; Yue, X.; Wang, H.; Zhang, X.; Liu, X. Current status and prospects of mining technology in metal mines. Chin. J. Eng. 2025, 47, 971–983. [Google Scholar] [CrossRef]
- Ranjith, P.G.; Zhao, J.; Ju, M.; De Silva, R.V.; Rathnaweera, T.D.; Bandara, A.K. Opportunities and challenges in deep mining: A brief review. Engineering 2017, 3, 546–551. [Google Scholar] [CrossRef] [Scilit]
- Shi, T.; Li, Z.; Guo, J.; Gong, H.; Gu, C. Research progress on CNTs/CNFs-modified cement-based composites–a review. Constr. Build. Mater. 2019, 202, 290–307. [Google Scholar] [CrossRef] [Scilit]
- Wang, X.; Guo, P.; Huang, W.; Chen, Z.; Chen, Q.; Zhao, K. Stability calculation of backfill roof in downward roadway under multifactor influence. Rock Soil Mech. 2022, 43, 3453–3462. [Google Scholar] [CrossRef]
- Zhang, Q.; Jiang, C.; Gao, X.; Liu, B. Study on Optimization of Structural Parameters of Hexagonal Mining Method with Large Cross-section. Gold Sci. Technol. 2020, 28, 42–50. [Google Scholar]
- Qi, C.; Fourie, A. Cemented paste backfill for mineral tailings management: Review and future perspectives. Min. Eng. 2019, 144, 106025–106046. [Google Scholar] [CrossRef] [Scilit]
- Wu, A.; Wang, Y.; Ruan, Z.e.; Xiao, B.; Wang, J.; Wang, L. Key theory and technology of cemented paste backfill for green mining of metal mines. Green Smart Min. Eng. 2024, 1, 27–39. [Google Scholar] [CrossRef] [Scilit]
- Bastos, G.; Patiño-Barbeito, F.; Patiño-Cambeiro, F.; Armesto, J. Nano-inclusions applied in cement-matrix composites: A review. Mater. Des. 2016, 9, 1015. [Google Scholar] [CrossRef] [Scilit]
- Zhou, Z.; Liu, J.; Wu, R.; Wu, A.; Wang, H.; Wang, S. Analysis of Bleeding of Low Concentration FullTailings Filling Material and Its Regulate-control. Chin. J. Mater. Sresearch 2020, 34, 481–488. [Google Scholar] [CrossRef]
- Zhou, M.; Lu, W.; Song, J.; Lee, G.C. Application of ultra-high performance concrete in bridge engineering. Constr. Build. Mater. 2018, 186, 1256–1267. [Google Scholar] [CrossRef] [Scilit]
- Zhao, H.; Yu, H.; Yuan, Y.; Zhu, H. Blast mitigation effect of the foamed cement-base sacrificial cladding for tunnel structures. Constr. Build. Mater. 2015, 94, 710–718. [Google Scholar] [CrossRef] [Scilit]
- Wu, A.; Yang, Y.; Cheng, H.; Chen, S.; Han, Y. Status and prospects of paste technology in China. Chin. J. Eng. 2018, 40, 517–525. [Google Scholar] [CrossRef]
- Singh, N.; Kalra, M.; Saxena, S. Nanoscience of cement and concrete. Mater. Today Proc. 2017, 4, 5478–5487. [Google Scholar] [CrossRef] [Scilit]
- Du, S.; Wu, J.; AlShareedah, O.; Shi, X. Nanotechnology in cement-based materials: A review of durability, modeling, and advanced characterization. Nanomaterials 2019, 9, 1213. [Google Scholar] [CrossRef] [Scilit]
- Barbhuiya, S.; Mukherjee, S.; Nikraz, H. Effects of nano-Al2O3 on early-age microstructural properties of cement paste. Constr. Build. Mater. 2014, 52, 189–193. [Google Scholar] [CrossRef] [Scilit]
- Musso, S.; Tulliani, J.-M.; Ferro, G.; Tagliaferro, A. Influence of carbon nanotubes structure on the mechanical behavior of cement composites. Compos. Sci. Technol. 2009, 69, 1985–1990. [Google Scholar] [CrossRef] [Scilit]
- Kim, G.; Cho, S.; Moon, J.; Suh, H.; Her, S.; Sim, S.; Bae, S. Investigation of the hydrate formation and mechanical performance of limestone calcined clay cement paste incorporating nano-CaCO3 and nano-SiO2 as partial limestone substitutes. Constr. Build. Mater. 2024, 418, 135335–135351. [Google Scholar] [CrossRef] [Scilit]
- Gao, C.; Huang, L.; Yan, L.; Jin, R.; Chen, H. Mechanical properties of recycled aggregate concrete modified by nano-particles. Constr. Build. Mater. 2020, 241, 118030–118045. [Google Scholar] [CrossRef] [Scilit]
- Bai, S.; Yu, L.; Guan, X.; Li, H. Experimental study on the effect of nano-SiO2 on long-term properties of negative-temperature cement paste. Cem. Concr. Compos. 2025, 157, 105916–105923. [Google Scholar] [CrossRef] [Scilit]
- Xu, Z.; Ji, Y.; Zhang, J.; Zhang, Z.; Xue, Q.; Gao, F. Mechanism of nano-SiO2 internal generation for modification of cement-based materials. J. Build. Eng. 2023, 76, 107247–107264. [Google Scholar] [CrossRef] [Scilit]
- Zhang, W.; Lang, L.; Qi, Z.; Wang, Y.; Xue, Q.; Li, J. Muti-scale analysis of solidification/stabilization (S/S) of Pb-contaminated dredged sediment using nano-SiO2 modified cement. J. Rock. Mech. Geotech. Eng. 2025, 17, 5781–5799. [Google Scholar] [CrossRef] [Scilit]
- Xiong, Y.; Liu, X.; Cheng, H.; Wu, S.; Zhang, J.; Liu, W.; Tuo, R.; Liu, Z. Mechanical properties and damage mechanism of steel fiber reinforced cemented tailings backfill. Chin. J. Eng. 2025, 47, 234–248. [Google Scholar] [CrossRef]
- Bates, S.; Zografi, G.; Engers, D.; Morris, K.; Crowley, K.; Newman, A. Analysis of amorphous and nanocrystalline solids from their X-ray diffraction patterns. Pharm. Res. 2006, 23, 2333–2349. [Google Scholar] [CrossRef] [Scilit] [PubMed]
- GB/T 12959-2024; Test Methods for Heat of Hydration of Cement. National Technical Committee for Cement Standardization: Beijing, China, 2024.
- GB/T 1346-2024; Test Methods for Water Requirement of Standard Consistency, Setting Time and Soundness of the Portland Cement. National Technical Committee for Cement Standardization: Beijing, China, 2024.
- JGJ/T 70-2007; Test Methods for Basic Properties of Building Mortar. Ministry of Housing and Urban-Rural Development of the People’s Republic of China MOHURD: Beijing, China, 2007.
- Long, X.; Li, H.; Iyela, P.M.; Kang, S.-B. Predicting the bond stress–slip behavior of steel reinforcement in concrete under static and dynamic loadings by finite element, deep learning and analytical methods. Eng. Fail. Anal. 2024, 161, 108312. [Google Scholar] [CrossRef] [Scilit]
- Zhuang, C.; Chen, Y. The effect of nano-SiO2 on concrete properties: A review. Nanotechnol. Rev. 2019, 8, 562–572. [Google Scholar] [CrossRef] [Scilit]
- Horszczaruk, E.; Łukowski, P.; Seul, C. Influence of dispersing method on the quality of nano-admixtures homogenization in cement matrix. Mater. Des. 2020, 13, 4865. [Google Scholar] [CrossRef] [Scilit]
- Yeap, S.P. Permanent agglomerates in powdered nanoparticles: Formation and future prospects. Powder Technol. 2018, 323, 51–59. [Google Scholar] [CrossRef] [Scilit]
- Xibing, L.; Jian, Z.; Shaofeng, W.; Bing, L. Review and practice of deep mining for solid mineral resources. Chin. J. Nonferrous Met. 2017, 27, 1236–1262. [Google Scholar] [CrossRef]
- Zhengqiao, Y.; Qi, Z.; Hang, W.; Kai, Z.; Zhiliang, C. Research progress on the adaptation and regulation mechanism of micro-organisms in metal tailings. Ecol. Environ. Sci. 2024, 33, 156–166. [Google Scholar] [CrossRef]
- Xu, D.-M.; Zhan, C.-L.; Liu, H.-X.; Lin, H.-Z. A critical review on environmental implications, recycling strategies, and ecological remediation for mine tailings. Environ. Sci. Pollut. Res. 2019, 26, 35657–35669. [Google Scholar] [CrossRef] [Scilit]
- Sun, W.; Ji, B.; Khoso, S.A.; Tang, H.; Liu, R.; Wang, L.; Hu, Y. An extensive review on restoration technologies for mining tailings. Environ. Sci. Pollut. Res. 2018, 25, 33911–33925. [Google Scholar] [CrossRef] [Scilit] [PubMed]
- Yao, Y.; Cui, Z.; Wu, R. Development and challenges on mining backfill technology. J. Mater. Sci. Res. 2012, 1, 73. [Google Scholar] [CrossRef] [Scilit]



Disclaimer/Publisher’s Note: The statements, opinions and data contained in all publications are solely those of the individual author(s) and contributor(s) and not of MDPI and/or the editor(s). MDPI and/or the editor(s) disclaim responsibility for any injury to people or property resulting from any ideas, methods, instructions or products referred to in the content. |
© 2026 by the authors. Licensee MDPI, Basel, Switzerland. This article is an open access article distributed under the terms and conditions of the Creative Commons Attribution (CC BY) license.