


Abstract
Although rock bolts are widely used in tunnel engineering, their effectiveness remains uncertain under specific geological conditions. This study investigates a single-track railway tunnel excavated in gently dipping stratified mudstone to evaluate the applicability of sidewall rock bolts. Field measurements, including tunnel deformation, initial support reaction, and bolt axial force, were conducted. An equivalent support force of bolts was quantified, and a coupled relationship between bolt axial force and surrounding rock displacement was established based on interfacial mechanics. In addition, a physics-constrained inversion framework was developed to reconstruct the displacement field from measured bolt responses. The results show that tunnel deformation is minimal, with a maximum crown settlement of 4.7 mm and convergence of 3.6 mm. The initial support bears 93.4% of total support capacity, compared with merely 6.6% from rock bolts, revealing that primary support dominates load bearing under small deformation. Further parametric analysis indicates that increasing bolt length beyond 1 m does not further enhance the support performance. These findings suggest that there is potential for optimizing the length of fully grouted sidewall rock bolts in heterogeneous, gently dipping layered mudstone tunnels.
1. Introduction
Rock bolt support is widely used in underground engineering [1,2,3]. According to incomplete statistics, the annual usage of rock bolts in tunnel projects in China exceeds 2 million tons, equivalent to approximately 150–200 million pieces, effectively ensuring the smooth progress of tunnel construction. With the extensive application of rock bolts in tunnel engineering, the supporting performance of rock bolts in different geological formations has been studied. In soft rock tunnels with large deformations, rock bolts and rock anchors are highly valued due to their good support performance [4]. In loess tunnels, the support effect of rock bolts is unsatisfactory, especially in the crown, where bolts are subjected to compression [5,6]. In tunnels with horizontal layered surrounding rock, studies suggest that rock bolts are only required within a 120° range of the crown, and sidewall rock bolts can be omitted [7]. These observations indicate that the support performance of rock bolts is closely related to the lithology and structure of the surrounding rock.
Mudstone is a sedimentary rock mainly composed of clay minerals. It can be further subdivided based on diagenesis and mineral content, but it generally exhibits low strength and weakening upon water exposure [8,9]. In tunnel engineering within mudstone and similar sedimentary rock strata, both rebar bolts and hollow grouted bolts are widely used. Typically, rebar bolts are preferred in conditions with good rock mass integrity and small deformation, due to their convenient installation, high stiffness, and low cost. In contrast, hollow grouted bolts are more often used in fractured, jointed, or water-rich ground, where grouting through the hollow bar can reinforce the surrounding rock and seal groundwater. However, studies on rock bolt support in mudstone tunnels indicate that systematic rock bolts have a limited effect on improving the structural stress state in deeply buried, moderately weathered mudstone long-span highway tunnels [10]. In medium-thick mudstone tunnels, the effectiveness of systematic rock bolts is not significant [11]. In layered mudstone tunnels, rock bolts with an angle of less than 30° to the bedding show unsatisfactory support performance [12]. When exposed to water, the bonding force between rock bolts (or anchors) and mudstone decreases significantly [13]. These findings suggest that the performance of systematic rock bolts in mudstone formations requires targeted assessment depending on the actual geological conditions.
Methods for evaluating the support performance of rock bolts can be classified into several categories. (1) Field tests. The support performance can be assessed by setting test sections with and without rock bolts [10,14], or with different types of rock bolts, and comparing tunnel deformation and support structure response. This method can theoretically reflect the support effect of rock bolts directly; however, it is challenging for the test sections to meet the objective comparison conditions. In addition, by measuring the axial force of rock bolts [15,16], the support performance can be evaluated. The measured axial force is used directly or converted into an equivalent support force to assess the performance of rock bolt support. (2) Theoretical calculation. An elastoplastic analytical model is constructed, typically a thick-walled cylinder model. The rock within the rock bolt reinforced zone is treated as a composite material [17,18,19,20,21], or the rock bolt support force is simplified as a uniformly distributed stress increment applied to the model [20,22]. The elastoplastic solution is then obtained after rock bolt reinforcement. This method involves many assumptions compared with actual engineering conditions, but it remains essential for theoretical research. In addition, based on interfacial mechanics theory, a coupled relationship between the axial force of the bolt and the internal displacement of the surrounding rock can be established. The bolt axial force can then be derived from the internal displacement of the surrounding rock, enabling evaluation of the bolt support performance. However, this approach requires knowledge of the internal displacement of the surrounding rock, which can be obtained either through in situ measurements [23] or from the elastoplastic solution of a thin-walled cylindrical tunnel model [24]. (3) Numerical Simulation. Rock bolts are typically simulated using beam elements [25] or truss elements [26] in numerical software. The geological model simulates tunnel excavation following construction stages. Rock bolt elements are inserted into the model at appropriate times. This process provides information on stress and displacement for all structural components throughout tunnel construction. This approach is widely used in many engineering case studies. However, this method cannot fully account for the shear cooperative deformation mechanism between the rock bolt and the surrounding rock. Consequently, the calculated rock bolt support force is only an approximate solution. (4) Model tests. Model tests are based on similarity theory. Scaled or time-scaled models are established for different working conditions to reproduce engineering problems. One type of model test involves constructing a reduced-scale model of the entire target tunnel section [27,28,29]. This approach studies the overall engineering problem of the tunnel. It cannot effectively focus on the rock bolt itself. Another type of model involves establishing a large-scale model of the rock bolt [30,31]. Time-scaling tests are conducted through loading. The specific research methods should take into account the research focus and the research conditions.
These observations highlight the need for a more rigorous evaluation of the support effectiveness of rock bolts in mudstone strata. In particular, the performance of sidewall rock bolts remains unclear under conditions of small deformation and high initial support stiffness. To address this issue, this study, based on a single-track railway tunnel project, adopts a combined approach of field testing and coupled analysis of bolt response and internal displacement of the surrounding rock. The aim is to systematically investigate the actual support performance of sidewall bolts in a tunnel excavated in layered mudstone under small-deformation conditions, and to provide a basis for the optimal design of fully grouted sidewall rock bolts.
2. Experimental Scheme
2.1. Overview of the Tunnel Test Section
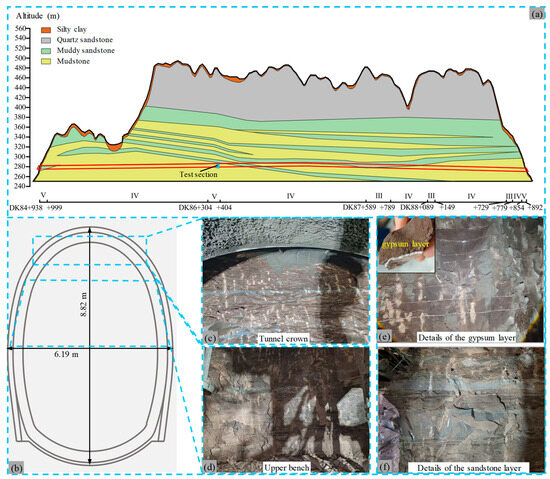
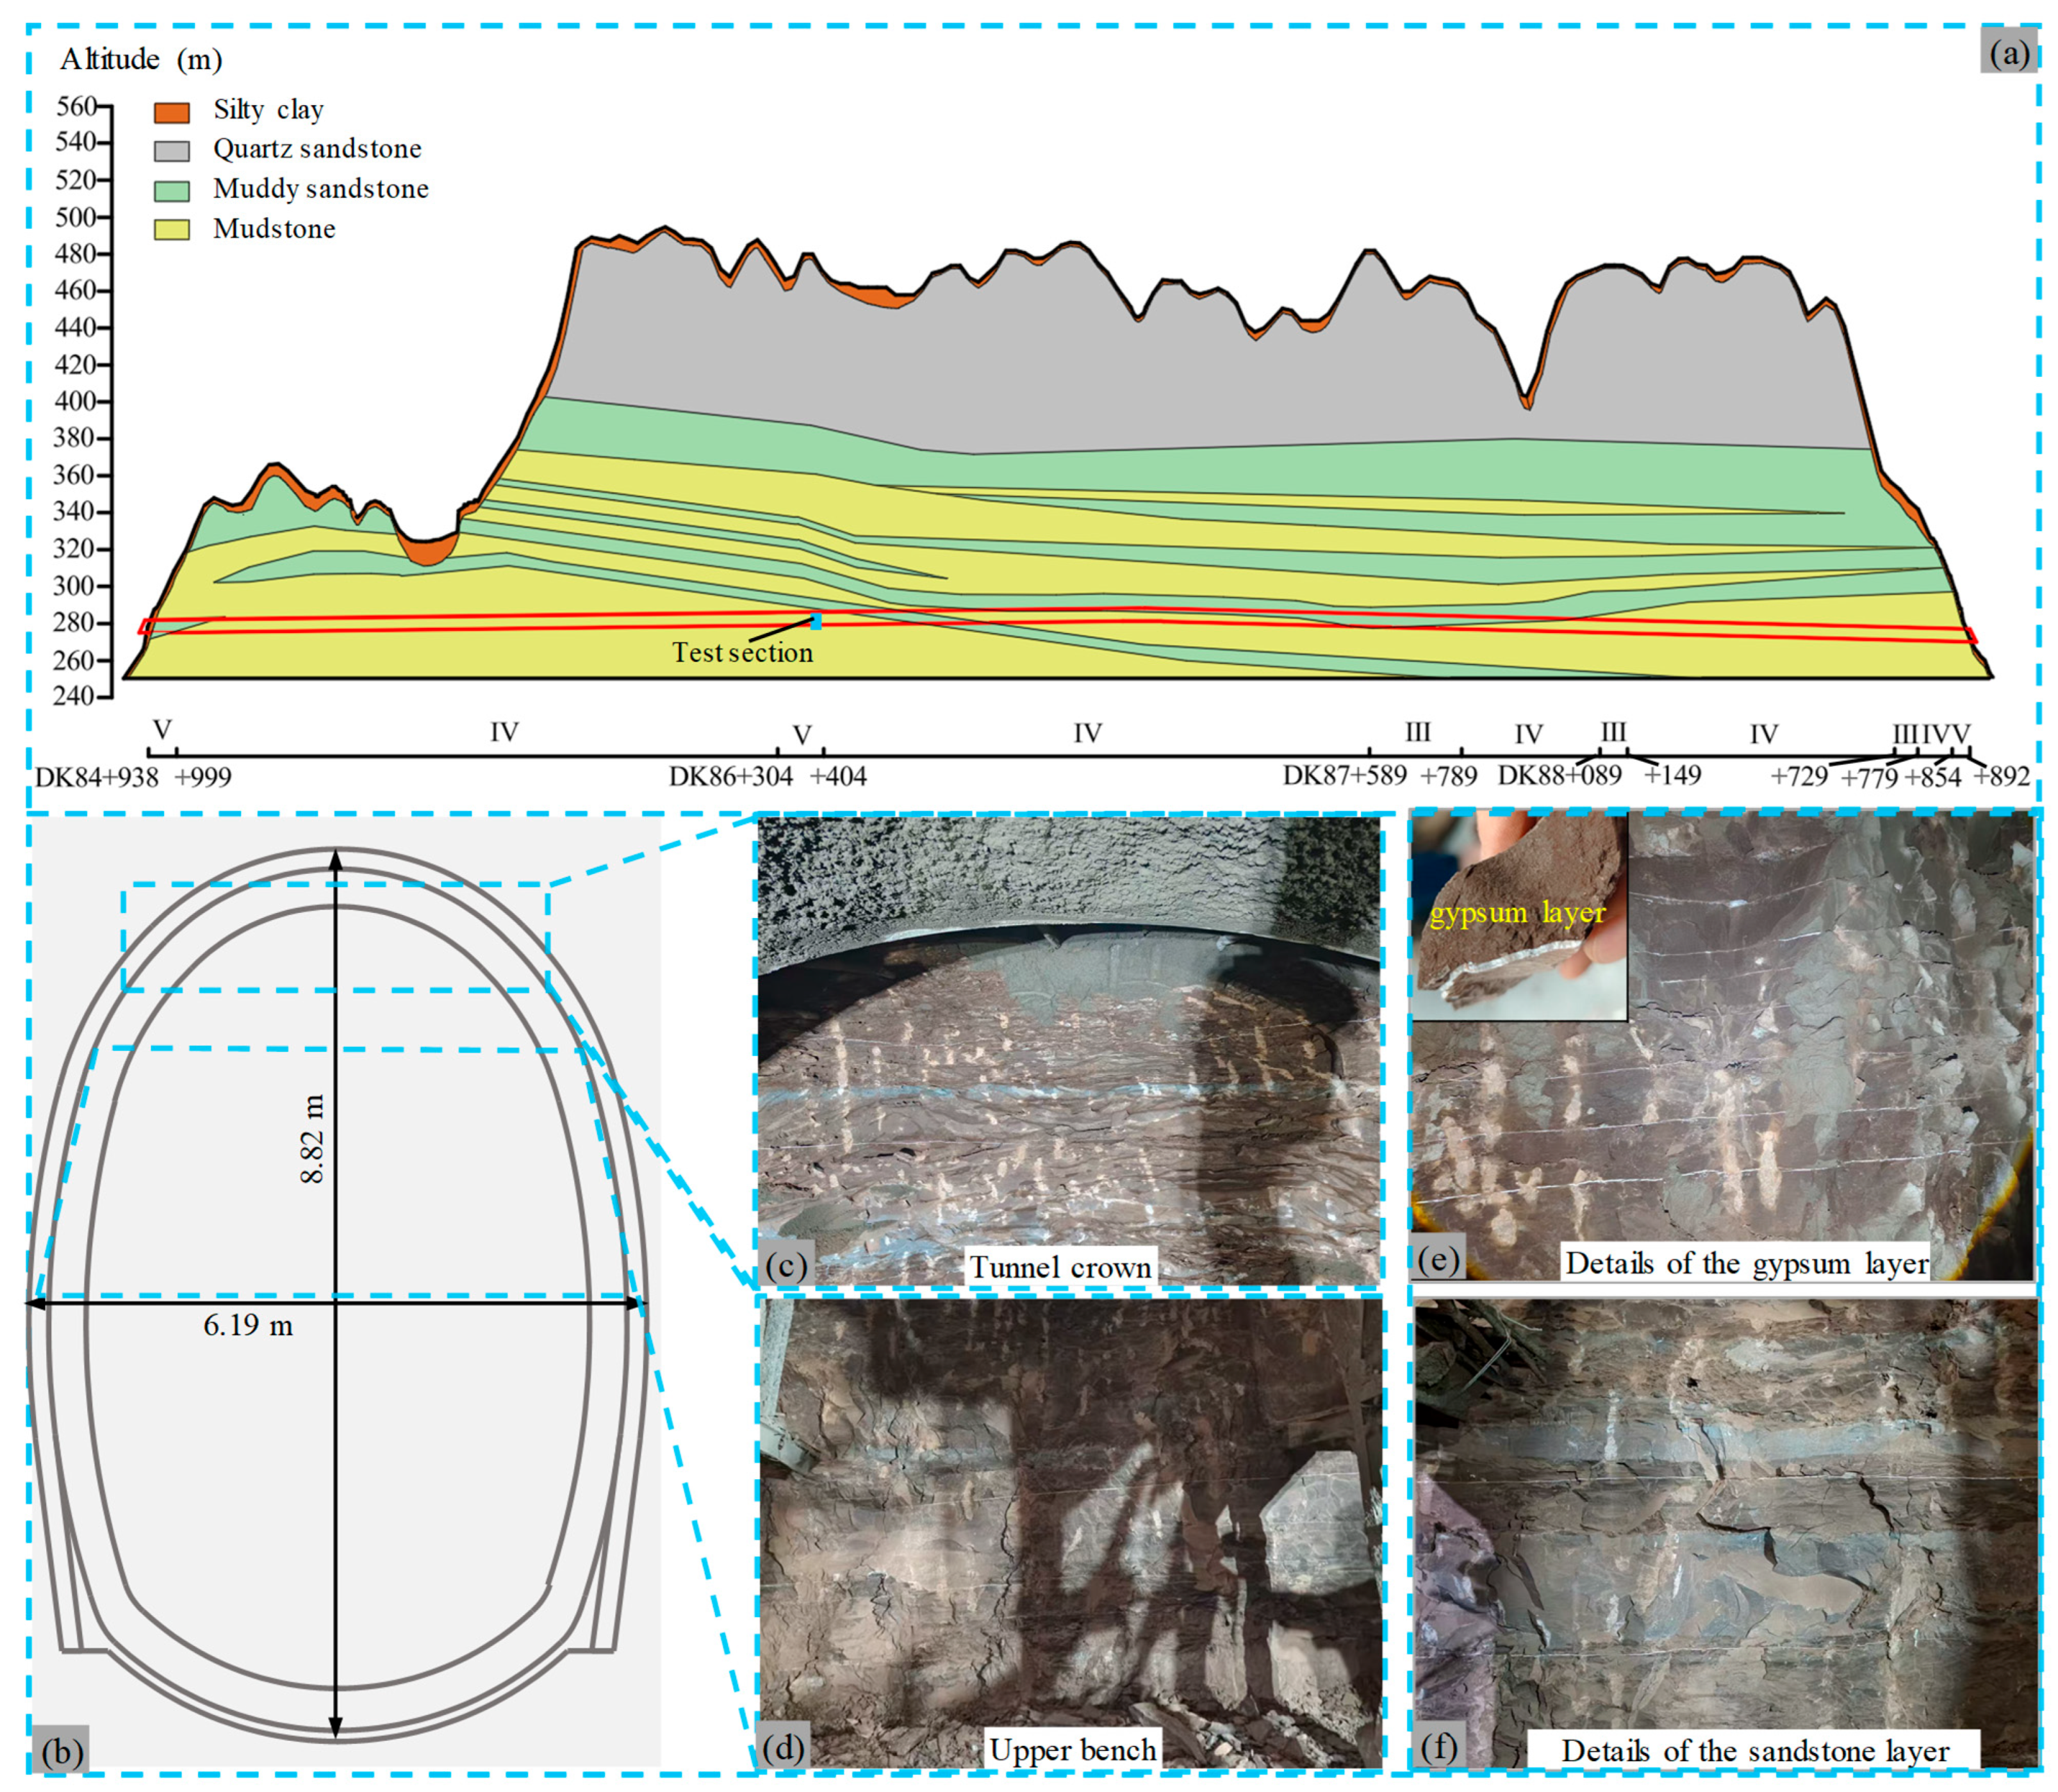
The test section is selected in a single-track railway tunnel under construction. The rock strata in the tunnel site have an attitude of 110–170° with a dip angle of 2–8°, representing a typical gently dipping layered rock mass. The tunnel mainly passes through layered mudstone strata. The geological longitudinal profile of the tunnel is shown in Figure 1a. The tunnel is designed for a single track with a speed of 120 km/h. The tunnel cross-section is shown in Figure 1b.
Figure 1.
Schematic diagram of tunnel related information. (a) geological longitudinal profile; (b) tunnel cross-section; (c–f) Surrounding rock conditions.
The test section of this study is located at mileage DK86 + 395, with a buried depth of 185 m and minimal depth variation in the vicinity. The in situ stress field is dominated by gravitational stress. In accordance with the Code for Design of Railway Tunnels (TB10003-2016), the surrounding rock is classified as Grade V. The tunnel is excavated using the two-bench method with core soil reservation, with a bench length of approximately 50 m.
As shown in Figure 1c–f, the tunnel face is dry and free of groundwater. The surrounding rock is mainly dark gray mudstone. It exhibits a layered structure. Grayish-green sandstone layers are interleaved with clear boundaries. The surrounding rock at the tunnel face is densely segmented by milky-white gypsum infill layers. Figure 1e shows the good integrity of each mudstone layer. The gypsum infill thickness is about 3–5 mm. Detachment easily occurs at the interface between mudstone and gypsum layers. Figure 1f shows that sandstone layers at the same horizontal level have uniform thickness. The thickness of the sandstone layers ranges from 10 to 50 cm.
Although an argillaceous sandstone layer exists above the crown, as shown in Figure 1a, it lies outside the anchorage zone of the sidewall rock bolts. Given the gently dipping attitude of the rock strata, its influence on sidewall surrounding rock deformation and bolt axial force distribution is negligible. In summary, the geological conditions of the test section exhibit good consistency along the tunnel axis, and the test results from a single cross-section can be considered representative of the support response of sidewall rock bolts in this Grade V mudstone stratum.
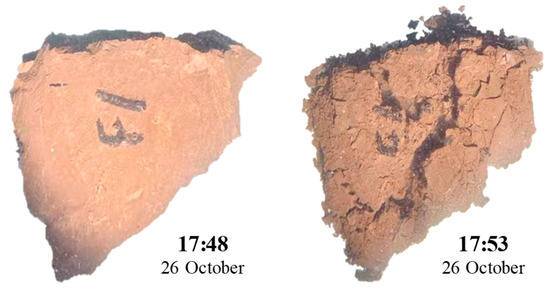
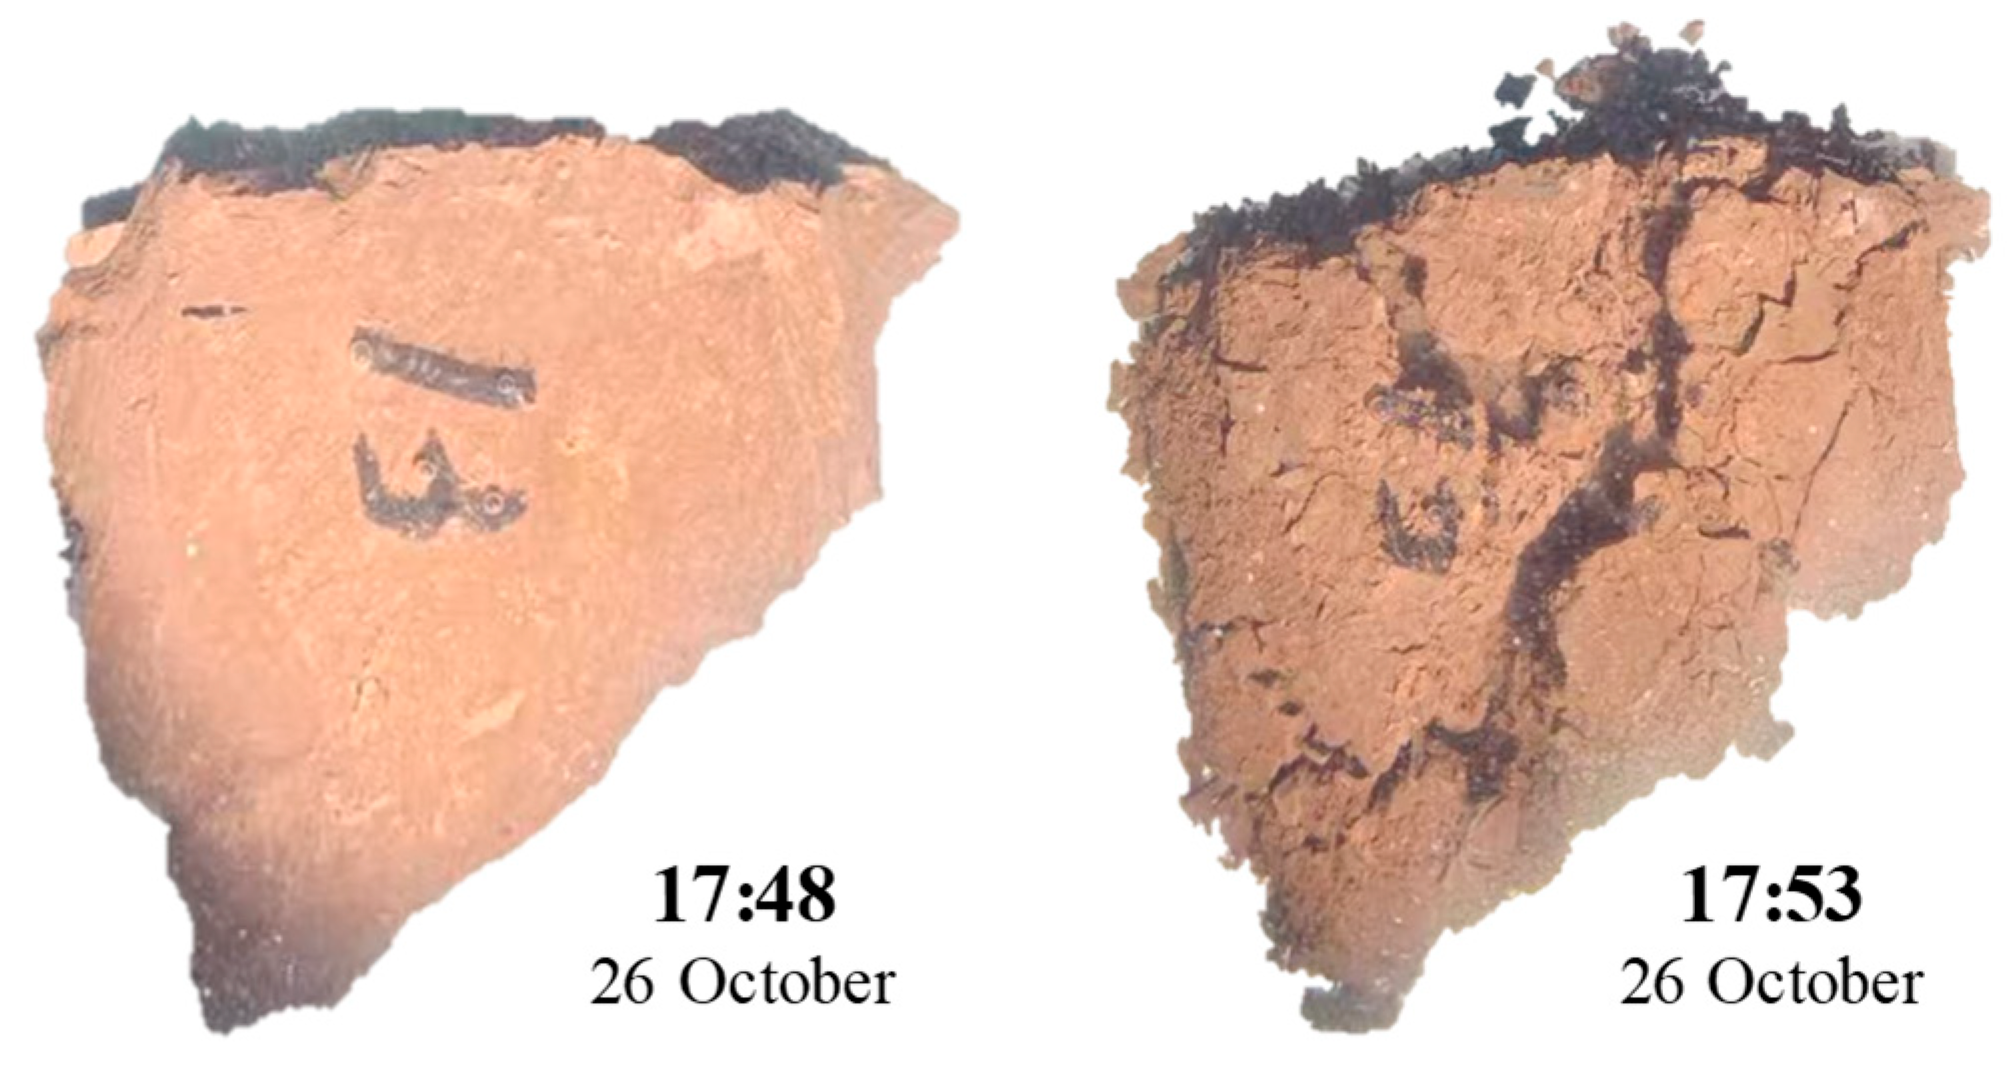
Mudstone samples were collected in the test section. Disintegration property tests were conducted on the mudstone. When the collected mudstone sample is immersed in a water-filled container, a large number of dense bubbles immediately emerge from the sample surface. Although the surface appears dense and smooth visually, the generation of bubbles indicates that pores and micro-cracks still exist inside the sample. Figure 2 shows the comparison of the samples before and after 5 min of immersion.
Figure 2.
Comparison of mudstone before and after water immersion.
As shown in Figure 2, after 5 min of soaking, the samples disintegrated from intact blocks into loose fragments and powder. This result indicates that the mudstone in the test section maintains good integrity and mechanical properties under dry conditions, but it disintegrates easily upon contact with water, and its mechanical strength is almost completely lost after disintegration.
As the surrounding rock of the test section is classified as Grade V and the mudstone shows significant disintegration characteristics, a combined initial support system consisting of rock bolts and I16 steel ribs is adopted in the design. Although the surrounding rock in this section exhibits good overall integrity and no groundwater development is observed, the design considers long-term service safety and potential emergencies. The detailed support parameters of the tunnel composite lining are shown in Table 1.
Table 1.
Test section support parameters.
2.2. Tunnel Deformation Monitoring Scheme
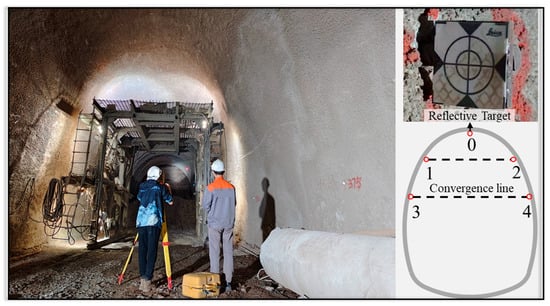
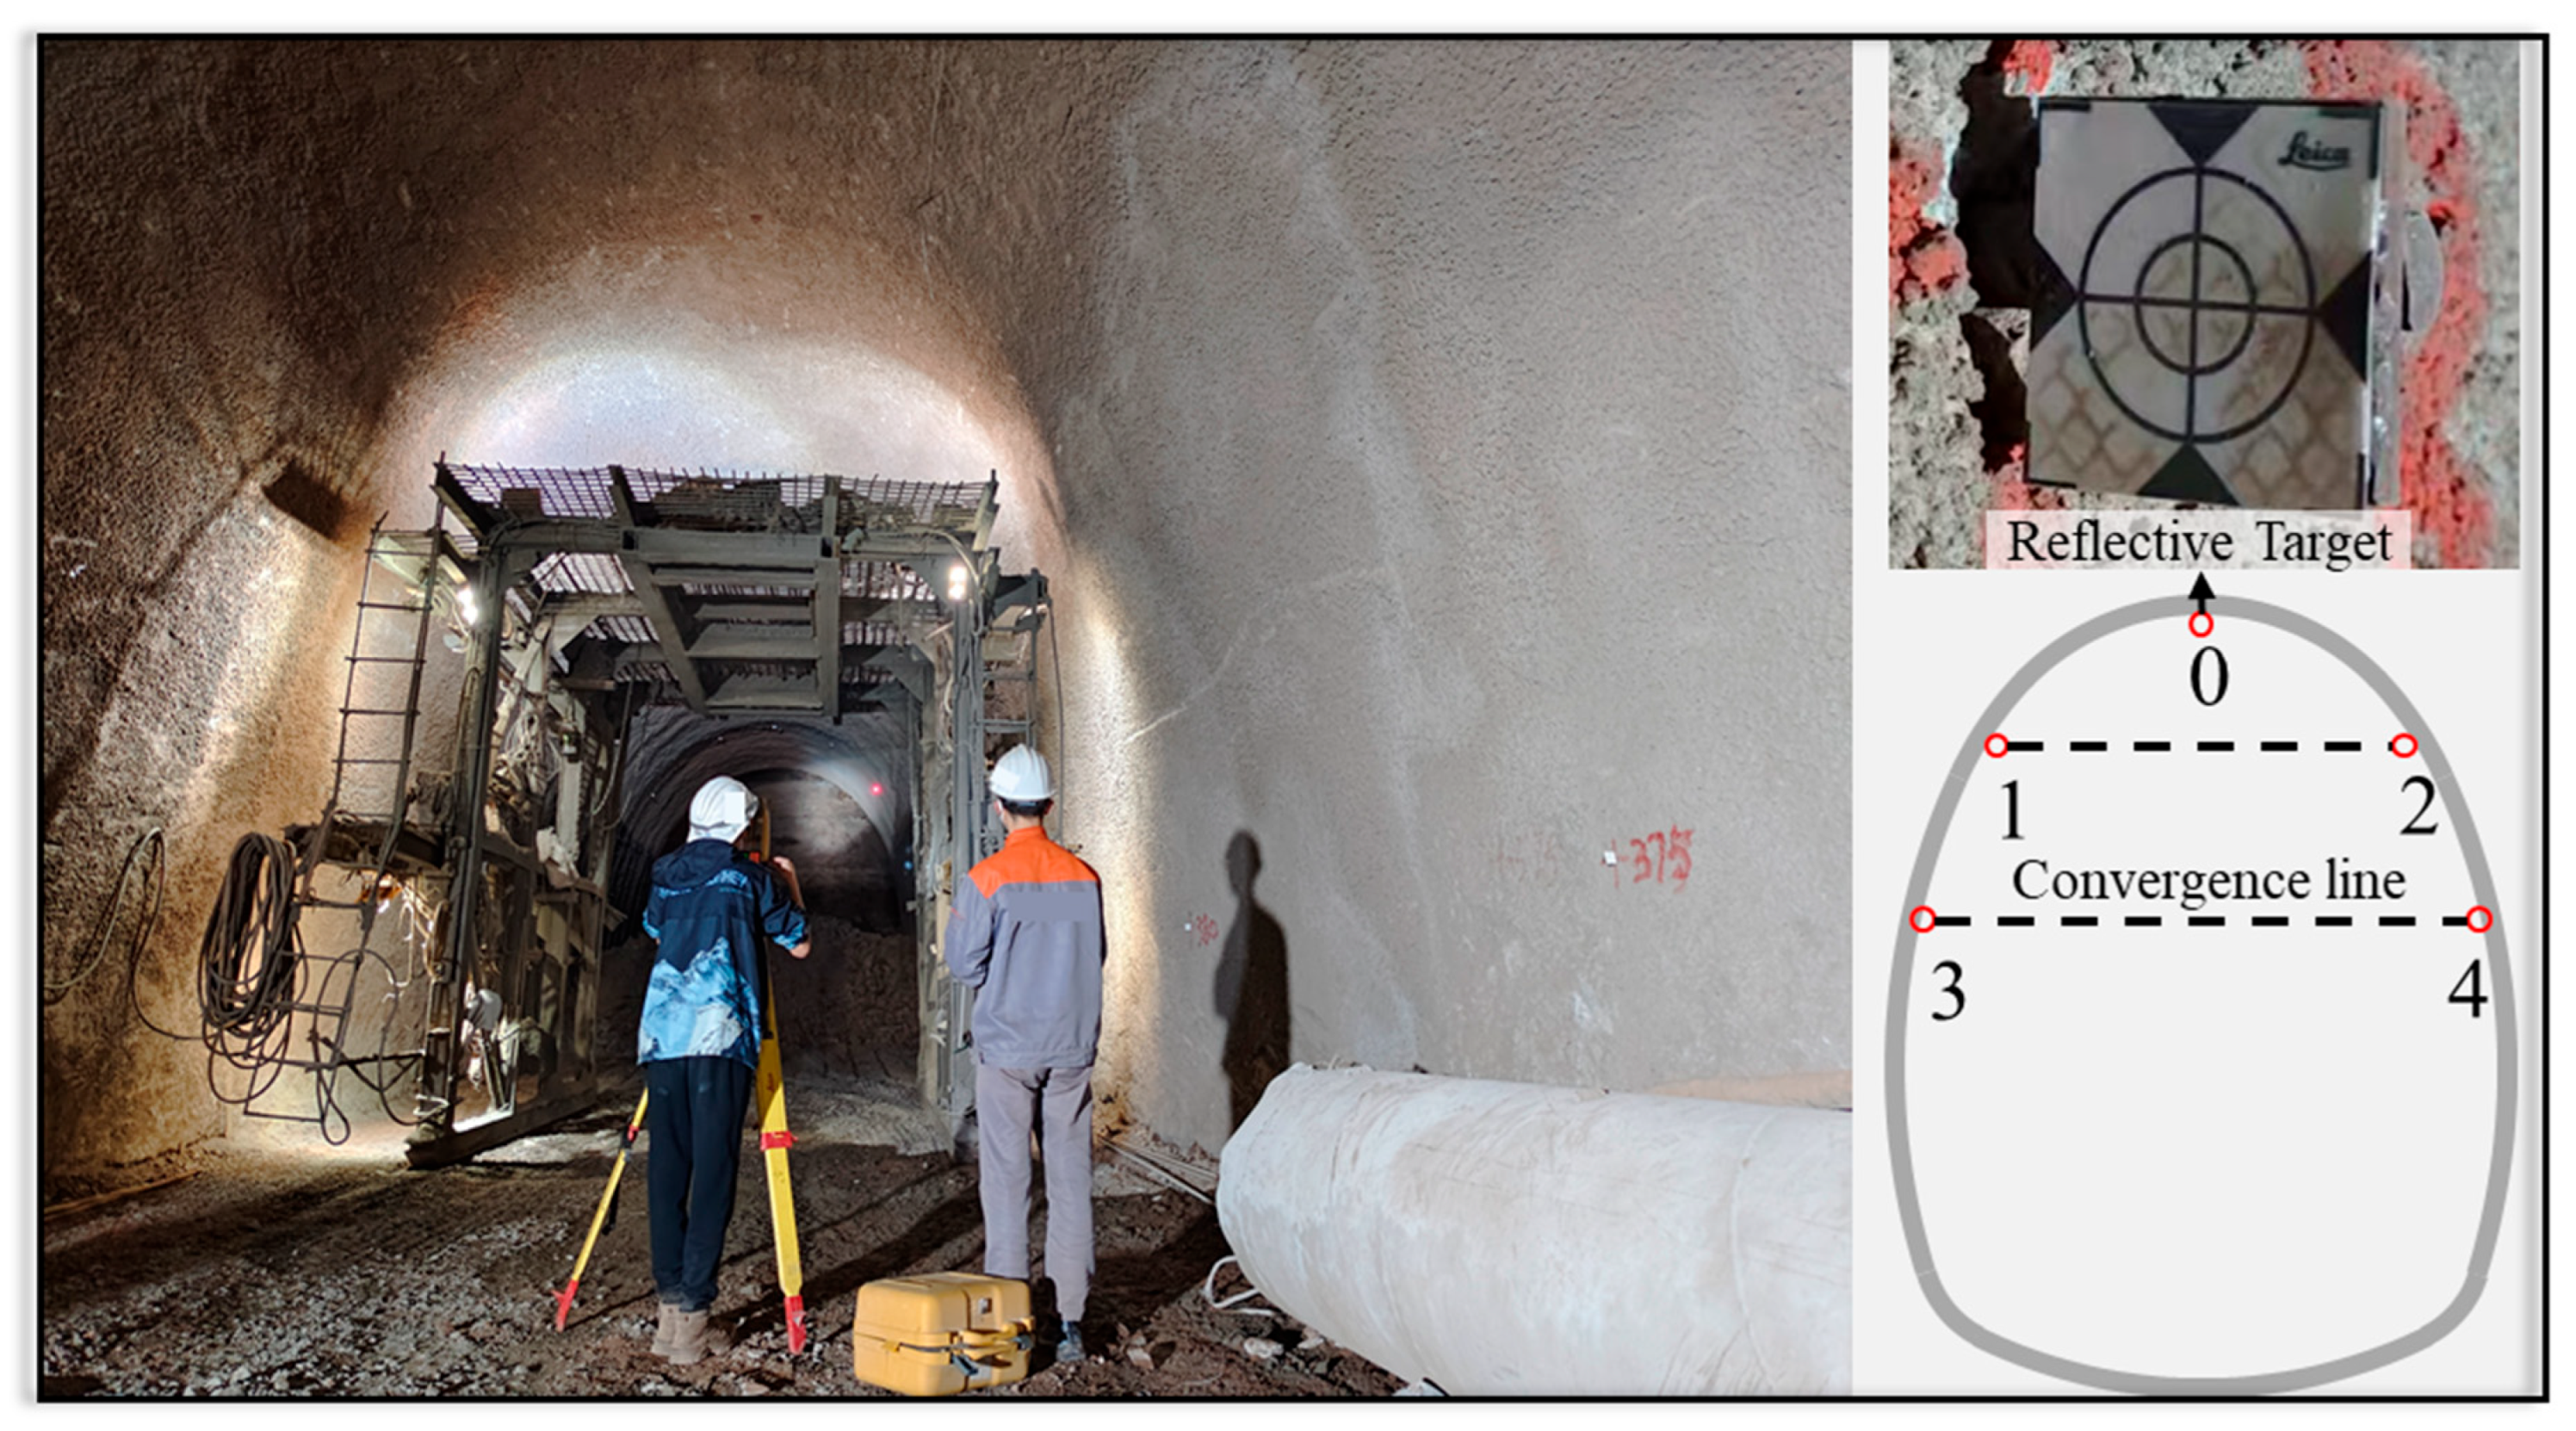
Tunnel deformation was measured using a total station. As shown in Figure 3, five monitoring points were arranged at the tunnel crown, both sides of the arch waist, and both sidewalls. The monitoring points were numbered. Deformation measurements were conducted at a frequency of 1 measurement per day. Tunnel settlement was defined as the change in elevation difference between a monitoring point and the reference point set on the filled invert. Tunnel convergence was defined as the change in horizontal distance between two monitoring points at the same elevation.
Figure 3.
Deformation monitoring of test section.
2.3. Experimental Scheme for Rock Bolt Support Performance
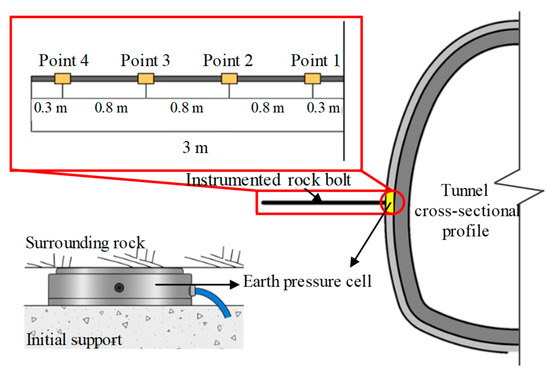
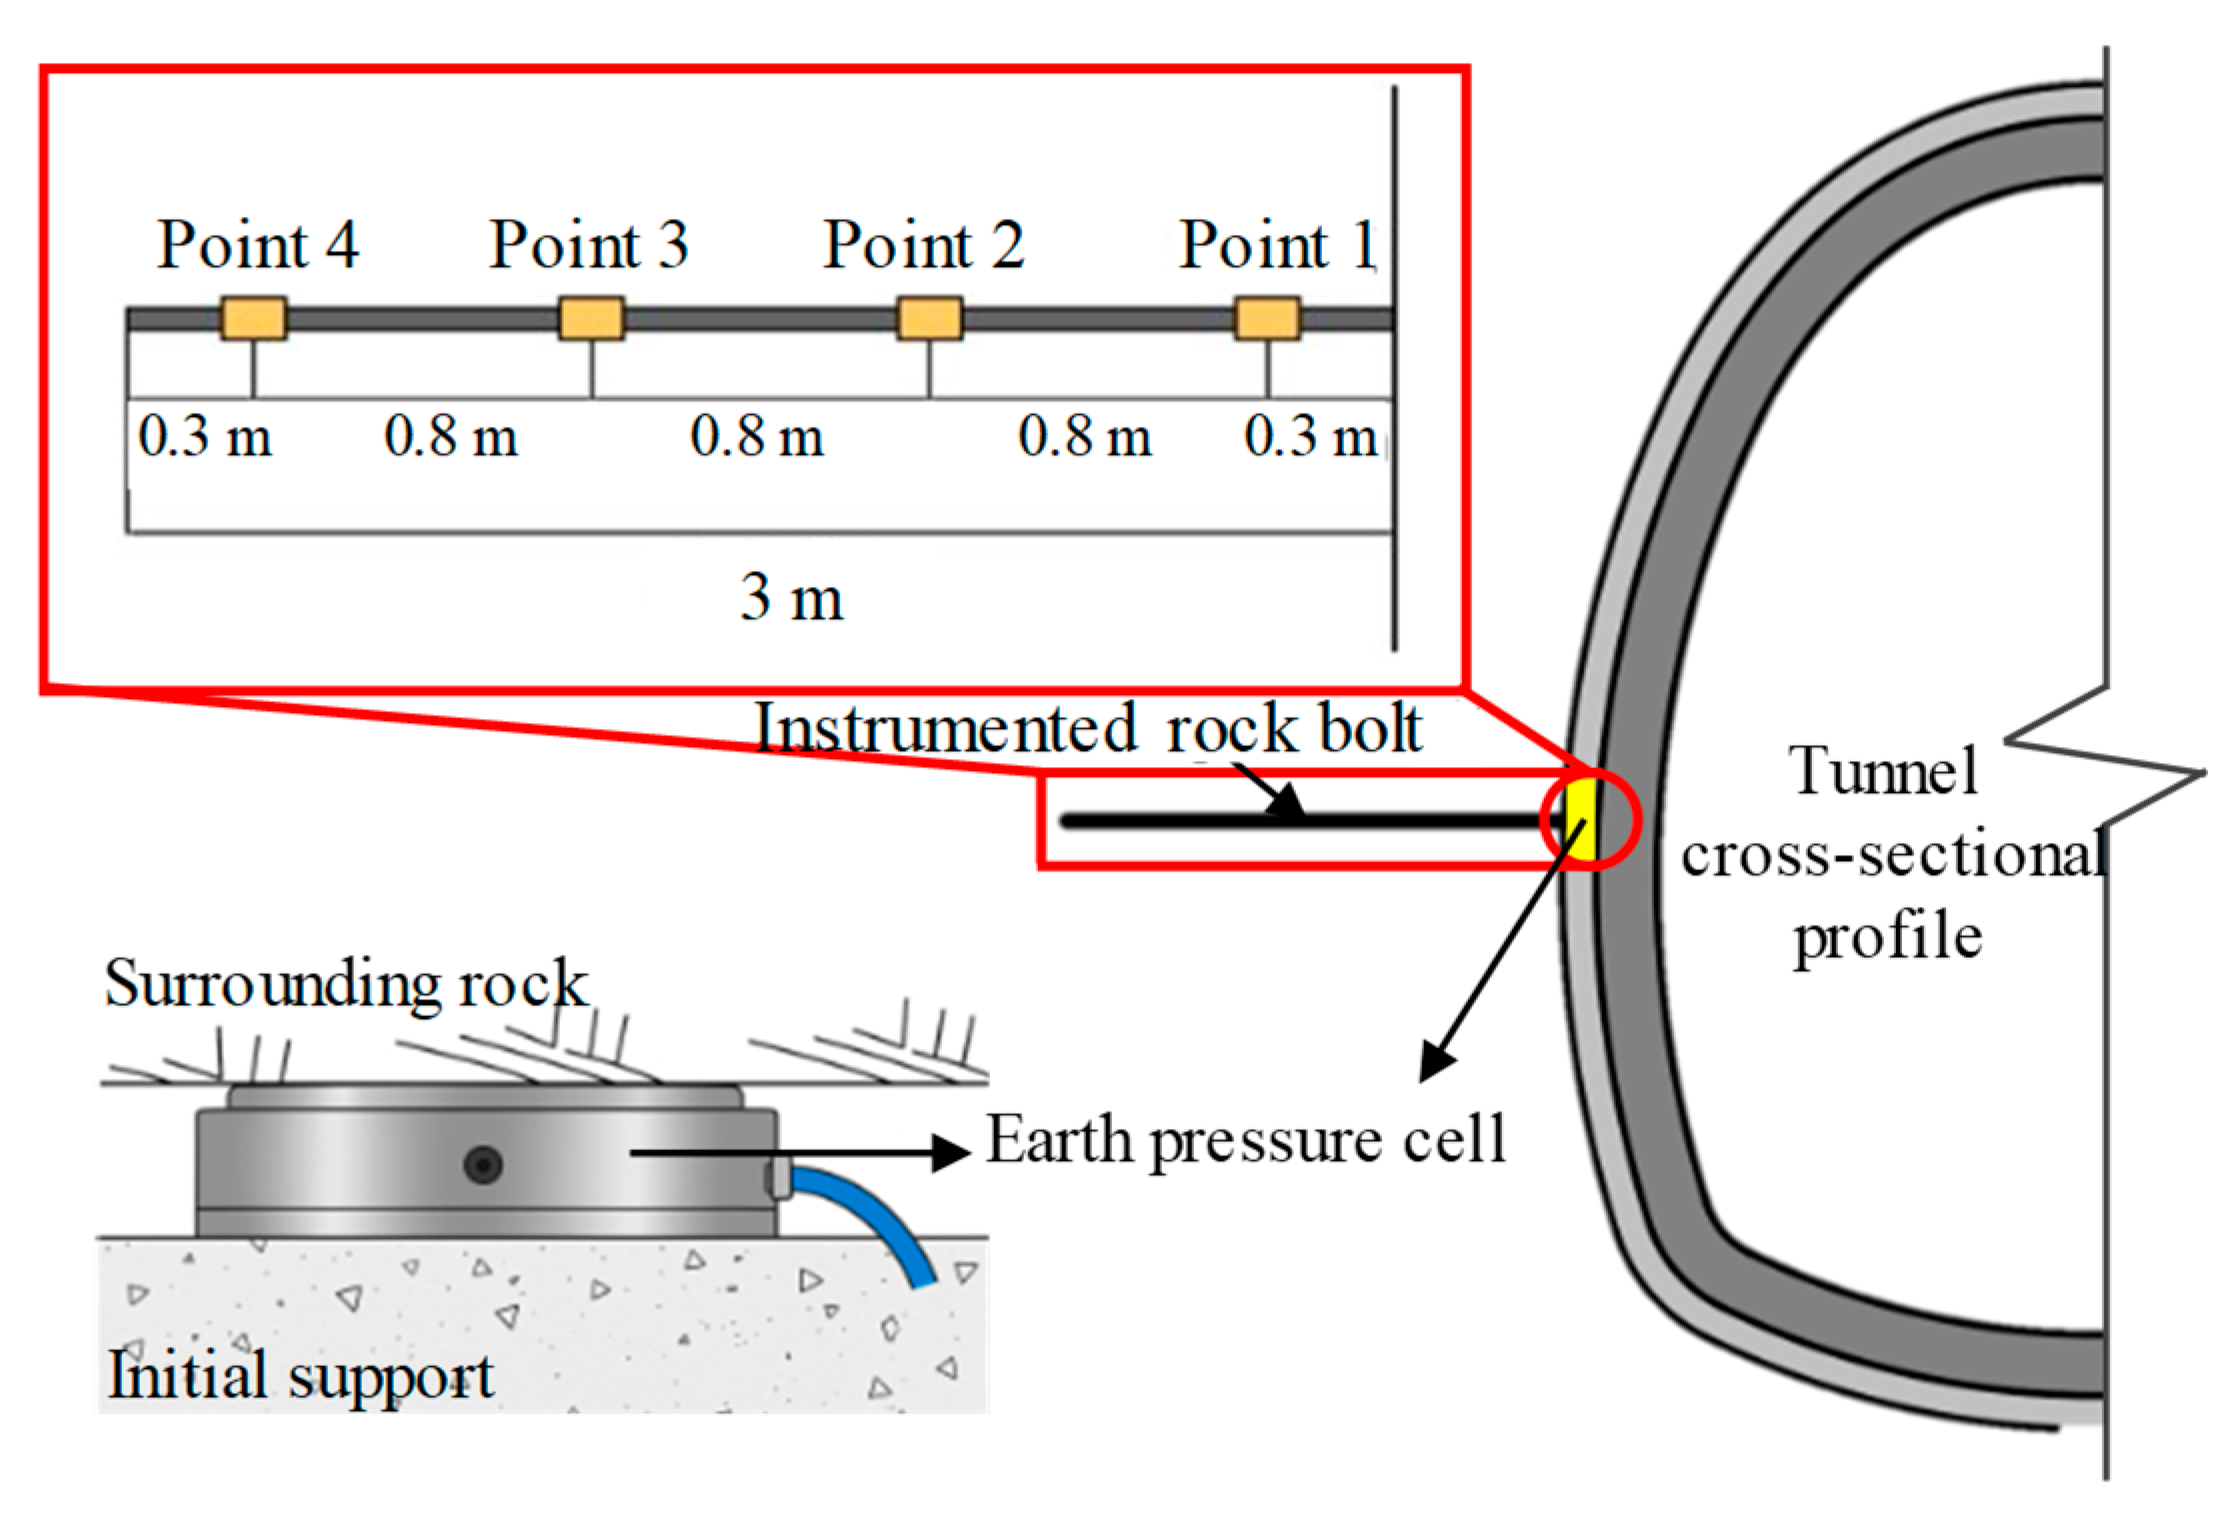
The instrumented rock bolt has the same length as the tunnel’s designed rock bolt. Its length is 3 m. As shown in Figure 4, the instrumented rock bolt is equipped with four monitoring points. The spacing between each monitoring point is 0.8 m. The distance from the outermost monitoring points to the two ends of the rock bolt is 0.3 m. An instrumented bolt was installed in the left sidewall, perpendicular to the tunnel wall and the tunnel axis, and approximately parallel to the gently dipping horizontal bedding plane. The bolt installation position is close to the sidewall deformation monitoring point. Simultaneously, an earth pressure cell is placed between the surrounding rock and the initial support at the measuring point. This monitors the support reaction of the initial support.
Figure 4.
Layout and installation location of instrumented rock bolt and earth pressure cell.
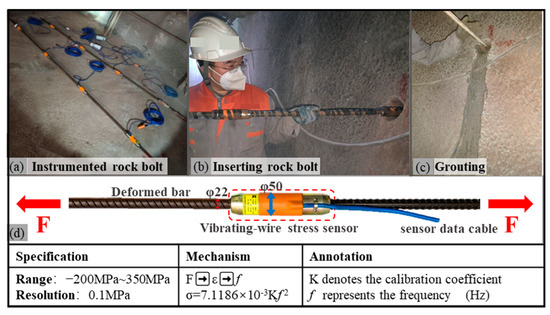
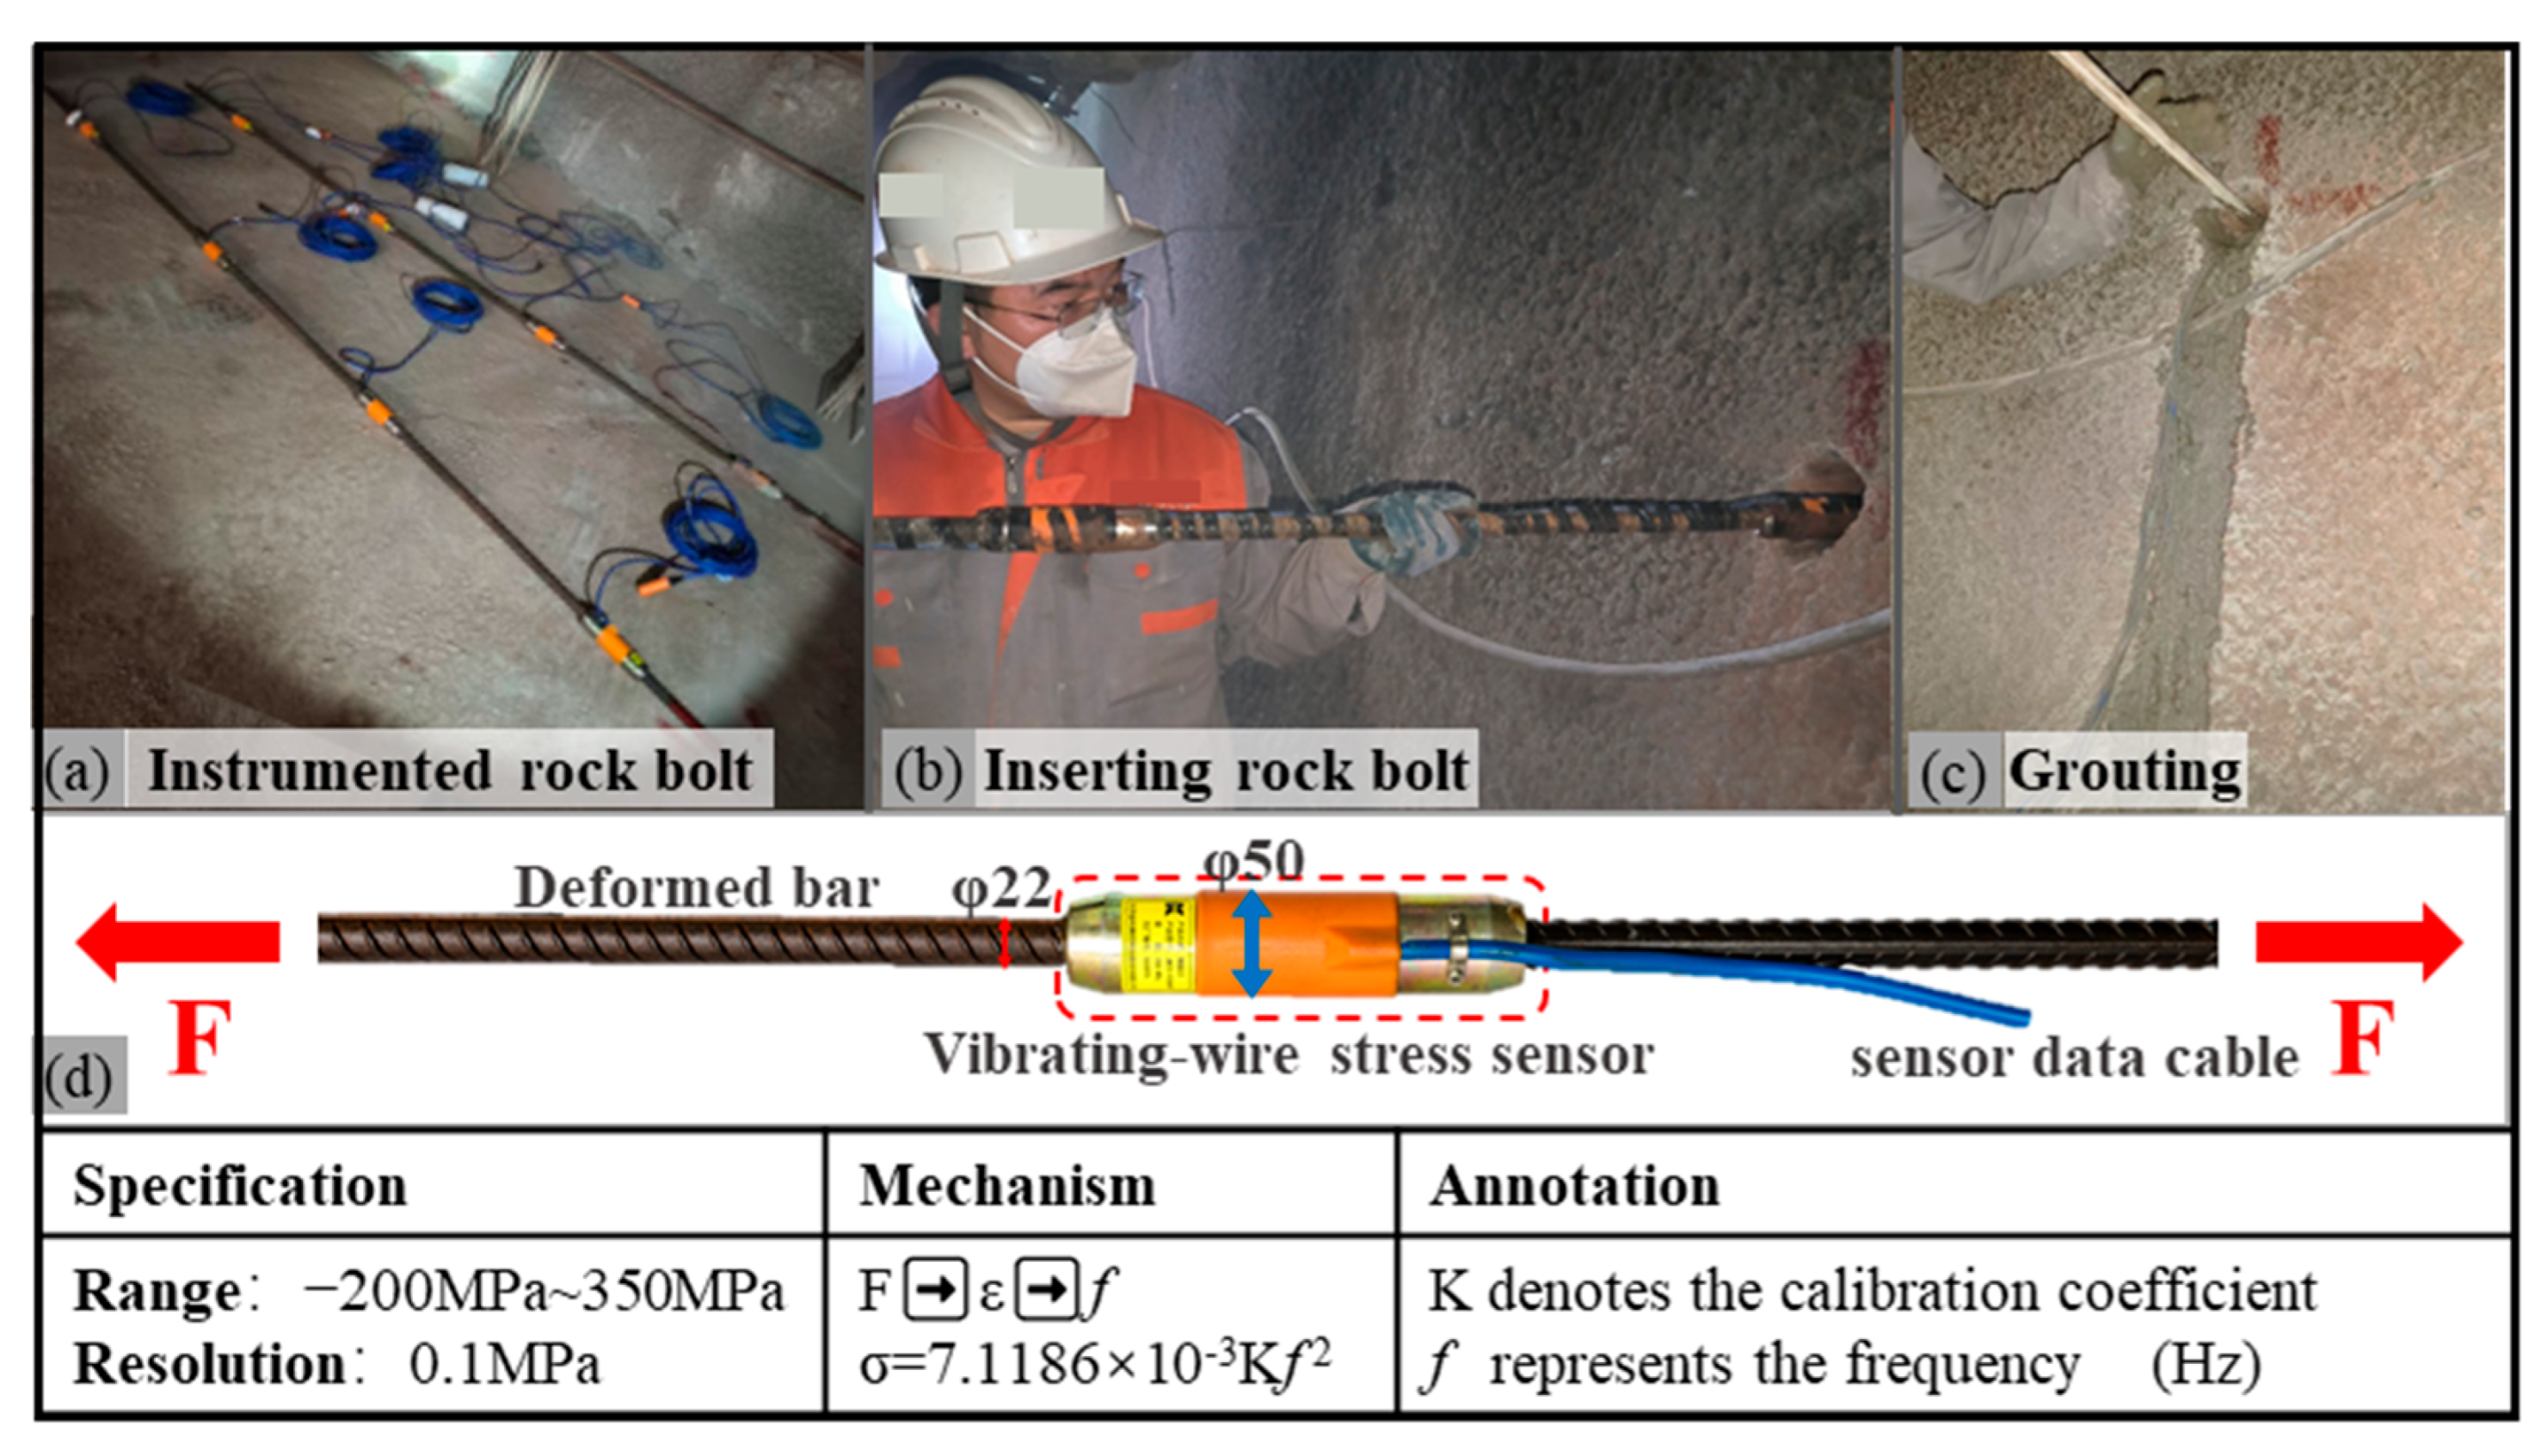
The instrumented rock bolt is of type JMZX422. As shown in Figure 5d, it consists of a 22 mm-diameter threaded steel bar and a 50 mm-diameter vibrating-wire stress sensor connected by a threaded joint. The measuring range is −200 MPa to 350 MPa, with a resolution of 0.1 MPa. Inside the sensor, the natural frequency f of the steel wire is proportional to the square root of the strain ε. When external forces cause strain in the steel wire, magnetic excitation is used to induce vibration. The frequency f is then measured, and the stress state of the bolt is obtained based on the relationship between frequency and strain. The steel wire is enclosed within a protective steel casing, providing high resistance to interference and high measurement accuracy, while minimizing potential damage to the measuring points during installation. Stress sensors are connected at the designated measuring points and arranged in series to form a complete instrumented rock bolt.
Figure 5.
Specification and installation of instrumented rock bolt. (a) instrumented rock bolt; (b) inserting rock bolt; (c) grouting; (d) specification of instrumented rock bolt.
The actual assembled instrumented rock bolt is shown in Figure 5a. The installation of the instrumented rock bolt is illustrated in Figure 5b,c. After the shotcrete of the upper bench had set, a 70 mm diameter anchor hole was drilled in the tunnel wall during the next excavation cycle. The instrumented bolt was then inserted into the hole, while the sensor data cables from each measurement point were led out of the hole. Once the bolt was fully inserted, a PVC grouting pipe was placed at the bottom of the hole. The pipe was gradually withdrawn during grouting until the hole was completely filled. Grouting quality was controlled using the hole-mouth return grouting method. After the grout had hardened and gained sufficient strength, initial readings were taken using a 3001L testing instrument. The axial force of the rock bolts was measured once per day.
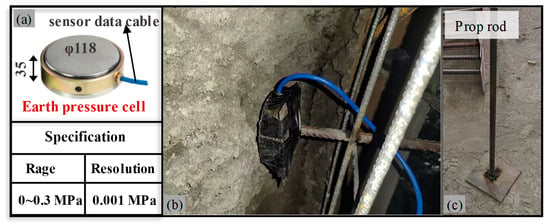
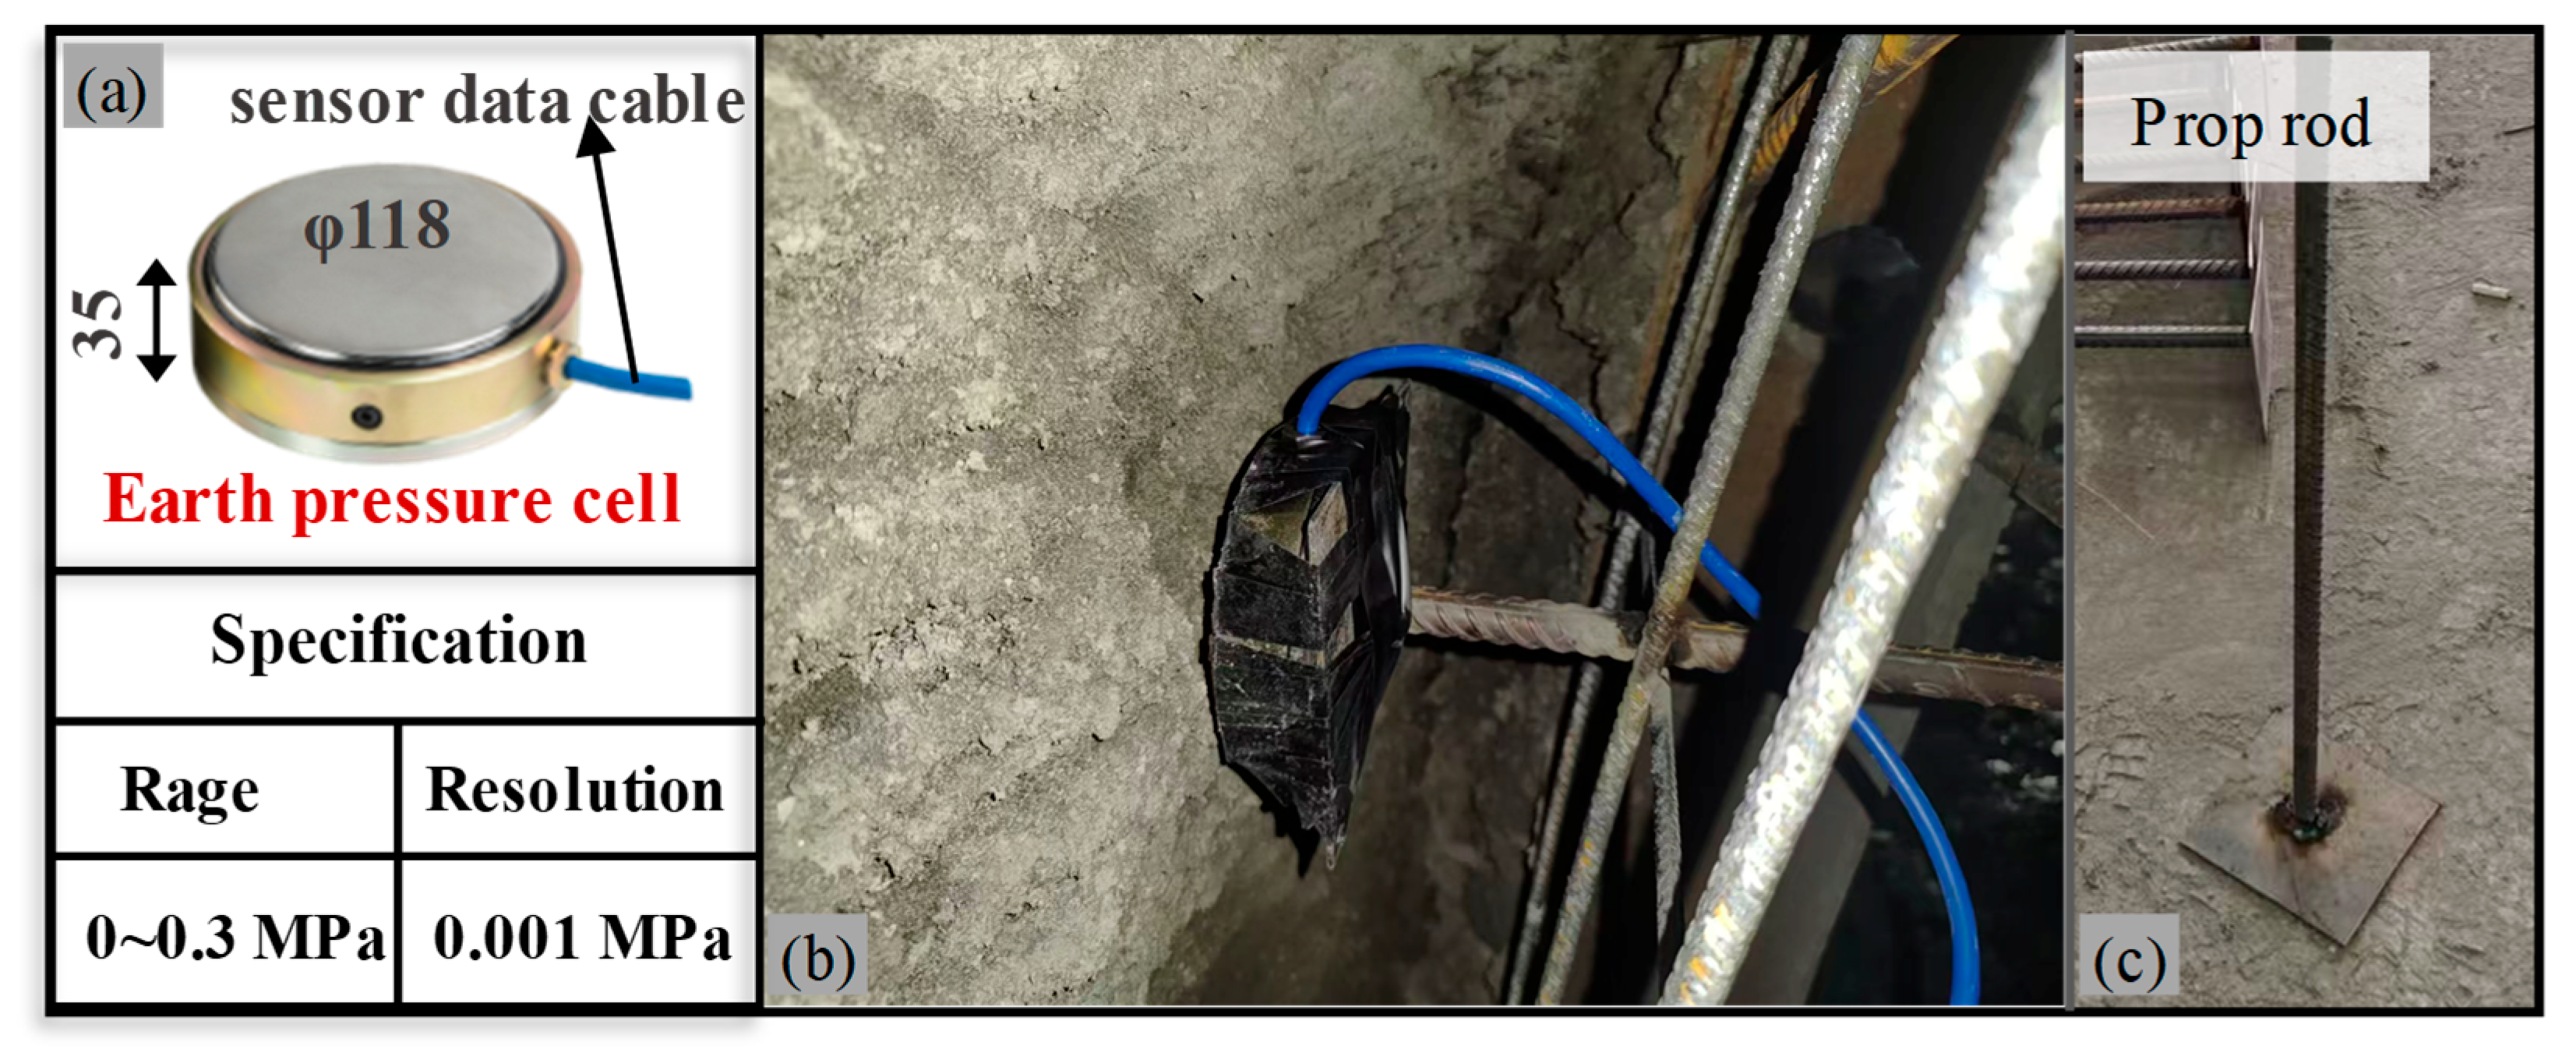
The earth pressure cell is of type JMZX5003. It is also a vibrating-wire sensor, and its measurement principle is the same as described above. As shown in Figure 6a, the earth pressure cell has a diameter of 118 mm and a thickness of 35 mm. Its maximum measuring range is 0.3 MPa, with a resolution of 0.001 MPa. The installation of the earth pressure cell was carried out after the steel frame of the initial support was completed but before shotcrete application. The installation of the earth pressure cell is shown in Figure 6b. First, the cell was fixed to the prop rod. Then, the cell was pressed firmly against the smooth surface of the surrounding rock. Finally, the tail of the prop rod was welded to the steel frame. The pressure cell data were collected with a 3001L integrated testing instrument. Measurements were taken once per day. As shown in Figure 6c, the use of a designed support rod for installing the pressure cell was adopted because no dedicated anchoring devices such as barrel-and-wedge systems were available on site. The pressure cell data were collected with a 3001L integrated testing instrument once per day.
Figure 6.
Specification and installation of earth pressure cell. (a) specification of earth pressure cell; (b) installation of earth pressure cell; (c) prop rod.
3. Test Results Analysis
3.1. Analysis of Tunnel Deformation in the Test Section
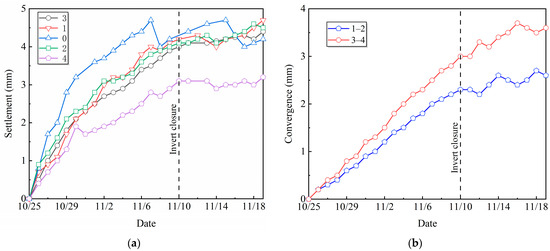
The final deformation results and the average deformation rates of the tunnel cross-section in the test section are listed in Table 2 and Table 3, respectively. The time-history curves of settlement and convergence for the entire monitoring period are shown in Figure 7.
Table 2.
Summary of final deformation.
Table 3.
Average deformation rate.
Figure 7.
Time-history curves of tunnel deformation. (a) Settlement; (b) Convergence.
Based on Table 2 and Table 3, and Figure 7, the deformation of the surrounding rock in the test section exhibits a small overall magnitude, distinct stage evolution characteristics, and a significant influence from invert closure. The deformation behavior is closely related to the layered mudstone geological conditions and the construction process:
(1) The overall deformation is very small, far below the designed reserve value. The maximum cumulative settlement is 4.7 mm, occurring at the left arch shoulder, and the maximum convergence is 3.6 mm, measured along line 3–4. The maximum deformation is only 7.8% of the designed reserve. The main reasons for the small deformation under a burial depth of 185 m are twofold. First, the mudstone is highly diagenetic, and the thin gypsum interlayers are parallel without forming a continuous weak plane. There are no faults in the tunnel site, resulting in good rock mass integrity and high self-stability. Second, the bedding attitude is 110–170°∠2–8°; the gentle dip inhibits interlayer shear slip, and the self-weight of the surrounding rock is primarily carried by the rock layers themselves.
(2) The deformation exhibits a three-stage evolution. The two-bench method was adopted, with an average advance rate of about 4 m/d. The distance between the upper and lower benches was approximately 50 m, with the lower bench lagging by about 12 days and the invert by about 16 days. In the first 5–6 days after upper bench excavation, the surrounding rock stress rapidly released, and the deformation increased quickly. Before invert closure, the deformation rate gradually decreased; a secondary disturbance occurred during lower bench excavation, causing a slight rebound in the deformation rate. After invert closure at 16 days, the initial support formed a closed load-bearing ring, and the deformation rate rapidly declined and then stabilized. Fluctuations in the convergence curves are attributable to systematic measurement errors.
(3) Vertical settlement is significantly larger than horizontal convergence. The cumulative settlement is approximately 1.3 times the convergence value, which is consistent with the typical deformation behavior of gently dipping layered strata [32]. Because the rock layers are nearly horizontal, the surrounding rock stress is mainly released in the direction perpendicular to the bedding (vertical), resulting in larger vertical deformation.
(4) Invert closure plays a crucial role in deformation control. Before invert closure, the maximum average settlement rate at the crown was 0.26 mm/d, and the maximum average convergence rate was 0.19 mm/d. After invert closure, these rates dropped to 0.08 mm/d and 0.07 mm/d, respectively, a reduction of about 70%. Even with a 16-day delay in invert construction, closure still effectively restrained further relaxation of the surrounding rock, highlighting the key role of closing the initial support into a full ring.
In summary, the small deformation characteristics of the test section are closely related to the good integrity of the layered mudstone, the gently dipping bedding, and the timely closure of the invert.
3.2. Analysis of Support Reaction Test Results
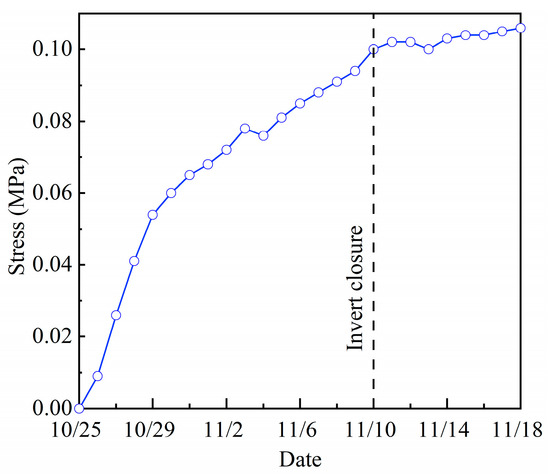
The support reaction of the initial support against the surrounding rock, measured by the earth pressure cells, was plotted as a time-history curve. The result is shown in Figure 8.
Figure 8.
Time-history curves of support reaction.
Analysis of Figure 8 shows:
(1) The support reaction of initial support increased continuously during construction. After excavation, the surrounding rock acted directly on the initial support. Early-stage rock deformation was rapid. Consequently, the support reaction rose quickly. As the rock deformation rate decreased, the growth rate of the support reaction also slowed. Finally, after the invert closure at the test section, the bearing capacity of the support structure increased significantly. The structure effectively restrained rock deformation and established a stable load–structure bearing relationship with the surrounding rock. Therefore, the support reaction leveled off.
(2) After the support reaction stabilized, the pressure was 0.106 MPa. The earth pressure cell measured the interaction force between the surrounding rock and the initial support. The data from this measurement point represent the overall support effect of the initial support at the sidewall of the test section.
3.3. Analysis of Axial Force Test Results
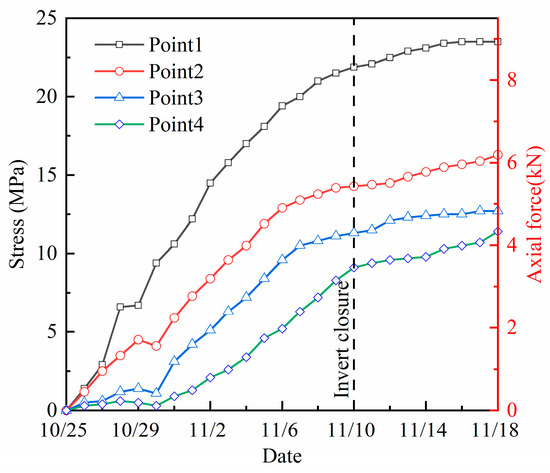
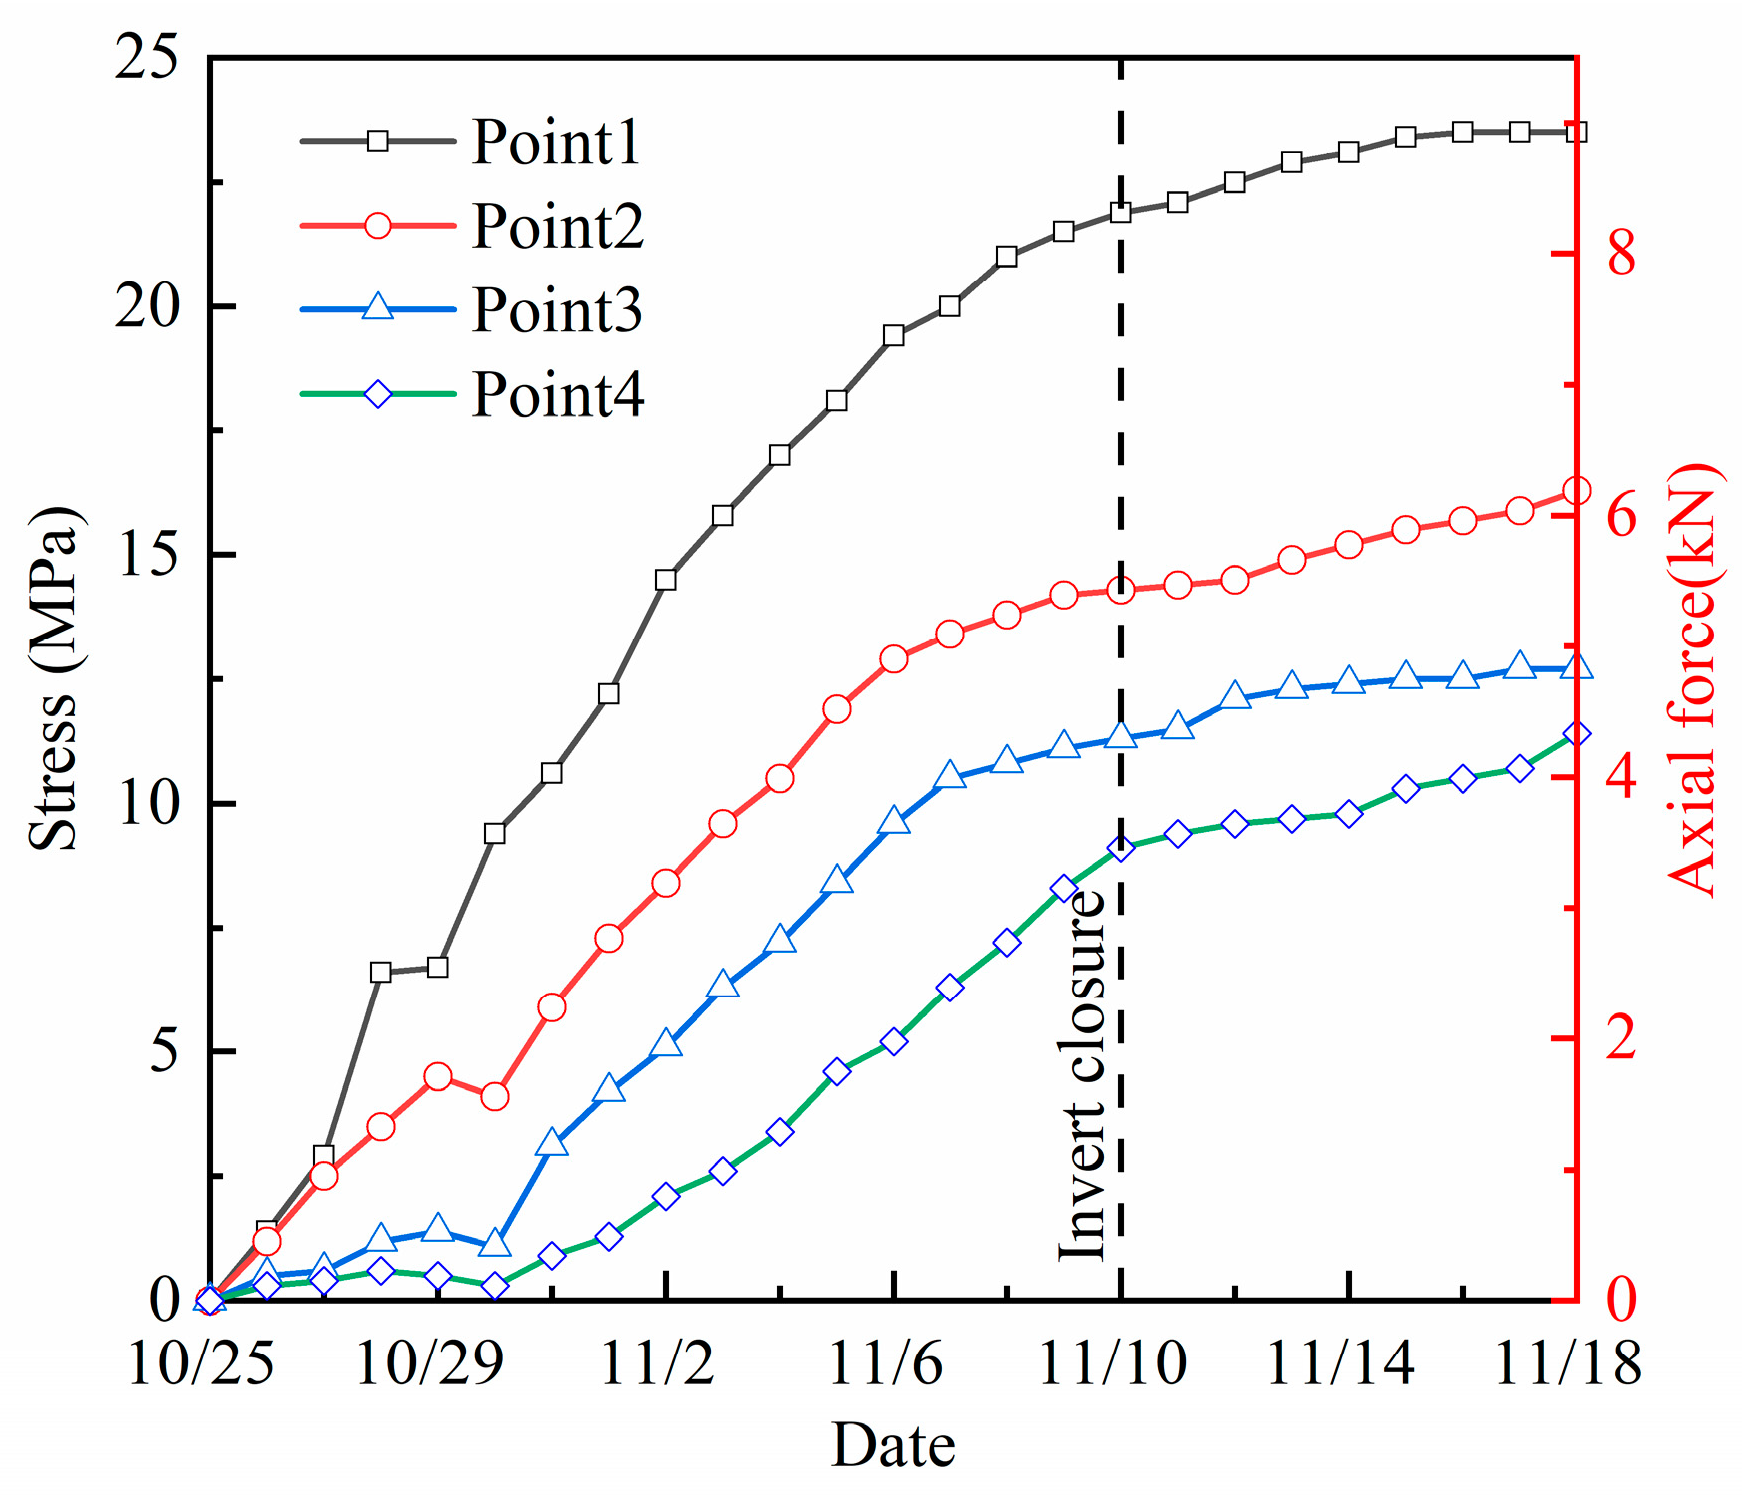
The axial force test results of the rock bolts were plotted as time-history curves, as shown in Figure 9. Positive values indicate that the bolts are under tensile stress.
Figure 9.
Time-history curves of axial force of the rock bolt.
Analysis of Figure 9 shows:
(1) The axial force of the rock bolts increased continuously during construction. This trend is consistent with the general pattern of tunnel deformation. The increase was pronounced before the invert closure. After the invert closure, axial forces at all measurement points gradually stabilized.
(2) The axial force growth trends at different measurement points varied across different stages. At points near the tunnel free face, Point 1 and Point 2, axial force began to increase rapidly after bolt installation. Points 3 and 4 showed obvious increases only five days after bolt installation.
(3) The closer a measurement point is to the tunnel free face, the larger the measured axial force. Since the installation of the instrumented rock bolt, the daily measured axial force values followed Point 1 > Point 2 > Point 3 > Point 4. The gap between Point 1 and the other points continued to grow.
(4) After the invert closure, axial forces at all measurement points tended to stabilize. Tunnel deformation was effectively restrained after the invert closure. The growth rate of axial force decreased markedly. The axial force of the rock bolts is clearly coupled with tunnel deformation.
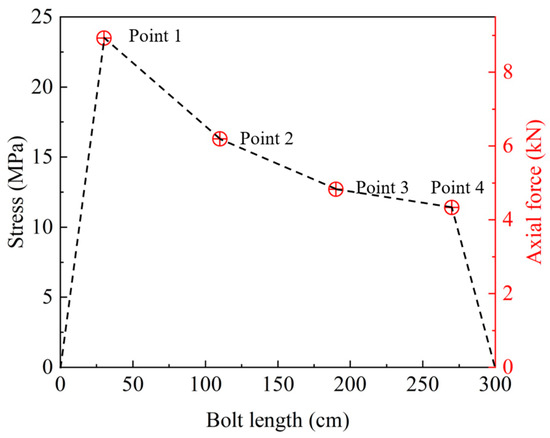
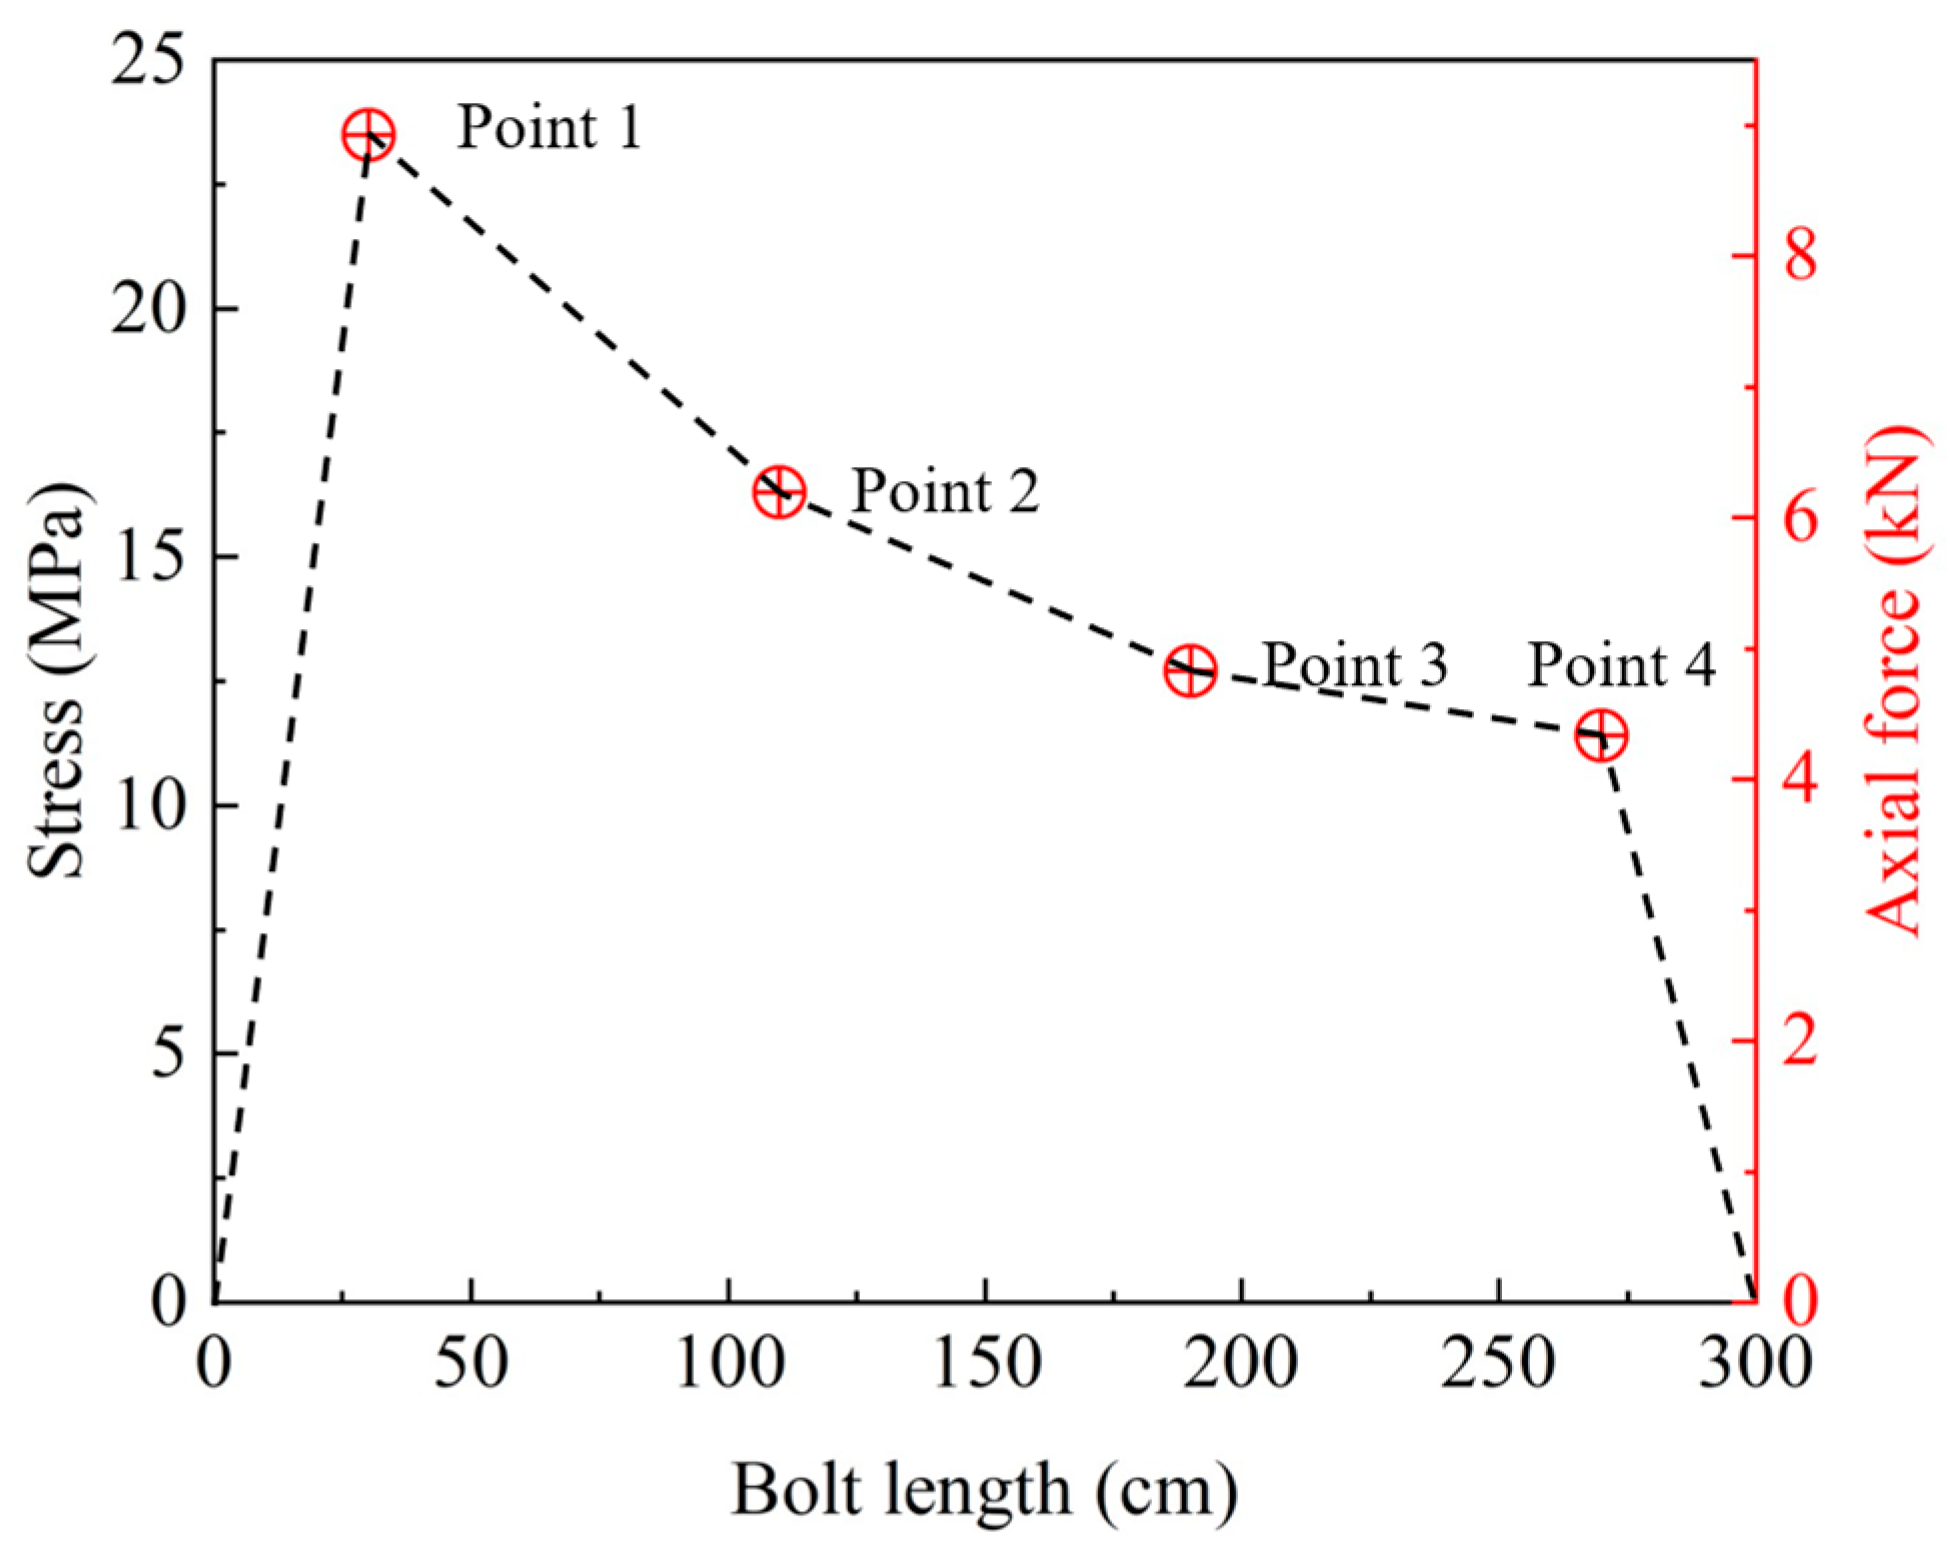
Axial force test results at each measurement point after bolt stabilization were extracted and compiled in Table 4. For full-length bonded rock bolts, the axial force at both ends is zero. Assuming a linear variation in axial force between measurement points, the axial force distribution along the bolt was plotted in Figure 10.
Table 4.
Final results of rock bolt axial force.
Figure 10.
Final distribution of rock bolt axial force.
(1) After the rock bolt axial force stabilized, its entire length was in a state of tension. Tunnel excavation induced surrounding rock deformation. This deformation varied with depth. As a result, relative displacement developed between rock masses at different depths. During construction, this relative displacement continued to increase. Consequently, the rock bolt was stretched while constraining rock displacement. Therefore, when the rock bolt remained in tension along its full length, it indicated that the bolt was performing its bearing function.
(2) The results of the axial force test were relatively low. The instrumented bolt recorded a maximum stress of 23.5 MPa. This corresponds to an axial force of 8.9 kN, only 6.5% of the bolt design load. This suggests that while the rock bolt performed its bearing function, its material properties were severely underutilized due to the relatively small surrounding rock deformation.
(3) The axial force of the rock bolt along its length showed a “single-peak” distribution. From the bolt front end to measuring point 1, the axial force increased rapidly from 0 to a peak value of 8.9 kN. Subsequently, the axial force began to decrease continuously. At point 2, the axial force decreased to 69.6% of that at point 1. Between points 1 and 4, the rate of axial force attenuation gradually slowed down. However, from point 4 to the bolt tail end, the axial force quickly dropped to zero.
According to the test results of the instrumented rock bolt, the fully grouted rock bolts installed in the sidewall of the single-track railway tunnel in layered mudstone were able to perform their bearing function. However, their axial forces were much lower than the design load.
3.4. Equivalent Support Force of Rock Bolt
The constraint effect of rock bolts on the surrounding rock cannot be directly reflected by their axial force. Therefore, many researchers have proposed the concept of the equivalent supporting force of rock bolts [33]. This concept converts the axial force of a rock bolt into an equivalent force acting on the surface of the surrounding rock within the influence zone of the bolt.
Mai and Zhang [34] proposed the calculation formula for the equivalent supporting force of multiple rock bolts acting on the surrounding rock:
where σ is the equivalent supporting force; n is the number of rock bolts; Nmax is the maximum axial force of a rock bolt; S is the surface area of the surrounding rock within the influence zone of the rock bolts.
Yao, et al. [35] proposed the formula for calculating the equivalent support force of a single rock bolt:
where σb is the maximum axial stress of the rock bolt; A is the cross-sectional area of the rock bolt.
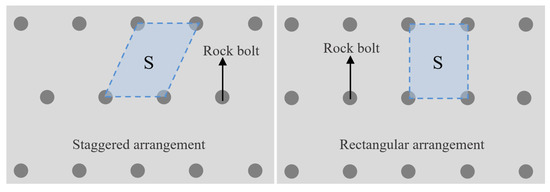
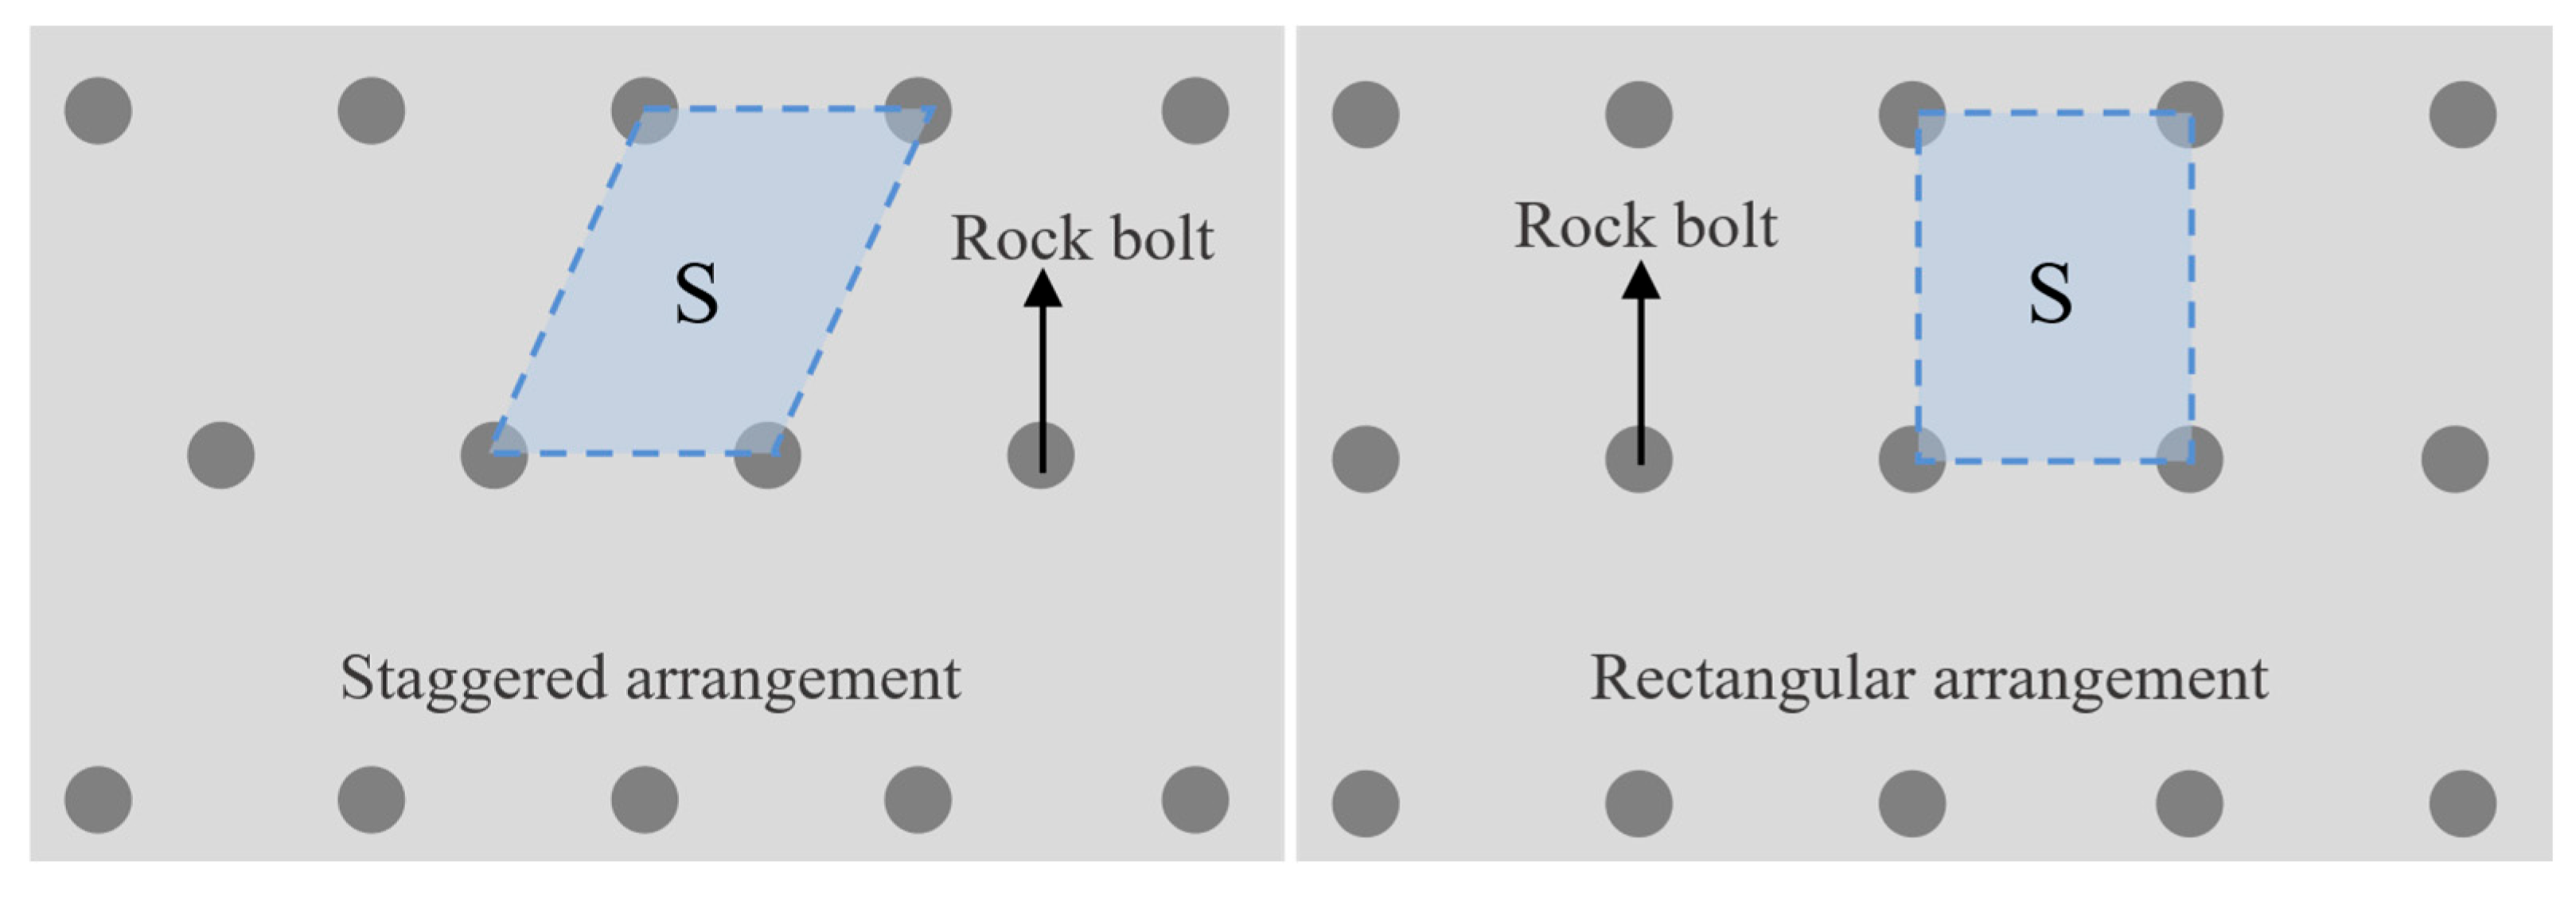
Therefore, Equations (1) and (2) are visibly equivalent. Furthermore, References [36,37] proposed a method for determining the value of S, the surface area of the surrounding rock within the rock bolt’s influence zone. As shown in Figure 11, the authors posit that the quadrilateral area enclosed by the rock bolts serves as S.
Figure 11.
Surrounding rock area within the influence range of the rock bolt.
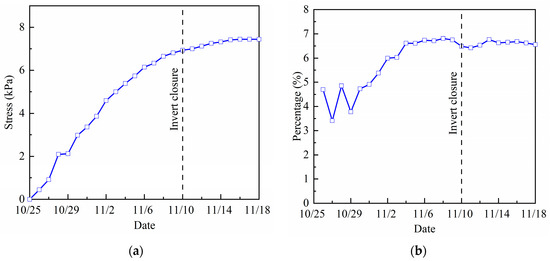
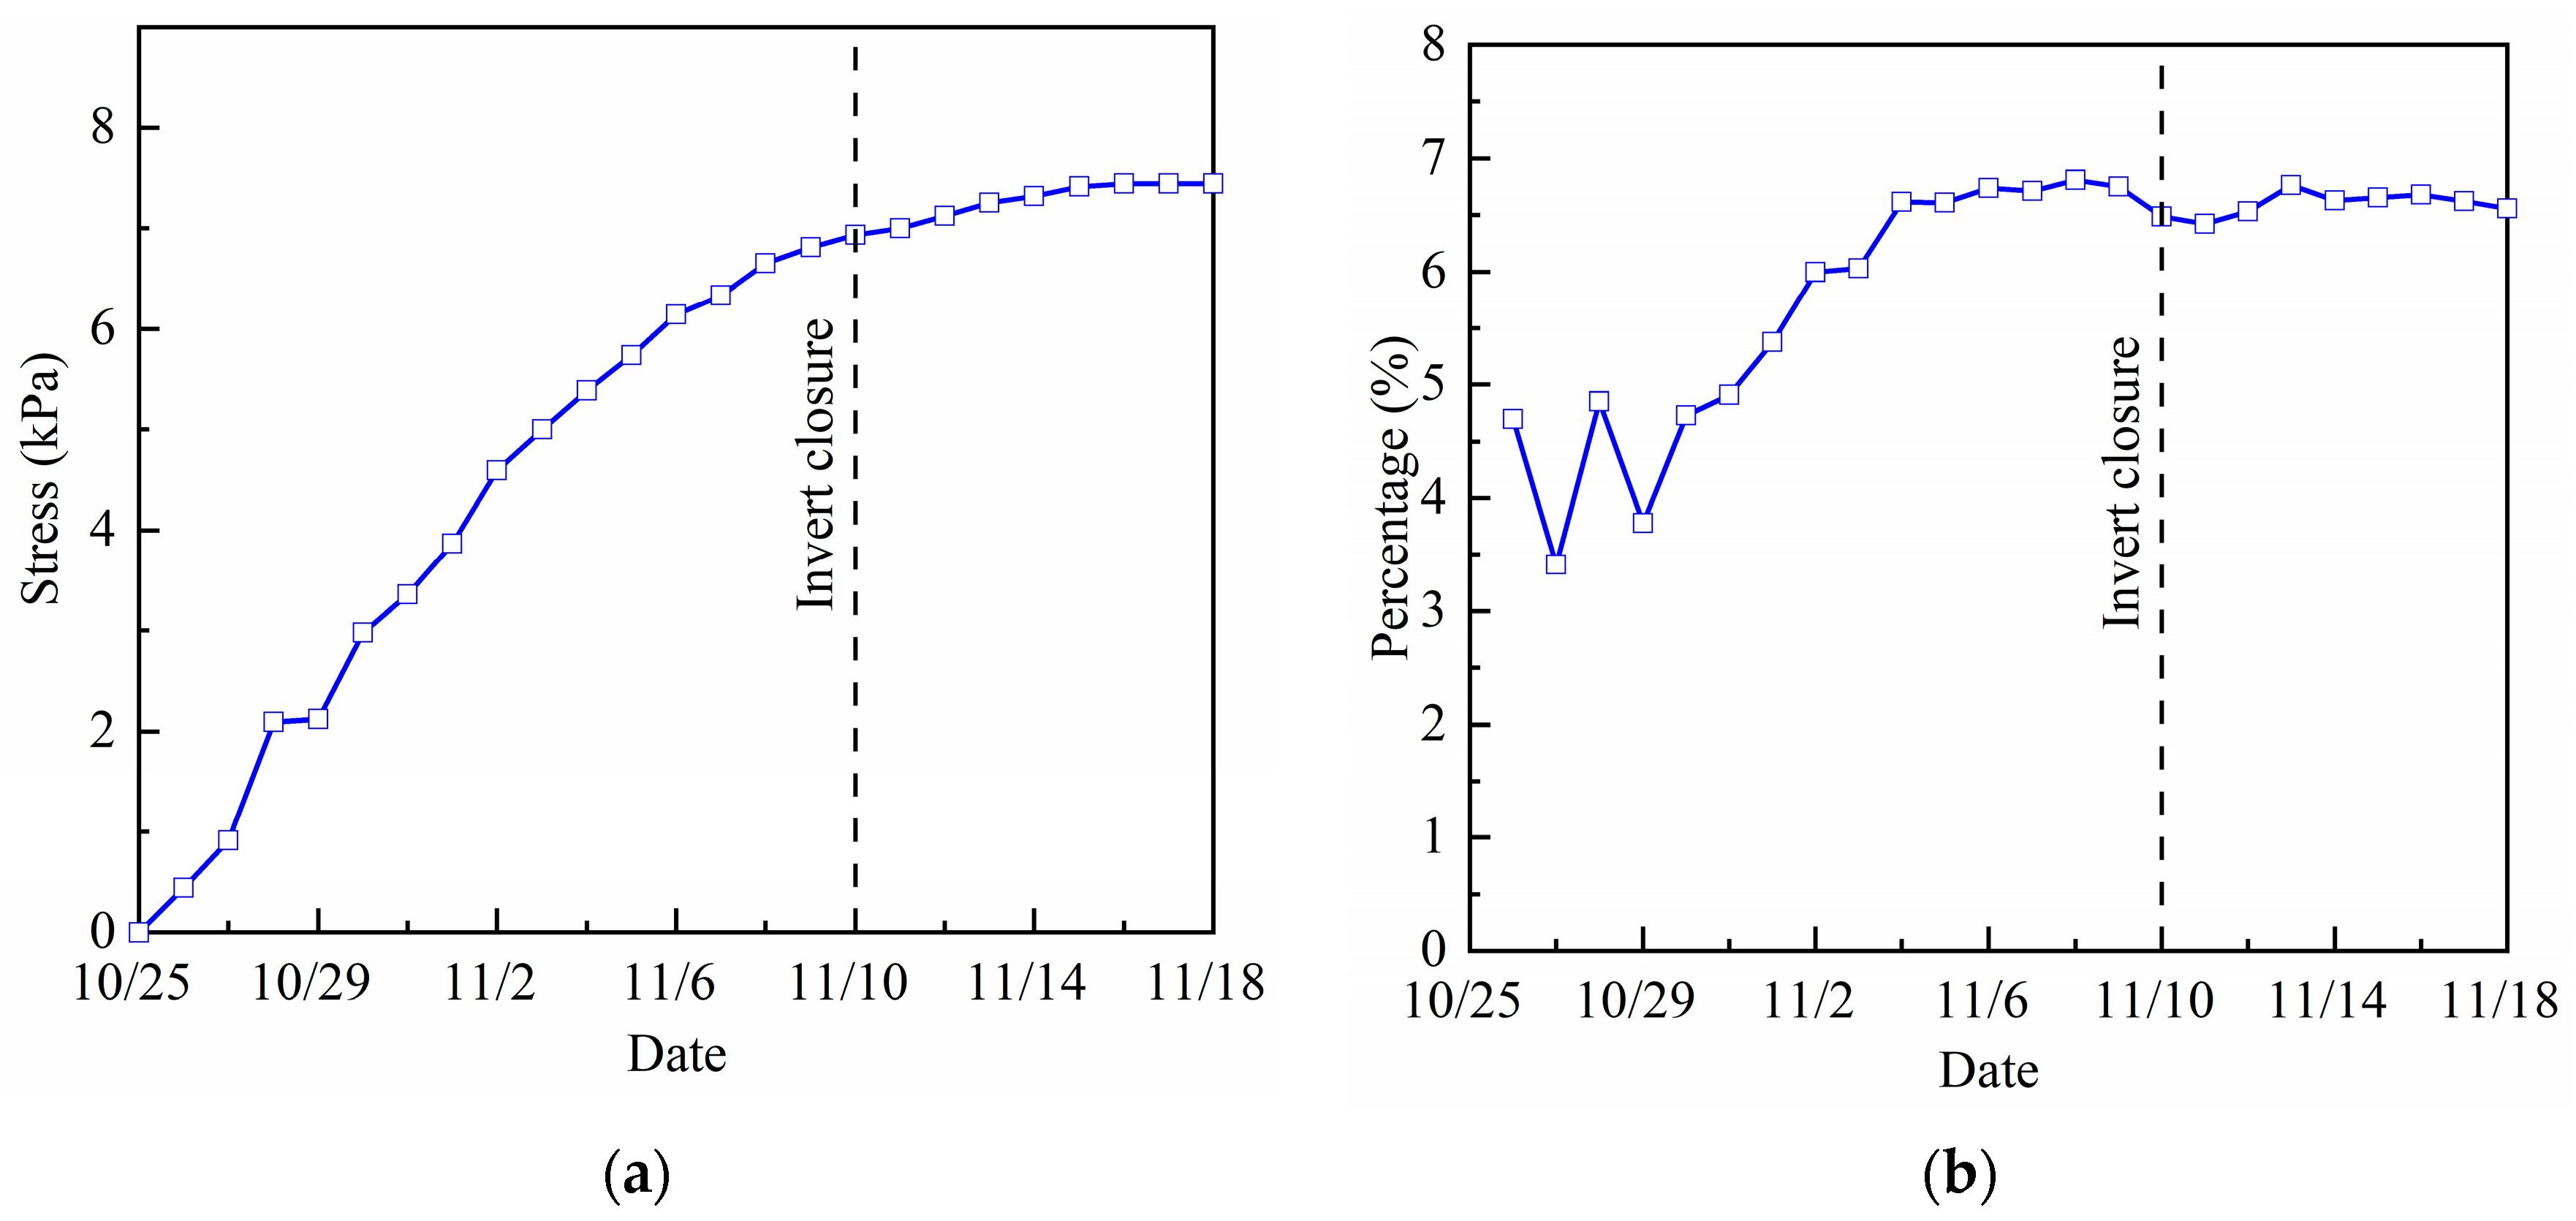
Based on the formulas above, the support force of rock bolts on the surrounding rock can be quantified. The measured value at Point 1 in Section 3.3 is considered the maximum axial force of the rock bolt. Then, the daily equivalent support force after installation is calculated. The results are shown in Figure 12a. Simultaneously, the ratio of the equivalent support force to the total support force is calculated and used to plot the trend of the equivalent support force percentage, as shown in Figure 12b. The total support force refers to the combined support reaction force from the rock bolts and the initial support.
Figure 12.
Time-history curves related to equivalent support force. (a) Equivalent support force. (b) Equivalent support force ratio.
Figure 12 shows the following findings:
(1) The variation trend of the equivalent support force is consistent with that of the maximum axial force. The equivalent support force is the ratio of the maximum rock bolt axial force to the fixed area of the surrounding rock. The maximum rock bolt axial force is the measured value at Point 1. Therefore, the equivalent support force shows the same variation pattern as the measured value at Point 1. Specifically, the equivalent support force continuously increases during construction and tends to stabilize after the invert closure.
(2) The ratio of the equivalent support force to the total support force eventually reaches approximately 6.6%. The maximum equivalent support force is 7.44 kPa. At the same stage, the maximum support force of the initial support reaches 0.106 MPa. Before the invert closure, the ratio of the equivalent support force to the total support force continuously increases. This ratio tends to stabilize after the invert closure.
In summary, in a single-track railway tunnel in gently dipping stratified mudstone, and without considering tectonic stress, the rock bolt equivalent support force is not significant. The initial support bears the majority of the surrounding rock pressure.
4. Theoretical Analysis
4.1. Relationship Between Axial Force of Bolt and Surrounding Rock Displacement
To obtain the axial force distribution of the bolt under the coupled interaction between the bolt and surrounding rock, an analytical expression is derived based on the mechanical characteristics of a fully grouted bolt. Although previous studies have investigated the relationship between bolt axial force and surrounding rock displacement, the bolt displacement was assumed to be equal to that of the surrounding rock, which effectively neglects interfacial mechanics. Consequently, the derived axial force formulations are inaccurate.
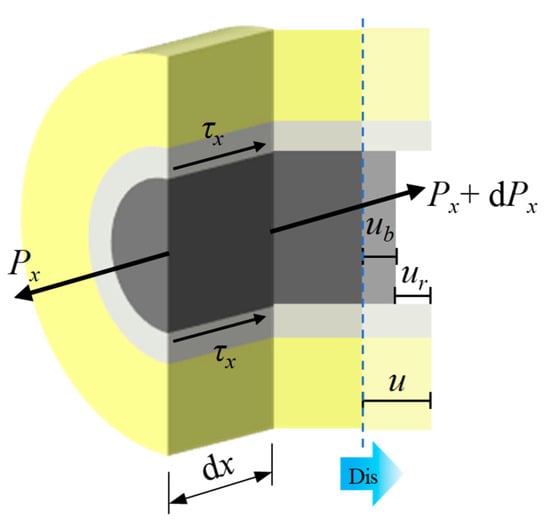
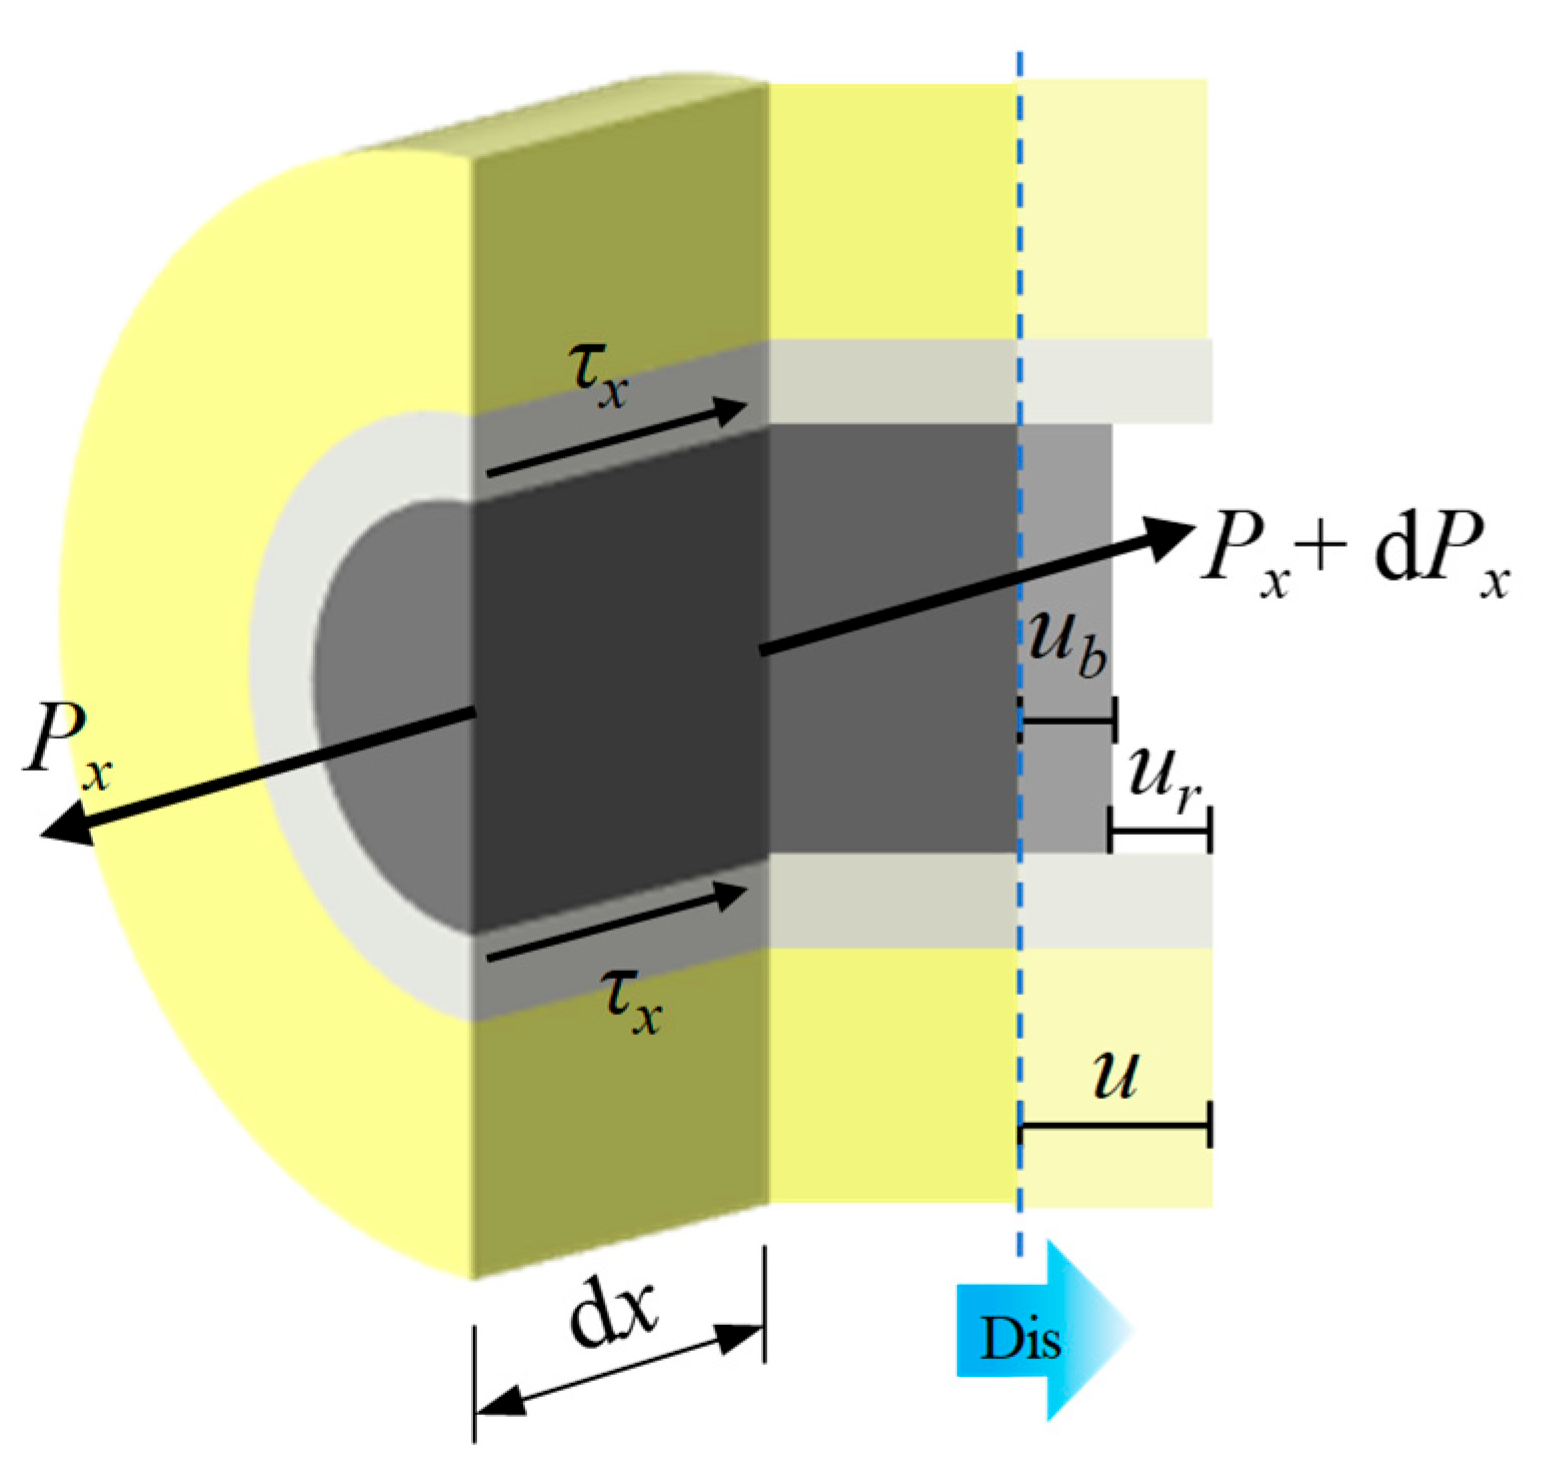
As shown in Figure 13, during the deformation process of the surrounding rock, its displacement is not synchronized with that of the bolt, leading to a relative displacement between them. Assuming that the displacement at the loaded end of the bolt is u0, the displacement of the bolt at an arbitrary depth x, denoted as ub, can be expressed as follows by considering the axial deformation of the bolt:
Figure 13.
Sketch of the equilibrium of rock bolt system.
The axial strain at an arbitrary position along the bolt, ε, can be determined according to the stress–strain relationship of the bolt material:
where P is the axial force of the bolt, Em is the elastic modulus of the bolt, and D is the diameter of the bolt.
The relative displacement between the bolt and the surrounding rock can be calculated as
where u denotes the displacement of the surrounding rock mass.
Based on the interfacial shear transfer mechanism, the shear stress acting on the bolt surface is related to the relative displacement ur between the bolt and the surrounding rock, which can be expressed as
where K is the shear stiffness of the anchorage interface (GPa/m).
Cai, et al. [38] derived a theoretical expression for the shear stiffness K based on the shear-lag theory. When the grout and the surrounding rock have identical material properties, the expression can be obtained as follows:
where G is the shear modulus of the surrounding rock, given by , in which E is the elastic modulus of the surrounding rock and ν is Poisson’s ratio of the surrounding rock; Dm is the diameter of the surrounding rock in the rock bolt-influenced zone.
When the material properties of the grout and surrounding rock differ, the equivalent shear stiffness is given as follows:
where Gg is the shear modulus of the grout, and Dg is the borehole diameter.
As previously assumed, the influence zone of the bolt is a quadrilateral region with an area of S. The equivalent influence diameter of the bolt can then be calculated using the area equivalence method:
As shown in Figure 13, from the force equilibrium equation of the rock bolt infinitesimal element, the following can be derived:
After simplification, Equation (10) can be expressed as
Substituting Equations (5) and (6) into Equation (11), the following can be obtained:
By differentiating both sides of Equation (12) with respect to x, the following can be obtained:
Let , and the above equation can be transformed into
The boundary conditions are
Then, the general solution of this differential equation can be obtained as follows:
From Equation (16), it can be seen that the axial force distribution of the fully bonded rock bolt is governed solely by the displacement of the surrounding rock.
The internal displacement of the surrounding rock satisfies a specific functional relationship with the radial depth of the surrounding rock. According to field test results reported in References [23,39], the internal displacement of the surrounding rock exhibits an exponential relationship with its radial depth. The functional form of the internal displacement of surrounding rock given in Reference [23] is as follows:
4.2. Calculation Procedure
Half of the monitored convergence displacement of the tunnel sidewall is taken as the absolute displacement of the surrounding rock at the loaded end of the bolt. Accordingly, the boundary condition is given as u(0) = 1.75 mm.
Considering that both the deformation of the surrounding rock and the axial force in the bolt are relatively small, the system can be assumed to remain within the elastic regime. Therefore, only the elastic properties of the materials are considered. Under this assumption, the interfacial shear stiffness is taken as 177.182 GPa/m, and the detailed parameters are listed in Table 5.
Table 5.
Mate rial parameters.
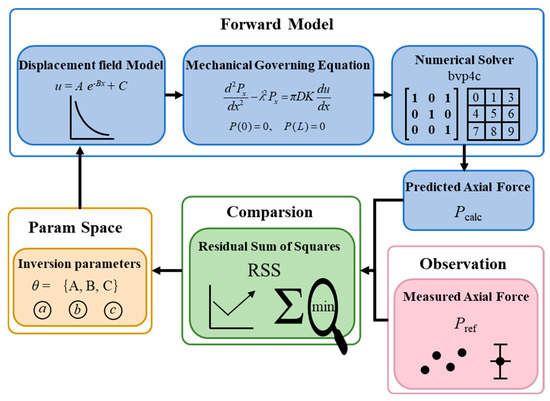
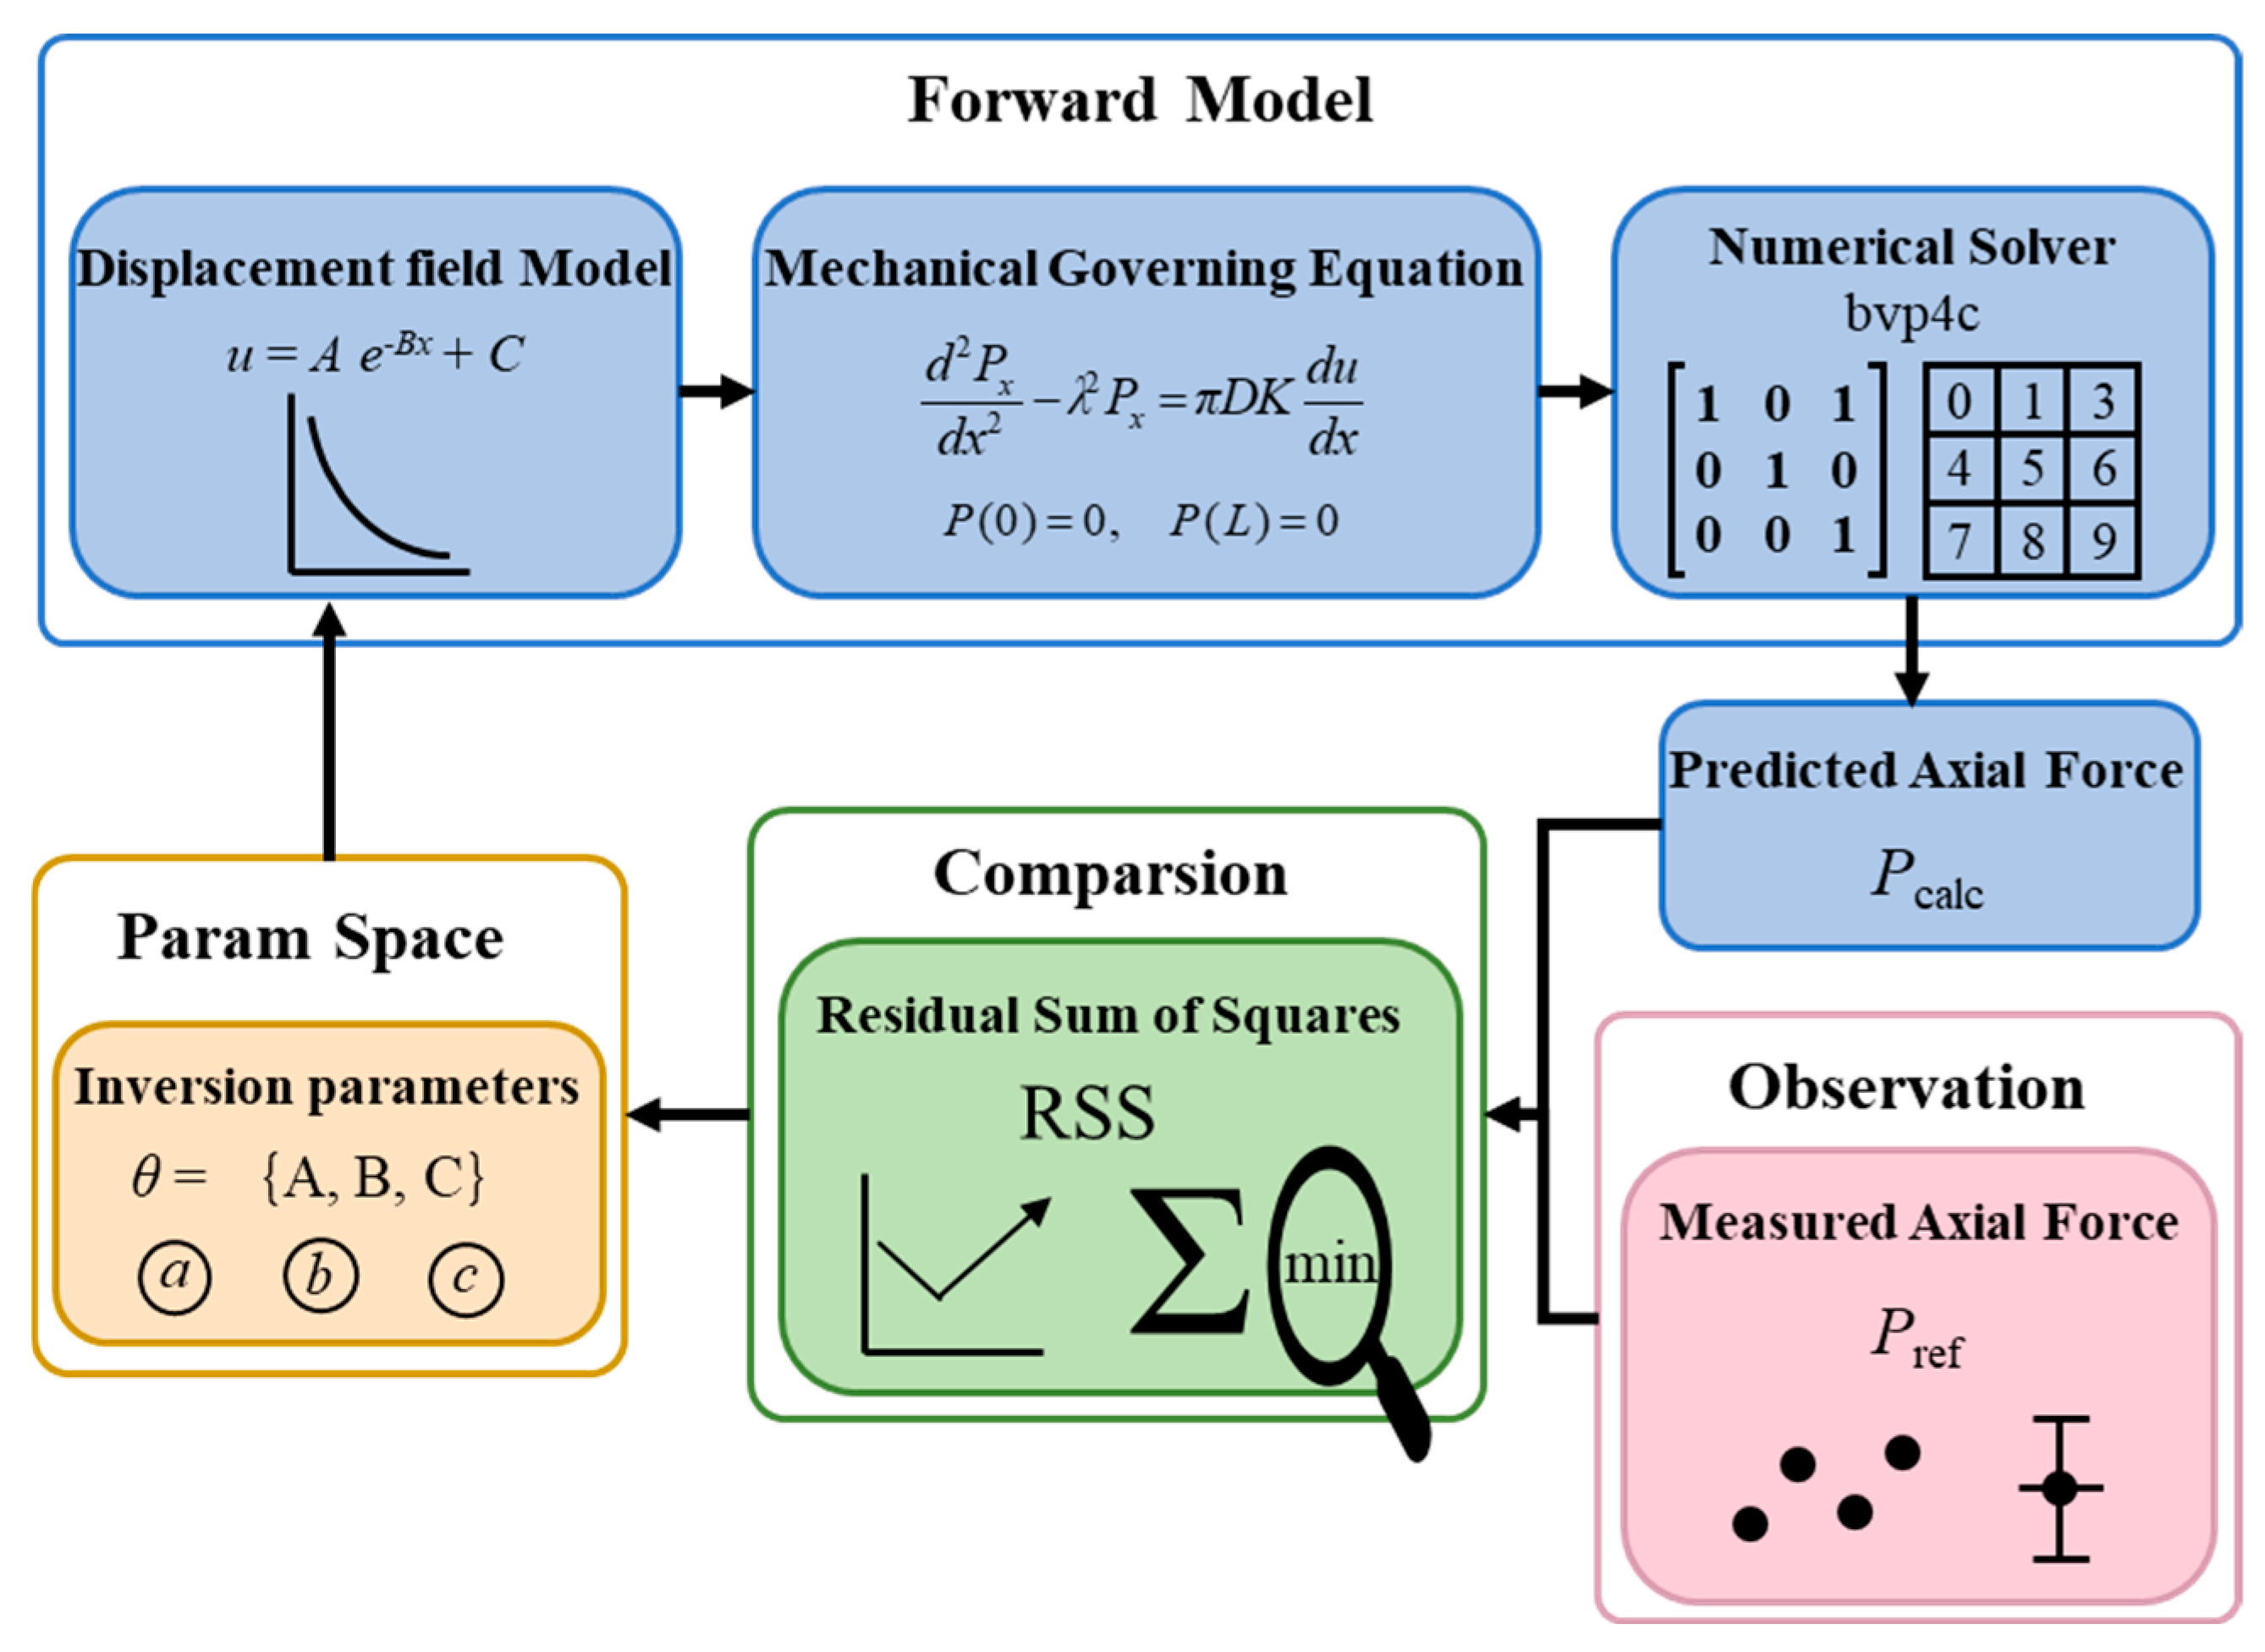
Using the measured axial force at selected points along the bolt and the prescribed boundary displacement u(0), the internal displacement field of the surrounding rock is identified through an inverse analysis incorporating the material properties. This enables the reconstruction of the axial force distribution along the full length of the bolt. The procedure is schematically illustrated in Figure 14.
Figure 14.
Flowchart of the physics-driven inverse parameter identification for rock bolt displacement fields.
As illustrated in Figure 14, a physics-driven inversion framework for the bolt displacement field is established in this study. The core of this framework lies in the deep coupling between the analytical displacement model and the governing mechanical equations. First, a parameter vector θ is defined in the parameter space to construct a displacement model that satisfies Equation (17). The obtained displacement expression is then substituted into the bolt force equilibrium equation to calculate the theoretical axial force, denoted as Pcalc, using a numerical solver. Subsequently, the residual sum of squares (RSS) between the calculated axial force Pcalc and the measured axial force Pref is evaluated. If the RSS does not meet the convergence criterion, the parameter vector θ is iteratively updated using a nonlinear least-squares optimization algorithm (lsqnonlin) based on the magnitude and direction of the residual until convergence is achieved.
This closed-loop inversion scheme not only ensures a high degree of agreement between the predicted results and monitoring data, but also guarantees that the identified displacement function strictly satisfies the mechanical equilibrium conditions of the rock–bolt anchorage system. Finally, the displacement expression is obtained as follows:
4.3. Results Analysis
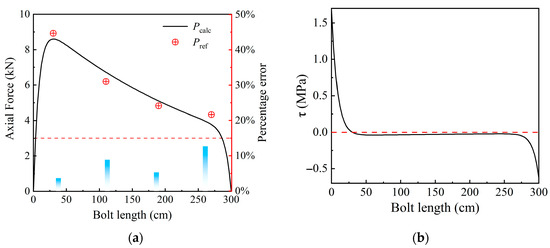
Based on the calculated results, the relationships of axial force and shear stress with bolt length are plotted in Figure 15. A comparison between the calculated and measured axial forces is also presented.
Figure 15.
Calculation results of rock bolt mechanical response. (a) axial force distribution; (b) shear stress distribution.
To evaluate the reliability of the inversion results under limited measurement points, the calculated axial force distribution was compared with the measured values at the four monitoring points. As shown in Figure 15a, the maximum relative error between the calculated curve and the measured values is 12.62%, and the mean absolute percentage error is 7.58%, indicating good agreement. This result benefits from the strong physical constraints of the inversion framework and the independent boundary displacement condition, u(0) = 1.75 mm. The inversion method combining limited measurement points with strong physical constraints proves feasible for parameter identification in geotechnical engineering.
Furthermore, the analysis of Figure 15 reveals the following:
(1) The bolt is entirely in a tensile state along its full length. The axial force exhibits a typical unimodal distribution, characterized by a rapid increase from the loaded end to a peak value, followed by a gradual attenuation. The attenuation process can be divided into two stages: a relatively gentle decrease in the initial segment and a rapid decline in the terminal segment until the axial force approaches zero at the far end.
(2) The axial force of the rock bolt remains low over its entire length. The maximum axial force is 8.6 kN, occurring at a distance of 30.3 cm from the loaded end, which corresponds to approximately 6.8% of the bolt design load. The equivalent support pressure derived from this value is 7.20 kPa, accounting for about 6.5% of the total support capacity.
(3) The interfacial shear stress along the bolt surface exhibits both positive and negative values over the full length. A positive value indicates shear stress directed toward the loaded end, while a negative value indicates the opposite direction. The shear stress is positive within the range of 0–30.3 cm and negative within 30.3–300 cm. The negative shear stress accounts for 89.9% of the total bolt length.
(4) The distribution of interfacial shear stress shows a characteristic pattern of “high at both ends and low in the middle.” The positive shear stress near the loaded end is relatively large and decays rapidly, becoming negative at approximately 30.5 cm. In the middle segment, the negative shear stress gradually decreases and approaches zero, while near the far end it increases rapidly again. Overall, the shear stress is significant at both ends, reaching 1.7 MPa at the loaded end and 0.6 MPa at the far end.
(5) A “neutral point” exists along the bolt. At approximately 30.3 cm, the interfacial shear stress changes from positive to negative, corresponding to the location of the maximum axial force, defined as the neutral point. Before the neutral point, the bolt primarily restrains the deformation of the surrounding rock; beyond the neutral point, it is mainly subjected to the pull-out resistance provided by the surrounding rock. When the neutral point is located close to the loaded end, it indicates that the effective anchorage depth is relatively shallow.
In summary, under conditions of small deformation of the surrounding rock, the overall stress level of the bolt is low, and the axial force exhibits a typical unimodal distribution, with a maximum value of only about 6.5% of the design load, indicating that the load-bearing capacity is not fully mobilized. The equivalent support pressure of the bolt accounts for approximately 6.5% of the total support capacity. The interfacial shear stress distribution follows a “high at both ends and low in the middle” pattern. The neutral point is located near the loaded end, and the negative shear stress dominates most of the bolt length. This indicates that the majority of the bolt lies within the anchorage zone; however, within this zone, large portions experience very low shear stress and thus contribute limited anchorage effect, while only a small segment effectively restrains the deformation of the surrounding rock. In stratified rock tunnels, the sidewall is not the primary zone for layer separation and block detachment; consequently, the bolts installed in this region provide limited support reaction and exhibit a relatively weak capacity to prevent rockfall.
4.4. Optimization of Bolt Length
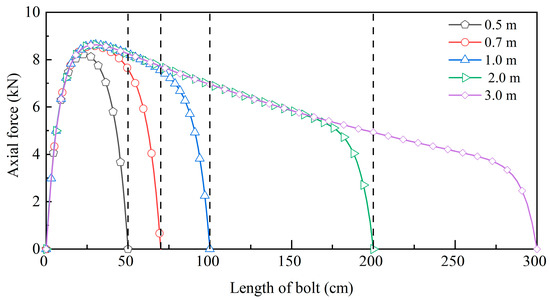
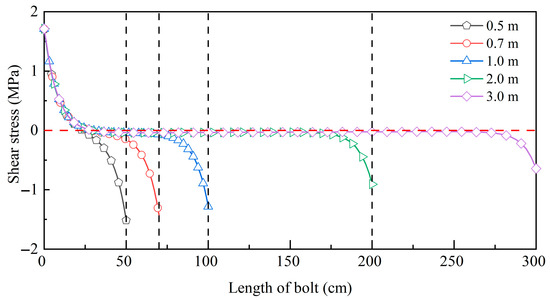
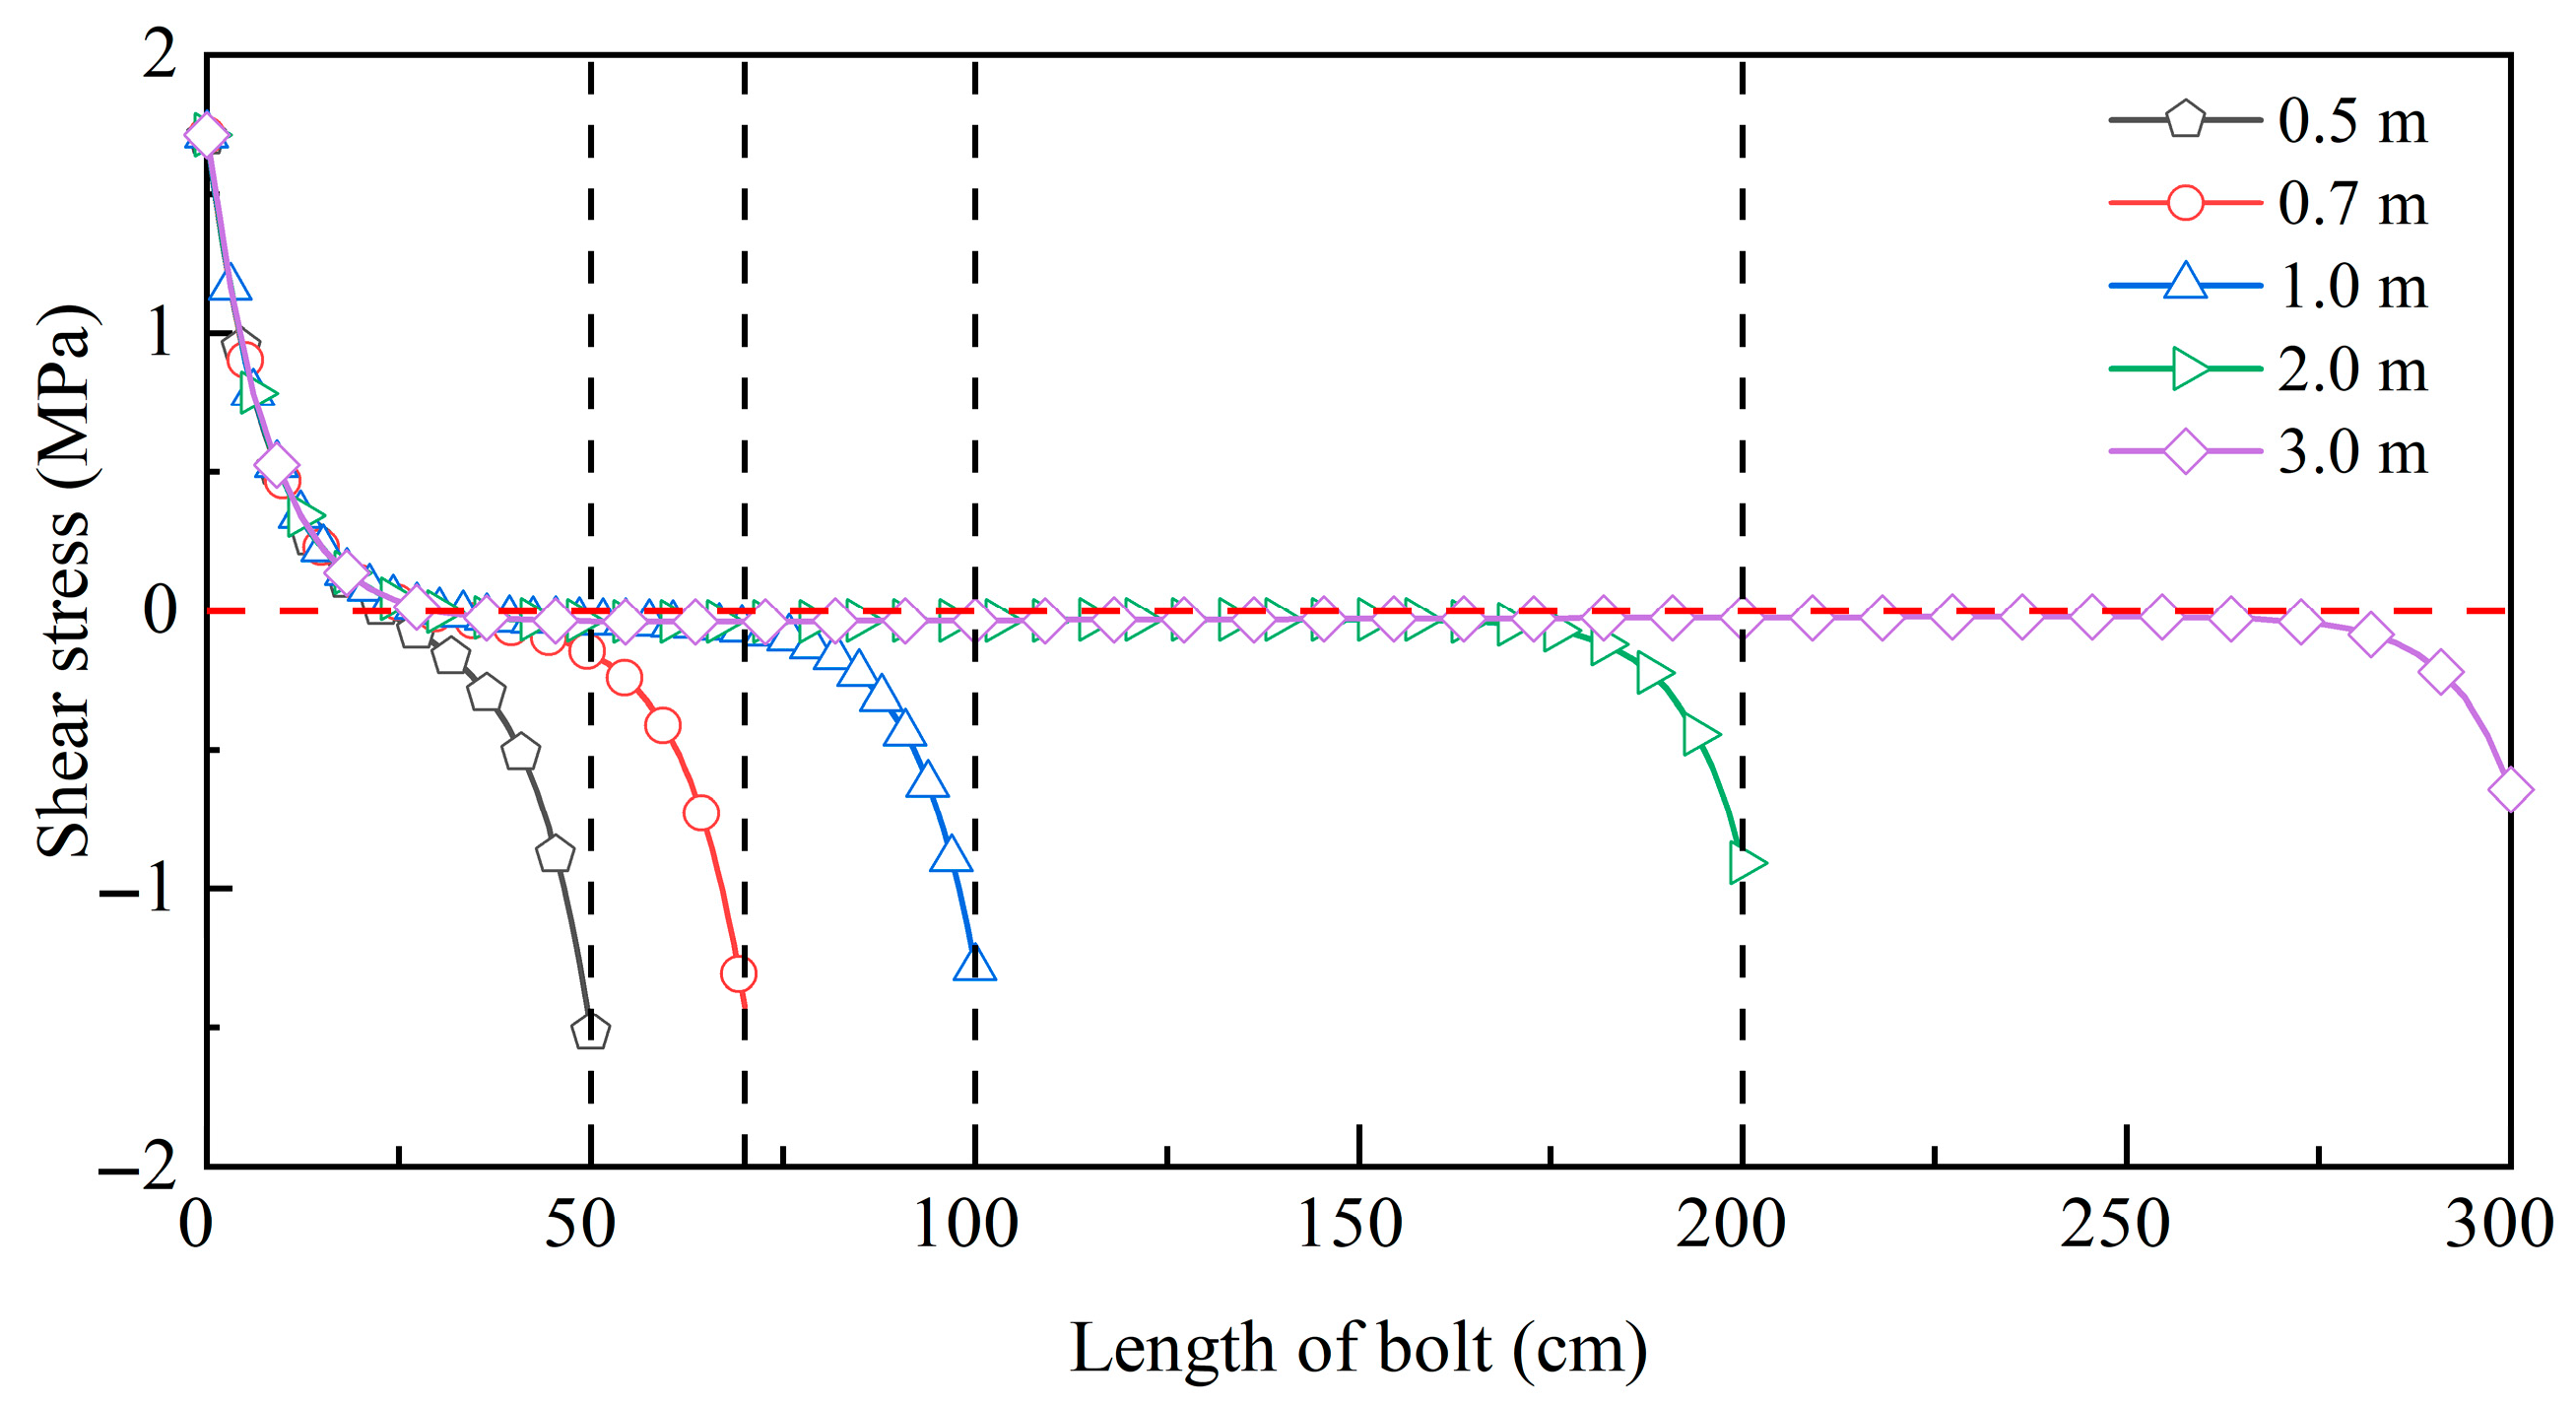
As indicated by the preceding analysis, the axial force of the originally designed bolts is relatively low, resulting in a significant underutilization of material performance. In this section, five working conditions with bolt lengths of 3.0 m, 2.0 m, 1.0 m, 0.7 m, and 0.5 m are designed to evaluate the support performance of bolts with different lengths. The distributions of axial force and interfacial shear stress for each condition are shown in Figure 16 and Figure 17.
Figure 16.
Axial force distribution of rock bolts with different lengths.
Figure 17.
Shear stress distribution of rock bolts with different lengths.
As can be observed from Figure 16, with decreasing bolt length, the maximum axial force does not exhibit significant variation. When the bolt length is reduced to 0.5 m, a slight decrease in the peak axial force is observed. For all bolt lengths, the distribution and variation trends of axial force in the region near the loaded end remain consistent, and the peak axial force occurs within 30.3 cm from the loaded end.
As illustrated in Figure 17, the reduction in bolt length leads to notable changes in the shear stress distribution along the bolt. Beyond the neutral point, the maximum shear stress increases significantly as the bolt length decreases. Meanwhile, the proportion of the inefficient anchorage zone gradually decreases, allowing for the anchorage performance along the entire bolt length to be more effectively mobilized.
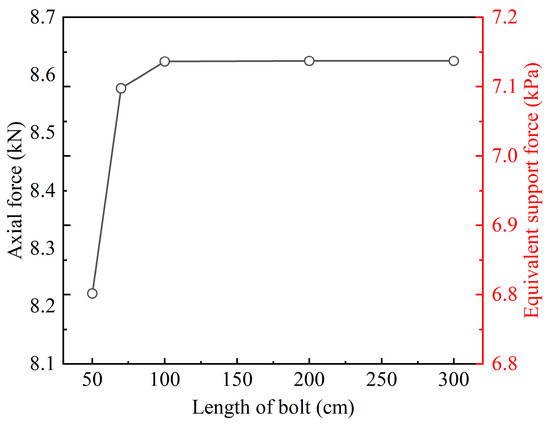
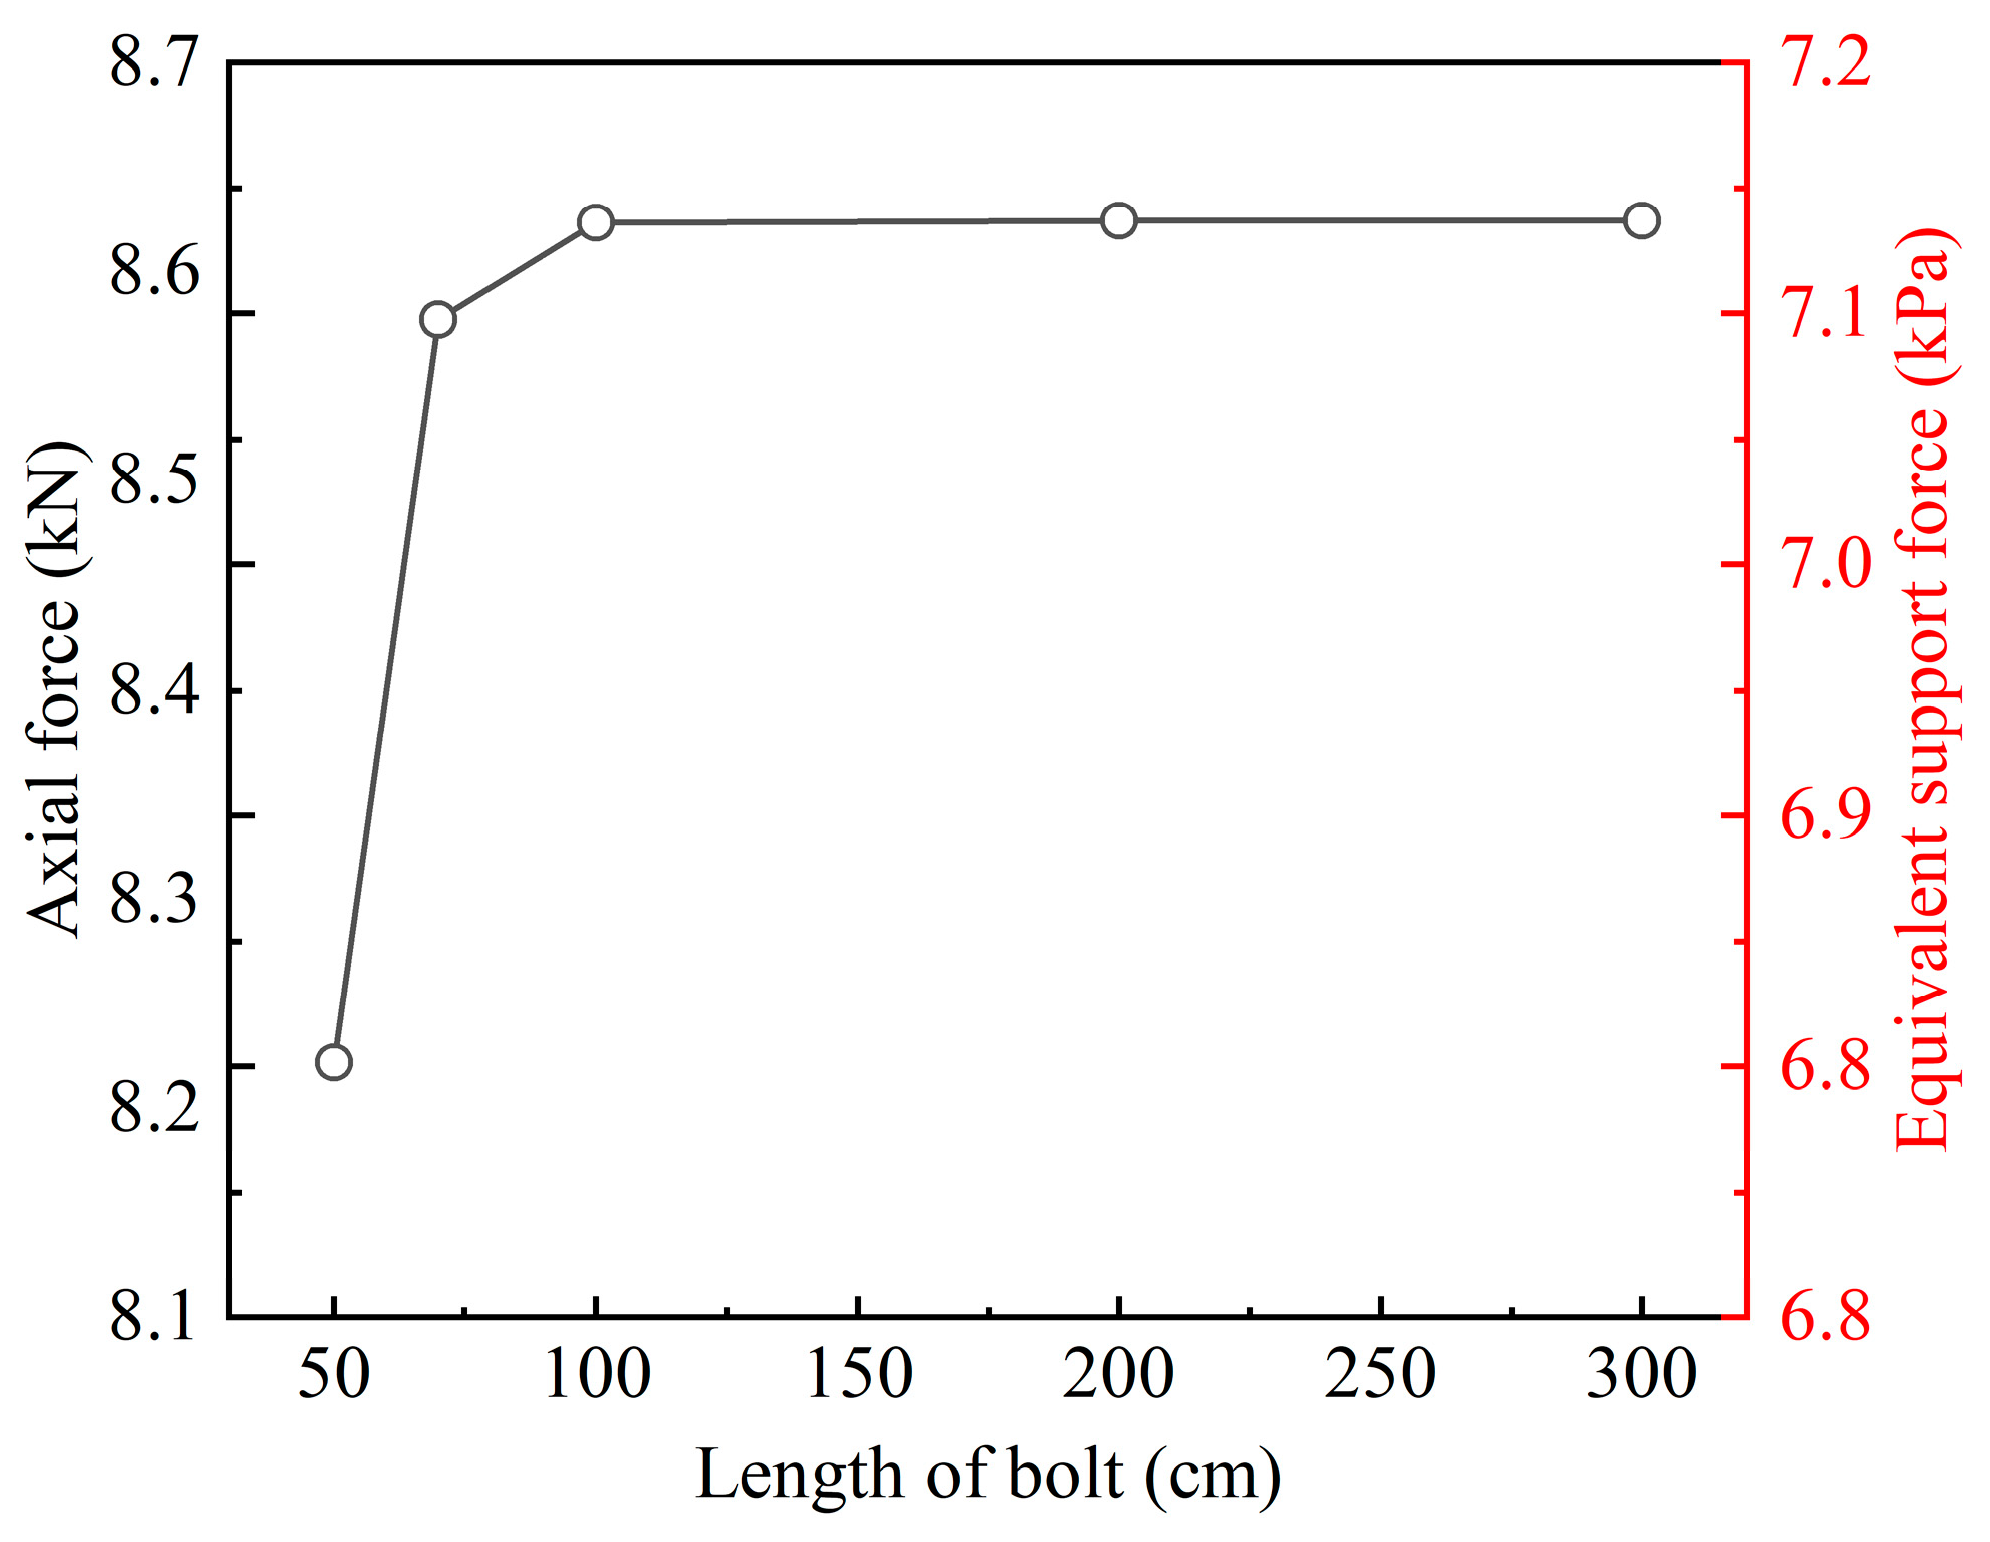
The relationships between the maximum axial force, equivalent support pressure, and bolt length are plotted, as shown in Figure 18.
Figure 18.
Curves of maximum axial force and equivalent support force for rock bolts of different lengths.
As can be seen from Figure 18:
(1) When the bolt length ranges from 1 m to 3 m, both the maximum axial force and the equivalent support pressure remain nearly unchanged. Therefore, from the perspective of equivalent support capacity, the bolt length in the tunnel can be optimized to 1 m while achieving a support effect comparable to that of a 3 m bolt.
(2) When the bolt length is less than 1 m, both the maximum axial force and the equivalent support pressure begin to decrease. At a length of 1 m, a slight reduction is observed; at 0.7 m, a noticeable decrease occurs; and at 0.5 m, the decreasing trend becomes more pronounced.
Based on the above analysis, a bolt length of 1 m in the test section sidewall is sufficient to achieve an anchorage effect comparable to that of the originally designed bolts. However, in practical engineering, the bolt length should not be excessively short, as insufficient length may prevent effective anchorage into stable rock strata. According to relevant specifications, the bolt length should not be less than 1.5 m, and in particular, it should not be less than 2 m in Grade V surrounding rock conditions.
5. Discussion
5.1. Support Effectiveness and Optimization Analysis of Grouted Sidewall Rock Bolts in Layered Mudstone Tunnels
The results of this study indicate that the contribution of sidewall rock bolts to the overall support system is limited, accounting for only approximately 6.6% of the total support capacity. This limited effectiveness is fundamentally associated with the deformation characteristics of the surrounding rock, which are governed by the geological and environmental conditions.
Under the investigated dry conditions, mudstone maintains relatively high strength and structural integrity, resulting in strong self-supporting capacity. Consequently, the surrounding rock undergoes only minor deformation after excavation. Such limited deformation results in insufficient relative displacement between the rock mass and the bolt, which in turn restricts shear transfer along the interface and prevents full mobilization of bolt axial force [24]. As a result, the stress level along the bolt remains low, and a large portion of the bolt length is characterized by ineffective anchorage. The neutral point is located close to the tunnel free face, indicating that the effective anchorage depth is relatively shallow, with most of the bolt length subjected to minimal shear stress [40,41]. This explains the low utilization efficiency of the rock bolt system.
These results highlight that the role of rock bolts is strongly governed by deformation level and geological conditions. Previous studies have shown that rock bolts can significantly enhance stability in tunnels experiencing large deformation or in fractured rock masses, where sufficient relative displacement enables effective load transfer [38]. In contrast, the present case involves a layered mudstone formation under dry conditions, where deformation is inherently limited. Under such circumstances, the mechanical demand for bolt participation is reduced, and the initial support system, particularly the steel ribs and shotcrete lining, provides sufficient confinement. This observation is consistent with previous studies on layered or weakly deformed rock masses, where the contribution of rock bolts is often secondary [42,43,44,45,46]. The present study further highlights that this reduced contribution is not merely a structural feature, but is closely linked to the deformation-controlled activation mechanism of rock bolts.
From an engineering perspective, these results suggest that the effectiveness of rock bolts should be evaluated in relation to the deformation characteristics of the surrounding rock rather than being assumed a priori. For tunnels excavated in gently dipping layered mudstone under dry conditions, the relatively high strength and integrity of the rock mass led to limited deformation, which in turn constrains the mobilization of bolt axial force. Under such conditions, the contribution of grouted sidewall rock bolts is relatively limited, and there is potential for optimizing bolt length.
However, caution should be exercised when extending these conclusions to water-bearing environments. Mudstone is highly sensitive to water, and its mechanical properties may deteriorate significantly upon water exposure [47,48,49]. Under such conditions, two competing mechanisms may arise. On the one hand, the degradation of the grout–rock interface may reduce the shear transfer capacity, thereby weakening the load transfer efficiency of rock bolts. On the other hand, the reduction in rock mass strength may lead to increased deformation of the surrounding rock, which could enhance the mobilization of bolt axial force. Therefore, the overall effectiveness of rock bolts under water-bearing conditions depends on the combined influence of these competing mechanisms. The conclusions obtained in this study are most applicable to dry or weakly water-affected conditions, and further investigation is required to quantitatively evaluate bolt performance under saturated or deteriorated conditions.
5.2. Limitations and Future Work
This study is a single-section field case study with constraints imposed by site construction and monitoring resources. Only one test section, one instrumented rock bolt, and one earth pressure cell were installed; the spatial representativeness of the monitoring data could be improved by multi-section testing. No control section without rock bolts or comparative tests with different bolt configurations were conducted, making it difficult to quantitatively analyze the differences in support schemes. Numerical simulation calibrated with field data was not performed. The internal displacement of the surrounding rock was assumed to follow an exponential function and indirectly verified through bolt axial force measurements, without in situ measurement. Therefore, the conclusions of this study are mainly applicable to gently dipping, intact, layered mudstone tunnels without groundwater that are similar to the test section. The generalizability of the findings needs to be further improved through multi-condition and multi-scale studies.
6. Conclusions
A field-based investigation combined with theoretical analysis was conducted to evaluate the performance of grouted sidewall rock bolts in a single-track railway tunnel excavated in layered mudstone. The main conclusions are summarized as follows:
(1) The deformation of the surrounding rock is minimal under the observed dry conditions, indicating a strong self-supporting capacity. The measured deformation is significantly lower than the design allowance. However, considering the pronounced water sensitivity of mudstone, its mechanical properties may deteriorate substantially upon water exposure. In such cases, increased deformation and a reduced self-supporting capacity of the surrounding rock can be expected, which may consequently alter the relative contribution of the support system.
(2) The initial support system serves as the primary load-bearing structure, contributing over 93% of the total support capacity, whereas the contribution of rock bolts is limited to approximately 6.6%.
(3) The axial force in the rock bolts remains at a low level throughout the construction process, indicating that under small deformation conditions the support demand on the bolts is low and their material capacity is underutilized.
(4) The effective anchorage zone of the rock bolts is limited, with a large proportion of the bolt length contributing minimally to shear transfer. The neutral point lies extremely close to the tunnel free face, indicating an extremely shallow effective anchorage depth.
(5) Increasing the bolt length beyond 1 m does not significantly enhance the support effect. Shorter bolts can achieve comparable performance while improving the utilization efficiency of the anchorage system.
In summary, there is potential for optimizing the length of fully grouted sidewall rock bolts in heterogeneous, gently dipping layered mudstone tunnels to improve both the technical and economic performance of the support scheme.
Author Contributions
Conceptualization, H.L. and J.C.; methodology, H.L. and Y.L.; validation, J.L., B.G. and Y.Y.; formal analysis, H.L.; investigation, H.L.; resources, Y.L. and B.L.; data curation, J.L. and B.G.; writing—original draft preparation, H.L.; writing—review and editing, J.C. and C.W.; visualization, H.L.; supervision, J.C. and C.W.; funding acquisition, C.W., Y.L. and B.L. All authors have read and agreed to the published version of the manuscript.
Funding
This research was funded by the Fundamental and Interdisciplinary Disciplines Breakthrough Plan of the Ministry of Education of China (No. JYB2025XDXM104), the National Natural Science Foundation of China (No. 52178380), the National Natural Science Foundation of China (No. 52278394), the Shaanxi Provincial Innovation Capacity Support Program (No. 2024ZC-KJXX-030), the Fundamental Research Funds for the Central Universities (Natural Science) (No. 300102213301), and the Sichuan Longxuyi Railway Co., Ltd.
Data Availability Statement
Data are contained within the article.
Conflicts of Interest
Author Bin Liu was employed by Sichuan Longxuyi Railway Co., Ltd. The remaining authors declare that the research was conducted in the absence of any commercial or financial relationships that could be construed as potential conflicts of interest.
References
- Zhang, Y.W.; Sun, J.C.; Song, Z.P.; Cao, Z.L.; Shi, W. Study on mechanical properties of constant-resistance and energy-absorbing bolts for large tunnel deformations. Tunn. Undergr. Space Technol. 2026, 167, 107036. [Google Scholar] [CrossRef] [Scilit]
- Fan, D.Y.; Liu, X.S.; Tan, Y.L.; Li, X.B.; Yang, S.L. Energy mechanism of bolt supporting effect to fissured rock under static and dynamic loads in deep coal mines. Int. J. Min. Sci. Technol. 2024, 34, 371–384. [Google Scholar] [CrossRef] [Scilit]
- Chen, G.D.; Li, Z.W.; Gong, W.P.; Li, T.Z. Probabilistic stability analysis of bolt-reinforced rock slopes considering corrosion based on sparse polynomial chaos expansions. Comput. Geotech. 2025, 188, 107568. [Google Scholar] [CrossRef] [Scilit]
- Yang, X.J.; Ming, W.; Zhang, W.R.; Zhu, C.; Mao, Y.D.; Wang, X.; He, M.C.; Tao, Z.G. Support on Deformation Failure of Layered Soft Rock Tunnel Under Asymmetric Stress. Rock Mech. Rock Eng. 2022, 55, 7587–7609. [Google Scholar] [CrossRef] [Scilit]
- Chen, J.; Qiao, X.; Wang, M. Stress and Action Mechanism of Rock Bolt in Loess Tunnel. Chin. J. Rock Mech. Eng. 2011, 30, 1690–1697. [Google Scholar]
- Chen, J.X.; Luo, Y.B.; Chen, L.J. Rewriting the history of loess tunnel construction. China Highw. 2019, 11, 30–35. [Google Scholar] [CrossRef]
- Feng, W.; Shi, Y.; Wang, X.; He, C. Support Optimum on Horizontal Bedded Surrounding Rock of Expressway Tunnel. China J. Highw. Transp. 2009, 22, 65–70. [Google Scholar] [CrossRef]
- Sun, D.X.; Wang, H.L.; Komine, H.; Cai, G.J.; Pan, G.F.; Ito, D. Slaking mechanisms of a mudstone and prediction of its number-size distribution considering shape evolution. Soils Found. 2025, 65, 101682. [Google Scholar] [CrossRef] [Scilit]
- Chen, J.X.; Luo, H.; Luo, Y.B.; Chen, H.; Chi, D.C.; Wang, C.W. Mechanism and prevention of “Closed Door” collapse in tunnel construction: A case study. Eng. Fail. Anal. 2024, 161, 108263. [Google Scholar] [CrossRef] [Scilit]
- Sun, X.; Li, X.; Wang, W. Experimental Study of Support Effect of System Bolts of a Deeply Buried Large-Span Tunnel in Moderately-Weathered Mudstone. Tunn. Constr. 2023, 43, 151–161. [Google Scholar]
- Wang, Y.; Li, X. Numerical Analysis on Applicability of Systematic Rockbolts in Mudstone Tunnel Considering Time-space Effect. J. Highw. Transp. Res. Dev. 2022, 39, 108–116. [Google Scholar]
- Zhang, Q.-S.; Guan, L.-Y.; Li, H.-Y.; Lei, Z.-C.; Lang, Q.-X. Stability Analysis and Optimization of Primary Support on Tunnel Excavation with Soft-hard Interbed Rock. Sci. Technol. Eng. 2020, 20, 9561–9566. [Google Scholar]
- Wu, Y.; Guo, G.; Wang, Z. The control principle and technology of “one obstruct and three strengthen” of soft rock roadways below weak aquifers. Coal Sci. Technol. 2023, 51, 72–82. [Google Scholar] [CrossRef]
- Liu, Y.; Tan, Z. Study on Effect of Systematic Anchor Bolts in Construction of Shallow-covered Large-span Small-spacing Loess Tunnels: Case Study on Taohuayu Tunnel. Tunn. Constr. 2015, 35, 514–520. [Google Scholar] [CrossRef]
- Liu, W.J.; Gao, F.Q.; Dong, S.Y.; Yuan, G.Y. A Novel Method for Estimating Axial Force of Rock Bolt Through 3D Laser Scanning and Deep Learning. Rock Mech. Rock Eng. 2024, 57, 1437–1450. [Google Scholar] [CrossRef] [Scilit]
- Chen, Y.L.; Li, Z.; Cui, T.Y. Field Investigation of the Reinforcement and Support Mechanism for a Tunnel in Layered Soft Rock Mass. KSCE J. Civ. Eng. 2023, 27, 4534–4543. [Google Scholar] [CrossRef] [Scilit]
- Fahimifar, A.; Soroush, H. A theoretical approach for analysis of the interaction between grouted rockbolts and rock masses. Tunn. Undergr. Space Technol. 2005, 20, 333–343. [Google Scholar] [CrossRef] [Scilit]
- Bobet, A. Elastic solution for deep tunnels. Application to excavation damage zone and rockbolt support. Rock Mech. Rock Eng. 2009, 42, 147–174. [Google Scholar] [CrossRef] [Scilit]
- Wang, J.C.; Zhang, D.L.; Sun, Z.Y.; Lu, S.; Zhu, J.L. Viscos-elastic-plastic analysis of the interaction between the rockbolt-cable combined support and rock mass considering tunnel face effect. Tunn. Undergr. Space Technol. 2025, 163, 106679. [Google Scholar] [CrossRef] [Scilit]
- Bobet, A.; Einstein, H. Tunnel reinforcement with rockbolts. Tunn. Undergr. Space Technol. 2011, 26, 100–123. [Google Scholar] [CrossRef] [Scilit]
- Sun, Z.Y.; Zhang, D.L.; Fang, Q.; Liu, D.P.; Dui, G.S. Displacement process analysis of deep tunnels with grouted rockbolts considering bolt installation time and bolt length. Comput. Geotech. 2021, 140, 104437. [Google Scholar] [CrossRef] [Scilit]
- Zou, J.F.; Chen, K.F.; Pan, Q.J. An improved numerical approach in surrounding rock incorporating rockbolt effectiveness and seepage force. Acta Geotech. 2018, 13, 707–727. [Google Scholar] [CrossRef] [Scilit]
- Luo, Y.; Shi, Z.; Wang, C.; Chen, J.; Liu, W.; Li, Y.; Wu, Y. Mechanical properties of rock bolt and analysis for the full-process of sliding failure based on rock mass absolute displacement. J. Traffic Transp. Eng. Engl. Ed. 2022, 9, 490–506. [Google Scholar] [CrossRef] [Scilit]
- Cai, Y.; Esaki, T.; Jiang, Y. A rock bolt and rock mass interaction model. Int. J. Rock Mech. Min. Sci. 2004, 41, 1055–1067. [Google Scholar] [CrossRef] [Scilit]
- Deng, J.; Zhao, Y.; Wang, D.; Liu, S.; Li, H. Study on the safe distance of spatial intersecting tunnel cavern under ground shock. Tunn. Undergr. Space Technol. 2024, 152, 105941. [Google Scholar] [CrossRef] [Scilit]
- Zhao, J.P.; Tan, Z.S.; Liu, X.L.; Zhang, B.J. Investigation of active and passive radial deformation control techniques for deeply buried soft rock tunnels: A case study of the Haba Snow Mountain Tunnel on the Yunnan-Tibet Railway. Tunn. Undergr. Space Technol. 2025, 165, 106903. [Google Scholar] [CrossRef] [Scilit]
- Jiang, B.; Wu, K.B.; Wang, Q.; Wang, Y.C.; Li, D.H.; Deng, Y.S. High prestressed anchorage support for tunnel surrounding rock model test method and its control effect. Tunn. Undergr. Space Technol. 2025, 157, 106332. [Google Scholar] [CrossRef] [Scilit]
- Tao, Z.G.; Lei, X.T.; Liu, K.Y.; Zhang, R.X.; Fan, X.W.; Cai, M.J. A model test investigation on prestressed anchor cable support for the Haidong fault tunnel. Tunn. Undergr. Space Technol. 2025, 158, 106396. [Google Scholar] [CrossRef] [Scilit]
- Zhang, Q.-Y.; Ren, M.-Y.; Duan, K.; Wang, W.-S.; Gao, Q.; Lin, H.-X.; Xiang, W.; Jiao, Y.-Y. Geo-mechanical model test on the collaborative bearing effect of rock-support system for deep tunnel in complicated rock strata. Tunn. Undergr. Space Technol. 2019, 91, 103001. [Google Scholar] [CrossRef] [Scilit]
- Yu, W.; Wang, B.; Liu, J.W.; Chen, L.; Zi, X. Mechanical properties of partially bonded rock anchors in squeezing large-deformation soft rock tunnels. Tunn. Undergr. Space Technol. 2024, 147, 105699. [Google Scholar] [CrossRef] [Scilit]
- Luo, X.X.; Wang, B.; Zeng, Z.X.; Dong, J.; Yu, W. Mechanisms and diffusion characteristics of prestress fields in deformation-prone tunnels under active support. Eng. Res. Express 2025, 7, 035139. [Google Scholar] [CrossRef] [Scilit]
- Li, X.; Xia, B.; Li, D.; Han, C. Deformation characteristics analysis of layered rockmass in deep buried tunnel. Rock Soil Mech. 2010, 31, 1163–1167. [Google Scholar] [CrossRef]
- Li, P.-T.; Liu, Q.-S.; Zhu, Y.-G.; Gao, F.; Fan, L.-D. Combined support method for large deformation of deep coal mine tunnel. Rock Soil Mech. 2025, 46, 591–612. [Google Scholar] [CrossRef]
- Mai, T.Z.; Zhang, Y. Study on Mechanical Properties of Anchored Rock Mass. Eng. Mech. 1987, 1, 106–116. [Google Scholar]
- Yao, X.-C.; Li, N.; Chen, Y.-S. The Oretical Solution for Shear Stresseson Interface of Fully Grouted Bolt in Tunnels. Chin. J. Rock Mech. Eng. 2005, 13, 2272–2276. [Google Scholar]
- Alejano, L.; Alonso, E.; Rodriguez-Dono, A.; Fernandez-Manin, G. Application of the convergence-confinement method to tunnels in rock masses exhibiting Hoek–Brown strain-softening behaviour. Int. J. Rock Mech. Min. Sci. 2010, 47, 150–160. [Google Scholar]
- Brown, E.; Hoek, E. Underground Excavations in Rock; CRC Press: London, UK, 1980. [Google Scholar]
- Cai, Y.; Esaki, T.; Jiang, Y. An analytical model to predict axial load in grouted rock bolt for soft rock tunnelling. Tunn. Undergr. Space Technol. 2004, 19, 607–618. [Google Scholar] [CrossRef] [Scilit]
- Wang, J.; Jin, X.; Zeng, J.; Gao, Y. Interior Displacement Character of Surrounding Rock in Coal Seam Section of Deep Tunnel. Chin. J. Undergr. Space Eng. 2005, 1, 685–688. [Google Scholar]
- Jiang, H.B.; Li, S.X.; Li, Q.L.; Xu, J.C. Mechanical Behavior of Fully Grouted Rock Bolts in Hydraulic Tunnels Subjected to Elevated Ground Temperatures. Buildings 2023, 13, 1280. [Google Scholar] [CrossRef] [Scilit]
- Jiang, H.B.; Huang, Y.H.; Shi, K.B.; Xiang, P.F.; Wei, G. Analysis of Malignant Expansion of Plastic Zone of Surrounding Rocks in High Ground Temperature Hydraulic Tunnels and the Mechanical Characteristics of the Support Structure. Symmetry 2022, 14, 2606. [Google Scholar] [CrossRef] [Scilit]
- Boon, C.W. Study of reinforcement support mechanisms for wide-span horse-shoe-shaped openings in horizontally layered jointed rock using the distinct element method. Rock Mech. Rock Eng. 2019, 52, 1179–1191. [Google Scholar] [CrossRef] [Scilit]
- Yuan, C.; Fan, L.; Cui, J.F.; Wang, W.J. Numerical Simulation of the Supporting Effect of Anchor Rods on Layered and Nonlayered Roof Rocks. Adv. Civ. Eng. 2020, 2020, 4841658. [Google Scholar] [CrossRef] [Scilit]
- Liu, H.J.; He, C.; Wang, B.; Xu, G.W.; Lin, Y.; Ma, G.Y.; Chen, X. A study on the failure mechanisms of layered soft rock tunnels considering the random distribution of rock mass mechanical parameters and the characteristics of anchor bolt failure. Eng. Fail. Anal. 2025, 169, 109189. [Google Scholar] [CrossRef] [Scilit]
- Liu, X.F.; Pan, P.Z.; Chen, S.; Zhou, Y.Y.; Wang, Z.F. The Anchoring effect for two types of vertically foliated slate with different layer thicknesses. Bull. Eng. Geol. Environ. 2024, 83, 188. [Google Scholar] [CrossRef] [Scilit]
- Terron-Almenara, J.; Skretting, E.; Holter, K.G.; Hoien, A.H. Design of Rock Support in Hard and Layered Rock Masses Using a Hybrid Method: A Study Based on the Construction of the New Skarvberg Tunnel, Norway. Rock Mech. Rock Eng. 2024, 57, 10491–10532. [Google Scholar] [CrossRef] [Scilit]
- Lan, Z.J.; Chen, W.Z.; Yuan, J.Q.; Wang, D.; Zhou, Y.; Shen, K. Study on the fracture behavior in clayey geomaterials under moisture diffusion by phase field modeling. Comput. Geotech. 2024, 171, 106373. [Google Scholar] [CrossRef] [Scilit]
- Li, L.F.; Zhou, Z.L.; Li, S.T.; Tan, Z.S.; Fu, Y.P. Investigation of Silty Mudstone Properties and Inverted Arch Uplift Mechanism: A Case Study of Xicheng Railway Tunnel. Rock Mech. Rock Eng. 2026, 25. [Google Scholar] [CrossRef] [Scilit]
- Qu, J.K.; Xue, Y.G.; Kong, F.M.; Zhou, C.Y.; Peng, J.B.; Yan, S.; Liu, Z.; Ruan, Z.; Zang, M.D.; Fu, K.; et al. Deterioration characteristics of red beds lithological interface under water-rock interaction and its influence on tunnel deformation. Int. J. Rock Mech. Min. Sci. 2026, 199, 106434. [Google Scholar] [CrossRef] [Scilit]

Disclaimer/Publisher’s Note: The statements, opinions and data contained in all publications are solely those of the individual author(s) and contributor(s) and not of MDPI and/or the editor(s). MDPI and/or the editor(s) disclaim responsibility for any injury to people or property resulting from any ideas, methods, instructions or products referred to in the content. |
© 2026 by the authors. Licensee MDPI, Basel, Switzerland. This article is an open access article distributed under the terms and conditions of the Creative Commons Attribution (CC BY) license.