


Abstract
The South-to-North Water Diversion Project (SNWDP) in China involves a vast number of resettlers with far-reaching impacts. As a crucial carrier of resettlers’ daily lives, the indoor thermal comfort of resettlement housing directly affects their physical and mental health. However, existing empirical and field studies have paid limited attention to the thermal comfort and thermal adaptation of the resettlers. This study focuses on resettlers of the SNWDP, employing a combination of questionnaires and on-site measurements to analyze thermal benchmarks and thermal adaptation behavior data. The study introduces the concept of relative deprivation theory from social psychology, compares the correlations between vertical and horizontal deprivation and thermal perception across different relocation modes, and validates the predictive performance of commonly used thermal comfort models. The results show that as the relocation distance increases, the summer indoor thermal neutral temperature rises sequentially, and both the sensitivity to temperature changes and the width of the comfort zone also increase. Regarding thermal adaptation behaviors, the short-distance group primarily relies on passive adjustments such as using electric fans and reducing clothing, while the long-distance group significantly shifts toward active mechanical cooling like air conditioning. The sense of relative deprivation has a significant impact on the thermal comfort of medium- and long-distance resettlers, and its correlation even exceeds that of physical factors such as air temperature and black globe temperature. Among all groups, the ePMV and ePTS models modified by the expectancy factor exhibit the best predictive performance, with the smallest average deviation from the actual Thermal Sensation Vote (TSV), making them the optimal evaluation models for indoor thermal comfort of resettlers in the SNWDP. The findings provide theoretical guidance for creating healthy and comfortable indoor thermal environments in resettlement areas and for the sustainable development of subsequent phases of the SNWDP.
1. Introduction
The South-to-North Water Diversion Project (SNWDP) is a major inter-basin water transfer project in China. The project was officially approved by the State Council in December 2002, with the eastern and middle routes commencing operation in November 2013 and December 2014, respectively. The middle route, from which the resettlers in this study originated, required a large-scale resettlement program. According to official statistics, approximately 340,000 to 440,000 residents were relocated due to the project. The resettlement program for the middle route began in 2009 and was largely completed by 2012, with resettlers placed in over 600 resettlement sites across Henan, Hubei, and other provinces [1]. The climatic, geographical, socio-cultural, and economic conditions of the resettlement areas differ greatly from those of their original places of residence. This drastic change in external environment has a profound impact on their quality of life and physical and mental health. In recent years, an increasing number of studies have focused on issues such as social adaptation, economic recovery, and psychological reconstruction of resettlers [2,3]. However, research on the residential comfort and thermal adaptation mechanisms of resettlers in new environments remains relatively scarce. Due to different relocation modes, resettlers exhibit varying thermal comfort needs and environmental adaptation behaviors, which is particularly important in the design of resettlement housing for the SNWDP.
The thermal comfort and thermal adaptation process of resettlers appear to be influenced by a greater number of factors, including climate differences between their original and resettlement areas, relocation modes, duration of thermal adaptation, social support networks, economic recovery levels, and psychological sense of belonging. In resettlement housing, resettlers often relieve thermal discomfort in summer by opening windows for ventilation, using electric fans, or air conditioners. However, constrained by economic pressures and energy prices after relocation, some low-income resettlers tend to prefer passive adjustments (e.g., adjusting clothing, changing daily routines) [4]. Resettlers’ daily activity patterns, time spent outdoors, and intergenerational cohabitation also differ from those of local residents, all of which profoundly affect their thermal comfort needs [5]. Physiologically, long-term psychological stress and a sense of unfamiliarity with the environment may lead to alterations in autonomic nervous regulation, thereby affecting thermal perception thresholds. Energy poverty is particularly realistic for resettlers in the midst of livelihood reconstruction; households with slower economic recovery may actively lower their indoor comfort expectations [6,7]. Therefore, changes in resettlers’ thermal needs can be summarized as an inconsistency in behavioral, physiological, and psychological adaptability.
However, existing research appears to have paid little attention to the current state of indoor thermal comfort among resettlers of the SNWDP. Previous studies have often selected voluntary migrants as participants to investigate differences in thermal adaptation under various thermal experiences. For example, Liu et al. [8] conducted long-term tracking and questionnaire surveys on indoor thermal adaptation of migrants from different climate zones to explore their different behavioral adaptation processes. Using a long-term climate chamber experiment, Dong et al. [9] further investigated the perceptive and physiological adaptation of migrants with different thermal experiences, revealing that psychological adaptation dominated thermal adaptation development in southern migrants. Ji et al. [10] studied the impact of long-term thermal history on individuals’ thermal sensation evaluations and derived patterns of thermal adaptation. However, there are often considerable differences in indoor thermal comfort and adaptive behaviors between involuntary resettlers and voluntary migrants. Involuntary resettlers, constrained by economic limitations and past living habits, tend to adopt passive, low-cost adaptive behaviors such as adding or removing clothing and opening or closing windows to tolerate a wider range of thermal environments. In contrast, voluntary migrants, seeking a higher quality of life, are more inclined to actively use mechanical means such as air conditioners and heaters to precisely maintain room temperature within a narrow, comfortable range. This consideration may also lead to inconsistencies in thermal needs and adaptive behaviors between the two groups.
Thermal comfort is defined by ASHRAE as “that condition of mind which expresses satisfaction with the thermal environment” [11]; therefore, thermal comfort falls within the realm of psychology. However, research on the impact of psychological factors on thermal comfort remains very limited, especially regarding psychological differences arising from social comparison. Brahim et al. argue that human judgment of thermal comfort is not constant but dynamically changes with subjective emotional experiences, and they found significant differences in subjective thermal evaluation between anger and happiness [12]. Li et al. suggest that humans are greatly influenced by subjective feelings and cognitive biases in long-term thermal comfort assessment [13]. Lam et al. demonstrated that the psychological expectations of tourists affect their thermal sensation, and studies by Rutty et al. reached similar conclusions [14,15]; that is, tourists’ psychological expectations of a destination cause their subjective thermal sensation to be completely different from that of local residents. Additionally, autonomy, or perceived control, also influences human subjective thermal sensation. Studies by Elnabawi et al. and Johansson et al. indicate [16,17] that people with higher autonomy feel more comfortable thermally. Regarding the impact of social factors on thermal comfort, Shooshtarian et al. defined social factors as the presence or absence of companions [18] and found that individuals without companions have higher thermal sensitivity. Galindo et al. used SEM structural modeling to discuss psychological and social factors, finding that insecurity and noise—both psychological factors—affect thermal sensation, while social factors showed low significance [19]. In summary, although existing studies have explored the impact of psychological and social factors on thermal comfort, the findings seem inconsistent.
Given that thermal comfort is fundamentally a psychological state as defined above [11], it is likely to be influenced not only by physical environmental parameters but also by subjective emotions and cognitive comparisons. One particularly relevant psychological framework is Relative Deprivation Theory (RDT). Relative Deprivation (RD) was first proposed by sociologist Stoffer in 1949 and has since become an important research topic in fields such as psychology, sociology, and political science. The classical Relative Deprivation Theory (RDT) holds that individuals primarily evaluate their status and circumstances through comparison with others. In such comparisons, disadvantaged groups often experience multidimensional inequalities in education, housing, healthcare, and other areas, which in turn generate dissatisfaction and extreme behaviors, such as gambling and suicide [20]. Kunst and Obaidi even suggest that relative deprivation is likely a significant driver of the emergence of violent extremism across cultures and contexts in the 21st century [21]. Relative deprivation primarily stems from social comparison, including both horizontal comparison with reference groups and vertical comparison between one’s current state and past or future states, resulting in negative emotional experiences [22]. In the context of the SNWDP, resettlers are involuntarily displaced from their original homes and placed in unfamiliar environments. This experience frequently leads to perceived disadvantages in housing quality, economic opportunities, and social status, which may trigger a sense of relative deprivation. This subjective psychological state, in turn, can bias how resettlers evaluate their new living environment—including their perception of indoor thermal comfort. Disadvantaged groups have long been the primary subjects of research on relative deprivation, as their group membership remains fixed amid social development and change, and they often find themselves in an inferior position when compared to out-groups. Sablonnière et al. argue that if individuals possess less than others who enjoy equal rights, relative deprivation may be triggered [23]. Grant’s research found that when group members perceive discrimination, it triggers anger and dissatisfaction, which in turn leads to social conflict [24]. Regarding research on migrants and relative deprivation, Lamb used relative deprivation theory to explain the paradox of migrant workers’ subjective satisfaction versus objective inadequacy of the working environment. The main reason is that migrants compare themselves with fellow migrants of the same status rather than with local residents [25]. Xia et al. studied domestic migrants in China and found that relative deprivation affects social exclusion, which in turn influences migrants’ quality of life [26]. Research by Meuleman et al. suggests that relative deprivation among migrant groups is an important mediating factor between social structural position and perceived threat [27]. Thus, examining relative deprivation is essential for understanding the psychological mechanisms that shape thermal comfort evaluations among resettlers in this project.
In daily research, it is often observed that despite all being resettlers of the SNWDP, there are extreme differences in their physical condition, psychological state, and satisfaction with the environment of the resettlement area. These differences arise because individual resettlers have experienced varying levels of environmental exposure in their original places of residence, different degrees of trauma during the relocation process, and divergent levels of social integration and economic reconstruction capacity after resettlement. These factors lead to different degrees of adaptation across multiple systems (nervous, endocrine, immune, cardiovascular, etc.), resulting in different levels of “resettlement adaptation status” [6]. The comprehensive adaptation level of resettlers is closely related to their thermoregulatory capacity, environmental stress response patterns, daily behavioral habits, and available regulatory resources. This likely directly affects their tolerance thresholds for changes in the indoor environment, their preferences, and their adaptive behaviors, thereby leading resettlers under different relocation modes to exhibit distinctly different thermal adaptation patterns.
Currently, indoor thermal comfort evaluation models can be roughly divided into three categories: classical heat balance models, adaptive regression models, and adaptive heat balance models [28]. Fanger proposed the Predicted Mean Vote (PMV) based on the heat balance theory between the human body and metabolic heat production [29]. Gagge proposed the Standard Effective Temperature (SET) based on Effective Temperature (ET) [30]. These two thermal comfort evaluation models have been widely used globally and can accurately predict indoor thermal comfort conditions, laying the foundation for the development of thermal comfort models. However, an increasing number of field studies have found significant discrepancies between field measurement results and classical thermal comfort models [31,32,33]. These differences may be attributed to population differences and the neglect of thermal expectations, culture, and climate adaptation [34,35]. In fact, when facing environmental discomfort, humans actively apply subjective adjustments, including physiological, psychological, and behavioral adaptations [36,37]. Consequently, researchers have developed adaptive models suitable for different climate zones and different cities [38,39,40,41,42]. Most of these studies establish regression models using outdoor air temperature as the independent variable and neutral temperature as the dependent variable [11,43]. The calculation methods for outdoor air temperature vary. ASHRAE 55 recommends using an Exponentially Weighted Running Mean with an exponent α in [0–1] [11]; GB/T 50785—2012 adopts a 7-day smoothing exponent with α = 0.8 [44]. Some studies use the arithmetic mean of 7-day, 15-day, or 21-day average outdoor temperatures [45], or natural daily or monthly averages [46,47]. Because classical heat balance models do not account for the subjective initiative of human adaptation, while adaptive regression models use only outdoor air temperature as a single index, researchers have integrated the strengths and weaknesses of both and attempted to establish connections between them, developing various adaptive heat balance models. For PMV-related models, examples include aPMV [48], ePMV [49], PMVn [50], PMVadj [31], and ATHBpmv. For SET-related models, examples include PTS [23], ePTS, aPTS [51], and ATHBpts [11]. However, few studies have investigated the applicability and accuracy of indoor thermal comfort models for involuntary resettlers. Therefore, when evaluating the indoor thermal environment of resettlers from the SNWDP, blindly and subjectively using any single evaluation model would inevitably bias the evaluation results.
The purpose of this study is to focus on the indoor thermal comfort of resettlers from the SNWDP, and to examine whether relative deprivation—a common psychological experience among involuntary resettlers—significantly affects their thermal comfort perception. According to the relocation mode, the resettlers are divided into three groups: short-distance (within the same county), medium-distance (within the same prefecture-level city), and long-distance (within the same province). Household surveys were conducted in typical resettlement areas representing these three relocation modes. The specific research contents are as follows:
Section 1 reviews the research background and defines the research objectives.
Section 2 describes the research methods, including questionnaires and field measurements.
Section 3 presents the analysis results, including differences in thermal neutrality across different relocation modes, exploration of dynamic behavioral adaptation processes, the influence of relative deprivation, and the selection of indoor adaptive thermal balance models.
Section 4 provides interpretation and discussion, along with research limitations and future directions.
Section 5 summarizes the main research findings.
2. Methods
2.1. Study Locations and Participants
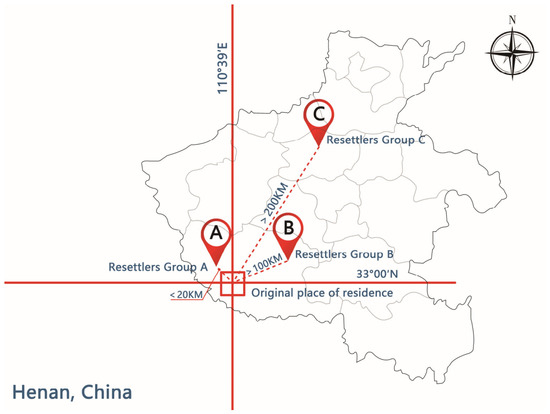
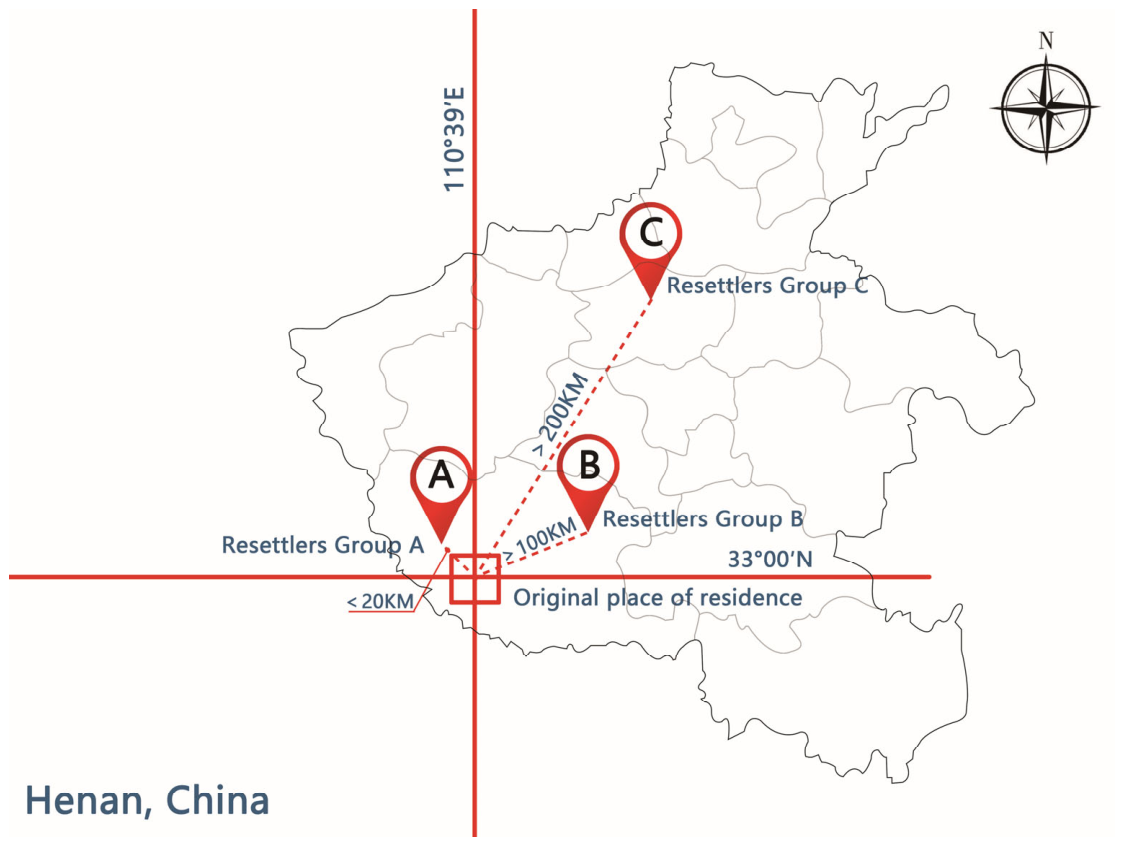
As the main objective of this study is to examine the indoor thermal comfort thresholds and differences in adaptive behaviors among resettlers of the SNWDP, the control group consisted of non-relocated residents in the water source area of the Middle Route of the SNWDP. The experimental group comprised resettlers from the same project under three different relocation modes: Group A (short-distance resettlers relocated within the same county), Group B (medium-distance resettlers relocated within the same prefecture-level city), and Group C (long-distance resettlers relocated within the same province). Their relocation distances from the original place of residence were <20 km, >100 km, and >200 km, respectively. The relocation distances and locations are shown in Figure 1. Both Group A and Group B resettlement areas are located within Nanyang City, Henan Province, China. Nanyang has a subtropical monsoon climate and is classified as a hot-summer and cold-winter region under China’s building climate zoning. Group C is located in Xingyang City, which has a temperate monsoon climate and is classified as a cold region.
Figure 1.
Geographic locations of the measurement space.
This study focused on the indoor environment of resettlement housing. Resettlers who had lived long-term in the resettlement houses were recruited as participants. During the study period, a total of 600 resettlers (200 from each of Groups A, B, and C) participated in questionnaire surveys conducted in their own homes within the resettlement areas. All three groups completed their relocation in 2011, and participants were recruited randomly.
2.2. Meteorological Measurements
Field meteorological measurements were conducted during the summer from June to August 2025. The research team was divided into three groups to carry out measurements in resettlement areas corresponding to the three relocations. Field measurements and questionnaire surveys were conducted simultaneously, and all measurement days were sunny or partly cloudy. During the study period, indoor air temperature (Ta), relative humidity (RH), air velocity (Va), black globe temperature (Tg), and outdoor air temperature () were measured. Outdoor air temperature was obtained from meteorological data from the weather station nearest to the study site. The measurement range, accuracy, and other parameters of all instruments met the requirements of the ISO 7726 standard [51]. Detailed instrument parameters are provided in Table 1.
Table 1.
Technical parameters of testing instruments.
All instruments were placed at a height of 1.1 m above the floor. The mean radiant temperature (Tmrt) and operative temperature (Top) were calculated using the ISO 7726 standard and the CNE standard [51].
where D is the globe diameter (D = 0.05 m in this study) and Ɛ is the emissivity (Ɛ = 0.95 for a black globe).
Va < 0.2 m/s, A = 0.5; 0.2 m/s ≤ Va < 0.6 m/s, A = 0.6; 0.6 m/s ≤ Va < 1.0 m/s, A = 0.7.
2.3. Questionnaire Survey
The questionnaire consists of three parts. The first part collects basic information about the resettlers, including age, gender (1 = male, 2 = female), and clothing. The second part investigates thermal comfort evaluation, including Thermal Sensation Vote (TSV) and Thermal Comfort Vote (TCV). Thermal sensation uses the ASHRAE 7-point scale (−3 = cold, −2 = cool, −1 = slightly cool, 0 = neutral, +1 = slightly warm, +2 = warm, +3 = hot). Thermal comfort uses a 5-point scale (−2 = very uncomfortable, −1 = uncomfortable, 0 = neutral, +1 = comfortable, +2 = very comfortable) [11]. The third part records thermal adaptive behaviors using a binary scale. Because it is impossible to record the resettlers’ thermal adaptive behaviors throughout the day in real time, the execution of behavioral adjustments was recalled and verbally reported by the respondents and recorded by the researchers. The execution status of each behavior level is set as 0 (not performed) or 1 (performed). Resettlers could select multiple thermal adaptive behaviors or tools from the following options: air conditioner, electric fan, hand fan, reducing clothes, adjusting doors and windows, cold drinks, going to a cool place, and others.
The fourth part investigates RD votes, adopting the widely recognized cognitive-affective two-dimensional structure model of RD, which includes both cognitive and affective components. Since this study focuses on the relationship between differences in thermal comfort among resettlers with varying relocation distances and relative deprivation, and mainly involves intergroup comparisons, this paper examines the effects of group deprivation. The cognitive part centers on “housing thermal comfort” and involves horizontal deprivation (comparison with local residents and resettlers under different relocation modes) as well as vertical deprivation (comparison with the pre-relocation situation). Accordingly, the cognitive items are: RD1: “Compared with local residents, how do you find the thermal comfort of your home?”; RD2: “Compared with other relocation modes, how do you find the thermal comfort of your home?”; RD3: “Compared with your pre-relocation home, how do you find the thermal comfort of your current home?” All options use a 5-point scale: 1 = very good, 5 = very poor. Each cognitive item is followed by a corresponding affective item: “How do you feel about this difference?” Options also use a 5-point scale: 1 = very satisfied, 5 = very dissatisfied. The sum of the cognitive and affective scores for each group constitutes that group’s RD score. The sum of the RD scores across groups gives the overall RD score. A higher score indicates a higher level of perceived relative deprivation.
2.4. Calculation Process of Thermal Comfort Models
This paper discusses eight adaptive thermal balance models: four related to PMV (PMV, ePMV, aPMV, ATHBpmv) and four related to SET (PTS, ePTS, aPTS, ATHBpts). PMV and SET were calculated using ASHRAE Standard 55 [11], and SET was converted to PTS according to Equation (3) [52].
ePMV and aPMV were calculated according to the methods of Fanger et al. and Yao et al. [46,47], using Equations (4) and (5). The expectancy factor (e_pmv) and adaptive coefficient (λ_pmv) were determined by applying the least squares method to field measurement data using Equations (6) and (7) [46,47,50,53,54]. The calculation methods for ePTS and aPTS were identical to those described above. For the ATHBpmv and ATHBpts models, calculations were performed using the R programming language with field measurement data as input.
2.5. Limitations
Due to severe hollowing-out of the resettlement areas, the number of valid respondents in each resettlement area was less than 200, which introduces some uncertainty to the findings. Moreover, the survey was conducted only in summer. Future research should extend to winter and include long-term observations of thermal comfort.
Data on resettlers’ income levels, energy consumption, and psychological scales (e.g., resettlement satisfaction) were not collected simultaneously, making it difficult to disentangle the respective contributions of economic constraints and psychological adaptation. Furthermore, the relocation took place more than 15 years ago; the observed differences are the result of long-term adaptation, but the temporal trajectory of adaptation cannot be determined.
The primary objective of this study was to investigate the psychological mechanisms linking thermal comfort and relative deprivation. Consequently, the questionnaire was designed to focus on thermal perception, adaptive behaviors, and subjective evaluations of relative deprivation. Nevertheless, future research should incorporate socio-economic variables to examine their potential moderating effects.
3. Results
3.1. Respondent Information and Meteorological Parameters
A total of 177 valid questionnaires were collected from Group A, 178 from Group B, and 176 from Group C (Table 2). Because the resettlers of the SNWDP were uniformly resettled by the government, Group A (within-county resettlers) and Group B (within-city resettlers) were assigned the same house type. Group C had a different house type from Groups A and B, but the floor area difference did not exceed 20 m2, and all houses were two stories. Therefore, it can be considered that the building quality of the resettlement houses across different relocation modes was similar. Most resettlers lived only on the first floor, leaving the second floor vacant; one reason for this is that the second floor receives more solar radiation and has higher temperatures. The respondents ranged in age from 20 to 85 years, with 46% male and 54% female. Regarding clothing, the three groups showed little difference in indoor clothing thermal insulation in summer, all adopting a relatively low clothing insulation (Icl) of approximately 0.31 clo. The respondents remained seated while answering the questionnaire, so the metabolic rate was taken as 1.0 met (seated, at rest).
Table 2.
Sample Distribution and Basic Characteristics of Surveyed Resettlers.
Table 3 shows the indoor and outdoor meteorological parameters in the three resettlement areas during the field survey. As can be seen from Table 3, the indoor and outdoor meteorological parameters among the three experimental groups did not differ greatly during the measurement period.
Table 3.
Indoor and outdoor climate conditions during the research period.
3.2. Relative Deprivation
First, a reliability analysis was conducted on the questionnaire data. The Cronbach’s α coefficients were 0.668 for Group A, 0.882 for Group B, and 0.841 for Group C, all of which exceed the conventional threshold for acceptable reliability. This indicates that the collected data are consistent and suitable for cognitive-emotion-based RD analysis. The calculated RD scores for each experimental group are presented in Table 4.
Table 4.
Average RD values of various experimental groups.
The overall RD scores followed the order of C > B > A, indicating that groups with longer relocation distances reported higher levels of relative deprivation. This suggests that, at least in the context of housing thermal comfort, individuals relocated over greater distances exhibit more pronounced perceptions of deprivation in both intra-group and social comparisons. Furthermore, RD2 (comparison with other resettlers in similar social positions) received the highest scores across all experimental groups, implying that involuntary resettlers experience the strongest sense of relative deprivation when comparing themselves to peers who share a comparable resettlement status.
3.3. Differences in Thermal Benchmarks
3.3.1. Correlation Between Top and TSV
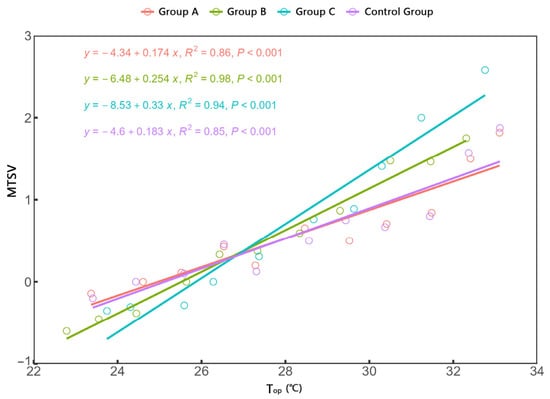
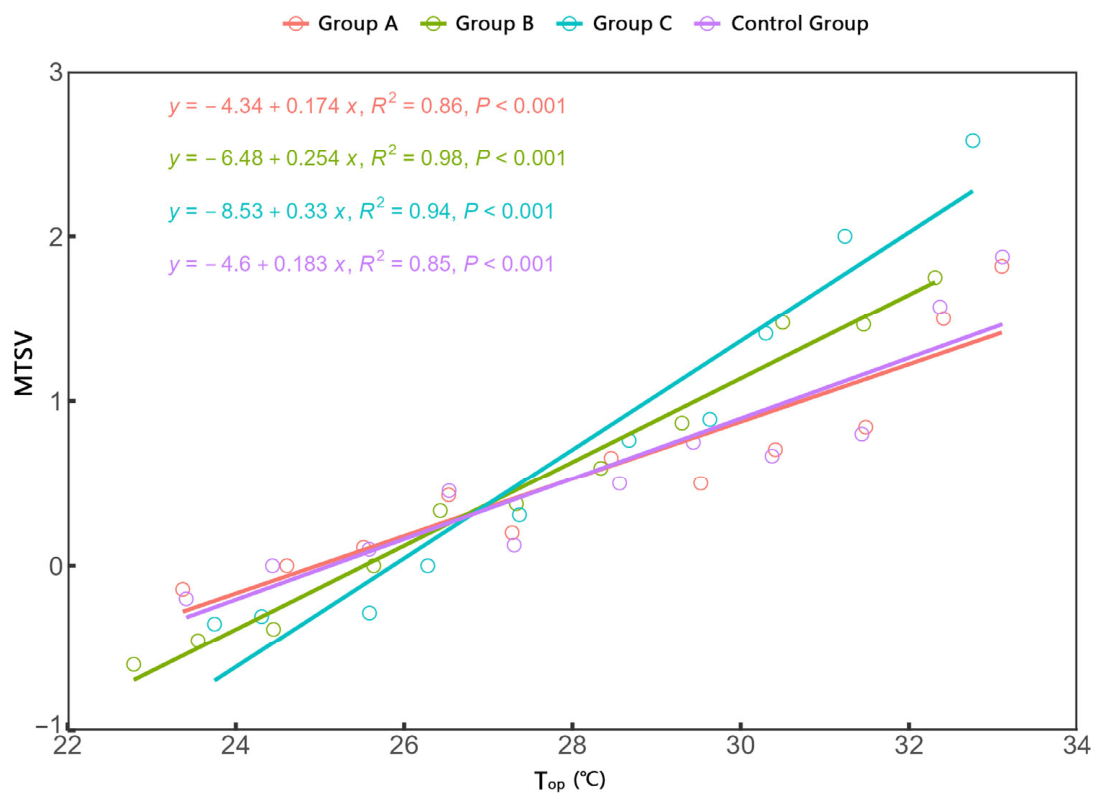
To establish the indoor thermal sensation model for resettlers under different relocation modes during summer, the relationship between Top and TSV was analyzed through linear fitting. Top was grouped into 1 °C intervals, excluding groups with fewer than five samples. The mean values of Top and TSV (MTSV) were calculated for each group, and linear regression analysis was performed between the two. The results are shown in Figure 2. Setting MTSV = 0, the calculated Top value is the thermal neutral temperature. The indoor thermal neutral temperature of the control group was 25.15 °C, Group A (experimental) was 24.97 °C, Group B was 25.51 °C, and Group C was 25.84 °C. It can be seen that Group A and the control group had very similar neutral temperatures, differing by less than 0.2 °C, while the difference increased with longer relocation distances. The slope of the equation represents the sensitivity of thermal sensation to temperature changes, with C > B > A, indicating that resettlers relocated over longer distances are more sensitive to temperature changes. The range of neutral thermal sensation (MTSV between −0.5 and 0.5) was 22.42–27.88 °C for the control group, 22.05–27.80 °C for Group A, 23.54–27.48 °C for Group B, and 24.25–27.42 °C for Group C. Again, the control group and Group A showed little difference, while the neutral range narrowed with increasing relocation distance.
Figure 2.
Correlation between Top and MTSV.
3.3.2. Correlation Between Top and MTCV
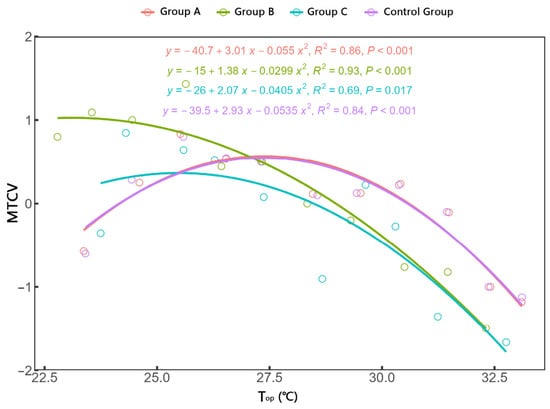
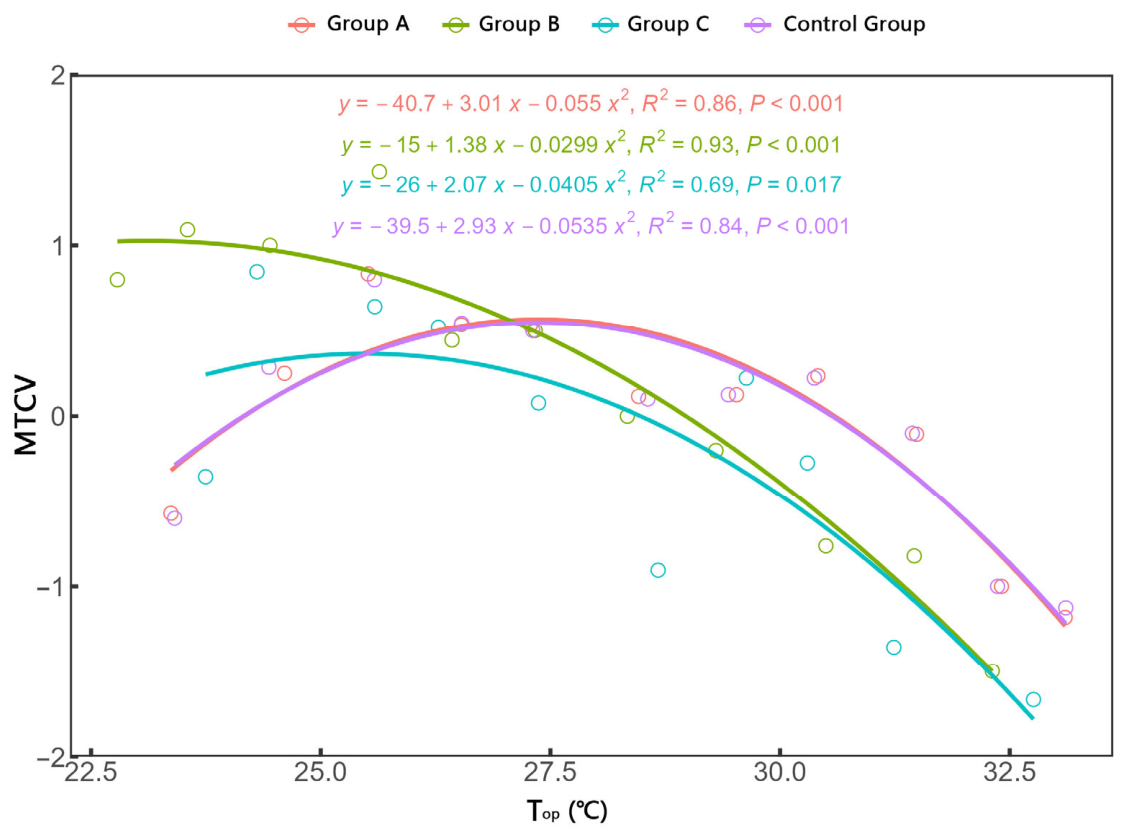
Similarly, Top was grouped into 1 °C intervals to analyze the relationship between Top and TCV through linear fitting. Groups with fewer than five samples were excluded, and a quantitative relationship between Top and MTCV was established. The results are shown in Figure 3. The range of thermal comfort (TCV > 0) was 25.45–29.26 °C for the control group, 24.13–30.65 °C for Group A, 17.33–28.77 °C for Group B, and 20.01–29.24 °C for Group C. Again, Group A and the control group showed the closest curves. Comparing these results with the previously determined range of neutral thermal sensation (−0.5 < TSV < 0.5), it was found that the comfort zone from thermal comfort votes differed from the neutral thermal sensation range. The comfort zones for Groups B and C were significantly wider than their neutral thermal sensation ranges. This also reflects the difference between thermal sensation and thermal comfort in the resettlement areas of the SNWDP, indicating that thermal sensation is mainly influenced by the indoor physical environment, while thermal comfort is affected not only by environmental factors but also by subjective factors such as satisfaction and emotions. Studying the subjective factors that constitute human thermal comfort is an important research area [54].
Figure 3.
Correlation between Top and MTCV.
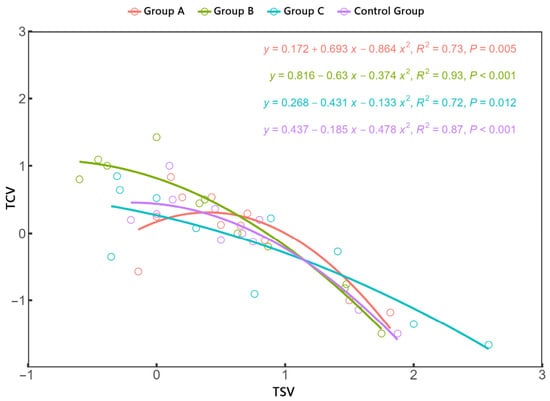
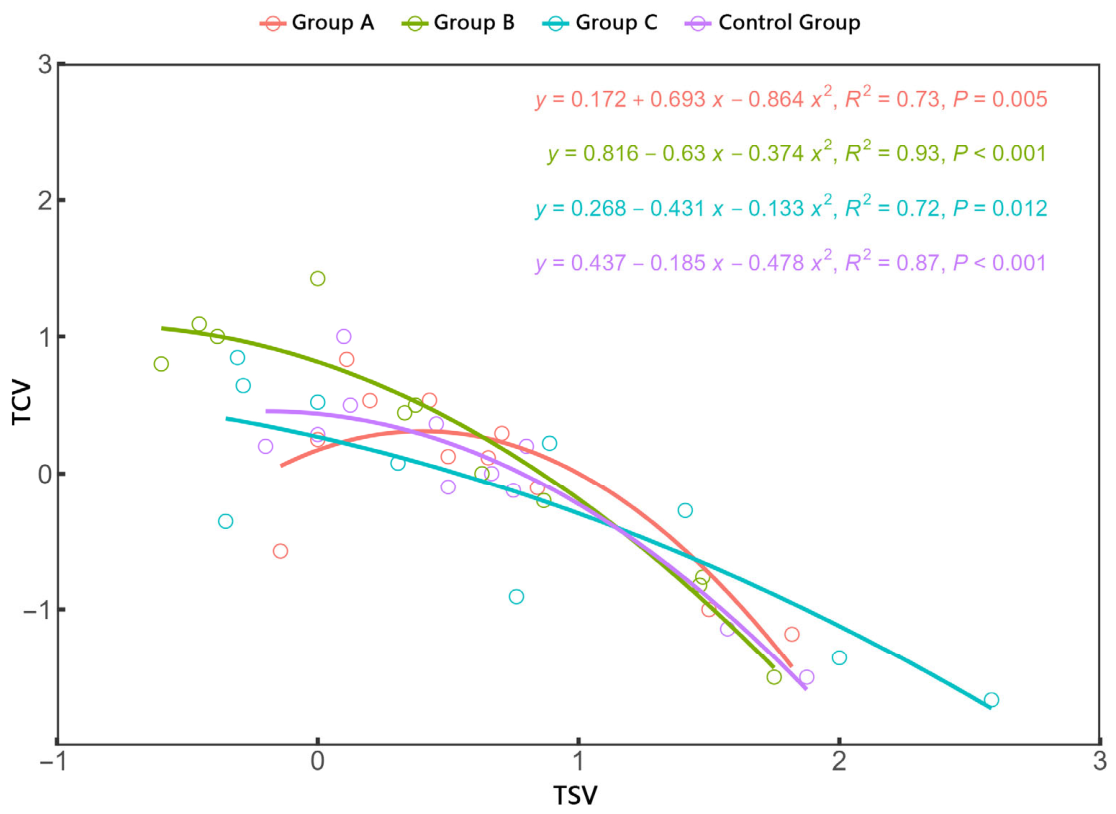
To further analyze the relationship between TSV and TCV among the experimental groups and the control group, regression analysis was used to establish quantitative relationships between MTSV and MTCV at different levels of thermal perception. The results are shown in Figure 4. When MTCV > 0, the corresponding MTSV range represents the thermal sensation range considered comfortable. For the control group, this range was –1.17 to 0.78; for experimental Group A, –0.20 to 1.00; for Group B, –2.54 to 0.86; and for Group C, –3.77 to 0.53. This indicates that the greater the relocation distance, the wider the thermal comfort range. Moreover, Groups B and C clearly preferred a cooler thermal sensation in summer, whereas Group A appeared to prefer a warmer thermal sensation. The lower bound of the thermal sensation range for the experimental groups became progressively lower, meaning that they were increasingly able to accept (or even prefer) a cooler environment in summer.
Figure 4.
Correlation between MTSV and MTCV.
3.4. Differences in Adaptive Behaviors of Resettled Residents
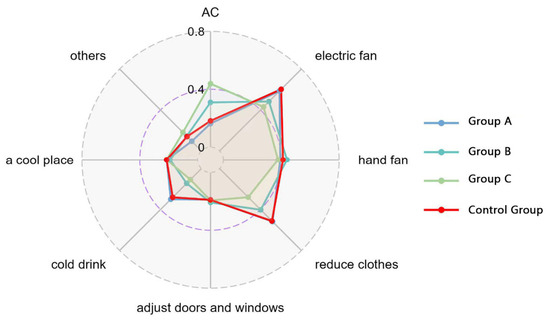
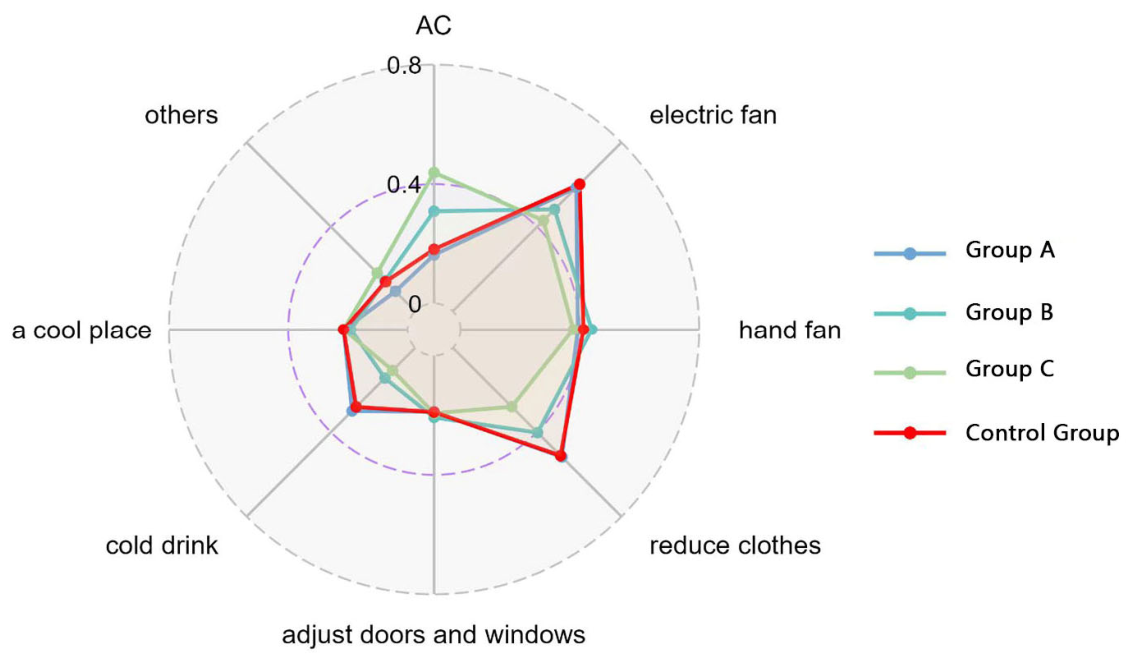
Figure 5 shows the statistical data on summer adaptive behaviors of resettled households under different relocation and resettlement modes in the SNWDP. During hot summer weather, the main adaptive behaviors adopted by resettlers in each group included air conditioning, electric fans, reducing clothing, and adjusting doors and windows. A chi-square test was used to analyze each adaptive behavior among residents under different resettlement modes, and statistically significant differences between groups were found for the use of air conditioning, reducing clothing, and using fans (p < 0.001).
Figure 5.
Proportion of different thermal adaptation behaviors or tools.
The relocation mode in the South-to-North Water Transfer resettlement areas significantly influences the choice of adaptive behaviors. Group A (within-county resettlement) remained relatively close to the climate and social networks of their original place of residence, so the impact of relocation on them was smaller, and their behavioral habits exhibited characteristics similar to those of the local non-resettled population. Reducing clothing in summer occurred mainly among adult male resettled residents in Group A and the control group. In these two groups, some men took off their shirts at home, leaving their upper bodies uncovered to maintain physical comfort. Group B fell between Group A and Group C, while in Group C, because the relocation distance was longer and the time since relocation was greater (more than 10 years), this behavior was less common. Additionally, using electric fans was also a common cooling measure for local resettled residents (Group A). Group B (within-city resettlement) had a moderate relocation distance; they partially retained traditional cooling habits, with fan use and clothing reduction also being common cooling measures. At the same time, having a certain level of economic means, their proportion of air conditioner use was higher than that of Group A and the control group. Group C (within-province resettlement) had the longest relocation distance and was most affected by changes in climatic environment, resulting in marked differences in thermal adaptive behavior compared with the other two groups. This is mainly reflected in the use of air conditioning: more than half of the resettled residents in Group C chose air conditioning as a cooling measure, and during the hot summer, their primary adaptive behaviors were air conditioning and fans. Overall, under resettlement modes with different relocation distances, resettled households of the South-to-North Water Transfer Project comprehensively use active mechanical cooling and passive natural cooling measures according to their economic conditions, housing types, and degree of adaptation to the new environment, forming differentiated summer thermal adaptive behaviors.
3.5. The Impact of Relative Deprivation on Thermal Comfort
In order to test the effect of relative deprivation on TCV, each RD score was used as an independent variable and TCV for one-way variance analysis. The corresponding p values for each experimental group are shown in Table 5.
Table 5.
One-way analysis of variance (ANOVA) test between RD and TCV.
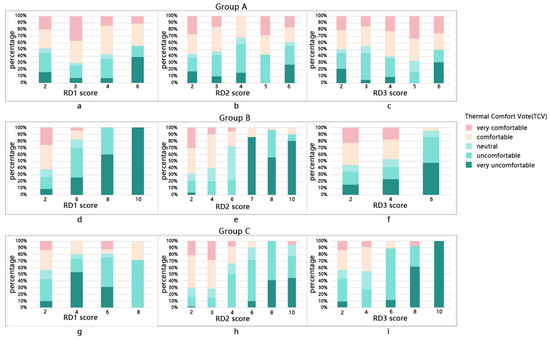
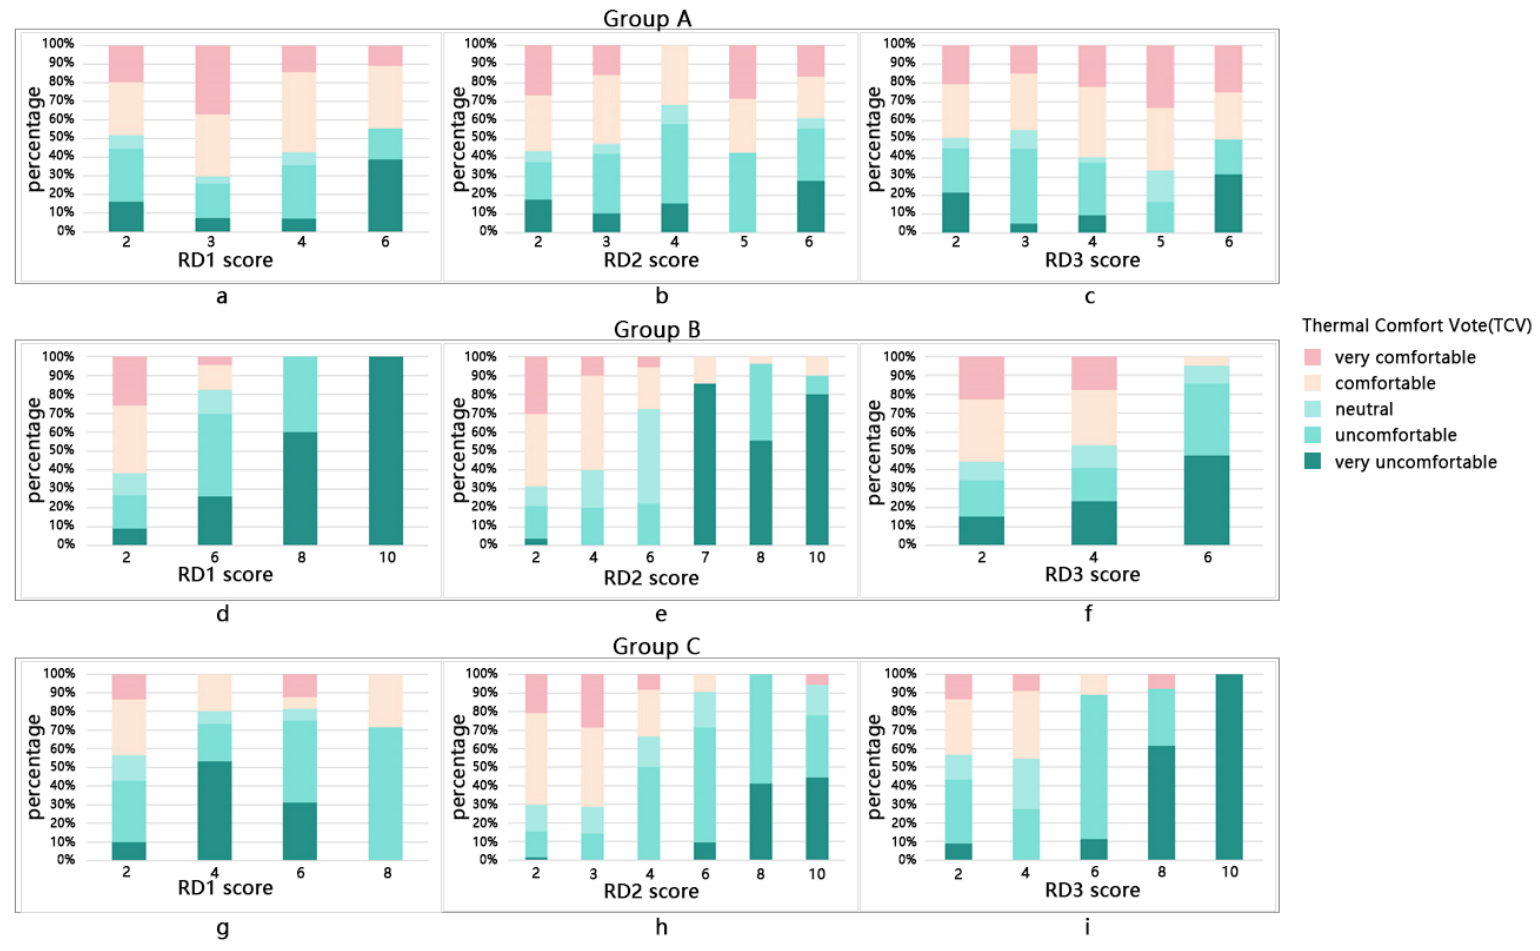
The article counts the TCV value of each segment in each RD. Since the number of samples in some segments is too small, there is no statistical significance and cannot be tested after the hoc test, the score groups with less than 5 are eliminated. The statistical results are shown in Figure 6. The results of the analysis of variance showed that the RDs in Group A had no significant effect on TCV. As shown in Figure 6a–c, there was no significant difference in the comfort evaluation of each RD score. In addition to RD1 in Group C, the RD scores of Group B and Group C both had a significant impact on TCV. We conducted Tukey’s Honestly Significant Difference (Tukey’s HSD) post hoc tests for pairwise comparisons. The results showed that there were statistically significant differences between “score 2-very comfortable” and “very comfortable score—score 6” in group B, and “score 2-very comfortable” and “very comfortable score—score 8” in group C.
Figure 6.
Distribution of TCV under different RD scores in each group (a) RD1 score in Group A; (b) RD2 score in Group A; (c) RD3 score in Group A; (d) RD1 score in Group B. (e) RD2 score in Group B; (f) RD3 score in Group B; (g) RD1 score in Group C. (h) RD2 score in Group C; (i) RD3 score in Group C.
In summary, the ANOVA confirmed the validity of the relationship between RD and TCV in Groups B and C, while the assumption of RD and TCV in Group A is wrong.
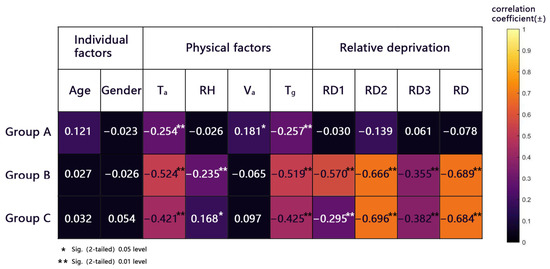
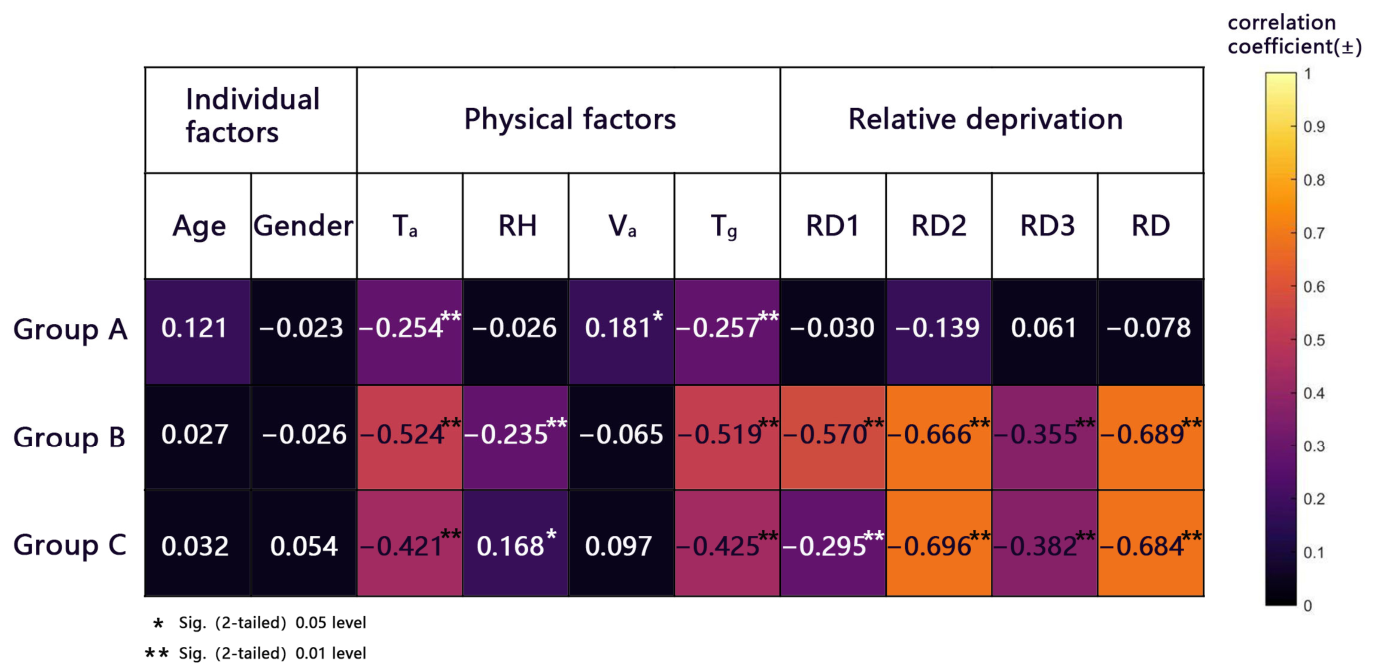
In order to further analyze and compare the strength of the effects of each factor on thermal comfort, individual factors (age, gender) and physical factors (Ta, RH, Va, Tg) were added, and Spearman was used for the correlation analysis, and the results are shown in Figure 7. In Group A, air temperature (Ta) and globe temperature (Tg) were identified as the factors exerting the strongest influence on TCV, whereas RD scores showed no significant correlation with TCV—consistent with the earlier ANOVA results. In contrast, for Groups B and C, relative deprivation demonstrated a strong negative correlation with TCV: higher levels of RD were associated with lower thermal comfort scores, indicating greater discomfort. Notably, in these groups, the impact of relative deprivation on thermal comfort exceeded even that of Ta and Tg. Among them, RD2 has the highest correlation with TCV, followed by RD1 and RD3, indicating that the relative sense of deprivation generated compared to other resettlement modes has the strongest impact on thermal comfort. Moreover, involuntary resettlers also experience a relative sense of deprivation in comparison to local residents and previous housing, which affects their subjective perception of thermal comfort.
Figure 7.
Correlation between different influencing factors and TCV.
Based on the correlation analysis, multiple linear regression was performed to elucidate the linear relationships between the influential factors and thermal comfort. Variables with a significant impact on each experimental group were retained for the models. The adjusted R2 values were 0.075 for Group A, 0.643 for Group B, and 0.561 for Group C. The models for Groups B and C demonstrated strong explanatory power between the independent variables and thermal comfort. Although the adjusted R2 was relatively low in Group A, the model remained highly significant (p < 0.001), indicating that the selected independent variables still provide meaningful, though modest, explanatory insight into the dependent variable. The final regression models for each group are presented below.
Group A: TCV = 3.533 − 0.372 × Ta − 0.753 × Va − 0.504 × Tg
Group B: TCV = 7.884 − 0.688 × Ta − 0.002 × RH + 0.481 × Tg − 0.181 × RD1 − 0.219 × RD2 + 0.048 × RD3
Group C: TCV = 5.09 − 0.418 × Ta − 0.001 × RH + 0.303 × Tg − 0.066 × RD1 − 0.252 × RD2 + 0.053 × RD3
The regression coefficients for each variable across the groups are summarized as follows:
Group A: For each unit increase in air temperature (Tₐ), air velocity (Vₐ), and globe temperature (Tg), the thermal comfort vote (TCV) changes by approximately 0.372, 0.753, and 0.504 units, respectively.
Group B: For each unit increase in Tₐ, RH, Tg, RD1, RD2, and RD3, the TCV changes by approximately 0.688, 0.002, 0.481, 0.181, 0.219, and 0.048 units, respectively.
Group C: For each unit increase in Tₐ, RH, Tg, RD1, RD2, and RD3, the TCV changes by approximately 0.418, 0.001, 0.303, 0.066, 0.252, and 0.053 units, respectively.
These coefficients quantify the marginal effects of environmental and psychological factors on thermal comfort perception within each group.
3.6. Selection of Indoor Thermal Comfort Evaluation Models for Resettled Residents of the South-to-North Water Transfer Project
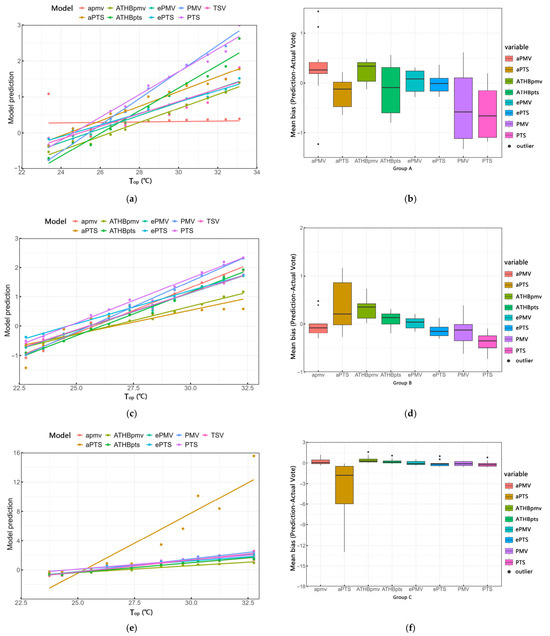
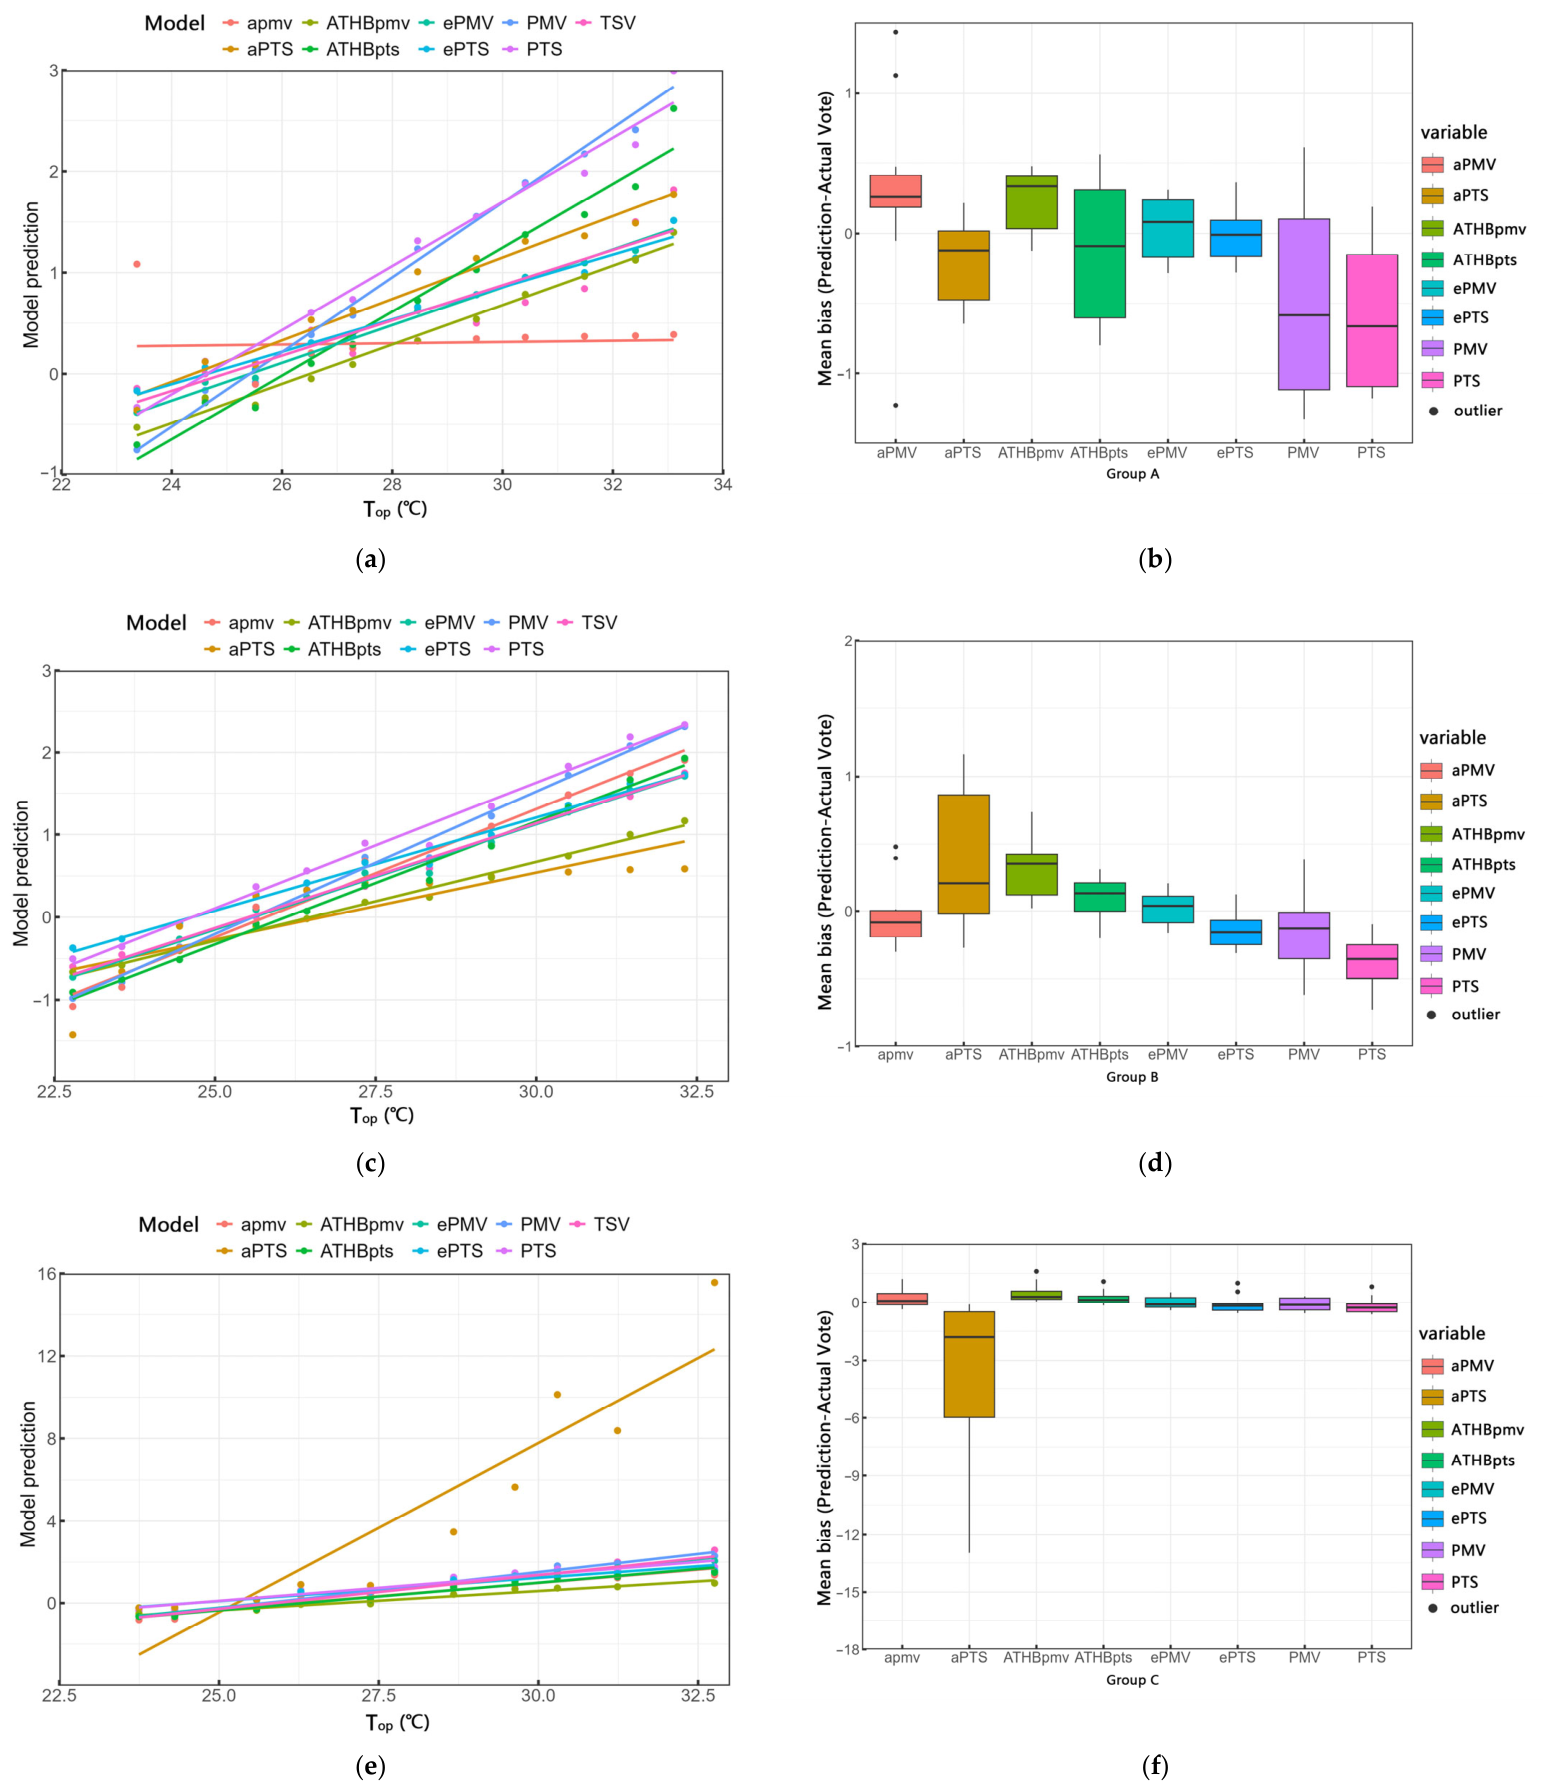
Top was binned into 1 °C intervals, bins with fewer than five samples were removed, and the calculated results of the eight evaluation models, together with TSV, were each subjected to regression analysis against Top. Referring to the methods of Humphreys and Nicol [54] and Yao et al. [28], the predictive performance of the indoor thermal comfort evaluation models was compared using the mean deviation between predicted thermal sensation (PSV) and measured TSV. The results are shown in Figure 8. The linear regression details for the different groups are listed in Table 6.
Figure 8.
Predictive performance of thermal comfort evaluation models for different experimental groups (a) Model predictions in Group A; (b) Box plots in Group A. (c) Model predictions in Group B; (d) Box plots in Group B. (e) Model predictions in Group C; (f) Box plots in Group C.
Table 6.
Details of linear regression for different groups.
For the fitting curves from Group A (Figure 8a,b), the aPMV model showed the poorest fitting performance, while the other seven models all exhibited good fitting performance with Top. The traditional thermal comfort models PMV and PTS both overestimated thermal sensation to varying degrees, with relatively large mean deviations. Among them, the fitting curves of ePMV and ePTS were closest to TSV, and ePTS was the evaluation model with the smallest mean deviation.
For the fitting curves from Group B (Figure 8c,d), all models showed good fitting performance. When the temperature exceeded 24.4 °C, both PTS and PMV overestimated thermal sensation. The fitting curves of ATHBpts, ePMV, and ePTS were all relatively close to TSV. ePMV exhibited the best fitting performance, with the smallest difference in slope, almost completely coinciding with TSV. ePTS also had the smallest mean deviation in Group B.
For the fitting curves from Group C (Figure 8e,f), all models showed good fitting performance, but the slope of the aPTS model differed considerably from those of the other models and TSV. ePMV and PMV were closest to TSV, both with small mean deviations, among which ePMV was the smallest.
In summary, among the three experimental groups in the selected Chinese SNWDP case, the ePTS and ePMV models, which incorporate the expectancy factor “e”, are the most suitable indoor thermal comfort evaluation models.
4. Discussion
4.1. Differences in Thermal Benchmarks Under Different Relocation Modes
This study found a systematic positive correlation between relocation distance and summer indoor thermal neutral temperature as well as thermal sensitivity. Specifically, the thermal neutral temperature of short-distance relocators (Group A, resettled within the same county, 24.97 °C) was very close to that of non-relocated residents (25.15 °C); the neutral temperatures of medium-distance (Group B, 25.51 °C) and long-distance (Group C, 25.84 °C) relocators increased successively. Thermal sensitivity followed the same order: C > B > A. The resettlement area of Group A belongs to the same hot-summer and cold-winter climate zone as their place of origin, so their thermal baseline remained largely unchanged. Group C moved to a colder severe cold region, where long-term cold exposure may induce an upregulation of physiological heat production, paradoxically raising their summer neutral temperature. Meanwhile, Group C exhibited a strong cool preference (with the lower bound of the thermal sensation corresponding to the comfort range as low as −3.77), revealing a “dissociation” between physiological adaptation and psychological expectation.
This finding forms an interesting dialogue with studies on thermal adaptation of migrants in multiple countries. Cohen et al. [55] found in Beersheba, Israel, that the annual neutral PET of migrants from cold climates (19.8 °C) was significantly lower than that of native residents (22.3 °C)—a direction opposite to that of the present study. The fundamental reason lies in the difference in migration direction: the migrants in Cohen’s study moved from cold to hot and arid regions, whereas Group C in this study moved from warm to cold regions. When migrants move from cold to hot regions, their physiological capacity for heat dissipation needs to be upregulated, which may lead to a downward adjustment in their perceived neutral temperature. In contrast, long-term cold exposure in the present study induces an upregulation of thermogenic capacity, causing the body to generate more heat under the same ambient temperature and thereby raising the neutral temperature. This suggests that the effect of thermal history on neutral temperature is direction-dependent. Dong et al. [9] found in climate chamber experiments with migrants across climate zones in China that psychological adaptation occurs faster than physiological adaptation in southern migrants, while the opposite is true for northern migrants, indicating that psychological and physiological adaptations are not synchronized. In Group C of this study, the elevated neutral temperature (physiological) coexists and deviates from a strong cool preference (psychological), which aligns well with the findings of Dong et al. Furthermore, Zhao et al. [56] found in Kunming, a temperate region of China, that residents’ neutral and comfort temperatures are significantly lower than those in hot-summer/cold-winter and cold regions. This confirms the shaping role of climatic background on thermal baselines and also explains the psychological preference for a cool environment in Group C—migrants’ psychological expectations naturally tend to align with the climatic characteristics of the destination region.
4.2. Passive Persistence and Active Restructuring of Adaptive Behaviors
This study found that the thermal adaptation behaviors of migrants under different relocation patterns exhibit a clear gradient evolution. The short-distance relocators (Group A) retained the passive regulation habits from their place of origin (e.g., using fans and reducing clothing); the medium-distance relocators (Group B) were in a transitional state; and the long-distance relocators (Group C) fully shifted to an active cooling strategy dominated by air conditioning. Group C completed their relocation in 2011, and by the time of the survey in 2025, 14 years had passed. Their economic conditions had greatly improved compared to before relocation—explaining the fundamental shift in their energy-use habits.
This gradient evolution echoes multiple studies both internationally and domestically. Liu et al. [8], in a longitudinal study of migrants across climate zones in China, found that even 1.5 years after relocation, migrants from hot-summer and warm-winter regions had not yet fully completed their behavioral adaptation. In the present study, Group A still retained habits from their place of origin after 14 years, whereas Group C had completely switched to air conditioner use, indicating that the timescale required for complete behavioral restructuring depends on the magnitude of environmental change or the availability of economic resources.
Wang et al. [57] studied resettled communities of hydropower migrants in the Jinsha River Basin and found that migrants adapted to the local climate through spontaneous spatial modifications (e.g., adding courtyards, converting flat roofs to pitched roofs), proposing a “place-adaptation” framework. Yan et al. [4,5] investigated resettlement housing for migrants from the SNWDP and found that migrants, in real-life settings, added courtyards and modified spaces according to their needs to adapt to the local climate. In the present study, Group A retained the traditional behavior of reducing clothing, while Group C abandoned this behavior, which can be seen as a behavioral manifestation of the “place-adaptation” framework. The disappearance of original behaviors in Group C suggests that when the relocation distance is sufficiently large, the original “placeness” is eventually replaced by new adaptation patterns. Bui et al. [58] studied migrants from the Son La Hydropower Project in Vietnam and found that resettlement produced uneven effects: households with higher pre-resettlement incomes experienced greater income declines after resettlement. Although the present study did not collect detailed income data, a similar uneven pattern was observed in adaptive behaviors: those long-distance migrants who had economically recovered could afford air conditioning, while those who remained in passive regulation might be locked into lower comfort levels. This suggests that economic stratification within resettlement areas may exacerbate inequalities in thermal comfort.
In summary, the differences in adaptive behaviors are not merely a matter of technological choice; rather, they represent a “behavioral restructuring” that occurs as migrants integrate into a new environment, under the triple constraints of culture, economy, and the physical environment.
4.3. Relative Deprivation and Indoor Thermal Comfort
Among the many factors influencing thermal comfort, physical factors (especially air velocity, Va) are considered the most direct. However, for medium-distance (Group B) and long-distance (Group C) involuntary migrants, all dimensions of RD significantly affect their thermal comfort votes; in univariate analyses, the correlations are even stronger than those of air temperature and black globe temperature. This is a striking finding in the study of thermal comfort among involuntary migrants—psychosocial factors surpass the influence of the actual physical environment, as relative deprivation prevents migrants from accurately responding to the real thermal conditions. Specifically, the effects of horizontal deprivation (RD1: comparison with local residents; RD2: comparison with migrants under other resettlement modes) are stronger than that of vertical deprivation (RD3: comparison with pre-relocation housing), with RD2 (comparison with other migrants) showing the strongest correlation.
This finding is highly consistent with the theory of relative deprivation in social psychology. Based on a large-scale survey of 41,007 adults in New Zealand, Lilly et al. [59] further revealed the moderating role of group status on responses to relative deprivation: among high-status groups, group-based relative deprivation was positively correlated with right-wing authoritarianism and social dominance orientation; whereas among low-status groups, this relationship turned negative. This finding aligns with the study by Gheorghiu et al. [60] in the British context, which showed that the effect of relative deprivation depends on the status of immigrant groups—immigrants from low-status countries (e.g., Poland, India) are more likely to be perceived as encroaching upon the deserving entitlements of the majority group, thereby triggering stronger distrust and, in turn, predicting support for exclusionary policies (e.g., anti-immigration policies). In the present study, RD2 (comparison with migrants under other resettlement modes) exhibited the strongest effect, which is precisely a manifestation of this mechanism among the South-to-North Water Diversion migrants: migrants take other migrants in similarly situated positions as their reference group, and the resulting sense of deprivation ultimately negatively affects their thermal comfort evaluation of the resettlement housing.
Furthermore, recent research on relative deprivation and intergroup relations also corroborates the findings of the present study from multiple perspectives. Moscatelli et al. [61] found in a simple group categorization experiment that whether individuals perceive their own group as disadvantaged (relative deprivation) or advantaged (relative gratification), they are more likely to exhibit outgroup discrimination. The reason “perceiving disadvantage” intensifies discrimination is that this feeling leads people to believe that different groups are in competition and that their fates are intertwined. Pavlović and Čorkalo Biruški [62] found in a sample of Croatian youth that group-based deprivation increases support for and even participation in political violence. These studies indicate that group-based relative deprivation not only influences political attitudes and collective action but also profoundly shapes individuals’ subjective evaluations of material environments (e.g., housing thermal comfort). When migrants perceive that their group (fellow South-to-North Water Diversion migrants) is disadvantaged relative to other reference groups, this sense of deprivation permeates their perception of specific material conditions, leading to systematic biases in subjective evaluations even when the objective physical environment is similar.
4.4. Indoor Thermal Comfort Evaluation Model for Resettlers of the SNWDP
Among the eight evaluated models, the predictive performances of aPMV (adaptive predicted mean vote) and aPTS (adaptive predicted thermal sensation) were unsatisfactory, which is inconsistent with the findings of most previous studies. In many studies involving general populations, aPMV and aPTS have been shown to be closest to actual thermal sensation, as they use an adaptive coefficient λ under feedback control theory to capture individual subjective adaptation differences. Their feedback on residents’ thermal adaptive behaviors is generally considered superior to that of ePMV and ePTS, which are associated with the expectancy factor “e” [46,47]. However, in the involuntary migrant sample of the present study, the opposite result was observed—ePMV and ePTS exhibited the smallest mean deviations across all three relocation distance groups, while aPMV and aPTS performed poorly in terms of fit. This reversal precisely highlights the distinctiveness of involuntary migrants in thermal comfort evaluation.
The expectancy factor “e” was originally proposed by Fanger et al. [46,47] for naturally ventilated buildings in warm climates. Its core inference is that if people have lived for a long time in warm environments without air conditioning, they develop a certain psychological tolerance to high temperatures. Even when the environment is “hot,” they regard it as their “lot,” leading to actual thermal sensation votes lower than the predicted values. The key mechanism underlying this phenomenon is psychological adaptation after losing the right to choose. The situation of involuntary migrants is highly similar to this: their housing choices are extremely limited; they passively accept government-arranged resettlement, have no alternatives, and feel powerless. The social stigma of “migrant identity” gives rise to a strong sense of loss of control over the new environment, prompting them to develop a “resigned acceptance” psychological defense strategy—even if the indoor thermal environment is not comfortable, they may report a relatively acceptable thermal sensation to reduce cognitive dissonance. Consequently, under the influence of psychosocial factors, there exists a “perceptual bias” in thermal comfort: the gap between the objective physical environment and subjective evaluation is systematically compressed.
The aPMV and aPTS [48] models are based on an adaptive coefficient λ, which implicitly assumes that residents can improve their environment through active feedback (e.g., opening/closing windows, adjusting air conditioning, adding or removing clothing) and adjust their thermal expectations accordingly. This “active feedback” pattern may hold for voluntary migrants or the general population, but it is difficult to apply to involuntary migrants. Because migrants lack a perceived sense of control over their housing and environment, they rarely engage in active, conscious feedback behaviors; instead, they cope with discomfort primarily through passively lowering their expectations. Therefore, the “active feedback” pathway underlying aPMV and aPTS appears to be ineffective in the sample of this study, whereas the “passive expectation adjustment” pathway characterized by ePMV and ePTS aligns highly with the actual psychological processes of the migrants.
Based on the above analysis, we recommend prioritizing the use of the ePMV or ePTS models [46,47] over traditional PMV/PTS or aPMV/aPTS when evaluating indoor thermal comfort for similar involuntary migrant populations. If conditions permit, incorporating a brief relative deprivation scale (e.g., RD1–RD3 used in this study) into post-occupancy evaluations can further improve predictive accuracy, as relative deprivation significantly moderates migrants’ expectation levels and perceptual biases. This finding not only provides a basis for tool selection in thermal environment assessments for resettlement areas of the SNWDP but also offers methodological references for thermal comfort studies in other involuntary resettlement scenarios, such as large-scale hydraulic projects, ecological migration, and poverty alleviation relocation.
4.5. Implications for the Sustainable Development of the Human Settlement Environment in Resettlement Areas of the SNWDP
Given the strong preference for a cool environment and the wider comfort zone observed among long-distance migrants (Group C), a uniform design standard should not be applied to all resettlement houses. For Group C, who relocated across climate zones, priority should be given to enhancing cross-ventilation design, installing shading components and movable external shading to facilitate passive cooling, while also providing a combination of fans and low-energy air conditioners to avoid increased energy consumption solely from relying on high-performance active cooling. For short-distance migrants (Group A), their traditional behavioral habits should be respected, and the design of resettlement housing should balance ventilation with privacy.
For medium- and long-distance migrants, the impact of relative deprivation on thermal comfort even exceeds that of physical environmental factors. Therefore, policy interventions should focus on the following issues: first, transparent communication—providing clear information about housing allocation can help reduce uncertainty and distrust; second, post-resettlement support—livelihood training, social integration programs, and community activities can help migrants rebuild their social networks and mitigate the negative effects of horizontal comparisons; third, participation mechanisms—regular feedback mechanisms that allow migrants to voice their opinions on housing quality can help restore their sense of control. After years of practice in China’s reservoir resettlement areas, the approach has shifted from “emphasizing relocation while neglecting resettlement” through passive compensation (“blood transfusion”) to supporting migrants’ integration into the construction of resettlement areas through active capacity-building (“blood manufacturing”) [63]. The findings of this study further confirm that material resettlement alone is insufficient; psychological adaptation must also be addressed. In this study, the relative deprivation effect was significantly stronger among medium- and long-distance migrants than among short-distance migrants, partly due to the greater degree of disruption to their social networks. Therefore, resettlement policies should prioritize “nearby resettlement” to preserve existing social networks to the greatest extent possible.
The differences in adaptive behaviors across groups indicate that a single indoor environment control strategy cannot meet diverse needs. Adjustable personalized environmental terminals (e.g., adjustable fans, local cooling devices) should be promoted to grant migrants greater control over their environment—this not only improves thermal comfort but also aids in the reconstruction of psychological belonging.
When evaluating indoor thermal comfort for involuntary migrants, it is recommended to use ePMV or ePTS models rather than aPMV or traditional PMV/PTS. If conditions permit, incorporating a brief relative deprivation scale into post-occupancy evaluations can help identify high-risk groups in need of psychological intervention.
5. Conclusions
This study focused on resettlers of the South-to-North Water Diversion Project in China, comparing their indoor thermal comfort characteristics under three different relocation modes. The research analyzed thermal benchmarks, adaptive behaviors, the influence of relative deprivation, and evaluation models, with the main findings as follows:
- (1)
- Relocation distance significantly affects the summer indoor thermal benchmarks of resettlers. The thermal neutral temperature of short-distance resettlers (Group A, within the same county, 24.97 °C) was very close to that of non-relocated residents in the water source area (25.15 °C). The neutral temperatures increased successively for medium-distance resettlers (Group B, within the same prefecture-level city, 25.51 °C) and long-distance resettlers (Group C, within the same province, 25.84 °C). Sensitivity to temperature changes increased with relocation distance. Moreover, the greater the relocation distance, the wider the summer thermal comfort range, and the more pronounced the preference for a cooler environment.
- (2)
- Thermal adaptive behavior patterns differed significantly across relocation modes. Short-distance resettlers retained the passive adjustment habits of their original places of residence (e.g., using electric fans, reducing clothing). Long-distance resettlers shifted substantially toward active mechanical cooling, primarily air conditioners, while their original region-specific behaviors gradually disappeared. Medium-distance resettlers exhibited a transitional state.
- (3)
- There was no significant correlation between indoor thermal comfort and relative deprivation for short-distance resettlers (within the same county). However, for medium-distance (within the same city) and long-distance (within the same province) resettlers, indoor thermal comfort was significantly correlated with relative deprivation. The influence of relative deprivation even exceeded that of the physical environment. Among the deprivation dimensions, horizontal deprivation—arising from comparisons with other resettlers sharing the same migrant status—showed the strongest correlation with indoor thermal comfort.
- (4)
- The expectancy-factor-corrected thermal comfort models (ePMV and ePTS) are the most suitable for evaluating the indoor thermal comfort of involuntary resettlers. The traditional PMV and PTS models systematically overestimated thermal sensation in all groups, while the adaptive model aPMV showed poor predictive performance. By incorporating an overall expectancy factor, ePMV and ePTS effectively corrected the perceptual bias caused by psychological adaptation and constrained behaviors among involuntary resettlers. Their regression slopes were closest to those of the measured TSV, and they exhibited the smallest average deviation.
Author Contributions
Conceptualization, S.L. and F.Z.; methodology, D.Y. and J.Z.; software, F.Z.; validation, S.L. and J.Z.; formal analysis, D.Y. and S.L.; investigation, S.L., D.Y. and J.Z.; resources, S.L., D.Y. and J.Z.; data curation, D.Y. and S.L.; writing—original draft preparation, S.L. and D.Y.; writing—review and editing, S.L., D.Y., F.Z. and B.W.; visualization, D.Y. and F.Z.; supervision, B.W. and J.Z.; project administration, J.Z.; funding acquisition, B.W., D.Y. and J.Z. All authors have read and agreed to the published version of the manuscript.
Funding
The research is supported by National Natural Science Foundation of China (52478065) and Key Research & Development and Promotion Project of Henan Province (252102320315).
Institutional Review Board Statement
The study was conducted in accordance with the Declaration of Helsinki, and approved by the Institutional Review Board of Architecture College, Nanyang Institute of Technology (Approval number: NYISTIRB 2025-019, 19 May 2025).
Informed Consent Statement
Informed consent was obtained from all subjects involved in the study. Written informed consent has been obtained from the patients to publish this paper.
Data Availability Statement
The original contributions presented in this study are included in the article. Further inquiries can be directed to the corresponding authors.
Acknowledgments
The authors would address appreciation to the Resettlement Area Village Committee and participant villagers for their support and cooperation in this research.
Conflicts of Interest
The authors declare no conflicts of interest.
References
- UNHCR. Global Trends: Forced Displacement in 2024; United Nations High Commissioner for Refugees: Geneva, Switzerland, 2025; Available online: https://digitallibrary.un.org/record/4087821 (accessed on 31 May 2026).
- Bartolome, L.J.; de Wet, C.; Mander, H.; Nagaraj, V.K. Displacement, Resettlement, Rehabilitation, Reparation, and Development (WCD Thematic Review I.3); World Commission on Dams: Cape Town, South Africa, 2000. [Google Scholar]
- Cernea, M.M. For a new economics of resettlement: A sociological critique of the compensation principle. Int. Soc. Sci. J. 2003, 55, 37–46. [Google Scholar] [CrossRef] [Scilit]
- Yan, D.; Zhao, J.X.; Chen, R.; Wang, B. Evaluation and Optimization Strategies of the Living Environment in One Resettlement Area of the South-to-North Water Diversion Project. Sustainability 2025, 17, 202. [Google Scholar] [CrossRef] [Scilit]
- Yan, D.; Fang, L.S.; Wang, B. Analysisand Optimization Strategies of Indoor Thermal Environment in the Resettlement Area of the South-to-north Water Diversion Project—A Case Study of Yunyu New Village, Nanyang. Build. Sci. 2025, 2, 100–109. [Google Scholar]
- Wang, Z.; Li, W.; Qi, J. Evaluation and Strategic Response of Sustainable Livelihood Level of Farmers in Ecological Resettlement Area of the Upper Yellow River—A Case Study of Liujiaxia Reservoir Area, Gansu Province. Int. J. Environ. Res. Public Health 2022, 19, 16718. [Google Scholar] [CrossRef] [Scilit] [PubMed]
- Duan, Y.; Chen, S.; Zeng, Y.; Wang, X. Factors That Influence the Livelihood Resilience of Flood Control Project Resettlers: Evidence from the Lower Yellow River, China. Sustainability 2023, 15, 2671. [Google Scholar] [CrossRef] [Scilit]
- Liu, Y.; Dong, Y.; Song, C.; Shi, Y.; Wang, Y.; Liu, J. Dynamic process of behavioral adaptation of migrants with different thermal experiences: A long-term follow-up field survey. Energy Build. 2020, 207, 109605. [Google Scholar] [CrossRef] [Scilit]
- Dong, Y.; Shi, Y.; Liu, Y.F.; Rupp, R.F.; Toftum, J. Perceptive and physiological adaptation of migrants with different thermal experiences: A long-term climate chamber experiment. Build. Environ. 2022, 211, 10872. [Google Scholar] [CrossRef] [Scilit]
- Ji, W.J.; Luo, M.H.; Cao, B.; Zhu, Y.X. Influences of long-term thermal experience on thermal comfort evaluations and exploration of thermal adaption. Heat. Vent. Air Cond. 2018, 48, 78–82. [Google Scholar]
- ASHRAE 55-2020; Thermal Environmental Conditions for Human Occupancy. American Society of Heating, Ventilating and Air-Conditioning Engineers: Atlanta, GA, USA, 2020.
- Brahim, A.; Ali, H.; Zghoul, A.; Jaradat, S. Mood state and human evaluation of the thermal environment using virtual settings. Indoor Built Environ. 2021, 30, 70–86. [Google Scholar]
- Li, P.; Zhao, X.; Gao, N.; Luo, M.; Shi, X. Influencing factors of long-term thermal comfort in office buildings. Build. Simul. 2024, 17, 2043–2061. [Google Scholar] [CrossRef] [Scilit]
- Lam, C.K.; Tapper, N. Visitors’ perception of thermal comfort during extreme heat events at the Royal Botanic Garden Melbourne. Int. J. Biometeorol. 2018, 6, 97–112. [Google Scholar] [CrossRef] [Scilit] [PubMed]
- Rutty, M.; Scott, D. Bioclimatic comfort and the thermal perceptions and preferences of beach tourists. Int. J. Biometeorol. 2015, 59, 37–45. [Google Scholar] [CrossRef] [Scilit]
- Elnabawi, M.H.; Hamza, N.; Dudek, S. Thermal perception of outdoor urban spaces in the hot arid region of Cairo, Egypt. Sustain. Cities Soc. 2016, 22, 136–145. [Google Scholar] [CrossRef] [Scilit]
- Johansson, E.; Yahia, M.W.; Arroyo, I.; Bengs, C. Outdoor thermal comfort in public space in warm-humid Guayaquil, Ecuador. Int. J. Biometeorol. 2018, 62, 387–399. [Google Scholar] [CrossRef] [Scilit]
- Shooshtarian, S.; Ridley, I. The effect of individual and social environments on the users thermal perceptions of educational urban precincts. Sustain. Cities Soc. 2016, 26, 119–133. [Google Scholar] [CrossRef] [Scilit]
- Galindo, T.; Hermida, M.A. Effects of thermophysiological and non-thermal factors on outdoor thermal perceptions: The Tomebamba Riverbanks case. Build. Environ. 2018, 138, 235–249. [Google Scholar] [CrossRef] [Scilit]
- Mummendey, A.; Kessler, T.; Mielke, R. Strategies to cope with negative social identity: Predictions by social identity theory and relative deprivation theory. J. Personal. Soc. Psychol. 1999, 76, 229–249. [Google Scholar] [CrossRef]
- Kunst, J.R.; Obaidi, M. Understanding violent extremism in the 21st century: The (re) emerging role of relative deprivation. Curr. Opin. Psychol. 2020, 35, 55–59. [Google Scholar] [CrossRef] [Scilit] [PubMed]
- Xiong, M.; Ye, Y.D. Relative Deprivation: Concept, Measurement, Influencing Factors and Effects. Adv. Psychol. Sci. 2016, 24, 438–453. [Google Scholar] [CrossRef] [Scilit]
- de la Sablonnière, R.; Taylor, D.M.; Perozzo, C.; Sadykova, N. Reconceptualizing relative deprivation in the context of dramatic social change: The challenge confronting the people of Kyrgyzstan. Eur. J. Soc. Psychol. 2009, 39, 325–345. [Google Scholar] [CrossRef] [Scilit]
- Grant, P.R. The protest intentions of skilled immigrants with credentialing problems: A test of a model integrating relative deprivation theory with social identity theory. Br. J. Soc. Psychol. 2008, 47, 687–705. [Google Scholar] [CrossRef] [Scilit]
- Lamb, D.; Banerjee, R. It’s not great, but it could be worse! Immigrant job quality in Canada through the lens of relative deprivation theory. J. Econ. Soc. 2025, 64, 299–317. [Google Scholar] [CrossRef] [Scilit]
- Xia, Y.; Ma, Z. Relative deprivation, social exclusion, and quality of life among Chinese internal migrants. Public Health 2020, 186, 129–136. [Google Scholar] [CrossRef] [Scilit]
- Meuleman, B.; Abts, K.; Schmidt, P. Economic conditions, group relative deprivation and ethnic threat perceptions: A cross-national perspective. J. Ethn. Migr. Stud. 2020, 46, 593–611. [Google Scholar] [CrossRef] [Scilit]
- Yao, R.; Zhang, S.; Du, C.; Schweiker, M.; Hodder, S.; Olesen, B.W.; Toftum, J.; D’AMbrosio, F.R.; Gebhardt, H.; Zhou, S.; et al. Evolution and performance analysis of adaptive thermal comfort models—A comprehensive literature review. Build. Environ. 2022, 217, 109020. [Google Scholar] [CrossRef] [Scilit]
- ISO 7730; Ergonomics of the Thermal Environment—Analytical Determination and Interpretation of Thermal Comfort Using Calculation of the PMV and PPD Indices and Local Thermal Comfort Criteria. International Standard Organization: Geneva, Switzerland, 2005.
- Ji, W.J.; Zhu, Y.X.; Du, H.; Cao, B.; Lian, Z.W.; Geng, Y.; Liu, S.L.; Xiong, J.Y.; Yang, C.Z. Interpretation of standard effective temperature (SET) and explorations on its modification and development. Build. Environ. 2022, 210, 108714. [Google Scholar] [CrossRef] [Scilit]
- Schweiker, M.; Wagner, A. A framework for an adaptive thermal heat balance model (ATHB). Build. Environ. 2015, 94, 252–262. [Google Scholar] [CrossRef] [Scilit]
- Cheung, T.; Schiavon, S.; Parkinson, T.; Li, P.; Brager, G. Analysis of the accuracy on PMV-PPD model using the ASHRAE Global Thermal Comfort Database II. Build. Environ. 2019, 153, 205–217. [Google Scholar] [CrossRef] [Scilit]
- Kim, J.; Schiavon, S.; Brager, G. Personal comfort models—A new paradigm in thermal comfort for occupant-centric environmental control. Build. Environ. 2018, 132, 114–124. [Google Scholar] [CrossRef] [Scilit]
- Hoof, J.V. Forty years of Fanger’s model of thermal comfort: Comfort for all? Indoor Air 2008, 18, 182–201. [Google Scholar] [CrossRef] [Scilit]
- de Dear, R.J.; Brager, G.S. Developing an adaptive model of thermal comfort and preference. ASHRAE Trans. 1998, 104, 145–167. [Google Scholar]
- Nicol, J.F.; Humphreys, M.A. Adaptive thermal comfort and sustainable thermal standards for buildings. Energy Build. 2002, 34, 563–572. [Google Scholar] [CrossRef] [Scilit]
- Mui, K.W.H.; Chan, W.T.D. Adaptive comfort temperature model of air-conditioned building in Hong Kong. Build. Environ. 2003, 38, 837–852. [Google Scholar] [CrossRef] [Scilit]
- Ye, X.J.; Zhou, Z.P.; Lian, Z.W.; Liu, H.M.; Li, C.Z.; Liu, Y.M. Field study of a thermal environment and adaptive model in Shanghai. Indoor Air 2006, 16, 320–326. [Google Scholar] [CrossRef] [Scilit] [PubMed]
- Yang, L.; Zheng, W.; Mao, Y.; Lam, J.C.; Zhai, Y. Thermal adaptive models in built environment and its energy implications in Eastern China. Energy Procedia 2015, 75, 1413–1418. [Google Scholar] [CrossRef] [Scilit]
- Thapa, S. Thermal comfort in high altitude Himalayan residential houses in Darjeeling, India-An adaptive approach. Indoor Built Environ. 2020, 29, 84–100. [Google Scholar] [CrossRef] [Scilit]
- Williamson, T.; Daniel, L. A new adaptive thermal comfort model for homes in temperate climates of Australia. Energy Build. 2020, 210, 109728. [Google Scholar] [CrossRef] [Scilit]
- de Dear, R.J.; Brager, G. The adaptive model of thermal comfort and energy conservation in the built environment. Int. J. Biometeorol. 2001, 45, 100–108. [Google Scholar] [CrossRef] [Scilit]
- Cao, W.; Wu, W.D. The optimization method for adaptive thermal comfort models in naturally ventilated buildings. J. Human. Settl. West. China 2025, 40, 148–154. [Google Scholar]
- GB/T 50785—2012; Evaluation Standard for Indoor Thermal and Humid Environment of Civil Buildings. China Architecture & Building Press: Beijing, China, 2012.
- Carlucci, S.; Bai, L.; de Dear, R.; Yang, L. Review of adaptive thermal comfort models in built environmental regulatory documents. Build. Environ. 2018, 137, 73–89. [Google Scholar] [CrossRef] [Scilit]
- Fanger, P.O.; Toftum, J. Extension of the PMV model to non-air-conditioned buildings in warm climates. Energy Build. 2002, 34, 533–536. [Google Scholar] [CrossRef] [Scilit]
- Yao, R.; Li, B.; Liu, J. A theoretical adaptive model of thermal comfort—Adaptive predicted mean vote (aPMV). Build. Environ. 2009, 44, 2089–2096. [Google Scholar] [CrossRef] [Scilit]
- Orosa, J.A.; Oliveira, A.C. A new thermal comfort approach comparing adaptive and PMV models. Renew. Energy 2011, 36, 951–956. [Google Scholar] [CrossRef] [Scilit]
- Schiavon, S.; Hoyt, T.; Piccioli, A. Web application for thermal comfort visualization and calculation according to ASHRAE Standard 55. Build. Simul. 2014, 7, 321–334. [Google Scholar] [CrossRef] [Scilit]
- Gao, J.; Wang, Y.; Wargocki, P. Comparative analysis of modified PMV models and SET models to predict human thermal sensation in naturally ventilated buildings. Build. Environ. 2015, 92, 200–208. [Google Scholar] [CrossRef] [Scilit]
- ISO 7726:1998; Thermal Environment—Instruments and Method for Measuring Physical Quantities. ISO: Geneva, Switzerland, 1998.
- Gagge, A.P.; Fobelets, A.P.; Berglund, L. A standard predictive index of human response to the thermal environment. ASHRAE Trans. 1986, 92, 709–731. [Google Scholar]
- Schweiker, M.; Wagner, A. Influences on the predictive performance of thermal sensation indices. Build. Res. Inf. 2016, 45, 745–758. [Google Scholar] [CrossRef] [Scilit]
- Humphreys, M.A.; Nicol, J.F. The validity of ISO-PMV for predicting comfort votes in every-day thermal environments. Energy Build. 2002, 34, 667–684. [Google Scholar] [CrossRef] [Scilit]
- Cohen, P.; Cohen, S.; Shashua-Bar, L.; Tanny, J.; Potchter, O. Outdoor thermal perception and adaptation of immigrants from cold climates to hot arid climate. Build. Environ. 2023, 243, 110631. [Google Scholar] [CrossRef] [Scilit]
- Zhao, H.; Ji, W.; Deng, S.; Wang, Z.; Liu, S. Thermal comfort and adaptation in the temperate zone and the effects of thermal history: A tracking survey field study. Energy Build. 2024, 324, 114895. [Google Scholar] [CrossRef] [Scilit]
- Wang, F.; Li, Z.; Xu, H.; Yan, J. “Locality—Adaptation” Research of Hydropower Resettlement Communities in the Jinsha River Basin: A Case Study of Ludila Hydropower Station. Landsc. Archit. 2025, 32, 12–20. [Google Scholar] [CrossRef] [Scilit]
- Bui, T.M.H.; Schreinemachers, P.; Berger, T. Hydropower development in Vietnam: Involuntary resettlement and factors enabling rehabilitation. Land Use Policy 2013, 31, 536–544. [Google Scholar] [CrossRef] [Scilit]
- Lilly, K.J.; Sibley, C.G.; Osborne, D. Asymmetries in responses to group-based relative deprivation: The moderating effects of group status on endorsement of right-wing ideology. Group Process. Intergroup Relat. 2024, 27, 823–844. [Google Scholar] [CrossRef] [Scilit]
- Gheorghiu, M.; Pehrson, S.; Christ, O. Status, relative deprivation, and moral devaluation of immigrants. Br. J. Soc. Psychol. 2022, 61, 510–531. [Google Scholar] [CrossRef] [Scilit]
- Moscatelli, S.; Albarello, F.; Prati, F.; Rubini, M. Badly off or better off than them? The impact of relative deprivation and relative gratification on intergroup discrimination. J. Personal. Soc. Psychol. 2014, 107, 248. [Google Scholar] [CrossRef] [Scilit]
- Pavlović, T.; Čorkalo Biruški, D. Egoistic and fraternalistic relative deprivation in the prediction of support for political violence and violent intentions. J. Deradicalization 2022, 30, 68–108. [Google Scholar]
- Huang, L.; Huang, J.; Wang, W. The Sustainable Development Assessment of Reservoir Resettlement Based on a BP Neural Network. Int. J. Environ. Res. Public Health 2018, 15, 146. [Google Scholar] [CrossRef] [Scilit]

Disclaimer/Publisher’s Note: The statements, opinions and data contained in all publications are solely those of the individual author(s) and contributor(s) and not of MDPI and/or the editor(s). MDPI and/or the editor(s) disclaim responsibility for any injury to people or property resulting from any ideas, methods, instructions or products referred to in the content. |
© 2026 by the authors. Licensee MDPI, Basel, Switzerland. This article is an open access article distributed under the terms and conditions of the Creative Commons Attribution (CC BY) license.