Article

Hydrogeochemically Driven Settlement and Stress–Strain Response in Pile Foundations

by
Zmagul Nuguzhinov
1,
Assel Mukhamejanova
2,*,
Nagima Zhumadilova
3,*,
Rafael Sungatullin
4 and
Timoth Mkilima
5
1
Kazakhstan Multidisciplinary Institute of Reconstruction and Development (KazMIRR), Karaganda Technical University Named After Abylkas Saginov, 56 Nursultan Nazarbayev Ave., Karaganda 100027, Kazakhstan
2
Department of Architecture and Design, Karaganda Technical University Named After Abylkas Saginov, 56 Nursultan Nazarbayev Ave., Karaganda 100027, Kazakhstan
3
Department of Geology and Exploration of Mineral Deposits, Karaganda Technical University Named After Abylkas Saginov, 56 Nursultan Nazarbayev Ave., Karaganda 100027, Kazakhstan
4
Department of Regional Geology and Mineral Resources, Institute of Geology and Petroleum Technologies, Kazan (Volga Region) Federal University, 18 Kremlyovskaya St., Kazan 420008, Russia
5
Department of Environmental Engineering and Management, The University of Dodoma, 1 Benjamin Mkapa Road, Iyumbu, Dodoma 41218, Tanzania
*
Authors to whom correspondence should be addressed.
Buildings 2026, 16(11), 2178; https://doi.org/10.3390/buildings16112178
Submission received: 28 February 2026 / Revised: 7 April 2026 / Accepted: 23 April 2026 / Published: 29 May 2026
(This article belongs to the Section Building Structures)

Abstract

To accurately assess foundation behaviour under urban conditions, it is essential to integrate geotechnical analysis with continuously evolving hydrogeological parameters. In rapidly developing cities such as Astana, long-term fluctuations in seasonal groundwater levels, salinity dynamics, and changes in soil permeability significantly influence stress–strain behaviour and structural settlement. This study employs multiple software tools, supported by detailed hydrogeological monitoring, laboratory testing, and integrated numerical simulations, to analyse the development of settlement and stress–strain characteristics for both the synagogue and the Independence Palace. The results show that between 2002 and 2020, groundwater salinity at the synagogue site increased from 1.10 g/L to 3.39 g/L, accompanied by a 23% rise in soil permeability. At the Independence Palace site, salinity reached 2.01 g/L, with an 18% increase in permeability. Numerical simulations conducted using GEO5, PLAXIS 2D, and LIRA SAPR revealed consistent trends but varying magnitudes of subsidence. PLAXIS 2D predicted settlement values approximately 15–25% higher than GEO5, while LIRA SAPR produced estimates 10–20% lower. Among the models, GEO5 demonstrated the closest agreement with field observations. The Independence Palace underwent relatively rapid stabilisation due to an effective drainage system, with consolidation occurring over approximately 100–150 days. In contrast, the synagogue experienced prolonged settlement over a period of 10–15 years, driven by high groundwater saturation and river recharge. These findings confirm that hydrochemical evolution plays a critical role in governing soil permeability. Consequently, cross-validation using multiple modelling platforms is essential, and long-term settlement assessments in complex hydrogeological environments must account for time-dependent changes in permeability.

1. Introduction

Due to the inherent heterogeneity, compressibility, and hydraulic sensitivity of river sediments, urban development in alluvial plains faces serious geotechnical challenges [1,2,3]. Alluvial sequences are typically composed of alternating layers of clay, loam, fine sand, and gravel lenses, each with a different hydraulic conductivity, compressibility index, and consolidation response [4]. In areas where groundwater conditions are influenced by the dynamics of nearby surface water bodies [5], soil hydraulic behavior is constantly influenced by factors such as fluctuations in pore water levels, increased salinity due to evaporation and concentration, and changes in ionic composition due to mixing with river water or anthropogenic tributaries [6,7]. Astana is located in such a hydrologically active alluvial plain, where the Akbulak and Yeshir rivers create seasonally varying hydraulic gradients that can reach tens of meters underground [8]. These conditions directly affect the effective stress, pore pressure dissipation, permeability, creep rate, and structural characteristics of deep foundations, especially those with large foundation areas and high performance requirements [9].
Despite these complexities, conventional methods for predicting subsidence tend to idealise permeability and hydrochemical conditions as static parameters expressed in fixed coefficients rather than time-varying variables. Widely used design models, including the classical Terzaghi-Bio consolidation theory, empirical stiffness-settlement relationships, and the elastic half-space approximation, assume that the pore water chemistry is homogeneous and the groundwater level remains stable throughout the life of the structure [10]. However, long-term monitoring data in urban environments affected by rivers typically indicate that increased river flow can raise the groundwater level by several meters, while urban and construction wastewater discharges can lower the groundwater level by several meters, as well as significantly increase the concentrations of sulfates, chlorides, and total dissolved solids [11,12]. These changes can change water bodies from non-corrosive to highly corrosive, accelerate the chemical degradation of concrete, and alter soil microstructure through flocculation and dispersion processes. Therefore, settlement predictions based on static pore water properties [13] may underestimate or distort long-term consolidation, secondary compression, and stress redistribution.
Advanced numerical tools such as PLAXIS 2D, GEO5 and LIRA-SAPR can simulate complex hydraulic-mechanical interactions, but they are rarely combined with long-term field data reflecting groundwater fluctuations. They can also simulate creeping clay using a soft soil creep model [14,15] and considering fully coupled flow and deformation behavior, but accuracy depends heavily on a properly specified permeability function that reflects the true effect of salinity. In GEO5 [16], hydrochemical changes are taken into account on their own unless the permeability is manually updated according to an external calibration. LIRA-SAPR [17,18] is primarily a structural analysis tool for evaluating stress–strain states; however, it does not simulate time-dependent consolidation. In practice, consolidation effects are incorporated through a sequential coupling approach, whereby time-dependent settlements and pore pressure dissipation are first computed using external geotechnical analyses (e.g., based on Terzaghi’s Consolidation Theory) and subsequently introduced into LIRA-SAPR as prescribed nodal displacements or equivalent load cases at discrete stages to represent their impact on the structural response. As a result, comparisons of results obtained using different software tools under the same hydrogeological conditions are still rare, and little is known about the reliability of settlement predictions at different pore water pressures.
Currently, there is still a great lack of quantitative assessments of the long-term effects of groundwater changes on the mechanical behaviour of mixed alluvial soils. In the case of loams and clays with different plasticities, the quantitative relationship between increased groundwater salinity and changes in permeability is still unclear. Published k(C) functions [19,20,21] are usually based on short-term laboratory experiments that do not take into account long-term ion accumulation or structural rearrangement of the soil structure. Similarly, the interaction between hardening caused by drainage and softening caused by addition in different structures within the same hydraulic basin is rarely documented. The lack of long-term building-scale studies limits our understanding of how hydrochemical transformations (e.g., sulfate enrichment or chloride accumulation) affect the compressibility index, creep ratio, and effective stress path. Furthermore, without rigorous numerical validation across different platforms, it is difficult to distinguish real physical phenomena from soft-body modelling errors caused by differences in the formulation of constitutive equations, implementation of boundary conditions, or consolidation algorithms [22].
This study fills a gap in this field by integrating twenty years of hydrogeological observation data, detailed geotechnical engineering property analysis, and a rigorous multi-program numerical modelling strategy to investigate two large public buildings on pile foundations in Astana, the synagogue and the Palace of Independence. The study quantifies the long-term evolution of groundwater level and hydrochemical properties, establishes a calibrated permeability and salinity function that reflects realistic groundwater conditions, and evaluates soil-structure interactions under various hydraulic, mechanical, and chemical conditions.

2. Materials and Methods

2.1. Study Site and Observation History

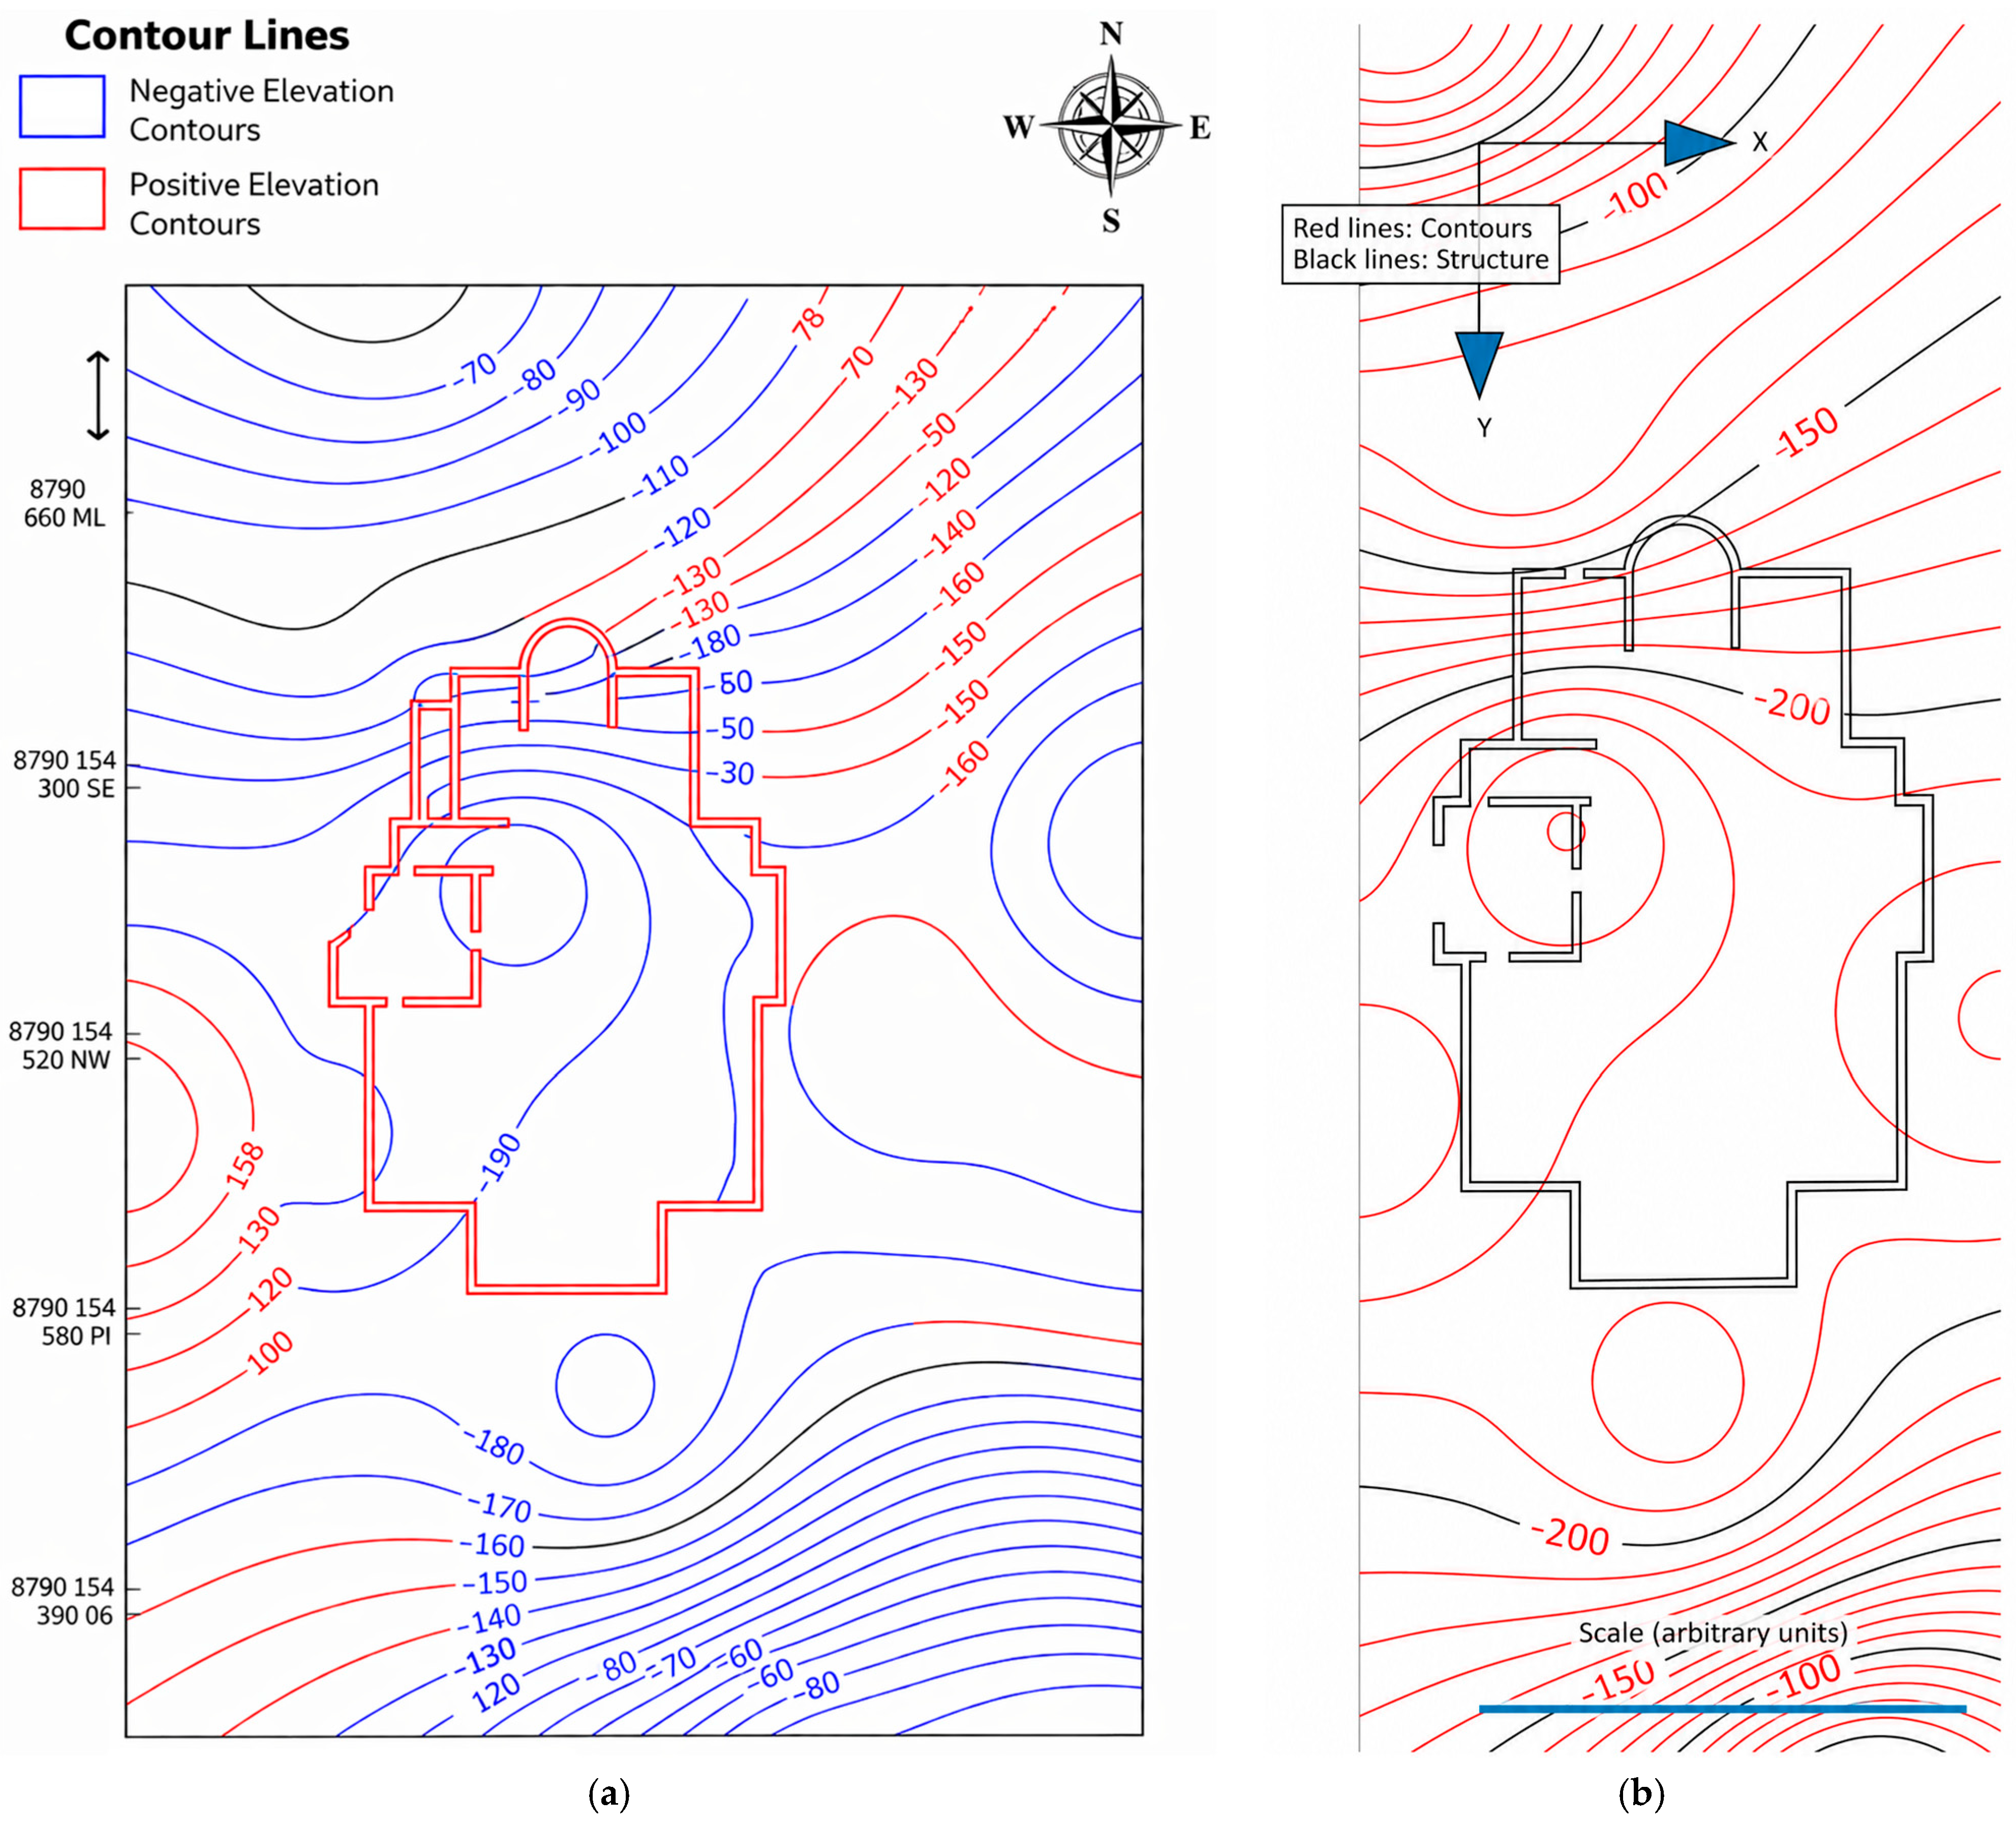
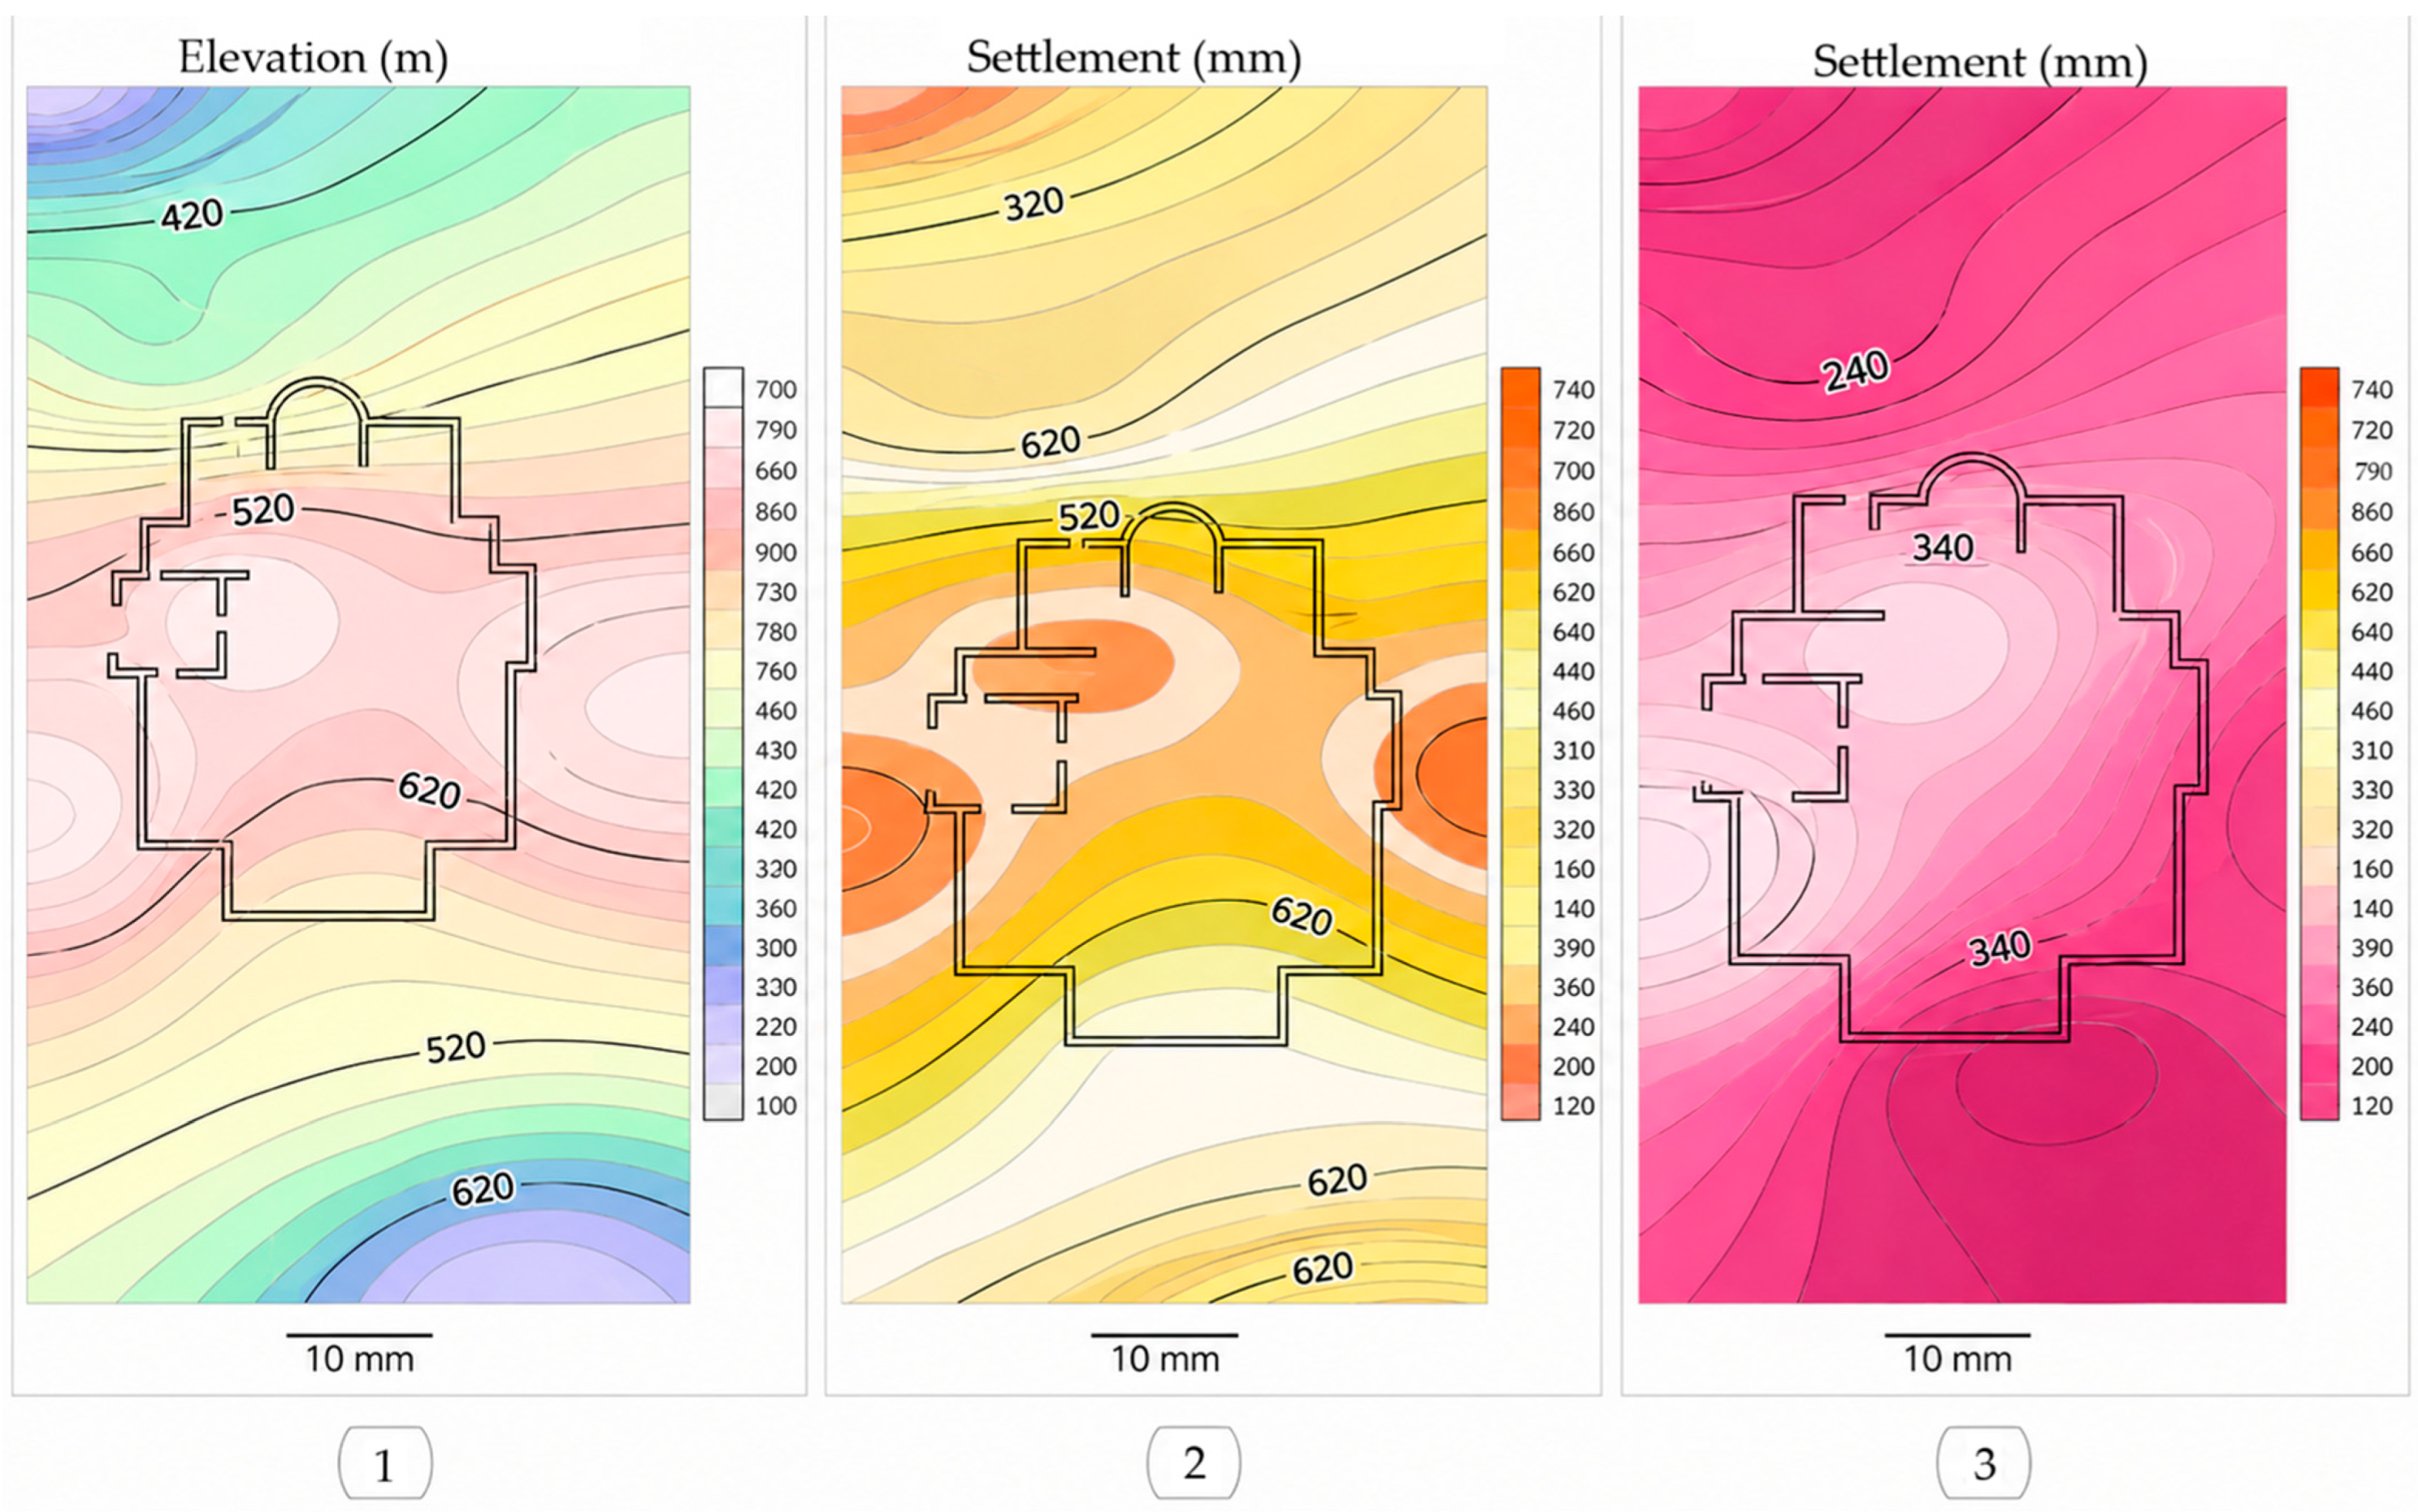
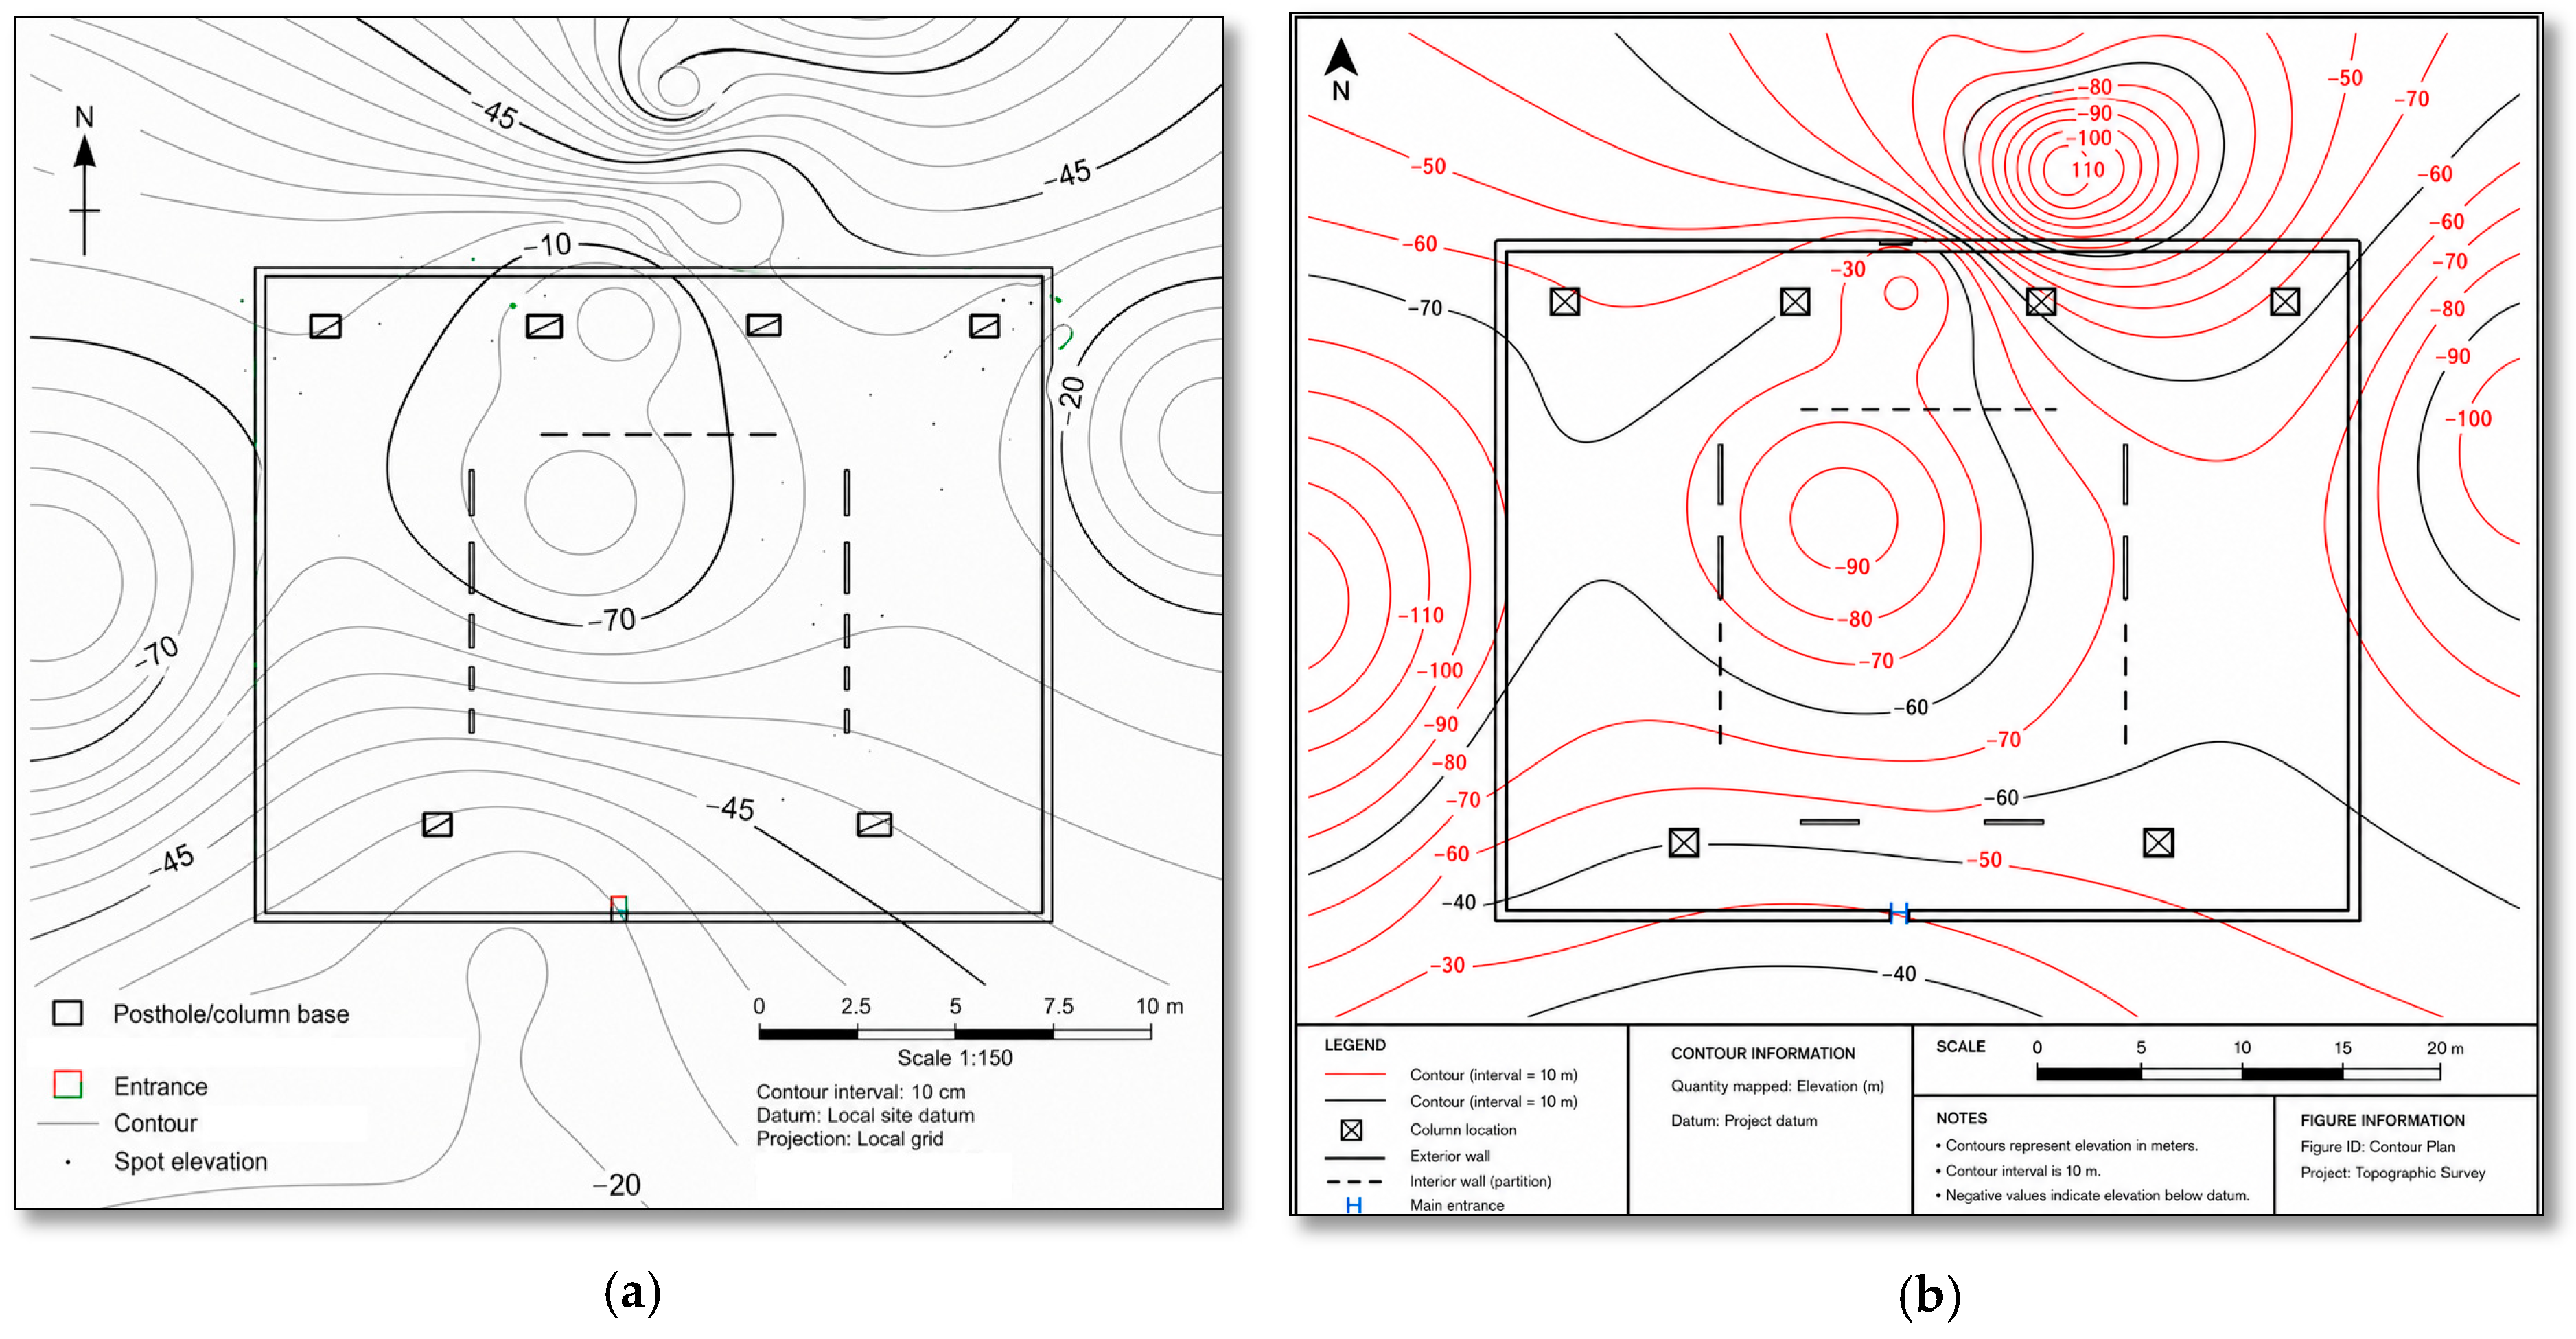
The study area was confined to two sites: the synagogue and the Independence Palace. Both are situated within a densely urbanised zone, surrounded by buildings of varying ages and located near rivers and their tributaries on the left bank of the Akbulak River. Quaternary formations containing groundwater play a key role in runoff, filtration processes, and long-term ground subsidence. The condition and structural appearance of the buildings were documented using a range of photographic techniques, including ground-based imaging and aerial photography. The geographic positions of the sites were established within the local street network. Boreholes and piezometers installed at each location provided detailed data on vertical stratification, groundwater table depth, seasonal fluctuations, and chemical composition. These instruments also enabled monitoring of variations in soil composition, clay layer thickness, hydraulic conductivity anisotropy, and annual water level changes. These field investigations support the development of a comprehensive hydrogeological model of the sites, enabling a detailed analysis of ground subsidence and its variation beneath each structure (Figure 1).
Table 1 lists the building and structural characteristics used in geotechnical engineering modelling, including building use, height, plan dimensions, foundation type and effective depth, as well as design features that affect load transfer to the pile foundation. These parameters provide the basis for defining load cases and deriving equivalent strip or line loads used in the numerical model.
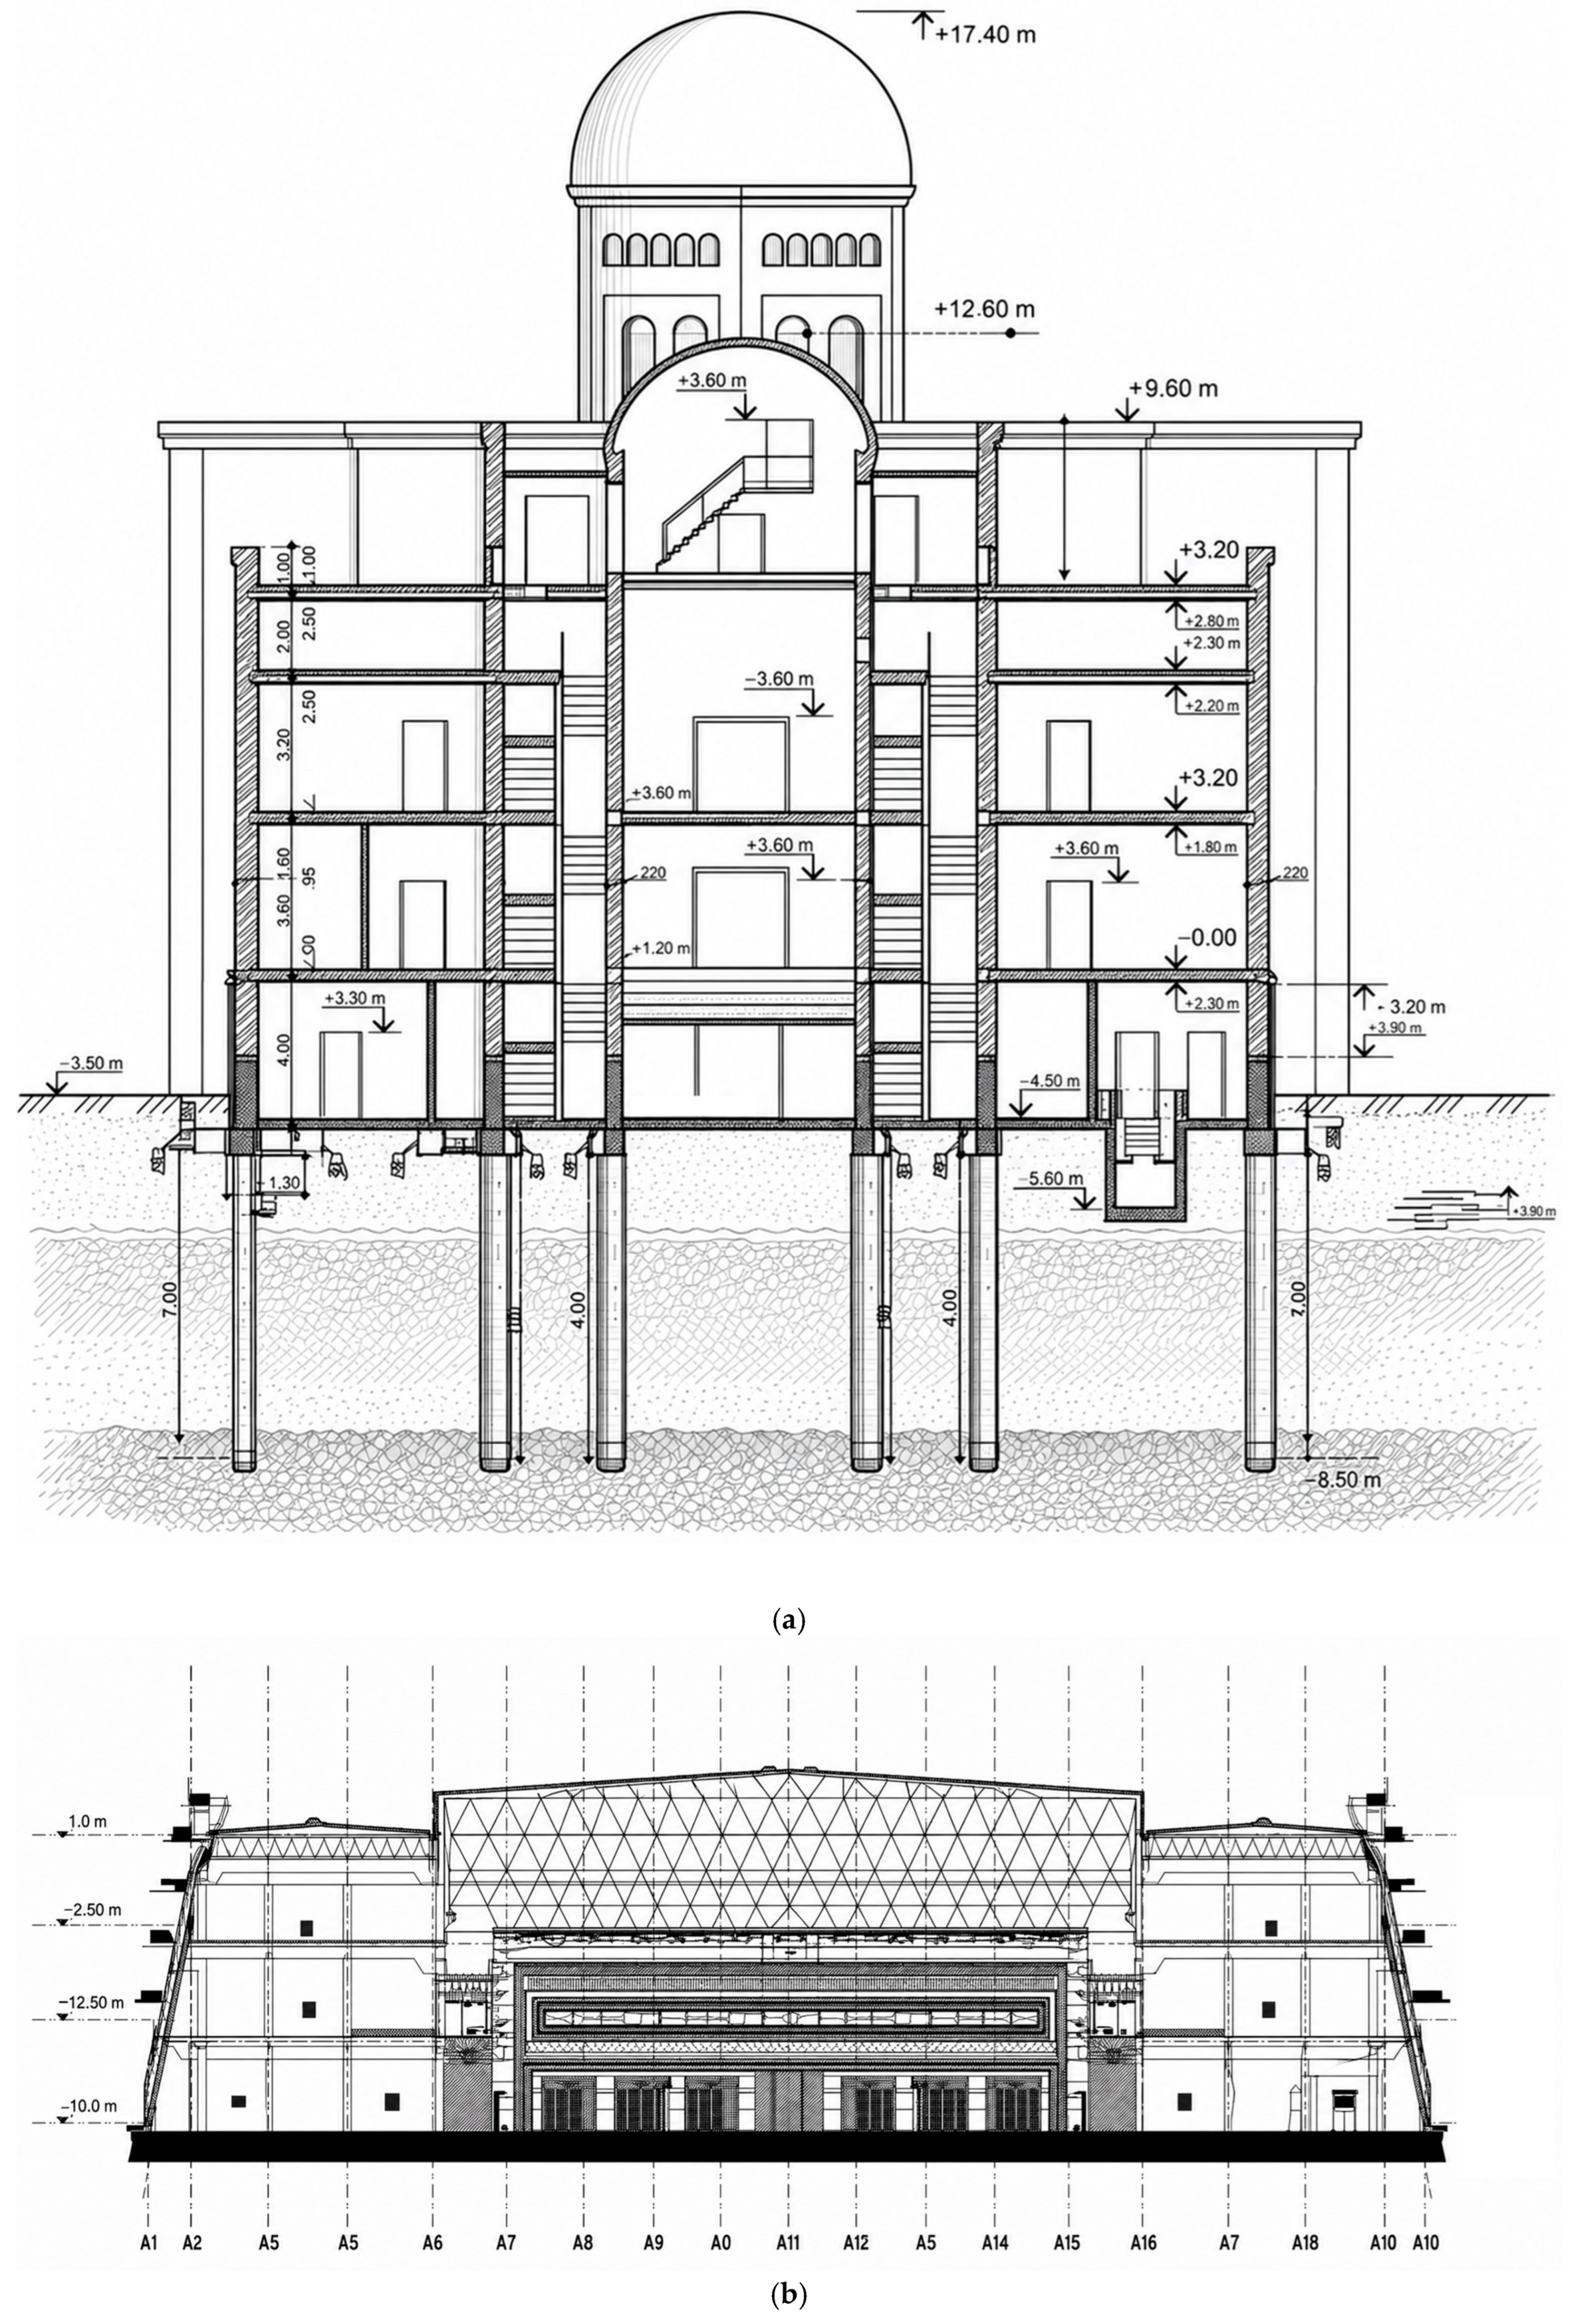
The geographical coordinates of each borehole and piezometer were recorded in the WGS84 system with a positioning accuracy of ±0.5 m, ensuring precise spatial definition of all monitoring points as well as the boundary conditions used in the digital model. Each monitoring borehole is documented with its installation depth, filter interval, filter material characteristics, installation date, and any subsequent maintenance or re-inspection activities. This level of detail enables reliable reconstruction of temporal changes in groundwater pressure and hydrochemical composition. The foundation systems of the structures are also described in detail. The synagogue, completed in 2007, is supported by a reinforced concrete pile foundation system arranged in a 1.8 m grid. It utilises driven piles with a diameter of 400 mm and lengths ranging from 9 to 11 m, connected by reinforced concrete pile caps to form a rigid strip lattice framework. The Independence Palace, also constructed in 2007, is founded on a system of large pile caps with grid spacing ranging from 2.5 to 6.0 m. The piles extend to depths of 12 to 16 m, depending on local geological conditions, and are interconnected by a robust structural system incorporating a steel plate grid to control differential settlement.

2.2. Geological and Geotechnical Engineering Dataset

At both sites, the subsurface profile consists of loam, sandy loam, sand, clay, and gravel, with layer thicknesses varying across the foundation areas. Table 2 presents the complete stratigraphic profile along with the key geotechnical properties used in the modelling, including density, elastic modulus, cohesion, angle of internal friction, and permeability. These parameters were derived from laboratory testing and field investigations conducted as part of the engineering geological survey and form the basis for the soil characterisation used in settlement and stress–strain analyses (Table 2).
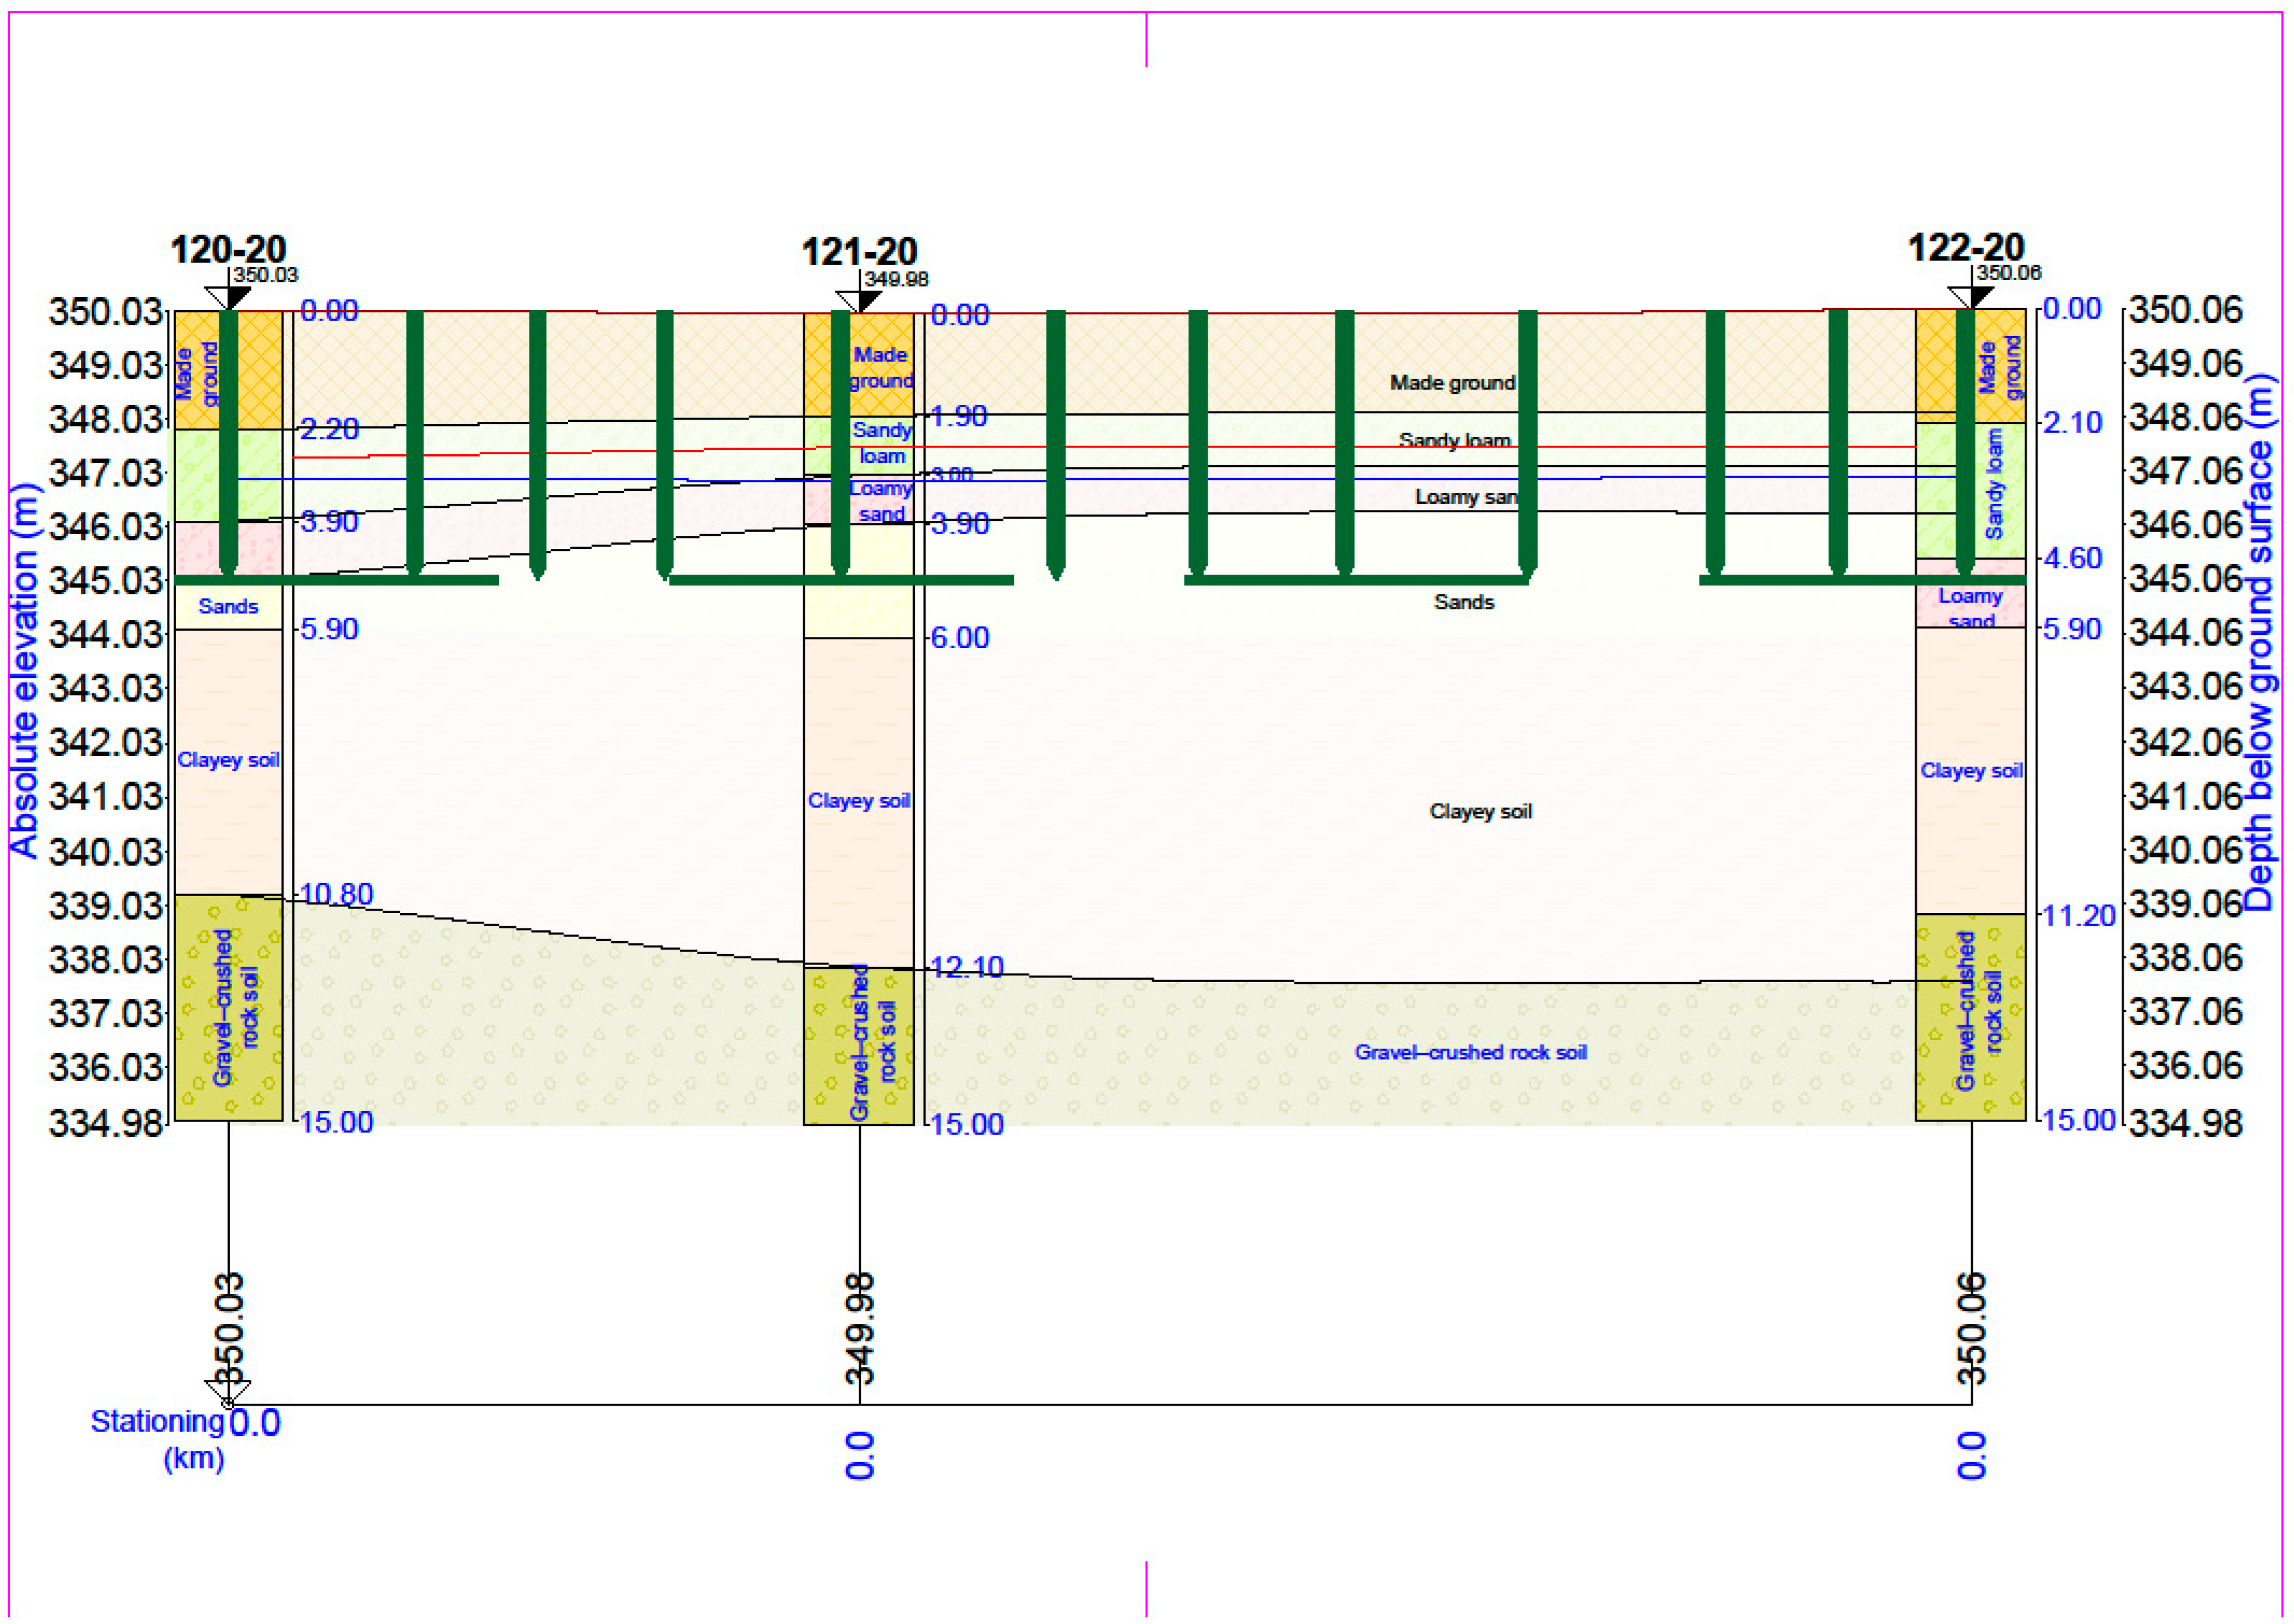
Figure 2 shows the geological profile of the synagogue site. This profile reveals the spatial distribution, depth range, relative thickness, and location of groundwater at the time of the study. This figure provides important visual clues to understanding how clay-rich soil layers affect consolidation processes, how sandy soil layers facilitate drainage, and how hydrostratigraphy determines the stress distribution under the structure.
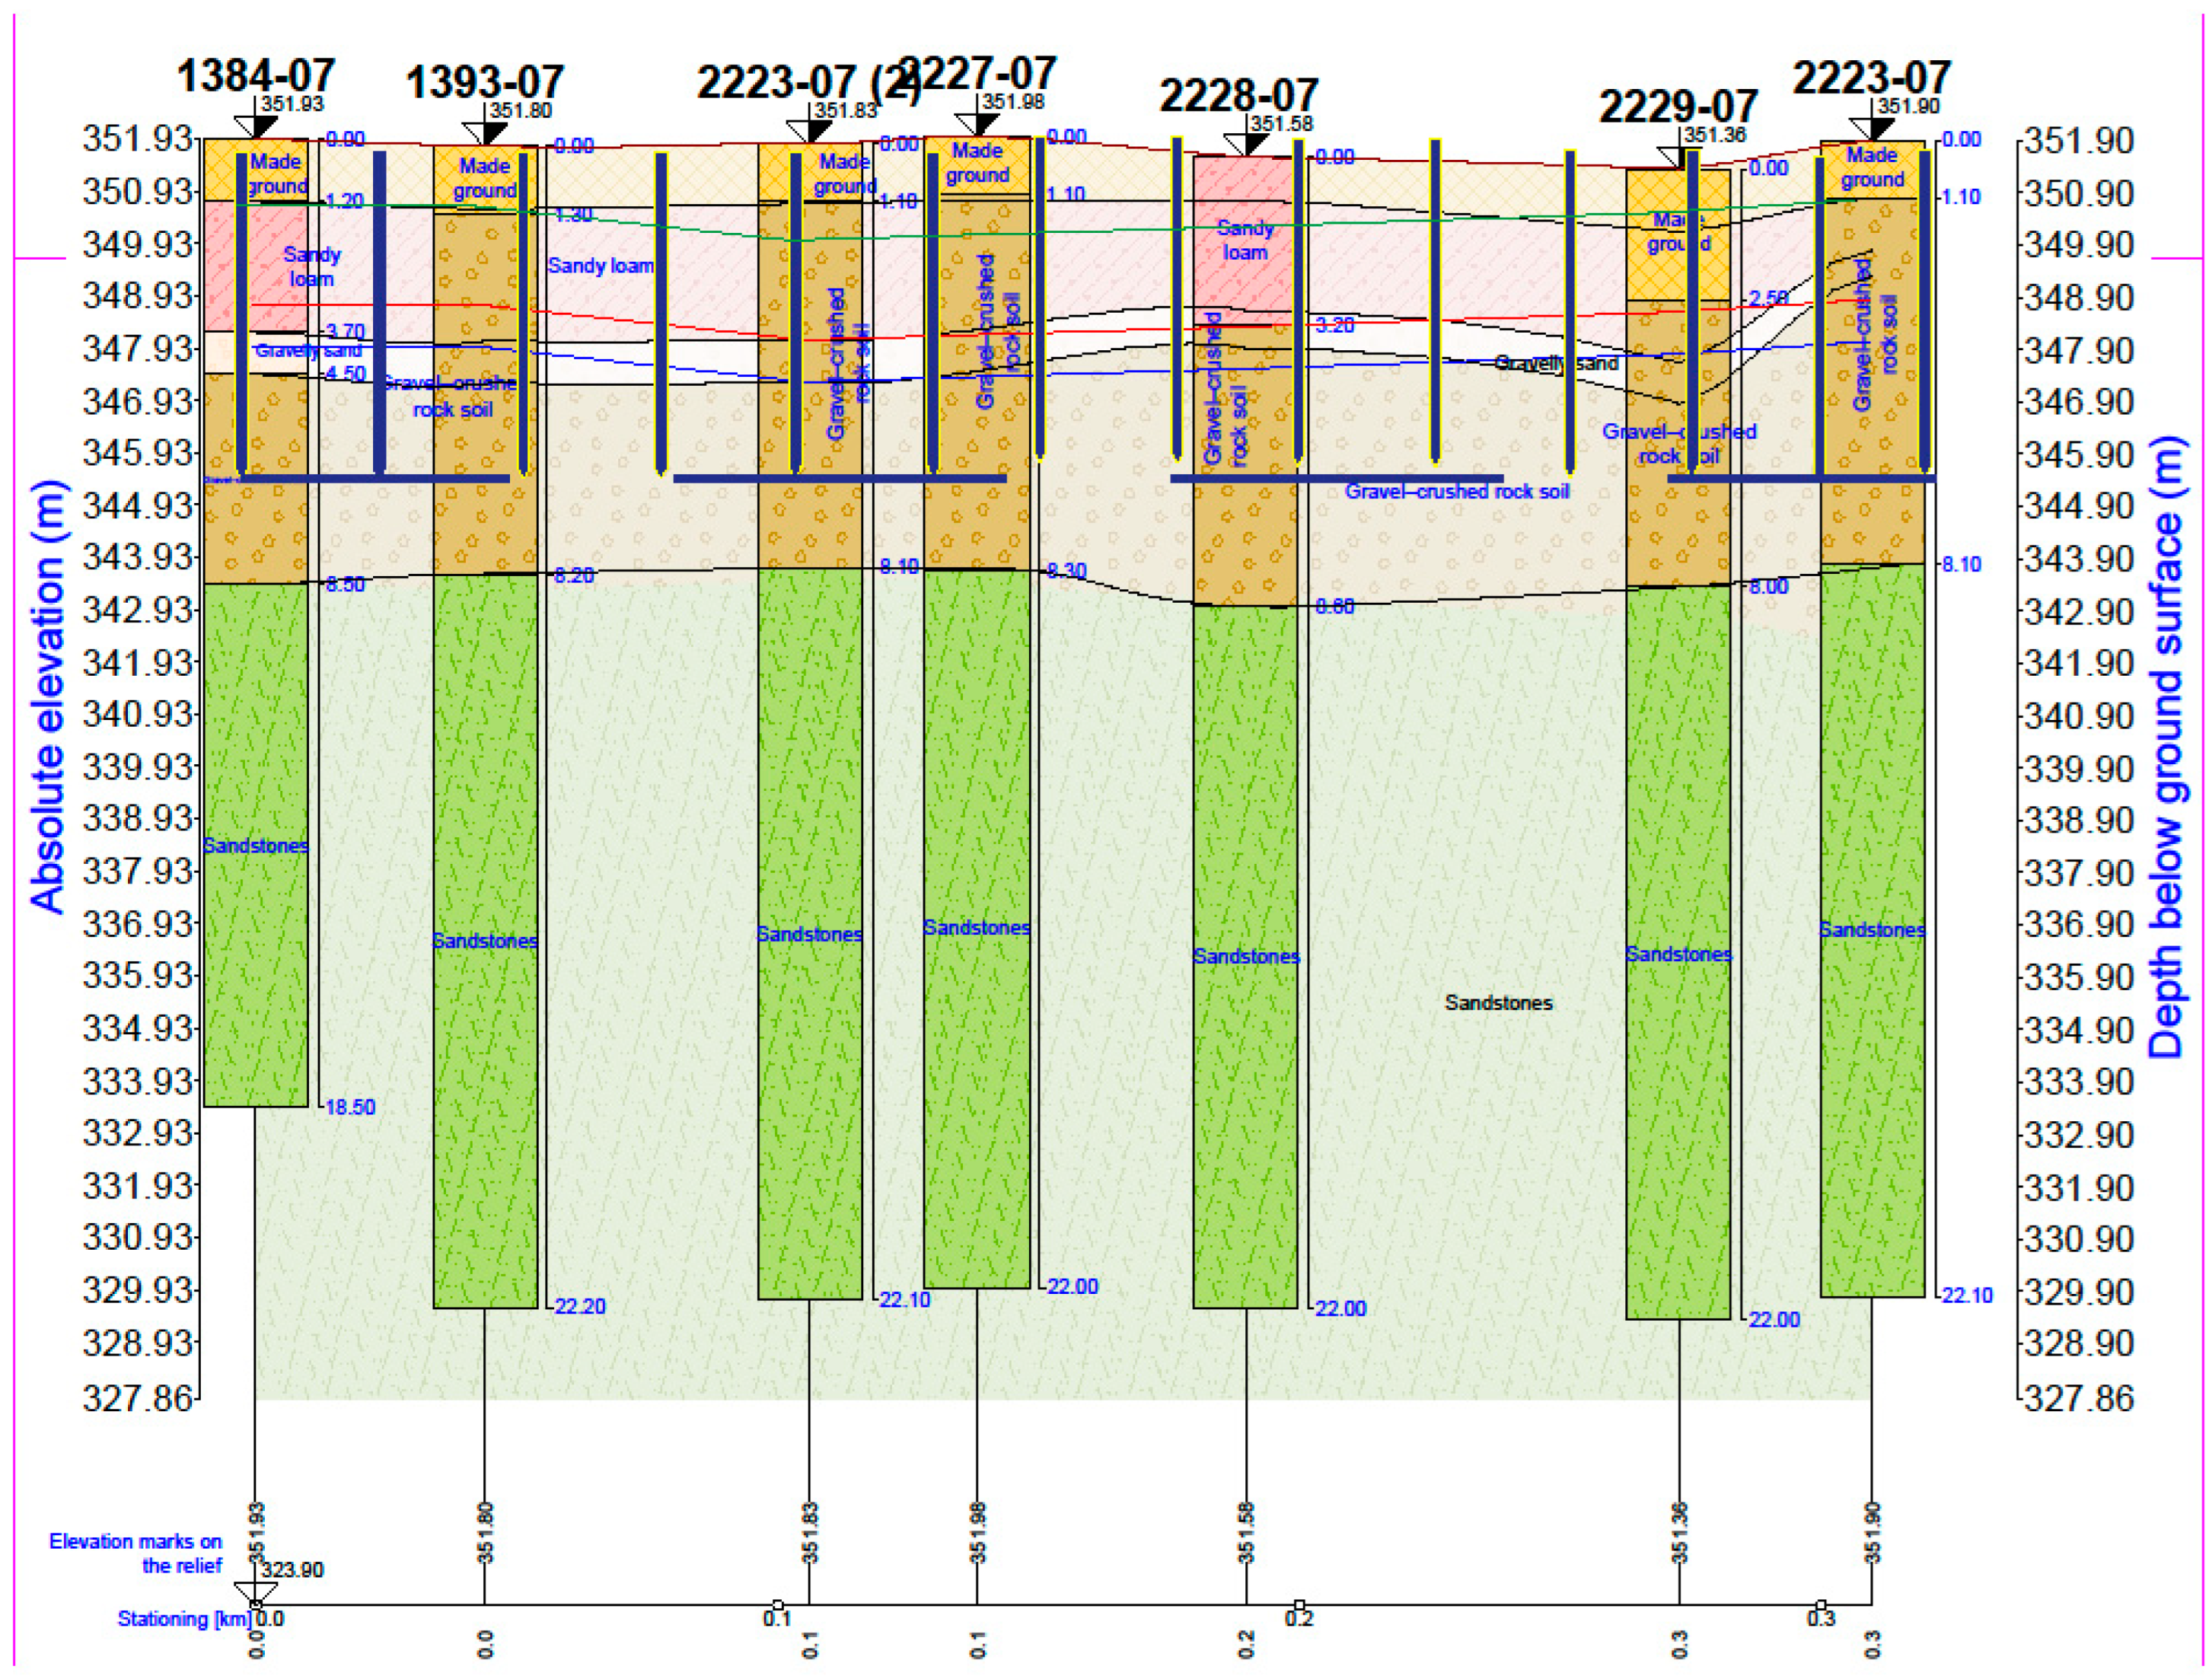
Figure 3 shows the geological profile of the Independence Palace. This profile shows the alternation of loam and sandy loam layers, the area of some drainage zones and the groundwater conditions resulting from the long-term fall in the groundwater table. This profile clearly explains the rapid consolidation and differential stiffness phenomena observed in the subsequent settlement analysis, which should be analysed together with the geotechnical engineering parameters listed in Table 2.
In order to ensure full reproducibility of the geotechnical engineering data, the study involved 27 boreholes and 14 cone penetration tests at two construction sites. The borehole depths ranged from 12 to 42 m, and the cone penetration depths ranged from 18 to 25 m, depending on the presence of obstacles. All parameters and mechanical properties presented in this article are derived from laboratory tests conducted according to internationally recognised standards, including ASTM D2487 [23] (soil classification), ASTM D4318 [24] (Atterberg limit), ASTM D698/D1557 [25] (compaction behaviour), ASTM D2435 [26] (consolidation test), and ASTM D3080-23 direct shear test [27]. In order to ensure consistency across Europe in the determination of particle size analysis methods, density, permeability, triaxial strength and stiffness, additional testing was carried out in accordance with EN ISO 17892-3: 2015 [28].

2.3. Hydrogeological and Hydrochemical Monitoring

Long-term groundwater level and chemical composition monitoring was carried out at both study sites to identify seasonal, interannual and multiannual hydrogeological trends. The monitoring program included continuous and periodic monitoring of groundwater level, hydrochemical evolution and soil-water interaction processes. Groundwater level was measured using a dedicated piezometric network, and the data provided form the basis for interpreting hydraulic gradients, recharge effects and drainage conditions discussed in the following sections. Table 3 presents all groundwater level measurements used in the analysis. Groundwater depth is expressed as depth relative to the surface, with larger positive values indicating greater depth.
Groundwater levels were measured two to four times per piezometer using Solinst pressure sensor data loggers. Measurements were made using Levelogger Edge and In-Situ LevelTROLL series instruments with an accuracy of ±0.3 cm. Manual readings were confirmed quarterly using an electrical contact flowmeter to control instrument drift. Water chemistry samples were taken every three to six months using a low-flow purge method to minimise mechanical stress. Samples were collected in pre-acidified polyethene containers and analysed according to standard procedures: pH was determined according to ISO 10523 [29], major cations and iron according to ISO 11885 (ICP-OES) [30], and chlorides and sulfates according to ISO 10304-1 [31] (ion chromatography). The detection limits for Cl, SO42− and Fe were 0.01 mg/L, 0.02 mg/L and 0.005 mg/L, respectively. Total mineralisation was determined by a gravimetric method in accordance with the GOST 18164-72 [32] standard with an accuracy of ±0.02 g/L. Before each measurement, all instruments were regularly calibrated using certified multi-ionic standard solutions. The uncertainty associated with salinity measurements (TDS and dissolved ion concentrations) reflects the combined instrumental precision and analytical error from laboratory procedures. Electrical conductivity measurements used for TDS estimation were obtained using calibrated probes with an accuracy of ±1.5%, while ion concentrations measured by ion chromatography and ICP-OES exhibit analytical uncertainties ranging from ±2% to ±3%, depending on the ion species. The reported ± values in the manuscript represent the propagated uncertainty combining instrument precision, calibration drift correction, and replicate sample variability, based on repeated measurements of field and laboratory samples under identical conditions.

2.4. Structure of Numerical Modelling

This study used an integrated numerical model combining GEO5, PLAXIS 2D and LIRA-SAPR software to evaluate the soil-structure interaction in the synagogue and the Independence Palace, simulating settlement, consolidation and stress–strain response of the structure. GEO5 examined one-dimensional and two-dimensional consolidation processes, taking into account staged loading and pore water pressure dissipation; PLAXIS 2D modelled the coupled hydraulic-mechanical processes, including groundwater dynamics, creep and deformation of clay and loam layers; LIRA-SAPR assessed the response of the superstructure to soil settlement and stress redistribution. All analyses were performed using validated software versions (GEO5 2022, PLAXIS 2D CONNECT Edition V22, LIRA-SAPR 2021 R3), and material parameters were obtained from laboratory and field tests, including unit weight, modulus of deformation, Poisson’s ratio, angle of internal friction, cohesion, permeability, consolidation coefficient, compression index, overcompaction coefficient and creep coefficient. The numerical domain is at least five times the width of the horizontal foundation and three times the width of the vertical foundation. The pile foundations are represented using integrated elements in PLAXIS and equivalent stiffness lines in GEO5. The mesh under the foundation is refined to account for steep stress gradients and pore water pressure, and consists of 40,000 to 55,000 elements. A finite element mesh refinement study was conducted to ensure numerical stability and mesh-independent settlement predictions. The global mesh was generated using 15-node triangular elements with local refinement introduced beneath pile caps and foundation contact zones, where stress gradients are highest. In these critical regions, the baseline element size was approximately 0.50 m for the synagogue model and 0.75 m for the Independence Palace model, while a coarser mesh of up to 2.0–3.0 m was used in far-field zones to reduce computational cost. To assess mesh convergence, a refined mesh was generated in which the minimum element size beneath pile caps was reduced by 50% (to 0.25 m for the synagogue and 0.375 m for the Independence Palace), while maintaining identical boundary conditions and constitutive parameters. The resulting comparison of total and differential settlement showed that refinement produced only minor changes in predicted response. The maximum variation in total settlement was less than 4% for the synagogue model and less than 3% for the Independence Palace model, while differential settlement changed by less than 5% in both cases. These differences indicate that the baseline mesh is sufficiently refined and that the numerical solution can be considered mesh independent for engineering interpretation.

2.5. Material Model and Parameters

All soil layers in the model were represented using constitutive parameters derived from laboratory and field investigations. Based on triaxial, oedometer (consolidation), and index tests, the parameter set included specific gravity, deformation modulus, Poisson’s ratio, angle of internal friction, effective cohesion, permeability coefficient, consolidation coefficient, compression index, secondary compression index, and creep coefficient. For fine-grained soils (clay and loam), the constitutive parameters used in the PLAXIS 2D Soft Soil and Soft Soil Creep models, namely the modified compression index (λ*), swelling index (κ*), and creep coefficient (μ*), were obtained directly from oedometer test results. The parameters λ* and κ* were determined from the slopes of the virgin compression and recompression lines in the void ratio logarithmic effective stress (e–logσ′) relationships, while the creep coefficient μ* was derived from the secondary compression phase under constant effective stress conditions. The preconsolidation pressure (σ′p) was interpreted using the Casagrande method applied to the consolidation curves and ranged from approximately 120–180 kPa for the synagogue clay deposits and 150–220 kPa for the soils underlying the Independence Palace, reflecting differences in stress history and overconsolidation ratios between the two sites. For the loam layer, an overconsolidation ratio was introduced where necessary based on the ratio between preconsolidation pressure and in situ effective stress. The clay layer beneath the synagogue was modelled using the PLAXIS 2D Soft Soil and Soft Soil Creep models to capture both plastic volumetric deformation and time-dependent creep behaviour, while the soils beneath the Independence Palace were assigned elastoplastic parameters consistent with their drainage conditions, lower long-term creep susceptibility, and more rapid consolidation characteristics. To ensure robustness of long-term predictions, a sensitivity analysis framework was implemented in which the creep coefficient μ* was varied within ±10% of its calibrated value while maintaining other parameters constant, allowing evaluation of the influence of time-dependent deformation on settlement behaviour and supporting the reliability of the selected parameter set.

2.6. Bandwidth Calibration (k(C))

Using measured groundwater chemical parameters and laboratory permeability data collected during the observation period, the permeability-salinity relationship k(C) was determined [33]. The permeability–salinity relationship, k(C), was established using paired groundwater hydrochemical data and laboratory-measured permeability values obtained during the monitoring period. Total dissolved solids (TDS) concentration (mg/L) was adopted as the primary proxy for salinity. Based on exploratory data analysis, an exponential decay model was found to best represent the observed relationship between hydraulic conductivity and salinity (Equation (1)). The baseline permeability k0 was determined separately for each soil layer by combining laboratory permeability tests and regression-based back-calibration from site-specific hydrochemical datasets. For sandy and gravelly layers, k0 was taken as the mean hydraulic conductivity measured directly from constant-head permeability tests on undisturbed or reconstituted samples. For fine-grained loam and clay layers, k0 was obtained from falling-head permeability tests and cross-validated against oedometer-derived consolidation coefficients using standard Terzaghi relationships. Where direct permeability measurements were limited, k0 was additionally refined as the intercept parameter of the calibrated k(C) regression corresponding to negligible salinity conditions, ensuring consistency between laboratory-derived hydraulic conductivity and field-observed hydrochemical behaviour for each stratigraphic unit.
k ( C ) = k 0 e x p ( α C )
where k(C) is the hydraulic conductivity (m/day), C is the TDS concentration (g/L), k 0 is the reference permeability at negligible salinity, and α is a fitting parameter describing the sensitivity of permeability to salinity.
The regression analysis was performed on datasets comprising n = 48 samples for the synagogue site and n = 52 samples for the Independence Palace site. The fitted parameters for the synagogue soils were k 0 = 1.32 × 10 3 m/day and α = 0.41   L /g, while for the palace soils k 0 = 1.08 × 10 3 m/day and α = 0.36   L /g. The coefficients of determination were R 2 = 0.87   (synagogue) and R 2 = 0.82   (palace), indicating a strong dependence of permeability on ionic strength. The mean squared errors (MSE) were 6.5 × 10 5 m/day and 1.1 × 10 4 m/day, respectively. All regression coefficients were statistically significant at the 95% confidence level. The 95% confidence intervals for the fitted parameters were as follows: for the synagogue dataset, k 0 = ( 1.21 1.43 ) × 10 3 m/day and α = 0.36 0.46   L /g; for the palace dataset, k 0 = ( 0.97 1.19 ) × 10 3 m/day and α = 0.31 0.42   L /g.
It should be noted that the adopted formulation assumes a unique, monotonic relationship between permeability and salinity and does not explicitly incorporate hysteresis effects associated with repeated wetting–drying cycles. This assumption is justified by the hydrogeological conditions of the study sites, where groundwater level variations are gradual and do not induce pronounced cyclic desaturation–resaturation processes in the fine-grained soils. A sensitivity analysis was performed by varying TDS concentrations within ±20% of the observed range. The results indicate that permeability variations were approximately ±12% for clay layers and ±18% for loam layers, reflecting the greater responsiveness of more permeable soils to changes in pore water chemistry. These results confirm that the calibrated k ( C ) function captures both the measured variability in groundwater composition and its influence on hydraulic conductivity with sufficient accuracy for predictive modelling.
The Boussinesq analytical solution was retained as a first-order reference for settlement under simplified homogeneous elastic half-space conditions, serving only as an order-of-magnitude benchmark to verify global stress distribution and settlement trends prior to the application of the fully coupled numerical model that explicitly accounts for layered stratigraphy, stress-dependent stiffness, and time-varying permeability, in accordance with standard geotechnical practice where closed-form solutions are used for preliminary validation rather than detailed prediction.

2.7. Mathematical Modelling

2.7.1. First Stage—Initial Compression

Before the pore pressure drops significantly, the soil undergoes elastic compression under its own gravity, a process that occurs almost instantaneously. During this time, the soil framework undergoes elastic deformation, the pore pressure remains constant, and the volume change is negligible. This can be expressed mathematically using Equation (2).
Δ V = 0 , u = c o n s t a n t
In this context, ΔV represents the change in soil volume (m3), and u represents the pore water pressure (kPa). Although the initial compression is small, it contributes to the overall settlement and marks the beginning of the subsequent consolidation phase. Assessing this phase is particularly important for sensitive or lightly loaded foundations, as even small elastic deformations can influence the initial stress distribution within the soil.

2.7.2. Second Stage—Initial Payment (Total)

The initial settlement stage reflects the dissipation of pore water pressure under load, which is the main component of the long-term settlement of saturated soil. The total initial settlement at any time t is determined by Equation (3).
S c ( t ) = S f U ( t )
In this case, S c ( t ) is the settlement (m), S f is the final initial settlement after full compaction (m), and U ( t ) is the degree of compaction (dimensionless). For a soil layer with a thickness of H under double drainage conditions, U ( t ) can be approximated by the sequential solution (Equation (4))
U ( t ) = 1 m = 0 8 π 2 ( 2 m + 1 ) 2 e x p ( 2 m + 1 ) 2 π 2 C v t 4 H 2
In this case, C v is the consolidation coefficient (m2/d), H is the length of the drainage path (m), and m is the level index. The final main settlement, S f , is calculated based on the soil compaction.

2.7.3. Third Stage—Secondary Subsidence (Creep)

After primary consolidation, the soil will continue to slowly deform due to creep under the influence of a constant effective stress; this process is called secondary settlement. In fine-grained soils (e.g., clay and loam), creep contributes particularly significantly to the long-term total settlement, and secondary settlement is therefore particularly important. Secondary settlement can be represented by Equation (5).
S s ( t ) = C α H l o g 10 t t p
In this context, S s ( t ) —secondary settlement (in metres), C α —secondary compression index (dimensionless), H—layer thickness (in metres), t—time since loading, and t p —duration of primary consolidation. The inclusion of this stage ensures that long-term deformation is taken into account and that the foundation settlement predictions for the coming decades are more consistent with actual design and maintenance plans.

2.8. Effective Stress, Pore Pressure and Hydraulic Conductivity

Long-term behaviour depends on the interaction of effective stress, pore pressure dissipation, and changes in hydraulic conductivity over time. Effective stress controls settlement by determining the deformation of the soil framework under load, while pore pressure during consolidation varies with drainage conditions and soil compressibility, the latter determined by researchers based on long-term pressure measurements. Soil microstructure and permeability change over time due to the evolution of pore water chemistry, especially salinity, which affects the soil microstructure. This model predicts primary and secondary settlement through interrelated processes, thus showing the behaviour of foundation soils under long-term hydraulic, mechanical, and hydrochemical changes.

2.9. Model Calibration and Validation

The numerical model was calibrated and validated using geodetic settlement measurements obtained from a network of benchmarks installed across both structures. A total of 38 benchmarks were used for the synagogue and 54 for the Independence Palace, with spatial distribution designed to ensure representative coverage of foundation behaviour, including edges, central zones, and principal load-bearing axes. This configuration enabled the assessment of both absolute settlement and differential deformation across each foundation system. Validation was carried out through comparison of simulated and observed settlement values at corresponding benchmark locations. In addition to point-wise error metrics such as root mean square error (RMSE), the validation framework included analysis of spatial settlement distribution, maximum differential settlement (ΔS_max), and corresponding deformation gradients derived from relative displacement over known horizontal distances. This approach ensures that the model performance is evaluated not only in terms of settlement magnitude but also in its ability to reproduce spatial variability and deformation patterns relevant to structural response. At the Synagogue site, cumulative vertical settlements ranged from 18 mm to 46 mm across monitoring points over the period 2002–2023, while at the Independence Palace site, settlements ranged from 25 mm to 72 mm over 2007–2023. The levelling measurements were conducted with an average accuracy of ±1.0–1.5 mm per survey epoch.

2.10. Sensitivity and Uncertainty Analysis

The sensitivity analysis aimed to assess the impact of uncertainty in geotechnical engineering parameters on settlement predictions. Permeability, stiffness, and creep were varied with respect to laboratory and field test values. Increasing permeability by 20% produced a reduction of 8–12% in predicted long-term settlement due to accelerated consolidation; conversely, decreasing permeability by 20% resulted in an increase in settlement of 10–15%. Changes in stiffness had more severe consequences: increasing the elastic modulus reduced settlement by as much as 22%, while decreasing it increased settlement by 30%. Changes in the creep coefficient resulted in changes in long-term settlement of about 10–18%, highlighting its significance for this particular site. The results from this sensitivity analysis are shown in another table that details the effect of each parameter on deposition. A parametric sensitivity analysis was conducted to evaluate the influence of key model parameters on predicted settlement response. Hydraulic conductivity (k) was varied by ±30%, salinity concentration (C) by ±20%, and representative soil layer thicknesses by ±15% relative to calibrated baseline values. The results indicate that settlement predictions are most sensitive to variations in permeability, followed by layer thickness, while salinity exerts an indirect influence through its role in the k(C) coupling relationship.

3. Results

3.1. Groundwater Level, Seasonal Dynamics and Hydrochemical Evolution

3.1.1. Changes in Groundwater Levels

The studies showed that long-term groundwater monitoring in the synagogue and Independence Palace areas reveals two different hydrological systems that have a significant impact on soil consolidation. Throughout the monitoring period, the groundwater level in the synagogue area has been rising steadily, indicating a continuous groundwater recharge despite limited drainage. The groundwater depth in 2002 ranged from 3.10 to 3.20 m, which corresponds to a water level of 345.90–346.20 m. The measurements showed that the groundwater level dropped by 1.00–2.10 m and reached 349.98–350.06 m, which corresponds to an increase in hydraulic pressure of approximately 4.08–4.16 m. This continuous rise in the groundwater level resulted in the clay layer being completely saturated, which reduced the effective stress and slowed down the primary and secondary consolidation processes. Meanwhile, the groundwater level in the Independence Palace area has been continuously falling due to reduced urban drainage, construction site drainage and natural groundwater recharge. In 2007, the groundwater level was 0.90–2.50 m (water level 350.55–351.71 m), and by 2023, it had risen to 5.00–5.10 m (water level 348.76–348.85 m), indicating a decrease in the water table of approximately 2.80–2.86 m. This decrease in groundwater level increased the effective stress in the supporting soil, increased soil stiffness and accelerated the consolidation process, so that the foundation reached a stable state. The monitoring results showed two different trends: the water level in the synagogue gradually rose, while in the palace it continued to decrease, according to a predetermined pattern (Figure 4). Mineralogical analysis of representative fine-grained soil samples was used to support the interpretation of hydrochemical mechanisms affecting permeability evolution. X-ray diffraction results indicated that the clay fraction is predominantly composed of illite and kaolinite, with minor quartz and feldspar, while swelling clay minerals such as smectite are present only in trace amounts (<5%). This mineralogical assemblage suggested low to moderate plasticity soils with limited double-layer expansion potential, meaning that changes in ionic strength primarily influenced particle aggregation and pore structure rather than swelling-induced volume change. Consequently, the observed permeability variations were consistent with flocculation-driven microstructural reorganisation in mixed loam–clay matrices under varying hydrochemical conditions.

3.1.2. Chemical Changes in Water

At both places, the chemical makeup of the groundwater varied a lot over time, which may have impacted soil behaviour, changes in permeability, and long-term settling. In the Synagogue area, salinity rose from 1.10 g/L to 3.39 g/L, meaning an increase of 208–209%; the sulfate level shot up from 360 mg/L to 1068 mg/L (nearly 197%); and chloride grew from 138 mg/L to 426 mg/L. These are changes that match more corrosive groundwater according to EN 206 standards [34]. This standard defines water as highly corrosive (XA3/XA4) when chloride exceeds 0.4 g/L or sulfate exceeds 1 g/L. Increased ion levels in clay and loam layers alter particle flocculation, structure, and adhesion between particles; this could change how fast concrete components set and consolidate, as well as their durability. The Independent Palace area showed less chemical change: mineralisation rose from 1.13 g/L to about 2.01 g/L (around a seventy-eight percent increase), with sulfate and chloride contents staying below the erosive limit set by EN206; meanwhile, pH values went between 7.6 and 8.7, slightly alkaline to moderately erosive conditions, which implied relatively small changes reflecting good drainage plus limited opportunities for alteration in soil structure. Table 4 lists the chemical composition and erosiveness of groundwater at both locations during monitoring time.

3.2. Trend of Permeability Coefficient Change and k(C) Correction

The permeability coefficients at both sites reflect the combined effects of groundwater salinity, soil structure, and long-term hydrodynamic changes. As salinity increases, the ionic strength of pore water modifies the soil microstructure, affecting the permeability of clay and silt deposits. Table 5 summarises this trend, presenting data including measured values at the Synagogue (2002 and 2020) and the Palace of Independence (2007 and 2023), as well as projected values for 2040. The data show that permeability is increasing at both sites, but the magnitude and rate of change differ due to the different hydrogeological conditions. At the Synagogue, the slow but steady increase in permeability is consistent with a rising groundwater level and the gradual enrichment of the soil’s chemical components. At the Palace of Independence, the marked increase in permeability is attributed to a falling groundwater level, increased effective stress, and partial aeration of the silt layer. These trends highlight the importance of incorporating the time-variable hydraulic conductivity function k(C) into numerical models to accurately simulate site-specific solidification and deposition patterns.
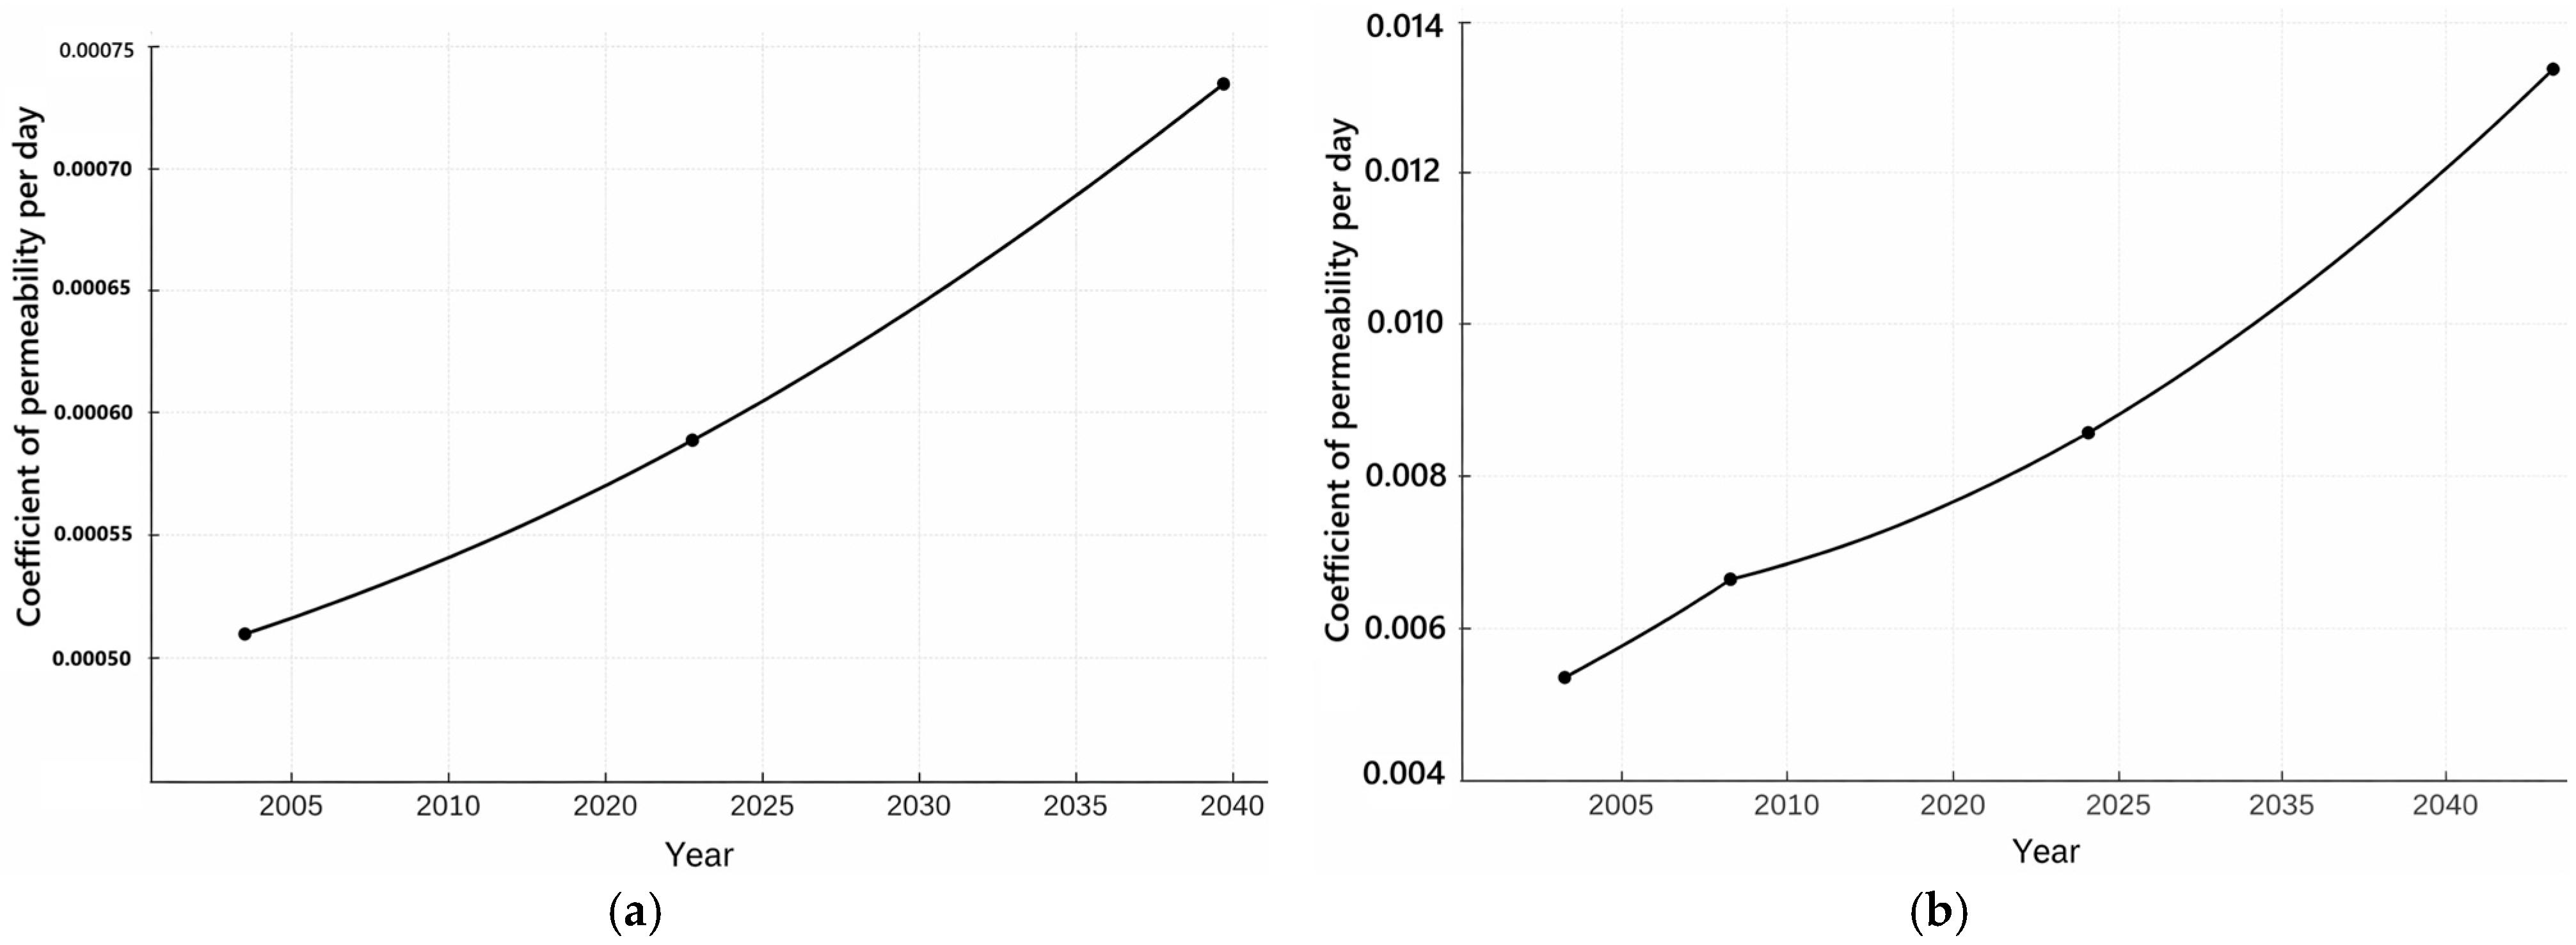
Figure 5 illustrates the calibration of the permeability coefficient as a function of salinity and shows the time trend of the predicted k(C) ratio. The synagogue curve exhibits a slight upward trend, indicating that permeability gradually increases with increasing groundwater salinity. This phenomenon reflects the gradual diffusion of ions in the clay matrix, which weakens intermolecular bonding forces, promotes dispersion, and ultimately increases hydraulic conductivity. The shortening curve shows a sharp rise over a shorter period, indicating that the silt is highly sensitive to rapid drainage and the associated structural changes. The sharp inflexion point of the calibration curve corresponds to a sudden drop in the groundwater level and the resulting increase in effective stress, which increases the permeability of the partially aerated silt. Therefore, this figure provides important visual evidence for the mechanism of permeability changes at both locations.

3.2.1. Permeability at the Synagogue

In the Synagogue area, the permeability of the clay layer gradually increased during the observation period, reflecting the continuous saturation of groundwater and more intense mineralisation. In 2002, the measured permeability was 0.00050 m/day, and by 2020 it increased to 0.0006145 m/day, i.e., an increase of approximately 22.9%. Based on the long-term mineralisation trends, the permeability is predicted to reach 0.000729 m/day by 2040, which means a total increase of approximately 45.8% compared to the initial level. These changes are closely related to the increase in groundwater mineralisation from 1.10 g/L to 5.93 g/L. The long-term saturation has enhanced the interaction between pore water and soil, gradually changing the microstructure of the clay and thus increasing its permeability. Increased pore pressure, increased salinity, and ongoing chemical changes have all contributed to slow but steady changes in permeability in this area.

3.2.2. Permeability at the Palace

The dynamic changes in permeability at the Palace of Independence differ significantly from those occurring at the synagogue. The permeability coefficient measured in early 2007 was 0.00430 m/day, and by the fall of that year, it had rapidly increased to 0.00801 m/day, an increase of 86%. By 2023, the permeability had increased further to 0.00940 m/day, an 86% increase compared to the measurements taken in early 2007. Long-term projections indicate that by 2040, the permeability coefficient could reach 0.01490 m/day, an increase of approximately 246% compared to the measurements taken in early 2007. This marked upward trend is primarily associated with a declining groundwater level, which increases effective stress, accelerates the consolidation process, and causes micro-cracking and soil remodelling. Partial ventilation also promotes changes in soil structure, processes related to mineral deposition, dissolution, and microbial activity, so that changes in permeability in the palace are more dramatic than the gradual changes observed in the Synagogue.

3.3. Comparison of Calculation Results Performed Using Different Computer Programs

For both the Synagogue and the Palace of Independence, the subsidence increased with increasing load. PLAXIS 2D predicted the greatest displacement, GEO5 predicted the average value, and LIRA-SAPR predicted the least. For the Palace of Independence, GEO5 estimated a subsidence of 0.3 mm at the minimum load and 198.4 mm at the maximum load; corresponding results from PLAXIS 2D ranged from 0.36 mm to 238.1 mm, while LIRA-SAPR estimated a subsidence ranging from 0.27 mm to 178.6 mm. For the Synagogue, no subsidence was observed with the initial load; at the maximum load, GEO5 estimated a subsidence of 207.7 mm, PLAXIS 2D 249.2 mm, and LIRA-SAPR 186.9 mm. As the load increases, the effective vertical stress of the soil also increases. PLAXIS 2D typically predicts the highest stress value, while LIRA-SAPR predicts the lowest. The Bosinsk solution consistently predicts a base stress value lower than the numerically predicted value. The results show systematic differences in settlement and stress magnitude between the different modeling platforms, reflecting differences in the formation models, numerical formulas, and stiffening algorithms applied to the same foundation and soil structure load (Table 6).
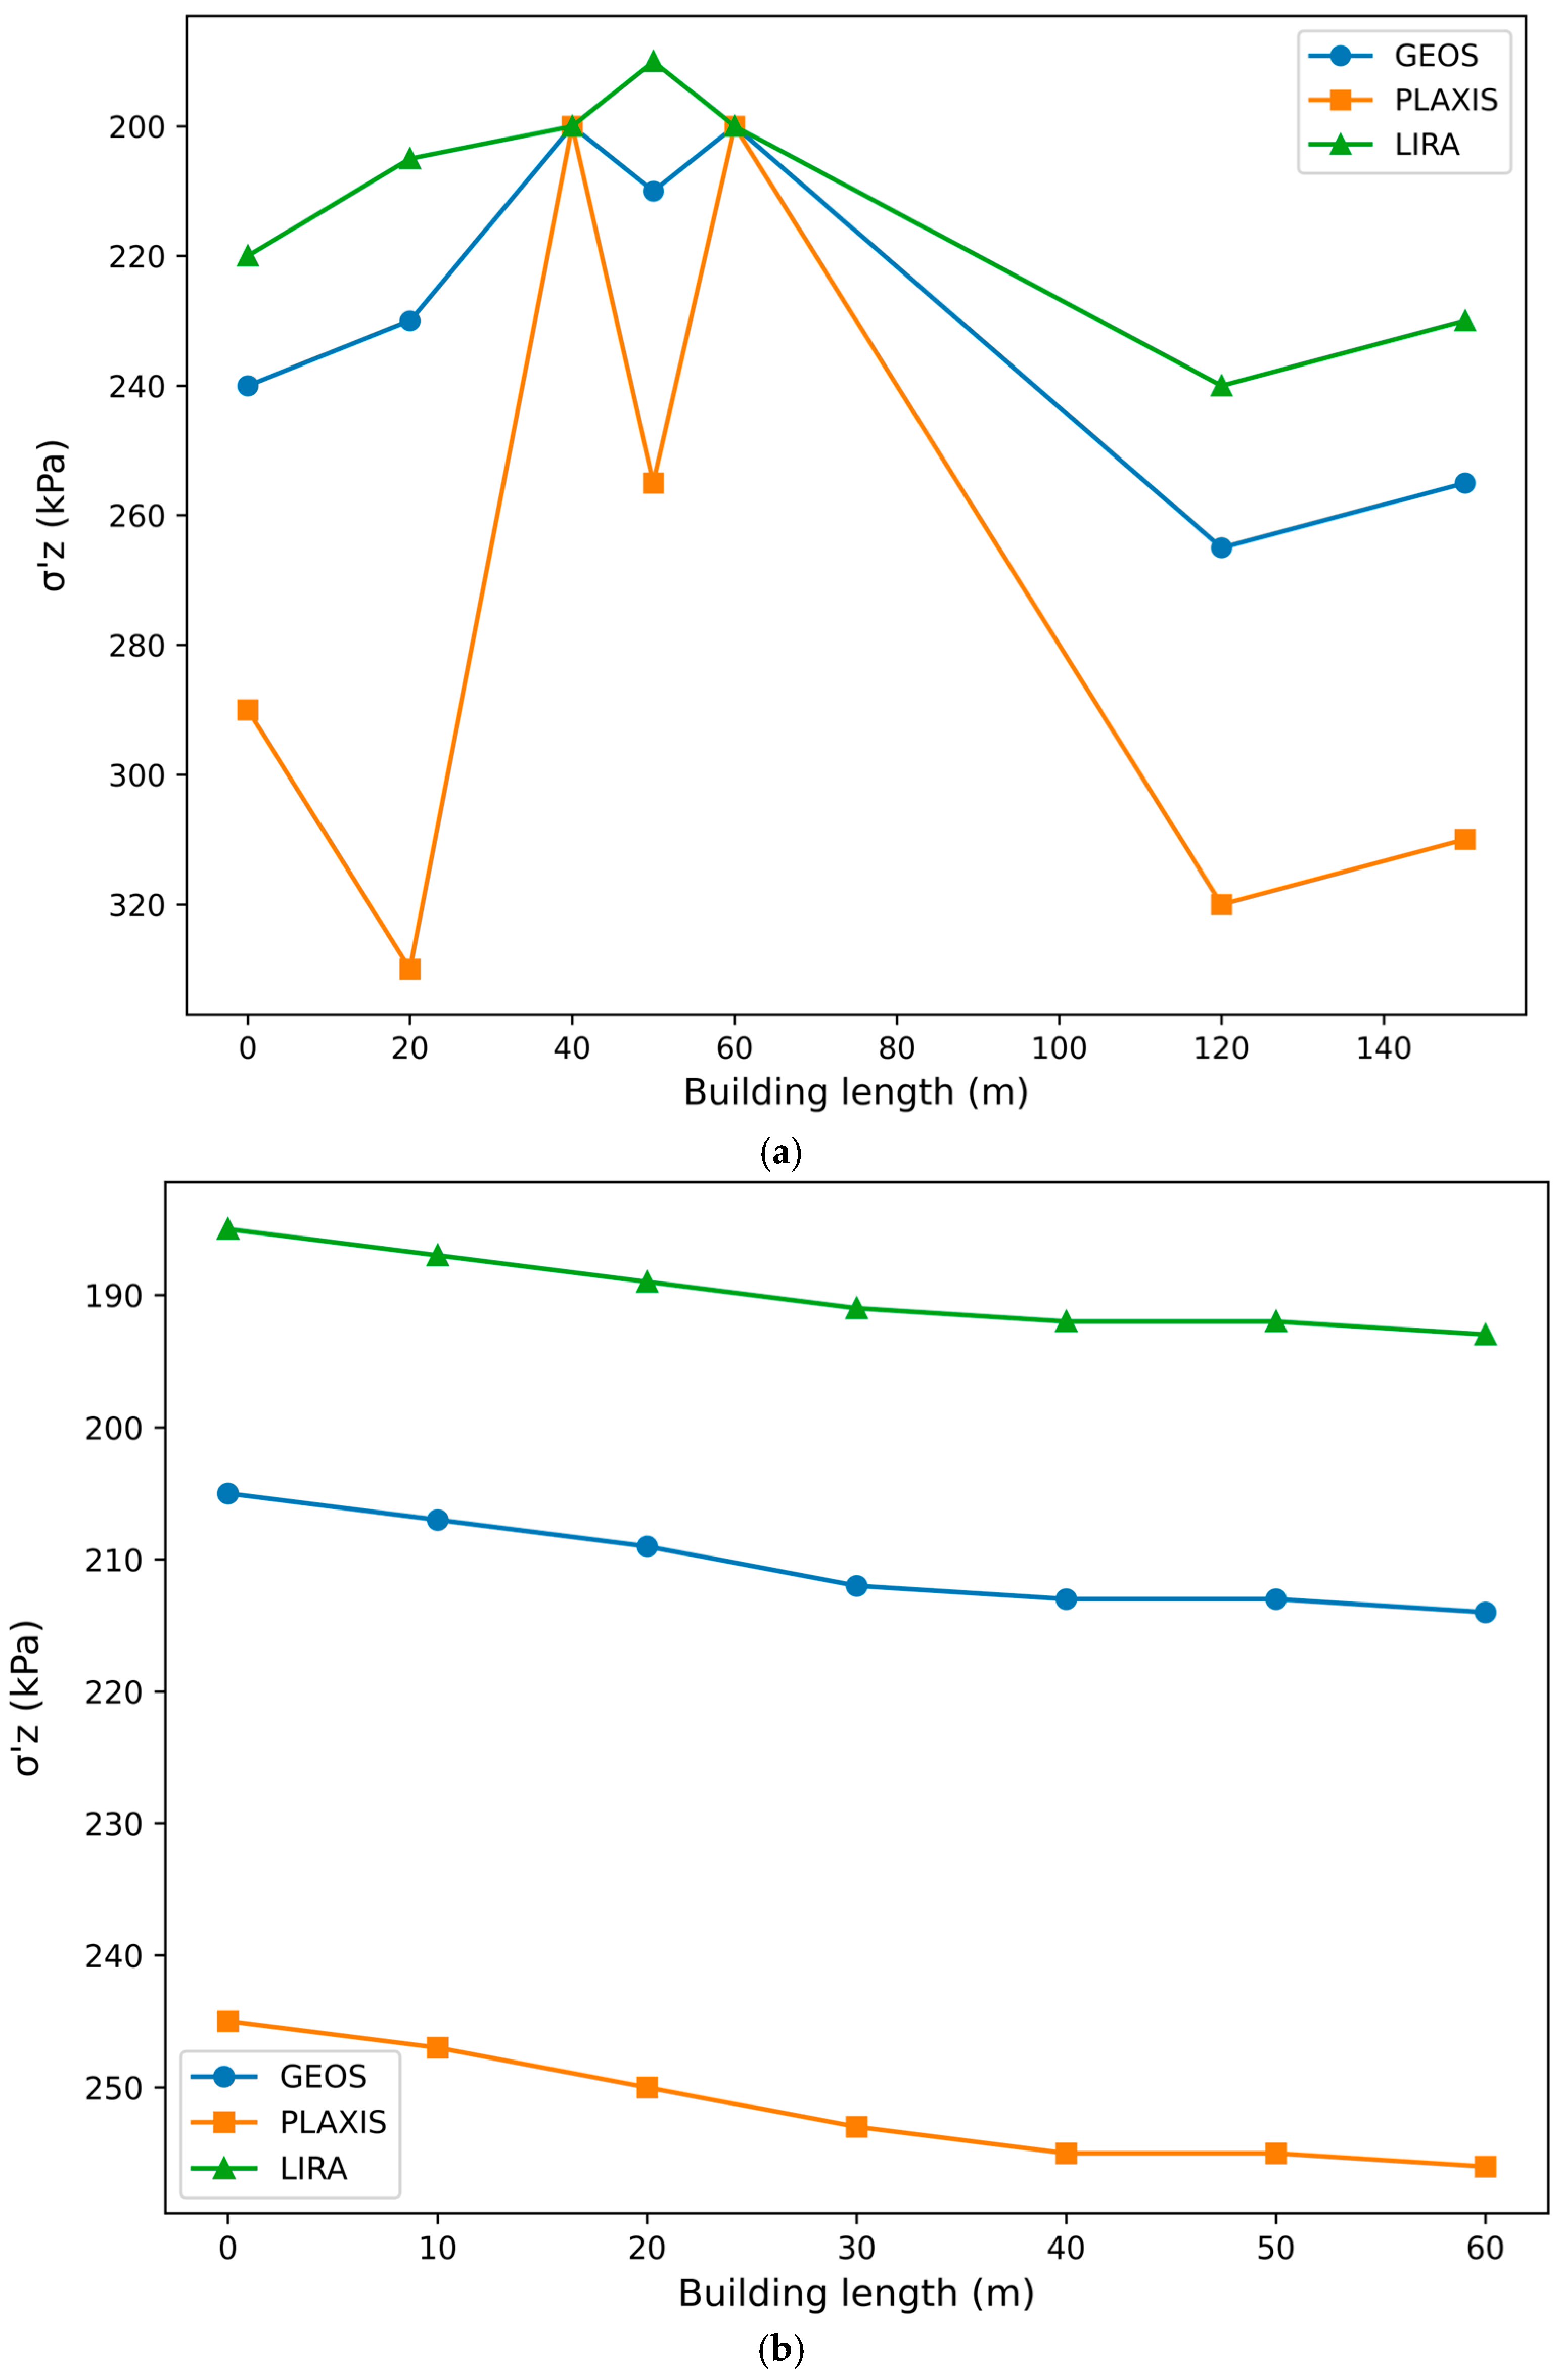
Figure 6 compares settlement curves derived using different computer programs, illustrating in more detail the relationships between the calculation tools. The trends in the figure clearly show the differences between the various numerical methods. PLAXIS, which uses a soft soil model that considers coupled flow, creep, and extended tectonic behaviour, consistently predicts maximum settlement. GEO5, which uses a more realistic but less computationally demanding cohesion formula, predicts average settlement values. LIRA-SAPR, which primarily uses a plastic–elastic formula without considering cohesion or hydrodynamic coupling, consistently predicts minimum settlement values. This figure confirms the methodological differences recorded in the table and highlights how soil behaviour models influence the predicted deformation values.

3.3.1. Soil Settlement Value

A clear pattern emerges when comparing settlement values calculated using different computational tools. PLAXIS 2D calculates the highest settlement values, typically 15–25% higher than those calculated using GEO5. This trend continues across the entire loading range, from very small settlements of around 0.3 mm to large settlements of up to 198.4 mm at 500 kPa loads. The relatively high settlement values calculated by PLAXIS are attributed to its ability to simulate creep, time-varying stiffness, and double flow—factors that collectively lead to greater deformation under long-term loading. In contrast, LIRA-SAPR consistently predicts lower settlement values, typically 10–20% lower than those calculated using GEO5. This difference stems from the fact that LIRA-SAPR generally uses a simplified elastic-plastic model that does not account for soil stiffness or hydrodynamic effects. Therefore, its predicted settlement values do not include time-varying stiffness and are consequently lower. The GEO5 program consistently calculates average settlement values, making it the closest of the three programs to field observations. By balancing soil layers, increasing loads, and modelling consolidation, GEO5 delivers results that are neither overestimated nor underestimated. This principle was confirmed at both study sites, demonstrating that the program maintains stable performance under diverse geological and hydrological conditions.

3.3.2. Stress Comparison (σ′z)

When comparing the predicted vertical effective stresses of different software platforms, a systematic difference in the calculation methods can be found. GEO5 estimates the value of σ′z of the synagogue at a load of 500 kPa, which is 266.07 kPa, while PLAXIS estimates a higher value of 319.28 kPa. Boussinesq’s analytical solution shows the lowest value of σ′z, which is 148.23 kPa, while LIRA-SAPR estimates it at 239.46 kPa. GEO5 predicts that the value of σ′z of the synagogue will be between 212 and 213 kPa, PLAXIS predicts that it will be between 254 and 256 kPa, LIRA-SAPR predicts that it will be between 191 and 192 kPa, and Boussinesq predicts that it will be between 144 and 151 kPa. The reason for these numerical differences is the basic modelling assumptions of each method. Since the Boussinesq solution is analytical, it does not take into account soil layers, anisotropy, time-dependent behaviour, or continuously changing hydrogeological conditions. As a result, its results are consistently lower than those of numerical models. The PLAXIS model, which takes into account creep, consolidation, and hydrodynamic coupling, gives the best results, reflecting a more accurate picture of soil behaviour under loading. The GEO5 and LIRA-SAPR models are between these two, with the LIRA-SAPR model often showing lower results due to the lack of a consolidation model.

3.4. Spatial Settlement and Stress Field—GEO5

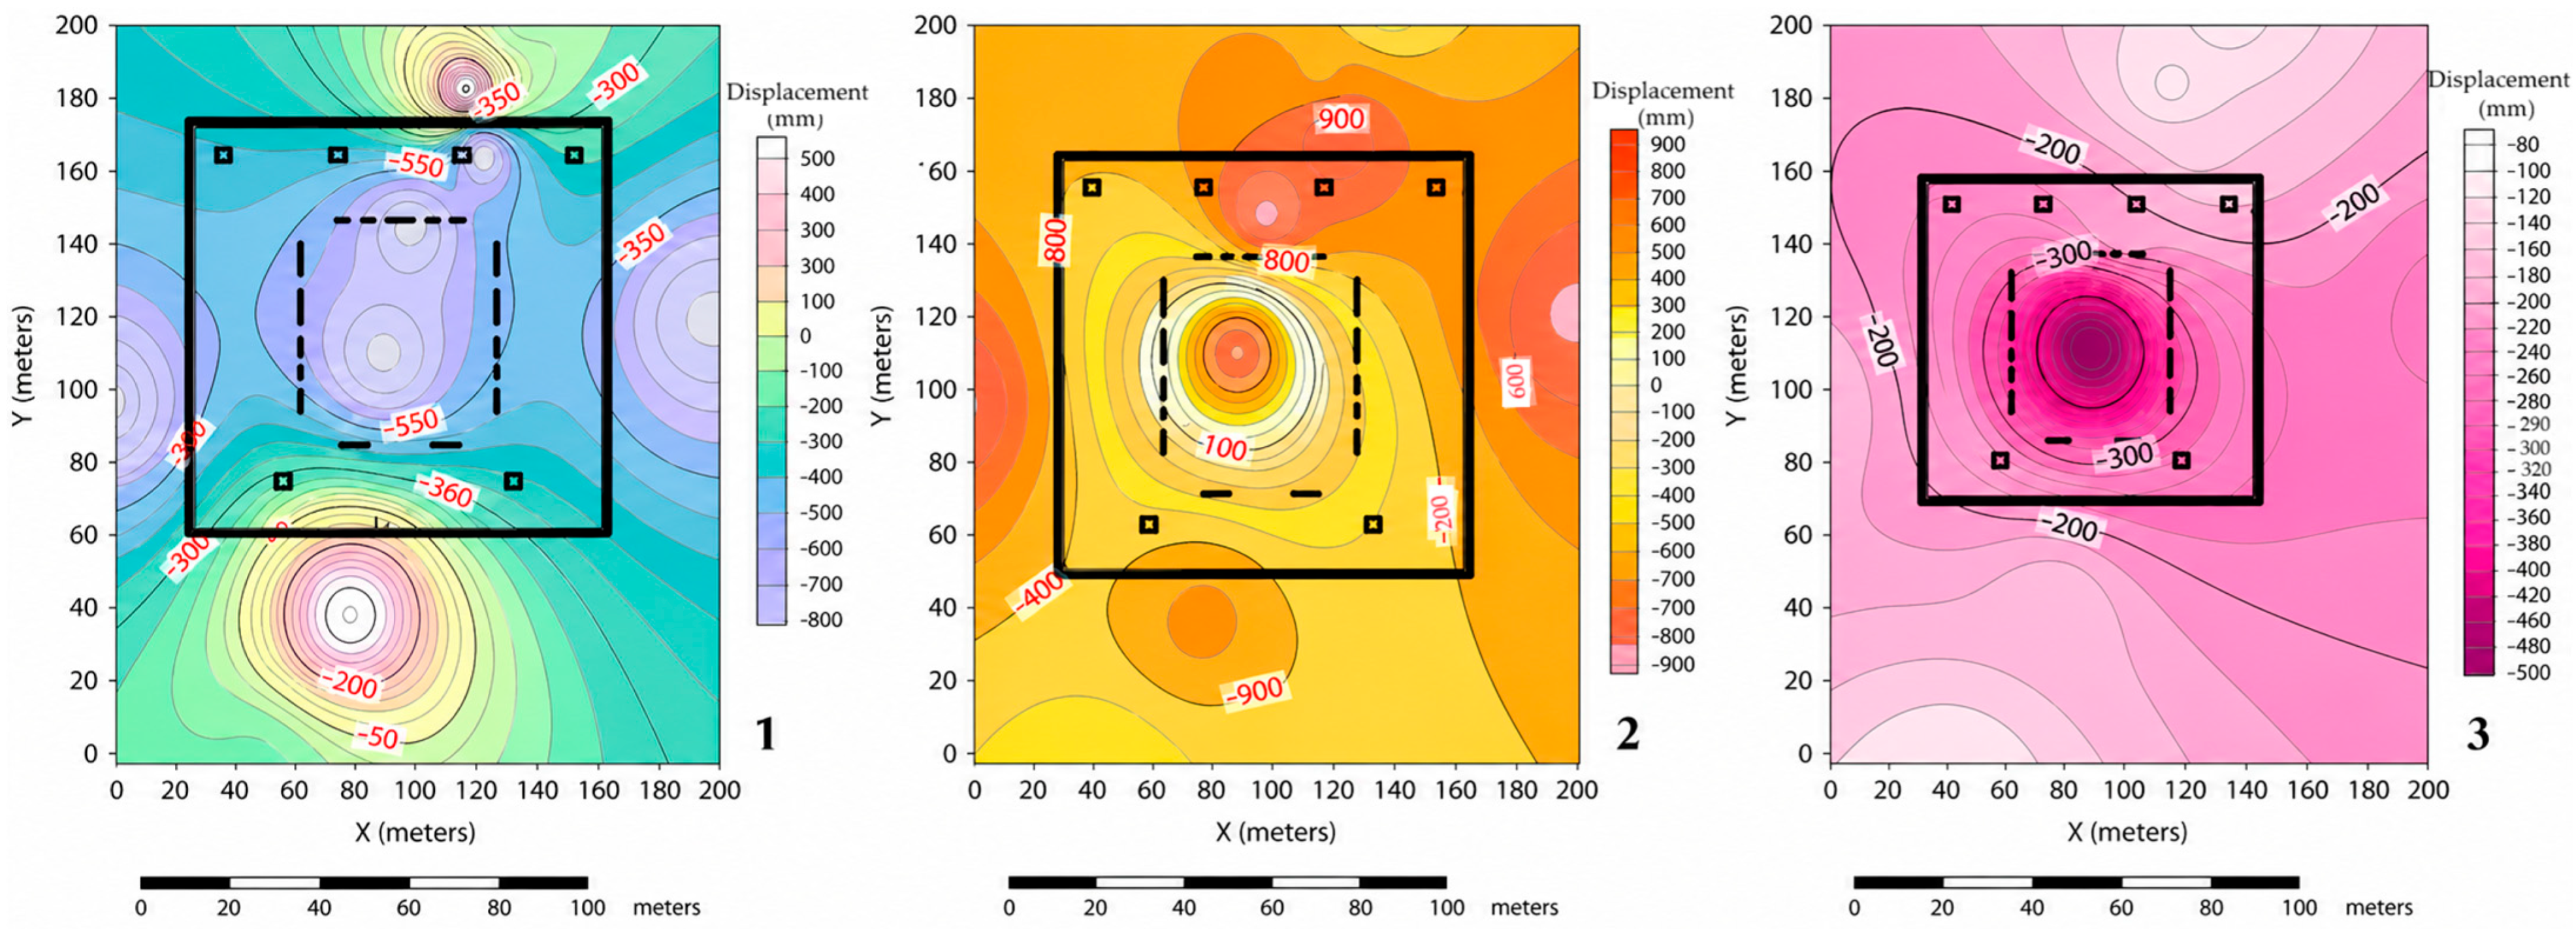
GEO5 spatial settlement and stress calculations provide a detailed picture of the response of each structure to loading, taking into account the actual soil stratification and groundwater conditions. The results of the synagogue and palace calculations are shown separately, with each figure directly below the corresponding result. These visualisations illustrate the deformation patterns during the second and third loading stages and how the stress concentration reflects the main hydrogeological properties of each site.

3.4.1. Synagogue

The simulation results from GEO5 for the temple reveal that in the southern part of the foundations, a clay layer is thicker and more compressible; hence, it experiences maximum settlement. As we move into the second and third stages, widening and steepening settlement lines indicate increasing deformation due to stress transfer towards weaker points in the underlying soil. The model also shows sensitivity to this material under progressively increasing loads with an effective vertical stress of about 800 kN/m2, which means a high stress concentration in deep clay layers. When compared with numerical results, significant differences appear with the classical Bosinski solution in the magnitude and pattern of predicted settlement. The complex soil structure at this site, with its varying stiffness, cannot be simulated by analytical models assuming homogeneity and uniformity of soils plus their groundwater influence. However, GEO5 does consider these hydrostrategic characteristics, producing a stress-settlement distribution model that better fits local geological and hydrochemical constraints. The difference between analytical and numerical predictions, as illustrated in Figure 7, reaffirms that local geological conditions together with groundwater conditions are primary factors influencing the deformation process underneath the synagogue.
The vertical effective stress distribution diagram (see Figure 8) illustrates how the stresses progressively develop during the three evaluation phases and indicates that the load is gradually concentrating as construction works advance. In the first diagram (phase 2), it can be seen that in the centre of the foundation, a greater load is being supported, and some localised stress concentrations start developing due to interaction with this heterogeneous soil layer. These early zones of stress are indicative of forces having started their redistribution towards areas where there is structural significance. The second diagram (phase 3) shows that within the system, vertical stress has a maximum value, which means that construction loading effects have significantly increased with greater mobilisation of applied stresses within the soil. Underneath certain portions of the foundation slab, large areas of maximum stress are noted, especially close to column axes where transfer of load reaches its peak; here, contour lines for effective vertical stresses steepen, indicating increasing heterogeneity in loading as soils react to variations in stiffness and permeability. All these diagrams together reflect a change from an average moderately spread-out stress to a very sharply concentrated vertical effective stress, thus confirming the high relevance of detailed analysis of stress paths toward evaluations of soil settlement behavior, as well as foundation performance.

3.4.2. Independence Palace

The GEO5 model of the palace shows that the maximum settlement occurred below the central load line of the building, which corresponds to the areas of greatest load transfer and optimal soil compaction. The settlement pattern of the third stage is characterised by a clear asymmetry. This asymmetry is caused by changes in soil stiffness due to the long-term fall in the groundwater table. Areas with deeper drainage have higher stiffness and lower settlement, while areas with water retention show higher deformation. The model predicts an effective vertical stress of approximately 745 kN/m2, which is slightly lower than the maximum value for the synagogue, but still indicates large stress accumulation. The magnitude of the settlement pattern varies greatly, but is generally similar to the Boussinesq prediction. The deformation behaviour at this location is influenced by strata and fluctuations in the groundwater level, factors that analytical methods cannot take into account. GEO5, therefore, more accurately represents the soil response under the palace (Figure 9).
The three-stage effective stress behaviour in an independent palace building is illustrated in the vertical effective stress distribution diagram (see Figure 10), which also shows how the load gradually changes the subsurface stress field. The first figure shows the second stage, when the structural load begins to increase, and the centre of the foundation experiences a more concentrated stress as the load is transferred downwards to the main supporting elements. In the central area, the earliest and most pronounced development of vertical effective stresses occurs at this point, as the stress field becomes more diffuse. The location of the main structural elements, especially the column axes, which are the main channels for vertical load transfer, is directly related to these newly formed areas of high stress. As the load intensity increases, the stress contour lines become sharper and more localised, indicating a non-uniform stress distribution over the entire foundation area. The central region, therefore, becomes the area of highest vertical stress, reflecting differences in soil stiffness and building geometry. This sequence of events highlights the importance of identifying stress concentration zones early in the analysis phase, as they are crucial in determining the type of deformation and subsequent settlement behaviour.

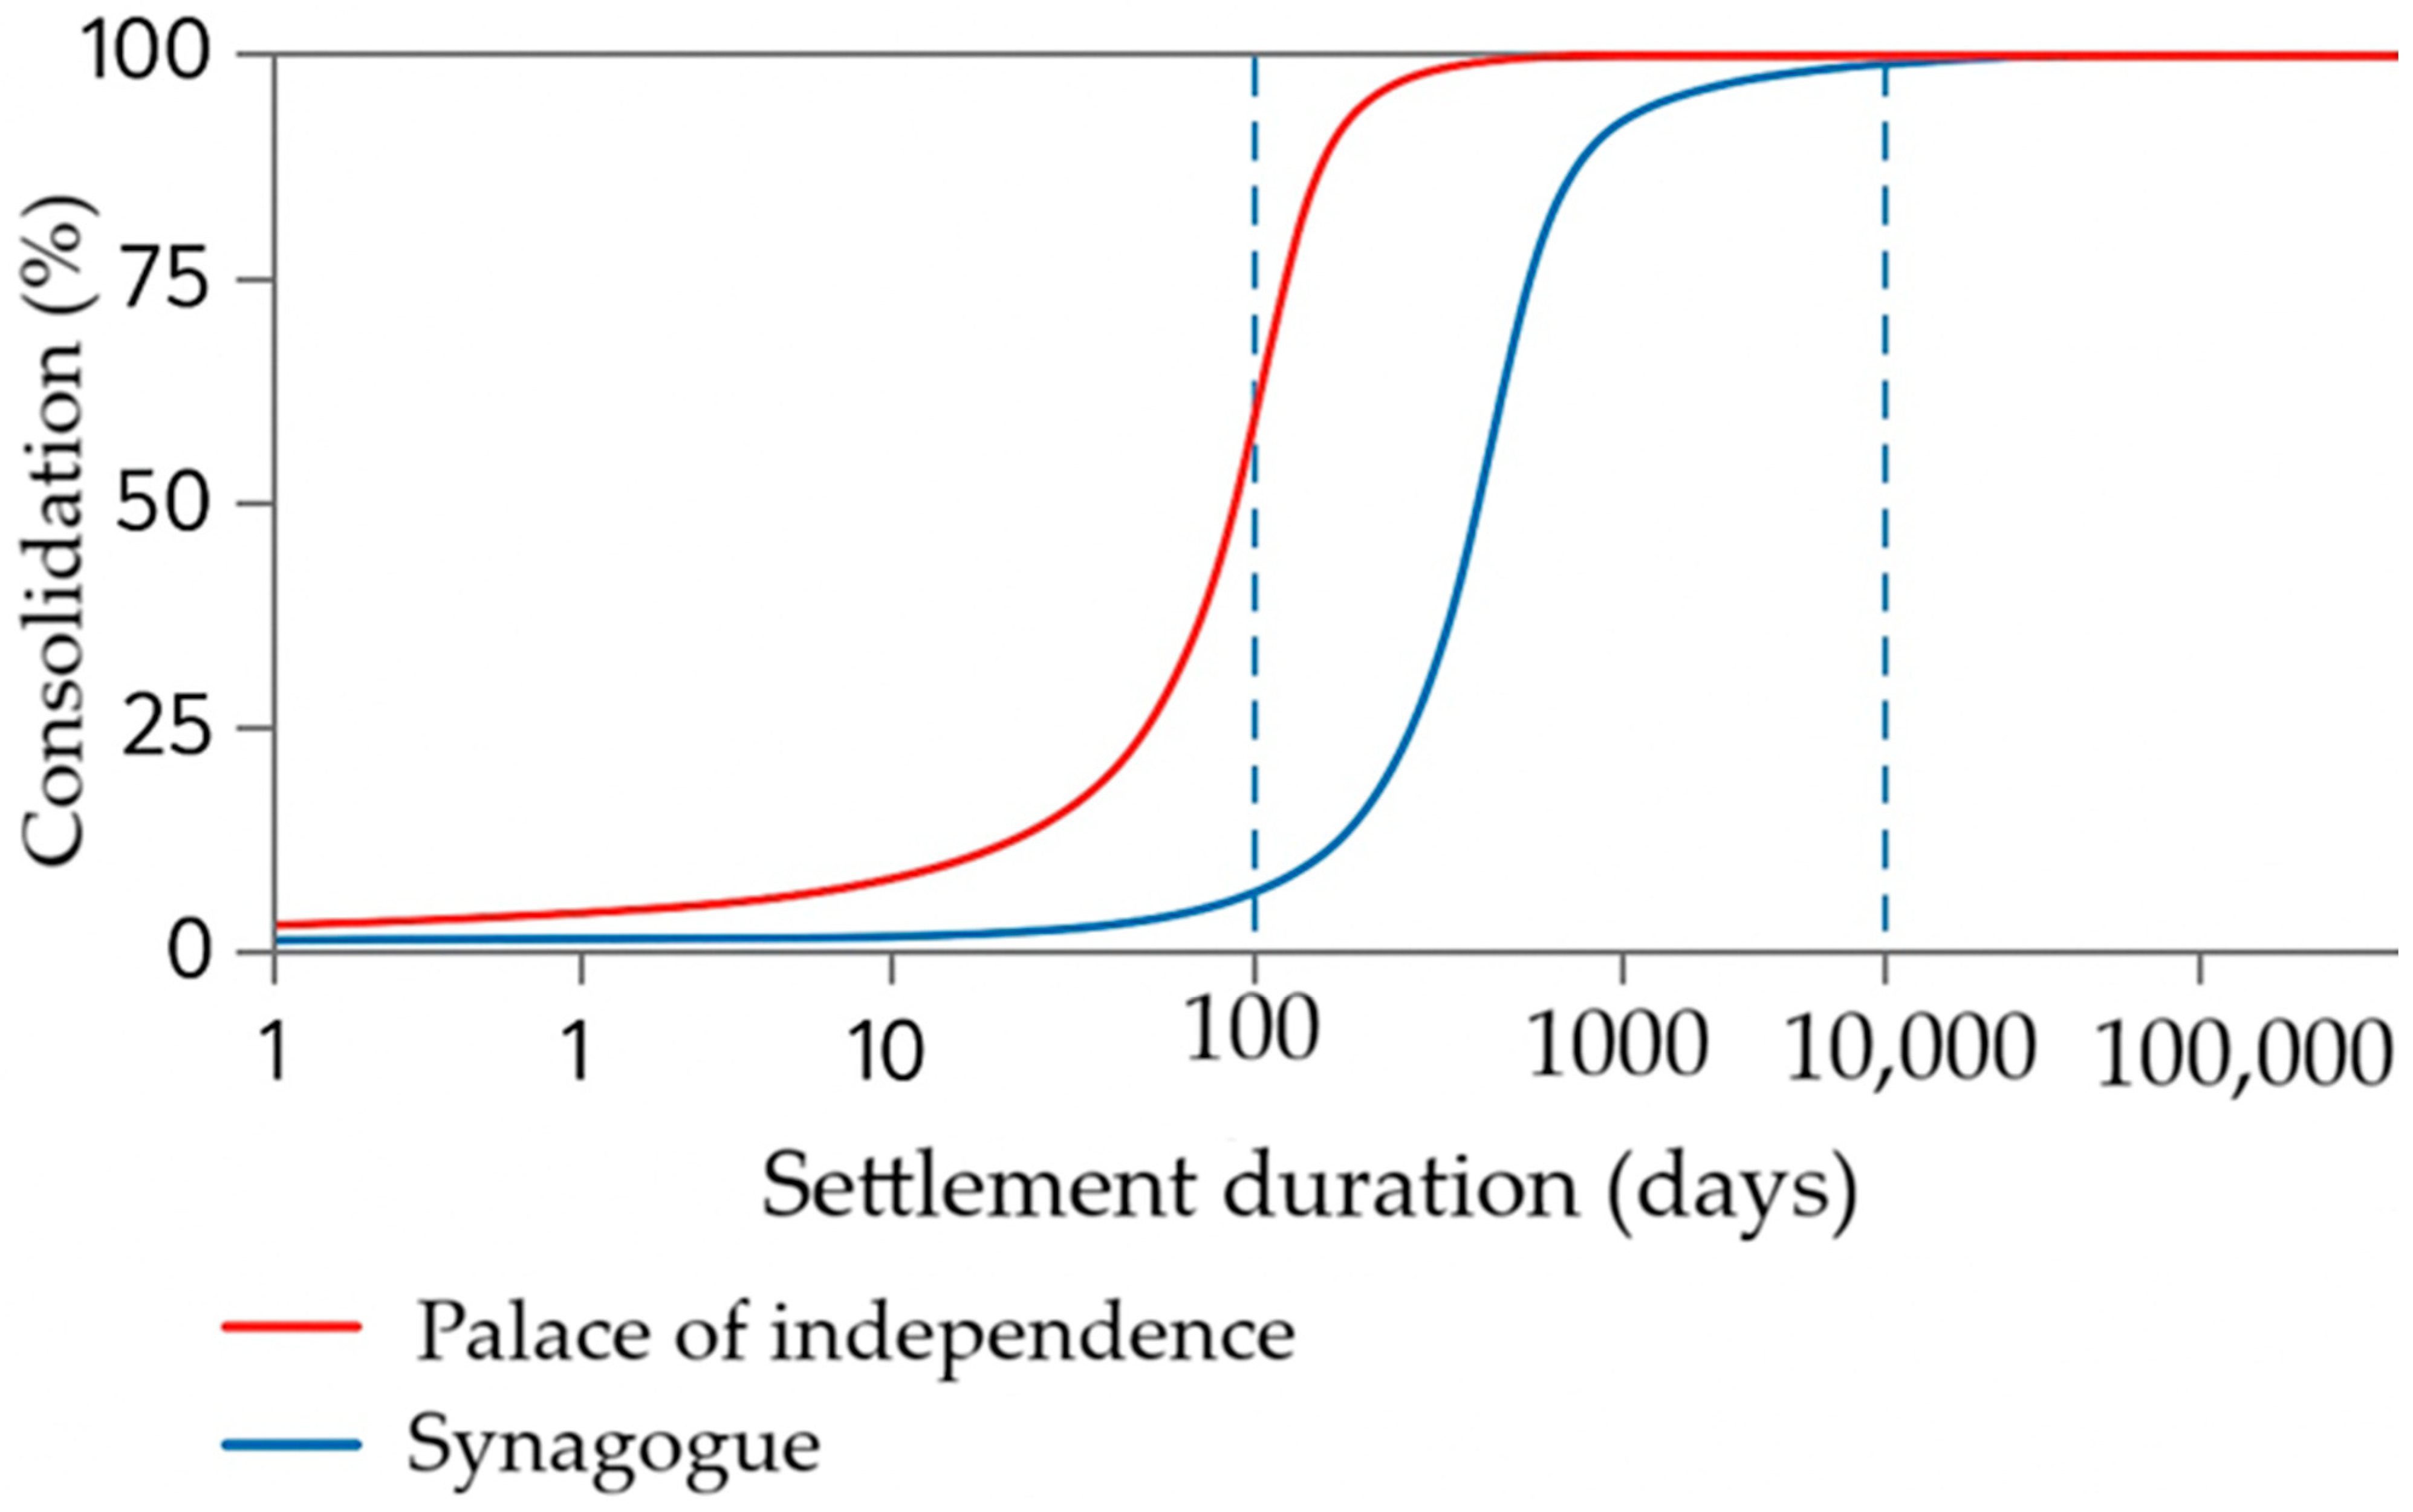
3.5. Changes in Firming and Settlement Behaviour over Time

The timing of events under the synagogue and the Palace of Independence shows clear differences in soil water conditions. The Palace of Independence had a fast start to solidification, with about half of the total settling happening in the first 100 days and between 95% and 98% in the first year. This is because it lies above a fairly well-drained marl bed. An earlier drop in the water level from 0.9 to 3.4 m in 2007 to 5.0–5.1 m in 2023 helped this process speed up. The lower water level reduced saturation, increased effective stress, and allowed pore pressure to dissipate quickly. On the other hand, due to its location on low-permeability clay deposits that are influenced by the Akbulak River, high groundwater results in a slow firming rate for the synagogue. About 10% of settlements took place within 100 days, 50% after one year, and 75% within three years; near total consolidation (over 95%) took between ten and twelve years. From these data, it is indicated that permeability and the type of soil, along with the dynamics of groundwater, are very important factors in determining both the magnitude and rate of settlement. A rapid fall in groundwater level increases effective vertical stress while reducing pore pressure; hence, at a loading stage of about 500–600 kN/m2 most of the load could be carried by soil structure itself. Numerical models may better capture significant hydraulic-mechanical interactions like consolidation creep and variations in groundwater level compared to analytical solutions based on classical Bosinski theory, which only estimates elastic stress (Table 7). A sensitivity analysis of the creep coefficient (μ*) indicates that a ±10% variation results in changes in long-term settlement of approximately 8–14% for the synagogue and 6–11% for the Independence Palace. The higher sensitivity observed in the synagogue is attributed to the presence of thicker, low-permeability clay layers, where secondary compression plays a more significant role in total deformation. These results confirm that the creep parameter is a critical factor in long-term settlement prediction, particularly under conditions of sustained loading and high saturation.

3.5.1. Independence Palace

The consolidation process of the Independent Palace was characterised by a very rapid development of subsidence. In the first 50 days, the consolidation rate was approximately 5%. After 100 days, it jumped to 50%, and after 300 days, it reached approximately 90%. After a year, consolidation was almost complete, at approximately 99%. These figures indicate that the main consolidation phase was completed in approximately three to five months. This rapid consolidation rate was due to the high permeability of the loam layer and a significant decrease in the groundwater level. These conditions increased the effective stress and accelerated the dissipation of pore pressure. With effective soil drainage and rapid structural changes, subsidence stabilised within a short time.

3.5.2. Synagogue

The consolidation process of synagogues is very different from that of other buildings. In the first 50 days, consolidation is only about 1%, and after 100 days, it reaches about 10%. After 300 days, consolidation increases to about 40%. After a year, soil consolidation reaches about 75%, but even after three years, it only reaches 90%. Complete consolidation takes 10–15 years. This long consolidation cycle is due to several interrelated factors: a thick layer of low-permeability clay, high soil saturation, a constantly rising groundwater table, and river recharge, all of which maintain pore pressure in the soil. The extremely low consolidation and permeability coefficients further slow down the dissipation of excess pore pressure. As a result, both primary and secondary consolidation processes are slow, and long-term creep becomes the main factor in subsidence.

3.6. Validation of Spatial Settlement and Differential Deformation

The validation of the numerical model was performed using geodetic measurements from 38 benchmarks at the synagogue and 54 benchmarks at the Independence Palace. The spatial distribution of these points allowed detailed evaluation of settlement patterns across the full foundation areas, including central zones and structural edges. For the synagogue, the maximum observed differential settlement (ΔS_max) reached 14.6 mm across a horizontal distance of approximately 32 m, corresponding to a settlement gradient of 0.46 mm/m. The numerical model predicted a maximum differential settlement of 13.8 mm, resulting in a deviation of approximately 5.5%. The spatial distribution of settlement showed a clear concentration in the southern part of the structure, which was consistently reproduced by the model. For the Independence Palace, the maximum observed differential settlement was 21.3 mm over a span of approximately 110 m, corresponding to a gradient of 0.19 mm/m. The model predicted a value of 19.6 mm, with a deviation of approximately 8.0%. The calculated settlement field successfully captured the asymmetrical deformation pattern associated with groundwater level decline and spatial variability in soil stiffness. In addition to differential settlement, the agreement between observed and simulated settlement fields was assessed using correlation analysis. The correlation coefficient between measured and modelled settlement distributions exceeded 0.90 for both sites, indicating strong agreement in spatial trends. These results demonstrate that the numerical model reliably reproduces both the magnitude and spatial gradients of settlement, confirming its suitability for simulating long-term soil–structure interaction under varying hydrogeological conditions.

4. Discussion

Hydrochemical evolution plays a crucial role in changing the hydraulic properties of soils, which in turn affects the rate and extent of consolidation at both study sites. The results show that long-term changes in the chemical composition of groundwater, such as increased ion concentration, changes in saturation index and redox potential, can alter soil structure, microstructure and drainage properties. This chemically induced transformation [35,36] has been widely documented in alluvial aquifers, where silicate weathering, carbonate dissolution and ion exchange reactions gradually change the hydrochemical conditions [37]. These processes increase ionic strength, promote mineral precipitation or dissolution and slowly change the infiltration pathways of fine-grained soils. Under these conditions, the synagogue site was threatened by rapid transformation into a chemically erosive groundwater environment. In contrast, the palace remained relatively stable due to the consistently low groundwater level and limited geochemical influence. These different conditions largely determined the consolidation trajectories of the two buildings. The hydrochemical trends of the synagogue are consistent with findings from groundwater system studies that show that salinity, anthropogenic pollutants, and redox-sensitive ions gradually build up under fluctuating recharge conditions [38]. The differences in consolidation and settlement behavior between the two buildings are governed by distinct hydrogeological and soil-structural controls rather than simple magnitude effects, where the Synagogue site exhibits slow consolidation due to persistently saturated conditions and hydrochemically driven permeability evolution that delays pore pressure dissipation, whereas the Independence Palace shows faster settlement response driven by groundwater drawdown, increased effective stress, and enhanced drainage efficiency; statistical evaluation of key settlement parameters, including mean rates, temporal trends, and spatial variability across monitoring points, confirms that these differences are significant and systematically consistent, thereby reinforcing that the observed divergence in settlement behavior is controlled by coupled hydrogeological conditions and soil compressibility rather than random variability in the monitoring data.
Rising groundwater levels, together with increased bicarbonate, sulfate, and nitrate concentrations, increase clay dispersibility and weaken interparticle bonding, a mechanism often observed in chemically active aquifers. In high-salt environments, the clay microstructure gradually degrades, increasing micropore connectivity and overall permeability. Similar patterns have been observed in groundwater zones with harsh chemical conditions, such as low pH, high sulfate, or highly corrosive carbon dioxide [39]. These mechanisms explain the slow but steady increase in synagogue permeability: the soil remains fully saturated, pore pressures remain high, and hydraulic evolution is dominated by changes in the chemical structure of the clay rather than mechanical loading. In contrast, changes in permeability in the chamber are primarily driven by geomechanical rather than geochemical processes. Falling groundwater levels increase effective stress, promote drainage, and accelerate soil consolidation. These conditions are similar to those in deep reservoirs with large stress differentials, where permeability responds rapidly to changes in surrounding stresses and stress paths. As water drains from the soil matrix, clay plates shift, pore throats narrow, and the soil framework compacts. These processes reduce soil compressibility and increase its stiffness [40]. In addition to its geotechnical implications, the observed groundwater chemistry also has important consequences for the long-term durability of concrete foundation elements. Elevated concentrations of sulfates, chlorides, bicarbonates, and other dissolved ions can accelerate deterioration mechanisms such as sulfate attack on cementitious matrices, chloride-induced depassivation and corrosion of reinforcing steel, and progressive leaching of calcium-bearing hydration products. These processes are particularly critical in fluctuating groundwater environments, where repeated wetting and drying cycles enhance ion ingress and transport into the concrete pore network. Although structural deterioration was not explicitly modelled in this study, the hydrochemical conditions identified at the Synagogue site indicate a potentially aggressive exposure class requiring durability-oriented design considerations such as sulfate-resistant cement selection, increased concrete cover, and the use of protective barriers or drainage improvement systems to mitigate long-term degradation risks.
Partial aeration during drainage can also induce physicochemical changes in the soil, such as oxidation-induced carbon fixation or microstructural reorganisation, which initially increase permeability but eventually become the dominant factor due to compaction. Model comparisons also show that only advanced numerical methods can reliably capture the complex interactions between hydrochemistry, geomechanics, and drainage conditions. The PLAXIS model and its coupled consolidation-creep model consistently predict maximum settlement because they take into account pore pressure dissipation, viscoelastic deformation, and permeability changes, all of which are very important for saturated clays undergoing chemical and mechanical changes. These results are in good agreement with the viscoelastic theory of layered consolidation, which shows that materials with high viscosity and partial viscoelasticity exhibit time-dependent deformation that exceeds classical predictions [41]. In contrast, the results of the GEO5 model, which focuses on permeability and drainage conditions of layered soils, are in good agreement with field observations. Methods based on Businesko’s law underestimate stress and settlement because they do not take into account the effects of pore water and chemically softened layers. A sensitivity analysis was performed to assess the influence of key governing parameters on predicted settlement behaviour, including hydraulic conductivity (k), salinity concentration (C), and soil layer thickness. The results indicate that model outputs are most sensitive to variations in permeability, followed by layer thickness, while salinity affects settlement indirectly through its coupling in the k(C) relationship. Specifically, ±30% variation in permeability leads to the largest change in predicted settlement [42], whereas ±15% variation in layer thickness produces moderate but systematic shifts in consolidation magnitude. Changes in salinity (±20%) produce comparatively smaller effects but remain significant due to their influence on long-term permeability evolution [43]. These results were compared against commonly adopted serviceability criteria from building codes for reinforced concrete foundations. Typical allowable limits for total settlement range from 50 to 80 mm, depending on structural type and stiffness, while differential settlement is generally controlled within approximately 1/500 to 1/1000 of the structural span. The computed settlements for both study sites remain within acceptable total settlement limits; however, localized differential settlements in compressible clay zones at the Independence Palace approach the upper bound of serviceability thresholds. This indicates that while overall structural performance remains within code-based limits, localised deformation control is critical for long-term serviceability in heterogeneous soil conditions. Settlement rate differences between the two Astana buildings are governed by the interaction of site-specific hydrogeological gradients, spatial variability in compressibility of fine-grained alluvial deposits, and permeability evolution induced by pore-water chemistry, leading to distinctly different consolidation responses under comparable loading conditions. The observed divergence is further reinforced by statistically significant contrasts in settlement progression parameters, indicating that variations in hydraulic conductivity and stratigraphic continuity exert first-order control over time-dependent deformation behavior, consistent with recent findings that emphasize coupled hydro-mechanical controls on urban ground deformation in alluvial systems [44,45,46].
The simplified elastoplastic LIRA-SAPR formulation does not predict settlement well enough because it does not take into account time-dependent consolidation or permeability changes. This highlights the need for tailored modelling tools that are tailored to the hydraulic-mechanical characteristics of each site. The different settlement patterns of the two buildings over time reveal the combined effects of changes in groundwater dynamics, hydrochemical environment, and soil structure. The palace represents a rapidly consolidating system, influenced by drainage, increased effective stress, and rapid pore pressure dissipation [47]. This is consistent with experimental results showing that consolidation accelerates with decreasing water content, especially in soils with faster pressure dissipation. On the other hand, the synagogue represents a slow consolidation phase, where continuous saturation, chemically altered groundwater, and limited drainage limit pore pressure dissipation. Under these conditions, the consolidation coefficient remains low, especially in clays with high water content and chemically inhibited permeability [32,33,34]. These fundamental differences explain why the palace reached the end of consolidation quickly, while the synagogue remained in a longer consolidation phase due to the combined hydrochemical factors [48,49,50].

5. Conclusions

The results demonstrate that groundwater level dynamics and hydrochemical evolution are the primary controls on permeability variation and consolidation behaviour at both sites. In the Synagogue area, a continuous rise in groundwater level combined with a more than threefold increase in mineralisation (from 1.10 to 3.39 g/L) led to sustained saturation, reduced effective stress, and slow consolidation, with permeability increasing moderately by about 22.9% over 18 years. In contrast, the Independence Palace area exhibited a groundwater decline of up to 2.86 m, which increased effective stress and accelerated consolidation, resulting in a much sharper permeability increase of up to 86% within a short period and a projected long-term increase exceeding 200%. These differences confirm that permeability evolution is governed not only by salinity but also by groundwater regime and stress conditions, with flocculation-driven microstructural changes dominating in low-swelling clay–loam systems. Comparative numerical analysis further showed consistent methodological differences, with PLAXIS predicting the highest settlements and stresses due to its ability to capture coupled consolidation, creep, and pore-water flow, while GEO5 provided intermediate results closest to observations, and LIRA-SAPR systematically underestimated deformation. The agreement between modelled and measured settlements (correlation coefficient >0.90 and deviation <8%) confirms the reliability of the adopted hydro-mechanically coupled approach for long-term prediction. Based on these findings, accurate assessment of subsidence in similar environments requires cross-validation of numerical results using multiple modelling approaches and continuous updating of the permeability–salinity relationship k ( C ) to reflect observed increases in mineralisation and permeability over time. This can be effectively achieved through periodic hydrochemical monitoring and recalibration using field permeability data, ensuring that model predictions remain consistent with the evolving groundwater conditions and soil response.


Author Contributions

Conceptualization, Z.N. and A.M.; Methodology, A.M. and N.Z.; Validation, T.M.; Formal analysis, N.Z. and A.M.; Investigation, R.S. and A.M.; Resources, Z.N.; Data curation, T.M.; Writing—original draft preparation, A.M. and N.Z.; Writing—review and editing, T.M. and A.M.; Visualization, T.M.; Supervision, Z.N.; Project administration, Z.N. All authors have read and agreed to the published version of the manuscript.

Funding

This research received no external funding.

Data Availability Statement

The data that support the findings of this study are available from the corresponding authors upon reasonable request.

Conflicts of Interest

The authors declare no conflict of interest.

References

  1. Mukhamejanova, A.; Raimbekova, A.; Aitkazina, A.; Kozyukova, N.; Karaulov, S. Spatial Interpolation of Geotechnical Properties Using EBK, IDW, and Kriging: A Case Study in Astana, Kazakhstan. E3S Web Conf. 2025, 648, 01010. [Google Scholar] [CrossRef]
  2. Mukhamejanova, A.; Aldungarova, A.; Alibekova, N.; Karaulov, S.; Kudaibergenov, N.; Yespolova, Z.; Kurmanova, D.; Baizakova, G.; Kazhimkanuly, D. Toward the Use of an Intermediate Value of the Modulus of Deformation of Soils in Geotechnical Design. E3S Web Conf. 2024, 559, 01008. [Google Scholar] [CrossRef]
  3. Nuguzhinov, Z.S.; Mukhamejanova, A.T.; Tokanov, D.T.; Koishybay, Z.; Zhumadilova, N.Z.; Beketova, M.S. Comprehensive Study of the Basses and Foundations of Furnaces No. 61, 63 of the Melting Shop No. 6 of the Aksu Ferroalloy Plant in Connection with the Renovation. In Smart Geotechnics for Smart Societies; CRC Press: London, UK, 2023; pp. 1309–1313. [Google Scholar]
  4. Suther, B.E.; Leigh, D.S.; West, L.T. Soil Chemistry and Clay Mineralogy of an Alluvial Chronosequence from the North Carolina Sandhills of the Upper Coastal Plain, USA. Soil Syst. 2021, 6, 1. [Google Scholar] [CrossRef]
  5. Mkilima, T. Groundwater Salinity and Irrigation Suitability in Low-Lying Coastal Areas. A Case of Dar Es Salaam, Tanzania. Watershed Ecol. Environ. 2023, 5, 173–185. [Google Scholar] [CrossRef]
  6. Yao, Y.; Tu, C.; Hu, G.; Zhang, Y.; Cao, H.; Wang, W.; Wang, W. Groundwater Hydrochemistry and Recharge Process Impacted by Human Activities in an Oasis–Desert in Central Asia. Water 2024, 16, 763. [Google Scholar] [CrossRef]
  7. Lu, T.; Huo, A.; Wang, J.; Lu, Y.; Zhou, W. Hydrodynamic Behaviors and Geochemical Evolution of Groundwater for Irrigation in Yaoba Oasis, China. Water 2022, 14, 3924. [Google Scholar] [CrossRef]
  8. Aitzhanova, M.; Zhaparova, S.; Zhamanbayeva, M.; Satimbekova, A. Soil and Environmental Consequences of Spring Flooding in the Zhabay River Floodplain (Akmola Region). Sustainability 2025, 17, 10378. [Google Scholar] [CrossRef]
  9. Zhussupbekov, A.Z.; Mukhamejanova, A.T.; Abdrakhmanova, K.A. Comprehensive Study of the Mutual Influence of Closely Erected Foundations of Reconstructed Buildings. In Smart Geotechnics for Smart Societies; CRC Press: London, UK, 2023; pp. 519–522. [Google Scholar]
  10. Feng, W.-Q.; Yin, J.-H.; Chen, W.-B.; Tan, D.-Y.; Wu, P.-C. A New Simplified Method for Calculating Consolidation Settlement of Multi-Layer Soft Soils with Creep under Multi-Stage Ramp Loading. Eng. Geol. 2020, 264, 105322. [Google Scholar] [CrossRef]
  11. Mattia, M.; Mondati, G.; Mazza, R.; Rosa, C.; Di Salvo, C.; Tuccimei, P. Groundwater–River Water Interaction in an Urban Setting (Rome, Italy) Using a Multi-Method Approach (Hydrogeological and Radon Analyses). Water 2025, 17, 1555. [Google Scholar] [CrossRef]
  12. Bartnik, A.; Moniewski, P. Changes in Water Quality of a Small Urban River Triggered by Deep Drainage of a Construction Site. J. Water Land Dev. 2016, 31, 11–22. [Google Scholar] [CrossRef][Green Version]
  13. Vesterberg, B.; Andersson, M. Settlement and Pore Pressure Behaviour and Predictions of Test Embankments on an Organic Clay. Int. J. Geotech. Eng. 2022, 16, 1049–1067. [Google Scholar] [CrossRef]
  14. Mahesh Bhat, K.; Nayak, S. Experimental Studies and Its Application Using PLAXIS-2D for Lithomargic Clay Stabilized by GBFS and Lime. Geotech. Geol. Eng. 2021, 39, 4901–4915. [Google Scholar] [CrossRef]
  15. Wulandari, P.S.; Tjandra, D. Analysis of Piled Raft Foundation on Soft Soil Using PLAXIS 2D. In Proceedings of the Procedia Engineering, Surabaya, Indonesia, 11–13 September 2015. [Google Scholar]
  16. Chimdesa, F.F.; Chimdesa, F.F.; Jilo, N.Z.; Hulagabali, A.; Babalola, O.E.; Tiyasha, T.; Ramaswamy, K.; Kumar, A.; Bhagat, S.K. Numerical Analysis of Pile Group, Piled Raft, and Footing Using Finite Element Software PLAXIS 2D and GEO5. Sci. Rep. 2023, 13, 15875. [Google Scholar] [CrossRef]
  17. Barabash, M.; Pisarevskyi, B.; Bashynskyi, Y. Material Damping in Dynamic Analysis of Structures (with LIRA-SAPR Program). Civ. Environ. Eng. 2020, 16, 63–70. [Google Scholar] [CrossRef]
  18. Nasybullin, R.; Akhmadiev, F.; Bakhareva, O. The Optimization of the Number of Reinforcing Bars in the Slabs in Grasshopper and Integration with TEKLA and LIRA-SAPR. IOP Conf. Ser. Mater. Sci. Eng. 2020, 890, 012123. [Google Scholar] [CrossRef]
  19. Wrzesiński, G.; Markiewicz, A. Prediction of Permeability Coefficient k in Sandy Soils Using ANN. Sustainability 2022, 14, 6736. [Google Scholar] [CrossRef]
  20. Bourg, I.C.; Ajo-Franklin, J.B. Clay, Water, and Salt: Controls on the Permeability of Fine-Grained Sedimentary Rocks. Acc. Chem. Res. 2017, 50, 2067–2074. [Google Scholar] [CrossRef]
  21. Utepov, Y.; Lechowicz, Z.; Zhussupbekov, A.; Skutnik, Z.; Aldungarova, A.; Mkilima, T. The Influence of Material Characteristics on Dam Stability under Rapid Drawdown Conditions. Arch. Civ. Eng. 2022, LXVIII, 539–553. [Google Scholar] [CrossRef]
  22. Oberkampf, W.L.; Trucano, T.G.; Hirsch, C. Verification, Validation, and Predictive Capability in Computational Engineering and Physics. Appl. Mech. Rev. 2004, 57, 345–384. [Google Scholar] [CrossRef]
  23. ASTM D2487; Standard Practice for Classification of Soils for Engineering Purposes (Unified Soil Classification System). ASTM International: West Conshohocken, PA, USA, 2020.
  24. ASTM D4318-17; Standard Test Methods for Liquid Limit, Plastic Limit, and Plasticity Index of Soils. ASTM International: West Conshohocken, PA, USA, 2017.
  25. ASTM D698; Standard Test Methods for Laboratory Compaction Characteristics of Soil Using Standard Effort (12,400 ft-lbf/ft3 (600 kN·m/m3)). ASTM International: West Conshohocken, PA, USA, 2012.
  26. ASTM D2435/D2435M-11; Standard Test Methods for One-Dimensional Consolidation Properties of Soils Using Incremental Loading. ASTM International: West Conshohocken, PA, USA, 2011.
  27. ASTM D3080-23; Standard Test Method for Direct Shear Test of Soils Under Consolidated Drained Conditions. ASTM International: West Conshohocken, PA, USA, 2023.
  28. Afonso, C.; Neves, E.; Teixeira, A.; Carvalho, M.M. Soil Particle Density Determination According to EN ISO 17892-3:2015: Some Difficulties in Laboratory Practices. In Advances in Science, Technology and Innovation; Springer Nature: London, UK, 2023; pp. 43–47. ISBN 9783031259852. [Google Scholar]
  29. Uysal, E.; Liv, L.; Akçadağ, F. Proficiency Testing for Determination of pH and Electrolytic Conductivity in Water and Soil Samples. J. Chem. Metrol. 2019, 13, 29–38. [Google Scholar] [CrossRef]
  30. ARNOLD TATU, G.-L.; VAN STADEN, J.F. Phthalocyanine Modified Electrodes Based on Reduced Graphene Oxide for Determination of Lead in Different Types of Water. Rev. Chim. 2019, 64, 887–892. [Google Scholar] [CrossRef]
  31. Bassi, I.; Bandinelli, C.; Delchiaro, F.; Sarti, G. A New Perspective on Hydrogen Chloride Scavenging at High Temperatures for Reducing the Smoke Acidity of PVC in Fires—III: EN 60754-2 and the Species in Solution Affecting pH and Conductivity. Fire 2025, 8, 18. [Google Scholar] [CrossRef]
  32. Nazarenko, M.Y.; Kondrasheva, N.K.; Saltykova, S.N. Efficiency of Applying Oil Shale and Ash-Shale Wastes for Water Treatment from Organic Pollutants. Bull. Tomsk Polytech. Univ. Geo Assets Eng. 2016, 327, 95–103. [Google Scholar]
  33. Jin, Q.; Cui, X.; Su, J.; Lu, T.; Wang, J.; Han, R. Laboratory Measurement and Analysis of the Deteriorated Layer Permeability Coefficient of Soil-Cement Deteriorated in a Saline Environment. Materials 2019, 12, 2245. [Google Scholar] [CrossRef]
  34. EN 206-1; Concrete—Part 1: Specification, Performance, Production and Conformity. European Committee for Standardization (CEN): Brussels, Belgium, 2000.
  35. Chen, J.; Yan, B.; Xu, T.; Xia, F. Hydrochemical Evolution Characteristics and Mechanism of Groundwater Funnel Areas under Artificial Governance in Hengshui City, North China. Ecol. Indic. 2023, 148, 110059. [Google Scholar] [CrossRef]
  36. Wen, S.; Liang, S.; Pang, G.; Shan, Q.; Ye, Y.; Zhang, J.; Dong, M.; Fu, L.; Wen, M. Hydrochemical Characteristics and Evolution Mechanisms of Shallow Groundwater in the Alluvial–Coastal Transition Zone of the Tangshan Plain, China. Water 2025, 17, 2810. [Google Scholar] [CrossRef]
  37. Islam, S.; Khan, S.A.; Ahmad, I. Integrating Hydrochemical Evolution, Contamination Sources and Stable Isotopes (Δ18O and Δ2D) Behaviour in a River-Fed Alluvial Aquifer, Saharanpur, India. Clean. Water 2025, 4, 100140. [Google Scholar] [CrossRef]
  38. Abebe, A.; Jothimani, M.; Berhanu, G. Hydrogeochemical Evaluation of Groundwater Quality and Its Applicability for Various Purposes in the Drought-Prone Konso Zone, Rift Valley, Southern Ethiopia. Appl. Environ. Soil Sci. 2024, 2024, 7304847. [Google Scholar] [CrossRef]
  39. Fendekova, M.; Malik, F.; Krcmar, D.; Fendek, M.; Rohacikova, A. Groundwater Aggressiveness Assessment According to EN 206-1: Data, Methods and Application on Groundwater in the Horna Nitra Basin, Slovakia. Environ. Earth Sci. 2011, 64, 461–470. [Google Scholar] [CrossRef]
  40. Liu, Q.; Chen, T.; Zhang, H.; Xu, K.; Zheng, X.; Wang, Z.; Hui, C.; Pan, Z. Experimental Investigation of Permeability Evolution in Deep Reservoirs under True Triaxial Stress: A Review. Gas Sci. Eng. 2025, 144, 205739. [Google Scholar] [CrossRef]
  41. Chen, X.; Chen, W.; Yue, Z. Consolidation of Multilayered Soil with Fractional Derivative Viscoelasticity Due to Surface Loading and Internal Pumping. Transp. Geotech. 2023, 42, 101083. [Google Scholar] [CrossRef]
  42. Shahir, H.; Pak, A.; Taiebat, M.; Jeremić, B. Evaluation of Variation of Permeability in Liquefiable Soil under Earthquake Loading. Comput. Geotech. 2012, 40, 74–88. [Google Scholar] [CrossRef]
  43. Amiri, M.; Zare, R. Time-Dependent Permeability Evolution in Saline-Affected Sandy Clay Soils: Coupled Experimental and Microstructural Analysis. Results Eng. 2026, 30, 109904. [Google Scholar] [CrossRef]
  44. Jeong, W.; Song, M.-S.; Yum, S.-G.; Adhikari, M. Das Ground Settlement Susceptibility Assessment in Urban Areas Using PSInSAR and Ensemble Learning: An Integrated Geospatial Approach. Buildings 2025, 15, 4364. [Google Scholar] [CrossRef]
  45. Wang, X.W.; Xu, Y.S. Long-Term Effects of Subsurface Structures on Groundwater Level in a Typical Urban Area of Shanghai, China. Hydrogeol. J. 2024, 32, 1085–1099. [Google Scholar] [CrossRef]
  46. Li, H.; Gu, M.; Zhang, M.; Ma, B.; Zhu, X.; Gu, L.; Tai, J.; Chen, L. Research on the Influence of Groundwater Level Dynamic Rising Process on Buildings Based on Numerical Simulation. Water 2025, 17, 3014. [Google Scholar] [CrossRef]
  47. Lo, W.C.; Lee, J.W. Effect of Water Content and Soil Texture on Consolidation in Unsaturated Soils. Adv. Water Resour. 2015, 82, 51–69. [Google Scholar] [CrossRef]
  48. Wang, J.; Yuan, W.; Yin, X.; Li, W.; Li, X. One-Dimensional Consolidation Properties of Soft Clay under Multi-Stage Loading. Appl. Sci. 2023, 13, 10340. [Google Scholar] [CrossRef]
  49. Zhang, L.; Dang, F.; Gao, J.; Ding, J. Measurement and Investigation on 1-D Consolidation Permeability of Saturated Clay Considering Consolidation Stress Ratio and Stress History. Geofluids 2021, 2021, 6616331. [Google Scholar] [CrossRef]
  50. Kinslev, E.M.; Hededal, O.; Rocchi, I.; Zania, V. Primary and Secondary Consolidation Characteristics of a High Plasticity Overconsolidated Clay in Compression and Swelling. Soils Found. 2023, 63, 101375. [Google Scholar] [CrossRef]
Figure 1. Building facade and site surroundings: (a) the synagogue; (b) the Independence Palace.
Buildings 16 02178 g001
Figure 2. Geological profile of the synagogue area.
Buildings 16 02178 g002
Figure 3. Geological profile of the Independence Palace.
Buildings 16 02178 g003
Figure 4. Time trend of groundwater level changes.
Buildings 16 02178 g004
Figure 5. Calibration curve k(C) and time trend (a) Synagogue (b) Palace.
Buildings 16 02178 g005
Figure 6. Comparison of settlement of the foundations of the synagogues and the Independence Palace calculated using GEO5, PLAXIS 2D and LIRA-SAPR: (a) Synagogue, (b) Palace.
Buildings 16 02178 g006
Figure 7. Maximum settlement of the synagogue building (mm) calculated using mathematical modelling in GEO5: (a) Settlement profile in stage 2, (b) Settlement profile in stage 1.
Buildings 16 02178 g007
Figure 8. Mathematical modelling of the synagogue building based on Businesko’s theory, presenting the distribution of vertical effective stresses (kN/m2) in stages 2 and 3.
Buildings 16 02178 g008
Figure 9. Calculation of the maximum settlement (mm) of the detached palace building using the GEO5 mathematical model. (a) Contour lines of the second stage of settlement. (b) Contour lines of the third stage of settlement (red).
Buildings 16 02178 g009
Figure 10. Mathematical modelling of the Independence Palace building based on Businesko’s theory, which determined the distribution of vertical effective stresses (kN/m2) in the second and third stages.
Buildings 16 02178 g010
Table 1. Architectural and structural features of synagogues and the Independence Palace.
VolumeSynagogueIndependence Palace
Building typeTwo-story public buildingThree-story public building
Total height (in meters)23.419.5
Floor plan dimensions (in meters)40.2 × 26.8150 × 150
Main systemMonolithic reinforced concrete strip lattice pile foundation; foundation depth 9 m.Pile foundations, monolithic reinforced concrete floor slab, lattice foundations; foundation depth (if applicable, please specify).
Table 2. Geological structure and soil engineering characteristics of the study area.
BuildingSoil LayerWorkDensity (g/cm3)Specific Weight (kN/m3)φ (°)Adhesion Coefficient c (kPa)Deformation Modulus E (MPa)Poisson’s Ratio νPermeability Coefficient k (m3/Day)DungeonKerrσ−1 (kPa)Obsessive–Compulsive Disorder
SynagoguefullLoam, sandy loam, medium sandy loam and artificial soil with gravel/pebbles/sand.1.85–2.1218.5–21.218–312–177–300.27–0.420.40.120.0550–801–2
Loam/Sandclay and gravel soil≈2.0≈2020–285–2520–300.27–0.420.00050–0.000950.10.0480–1201–1.5
sand/gravelcoarse gravelly soil2.0–2.220–2230–350–525–350.30–0.350.930.050.02100–1501–1.2
Independence PalacefullArtificial loam containing gravel, pebbles and sand; loam; medium-grained sand.1.87–2.5719.2–25.718–382–207–290.27–0.350.15 (fill soil), 0.13 (loam), 15.8 (sandy soil)0.120.0550–901–2
Dense soildense, load-bearing soil2.0–2.320–2322–3010–2515–29≈0.300.0043–0.00940.080.0380–1201–1.5
clay/loamIt contains gravelly and clayey loam, with rock fragments among them, compacted sandstone.2.2–2.522–2530–385–2520–290.30–0.3520–21.50.050.02120–1501–1.2
gravel/sandcoarse gravelly soil2.3–2.623–2532–380–520–300.30–0.3520–21.50.040.02130–1601–1.1
Table 3. Groundwater levels recorded in the Synagogue and the Independence Palace area.
Research LocationMeasurement SeasonMeasurement DateAbsolute Height (in Meters) Along the Groundwater LevelDepth of Groundwater (Meters)
Synagoguesummer19 August 2002345.90–346.203.10–3.20
summer19 August 2020349.98–350.061.00–2.10
Independent Palace of Independencespring27 March 2007350.55–351.710.90–2.50
autumn17 November 2007347.63–348.312.92–3.40
spring16 March 2023348.76–348.855.00–5.10
Table 4. Chemical composition and mineralisation trend of groundwater.
VolumeUnitSynagogue, 19 August 2002Synagogue, 19 August 2020Chamber, 27 March 2007Chamber, 17 November 2007Chamber, 16 March 2023
pH-7.8 ± 0.17.6 ± 0.18.7 ± 0.18.5 ± 0.17.8 ± 0.1
Fully mineralizedg/L1.10 ± 0.033.39 ± 0.051.13 ± 0.021.77 ± 0.032.01 ± 0.04
Chloride (Cl)mg/L138 ± 5426 ± 12224 ± 6369 ± 10266 ± 7
Sulfate (SO42−)mg/L360 ± 101068 ± 25403 ± 11660 ± 18588 ± 15
Iron (Fe)mg/L0.12 ± 0.020.18 ± 0.030.10 ± 0.010.13 ± 0.020.11 ± 0.01
water corrosivenessModerately invasive (XA1–XA2)Extremely aggressive (XA3/XA4)Moderately invasive (XA1)Moderately invasive (XA1)Moderately invasive (XA1)
Table 5. Changes and predictions of permeability coefficients.
Location/Soil TypeDateTime (in Years) from the Reference PointTotal Mineralisation C(t) (g/L)f(C)Base k0 (m/Day)Calibrated k(t) (m/Day)
Synagogue (Kleis e(J2))19 August 200201.110.00050.0005
19 August 2020183.391.2290.000950.0006145
Forecast for 2040385.931.4830.000950.0007415
Independence Palace (Loams e(C1))27 March 200701.1310.00430.0043
17 November 20070.641.771.0640.00430.00801
16 March 202315.982.011.0880.00940.0094
Forecast for 2040332.951.1820.00940.0149
Table 6. Comparison of settlement and stress results according to different programs used.
BuildingGEO5 Sketch (mm)PLAXIS Sediment (mm)Calculation Results (Units: Lira, Millimetre)σ′z GEO5 (kPa)σ′z PLAXIS (kPa)σ′z LIRA (kPa)σ′z Business Unit (kPa)
Palace of Independence0.30.360.27227.2272.7204.585.3
23.528.221.2248.6298.3223.8114.7
38.145.734.3265.4320.1240.2138.2
110.7132.899.6307.5389.1285212.4
112.3134.8101.1319410.2298.2228.7
113.3136101.9317.1412.3296.8231.9
114.4137.3102.9321.5420.6301.1239.6
115.2138.2103.7330.2430.5309.8247.3
Synagogue000203.5244.2183.2155.4
16.319.614.7213.2255.9191.9168.1
103.6124.393.2205.6246.7185198.7
192.9231.5173.6212.2254.6191218.3
198.4238.1178.6212.3254.7191.1223.8
203.9244.7183.5211.2253.4190.1229.5
207.7249.2186.9208.1249.8187.3235.7
Table 7. Percentage of building foundation reinforcement by settlement duration (in days).
Payment Terms (in Days)Integration Rate (%)
Independence PalaceSynagogue
1~0~0
10~0~0
50Approximately 5Approximately 1
100Approximately 50Approximately 10
300Approximately 90Approximately 40
1 *Approximately 99Approximately 75
3100Approximately 90
10 *100Approximately 99
30100100
* Long-term consolidation periods expressed in years, reflecting the stage where secondary compression (creep) becomes significant, whereas all other durations are expressed in days and correspond primarily to primary consolidation.
Disclaimer/Publisher’s Note: The statements, opinions and data contained in all publications are solely those of the individual author(s) and contributor(s) and not of MDPI and/or the editor(s). MDPI and/or the editor(s) disclaim responsibility for any injury to people or property resulting from any ideas, methods, instructions or products referred to in the content.