


Abstract
This study experimentally investigates the aerodynamic mechanisms and dynamic responses of slender high-rise buildings subjected to oblique-downstream interference effects. Using a simulated open-terrain atmospheric boundary layer, a square prismatic principal building (aspect ratio 8.0) was evaluated alongside an identical interfering building. High-frequency force balance and aeroelastic vibration tests were conducted across four Scruton numbers (). Aerodynamic damping was quantified using the random decrement technique and a trial-and-error approximation. Results show pronounced resonant amplification under strict conditions. Specifically, at a low (1.12), a reduced velocity () of 5.5, and an interference location of , the principal building exhibits an inclined elliptical trajectory, driven by a negative aerodynamic damping effect of approximately −2%. Higher values attenuate displacement, but rooftop acceleration amplifications persist, reaching an interference factor of 2.0. Ultimately, the synchronized rhythmic channeling required to excite the principal building necessitates a minimum wake width from the interfering structure (breadth-to-depth ratio > 0.5), highlighting critical aeroelastic instabilities in dense high-rise clusters.
1. Introduction
The rapid trajectory of global urbanization has fostered a structural landscape characterized by high-density clusters of slender, high-rise buildings. In these complex urban topographies, structures are no longer isolated aerodynamic entities; instead, their wind-induced load characteristics and dynamic responses are profoundly dictated by the presence of neighboring buildings, a phenomenon scientifically defined as the interference effect [1,2]. Unlike isolated buildings, for which aerodynamic behavior is relatively well codified, the interference mechanism involves myriad fluid–structure interactions that defy simple categorization. Consequently, the investigation of these effects has remained a sustained research topic in wind engineering for years, necessitating a multi-dimensional synthesis of experimental, computational, and statistical methodologies to ensure both structural integrity and occupant comfort [3,4,5,6,7]. Historically, the research community has addressed these complexities through a triad of methodologies: rigid model tests employing high-frequency force balancers (HFFBs) for load quantification, pivot-based aeroelastic models for dynamic vibration sensing, and computational fluid dynamics (CFD) for high-resolution flow visualization [8,9]. Foundational investigations established that the interference mechanism depends on numerous interdependent parameters, including the characteristics of the approaching turbulent boundary layer, wind directionality, and the relative spatial coordinates between adjacent buildings [1,10]. Furthermore, the dynamic sensitivity of a building—governed by geometric aspect ratios, modal frequencies, and dimensionless parameters such as the Strouhal and Scruton numbers—plays a decisive role in the resulting structural response [11,12]. Methodological advancements have led to the integration of artificial neural networks (ANNs) and database-driven prediction systems to synthesize experimental data, enabling the estimation of interference factors across varying aspect ratios and cross-sectional geometries under diverse turbulent exposures [13,14].
The classical understanding of interference effects distinguishes between upwind (upstream) and downwind (downstream) interactions. Upstream interference, where a principal building is immersed in the wake of an adjacent structure, has been extensively documented. Researchers have identified that the upstream building can either provide a shielding benefit, reducing the mean wind load, or trigger buffeting through wake-induced turbulence [1,7,15]. Seminal studies utilizing HFFB and pressure scanning have quantified these interactions through “interference factors” (IFs), which delineate the relative change in wind load compared to isolated configurations [16,17]. For instance, when an upstream building possesses a larger wind-exposed area, the resulting shielding is significant; however, staggered arrangements can trigger intense channeling, leading to a marked increase in local peak pressures and overall dynamic loads [18,19]. Despite the wealth of literature on upstream effects, the aerodynamic complexities inherent in the downstream and side regions have only more recently gained significant academic attention [1,20].
A critical dimension of interference research concerns the aeroelastic behavior of slender structures, particularly those characterized by low Scruton numbers (), where structural damping is minimal. The physics of across-wind vibration in bluff bodies is dominated by vortex-induced vibrations (VIVs) and the resonant lock-in phenomenon [21,22]. As structural damping decreases and wind velocity approaches a critical threshold, the synchronization between vortex shedding and structural frequency induces dramatic across-wind displacements [23]. The presence of a neighbor fundamentally alters these wake patterns; for example, the rhythmic narrowing and widening of the flow passage between two structures can initiate “rhythmic channeling,” leading to resonant-like amplifications of the dynamic response [12,24]. In such scenarios, the interference is not merely a one-way wake effect but a two-way coupling that can lead to aeroelastic instabilities difficult to detect through rigid-model testing alone [8,25].
Central to these aeroelastic instabilities is the modulation of aerodynamic damping. For isolated prisms, across-wind aerodynamic damping is highly amplitude-dependent and varies significantly with reduced wind velocity [5,6,26,27]. Within an interfered flow field, the existence of an interfering model can either suppress or exacerbate this damping effect. Scientific evaluations have demonstrated that for super-tall buildings, the aerodynamic damping ratio can become negative under specific reduced velocities, leading to large-amplitude oscillations [28,29]. This sensitivity is intrinsically linked to structural geometric modifications; for instance, tapered or twisted building shapes have been shown to modify vortex-shedding frequencies along the height, thereby disrupting the organization of the wake structure even when immersed in interfered flow [30,31]. These aerodynamic modifications represent an efficient strategy for wind force reduction, effectively mitigating the adverse effects of wake-induced vibrations through passive flow control [32].
Specific investigations into downstream and oblique-downstream interference have elucidated unique motion archetypes, most notably the “elliptical resonant vibration” [1,33]. This behavior manifests when an interfering building is strategically located in specific regions, creating a synchronized vortex movement within the channel between the structures [34]. This interaction can lead to two distinct trajectories: an “inclined hollow elliptical motion” resulting from simultaneous two-directional resonance due to oblique-downstream interference, and a “standing elliptical motion” driven predominantly by across-wind resonance coupled with along-wind buffeting [1,35] due to downstream interference. The emergence of these shapes is fundamentally tied to the spectral characteristics of the wind force, particularly in oblique-downstream interference, where the along-wind and across-wind force spectra both exhibit pronounced vortex-induced peaks at the same frequency, thereby leading to a highly correlated resonance [36]. Experimental data indicate that the Scruton number exerts only a minor influence on downstream interactions compared to its role in upstream wake-induced vibrations, suggesting that velocity-dependent flow synchronization is the primary driver [33].
Beyond structural loads, the statistical distribution of wind pressures under interference conditions necessitates a departure from conventional assumptions. While the Gumbel distribution (Type I extreme value distribution) is the standard default in wind engineering, interfered flow fields frequently generate non-Gumbel extremes with distinct tail characteristics [37]. The presence of neighboring structures alters the fluctuation levels and shape parameters of extreme-value distributions, particularly near the leading edges, where momentum is enhanced by oblique-upwind buildings [38,39]. Accurate determination of design wind pressures thus requires a Generalized Extreme Value Distribution (GEVD) framework to reflect the physical limits imposed by complex building interactions [40]. Furthermore, modern standards are increasingly shifting focus from structural safety toward habitability and occupant comfort, as lateral acceleration under interference can exceed serviceability thresholds even at low return periods [41,42].
In conclusion, the evolution of wind engineering research reflects a transition from isolated structural analysis to the systemic evaluation of high-rise clusters. While the shielding and buffeting effects of upstream interference are well-characterized, the nuanced complexities of downstream and oblique-downstream interactions—characterized by resonant elliptical motions and motion-dependent damping—require continued rigorous investigation [1,43]. The integration of advanced aeroelastic vibration tests with high-resolution numerical simulations provides the most robust pathway for characterizing these intricate fluid–structure interactions [8,44]. As buildings continue to trend toward greater slenderness and more atypical geometries, accounting for these synergistic interference effects in the early design phase remains paramount for ensuring the long-term resilience and habitability of the urban built environment [45].
In the authors’ prior publication [33], the elliptical resonant vibration of the principal building caused by the oblique-downstream interfering building was examined using a series of force-measurement tests. The decisive condition for such a motion was indicated to be the spectrum shape of the along-wind force—a necessary and relatively large vortex-induced spectral peak, as in the across-wind force spectrum. Further, the square cross-sectional shape for the principal and the interfering buildings was found to be the only combination arrangement for the occurrence of the elliptical resonant vibration, according to the force-measurement tests based on four different cross-sectional shapes (circular, square, and two rectangular ones with the breadth ratios of 0.5 and 2.0) for the principal and interfering buildings. Although the elliptical resonant vibration motion was explained preliminarily through force-measurement tests [33], the range of interference locations examined and the variation in cross-sectional shapes were limited, and some essential factors, such as reduced velocity and Scruton number, were not examined in detail.
This study aims to further investigate the mechanisms of oblique-downstream interference effects in high-rise building clusters. Within a meticulously simulated turbulent atmospheric boundary layer, a square prismatic model with an aspect ratio of 8.0 is employed as the principal building for observation. To account for varying dynamic sensitivities, the model’s mass and damping properties are systematically modulated to represent four distinct Scruton numbers. An interfering building model, maintaining the same aspect ratio of 8.0 and identical cross-sectional geometry, is strategically positioned in the oblique-downstream region of the principal building. By varying the approaching wind speed, this study examines how different reduced velocities affect the displacement and acceleration responses of the principal building. Furthermore, the variations in negative aerodynamic damping induced by oblique-downstream interference are quantified, culminating in the development of an aerodynamic damping model tailored to high-rise buildings subjected to complex interference scenarios. Here is the arrangement of this article: Section 2 introduces the experimental settings for the wind tunnel tests in this study; Section 3 explains the related theoretical methodologies and presents experimental results and discussions; and Section 4 summarizes the highlights of this study.
2. Experimental Settings
2.1. Simulated Atmospheric Boundary Layer Flow
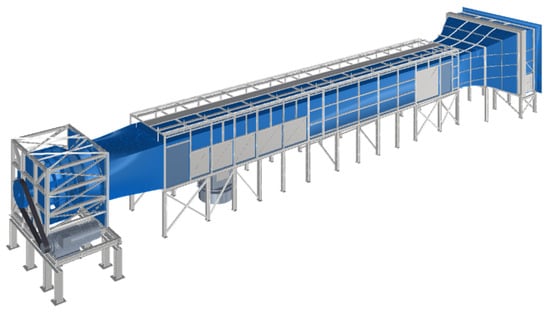
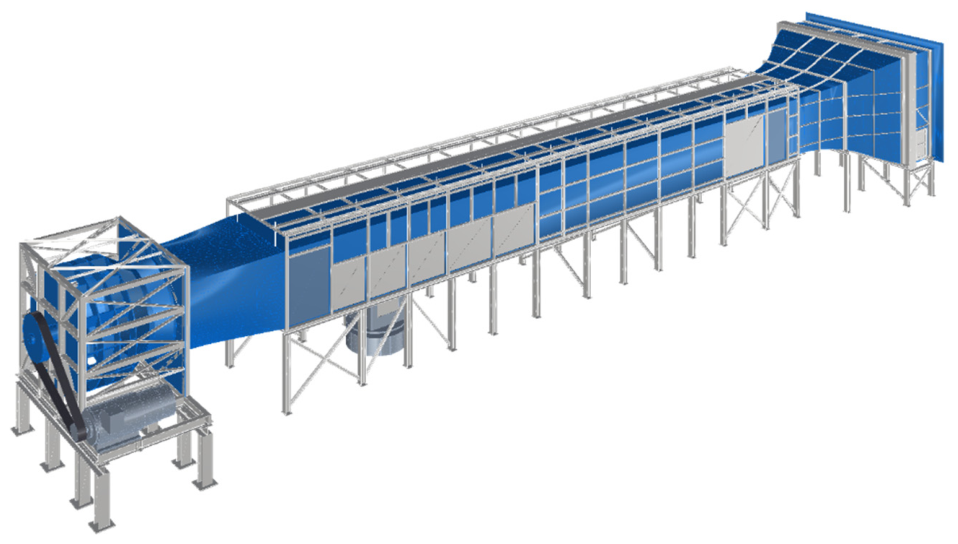
The experimental investigations were conducted in the No. 1 Atmospheric Boundary Layer Wind Tunnel at the Wind Engineering Research Center of Tamkang University. This facility is an open-circuit suction-type wind tunnel featuring a test section measuring 15 m in length, 2.2 m in width, and 1.8 m in height, as shown in Figure 1. Propulsion is provided by a centrifugal turbine fan driven by a 250 hp DC stepless variable-speed motor, enabling precise wind-speed regulation from 1 m/s to 28 m/s by adjusting the fan’s rotational speed (RPM). To ensure superior flow quality, the inlet section is designed with a 3.6:1 contraction ratio and is equipped with a single layer of honeycomb followed by three layers of conditioning screens, effectively maintaining the free-stream turbulence intensity between 0.5% and 1.0%.
Figure 1.
Atmospheric boundary layer wind tunnel at Tamkang University.
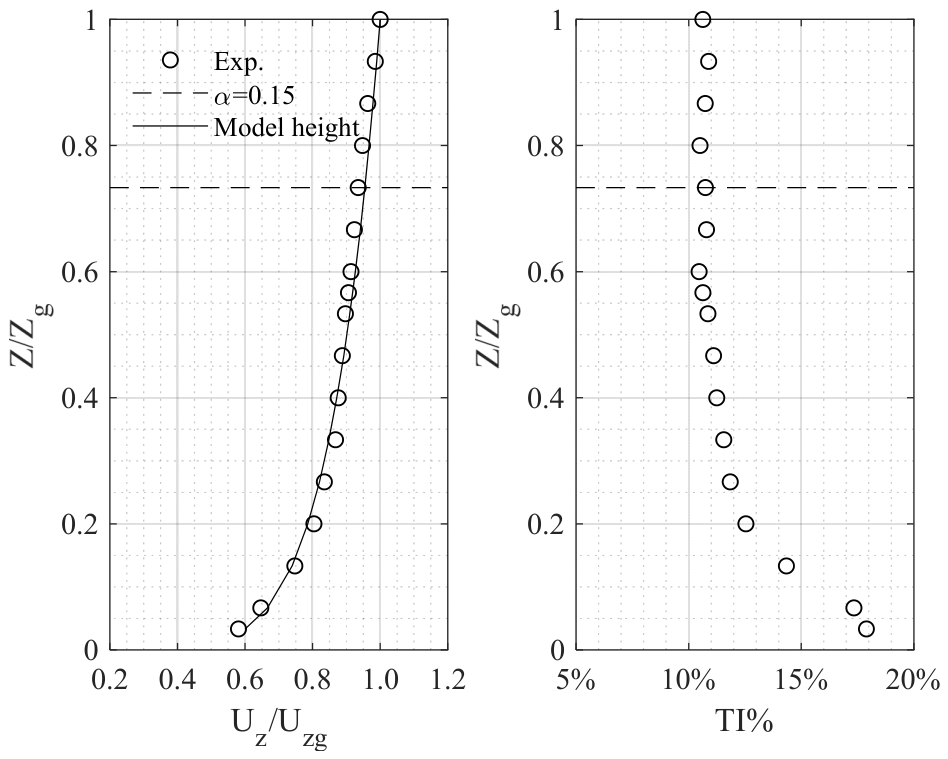
The simulated atmospheric boundary layer flow adopted in this study represents an open-terrain condition following a power-law profile with an exponent of 0.15. To achieve high-fidelity flow simulation, a combination of roughness elements, barriers, and triangular spires was strategically arranged in the upstream section of the wind tunnel to develop the target turbulent boundary layer at the downstream test location. Verification of the flow characteristics was conducted using a four-hole pressure probe (Cobra Probe) to record wind-speed time histories across the vertical profile. This instrumentation is capable of resolving the mean and fluctuating components of the longitudinal (), lateral (), and vertical () velocity vectors within an acceptance cone of ±45° and an angular accuracy of ±1°. Given its measurement range of 2 m/s to 100 m/s and a velocity precision of approximately 0.3 m/s, the probe provides sufficient accuracy for validating the quality of the simulated flow field.
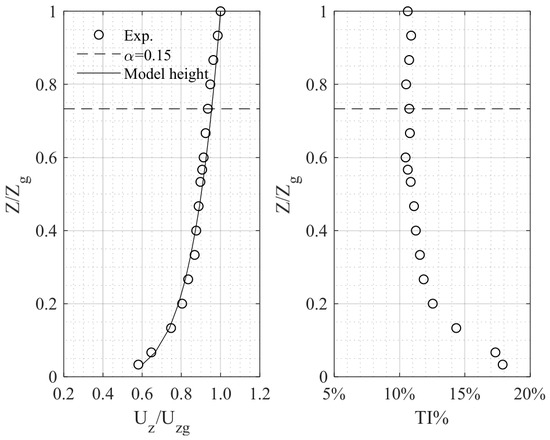
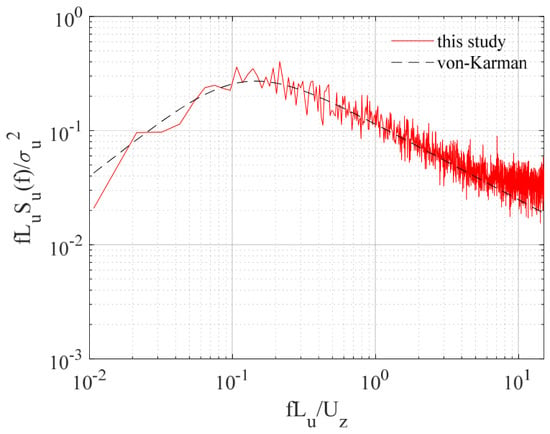
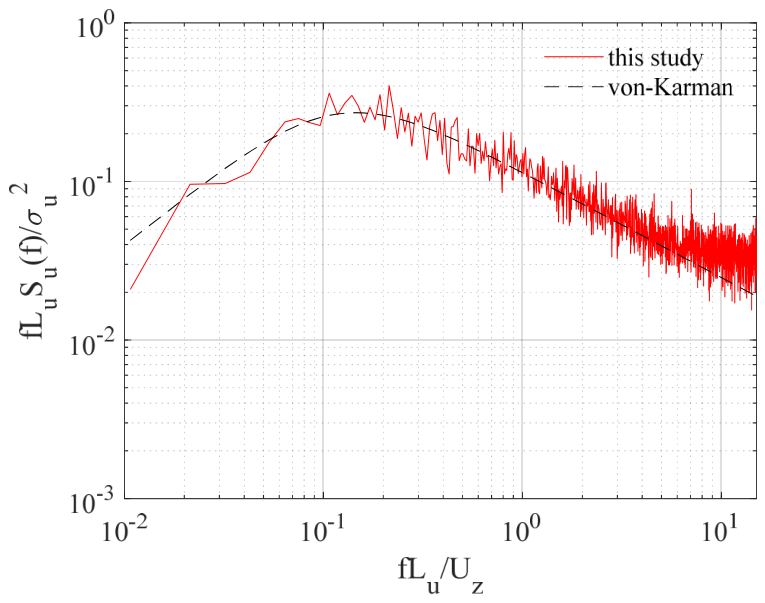
During the measurements, wind-speed time histories were recorded using the Cobra Probe at a sampling frequency of 1000 Hz for 120 s, yielding 120,000 data points per sample function. The vertical profile was characterized by measuring wind speed at 32 heights, ranging from 3 cm above the floor to 75 cm, corresponding to the scaled atmospheric boundary layer height in the wind tunnel. Figure 2 illustrates the simulated mean wind speed profile (left) and the turbulence intensity profile (right) for the target open-terrain condition. In this figure, the circular symbols represent the experimental measurements, while the solid black lines denote the theoretical profiles corresponding to a power-law exponent of 0.15 as specified by the AIJ 2015 recommendations. Furthermore, a horizontal dashed line is provided at 56 cm to indicate the building model’s relative scale within the flow. Figure 3 compares the fluctuating wind-speed spectrum at the model height with the von Karman empirical formula. The high degree of correlation between the experimental and empirical spectra demonstrates that the simulated turbulent boundary layer provides a valid aerodynamic environment for the subsequent investigation of interference effects. To ensure the simulated flow is undistorted by the building models installed in the wind tunnel, the largest blockage ratio in this study is approximately 3.2%, comprising 0.99% for the principal building model and 2.21% for the interfering building model with the largest projected area oriented parallel to the incoming wind. This blockage ratio is considered within acceptable limits under most international standards and regulations.
Figure 2.
Vertical profiles of simulated oncoming flows ((left): mean wind-speed profile; (right): turbulence intensity profile).
Figure 3.
Fluctuating wind-speed spectrum at the model height with the empirical von Karman spectrum model.
2.2. Aeroelastic Test Arrangement for Vibration Measurements
The principal building model utilized in this study is a square prism featuring an aspect ratio of 8.0 (), constructed with balsa wood cladding and an H-shaped aluminum alloy skeleton to maintain low mass and high stiffness. Designed at a geometric scale of 1/400, the model has a width () of 70 mm and a height () of 560 mm, with a square cross-section characterized by a depth-to-breadth ratio () of 1.0. Conventionally, the aspect ratio is defined by , which is the same value as the definition of in the square cross-sectional shape in this study. Nevertheless, considering the variation in the breadth ratio across the rectangular cross-sections of the interfering buildings in this study, and to avoid degrading the quality of the incoming flow due to large volume occupancy in the interfering area, all interfering building models are manufactured to have the same volume as the principal one. Such a generalization helps simplify subsequent discussions of the relevant interference-effect mechanism.
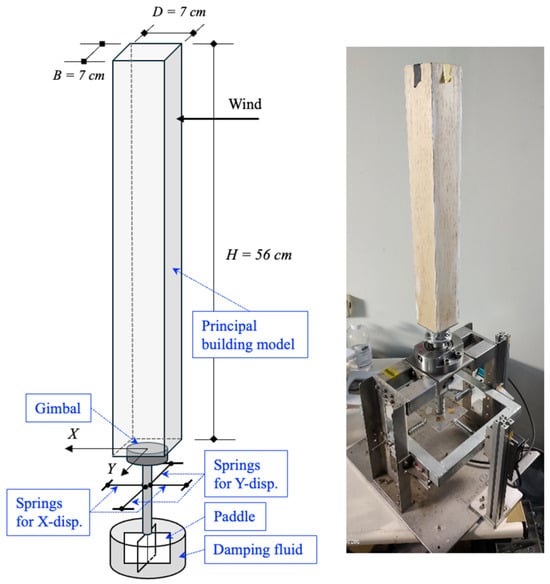
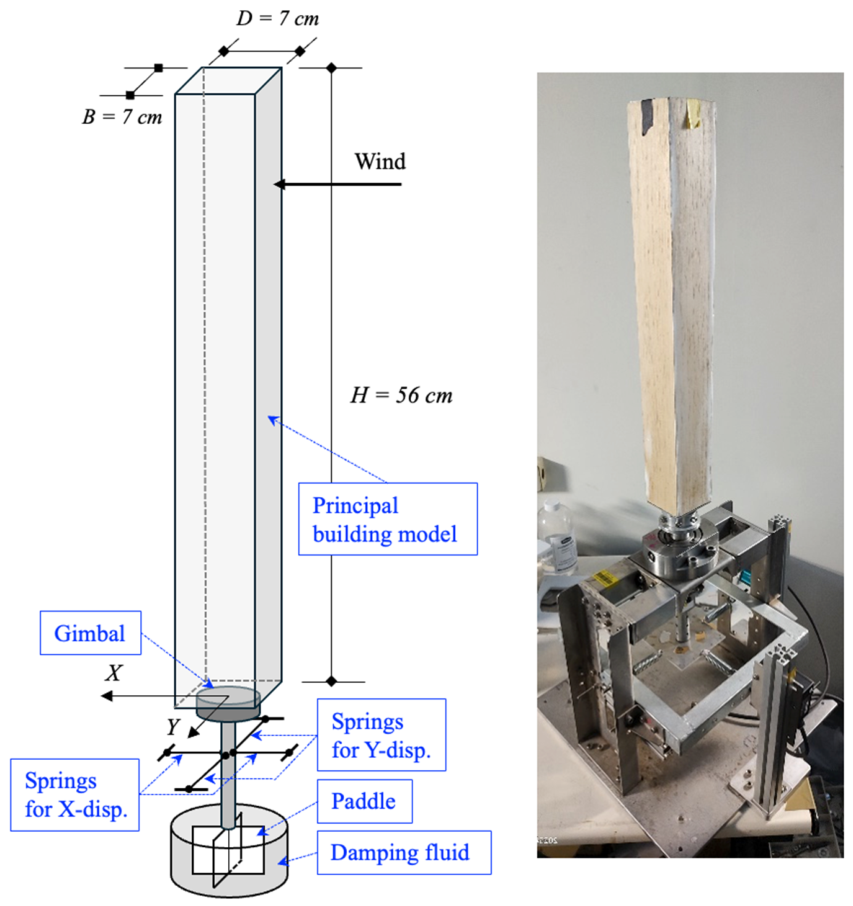
To facilitate dynamic investigations, the model mass is adjustable at the model’s top level, while the base is connected to a two-directional gimbal assembly, forming a horizontal rotating pivot system. The structural stiffness in both horizontal directions is regulated by adjustable springs situated beneath the two-dimensional gimbal. Furthermore, system damping is controlled via a paddle-type mechanism integrated at the base of the assembly and immersed in a damping reservoir, where the viscous damping ratio is precisely modulated by varying the viscosity of the damping fluid. Figure 4 shows the scheme of the aeroelastic mechanism with the principal building model.
Figure 4.
Aeroelastic mechanism with the principal building model. (Left): the schematic plot; (right): the photo of the aeroelastic mechanism.
In practical engineering applications, the Scruton number () serves as a pivotal metric for evaluating the wind-resistant performance of slender structures, such as high-rise buildings, bridges, and chimneys. A higher Scruton number indicates a superior capacity for energy dissipation, effectively mitigating vortex-induced vibrations (VIVs). Conversely, a lower value implies heightened sensitivity to wind-induced oscillations and susceptibility to resonance, which may compromise both structural safety and occupant comfort. Furthermore, the Scruton number is fundamental in wind tunnel testing and numerical modeling to ensure dynamic similitude between the scaled model and the full-scale prototype. By precisely calibrating the mass and damping parameters, the structure’s real-world dynamic behavior under wind excitation can be faithfully replicated, providing a scientific foundation for wind-resistant design. Consequently, engineers utilize assessments to develop vibration mitigation strategies, such as integrating supplemental dampers or modifying the cross-sectional geometry, to attenuate vibration amplitudes and enhance overall structural performance.
The Scruton number is a fundamental dimensionless parameter and is generally defined as
In the above definition, denotes the system mass, represents the structural damping ratio, is the air density, and signifies the characteristic dimension of the system. This formulation underscores that elevated mass and damping properties enhance the structural resistance to wind-induced oscillations; specifically, an increase in the Scruton number effectively attenuates the vibration amplitudes associated with periodic vortex shedding. Following the installation of the building model, four distinct Scruton numbers were obtained by systematically adjusting the top-level mass and the damping fluid’s viscosity. In the authors’ prior publication [11], two low Scruton numbers, 1.6 and 4.0, were chosen for the aeroelastic tests and compared with the test based on a similar level of low Scruton number in Bailey and Kwok [1]. In [11], the results for do not show a clear elliptical resonant vibration. To investigate the mechanism of the special interference phenomenon from the oblique-downstream interfering building, this study chose a relatively low Scruton number of 1.12 as the lower observation limit. The upper observation limit was set to 11.43 because the Scruton numbers for real-world high-rise buildings with reasonable weights and damping ratios are in the range of 10–20. Between these two limits, the authors set two intermediate values, 2.24 and 7.62, for better observations. To verify these parameters, the fundamental natural frequencies and damping ratios were identified through free-vibration tests that captured displacement signals at the model height in both orthogonal horizontal directions. These measurements were conducted using Keyence laser displacement sensors at a sampling frequency of 600 Hz for a 10 s duration. The stability of the identified dynamic properties was ensured by conducting 20 free-vibration trials in each direction and processing the signals using the random decrement technique. Furthermore, to validate the identification accuracy, a miniature PCB accelerometer weighing only 2 g was mounted at the model tip to record concurrent acceleration time histories. These signals were analyzed using the Eigensystem Realization Algorithm (ERA), confirming that the identification results from both displacement and acceleration data remained consistent. The specific parameter combinations for the four Scruton numbers utilized in the subsequent aeroelastic vibration measurements are summarized in Table 1.
Table 1.
Dynamic parameters of the principal building model for aeroelastic tests.
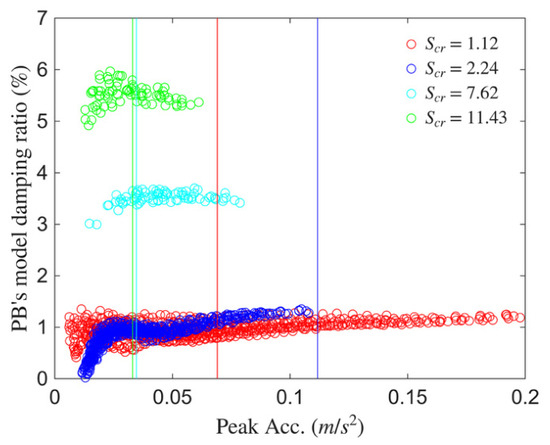
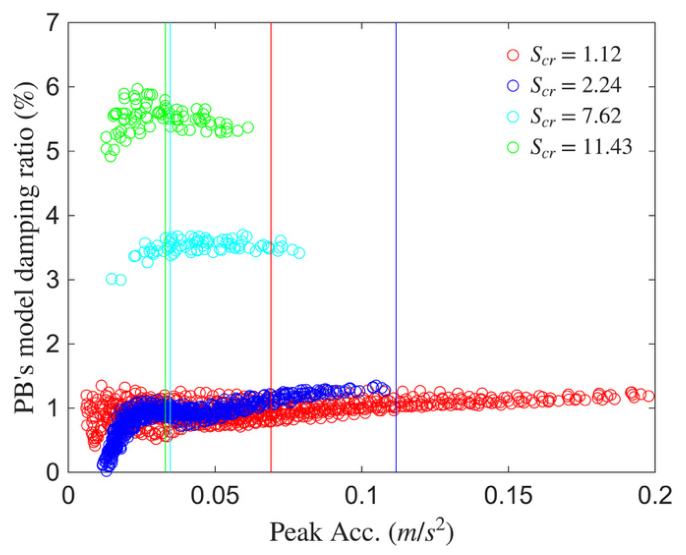
As in the authors’ prior work [11], the amplitude-dependent inherent damping ratios were examined through a series of free-vibration tests with different initial amplitudes to identify the model’s inherent damping ratio. In Figure 5, the amplitude-dependent feature of the model’s inherent damping ratio is clearly indicated when the structural response is relatively small. Four vertical threshold lines are drawn to indicate the smallest structural responses of four Scruton number cases when they are under the lowest reduced velocity of 4, which can be considered the most possible cases to be affected by the amplitude-dependent inherent damping ratio of the model. Among these four cases, the smallest structural responses are almost located at the positions where the damping ratios can be considered invariant. By the same reasoning as in [11], constant inherent damping ratios are used in the subsequent decomposition procedures for the principal building model.
Figure 5.
Identified inherent damping ratios for the principal building models with respect to peak acceleration at the model top.
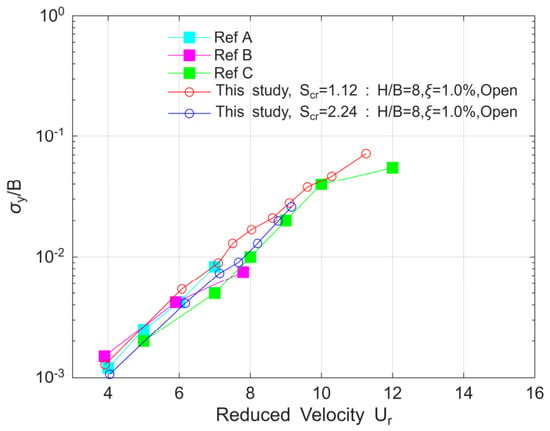
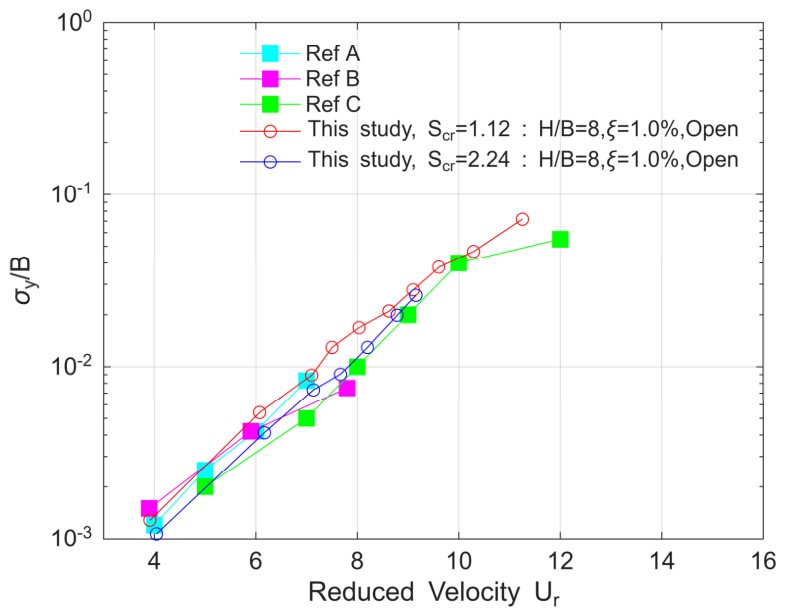
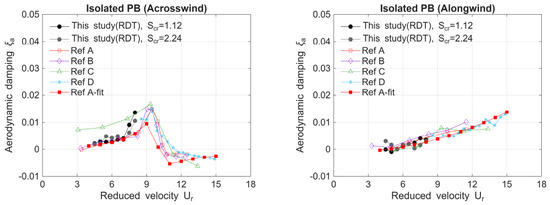
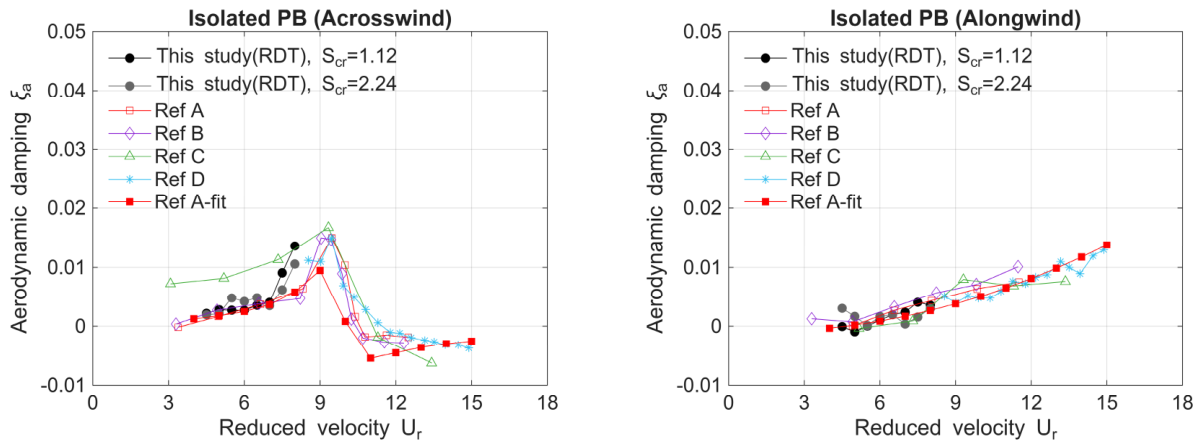
To validate the performance of aeroelastic models for vibration measurements, the two cases with small values in Table 1 are selected for comparison with the literature. In Figure 6, across-wind normalized displacements are plotted against reduced-velocity . Reduced velocity is a normalized velocity and is determined by the mean wind speed at the building model height and the product of the structural frequency and the windward width of the building, . Although the geometric appearance and Scruton numbers of the principal building models differ slightly from those reported in the literature reviews, the principal building models in this study exhibit a consistent trend. Figure 7 shows the aerodynamic damping ratios as a function of reduced velocity in the along-wind and across-wind directions, respectively. The systematic (overall) damping ratio is identified using the random decrement technique, which is commonly used to assess the aeroelastic model’s vibration behavior under different levels of approaching winds. Then, the aerodynamic damping is estimated by subtracting the model’s inherent damping ratio () in Table 1 from the identified systematic (overall) damping ratio. Since oblique-downstream interference effects were indicated in the reduced-velocity range of 5 to 6 [1,33], the aerodynamic damping ratios of the principal buildings in this study are estimated up to 8, which is before the critical reduced velocity where the lock-in phenomenon might occur. A fairly good consistency between this study and the literature is indicated by the two figures, showing that the aeroelastic models manufactured for the principal buildings in this study are reliable for subsequent investigations of interference effects.
Figure 6.
Normalized across-wind displacements of the principal building models: curve A is from Bailey & Kwok [1]; curve B is from Huang & Gu [45]; and curve C is from Kawai [21].
Figure 7.
Estimated aerodynamic damping ratios of the principal building models with the literature: curve A is from Qaun et al. [29]; curve B is from Huang et al. [28]; curve C is from Kim et al. [31]; curve D is from Kim et al. [30]; curve A-fit is fitted curve from Quan et al. [29].
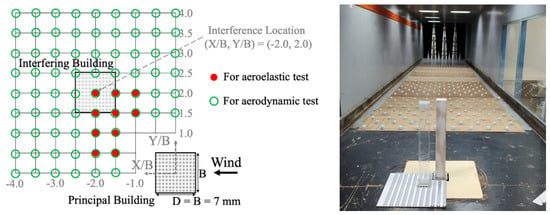
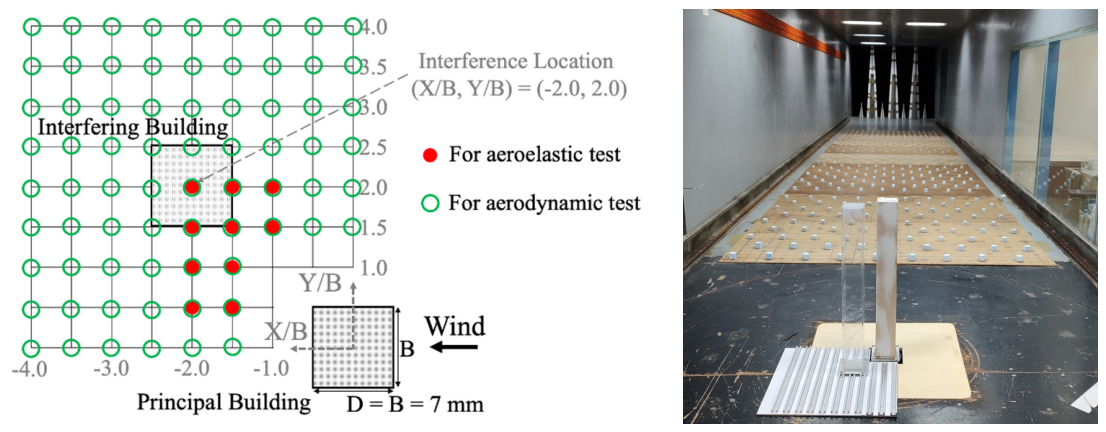
For the wind tunnel tests of interference effects in this study, the interfering building models were fabricated with cross-sectional geometries identical to those of the principal building. In the authors’ prior publication [11], the vibration of the interfering building model has been shown to be less important in altering the interference effects on the principal building model when both building models have square cross-sections. This study adopts a similar experimental setting for both building models in the aeroelastic wind tunnel tests to that in [11]; therefore, the interfering building models are assumed to function as static interference sources with no requirement for dynamic oscillation and are constructed from rigid acrylic. This research prioritizes the characterization of oblique-downstream interference; accordingly, the vibration measurements were conducted with the interfering building situated at the locations marked by red circles in Figure 8, while the principal building remained stationed at the coordinate origin (0, 0). The spatial arrangement is described using a coordinate system where the X-axis and Y-axis correspond to the along-wind and across-wind directions, respectively. The variables and represent the longitudinal and lateral separations between the geometric centers of the building models, and denotes the model width. Normalized coordinates, and , are used to define relative positioning, where positive X-over-B values denote upstream arrangements and negative values denote downstream arrangements. In this study, values are exclusively positive. A total of ten interference coordinates were investigated, extending to a maximum distance of . These locations were strategically selected to cover critical positions documented in prior literature where significant oblique-downstream interference effects are expected.
Figure 8.
Downstream interference locations for the interfering building model in the aeroelastic test (red circles) and the aerodynamic test (green circles).
2.3. Aerodynamic Test Arrangement for Force Measurements
To calibrate the estimated negative aerodynamic damping from the aeroelastic tests for vibration measurements, the aerodynamic test for force measurements is conducted. Overturning moments of the principal building model are measured at the model base using a JR3 Universal Force-Moment Sensor System (JR3), a high-precision six-axis instrumentation suite. This system enables the simultaneous measurement of three force components (, , ) and three moment components (, , ) at sampling frequencies reaching up to 8000 Hz. To ensure signal integrity during high-speed data acquisition, the system incorporates a dedicated digital signal processor to mitigate crosstalk and suppress noise in both the analog and digital domains, while facilitating signal amplification and transmission.
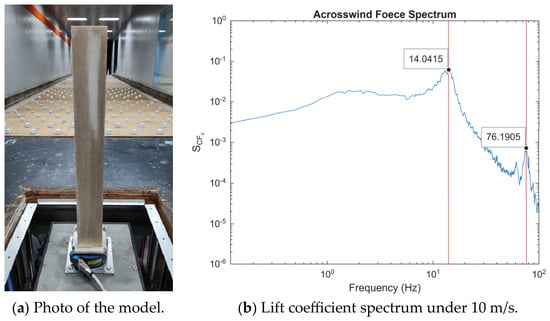
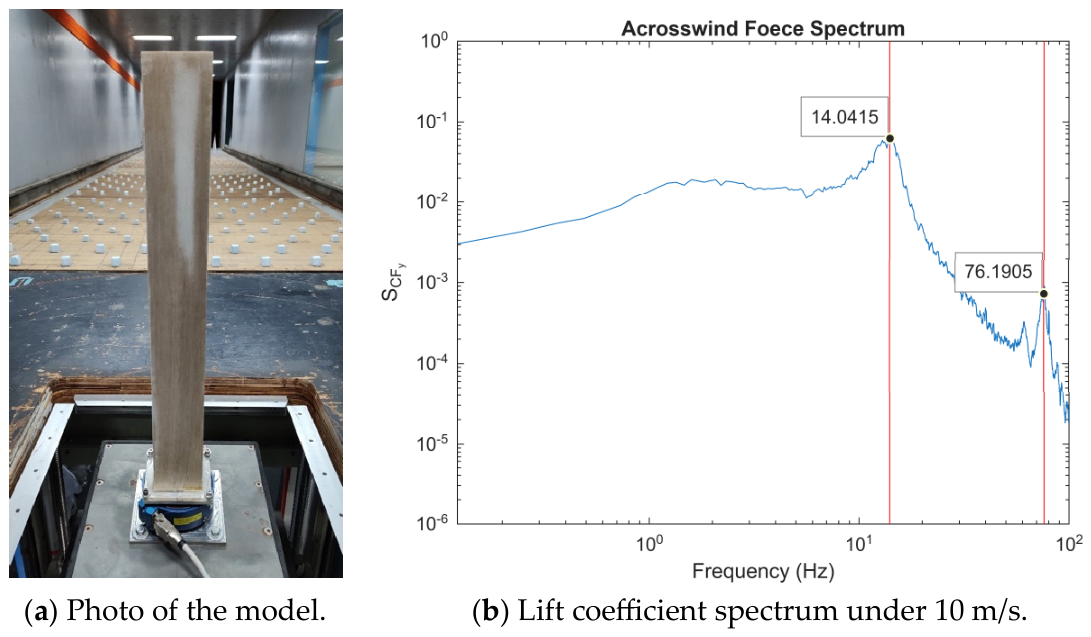
The high-frequency force balance (HFFB) is a highly sensitive measurement system mounted on a circular, adjustable turntable beneath the wind tunnel floor. During experiments, the building model is firmly attached to the sensor assembly. Great care is taken to ensure the entire measurement setup is structurally stiff and airtight to maintain data accuracy. It is essential to keep the system properly aligned horizontally and to verify that the windward face of the model stays exactly perpendicular to the incoming flow. An integrated photo showing the model and the force balance within the wind tunnel is shown in Figure 9. For aerodynamic testing, the number of downstream interference points is increased to cover a broader range, helping locate the most sensitive area for oblique downstream interference effects in this study. Figure 8 shows a broader range of interference locations (green circles).
Figure 9.
Aerodynamic mechanism with the principal building model.
Multiple free-vibration tests are again performed on the aerodynamic mechanism shown in Figure 9a, identifying a modal frequency of 76 Hz in both translational directions. In a force-measurement test, the building model should be securely connected to the force balancer to ensure a rigid configuration and prevent dynamic coupling that could disturb the force-measurement signals. From the lift force coefficient spectrum shown in Figure 9b, the vortex-shedding frequency is approximately 14 Hz, corresponding to a 10 m/s incoming mean wind speed at the model height, and is well below the modal frequency of 76 Hz. It is widely recognized that a perfect rigid feature is nearly impossible in a manned experiment; therefore, the separate spectral peaks representing vortex shedding and the model in Figure 9b are considered acceptable for the force-measurement tests in this study. For all force measurements in this study, the force signals are sampled at 1000 Hz over a 180 s duration, yielding 20 sample functions at a 10 min field scale to support stable, ensemble-averaged discussions in Section 3.
3. Results and Discussions
3.1. Isolated Principal Building
Theoretically, the governing equation of motion of the generalized single-degree-of-freedom system is given by Equation (2) as follows.
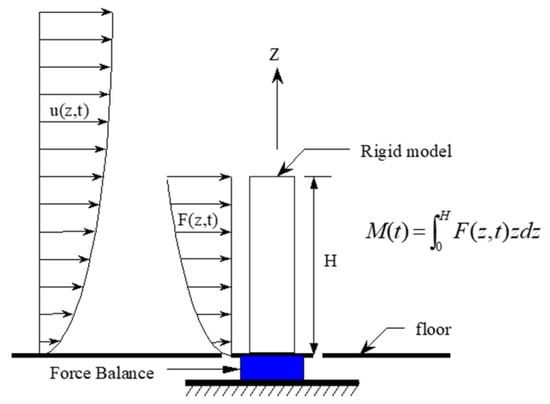
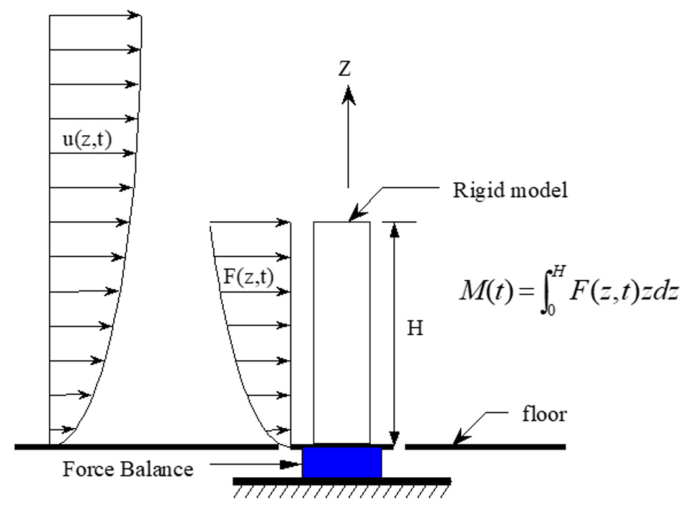
In the above equation, is the generalized mass and is determined by , where is the linear mode shape; is the mass distribution along the height of the building. is the generalized stiffness and is defined by , where is the fundamental frequency of the generalized single-degree-of-freedom system. is the generalized damping coefficient and is determined by , where is the systematic damping ratio. is the generalized force and is determined by , where is the translational force time series along the height of the building. With the substitution of , the generalized force can be rewritten as , where is the overturning moment at the base of the building. Figure 10 indicates the aerodynamic mechanism diagram for Equation (2). To compare with the direct displacement measurements from aeroelastic tests, the parameters in Table 1 are used to estimate the dynamic properties in Equation (2). The overturning moments measured in HFFB tests are used to determine the generalized force. Only the first mode in a linear shape is assumed for structural response estimation. The generalized displacement is then calculated by the Newmark time-stepping analysis in the time domain.
Figure 10.
The scheme system of the HFFB tests.
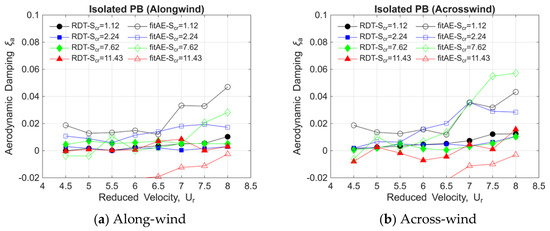
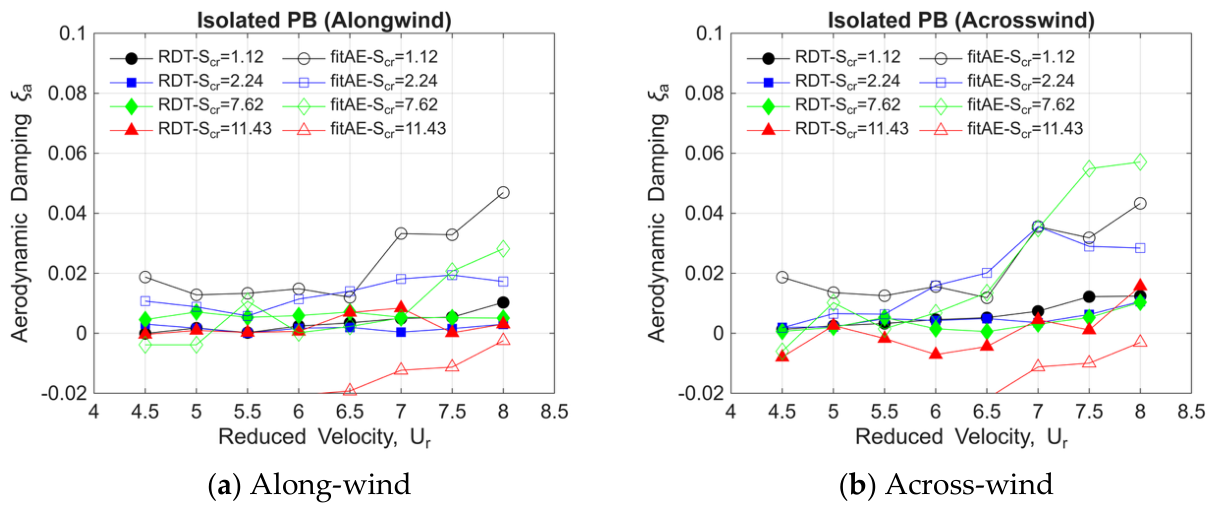
The key parameter for estimating structural responses is the systematic damping ratio, which is the resultant damping ratio arising from multiple sources. The damping ratio in Table 1 is the inherent damping ratio of the model, which is determined when the model is once manufactured. The aerodynamic damping is the added damping ratio due to the approaching wind and is strongly dependent on the Scruton number of the model. The random decrement technique is a common method for determining the systematic (overall) damping ratio when the model is subjected to strong winds. The aerodynamic damping is obtained by subtracting the inherent damping ratio from the systematic (overall) damping ratio . Nevertheless, the literature indicates that the aerodynamic damping ratio estimated via the random decrement technique does not produce the same structural response measured in aeroelastic tests—a small difference exists at different reduced velocities and decreases with increasing Scruton number [30]. A trial-and-error method can be used to find the optimal aerodynamic damping ratio by iteratively substituting different values into the governing equation until the estimated structural response is consistent with direct measurements from aeroelastic tests.
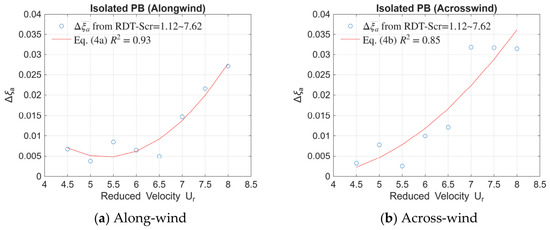
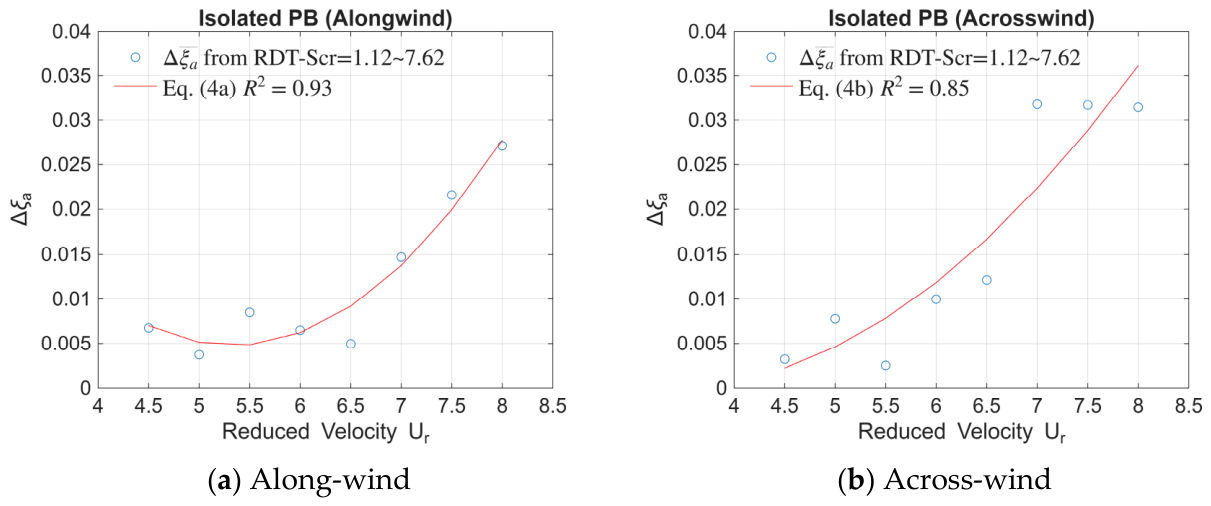
Figure 11 shows the identified and approximated aerodynamic damping ratios by the random decrement technique and the trial-and-error method, respectively. A clearer tendency is indicated: as the reduced velocity increases, the difference between the RDT-identified values and the trial-and-error approximated values increases, especially for those smaller Scruton-number models. The difference between the two methods is defined by Equation (3) and is regressed in a polynomial format in Equation (4).
Figure 11.
Aerodynamic damping ratios identified by the random decrement technique (“RDT” in the legend) and approximated by the trial-and-error method (“fitAE” in the legend) for the isolated PB model.
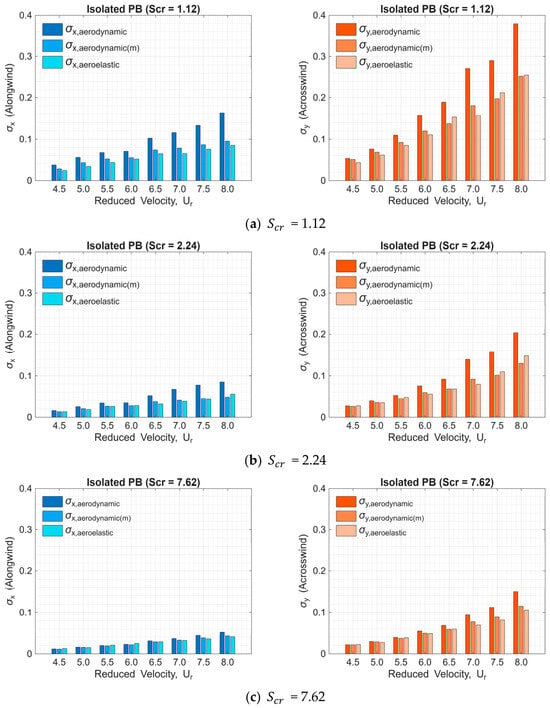
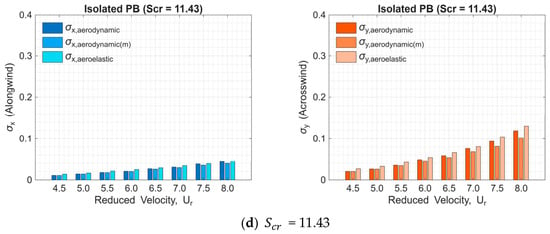
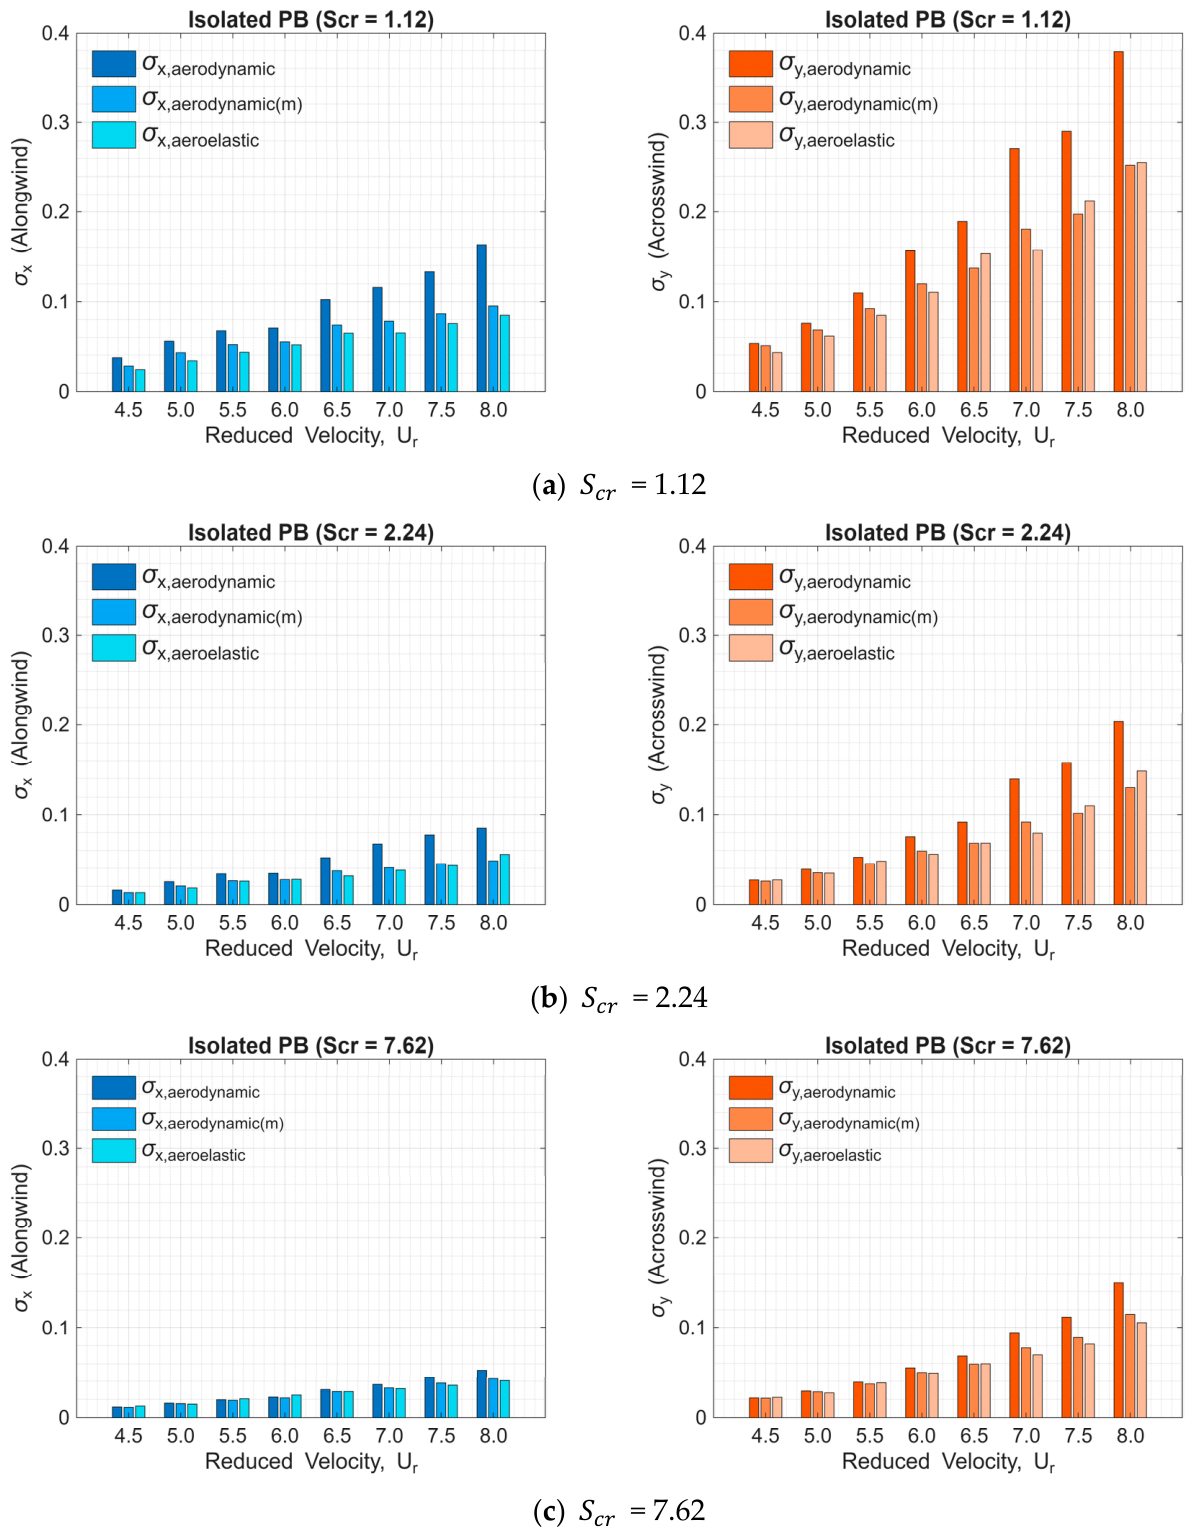
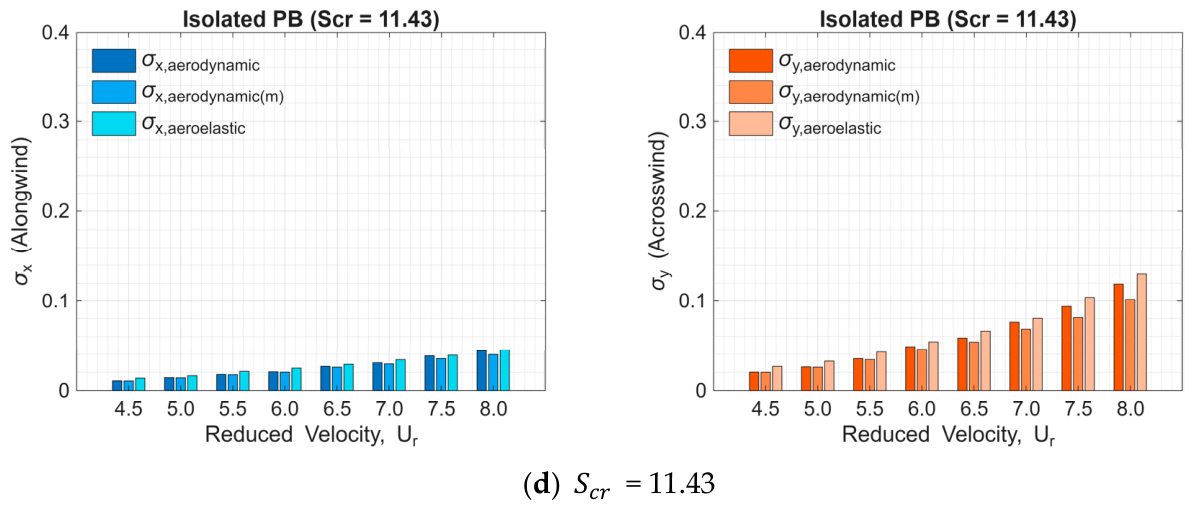
Figure 12 shows the regressed polynomial forms for the mean values of those aerodynamic damping difference from building models where equals 1.12, 2.24, and 7.62 using Equation (4) for the along-wind and across-wind directions, respectively. Relatively high R2 values in both directions indicate that the polynomial models in Equation (4a,b) fit the differences in aerodynamic damping ratio estimated by both identification techniques well. In Figure 12, only the three cases with Scruton numbers from 1.12 to 7.62 are regressed, excluding the unclear case with a Scruton number of 11.43. In this study, the model with a Scruton number of 11.43 exhibits only mild vibration, which is hardly detectable by the RDT method. To express how the differences in Figure 12 significantly reflect in structural responses, Figure 13 shows the standard deviations of the along-wind and across-wind displacements for three estimation paths. For instance, represents the result based on the RDT-identified aerodynamic damping ratio; represents the result based on the trial-and-error approximated aerodynamic damping ratio; represents the direct measurements from aeroelastic tests. Except for the case with a Scruton number of 11.43, the other three cases show greater consistency with the direct measurements from aeroelastic tests, thereby forming a fair baseline for estimating the interference-induced aerodynamic damping ratio in the subsequent discussion.
Figure 12.
The differences between aerodynamic damping ratios identified and approximated by the RDT method and the trial-and-error method.
Figure 13.
Standard deviations of the along-wind and across-wind displacements against reduced velocity.
3.2. Interfered Behavior of the Principal Building
3.2.1. Interfered Aerodynamic Forces Based on HFFB Tests
According to Bailey and Kwok (1985 [1]) and Lo et al. (2023 [33]), when the elliptical resonant vibration occurs, force spectra in the along-wind and across-wind directions have been compared to indicate a more significant portion of resonant responses than that of background responses when multiplied by the mechanical functions. The elliptical motion resembles an inclined, hollow trajectory, a combination of two harmonic motions with different amplitudes but at the same frequency. Therefore, the resonant component of the structural response is the dominant component representing the vibration behavior of the principal building model under interference [1,33], as determined by HFFB tests. The resonant component of the standard deviations in the displacement is estimated by the narrow-band assumption of a Gaussian distributed variable, as in Equation (5).
where is the velocity pressure and is determined by ; is the air density and is the mean wind speed at the building model height. and are the power spectral density functions of the overturning moment coefficients and in the across-wind and along-wind directions, respectively. and are determined by Equation (6). and are measured overturning moments from HFFB tests.
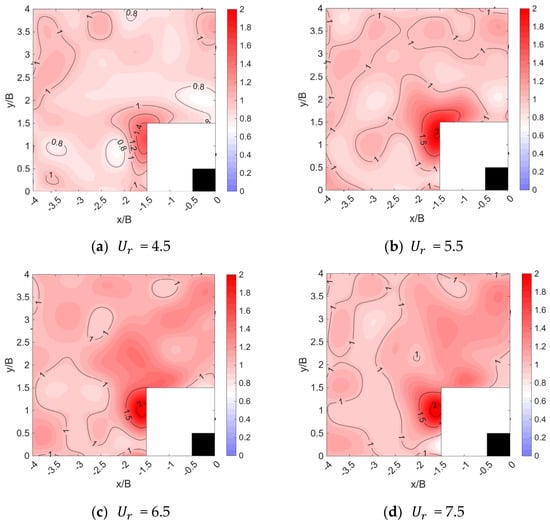
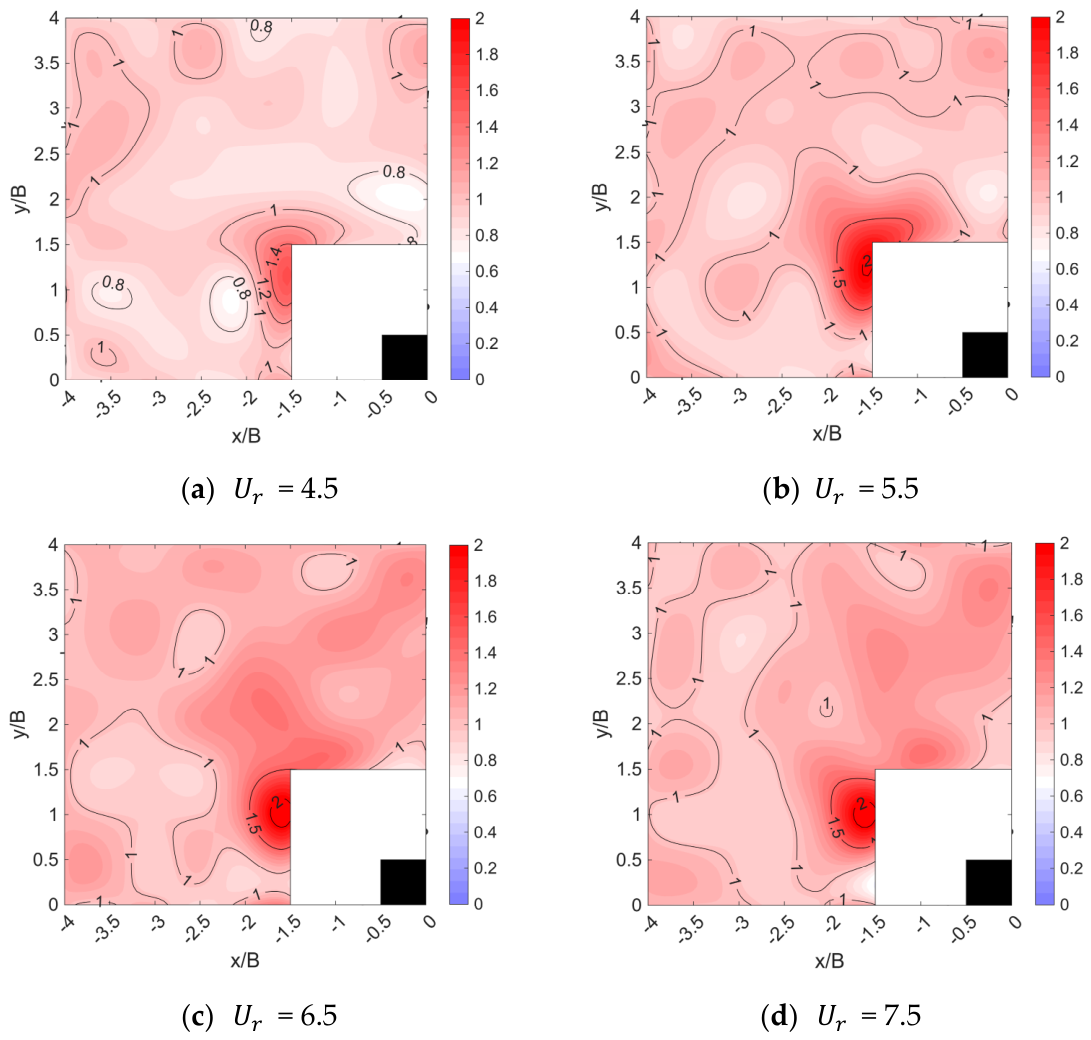
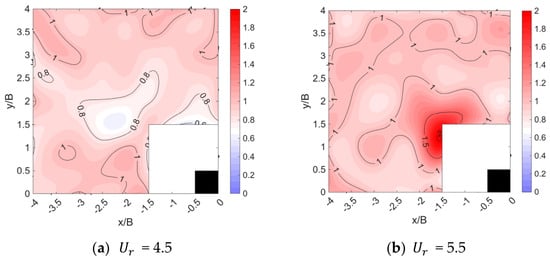
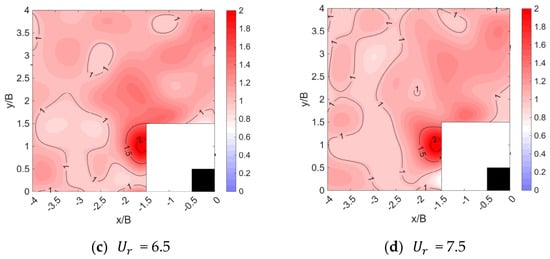
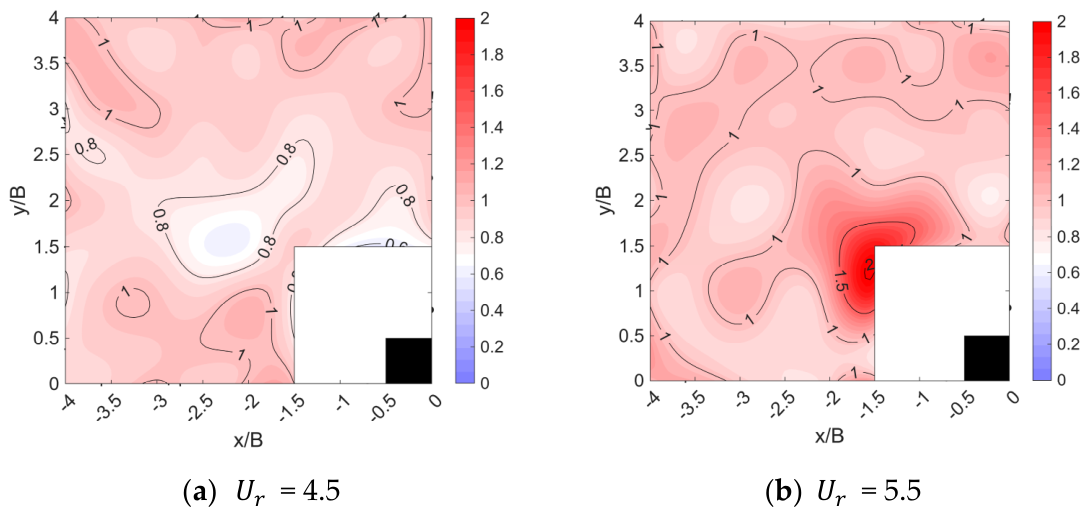
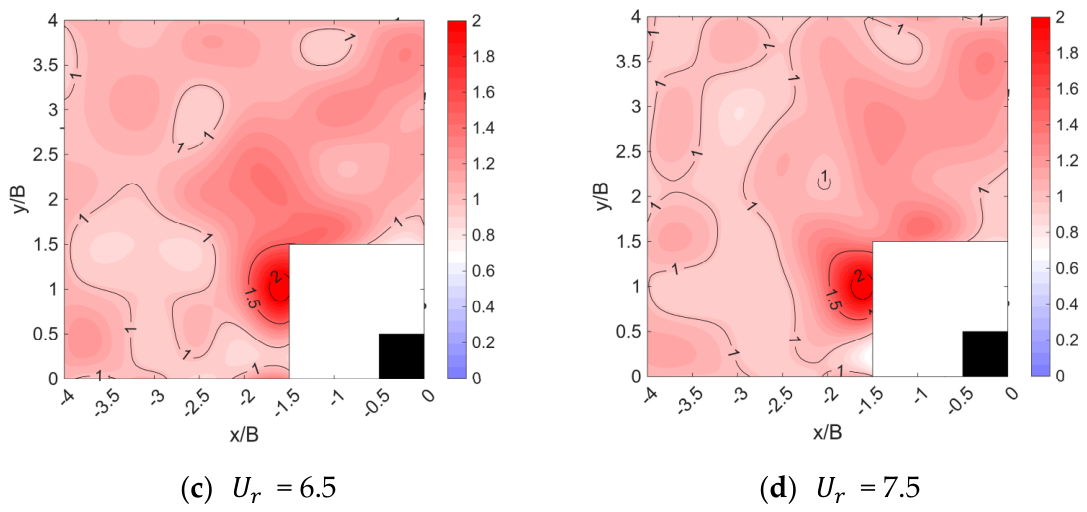
Further, an interference factor, defined as the ratio of the interfered quantity to the non-interfered quantity, more accurately indicates the significance of interference effects across different load-effect conditions. Figure 14 and Figure 15 show the contour plots of the interference factor of resonant-component standard deviations ( and ) in the along-wind and across-wind directions under selected reduced velocities. For the amplified resonant-component standard deviations () in the along-wind direction in Figure 14, the variation in reduced velocity does not make much difference in the location pattern. Most obvious amplified cases concentrate on the range of . A slight moving tendency from to with the increase in reduced velocity is indicated. The location of the amplified resonant component in the across-wind direction is less concentrated in a specific range, as shown in Figure 15. As the reduced velocity increases, the location where the amplified effects occur shifts from the leeward area of the principal building model to larger y/B values, even extending to the side area of the model. The largest amplification in the resonant-component standard deviations () in the across-wind direction is in the side area and a bit farther from the principal building model. Combining the observations in both directions, the specific location of is identified to have the significantly amplified resonant components in both directions, which coincides closely with the observation by Bailey and Kwok (1985) [1] and proves that the selected locations in red in Figure 8 are suitable for aeroelastic tests.
Figure 14.
Interference factor contour of resonant-component standard deviations in the along-wind direction.
Figure 15.
Interference factor contour of resonant-component standard deviations in the across-wind direction.
3.2.2. Interfered Vibration Behaviors Based on Aeroelastic Tests
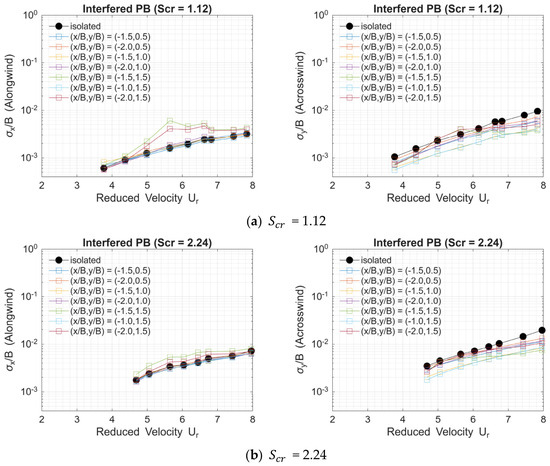
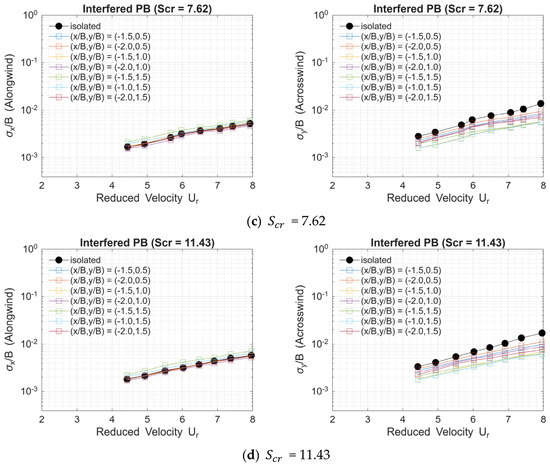
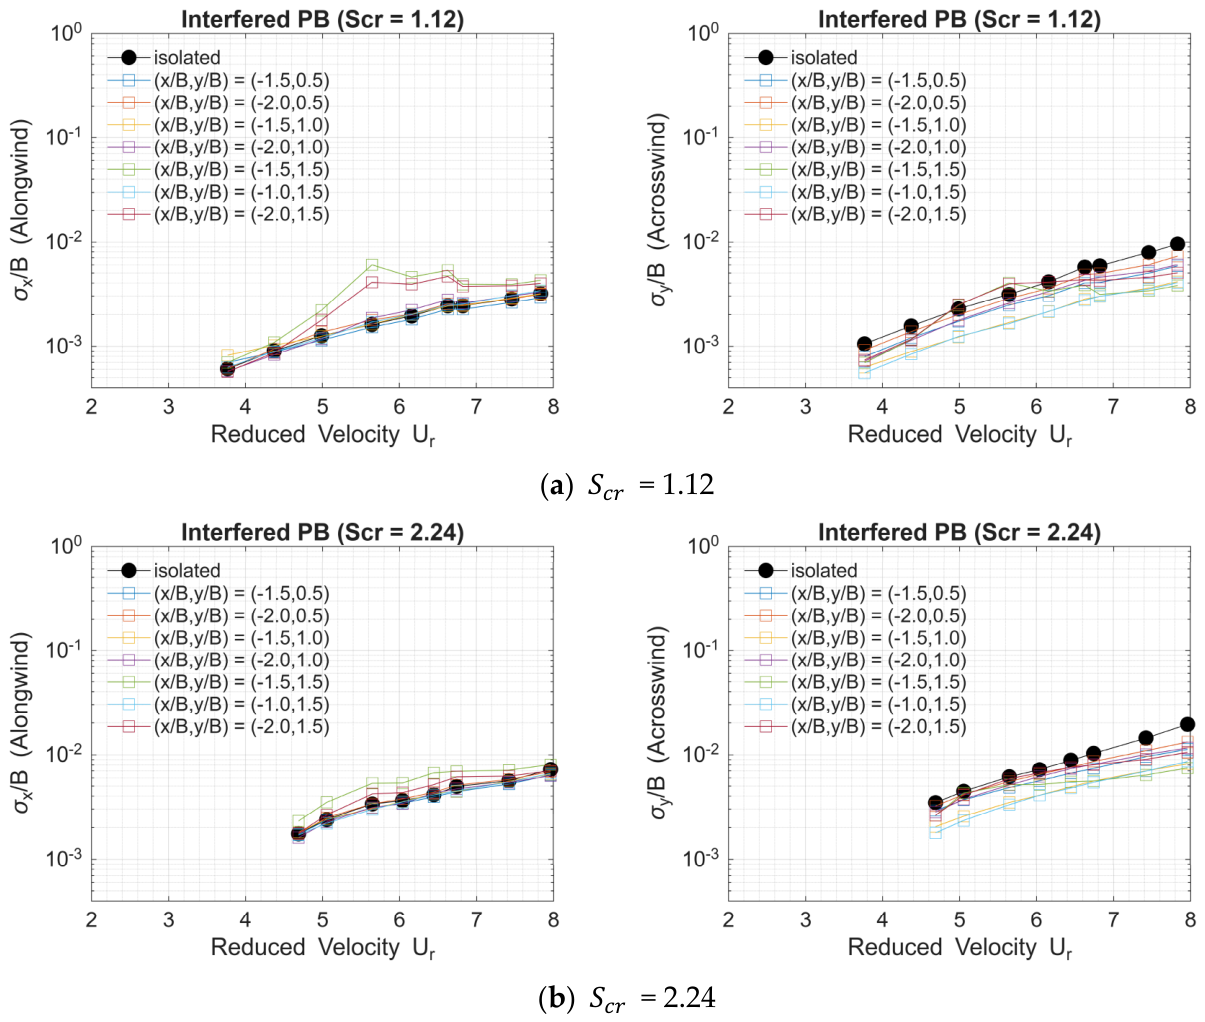
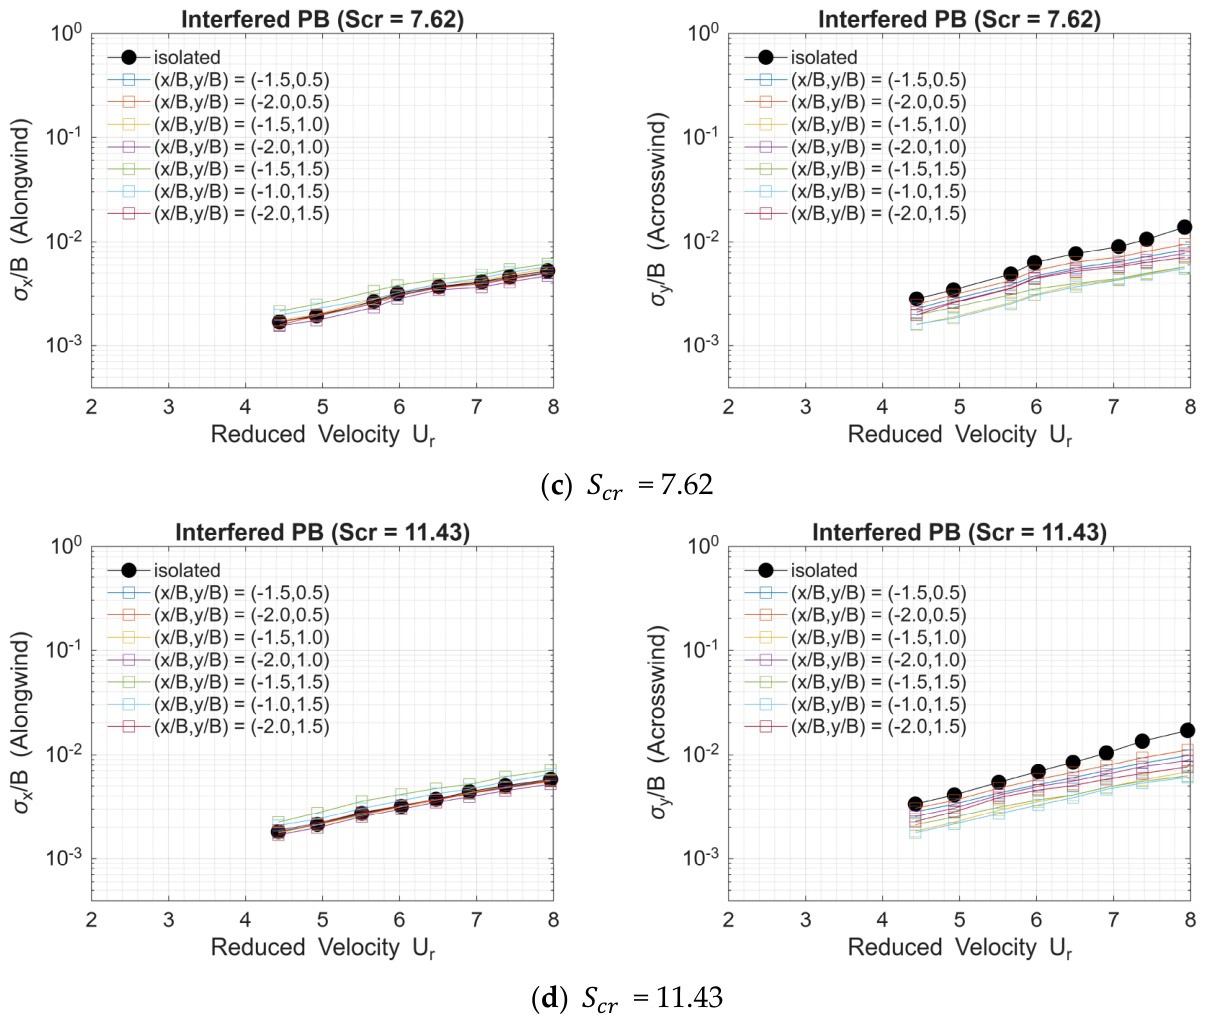
Figure 16 shows the variations in the normalized standard deviations of the along-wind and across-wind displacements as a function of reduced velocity. From the variations in the four Scruton number cases, it is clearly indicated that when the interfering building model is located at or and under reduced velocity is in the range of 5–7, the two cases with smaller Scruton numbers (1.12 and 2.24) exhibit clear amplification effects in the along-wind direction, while the only case with the smallest Scruton number (1.12) is found to have amplified effects in the across-wind direction. As observed in Figure 14 and Figure 15, a reduced velocity of 5.5 yields the most significant wind conditions for the oblique-downstream interference effects.
Figure 16.
Normalized standard deviations of the along-wind and across-wind displacements against reduced velocity.
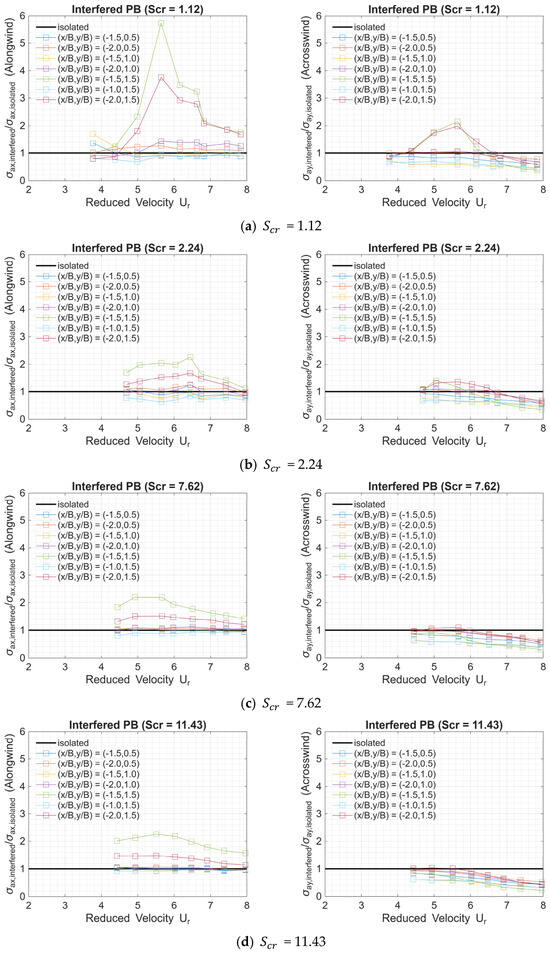
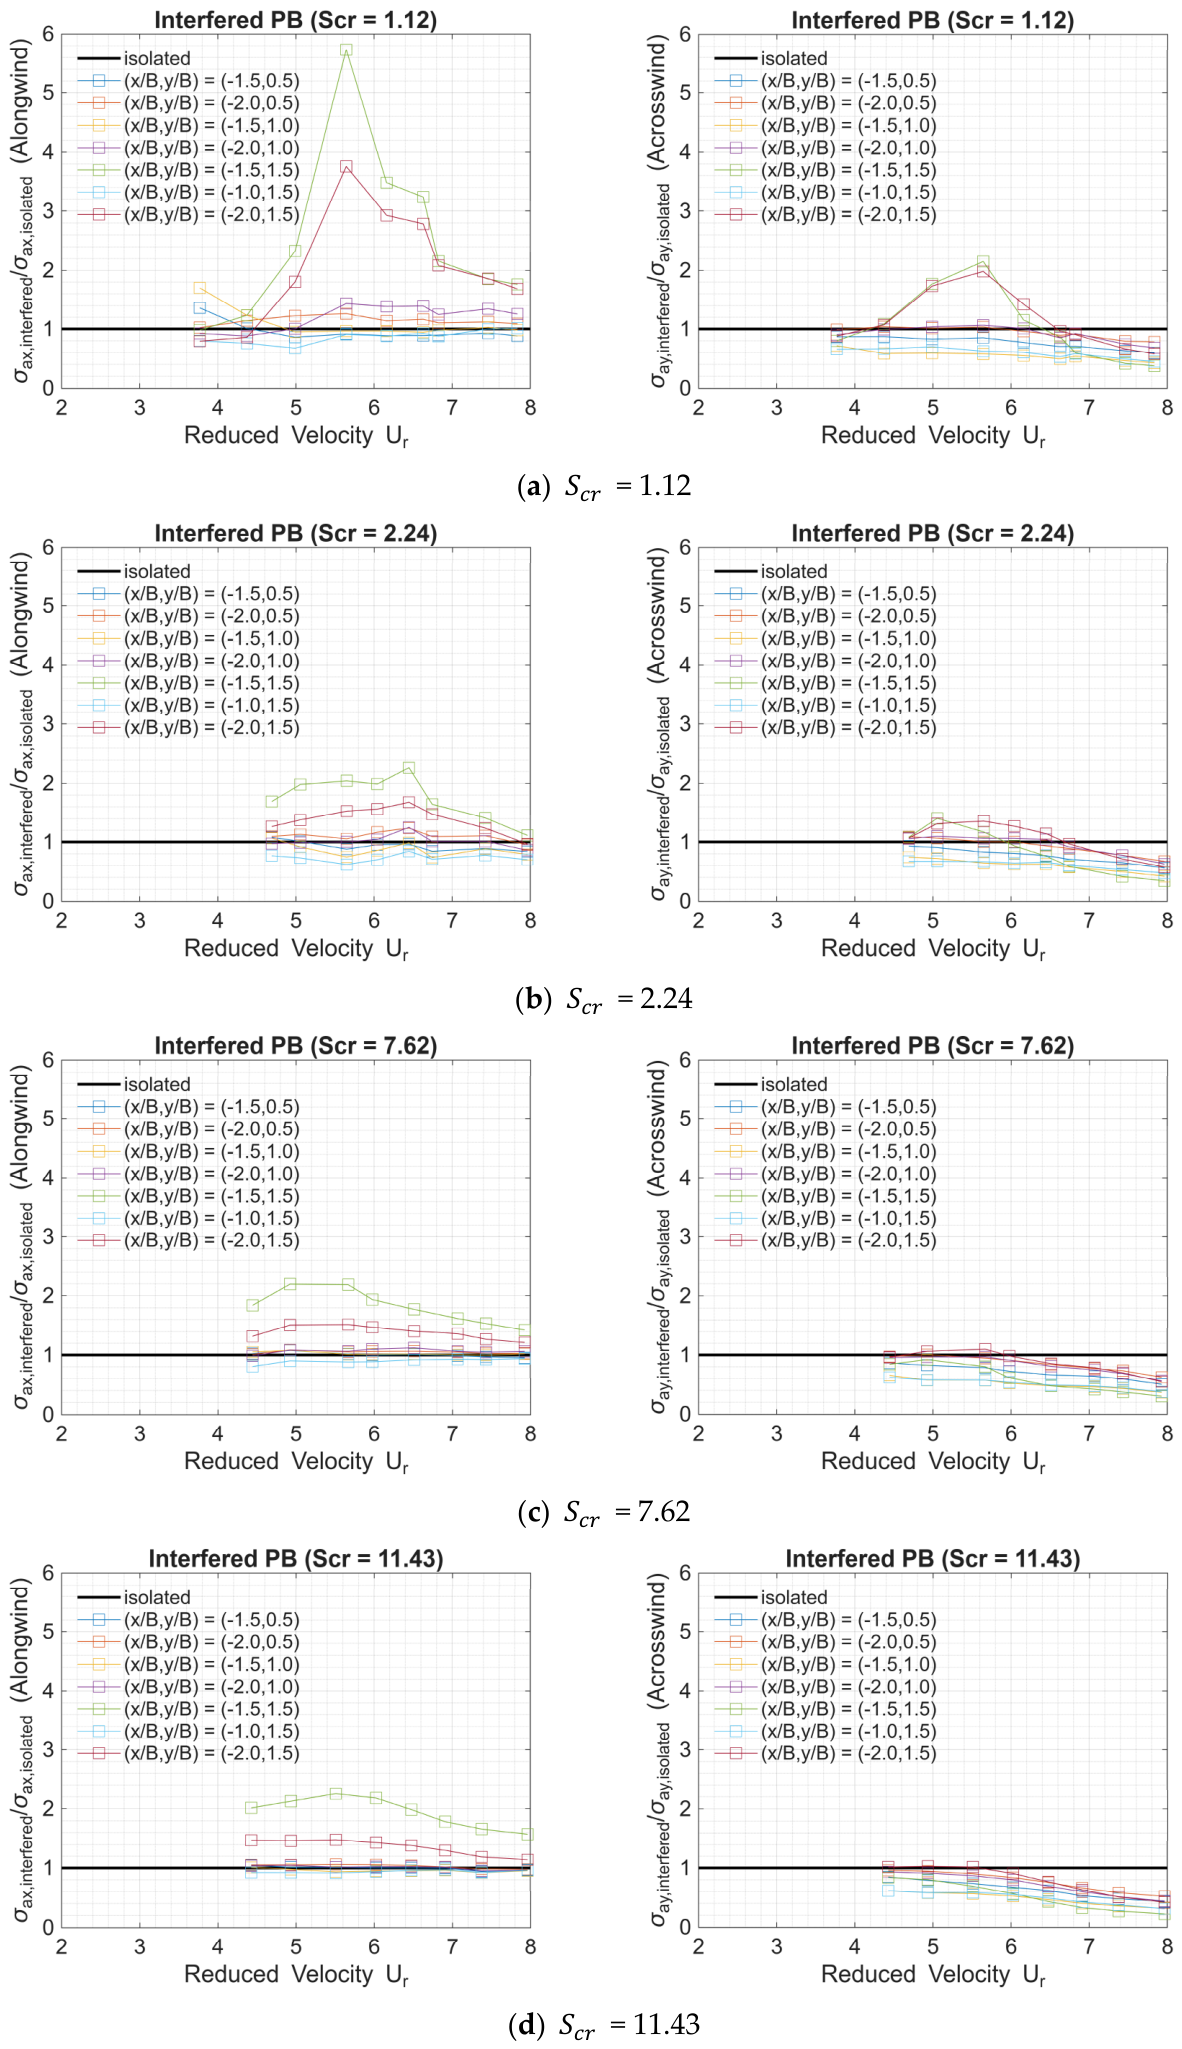
Applying the rooftop acceleration time series of the principal building model yields a different perspective on the interference effects caused by the four Scruton number cases. Figure 17 shows the variations in the rooftop acceleration-attributed interference factors in the along-wind and across-wind directions for the four Scruton number cases. Unlike the displacements in Figure 16, the interfered acceleration is clearly indicated for all four Scruton number cases in the along-wind direction. As the Scruton number increases, the largest interference factor in the along-wind direction decreases. All Scruton numbers show the consistent location or to be the most sensitive location for the along-wind acceleration; however, as the Scruton number changes, the reduced velocity changes when the most significant interference effect occurs. It is interesting to learn that even when the Scruton number is increased to a relatively high value of 11.43, the acceleration-attributed interference factor can reach 2.0, indicating that the Scruton number makes a difference across different load effects due to the oblique-downstream interference effect. On the other hand, only the smaller Scruton numbers show a clear amplified interference effect at the same interference locations near the reduced velocity of 5.5.
Figure 17.
Normalized standard deviations of the along-wind and across-wind accelerations against reduced velocity.
Combining the observations of the interfered displacements and accelerations among Figure 16 and Figure 17 concludes that the Scruton number of 1.12 for the principal building model, with the existence of the neighboring interfering building model allocated at and under the reduced velocity of 5.5, gives the best arrangement for the occurrence of the well-known oblique-downstream interference effect phenomenon. Bailey and Kwok (1985 [1]) indicated the interference factor reaches 4.36 in the along-wind displacement and 1.73 in the across-wind displacement when the interfering building is located at under the reduced velocity of 6.0 [1]. Similarly, Huang and Gu (2005 [45]) mentioned an interference factor of 2.69 in the along-wind displacement when the interfering building is located at under the reduced velocity of 5.85 [45]. Lo et al. (2023 [33]) not only identified the consistent interference location and reduced velocity, but also pointed out the intrinsic differences between the oblique-downstream interference effect and the (straight) downstream interference effect [33]. From the reported reduced velocities and interference locations in the literature [1,33,45], potential influences on the occurrence of the elliptical resonant vibration in the aeroelastic tests may be attributed to the differences in the aspect ratios of the building models, the simulated Scruton numbers, the simulated incoming turbulence across different lab environments, and so on. It is worth noting that elliptical resonant vibration is probably the most complex interference mechanism identified in the literature to date, and the current study may have uncovered only parts of its nature.
In Table 2, the standard deviation values of acceleration responses in both directions for different interference cases under Ucr = 5.5 are multiplied by a peak factor of 2.5 to estimate the 1 s peak acceleration during a 10 min time segment at the field scale. According to AIJ 2015 [46], the habitability curve with the H-70 index is chosen for comparison. By inserting the building’s fundamental frequency 0.223 Hz (converted from 13 Hz based on a time-scale factor of 1/58), 0.025 m/s2 is chosen as the threshold value for comparison. Table 2 clearly indicates that, even though the interference factor is approximately 2.0 for Scr = 11.43 when the interfering building is at the critical location, the absolute peak acceleration due to oblique-downstream interference effects is still far from being inhabitable. The peak acceleration increases as the Scruton number decreases; however, no exceeding case is observed until the Scruton number reaches its lowest value in this study. When the interfering building is located at (x/B, y/B) = (−1.5, 1.5), the peak acceleration is about 3.5 times the threshold value, which significantly impairs habitability. The Scruton number of high-rise buildings in the real world generally exceeds 10. Therefore, even if the interference effects cause a factor of 2 in comparison with the isolated base, the estimated peak acceleration should be suppressed to nearly no harm to habitability. However, if the Scruton number is below a certain threshold, the interference-induced habitability problem should be a concern.
Table 2.
Estimated peak acceleration responses for PB under Ucr = 5.5.
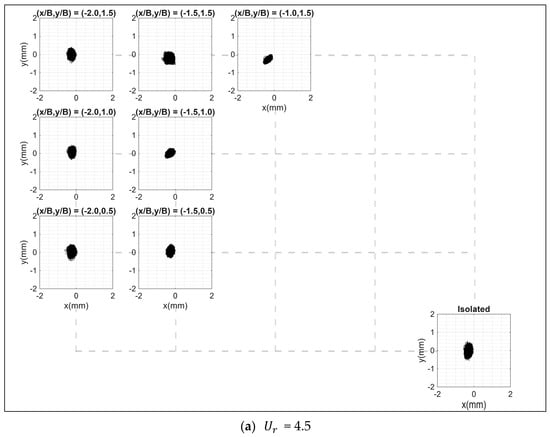
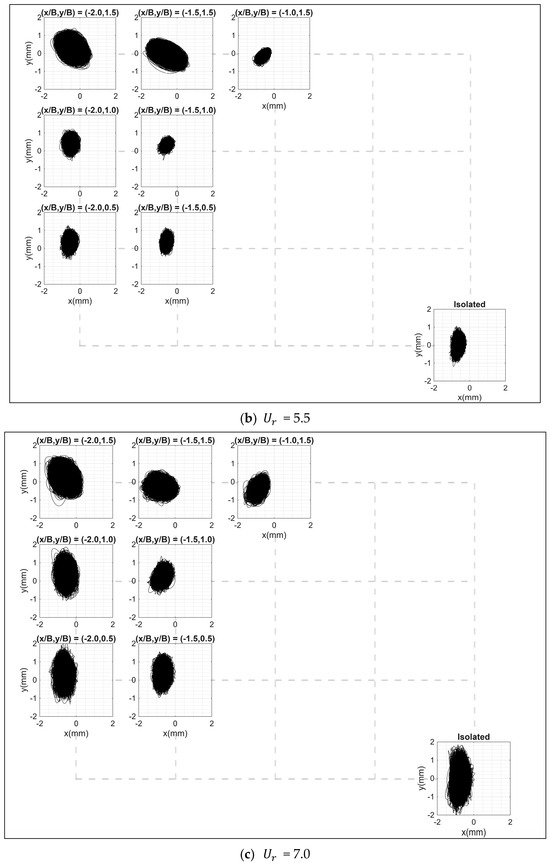
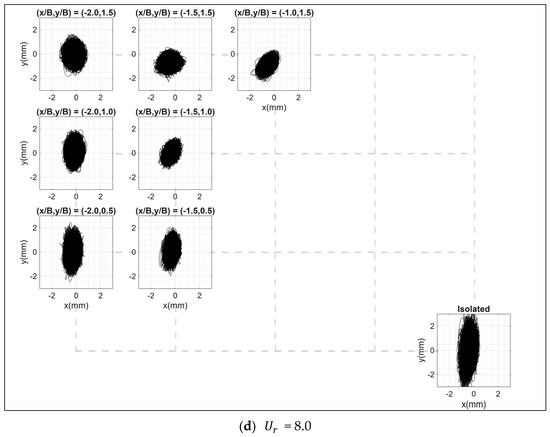
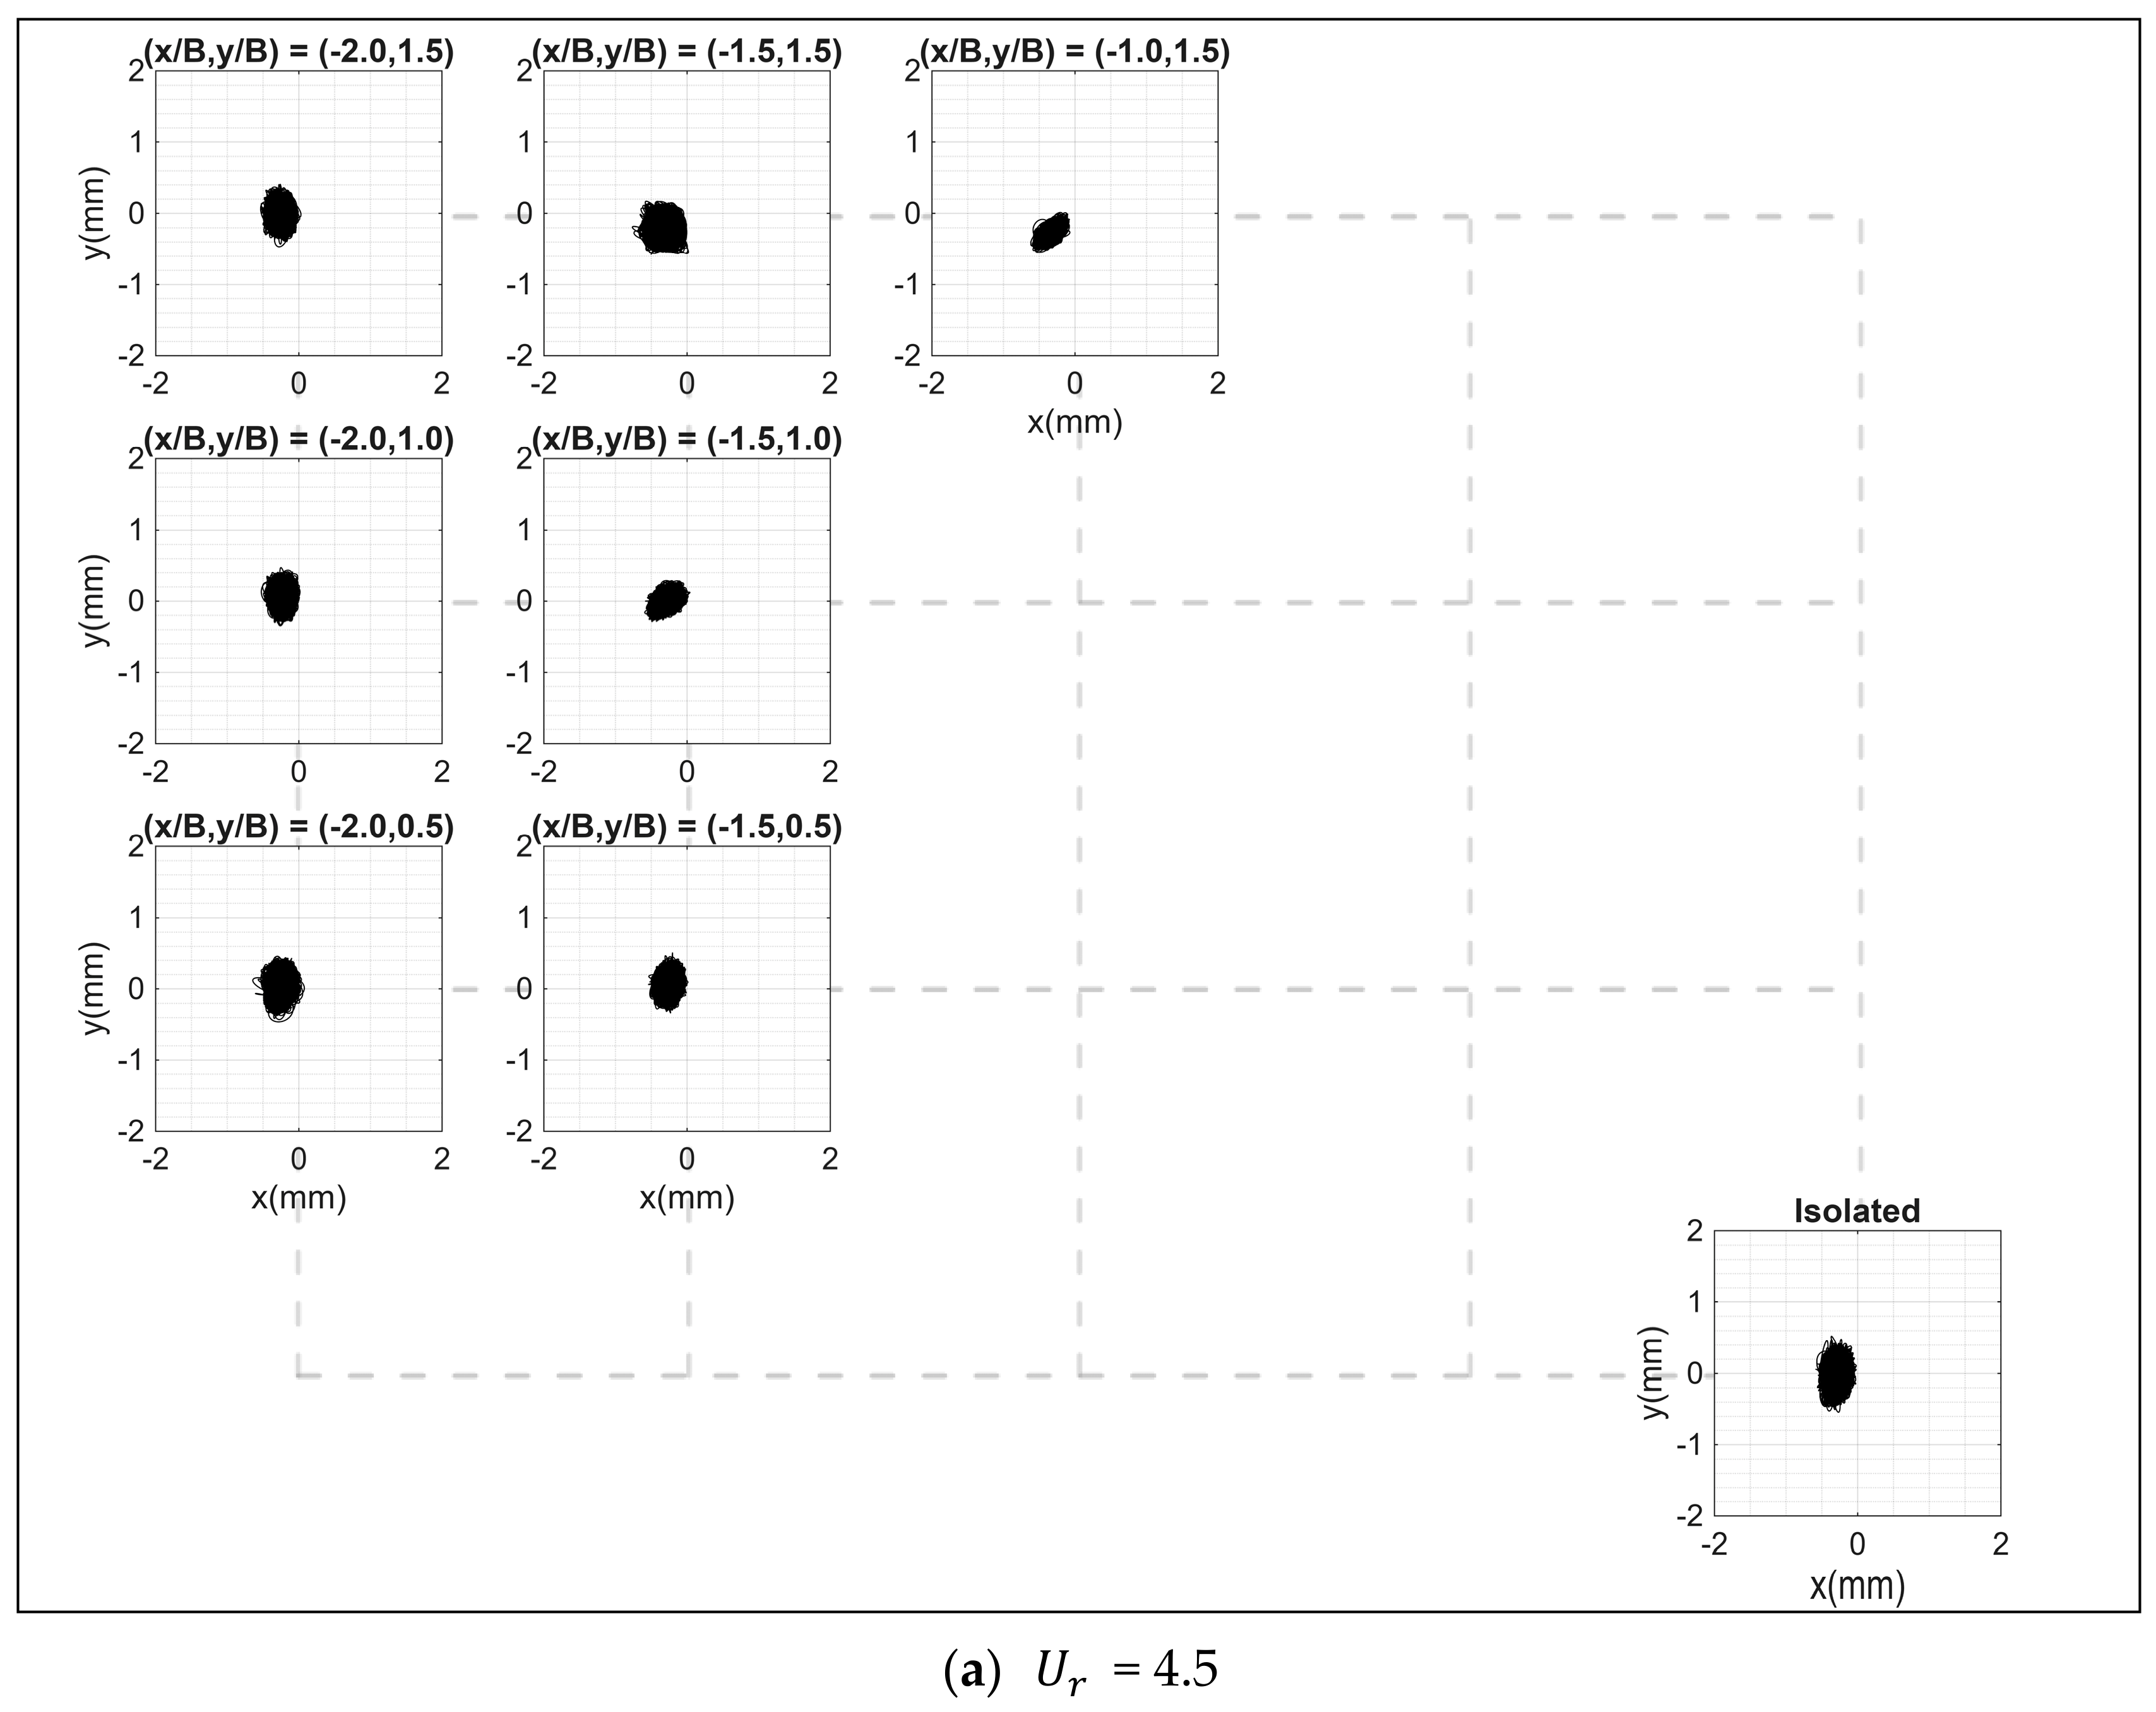
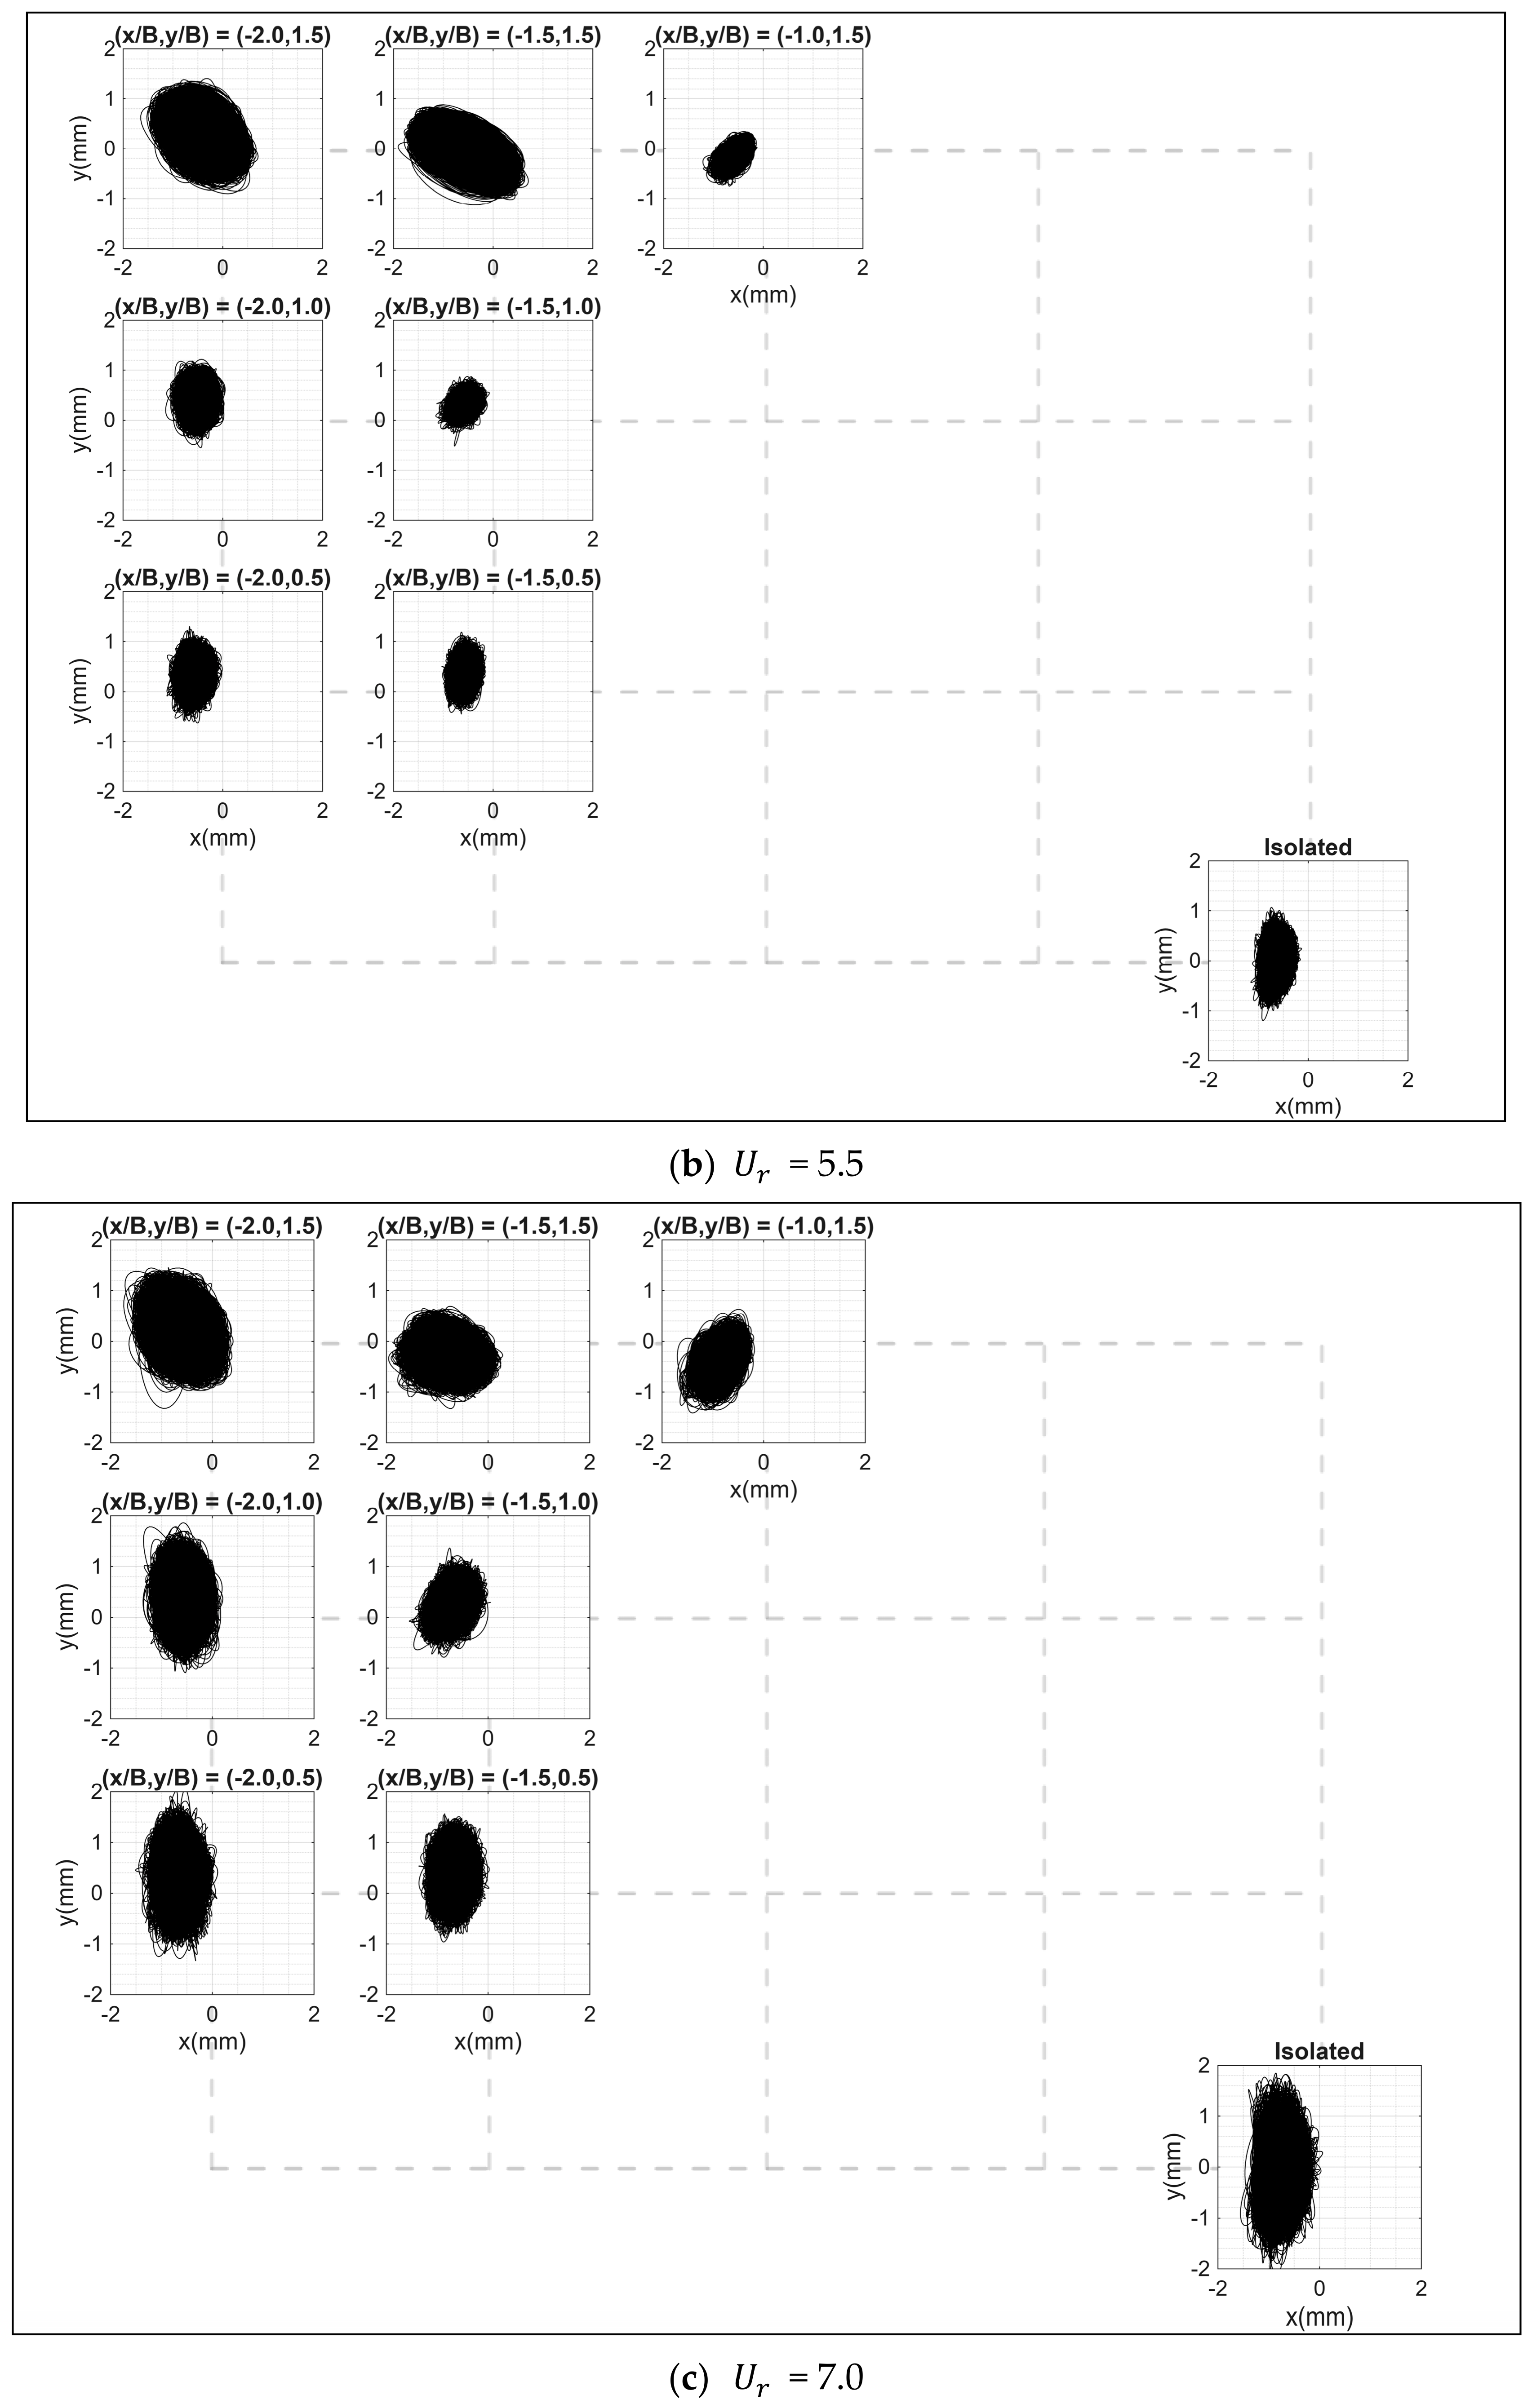
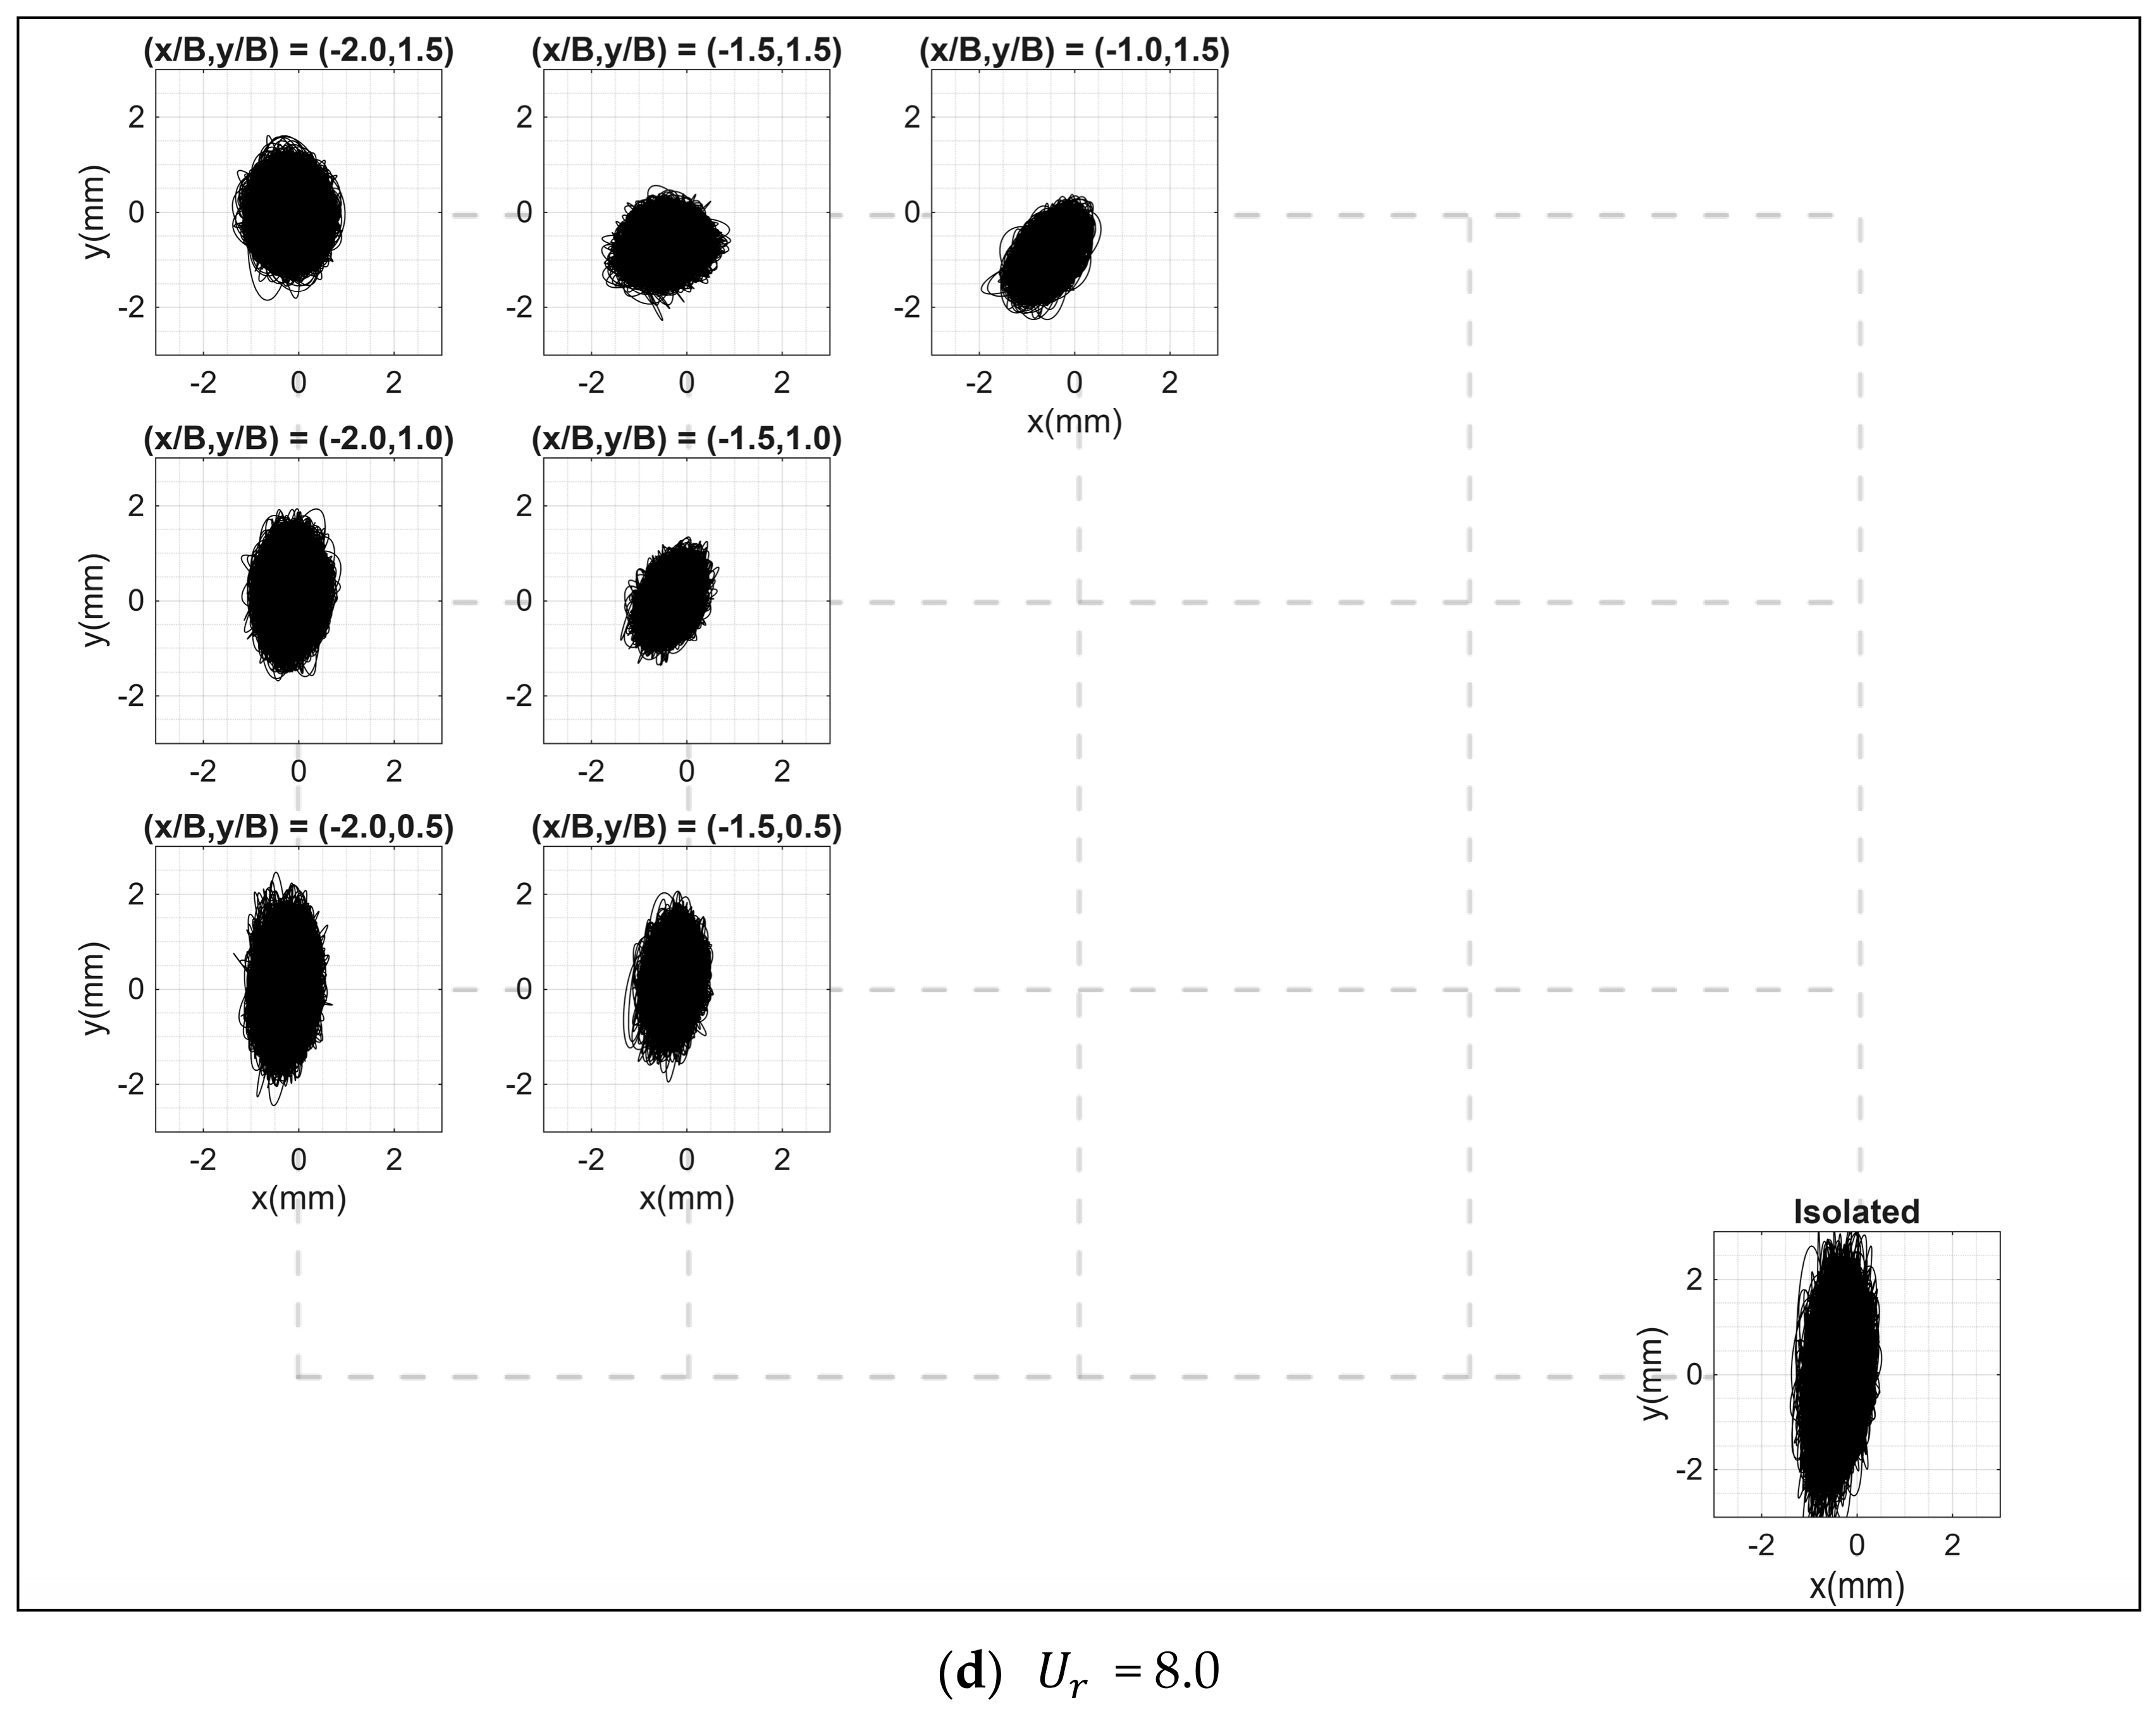
Figure 18 shows the displacement trajectories in the plane for the principal building model with under several selected reduced velocities. In these trajectory plots, seven interference locations are shown for comparison with the isolated principal building case. When the reduced velocity is 4.5, the sizes of the trajectory area for the case and for the isolated case are nearly the same. When the reduced velocity rises to 5.5, the size of the trajectory area for the case becomes much bigger and inclined to nearly a 45-degree slope toward the downstream, consistent with the vector direction from the origin to the interference location . The slope becomes vague when the interference location moves to . When the reduced velocity further increases to 7.0 and 8.0, the trajectory area is no longer an inclined elliptical shape but a more circular one, meaning that the high correlation between the along-wind and across-wind displacements is lost; therefore, the oblique-downstream interference effect disappears. Another interesting observation is that the trajectory areas at and show a nearly constant slope of the elliptical shape toward to the upstream, no matter how reduced velocity varies. The opposite slopes shown at and under the reduced velocity of 5.5, as shown in Figure 18b, requires a more detailed investigation with a finer resolution for interference locations.
Figure 18.
Displacement trajectories in the XY plane of the principal building model with = 1.12 under selected reduced velocities.
Consider the case where an interfering building is located at the coordinate of (x/B, y/B) = (−1.5, 1.5). As the incoming flow encounters the principal building, the sharp edges of the windward face trigger flow separation, resulting in the formation of downstream-moving vortices. When a vortex forms on the side adjacent to the interfering building, it enters the narrow gap between the two buildings. This constriction creates a channeling effect that increases flow velocity and, consequently, amplifies negative pressure (suction). This pressure imbalance draws the principal building toward the interfering building. As this initial vortex moves downstream, a counter-rotating vortex begins to develop on the opposite side of the principal building (the side without interference). Because this side remains unobstructed, the vortex shedding remains undisturbed. The periodic and alternating formation of these vortices, coupled with the guided shedding through the gap between the buildings, induces an oblique elliptical motion of the principal building toward the interfering building. If the vortex-shedding frequency aligns closely with the natural frequency of the principal building, elliptical resonance occurs, leading to a dramatic increase in vibration amplitude.
When considering the interfering building at coordinates of (x/B, y/B) = (−1.0, 1.5) or (−1.5, 1.0), the proximity between the two buildings creates an excessively narrow channel. This spatial constraint prevents the vortices, triggered by flow separation at the windward leading edge of the principal building, from passing through completely. Consequently, on the side adjacent to the interfering building, the resulting negative pressure acting on the principal building is reduced and remains perpendicular to the building. In contrast, a fully developed vortex can still form on the unobstructed side. As this vortex moves downstream, it wraps into the gap between the principal and interfering buildings, generating positive pressure at the corner of the principal building. This pressure distribution creates a pushing force that moves the principal building in the upstream direction. Due to this alternating vortex-shedding interaction on both sides, the resulting motion of the principal building is opposite to that observed in the (x/B, y/B) = (−1.5, 1.5) case, leading to an inverted phase change in the trajectory plot.
3.2.3. Interference-Induced Aerodynamic Damping Ratio for the Oblique-Downstream Interference Effects
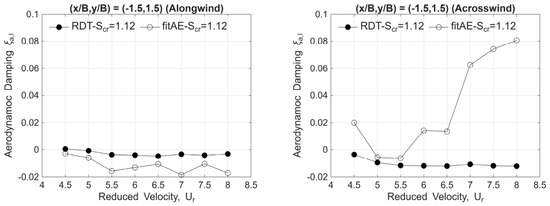
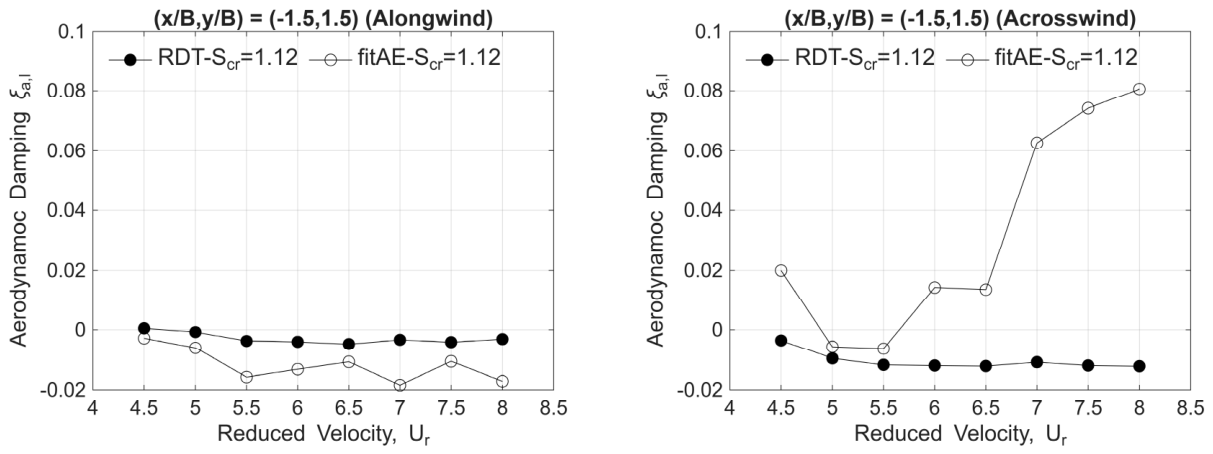
From previous discussions, rather strict limitations are identified for initiating oblique-downstream interference effects, including the interference location, reduced velocity, and the Scruton number. Assuming that interference effects do not alter the fundamental frequency of the building model, the aerodynamic damping ratio shall play a key role in the governing equation, amplifying the structural response. As in the previous discussion of aerodynamic damping in an isolated principal building model, the systematic damping ratio is first identified using the random decrement technique, and then the trial-and-error method is adopted to find the approximated systematic damping ratio that produces the same structural response (here, the displacement) as the results from aeroelastic tests. In Figure 19, the interference-induced aerodynamic damping ratio is calculated based on Equation (7) in a simple linear way.
Figure 19.
Aerodynamic damping ratios identified by the random decrement technique (“RDT” in the legend) and approximated by the trial-and-error method (“fitAE” in the legend) for the interfering building model located at (, ) = (−1.5, 1.5).
In Equation (7), is the resultant or systematic damping ratio of the whole system; is the aerodynamic damping ratio induced by the isolated principal building itself; is the interference-induced aerodynamic damping ratio due to the existence of the neighboring interfering building. The trajectories in Figure 18 reflect the consequent structural displacement amplitudes due to the generally negative and the varying positive interference-induced aerodynamic damping ratios in Figure 19. The critical case with the interference location of under the reduced velocity of shows an amplified along-wind displacement and a nearly the same across-wind displacement as the isolated case. The amplified along-wind displacement is attributed to the −2% negative interference-induced aerodynamic damping ratio, whereas the almost-identical across-wind displacement is associated with the nearly zero interference-induced aerodynamic damping ratio. Among all reduced velocities in Figure 19, only at reduced velocities of 5.0 or 5.5 will amplified structural responses be observed in both directions, especially the latter. The suppression of the across-wind displacement is clearly observed as the reduced velocity increases.
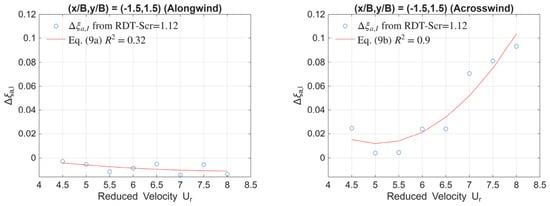
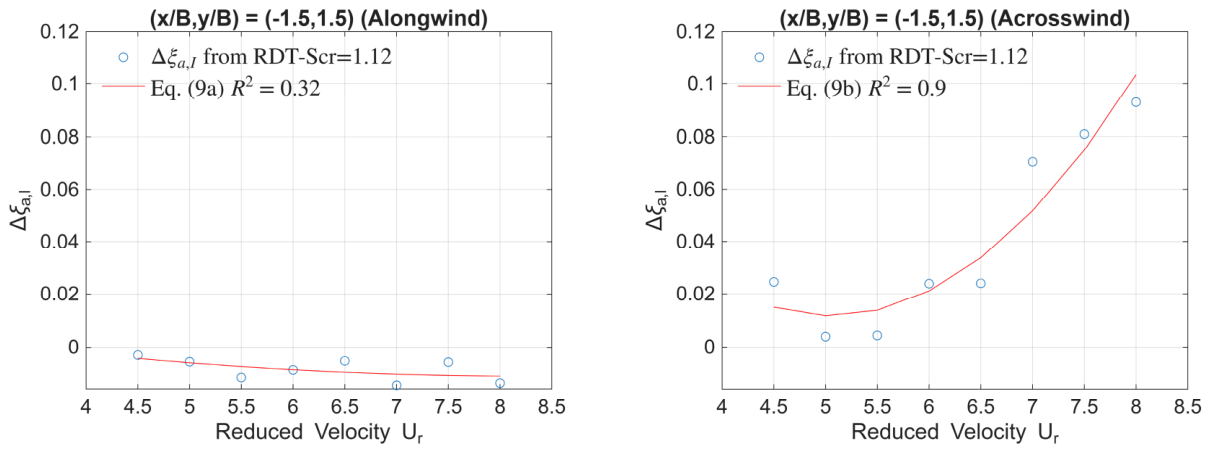
From the two distinct variations by the RDT method and the trial-and-error method in both figures in Figure 19, the trial-and-error method obviously produces a better agreement with the aeroelastic tests in estimating structural responses. Once again, the differences between the two methods for the interference-induced aerodynamic damping ratio are regressed for the along-wind and across-wind directions, as shown in Figure 20. Equations (8) and (9) are the polynomial regression models for the differences between the two methods. Intuitively, both polynomial models in Equation (9a,b) show good agreement with the observed data in both directions. However, the relatively low R2 value in the along-wind direction seems to be contradictory. Based on the default function POLYFIT in MATLAB (R2021a), the R2 value is defined in Equation (10), where is the ith observed sample and is the fitted point on the model. Because of the near-zero observed data in the along-wind direction, the calculated R2 value is low and inconsistent with the intuitive graphical representation. Generally speaking, the polynomial models of Equations (4a,b) and (9a,b) provide good agreement to represent the tendencies of the differences in aerodynamic damping ratios with respect to reduced velocities.
Figure 20.
The differences between interference-induced aerodynamic damping ratios identified and approximated by the RDT method and the trial-and-error method for the interfering building model located at (, ) = (−1.5, 1.5).
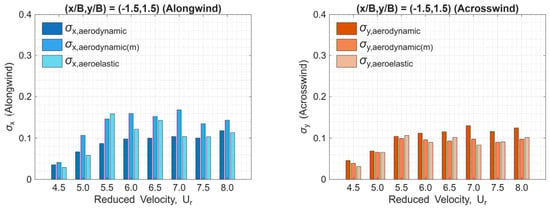
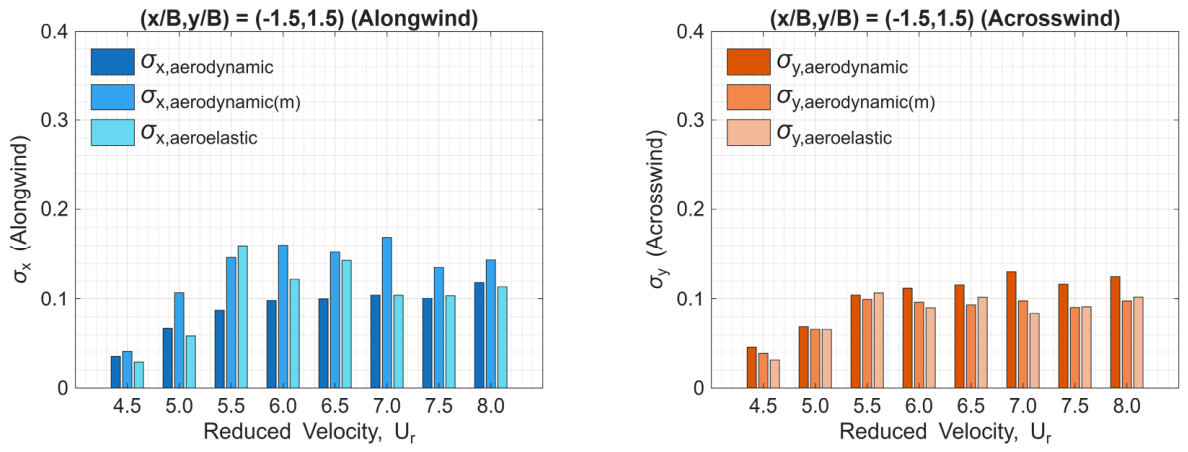
With the modifications of the interference-induced aerodynamic damping ratios in the along-wind and across-wind directions, Figure 21 shows a fairly good agreement in applying proper systematic damping ratios to the governing equation to estimate the standard deviations of the along-wind and across-wind displacements, especially for the critical case with the interference location of at the reduced velocity of . In Figure 21, represents the estimated structural response with the identified by the RDT method; represents the estimated structural response with the compensation of based on Equation (9a,b). Nevertheless, it is worth mentioning that the critical case in this study for the occurrence of the oblique-downstream interference effects remains under the following strict conditions: (1) both the principal building and the interfering building models are identically square-cross-sectional cylinders; (2) reduced velocity of 5.5; (3) interference location of ; (4) low-Scruton number . These strict conditions have also been consistent with those works in the literature.
Figure 21.
Standard deviations of the along-wind and across-wind displacements against reduced velocity for the interfering building model located at (, ) = (−1.5, 1.5).
3.3. Interference Effects Due to Cross-Sectional Variation in Interfering Building Models
Realizing that oblique-downstream interference effects occur under strict conditions, it might be interesting to investigate whether cross-sectional variation in the interfering building model alters these conditions. The principal building model with the Scruton number = 1.12 is selected as the fixed condition due to its tendency to produce clearer vibration behavior. The interfering building model’s cross-section is then varied from B/D = 0.2 to 5.0, where B/D is the ratio of the breadth of the windward face to the depth of the side face. Interference locations near (, ) = (−1.5, 1.5) are attempted with varying reduced velocities from 4.5 to 6.5, which generate sufficient cases for the observation of the oblique-downstream interference effects. To save time, the authors first applied the HFFB tests to all interfering building models to identify the critical location with the most significant overturning moment coefficients in both the along-wind and across-wind directions. The criteria for identification are set at a threshold of 1.4 for the displacement interference factor in the along-wind direction and 1.0 in the across-wind direction. The threshold values differ, and the value in the across-wind direction is smaller because the across-wind vibration is naturally larger under such conditions of high aspect ratio and low Scruton number. For cases that exceed these threshold values, they will be examined by the aeroelastic test to identify the most significant one as the representative of the B/D interfering building model.
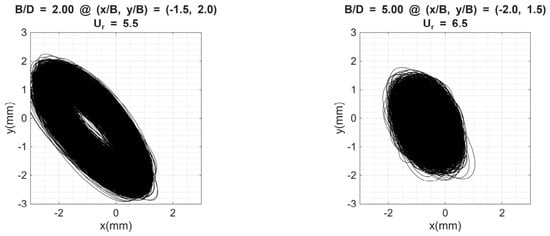
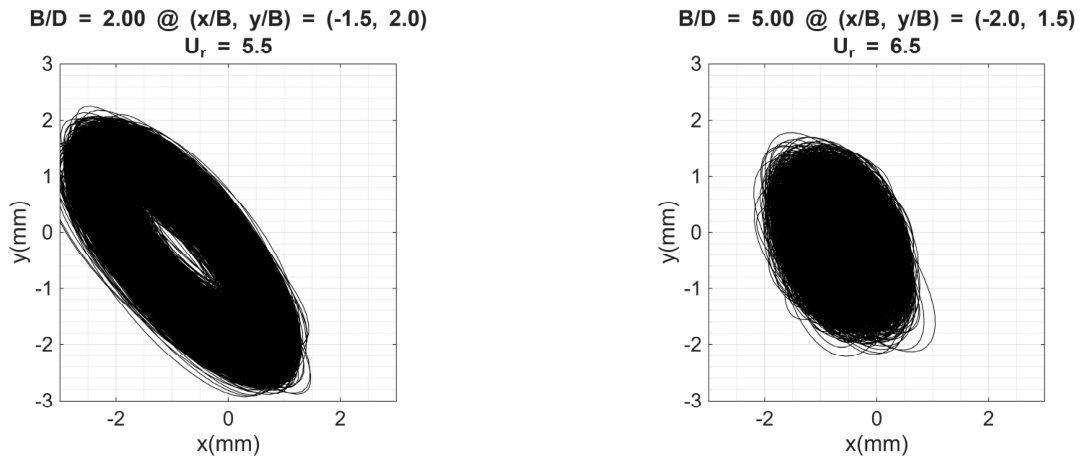
Table 3 presents the examined results, indicating that the interfering building model with different cross-sections will still exhibit possible oblique-downstream interference effects. However, the associated interference location and reduced velocity may be slightly different from the square one. The “NF” indicates those cases with relatively smaller interference factors in response magnitudes failed to pass the presumed threshold values for the subsequent aeroelastic tests. However, it is worth noting that such prescreening action is only an attempt in this study to efficiently examine those potential locations and reduced velocities for rectangular cylinders to have the elliptical resonant vibration. Figure 22 shows the displacement trajectories for the B/D = 2.0 and 5.0 cases. The former occurs at (, ) = (−1.5, 2.0) with a reduced velocity of 5.5; the latter occurs at (, ) = (−2.0, 1.5) with a reduced velocity of 6.5. Unfortunately, the authors did not identify any oblique-downstream interference effects for those B/D values smaller than 0.5. Based on the above observations, the occurrence of oblique-downstream interference effects has been shown to be a complex phenomenon, requiring a more detailed experimental setup, such as higher-resolution measurements of interference locations or reduced velocities, to elucidate its dominant mechanism.
Table 3.
Identified cases for the occurrence of oblique-downstream interference effects for PB model with = 1.12.
Figure 22.
Displacement trajectories in the XY plane of the principal building model with = 1.12 for B/D = 2.0 and 5.0.
4. Conclusions
The present experimental investigation systematically elucidated the aerodynamic mechanisms governing oblique-downstream interference effects on high-rise buildings. By synthesizing data from high-frequency force balance (HFFB) tests and aeroelastic vibration measurements in a simulated atmospheric boundary layer, this study characterized the dynamic sensitivity and the modulation of aerodynamic damping. The principal conclusions derived from this study are as follows:
Identification of Critical Parameters for Oblique-downstream Interference Effects: The manifestation of pronounced oblique-downstream interference is predicated on certain ranges of aerodynamic and structural parameters. The most severe response amplifications were identified at a specific reduced velocity () when the principal building featured a minimal Scruton number () and the interfering building was strategically positioned at the neighboring location of . Under these specific conditions, the principal building exhibits a characteristic inclined elliptical trajectory, indicating a highly correlated resonant state in both the along-wind and across-wind directions.
Necessary Modification to Aerodynamic Damping via RDT: Through the integration of the random decrement technique (RDT) and a trial-and-error approximation method, this study successfully quantified the interference-induced aerodynamic damping ratio (). The findings confirm that the dramatic escalation in along-wind displacement at the critical location is fundamentally driven by a significant negative aerodynamic damping effect (approximately −2%), whereas the across-wind damping remains near-neutral. This delineates the oblique-downstream phenomenon as a primarily damping-driven aeroelastic instability.
Dynamic Sensitivity and Load Effects: The Scruton number is a decisive determinant of a structure’s vulnerability to interference flow. While elevated Scruton numbers ( and ) effectively mitigated resonant displacement amplitudes, substantial amplifications in rooftop accelerations remained persistent, with interference factors reaching magnitudes of up to 2.0. This underscores that even structures with enhanced dynamic stiffness may experience potential habitability and serviceability challenges under complex interference scenarios. For the most critical case, due to the oblique-downstream interferences in this study, the peak acceleration is about 3.5 times the threshold value based on the H-70 index in AIJ 2015 [46].
Geometric Sensitivity of the Interfering Source: Variations in the most critical case, due to oblique downstream interference, the building’s cross-sectional geometry fundamentally alters the interaction mechanism. While interfering models with breadth-to-depth ratios () exceeding 0.5 consistently induced oblique-downstream interference, slender configurations () failed to trigger equivalent resonant behaviors. This suggests that a requisite wake width from the interfering structure is essential for the establishment of the synchronized rhythmic channeling necessary to excite the principal building’s dynamic response. It is worth noting that the breadth-to-depth ratios adopted for the interfering building models in this study indicate a wide range of the rough threshold search. It requires an additional step to carefully examine those values close to 0.5 to determine the actual B/D threshold value for the occurrence of the attempted interference effects.
It is worth noting that the experimental settings in this study can be further improved to achieve finer resolution in the interference locations and a reduced velocity range. For instance, it could be a further extension of this study to explore the mechanisms of the two elliptical displacement trajectories occur at two neighboring locations, and , exhibiting two opposite slopes. On the other hand, this study only used experimental techniques to investigate oblique-downstream interference effects. It would also be helpful in the extension of this study to apply CFD numerical analysis tools to help demonstrate the flow’s streamline movements between the principal building and the interfering building for the general understanding of the geometric sensitivity of the interfering sources. It is also worth noting that wind directionality is not discussed in relation to the occurrence of the elliptical resonant vibration in this study. All the building models in both aerodynamic and aeroelastic tests are arranged with their windward faces kept perpendicular to the incoming wind, which certainly narrows the range of discussion for this particular interference-effect mechanism. It would be the authors’ expectation to incorporate wind directionality into their future extensive work.
Author Contributions
Conceptualization, C.-H.C. and Y.-L.L.; methodology, Y.-L.L. and Y.L.; validation, C.-W.C. and Y.L.; formal analysis, C.-W.C. and Y.L.; investigation, Y.L.; data curation, C.-W.C. and Y.L.; writing—original draft preparation, Y. Li and Y.-L.L.; visualization, C.-W.C.; supervision, C.-H.C. and Y.-L.L. All authors have read and agreed to the published version of the manuscript.
Funding
This research received no external funding.
Data Availability Statement
Please email the corresponding author to access the data availability of the experimental data from this research.
Conflicts of Interest
The authors declare no conflicts of interest.
Abbreviations
The following abbreviations are used in this manuscript:
| ANNs | Artificial neural networks |
| CFD | Computational fluid dynamics |
| ERA | Eigensystem realization algorithm |
| GEVD | Generalized extreme value distribution |
| HFFBs | High-frequency force balancers |
| IF | Interference factors |
| JR3 | JR3 Universal Force-Moment Sensor System |
| PB | Principal building |
| RDT | Random decrement technique |
| VIV | Vortex-induced vibrations |
| RPM | Rotational speed |
| Scruton number | |
| Ur | Reduced velocity |
References
- Bailey, P.A.; Kwok, K.C.S. Interference excitation of twin tall buildings. J. Wind Eng. Ind. Aerodyn. 1985, 21, 323–338. [Google Scholar] [CrossRef] [Scilit]
- Saunders, J.W.; Melbourne, W.H. Buffeting effects of upstream buildings. In Proceedings of the 5th International Conference on Wind Engineering, Fort Collins, CO, USA, 8–14 July 1979; pp. 593–608. [Google Scholar] [CrossRef] [Scilit]
- Kareem, A. The effect of aerodynamic interference on the dynamic response of prismatic structures. J. Wind Eng. Ind. Aerodyn. 1987, 25, 365–372. [Google Scholar] [CrossRef] [Scilit]
- Khanduri, A.C.; Stathopoulos, T.; Bedard, C. Wind-induced interference effects on buildings—A review of the state-of-the-art. Eng. Struct. 1998, 20, 617–630. [Google Scholar] [CrossRef] [Scilit]
- Thepmongkorn, S.; Kwok, K.C.S. Effects of coupled translational-torsional motion and eccentricity between centre of mass and centre of stiffness on wind-excited tall buildings. Wind Struct. 2002, 5, 61–80. [Google Scholar] [CrossRef] [Scilit]
- Tang, U.F.; Kwok, K.C.S. Interference excitation mechanisms on a 3DOF aeroelastic CAARC tall building model. J. Wind Eng. Ind. Aerodyn. 2004, 92, 1299–1314. [Google Scholar] [CrossRef] [Scilit]
- Lam, K.M.; Leung, M.Y.H.; Zhao, J.G. Interference effects on wind loading of a row of closely spaced tall buildings. J. Wind Eng. Ind. Aerodyn. 2008, 96, 562–583. [Google Scholar] [CrossRef] [Scilit]
- Lo, Y.L.; Kim, Y.C.; Li, Y.C. Downstream interference effect of high-rise buildings under turbulent boundary layer flow. J. Wind Eng. Ind. Aerodyn. 2016, 159, 19–35. [Google Scholar] [CrossRef] [Scilit]
- Taniike, Y. Interference mechanism for enhanced wind forces on neighboring tall buildings. J. Wind Eng. Ind. Aerodyn. 1992, 42, 1073–1083. [Google Scholar] [CrossRef] [Scilit]
- Xie, Z.N.; Gu, M. Mean interference effects among tall buildings. Eng. Struct. 2004, 26, 1173–1183. [Google Scholar] [CrossRef] [Scilit]
- Lo, Y.L.; Li, Y.C.; Kim, Y.C. Downstream interference effect of low-Scruton-number high-rise buildings under turbulent boundary layer flow. J. Wind Eng. Ind. Aerodyn. 2020, 198, 104101. [Google Scholar] [CrossRef] [Scilit]
- Yahyai, M.; Kumar, K.; Krishna, P.; Pande, P.K. Aerodynamic interference in tall rectangular buildings. J. Wind Eng. Ind. Aerodyn. 1992, 41, 859–866. [Google Scholar] [CrossRef] [Scilit]
- Cheng, C.M.; Lin, Y.Y.; Wang, J.M.; Wu, J.C.; Chang, C.H. The aerodynamic database for the interference effects of adjacent tall buildings. In Proceedings of the 12th International Conference on Wind Engineering, Cairns, Australia, 1–6 July 2007. [Google Scholar]
- Khanduri, A.C.; Stathopoulos, T.; Bedard, C. Generalization of wind-induced interference effects for two buildings. Wind Struct. 2000, 3, 255–266. [Google Scholar] [CrossRef] [Scilit]
- Taniike, Y. Turbulence effect on mutual interference of tall buildings. J. Eng. Mech. 1991, 117, 443–456. [Google Scholar] [CrossRef] [Scilit]
- Kim, W.; Tamura, Y.; Yoshida, A.; Yi, J.H. Generalization of wind-induced loading between two tall buildings. J. Wind Eng. Ind. Aerodyn. 2016, 147, 186–201. [Google Scholar] [CrossRef] [Scilit]
- Mara, T.G.; Terry, B.K.; Ho, T.C.E.; Isyumov, N. Aerodynamic and peak response interference factors for an upstream square building of identical height. J. Wind Eng. Ind. Aerodyn. 2014, 133, 200–210. [Google Scholar] [CrossRef] [Scilit]
- Hui, Y.; Tamura, Y.; Yoshida, A.; Kikuchi, H. Pressure and flow field investigation of interference effects on external pressures between high-rise buildings. J. Wind Eng. Ind. Aerodyn. 2013, 115, 150–161. [Google Scholar] [CrossRef] [Scilit]
- Kim, W.S.; Tamura, Y.; Yoshida, A. Interference effects on local peak pressures between two buildings. J. Wind Eng. Ind. Aerodyn. 2011, 99, 584–600. [Google Scholar] [CrossRef] [Scilit]
- Chen, C.W.; Li, Y.C.; Lo, Y.L. Interference effects on the square and circular cross-sectional high-rise buildings under turbulent flows. Int. J. Archit. Eng. Technol. 2022, 9, 18–36. [Google Scholar] [CrossRef] [Scilit]
- Kawai, H. Vortex-induced vibration of tall buildings. J. Wind Eng. Ind. Aerodyn. 1992, 41, 117–128. [Google Scholar] [CrossRef] [Scilit]
- Kwok, K.C.S. Vortex-induced vibration of slender tall buildings. In Proceedings of the 2nd International Colloquium on Bluff Body Aerodynamics and Applications (BBAA2), Melbourne, Australia, 7–10 December 1992; pp. 247–258, (Paper-printed). [Google Scholar]
- Matsumoto, M. Across-wind vibration of tall building models with various cross-sections. In Proceedings of the 9th National Symposium on Wind Engineering, Tokyo, Japan, 4–5 December 1986; Japan Association for Wind Engineering: Tokyo, Japan; pp. 199–204, (Paper-printed, In Japanese/English).
- Cooper, K.R.; Wardlaw, R.L. Aerodynamic instabilities in wakes. In Proceedings of the International Conference on Wind Effects on Buildings and Structures, Tokyo, Japan, 6–11 September 1971; pp. 647–655. [Google Scholar]
- Frison, G.; Giammichele, L.; Mancini, S.; Santi, F.; Bartoli, G. HFBB model test for tall buildings: A comparative benchmark with a full-aeroelastic model. Eng. Struct. 2021, 242, 112591. [Google Scholar] [CrossRef] [Scilit]
- Cheng, C.M.; Lu, P.C.; Tsai, M.S. Acrosswind aerodynamic damping of isolated square-shaped buildings. J. Wind Eng. Ind. Aerodyn. 2002, 90, 1743–1756. [Google Scholar] [CrossRef] [Scilit]
- Tamura, Y.; Suganuma, S.Y. Evaluation of amplitude-dependent damping and natural frequency of buildings during strong winds. J. Wind Eng. Ind. Aerodyn. 1996, 59, 179–191. [Google Scholar] [CrossRef] [Scilit]
- Huang, P.; Quan, Y.; Gu, M. Experimental study of aerodynamic damping of typical tall buildings. Math. Probl. Eng. 2013, 2013, 731572. [Google Scholar] [CrossRef] [Scilit]
- Quan, Y.; Gu, M.; Tamura, Y. Experimental evaluation of aerodynamic damping of square super high-rise buildings. Wind Struct. 2005, 8, 309–324. [Google Scholar] [CrossRef] [Scilit]
- Kim, W.; Tamura, Y.; Yoshida, A.; Bandi, E.K.; Yi, J.H. Experimental study of aerodynamic damping of a twisted supertall building. J. Wind Eng. Ind. Aerodyn. 2018, 176, 1–12. [Google Scholar] [CrossRef] [Scilit]
- Kim, Y.C.; Tamura, Y.; Tanaka, H.; Ohtake, K.; Bandi, E.K.; Yoshida, A. Wind-induced responses of super-tall buildings with various atypical building shapes. J. Wind Eng. Ind. Aerodyn. 2014, 133, 191–199. [Google Scholar] [CrossRef] [Scilit]
- Lo, Y.L.; Kim, Y.C.; Yoshida, A. Effects of aerodynamic modification mechanisms on interference from neighboring buildings. J. Wind Eng. Ind. Aerodyn. 2017, 168, 271–287. [Google Scholar] [CrossRef] [Scilit]
- Lo, Y.L.; Chen, C.W.; Chang, C.H.; Li, Y.C. Investigation of the elliptical resonant vibration of high-rise buildings induced by the oblique-downwind interference effects. J. Asian Archit. Build. Eng. 2023, 22, 3476–3495. [Google Scholar] [CrossRef] [Scilit]
- Wang, T.; Kwok, K.C.S.; Yang, Q.; Tian, Y.; Li, B. Experimental study on proximity interference induced vibration of two staggered square prisms in turbulent boundary layer flow. J. Wind Eng. Ind. Aerodyn. 2022, 220, 104865. [Google Scholar] [CrossRef] [Scilit]
- Li, T.; Ishihara, T. Numerical study on wake galloping of tandem circular cylinders considering the effects of mass and spacing ratios. J. Wind Eng. Ind. Aerodyn. 2021, 210, 104536. [Google Scholar] [CrossRef] [Scilit]
- Lo, Y.L.; Kim, Y.C. Estimation of wind-induced response on high-rise buildings immersed in interfered flow. J. Appl. Sci. Eng. 2019, 22, 429–448. [Google Scholar] [CrossRef]
- Lo, Y.L.; Tseng, Y.F. Interference effects on tail characteristics of extreme pressure value distributions. J. Wind Eng. Ind. Aerodyn. 2017, 170, 28–45. [Google Scholar] [CrossRef] [Scilit]
- Kasperski, M. Specification of the design wind load—A critical review of code concepts. J. Wind Eng. Ind. Aerodyn. 2009, 97, 335–357. [Google Scholar] [CrossRef] [Scilit]
- Kim, W.S.; Tamura, Y.; Yoshida, A. Simultaneous measurement of wind pressures and flow patterns for buildings with interference effect. Adv. Struct. Eng. 2013, 16, 287–305. [Google Scholar] [CrossRef] [Scilit]
- Kim, W.S.; Tamura, Y.; Yoshida, A. Interference effects on aerodynamic wind forces between two buildings. J. Wind Eng. Ind. Aerodyn. 2015, 147, 186–201. [Google Scholar] [CrossRef] [Scilit]
- Tamura, Y. Amplitude dependency of damping in building and critical tip drift ratio. Int. J. High-Rise Build. 2012, 1, 1–13. [Google Scholar] [CrossRef]
- Yu, X.F.; Xie, Z.N.; Gu, M. Interference effects between two tall buildings with different section sizes on wind-induced acceleration. J. Wind Eng. Ind. Aerodyn. 2018, 182, 16–26. [Google Scholar] [CrossRef] [Scilit]
- Hui, Y.; Tamura, Y.; Yoshida, A. Mutual interference effects between two high-rise building models with different shapes on local peak pressure coefficients. J. Wind Eng. Ind. Aerodyn. 2012, 104, 98–108. [Google Scholar] [CrossRef] [Scilit]
- Zhang, W.J.; Kwok, K.C.S.; Xu, Y.L. Aeroelastic torsional behavior of tall buildings in wakes. J. Wind Eng. Ind. Aerodyn. 1994, 51, 229–248. [Google Scholar] [CrossRef] [Scilit]
- Huang, P.; Gu, M. Experimental study on wind-induced dynamic interference effects between two tall buildings. Wind Struct. 2005, 8, 147–161. [Google Scholar] [CrossRef] [Scilit]
- Architectural Institute of Japan (AIJ). Recommendations for Loads on Buildings; Architectural Institute of Japan (AIJ): Tokyo, Japan, 2015. [Google Scholar]

Disclaimer/Publisher’s Note: The statements, opinions and data contained in all publications are solely those of the individual author(s) and contributor(s) and not of MDPI and/or the editor(s). MDPI and/or the editor(s) disclaim responsibility for any injury to people or property resulting from any ideas, methods, instructions or products referred to in the content. |
© 2026 by the authors. Licensee MDPI, Basel, Switzerland. This article is an open access article distributed under the terms and conditions of the Creative Commons Attribution (CC BY) license.