


Abstract
This study presents a multi-factor coupled assessment of seismic disaster risk for approximately 635,000 individual building units in Ankang City, Shaanxi Province, China, utilizing a high-resolution dataset. The assessment methodology innovatively integrates the three core components of risk: seismic vulnerability V of load-bearing structures, site-specific seismic hazards R, and potential consequences C of damage, to formulate the Seismic Resilience Index ISR = C·R·V. Crucially, the approach advances established risk assessment frameworks by enhancing the spatial resolution of the site influence coefficient R using a high-resolution national site classification map and detailed local geological data. The results reveal that the areas with the lowest ISR values (indicating the lowest resilience and thus the highest risk) are predominantly concentrated in older residential districts of counties such as Ningshan, Hanyin, and Ziyang, where unreinforced masonry structures built prior to 1989 are widespread. The model assessment results align with expected structural performance characteristics, and the study concludes by offering quantified, priority-based recommendations for targeted structural intervention and seismic retrofitting in the identified highest-risk regions and building typologies.
1. Introduction
Earthquakes represent one of the most destructive categories of natural disasters, with a well-documented history of causing significant human fatalities and extensive degradation to critical infrastructure [1]. During seismic events, the powerful ground vibrations generated often lead to catastrophic structural failures—including the collapse of load-bearing frameworks, the rupture of exterior and interior walls, and the cave-in of roof structures. This structural failure exposes residents and occupants to immediate life threats. Beyond primary damage, earthquakes regularly initiate secondary hazardous events: post-seismic fires sparked by damaged electrical systems, leaks from ruptured gas pipelines, and landslides triggered by soil instability. These secondary hazards not only exacerbate the destruction of buildings and infrastructure networks but also escalate the likelihood of additional casualties and long-term economic losses [2,3,4].
This compound risk is particularly pronounced in two types of areas: densely populated urban centers where human and asset density amplifies impact, and regions where construction practices fail to meet minimum seismic safety standards. Such scenarios underscore the pressing necessity for the development and implementation of precise seismic vulnerability assessment methodologies. Additionally, the failure of essential infrastructure components—ranging from transportation networks (roads and bridges) to utility systems (power grids) and communication infrastructure—creates significant barriers to effective emergency response efforts. It also prolongs the timeline for post-disaster recovery, further highlighting the critical importance of targeted, science-based disaster mitigation strategies.
Within the domain of seismic risk assessment, prior research efforts have largely centered on two core tasks: evaluating the seismic capacity of buildings and forecasting the impacts of ground motion. Regarding seismic capacity, extensive studies have been conducted on the mechanical behavior of specific structural members through experiments and simulations [5], providing a theoretical basis for understanding failure mechanisms. These tasks have typically been supported by analytical tools such as vulnerability matrices or fragility curves, which are derived from generalized models rather than context-specific data [6,7,8,9,10]. Despite their widespread use, these conventional methodologies are associated with three distinct limitations that compromise their applicability in real-world scenarios.
First, vulnerability matrices frequently depend on standardized building classification systems. These systems are designed for broad applicability and thus fail to fully incorporate the substantial regional variations in construction techniques, material selection, and structural quality. This limitation is particularly evident when comparing urban and rural areas, where seismic design standards and implementation rigor often diverge significantly [11,12]. Such discrepancies carry heightened relevance in regions like China, where the gap between urban and rural building safety standards remains pronounced [13,14,15]. Second, a notable gap in existing literature is the insufficient consideration of long-term material degradation in buildings. This issue is especially critical for aging reinforced concrete (RC) structures, which are susceptible to performance loss due to steel bar corrosion, concrete spalling, and general wear over time. This oversight undermines assessment accuracy, as material deterioration directly diminishes structural resilience and elevates the fragility of buildings during seismic events [16,17,18]. Third, many current assessments adopt a macro-scale analytical framework, which prioritizes regional trends over the unique risk profiles of individual buildings. This approach is problematic in heterogeneous areas characterized by mixed land use (e.g., residential commercial complexes) and varying building conditions, as it fails to capture the nuanced risk levels of specific structures. Consequently, regional seismic risk maps generated through such methods may contain inaccuracies that hinder effective disaster mitigation planning [19,20].
To address the aforementioned limitations, this study undertakes a detailed seismic risk assessment of buildings in Ankang City, drawing on comprehensive field survey datasets and advanced analytical techniques. Unlike traditional numerical simulation studies that focus on the mechanical behavior of idealized models or sample-based regional estimates, this study establishes a data-driven, high-resolution assessment framework based on the National Natural Disaster Risk Survey. The primary contributions are threefold: (1) From Sampling to Census: We transition from the conventional “sample-based” extrapolation to a “census-based” individual assessment covering approximately 635,000 specific buildings. This granularity eliminates the statistical bias inherent in generalized vulnerability matrices. (2) Micro-Zonation Coupling: We innovatively integrate a 100 m resolution national site classification map into the risk model. By coupling this high-precision geological data (R) with building-specific vulnerability (V) and consequence (C) factors, the model captures localized risk hotspots (e.g., river valley soft soil zones) that coarse regional models overlook. (3) Revealing the Rural Deficit: We provide a quantitative dissection of the urban–rural safety gap in a typical mountainous bedrock region. By explicitly linking risk levels to “unfortified” and “pre-1989” typologies, the study moves beyond general risk mapping to identify the structural roots of rural vulnerability, offering precise targets for retrofitting policies.
2. Study Area
This study focuses on Ankang City, situated in the southeastern part of Shaanxi Province, China. Climatically, the region falls under the northern subtropical continental humid monsoon type, featuring distinct seasonal precipitation patterns and temperature variations. Geographically, Ankang is centered in a basin flanked by two major mountain ranges: the rugged Qinling Mountains form its northern boundary, while the imposing Bashan Mountains define its southern edge.
Demographically and economically, Ankang City has a registered resident population of over 2.47 million and a gross domestic product (GDP) of approximately 126.9 billion Chinese Yuan (CNY). Administratively, it comprises nine counties and one district, covering a large territorial area—extending roughly 200 km from east to west and 240 km from north to south, with a total land area of about 23,500 square kilometers. Topographically, the region exhibits high diversity: the central area is characterized by relatively low elevations, while the northern and southern peripheries are dominated by higher, undulating terrain.
Tectonically, the study area’s geological framework is shaped by the interaction of two major structural belts: the Qinling Indo China fold belt and the Caledonian fold belt of the Daba Mountains. This tectonic convergence contributes to the region’s complex geological conditions. According to China’s national seismic hazard zoning map, Ankang City is categorized as a seismic intensity zone of VI to VII. Although six seismic fault lines traverse the region, historical seismic activity has been relatively moderate with only one recorded earthquake exceeding a magnitude of M5.5 (an M5.5 event in 1868). Notably, however, strong earthquakes occurring in adjacent regions have previously inflicted damage on Ankang. A typical example is the catastrophic M8.0 Wenchuan earthquake in Sichuan Province on 12 May 2008: despite being approximately 600 km from Ankang, this earthquake caused severe structural damage to tens of thousands of buildings in the city and resulted in one reported death.
3. Data
A total of 635,000 building datasets were compiled for Ankang City, China, in this study. These datasets were originally collected in 2021 by China’s Ministry of Housing and Urban–Rural Development as part of a large-scale national building inventory project. This project received substantial financial support and adopted a rigorous, structure specific survey methodology: field data collectors used a dedicated mobile data gathering application to upload information to a centralized database in real time, ensuring data timeliness and traceability. Each dataset encompasses comprehensive attributes of the corresponding building, including its geographic coordinates, functional use, gross floor area, construction period, seismic resistance classification, structural defect status, site category, and seismic risk level, among other key parameters.
Table 1 summarizes the statistical characteristics of different building types in Ankang City, focusing on three dimensions: seismic resistance configuration, structural defect prevalence, and construction era. The statistical results indicate that public service-oriented buildings such as schools, medical facilities, social service centers, and commercial complexes have a significantly higher proportion of seismic resistant structures. Specifically, 97.02% of schools, 95.27% of medical facilities, 94.17% of social service centers, and 83.11% of commercial complexes are equipped with formal seismic protection measures. This high compliance rate is attributed to strict government mandated seismic safety regulations that apply specifically to public service infrastructure. In stark contrast, only 6.74% of residential buildings incorporate seismic design features, highlighting a critical gap in safety provisions for this building category. While urban residential buildings generally align with governmental seismic standards, most self-constructed rural dwellings lack such protections due to constraints related to construction costs and limited access to professional technical guidance.
Table 1.
Statistical analysis of potential risk factors across different building types in Ankang City.
In terms of structural defect incidence, residential buildings have the highest rate at 37.86%, far exceeding that of school buildings (17.36%) and medical facilities (21.27%). This discrepancy can be explained by differences in maintenance responsibility: residential buildings—especially rural ones—are typically maintained by individual homeowners, whereas public institutions (e.g., schools and hospitals) employ specialized maintenance teams to conduct regular inspections and repairs. Regarding construction eras, residential buildings and social service facilities show a relatively even distribution across three time periods: approximately 36.93% of residential buildings and 30% of social service facilities were constructed before 2000. In contrast, other building types (e.g., commercial complexes) have a higher concentration of newer structures, with 38.63% built after 2010—reflecting the more modernized infrastructure of commercial areas. This age-based distribution pattern is a key factor contributing to the higher prevalence of structural defects observed in older residential buildings.
While these limitations inevitably introduce a degree of uncertainty into the assessment of individual buildings, particularly regarding the subjective quantification of structural defects, they are mitigated by the massive sample size (N ≈ 635,000) and the standardized training provided to surveyors. Consequently, although micro-level deviations may exist for specific structures, these uncertainties are unlikely to fundamentally alter the macro-scale spatial distribution patterns and regional risk characteristics identified in this study. Furthermore, as discussed in the sensitivity analysis (Section 6), the model demonstrates robustness against minor parameter fluctuations.
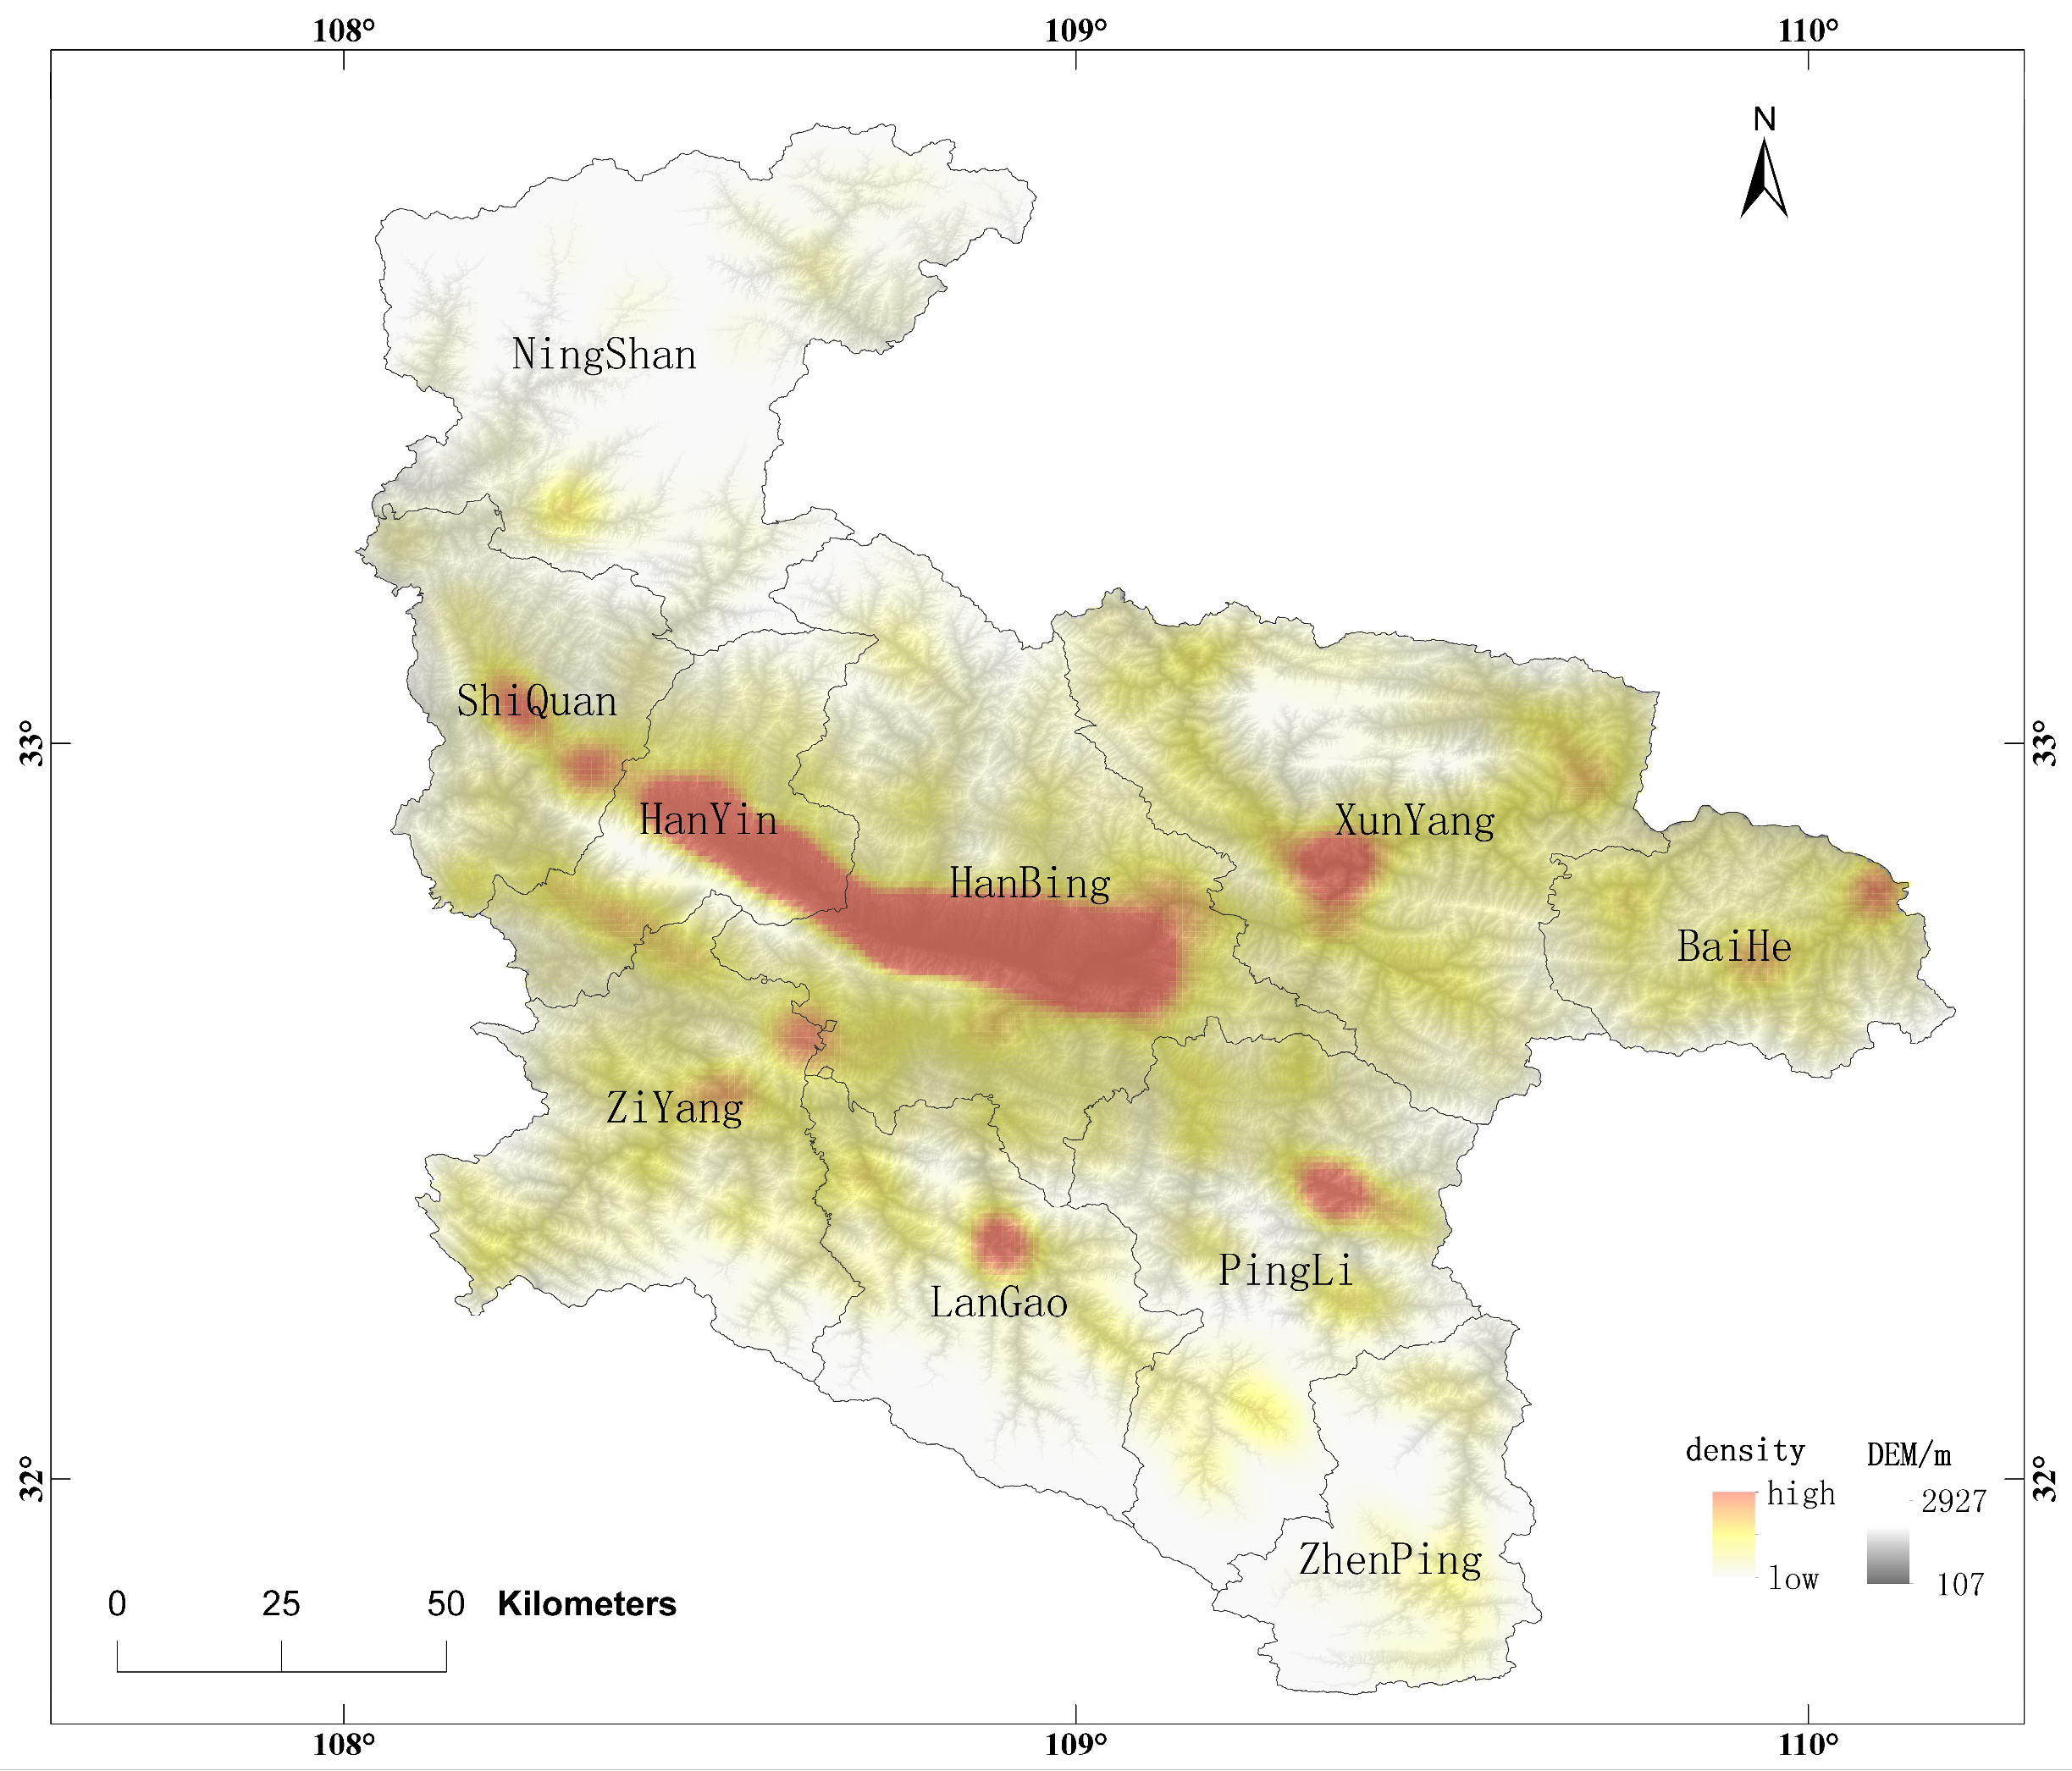
Furthermore, utilizing the building dataset employed in this study, a building density distribution map of Ankang City was generated, with the visualization presented in Figure 1. As illustrated in this map, Hanbin District home to Ankang City’s municipal government—exhibits the highest building density and the most extensive spatial coverage of structures. In contrast, other administrative counties and districts within Ankang show notably lower building density, characterized by scattered rather than concentrated distribution patterns.
Figure 1.
Building density map in Ankang City based on survey data.
An additional key observation from the map is the distinct northwest oriented strip like distribution of buildings across Ankang City. A typical example is the high-density building strip stretching across the Hanyin County HanBin District corridor. Moreover, high-density building clusters are predominantly situated in valley regions; this spatial pattern is closely tied to Ankang’s topographic features—where flat valley areas are more suitable for construction compared to mountainous terrain. This distribution characteristic not only reflects the region’s natural geographical constraints but also provides critical geographic context for interpreting the seismic risk patterns analyzed in this study.
4. Method
4.1. Individual Building Seismic Risk Assessment
This study follows the methodology outlined in the Technical Specifications for Grading Earthquake Hazard Risks of Buildings (Structures) (FXPC/DZ P-03) [21] issued by the China Earthquake Administration. According to this standard, the seismic risk level of a single building is determined by evaluating three core factors: the seismic vulnerability of the load-bearing structure, the seismic hazard potential of the site, and the potential consequences of damage.
Based on the calculated earthquake seismic risk index, the severity of building hazards is categorized into three distinct levels: “minor”, “moderate” and “critical”. The seismic resilience index for an individual building is mathematically expressed as follows:
where: C denotes the disaster impact consequence coefficient, which is associated with two key factors: the functional usage of the building and the potential scope of disaster impacts triggered by structural damage. Per the aforementioned specifications, this coefficient is classified into four distinct categories. R represents the site impact coefficient, encompassing both the seismic hazard potential of the building’s location and its site category. The value of R is assigned based on two authoritative references: China’s Seismic Parameter Zoning Map and the site type classification of the building’s location. V stands for the load bearing structure vulnerability impact coefficient, incorporating three critical attributes of the load bearing system: its seismic resistance grade, construction period, and the degree of structural defects. The assignment of V values adheres to the criteria outlined in the aforementioned specifications.
Detailed value ranges and assignment criteria for these three parameters are available in the Technical Specifications for the Grading of Earthquake Hazard Risks in Buildings (Structures). Additionally, the corresponding relationship between the calculated resilience index and the predefined risk levels (minor, moderate, critical) is presented in Table 2.
Table 2.
Relationship between seismic resilience index and potential risk levels.
But it is important to distinguish this data-driven, index-based assessment from mechanical numerical simulations (e.g., Finite Element Analysis). This study does not simulate the dynamic process of “progressive collapse.” Instead, the Seismic Resilience Index (ISR) serves as a semi-empirical proxy for the probability of reaching specific damage states under design seismic loads. According to the Technical Specifications (FXPC/DZ P-03), the calculated risk levels correspond to the following physical performance expectations:
- Critical Level: Indicates a high potential for partial or total collapse or severe structural failure that poses an immediate threat to life safety.
- Moderate Level: Indicates a potential for significant structural damage (e.g., shear failure of walls) that requires repair, but with a lower probability of sudden collapse.
- Minor Level: Indicates that expected damage is likely limited to non-structural components (e.g., infill walls) or slight structural cracking, maintaining basic operational functions.
4.2. Detailed Parameter Assignment and Calculation Example
To guarantee the scientific rigor and assessment transparency of the seismic risk evaluation results, this study strictly adhered to the technical specification FXPC/DZ P-03 when determining the values of the three core coefficients: the Disaster Impact Consequence Coefficient (C), the Site Impact Coefficient (R), and the Load Bearing Structure Vulnerability Coefficient (V). A comprehensive summary of the assignment criteria and numerical values for all these coefficients is provided in Table 3.
Table 3.
Summary of assignment criteria for risk assessment coefficients (C, R, and V) based on Specification FXPC/DZ P-03.
4.2.1. Determination of Consequence Coefficient (C)
The C coefficient reflects the severity of the consequences resulting from the damage to the structure. In the context of the Seismic Resilience Index (ISR), C acts as a ‘safety weighting factor’ positively correlated with resilience. A higher C value (e.g., C = 1.00 for Class IV) indicates lower failure consequences and thus a higher tolerance for damage, contributing to a higher resilience score. Conversely, critical facilities (Class I) are assigned the lowest C values (0.30) to impose a strict penalty, reflecting their high failure consequences and resulting in a lower resilience index (indicating higher risk). Values are assigned based on the seismic fortification classification (Classes I, II, III, and IV):
- Class I (Special): Critical facilities where function cannot be interrupted (e.g., nuclear facilities). The value is C = 0.30.
- Class II (Major): Buildings where function must be quickly restored or that involve a high risk of casualties (e.g., hospitals, schools). The value is C = 0.35.
- Class IV (Minor): Buildings whose damage does not endanger personal safety or cause severe economic loss. The value is C = 1.00.
- Class III (Typical): General buildings (e.g., ordinary residential, office buildings) other than I, II, and IV. The C value is calculated based on the Building Area (S, in m2) using Equation (2):
In the Ankang City assessment, the vast majority of residential buildings fall into the Class III category with S ≤ 500 m2, for which the C value is typically set to 0.75.
4.2.2. Determination of Site Influence Coefficient (R)
The R coefficient is determined by integrating the seismic hazard of the site and the site category influence via Equation (3):
Per the specification, the coefficients and are both set to 0.5.
- Seismic Hazard : Determined by the seismic fortification requirement of the area (see Table 3 for value mapping). For Ankang City, primarily located in the 0.1 g design parameter zone, is valued at approximately 0.95.
- Site Category Influence : The values are assigned based on the site class as listed in Table 3.
4.2.3. Determination of Vulnerability Influence Coefficient (V)
The V coefficient is a comprehensive measure of the structure’s vulnerability, considering its actual fortification standard , construction era , and deterioration degree using Equation (4):
Per the specification, is the fixed weight for the construction era, set to 0.1. The coefficients and are dynamic weights related to the relative severity of and . The coefficients and are dynamic weights strictly adopted from the technical specification FXPC/DZ P-03. The physical rationale behind the 0.2/0.8 weighting mechanism inside the numerators is to operationalize the ‘Short Board Principle’ (or Weakest Link Theory) in structural safety. Since a lower V value indicates higher vulnerability (lower resilience), the formula is designed to dynamically assign a larger weight to whichever sub-factor ( or ) has the lower value. For instance, if a building has good structural health ( ≈ 1.0) but poor fortification ( ≈ 0.05), the weight for fortification will increase significantly, ensuring that the final resilience score is dominated by the ‘weakest link’ (the lack of fortification) rather than being averaged out by the healthy condition. In this paper and .
- Fortification Level : Based on the difference between the building’s actual and required seismic level, with lower values assigned if the actual level is below the requirement.
- Construction Era : Reflects changes in seismic codes. Structures built before 1989 generally have lower seismic resistance and receive a relatively lower V value.
- Deterioration : Valued based on the severity of on site surveyed structural defects (detailed classification criteria involving structural vs. non-structural damage ratios are specified in Table 3).
4.2.4. Calculation Example and Risk Level Determination
To illustrate the index calculation process, we use a typical high-risk rural residential building in the Ankang dataset. This example building is classified as a Class III residential structure with an area under 500 m2. It was constructed before 1989, which places it in a low fortification epoch, and is located on a Class II site in the 0.1 g design parameter zone, the coefficient values for this building are determined as follows:
- Consequence Coefficient C = 0.75.
- Site Influence Coefficient R = 0.95.
- Vulnerability Influence Coefficient V = 0.168.
Substituting these values into the core assessment equation, the Seismic Resilience Index is calculated:
According to Table 2, the resulting index value falls within the range (0.075, 0.225], classifying the building’s earthquake hazard as “Moderate”.
It is important to note that the building parameters selected for this calculation example (Class III residential, pre-1989 construction, Class II site) were chosen to represent the dominant high-risk typology within the Ankang dataset. Typology Dominance: As detailed in Table 1, residential buildings constitute the majority of the dataset, and a significant portion (approx. 37%) were constructed before 2000, often lacking formal seismic design (Unfortified). Site Prevalence: Class II sites represent the most common geological condition in the study area. Risk Relevance: This specific combination of attributes (aging, unfortified, residential) is identified in Section 5 as the primary driver of regional seismic risk. Therefore, this example serves not merely as an isolated case, but as a demonstration of the assessment logic applied to the most prevalent and vulnerable building segment in the study area.
4.3. Regional Building Earthquake Disaster Risk Assessment
Based on the individual assessment results, the regional seismic risk level is determined by calculating the proportion of building area falling into each risk category (Minor, Moderate, Critical). The proportion Pi for risk level i is calculated as follows:
where: Pi is proportion of building area classified at risk level i (Minor, Moderate, Critical). Ai is total floor area of buildings classified at risk level i within the region.
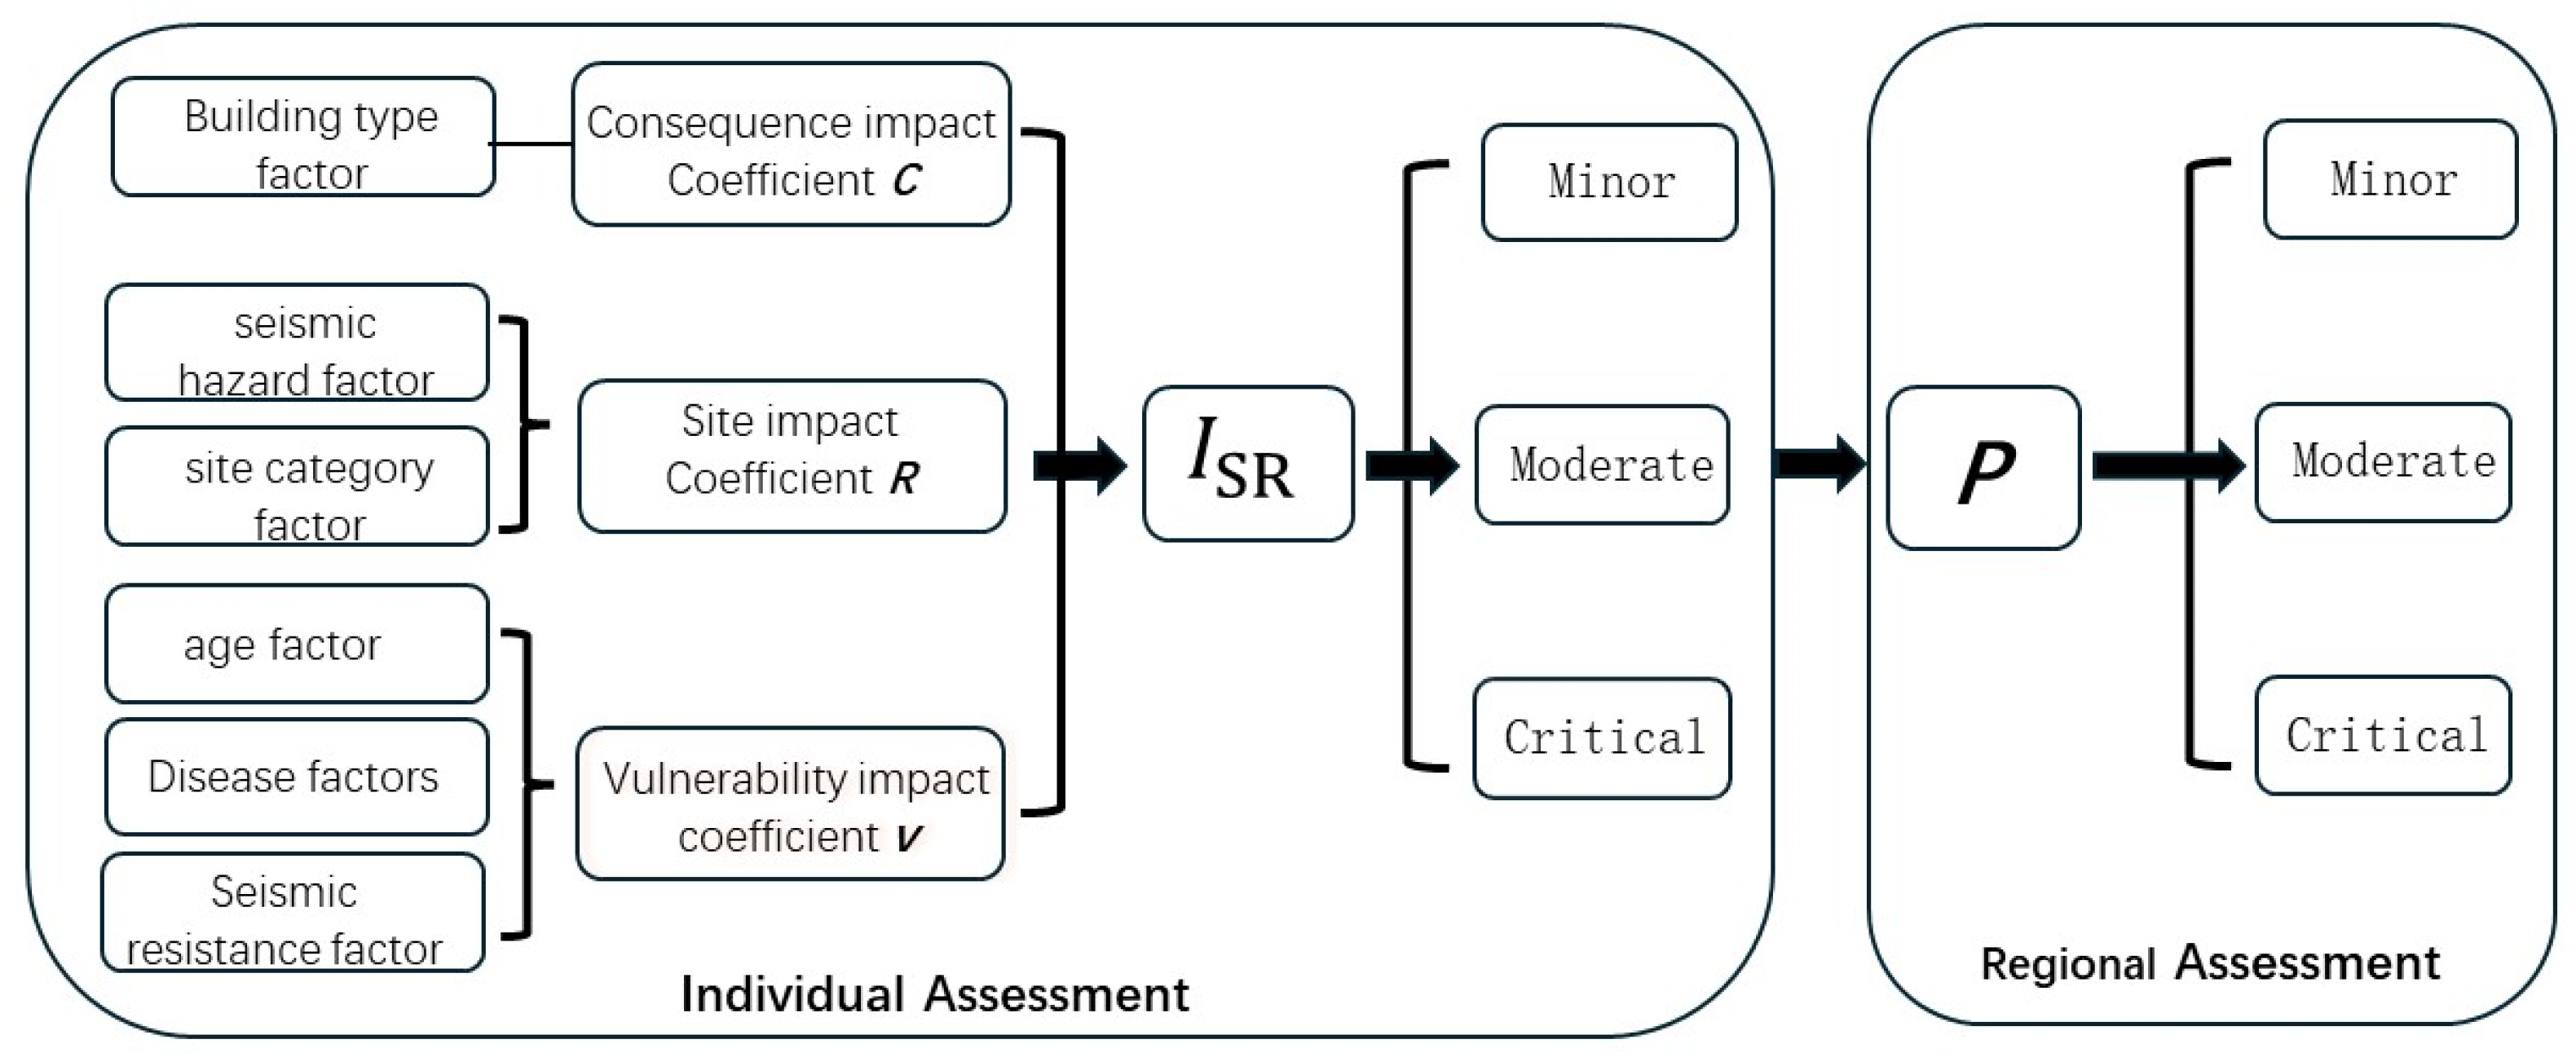
Atotal is total floor area of all assessed buildings in the region. The regional risk level is then categorized based on the cumulative proportions of ‘Moderate’ (PMod) and ‘Critical’ (PCrit) buildings. Table 4 provides the specific determination criteria, while Figure 2 illustrates the workflow for this assessment.
Table 4.
Determination criteria for regional seismic risk levels.
Figure 2.
Flowchart of Building Seismic Risk Assessment.
4.4. Local Parameter Refinement and Innovation
As stipulated in the technical guidelines, the Site Impact Coefficient (R) is primarily determined by two core factors: the seismic hazard potential of the building’s location and the site category of the area. To substantially improve the precision of the seismic risk assessment model, this study targeted the optimization of the “site category” component within R—an adjustment aimed at addressing the limitations of generic site classification methods used in prior research.
This optimization was implemented by adopting a national site classification map with a 100 m spatial resolution as the foundational data source [22]. Within the Geographic Information System (GIS) environment, the precise geographic coordinates of each individual building unit were spatially overlaid onto this high-resolution map. For each building, the corresponding site category parameter was then directly extracted from the 100 m × 100 m grid cell that the building’s coordinates fell within, and this parameter was subsequently assigned to the building for R value calculation.
Integrating high-resolution spatial data allows the Site Impact Coefficient (R) to accurately capture micro-scale geological heterogeneities. This includes subtle variations in soil type or bedrock depth that generic regional classifications often overlook. This refinement directly enhances the reliability of R and, in turn, improves the overall predictive accuracy of the building level seismic hazard assessment model.
5. Results
5.1. Individual Building Assessment Results
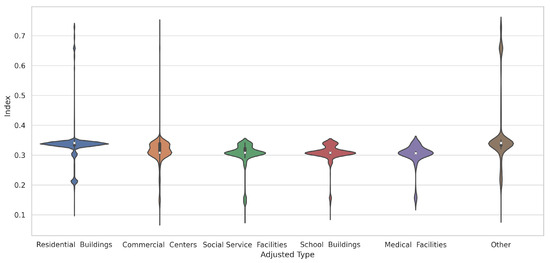
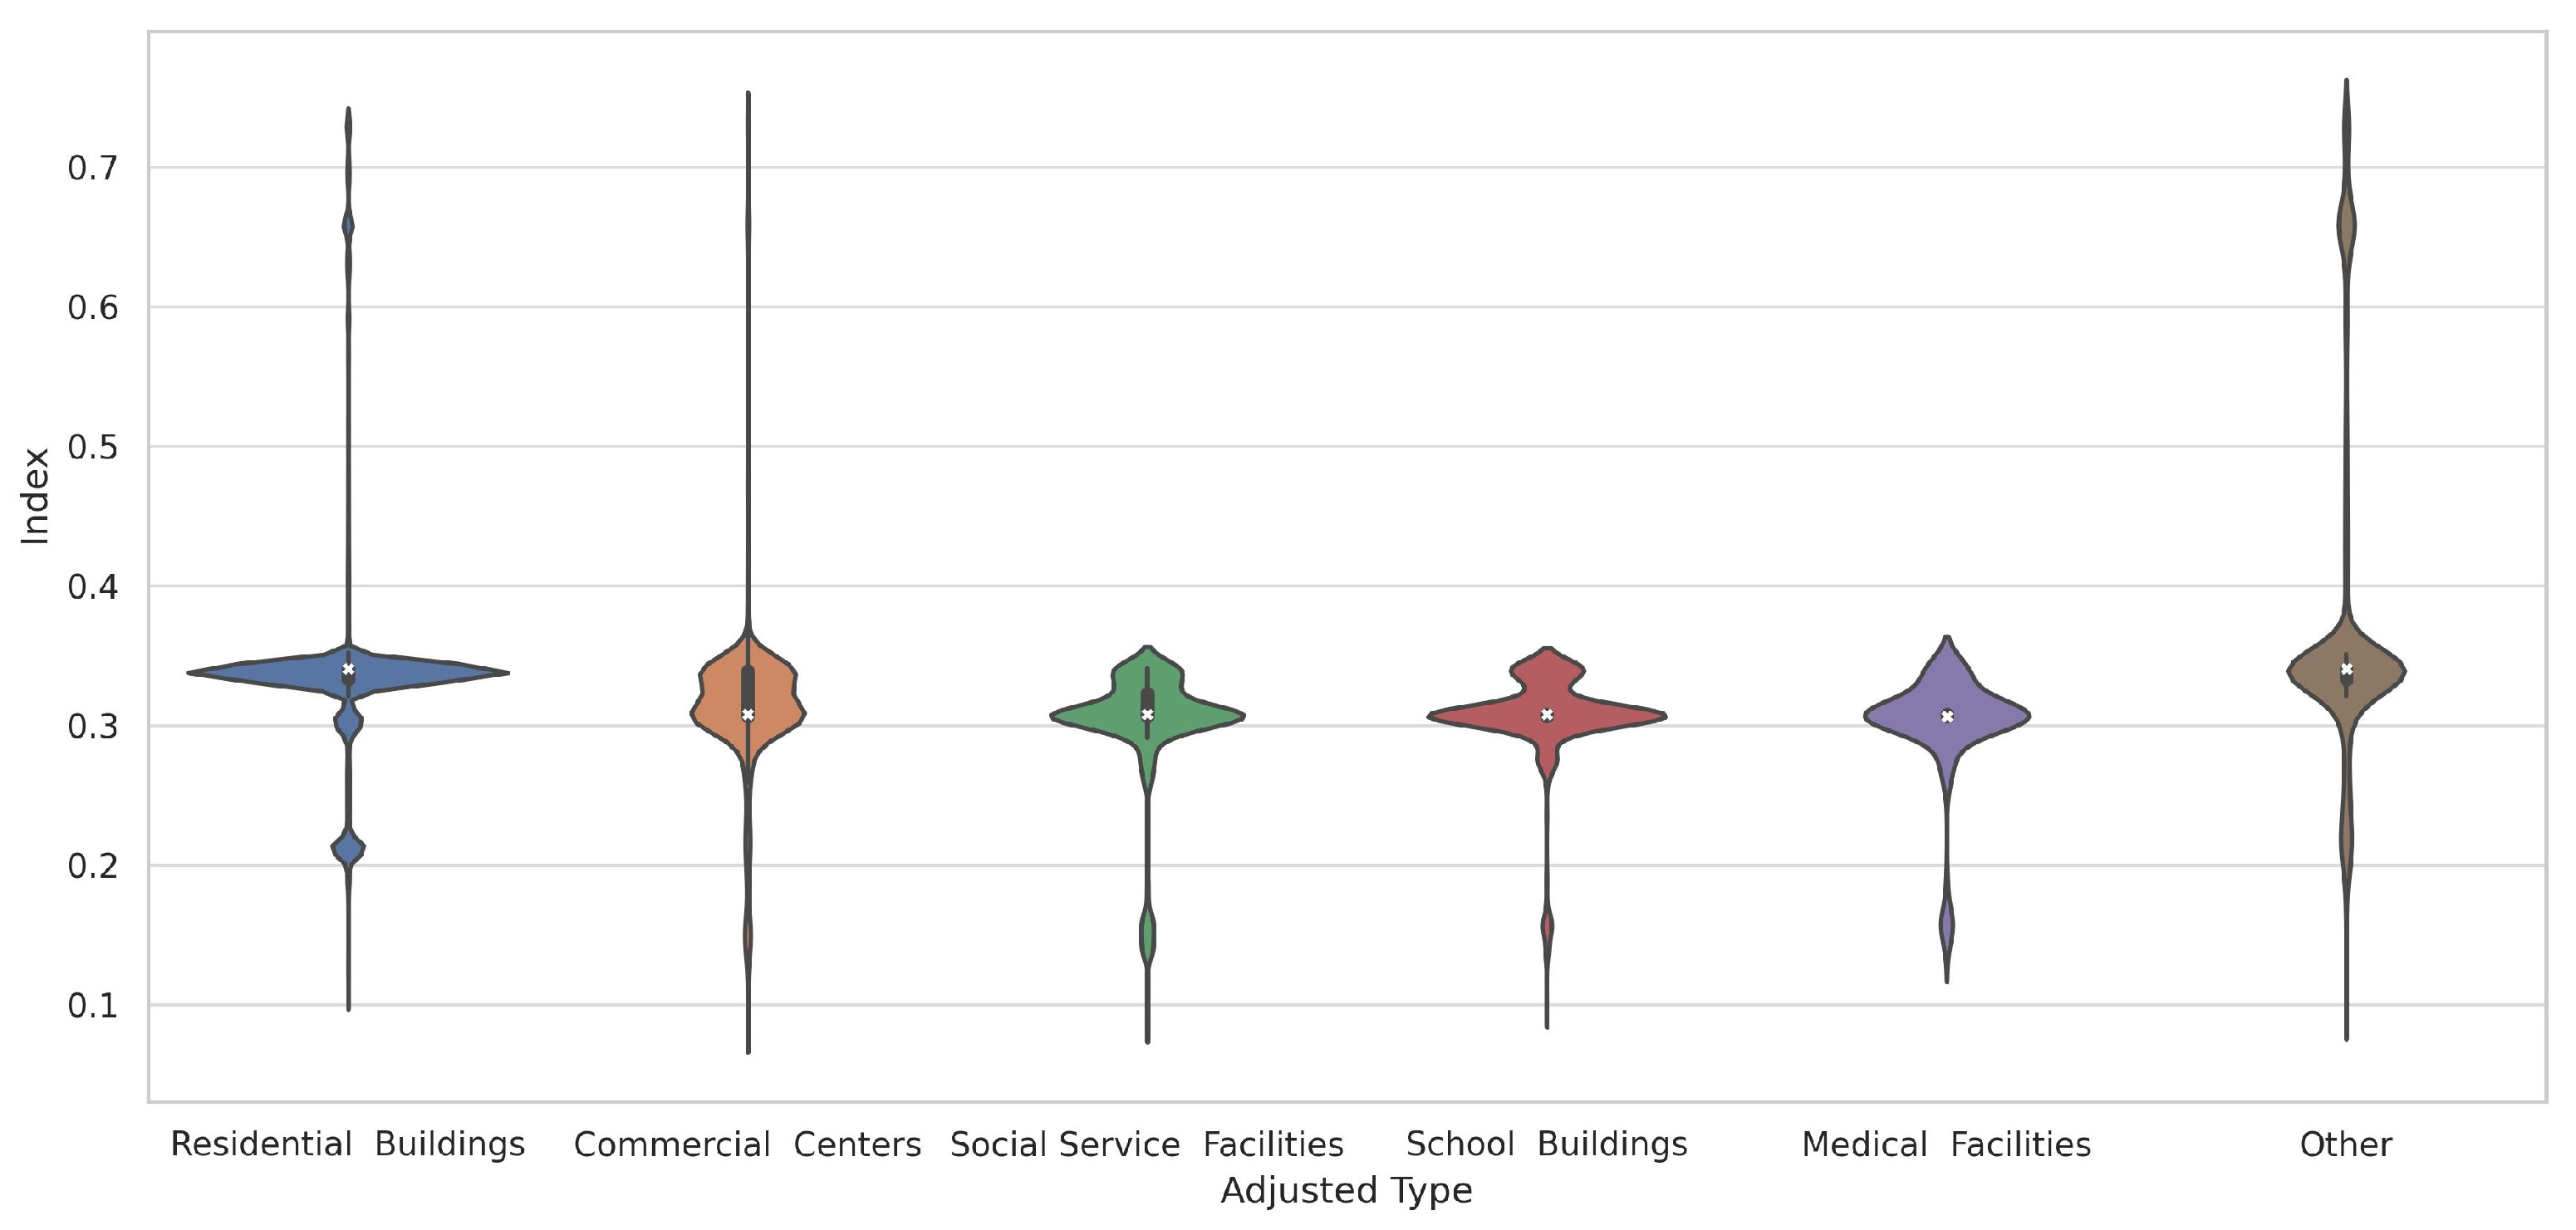
Figure 3 presents violin plots that intuitively illustrate the distribution characteristics of the Seismic Resilience Index across different building types in Ankang City. From these distribution patterns, a key observation emerges: the majority of data points for all building types are highly concentrated in the high index value range, specifically between 0.3 and 0.4. This range aligns with the “Minor” risk level defined in Table 2, indicating that most building units in Ankang City demonstrate relatively stable performance corresponding to low seismic risk.
Figure 3.
Distribution of seismic resilience index across different individual building types.
Nevertheless, building types with distinct functional purposes exhibit notable differences in both risk concentration and data variability. Residential buildings, which constitute the largest category, display a distinctly asymmetric distribution. The violin plot shows a wide span in the lower index range (indicating lower resilience), with a pronounced tail extending toward the minimum values. This broad, low-index-skewed distribution clearly reflects the greatest heterogeneity in structural performance among residential buildings. It also identifies residential buildings as the primary source of extreme high-risk structures (characterized by low index values), strongly suggesting the existence of multiple residential sub groups that require prioritized attention in seismic risk mitigation.
In contrast, critical public service facilities including educational and medical buildings—exhibit the most compact and highly concentrated index distribution, which reflects the most stable risk performance among all building types. Commercial buildings, meanwhile, fall between these two extremes: their distribution width is moderate, but a relatively extended data tail indicates that certain individual commercial structures may still carry a higher potential seismic risk.
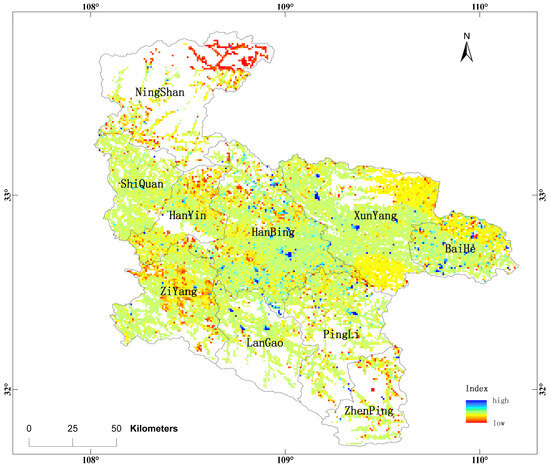
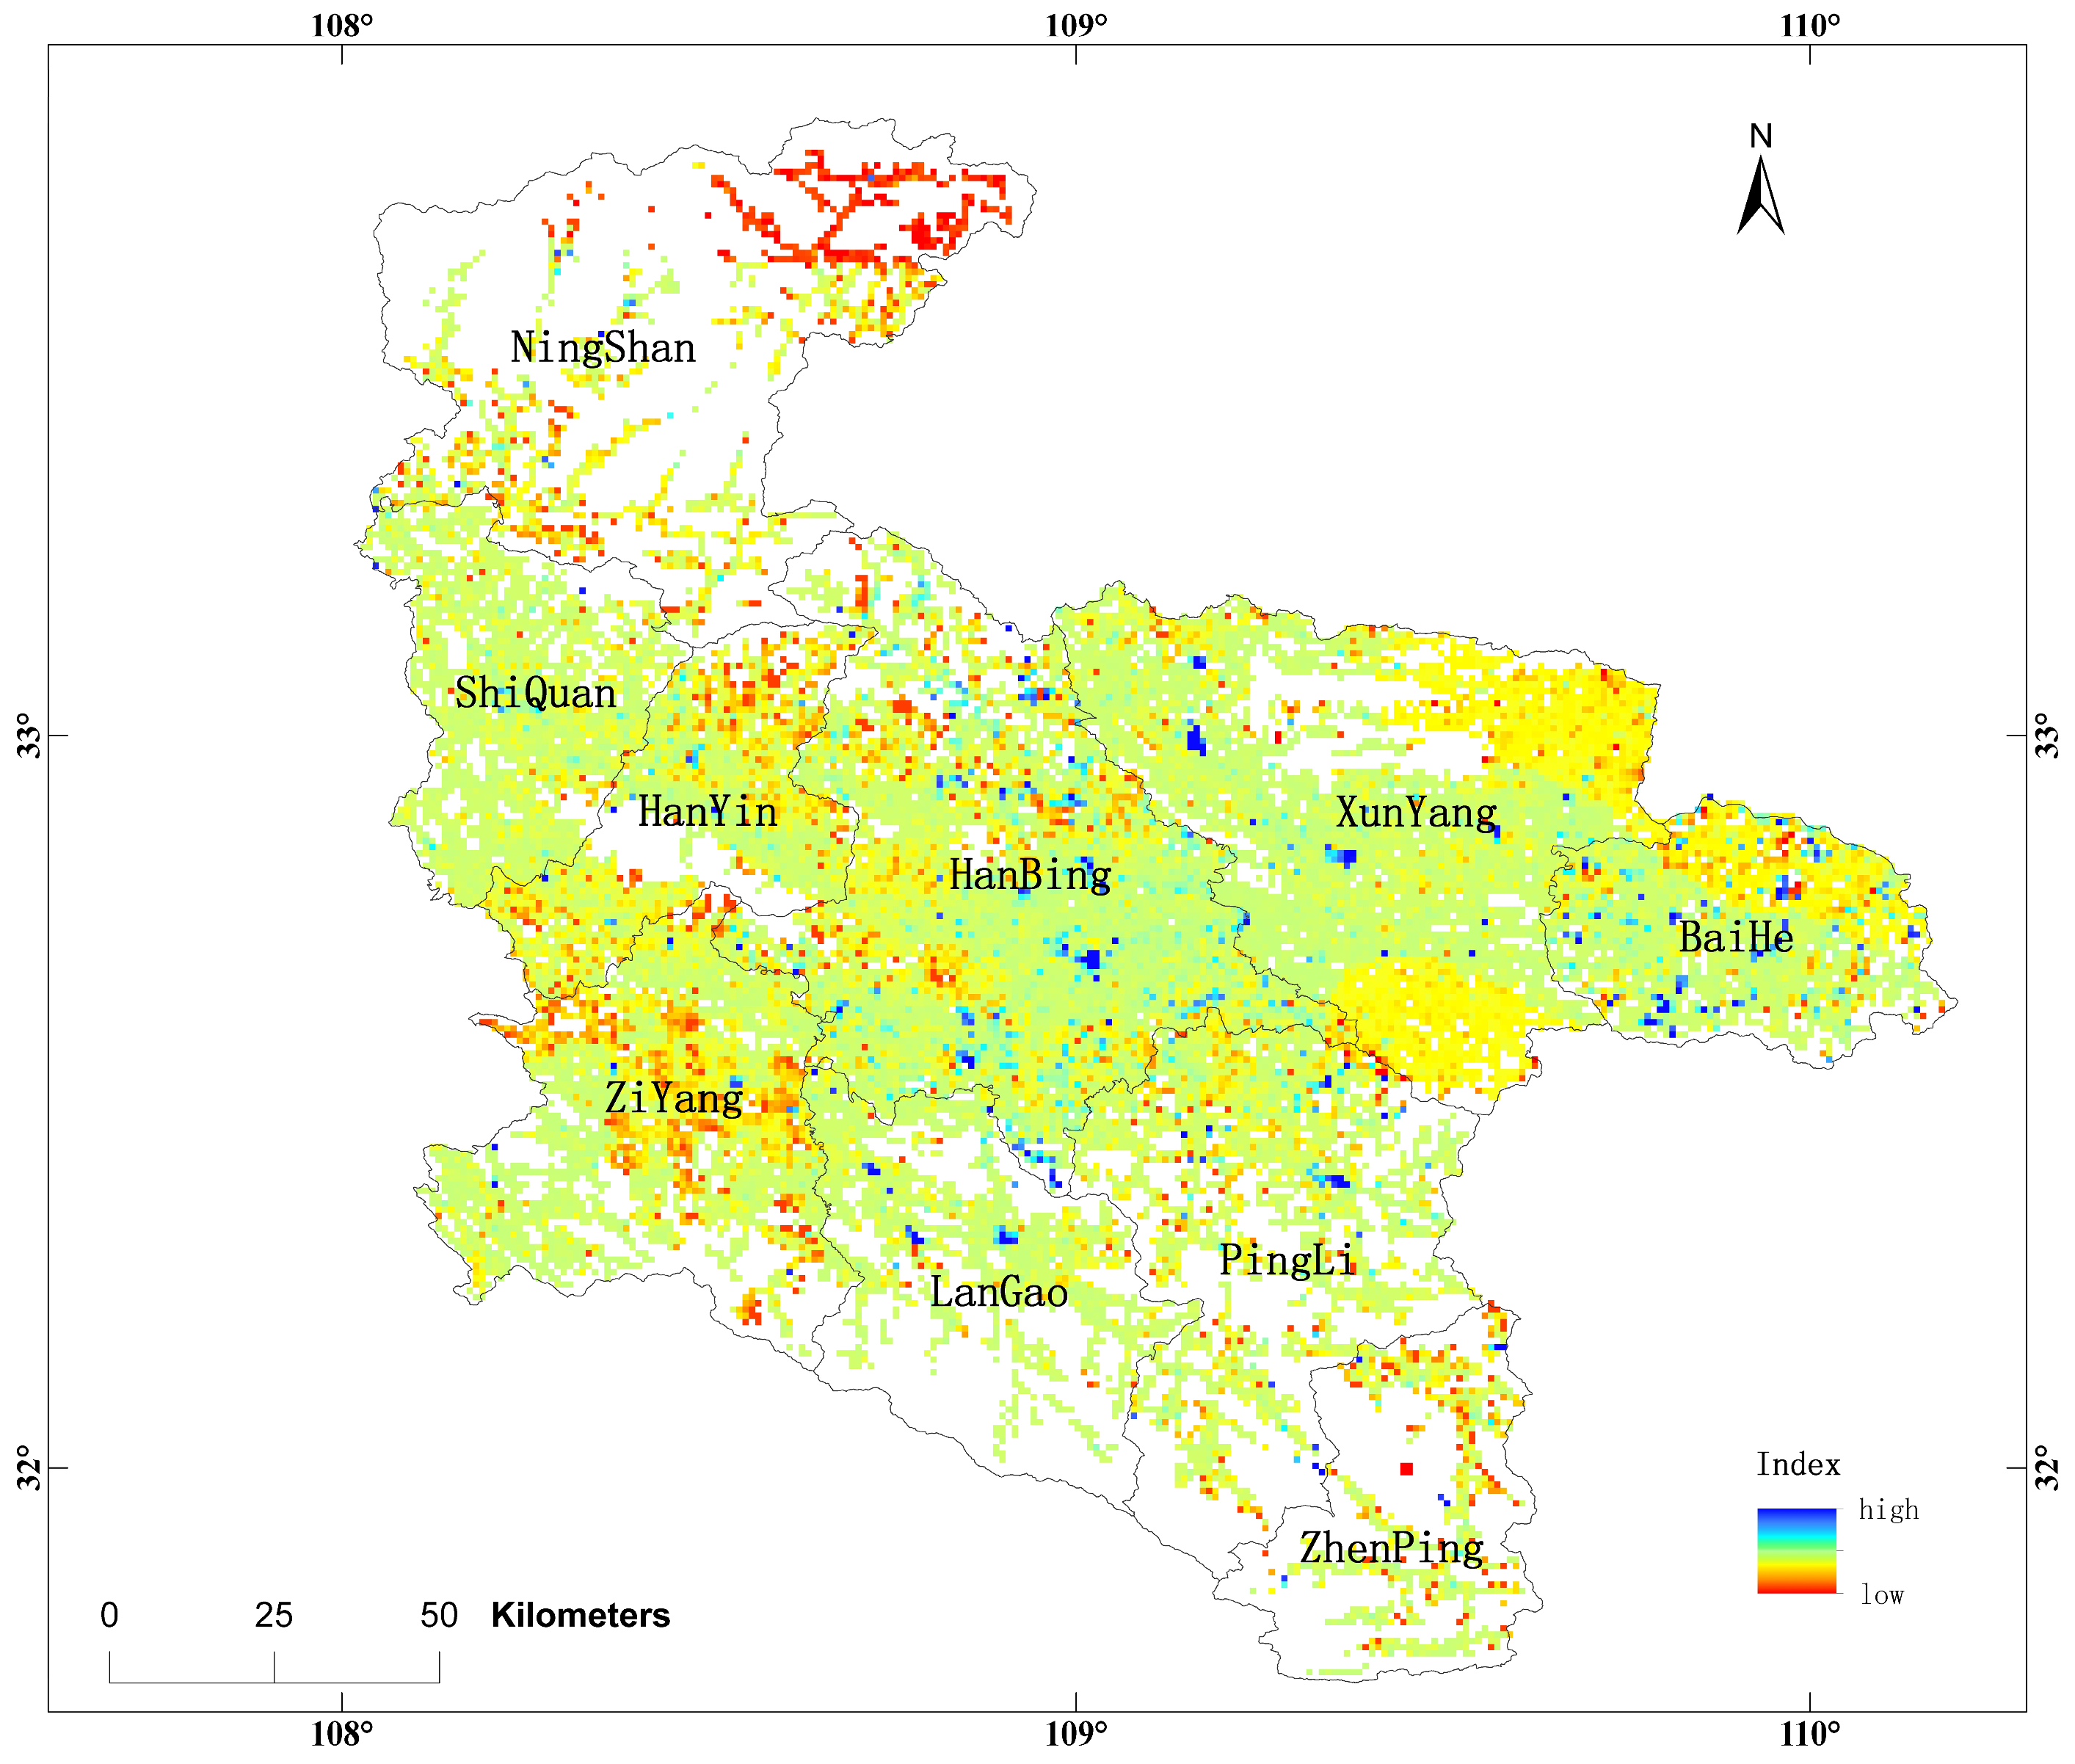
In order to illustrate the spatial dispersion of individual building seismic resilience index, this study employs kilometer grid units to compute the mean indexes across all buildings, with findings depicted in Figure 4. The visualization clearly reveals lower indexes in specific geographic areas: Ningshan’s north, Ziyang’s center, Hanyin’s north, and throughout Zhenping, contrasted with predominantly higher indexes in Hanbin. Notably, based on the adopted risk level categorization, a positive correlation with safety is observed: a higher resilience index ISR corresponds to stronger resistance capacity and thus a reduced disaster risk.
Figure 4.
Spatial distribution map of individual building seismic resilience index in Ankang City.
This assessment builds upon the framework established by the Seismic Resilience Index (ISR). To illustrate the spatial distribution of resilience across the region, we computed the index for all 635,000 individual buildings and categorized them into three risk levels as defined in Table 2. The statistical distribution of these risk levels across different architectural categories is summarized in Table 5. It becomes evident from the results of this statistical analysis that, in a general sense, the seismic risk level associated with the buildings in Ankang city is categorically low, with an overwhelmingly large majority of the buildings being designated under the “Minor” risk level classification, conspicuously devoid of any establishments falling within the “Critical” risk level. Additionally, a comparison across categories shows that the proportions represented by “Minor” classifications within the realms of School Buildings and Medical Facilities are conspicuously the most substantial, thereby reflecting the heightened degree of attention and prioritization accorded by both societal entities and governmental bodies towards the structural integrity and quality of buildings designated for educational and healthcare purposes.
Table 5.
Statistical distribution of risk levels across different types of buildings.
A notable finding from the individual assessment is the absence of buildings classified as “Critical” (ISR ≤ 0.075). This result is consistent with the parameter constraints imposed by the technical specification (FXPC/DZ P-03) when applied to the specific seismic context of Ankang City. To verify this, a theoretical lower bound calculation was performed for a “worst-case” residential building scenario in Ankang:
- Consequence (C): For standard residential buildings (S < 500 m2), C = 0.75.
- Site (R): Ankang is primarily in a 0.1 g seismic zone (R1 ≈ 0.95) with relatively stable site conditions (R2 ≈ 0.95 for Class II), yielding R ≈ 0.90.
- Vulnerability (V): Even for a structure with the worst attributes (Unfortified V1 = 0.05, Severe Defects V3 = 0.05, Old Age V2 = 0.75), the weighted calculation of the vulnerability coefficient typically yields a value around V ≈ 0.12. Substituting these minimums into the index formula: ISR,min = 0.75 × 0.90 × 0.12 ≈ 0.081. The calculated theoretical minimum (ISR ≈ 0.081) exceeds the threshold for the “Critical” level (0.075). Consequently, it is mathematically expected that even buildings with severe defects in this region fall into the “Moderate” rather than the “Critical” category. This confirms that the “Critical” classification is reserved for extreme scenarios (e.g., buildings on active fault lines or high intensity zones) not present in the Ankang dataset.
5.2. Regional Building Assessment Results
The regional seismic risk metric is derived from a statistical categorization based on the proportion of building area across different risk levels of individual buildings, reflecting the macro-level earthquake hazard potential of a specific type of building within a region. In recognition of the disparities in seismic resilience between urban and rural area buildings and the differences in population density covered by residential versus non-residential structures, our methodology segments all buildings into four key categories for hazard assessment: rural residential, rural non-residential, urban residential, and urban non-residential. This segmentation adheres to the grading criteria specified in Table 4. Detailed in Table 6 are the regional risk indexes and their corresponding risk levels for the various districts and counties in Ankang city.
Table 6.
Assessment results of seismic risk levels for buildings in Ankang City.
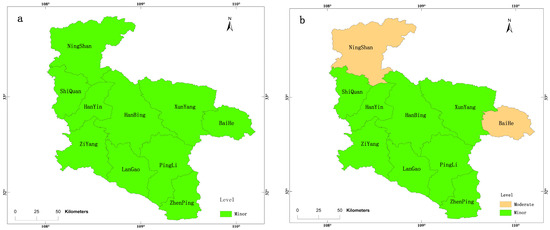
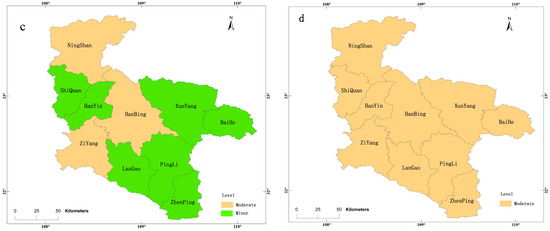
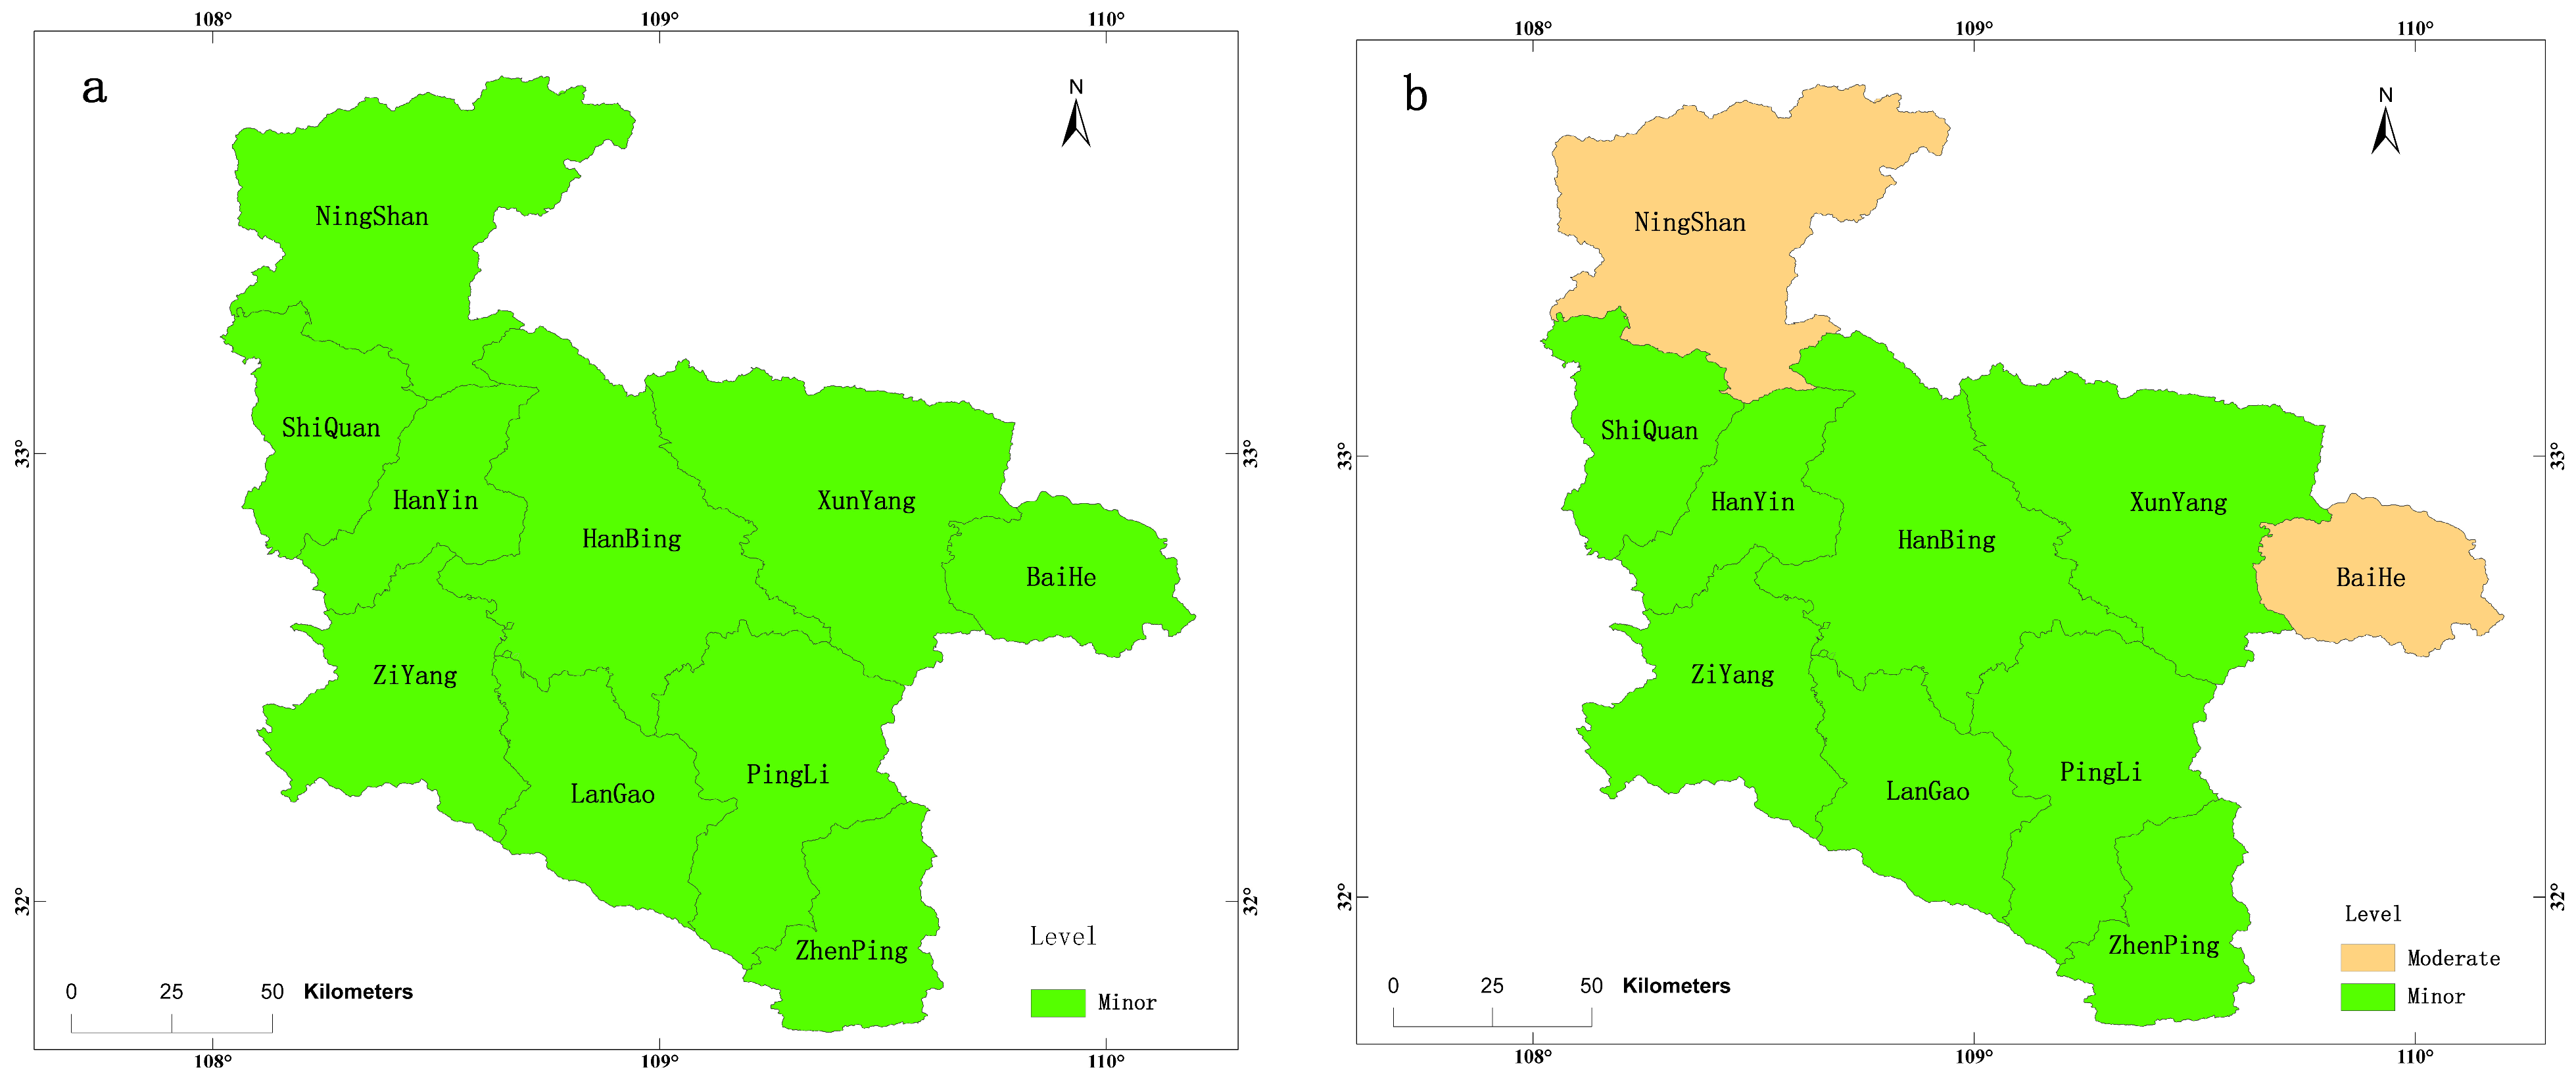
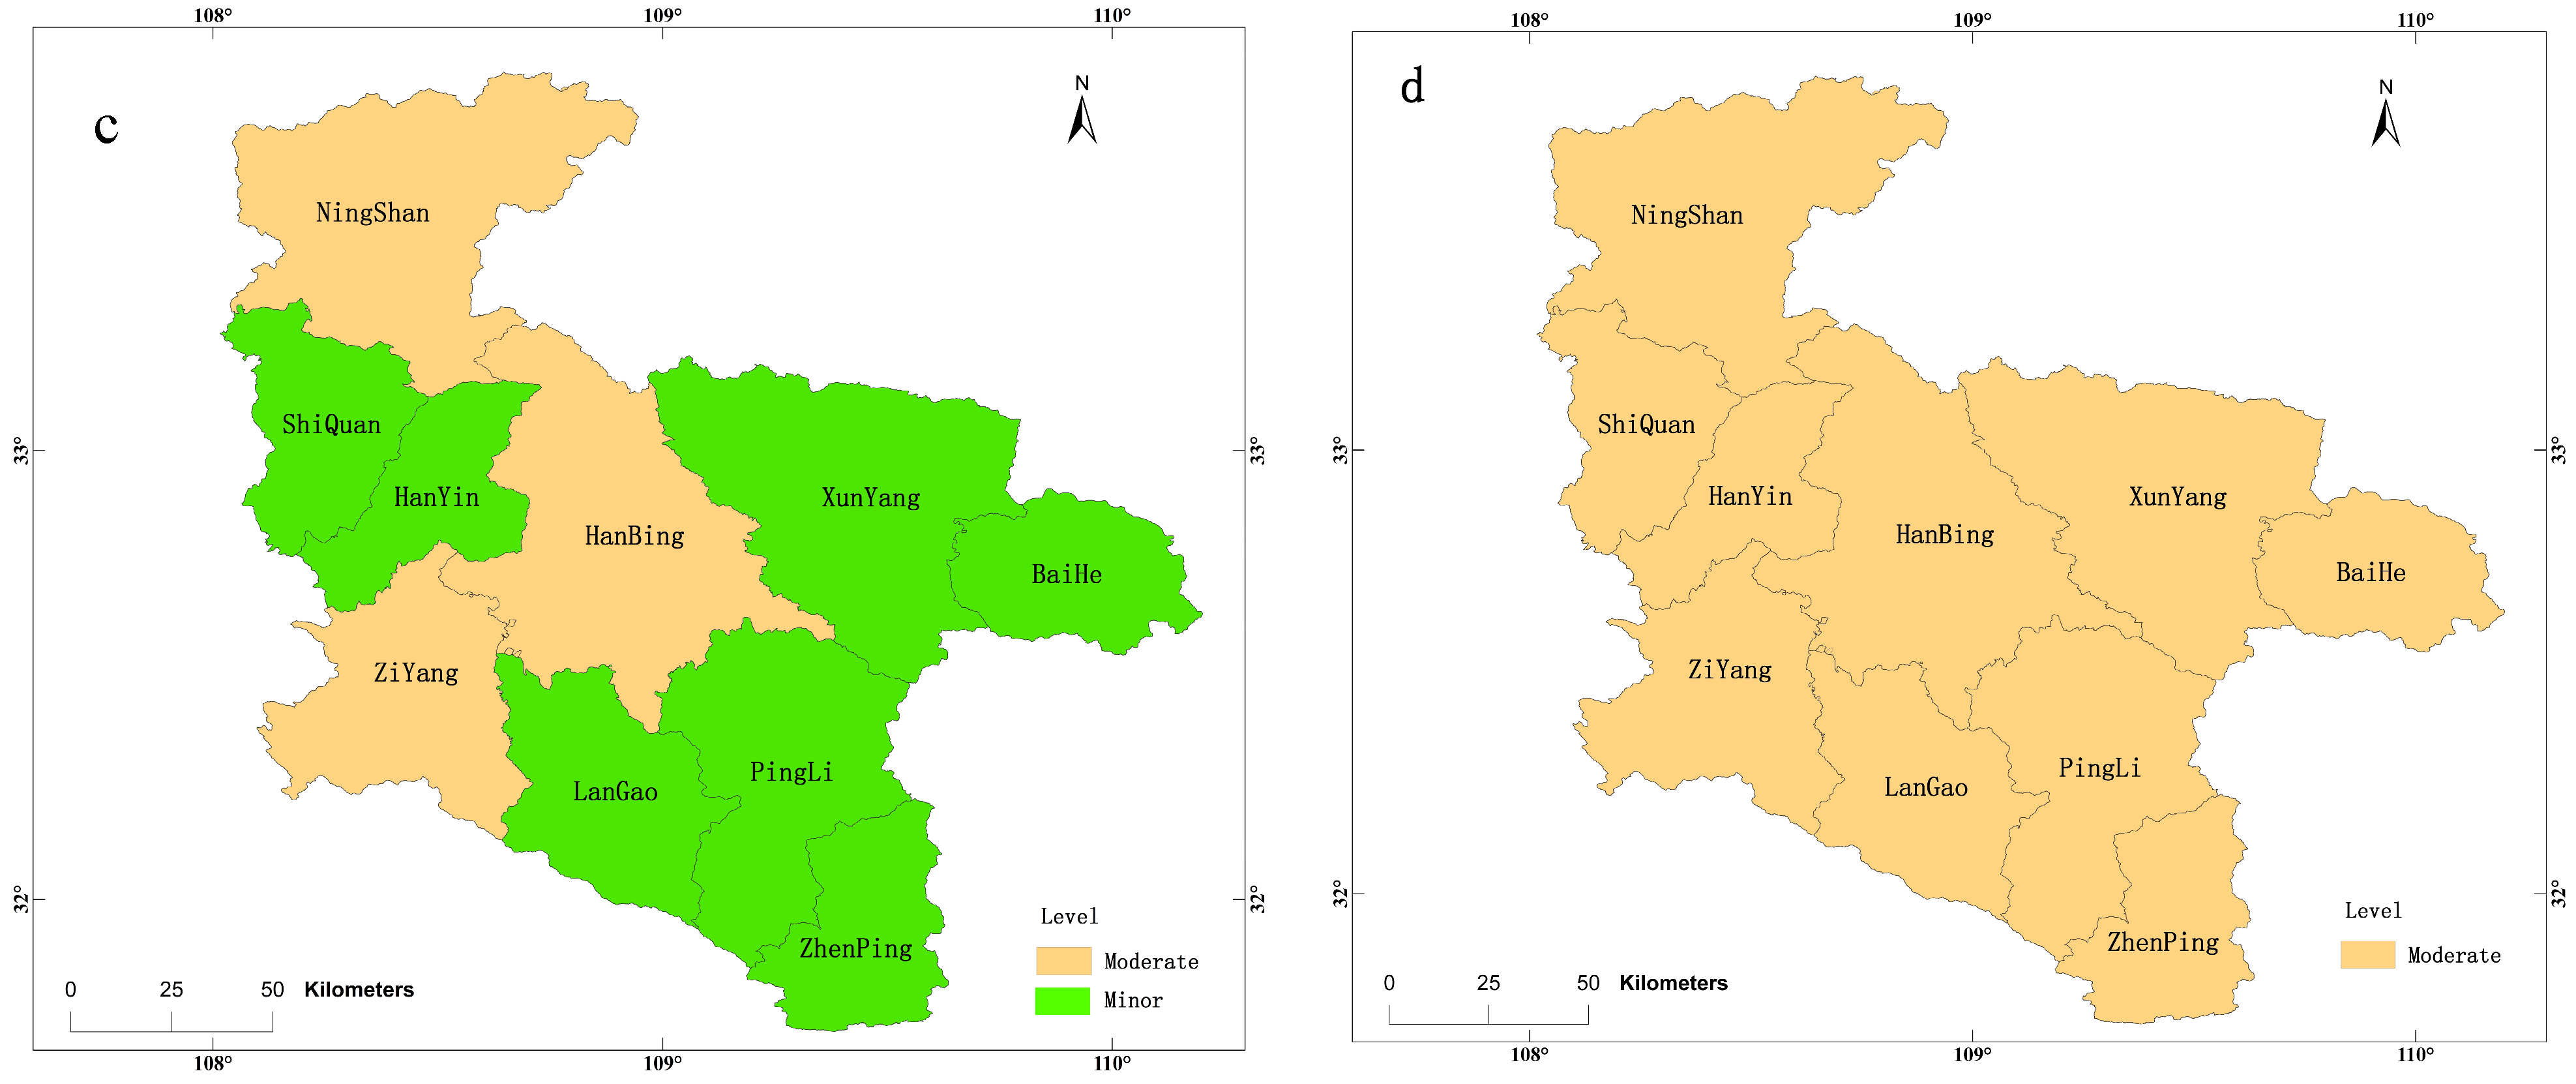
Figure 5 provides a visual representation of the distribution of regional seismic risk levels within Ankang City, mapped according to county level administrative divisions. Based on the evaluation results using counties and districts as assessment units, no regions in Ankang City have been categorized with a “Critical” risk level for building related seismic risks. In urban areas, the regional risk level for residential buildings across all counties and districts is classified as “Minor”; for non-residential buildings, only Ningshan and Baihe counties are rated as “Moderate”. In rural areas, the regional risk level for residential buildings is “Minor” across most counties, with the exception of Ningshan, Hanbin, and Ziyang, which are rated as “Moderate”. Additionally, the risk level for non-residential buildings is “Moderate” in all rural counties and districts. These findings indicate that urban areas have a lower seismic risk for buildings compared to rural areas. Overall, the seismic risk of buildings in Ningshan is relatively high, as 3 out of its 4 building categories have been rated as “Moderate” in terms of regional risk level.
Figure 5.
Distribution map of regional seismic risk levels for buildings in Ankang City, where section (a) corresponds to urban residential buildings, section (b) to urban non-residential buildings, section (c) to rural residential buildings, and section (d) to rural non-residential buildings.
To quantitatively address the drivers behind the observed urban–rural risk disparity, we performed a granular breakdown of the 19,690 building records in Ningshan County, explicitly stratifying the data into urban and rural categories based on administrative coding. The analysis reveals that the disparity is driven by a “triple-deficit” in rural housing:
- The Age Deficit: Rural areas are disproportionately burdened by legacy structures. 46.3% of rural buildings were constructed prior to 1989 (typically unreinforced masonry), compared to only 9.0% in urban areas. This indicates that the rural risk is largely a function of an aging, non-renewed housing stock.
- The Compliance Deficit: There is a systemic lack of seismic design in rural self-construction. Our data shows that 98.8% of rural buildings are classified as “Unfortified” (no seismic design), whereas 89.9% of urban buildings comply with formal seismic codes (Intensity VI or VII). This lack of engineering redundancy makes rural structures highly vulnerable to progressive collapse.
- The Maintenance Deficit: Consequently, rural buildings exhibit significantly faster degradation. The prevalence of “Major” structural defects in rural areas is 14.2%, nearly 7.5 times higher than the 1.9% observed in urban areas.
Synthesizing these factors, the “Moderate” risk rate in rural Ningshan reaches 35.6%, which is 3.3 times higher than that in urban areas (10.9%). This confirms that the regional risk hotspots are not random, but are structurally pinned to specific typologies: pre-1989, unfortified, defect ridden rural masonry dwellings.
6. Discussion
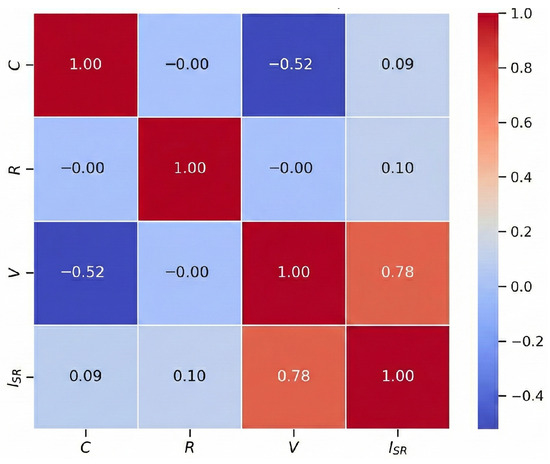
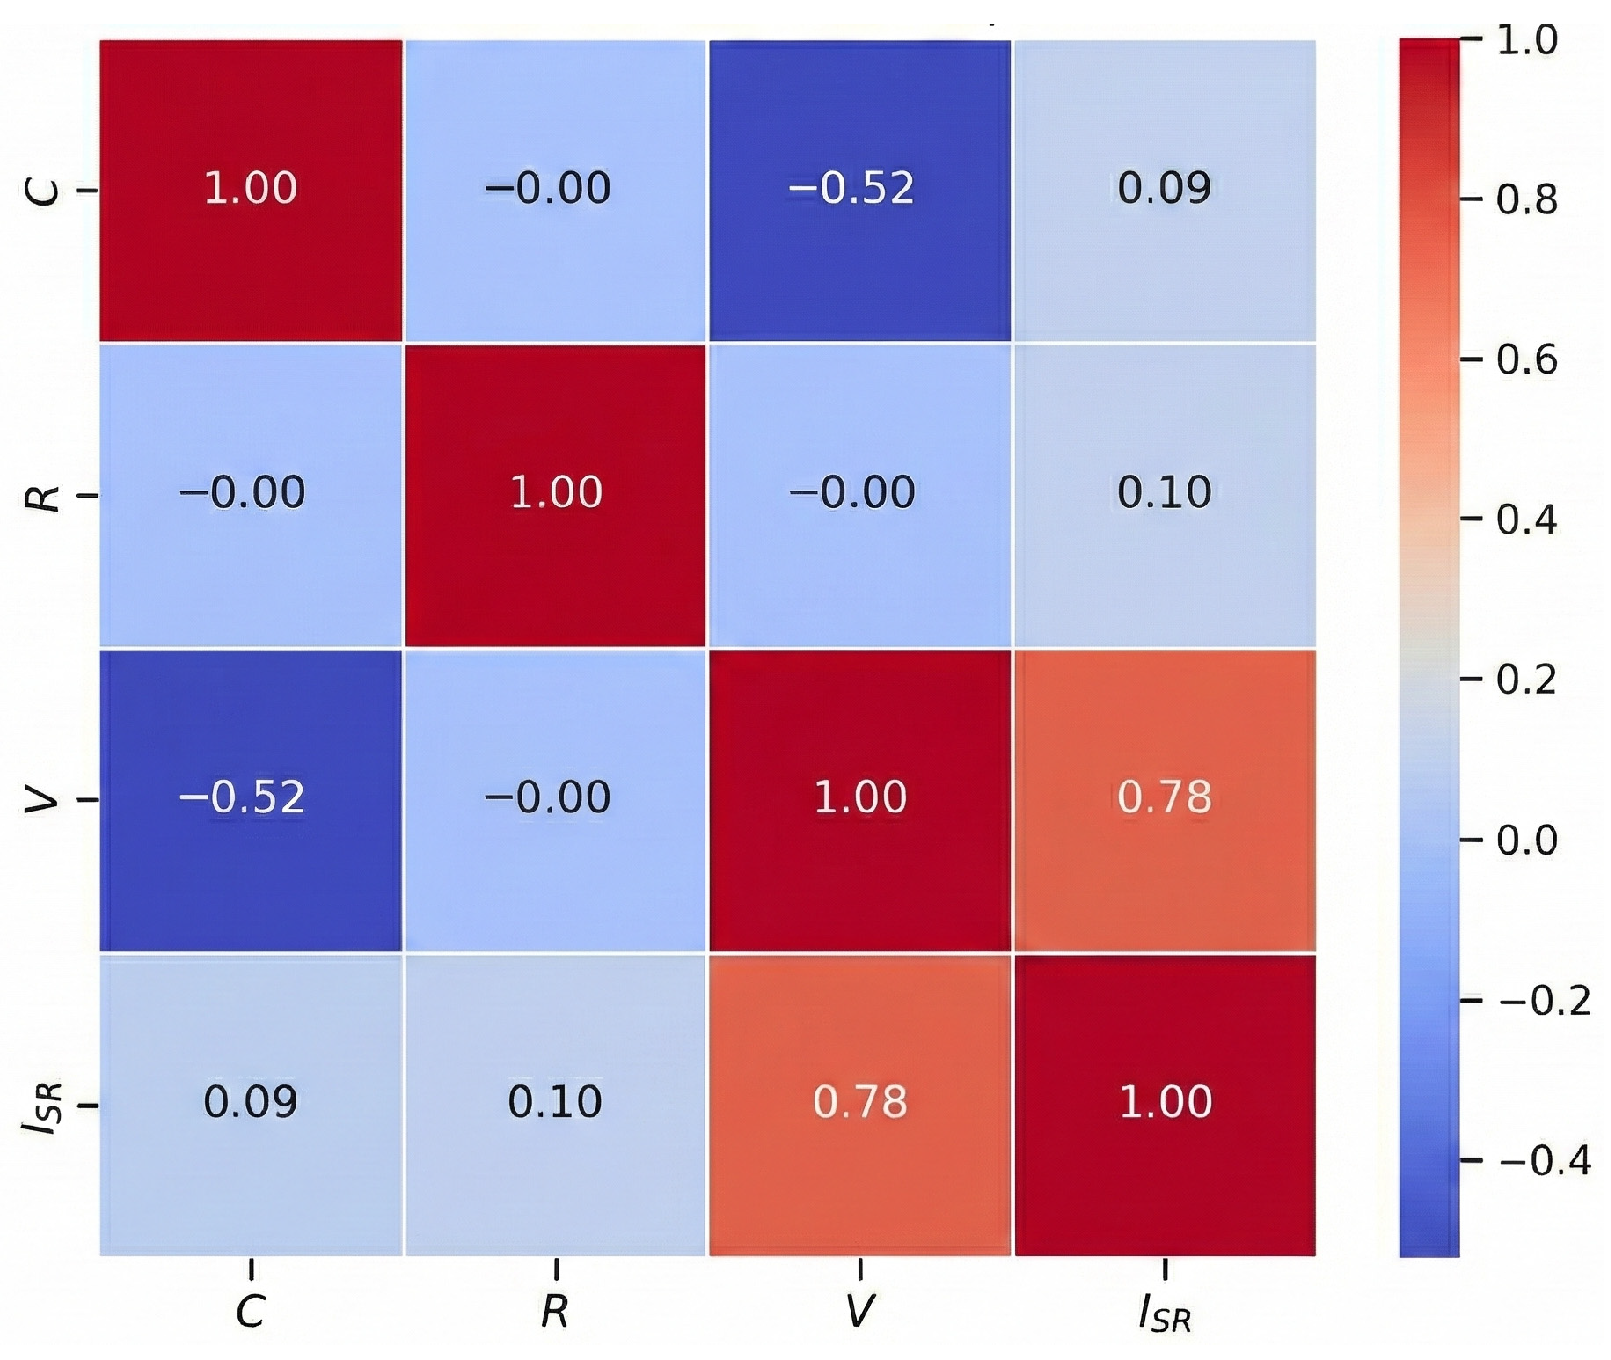
The assessment methodology employed in this study hinges on three core parameters: the disaster impact consequence coefficient (C), the site impact coefficient (R), and the load bearing structure vulnerability coefficient (V). Figure 6 presents a correlation matrix that visualizes the relationships between these three parameters and the overall Seismic Resilience Index ISR. The correlation coefficients were calculated using the Pearson method based on the raw assessment data of the entire building stock in Ankang City (N ≈ 635,000), without logarithmic transformation. The specific correlation values are annotated within each cell of the heatmap to ensure quantitative readability. This matrix provides critical insights into how each factor influences the outcomes of the seismic hazard assessment.
Figure 6.
Correlation matrix heatmap. Note: A positive correlation coefficient indicates that a higher value of the parameter is associated with a higher seismic resilience index (ISR), i.e., greater resilience.
As revealed by the correlation matrix, the vulnerability coefficient (V) exhibits a moderate positive correlation (r = 0.78) with the overall seismic resilience index. This finding indicates that the vulnerability of a building’s load bearing structure which integrates factors such as seismic resistance grade, construction period, and the degree of structural deterioration—exerts a substantial influence on determining the building’s seismic risk. The strong dependency of the resilience index on V underscores the importance of incorporating detailed structural evaluations in regions with aging or poorly maintained buildings, as these structures are likely to be major contributors to elevated risk levels.
In contrast, two key observations emerge regarding the other two coefficients. First, the consequence coefficient (C) which reflects a building’s functional usage and the potential scale of disaster impacts following structural damage exhibits a weak correlation with both the site impact coefficient (R) and the overall resilience index (r = 0.09 for C vs. ISR). Second, the site impact coefficient (R) also shows minimal correlation with the resilience index (r = 0.10). The near zero correlation between C and R suggests that, within the context of this study, the effects of site conditions and building functional usage are largely independent of each other. This independence is presumably linked to the relatively mild seismic activity in Ankang City: in such low-seismic-intensity regions, site conditions may have a less prominent impact on overall seismic risk. However, in areas with higher seismic hazard potential, R might exhibit a stronger correlation with the resilience index, as ground motion amplification in specific soil types (e.g., soft soil) could significantly degrade structural performance during an earthquake.
Sensitivity Analysis of Site Impact Resolution To quantify the contribution of the high resolution (100 m grid) site classification map, a sensitivity analysis was conducted by comparing the proposed model against a baseline model using a uniform site factor (Class II). The results show that the integration of high-resolution site data led to risk level reclassifications for approximately 0.01% of the total building stock. Spatially, these adjustments were highly concentrated in river valley zones, where the site conditions shifted from Class II to Class III.
It is important to note that this relatively low proportion is consistent with the specific geological context of Ankang City, which is predominantly a bedrock dominated mountainous region with naturally limited soft soil distribution. Consequently, the deviation between the generalized regional site class and the local reality is minimal for most areas. However, the method’s ability to pinpoint these sparse soft-soil pockets validates its precision. It can be inferred that in regions characterized by extensive alluvial plains or complex sedimentary basins, the impact of this high-resolution site assessment would be significantly more pronounced and critical for accurate risk stratification.
The weak correlation (r = 0.09) between C and the ISR further indicates that a building’s functional usage and potential impact scope have a relatively limited effect in the current assessment model. This phenomenon can be attributed to the uniform seismic design requirements mandated by the government for public service buildings (e.g., schools, hospitals). These standardized regulations reduce variability in C values across different building types, thereby weakening the coefficient’s influence on the overall resilience index. That said, future studies conducted in regions with more diverse building codes or varying population densities may yield different trends: in such contexts, differences in building usage and purpose could contribute more substantially to variations in the ISR.
Overall, the assessment methodology utilized in this study effectively captures the role of building vulnerability in regional seismic hazard evaluations. The significant influence of the vulnerability coefficient (V) suggests that policy interventions focused on structural reinforcement particularly for aging or rural self-constructed buildings could serve as effective measures to mitigate seismic risk in Ankang City. Nevertheless, the model has limitations, especially when applied to regions with different site conditions, varied building functional types, or distinct geological hazard profiles. These limitations highlight the need for adaptive adjustments to earthquake hazard assessment methodologies.
While a quantitative validation against building-by-building damage data is constrained by the lack of recent destructive earthquakes centered in Ankang, a qualitative consistency check can be performed using historical records from the 2008 Wenchuan M8.0 Earthquake. Although the epicenter was approximately 600 km away, Ankang City suffered significant structural damage due to the propagation of seismic waves. Historical disaster reports indicate that Ningshan County, located in the northern Qinling Mountain region, was among the areas in Ankang that experienced notable structural distress (including partial collapses of older rural dwellings) and economic loss during the event. This historical observation aligns remarkably well with the spatial results of our assessment. As shown in the regional assessment (Table 5 and Figure 5), Ningshan County is identified as the region with the highest seismic risk, being the only county where three out of four building categories (Rural Residential, Rural Non-residential, and Urban Non-residential) are classified at the “Moderate” risk level. This consistency between the model’s identification of Ningshan as a vulnerability hotspot and its actual historical performance during the Wenchuan earthquake provides a valuable qualitative validation, supporting the reliability of the proposed index in prioritizing high risk regions.
From a mitigation perspective, our theoretical projection indicates that bringing these pre-1989 unfortified structures (V1 ≈ 0.05) into compliance with current seismic codes (V1 ≥ 0.8) would reduce the “Moderate” risk prevalence in rural Ningshan from the current 35.6% to approximately 5%. This quantitative estimate highlights the transformative impact of the proposed strengthening measures, demonstrating that the urban–rural safety gap can be effectively bridged through targeted engineering interventions on this specific legacy building stock.
Future research could integrate additional parameters such as specific soil properties, geological hazard factors (e.g., landslide susceptibility), or detailed building usage characteristics to further refine the assessment model and enhance its applicability across diverse seismic environments.
7. Conclusions
7.1. Summary of Findings
The seismic risk assessment of buildings in Ankang City reveals a distinct spatial pattern in the distribution of potential risks. Among all administrative regions, Ningshan County exhibits the highest concentration of potential risks, as evidenced by the largest proportion of buildings classified at the “Moderate” risk level. This elevated risk level corresponds to the lowest values of the Seismic Resilience Index (ISR) and is primarily driven by the high density of structures constructed before 2000, with a particular focus on buildings erected prior to 1989. Most of these older structures lack seismic fortification measures and show visible signs of structural deterioration, further exacerbating their vulnerability. Notable risk concentrations are also identified in Hanbin District and Ziyang County; similar to Ningshan County, this pattern is closely associated with the widespread presence of unfortified buildings and aging structures. Overall, the assessment results align with expected structural performance and historical observations, such as the damage patterns from the 2008 Wenchuan Earthquake. Two key trends emerge from the analysis: first, stricter fortification standards in modern urban construction have effectively reduced risk; second, rural areas across Ankang City continue to demonstrate significantly higher seismic vulnerability. This rural-urban disparity is mainly attributed to the “triple-deficit” in rural housing: the predominance of older buildings, the systemic lack of seismic design compliance, and higher rates of structural defects compared to urban regions.
7.2. Quantified and Priority-Based Recommendations
Based on the detailed risk assessment results and the derived Seismic Resilience Index distribution, this study proposes the following quantified, priority driven recommendations to strategically mitigate earthquake related risks in Ankang City.
7.2.1. Data Informed Prioritization for Structural Intervention
It is suggested that intervention resources and efforts be prioritized for the highest risk structures identified in the assessment, guided by two core dimensions: (1) Targeted Geographic Zones: Counties with the lowest average resilience index values should be prioritized. In particular, Ningshan County is recommended as a focal point for large-scale seismic inspection and retrofitting initiatives over the next five years due to its high seismic risk. This targeted approach ensures that limited resources are directed to areas where risk reduction will have the most significant impact [23,24]. (2) High Vulnerability Building Typologies: Retrofitting work is advised to focus explicitly on residential buildings constructed before 1989. This focus is justified by the assessment’s finding that these structures exhibit the highest structural deterioration and lack of seismic fortification, maximizing the disaster mitigation efficiency per unit of investment.
7.2.2. Comprehensive Inspection and Reinforcement of Critical Infrastructure
A systematic hazard inspection campaign is recommended, with priority given to densely populated non-residential areas and industrial zones—specifically targeting buildings classified at the “Moderate” or higher risk level. This campaign should ideally include three key steps:
- Conducting a full seismic resilience evaluation of non-residential buildings, with special attention to two critical subcategories: structures required to maintain functionality during earthquakes (e.g., emergency shelters, medical facilities) and those housing hazardous materials (e.g., chemical storage facilities).
- Developing tailored mitigation measures based on the evaluation results for each high-risk structure.
- Implementing structural strengthening for unfortified buildings within these priority areas to bring them into compliance with current seismic safety standards.
Author Contributions
Conceptualization, D.S.; software, H.R.; validation, R.D. and D.S.; formal analysis, W.Z.; investigation, Q.T.; resources, D.S.; data curation, R.D.; writing—original draft preparation, D.S.; writing—review and editing, Q.T.; visualization, H.R.; supervision, R.D.; project administration, W.Z.; funding acquisition, D.S. All authors have read and agreed to the published version of the manuscript.
Funding
This research was funded by Natural Science Basic Research Program of Shaanxi (Program No. 2025JC-YBMS-293 and 2025JC-YBQN-697), Key Research and Development Program of Shaanxi (Program No. 2024SF-ZDCYL-05-15).
Data Availability Statement
The data presented in this study are available on request from the corresponding author due to privacy restrictions related to sensitive information protection.
Conflicts of Interest
The authors declare no conflicts of interest.
References
- Reiter, L. Earthquake Hazard Analysis: Issues and Insights; Columbia University Press: New York, NY, USA, 1990. [Google Scholar]
- Xiang, X.Q.; Huang, R.Q. Risk Evaluation and Risk Management of Geological Disasters. J. Geol. Hazards Environ. Preserv. 2000, 11, 38–41. [Google Scholar]
- Chen, H.F.; Dai, J.W.; Sun, B.T.; Wang, Y.R.; Zhang, C.H. Preliminary Analysis of Factors Affecting Casualties in the Yushu 7.1 Earthquake. Earthq. Eng. Eng. Vib. 2011, 31, 18–25. [Google Scholar]
- Wang, H.Y.; Huang, M.; Liang, R.L.; Wu, S.C. Preliminary Study on the Econometric Assessment Method of Earthquake Disaster Loss. J. Nat. Disasters 2009, 18, 105–110. [Google Scholar]
- Chong, R.; Peng, Y.; Shi, Q.X.; Wang, P. Eccentric compression performance of concrete filled steel tube slotted columns: Experiment and simulation analysis. Structures 2025, 74, 108580. [Google Scholar] [CrossRef] [Scilit]
- Sun, B.; Zhang, G. Study on vulnerability matrices of masonry buildings of mainland China. Earthq. Eng. Eng. Vib. 2018, 17, 251–259. [Google Scholar] [CrossRef] [Scilit]
- Masi, A.; Lagomarsino, S.; Dolce, M.; Manfredi, V.; Ottonelli, D. Towards the updated Italian seismic risk assessment: Exposure and vulnerability modelling. Bull. Earthq. Eng. 2021, 19, 3253–3286. [Google Scholar] [CrossRef] [Scilit]
- Lagomarsino, S.; Giovinazzi, S. Macroseismic and mechanical models for the vulnerability and damage assessment of current buildings. Bull. Earthq. Eng. 2006, 4, 415–443. [Google Scholar] [CrossRef] [Scilit]
- Martins, L.; Silva, V. Development of a fragility and vulnerability model for global seismic risk analyses. Bull. Earthq. Eng. 2021, 19, 6719–6745. [Google Scholar] [CrossRef] [Scilit]
- Shabani, A.; Kioumarsi, M.; Zucconi, M. State of the art of simplified analytical methods for seismic vulnerability assessment of unreinforced masonry buildings. Eng. Struct. 2021, 239, 112280. [Google Scholar] [CrossRef] [Scilit]
- Vicente, R.; Parodi, S.; Lagomarsino, S.; Varum, H.; Silva, J. Seismic vulnerability and risk assessment: Case study of the historic city centre of Coimbra, Portugal. Bull. Earthq. Eng. 2011, 9, 1067–1096. [Google Scholar] [CrossRef] [Scilit]
- Li, Y.Q.; Pang, S.; Shen, Z.Y. Thoughts on Safety and Construction Model of Rural Housing in China. Constr. Small Towns 2011, 2011, 58–64. [Google Scholar]
- Fang, Z.D.; Lin, S.Z.; Guo, Z.X. Survey and Potential Danger Analysis of Rural Houses in Fujian Province. Earthq. Resist. Eng. Retrofit. 2009, 31, 60–68. [Google Scholar]
- Zhang, G.X.; Sun, B.T.; Chen, X.Z.; Yan, P.L. Classification of Seismic Capability of Buildings and Earthquake Disaster Risk Analysis in Beijing. Earthq. Eng. Eng. Vib. 2018, 38, 223–229. [Google Scholar]
- Chen, H.; Liu, H.B.; Pan, N. Common Problems and Solutions of Self-built Masonry Houses by Rural Residents in Towns and Villages. Shanxi Archit. 2016, 42, 58–59. [Google Scholar]
- Diamantopoulos, S.; Achmet, Z.; Stefanidou, S.; Fragiadakis, M. Fragility assessment and risk-targeted design of RC buildings considering the effect of aging. Structures 2024, 61, 106277. [Google Scholar] [CrossRef] [Scilit]
- Guerrero, J.A.R.; Yang, T.Y.; Swei, O. Earthquake and deterioration inclusive probabilistic life cycle assessment (EDP-LCA) framework for buildings. Resilient Cities Struct. 2023, 2, 58–73. [Google Scholar] [CrossRef] [Scilit]
- Urlainis, A.; Shohet, I.M. A Comprehensive Approach to Earthquake-Resilient Infrastructure: Integrating Maintenance with Seismic Fragility Curves. Buildings 2023, 13, 2265. [Google Scholar] [CrossRef] [Scilit]
- Xu, W.; Wang, J.A.; Shi, P.J.; Zhou, J.H. Evaluation of Earthquake Disaster Risk of Chinese Cities. J. Nat. Disasters 2004, 13, 9–15. [Google Scholar]
- Zhang, G.X. Research on Regional Earthquake Disaster Risk Grading Evaluation Method Based on Multi-Source Data Fusion. Ph.D. Thesis, Institute of Engineering Mechanics, China Earthquake Administration, Harbin, China, 2020. [Google Scholar]
- FXPC/DZ P-03; Technical Specifications for the Grading of Earthquake Hazard Risks in Buildings (Structures). China Earthquake Administration: Beijing, China, 2021.
- Li, K.; Xie, J.J.; Li, X.J.; Jiang, W.X.; Zhu, C.B.; Zhang, Y. A 100-meter-resolution site-condition map of China based on surface geology and bedrock depth. Eng. Geol. 2025, 354, 108199. [Google Scholar] [CrossRef] [Scilit]
- Yu, Z.X.; Lu, K.N. Hidden Dangers and Countermeasures of Seismic Design of Civil Buildings in Panzhihua City. Panzhihua Sci. Technol. Inf. 2002, 27, 43–44. [Google Scholar]
- Hou, W.; Zhou, X.F.; Hao, L.; Li, X.L.; Xin, D.B. Study on Seismic Reinforcement Design Method for Masonry School Buildings in Xi’an Area. Technol. Earthq. Disaster Prev. 2011, 6, 130–135. [Google Scholar]

Disclaimer/Publisher’s Note: The statements, opinions and data contained in all publications are solely those of the individual author(s) and contributor(s) and not of MDPI and/or the editor(s). MDPI and/or the editor(s) disclaim responsibility for any injury to people or property resulting from any ideas, methods, instructions or products referred to in the content. |
© 2025 by the authors. Licensee MDPI, Basel, Switzerland. This article is an open access article distributed under the terms and conditions of the Creative Commons Attribution (CC BY) license (https://creativecommons.org/licenses/by/4.0/).