Abstract
China’s prefabricated construction industry, despite its recent emergence, faces challenges such as limited standardization, poor integration, and low industrialization. In the Engineering, Procurement, and Construction (EPC) model for prefabricated buildings, numerous risks arise due to the long project lifecycle, complex technical requirements, and force majeure factors. These risks may cause substantial project losses if not effectively controlled. This study, from the perspective of general contractors, explores risk assessment for prefabricated building projects under the EPC model to promote construction practices and enhance project resilience. The objective is to help contractors mitigate risks and ensure the smooth and environmentally responsible implementation of prefabricated projects. Risks were identified through literature review and case analysis, and a statistical process refined them into a structured index. The Analytic Network Process (ANP) was applied to assign indicator weights, establishing a comprehensive risk evaluation model. The Gray System Theory was then employed to assess the risks in a case study from Southwest China, validating the effectiveness and applicability of the proposed model. This research provides a systematic approach and theoretical support for EPC-based risk assessment, offering guidance for risk management and contributing to development in the construction industry.
1. Introduction
Prefabricated construction is a significant trend in the construction industry, necessitating a shift toward industrialized practices. Due to conventional contracting models, most prefabricated building projects in China still follow a fragmented management approach, separating design from construction. This results in insufficient coordination across key stages such as design, procurement, and construction, leading to slow project progress, communication difficulties, low resource integration efficiency, and challenges in ensuring construction quality. The Engineering, Procurement, and Construction (EPC) model integrates design, procurement, and construction into a unified framework, enabling efficient resource integration across the industrial chain, clarifying responsibilities, and optimizing project management. In prefabricated construction, the EPC model facilitates design optimization, rationalized equipment procurement, and scientific scheduling of construction activities, thereby enhancing project efficiency and improving construction quality. However, the EPC model also presents challenges, including extended project durations, technical complexity, and exposure to numerous force majeure factors. Information asymmetry between project owners and general contractors, coupled with varying management capabilities, increases the difficulty of cost adjustments and claims, placing a greater burden of risk on general contractors. As a result, the potential risks associated with EPC-based prefabricated construction continue to expand, making the precise and effective assessment of these risks a critical issue.
Researchers highlighted that the inherent risks in the prefabricated construction supply chain impact project completion rates [1]. Using grounded theory, they identified risks, developed a comprehensive risk framework covering all project phases, and employed an interpretive structural model (ISM) to analyze the relationships between risk factors. Pervez et al. assessed key risk factors in modular construction, selecting 20 risks from the literature and applying the fuzzy Delphi method to identify the most critical ones [2]. They then used the Full Consistency Method (FUCOM) to prioritize these risks. Shen et al. explored the application of Revit software in monitoring prefabricated construction processes [3]. Through case studies, they validated its effectiveness in enabling visualized management and decision support for construction safety risks. Wuni et al. argued that Modular Integrated Construction (MiC) represents a significant advancement over traditional construction methods [4]. They evaluated 15 on-site assembly (OA) risk factors in MiC projects, assessing their severity based on the interplay between factory production and on-site assembly. Li and Jing conducted a bibliometric analysis using CiteSpace on 385 papers from the CNKI database (2010–2020), uncovering research trends and key topics in EPC project management [5]. The study indicated growing academic attention in this field. Wu performed an in-depth analysis of contract risk management in EPC projects, finding that research primarily focuses on risk management in the early stages, implementation phase, and post-project completion [6]. Wang et al. categorized EPC project risks into five types: contract, design, procurement, construction, and external environment [7]. Using structural equation modeling (SEM), they conducted both qualitative and quantitative analyses on the Zhijiang Expressway project, identifying contract-related risks as the most critical. Fan et al. developed a hierarchical framework for prefabricated construction schedule risks from the perspective of general contractors [8]. They identified 22 schedule risk factors, structured them using the ISM, and classified risks based on driving and dependency forces using the impact matrix technique. Cao and Lei evaluated risks in prefabricated construction under the EPC model and proposed mitigation strategies. By conducting factor analysis with SPSS 22.0, they identified four primary indicators and 14 secondary indicators to quantify the impact of various factors on construction risks [9]. Xia et al. employed a gray-fuzzy theory model from a general contractor’s perspective, validating it through a case study in Nanjing. Their research identified the construction and design phases as the critical factors influencing project risk levels [10]. Li, in a study on large-scale engineering projects, concluded that project failures are often attributable to failures in organizational coordination and process management, rather than purely technical challenges [11]. Yang and Wang emphasized the decisive impact of design-phase decisions on the cost and schedule of prefabricated construction projects [12].
The aforementioned studies have established risk indicator systems from various evaluation perspectives and employed dynamic fuzzy theories and mathematical models to quantitatively analyze project risks. However, existing research has several limitations. Firstly, while the chosen mathematical model has been applied in risk assessment across various project domains, its specific application in prefabricated construction EPC projects remains limited. Secondly, within existing studies that employ this model, most tend to focus on isolated phases of the construction process, such as design, procurement, or construction, with comprehensive risk assessments spanning the entire project lifecycle being scarce. Thirdly, these studies predominantly evaluate risks related to a single project element, such as quality, safety, or cost, while integrated assessments that consider all critical elements are notably underdeveloped. To address these gaps, this study employs literature review and case analysis to effectively identify risks in prefabricated construction EPC projects. It integrates the Analytic Network Process (ANP) with Gray Clustering Analysis to develop a comprehensive risk assessment model that combines Gray Clustering Analysis with Fuzzy Evaluation. This approach not only captures the interdependencies among risk factors but also accounts for uncertainty and ambiguity in the assessment process. The proposed model is applied to a real-world case study of an EPC-based Prefabricated Buildings project (named as Project A) in Southwest China, validating its rationality while simultaneously determining the risk level of prefabricated construction EPC projects and providing insights for construction practices.
2. Construction of the Risk Assessment Index System
2.1. Extraction of Risk Factors
The extraction of risk factors should adhere to the principles of scientific rigor and objectivity, ensuring that the selected indicators comprehensively reflect the risk assessment criteria for EPC projects based on sound theoretical foundations.
First, this study employs a literature analysis approach using CiteSpace to extract risk factors. The literature sample consists of core journal articles retrieved from the CNKI academic journal database. After filtering out irrelevant studies, a total of 406 articles were selected. CiteSpace was then used to generate a keyword frequency table, and risk factors with a frequency of three or more were identified as the primary risk factors for EPC-mode projects.
Second, this study employs the open coding approach from grounded theory to identify risk factors through case study analysis. The empirical data were primarily collected through field research, focusing on four EPC prefabricated construction projects in Southwest China’s Chengdu and Chongqing regions—key hubs for prefabricated building development in this area. These selected projects demonstrate strong representativeness, with their floor area, investment scale, and technical requirements all ranking medium to high among comparable projects in the region. In-depth interviews were conducted with four experienced core managers (one from each project), focusing on the challenges encountered during project implementation. The coding process emphasized detailed case analysis, adhering to grounded theory’s native “In Vivo” coding principle to code the interview data. The specific coded materials were then synthesized into more abstract concepts, enabling the extraction of key themes and core concepts from the raw data, ultimately identifying the primary risk factors in EPC model projects.
Finally, the risk factors extracted from both methods were consolidated and merged to optimize and standardize risk classifications. This process resulted in a finalized list of risk factors for prefabricated construction projects under the EPC model, as shown in Table 1.

Table 1.
List of risk factors of projects.
2.2. Screening of Risk Factors
2.2.1. Screening Principles
The preliminary list of risk factors in Table 1 contains an excessive number of categories, which could increase the complexity of risk assessment and reduce its accuracy, making it difficult to effectively identify the most critical risk factors in EPC projects. To refine this list, a survey questionnaire was conducted, inviting experts from relevant organizations to evaluate and score each risk factor. The statistical analysis of the survey results was performed using SPSS 22.0, calculating the following key indicators:
Mean (μ): Represents the average score of each risk factor. Standard Deviation (σ): Reflects the degree of variation in risk factor scores—the larger the standard deviation, the greater the variation. Dispersion Value (δ): Defined as the ratio of the standard deviation to the mean. A smaller dispersion value indicates lower dispersion, meaning respondents’ opinions are more concentrated. Importance Index (Ri): Measures the significance of each risk factor. The formula for calculating Ri is as follows:
where Ri represents the importance index of the i-th risk factor, Liu denotes the number of respondents who rated the i-th risk factor at importance level “u”, and L refers to the total number of valid questionnaires [13].
The final screening of the risk factors is conducted by analyzing the correlation between the importance index (R-value) and the dispersion value (δ). A smaller δ indicates lower dispersion, meaning that respondents’ opinions are more consistent, and the corresponding risk factor should be retained. Conversely, risk factors with lower R-values are considered less critical and should be eliminated from the list.
2.2.2. Questionnaire Design and Data Sources
This study employs a questionnaire survey method for data collection. The questionnaire is designed based on the EPC project risk factor list established in Table 1 and consists of three sections: (1) Respondent Information: This section gathers basic details such as the respondent’s highest level of education, years of work experience, and the nature of their organization. (2) Terminology Explanation: Key technical terms used in the questionnaire are clarified to ensure a common understanding among respondents. (3) Questionnaire Content: A five-point Likert scale is used to assess the rationality of the identified risk factors.
The survey targets professionals involved in prefabricated construction projects in Southwest China. A total of 175 electronic questionnaires were distributed online, and 162 responses were received, yielding a response rate of 92.57%. After eliminating 10 invalid responses that did not meet the required standards, 152 valid responses remained, with an effective response rate of 86.86%. The detailed sample characteristics are presented in Table 2.
Table 2.
Basic information of survey objects.
2.2.3. Analysis of Survey Data
Before analyzing the questionnaire data, a reliability test was conducted to evaluate the stability and consistency of the assessment framework and examine the internal coherence of the indicators. A higher reliability coefficient indicates stronger consistency, stability, and reliability of the results. This study employs SPSS 22.0 software to measure Cronbach’s α coefficient, a widely used indicator of internal consistency, which ranges between 0 and 1 and is particularly suitable for analyzing Likert-scale surveys. When Cronbach’s α exceeds 0.7, the scale is considered to have acceptable internal consistency. As shown in Table 3, the Cronbach’s Alpha for the 30 identified risk factors in EPC-based prefabricated construction is 0.965, significantly exceeding 0.7, indicating high internal consistency and confirming the reliability and stability of the questionnaire data for subsequent analysis.
Table 3.
Reliability analysis results.
To ensure the risk indicator system accurately measures the target constructs, this study assessed its validity, with a primary focus on content validity due to the research’s scope and journal length limitations. Content validity was established through a rigorous development procedure: first, an initial item pool was generated via systematic literature review and case analysis; subsequently, a panel comprising three project management professors and two industry experts with over 20 years of experience conducted multiple rounds of evaluation and revision, assessing each risk item’s relevance, clarity, and comprehensiveness until consensus was achieved.
The screening threshold for the discrete value (δ) was set at ≤ 0.36 in this study, a determination grounded in established statistical consensus. Concurrently, the threshold for the importance value (R-value) was set at ≥65. This criterion was primarily derived from conventions observed in the project management risk literature, with the objective of retaining risk factors of medium-to-high importance or above. Based on the statistical analysis in Table 4, the importance index (R-value) and dispersion value (δ) of each risk factor were assessed. The results show that six risk factors—“Improper storage and protection of components”, “Inadequate quality and safety briefings”, “Immature application of new technologies and materials”, “Insufficient procurement personnel capabilities”, “Lack of contractual constraints on the owner”, and “Interest rate fluctuations”—all have dispersion values greater than 0.36, significantly higher than other factors, indicating a high level of disagreement among respondents. Additionally, the R-values of these six factors are all below 65, ranking lower than other risk factors. Given their low importance and high dispersion, these six factors are considered less critical and should be excluded from the final risk assessment framework.
Table 4.
Statistical calculation results of the questionnaire survey on risk factors.
2.3. Establishment of the Risk Assessment System
Through the identification, screening, and categorization of risk factors in EPC-based prefabricated construction projects, a comprehensive risk assessment index system was established. This system comprises six primary indicators and 24 secondary indicators, as detailed in Table 5.
Table 5.
Risk evaluation index system of projects.
3. Construction of the ANP–Gray Clustering Analysis Risk Evaluation Model
The Analytic Network Process (ANP) is a decision-making method proposed by Saaty. It is an extension of the Analytic Hierarchy Process (AHP). Unlike AHP, which emphasizes a unidirectional hierarchical structure, ANP incorporates interdependencies between risk factors and feedback loops among decision elements. This allows for a more accurate representation of internal relationships and the resolution of complex nonlinear problems [14]. Gray Fuzzy Comprehensive Evaluation, proposed by Professor Deng, is a method used to assess fuzzy factors or uncertain phenomena under conditions of limited information. Based on fuzzy mathematics, this approach quantifies qualitative factors and evaluates their membership levels within a given classification. The whitening weight function, a core component of Gray System Theory, is used to characterize the degree of preference for different values within a gray number’s range. This enables a quantitative description of how data points belong to specific gray classes [15].
This study adopts the ANP–Gray Clustering Analysis model to evaluate the risks associated with EPC-based prefabricated construction projects for the following reasons: (1) Interdependencies Among Risk Factors: Risks in EPC-based prefabricated construction are not only hierarchical but also interrelated across and within different levels of indicators. (2) Superiority Over AHP: Compared to AHP, ANP leverages a “supermatrix” to more effectively determine the mixed weightings of risk factors in EPC-based prefabricated construction. (3) Handling Gray and Fuzzy Characteristics: Due to the long construction cycles of EPC-based prefabricated projects, most risk indicators are qualitative rather than quantitative. The assessment of these risks relies heavily on expert judgment, and the relationships among risks and their contributing factors are often unclear. This results in high degrees of uncertainty and fuzziness in the risk evaluation framework [16].
Therefore, the ANP–Gray Clustering Analysis model is well-suited for evaluating risks in EPC-based prefabricated construction. This model not only accounts for the interconnections among risk indicators and their combined effects but also effectively addresses fuzziness and uncertainty in the risk evaluation process.
3.1. Determining Indicator Weights Based on ANP
3.1.1. Establishing the ANP Network Structure
Following the principles and implementation steps of ANP, a pairwise comparison of the dependent elements is required. This study applies an indirect dominance approach to compare risk factors within the network. Given a set of evaluation criteria, two risk factors are compared based on their impact on a third risk factor. ANP divides system elements into two main components [17]:
- 1.
- Control Layer: Defines the evaluation objective, which in this study is the risk assessment of EPC-based prefabricated construction projects. The key decision criteria include Probability of risk occurrence, Severity of risk consequences, and Controllability of risk factors.
- 2.
- Network Layer: Defines the risk factor set, corresponding to the primary indicators in the EPC risk assessment framework, which includes Design Risk (R1), Procurement Risk (R2), Construction Risk (R3), Management Risk (R4), Economic Risk (R5), and Other Risks (R6).
Each risk category consists of multiple secondary risk indicators. Based on this structure, an ANP-based risk assessment model for EPC-based prefabricated construction is developed, as shown in Figure 1.
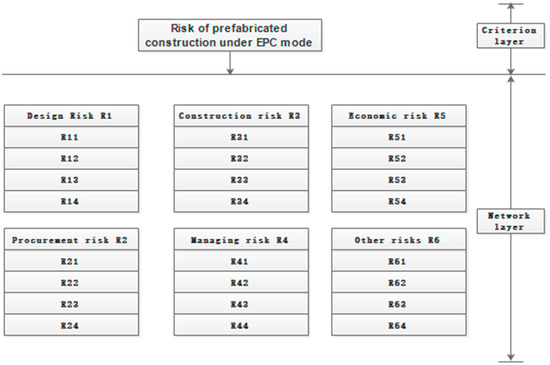
Figure 1.
Prefabricated building risk model under EPC mode based on ANP.
To ensure the professionalism and reliability of the research data, a panel of 20 seasoned industry experts was invited. The selection criteria for these experts were as follows: (1) employment by a general contracting enterprise; (2) over 15 years of relevant industry experience; and (3) direct responsibility for managing at least one complete prefabricated building EPC project. The panel had an average of 18 years of professional experience, with expertise spanning key areas including project management, structural design, construction technology, cost control, and procurement logistics, as detailed in Table 6.
Table 6.
The composition of the expert group.
To establish the relationships among risk factors, all 20 experts of the expert group were consulted through structured interviews. They were asked to identify feedback loops within risk groups and interdependencies between different risk categories. If more than 10 experts agreed on a causal relationship, it was retained in the model; otherwise, it was excluded. This process resulted in the EPC prefabricated construction risk factor relationship matrix, presented in Table 7. In Table 7, a value of “1” indicates the presence of an influence between two elements, whereas elements are assumed to have no self-impact. The direction of influence is represented by the row affecting the column.
Table 7.
Risk factor relationship matrix.
3.1.2. Constructing the Unweighted Supermatrix W
Based on the questionnaire method, experts were invited and indirect dominance comparison method was adopted. Under the Pi criterion, the risk element Rini in Ri was compared by indirect dominance according to its influence on the risk element Rjnj in Rj [18], that is, the pair-to-two comparison was made according to the scale defined in Table 8.
Table 8.
Scaling criteria.
Then the judgment matrix is constructed under the Pi criterion, as shown in Table 9.
Table 9.
The judgment matrix under the Pi criterion.
According to the formula, the consistency test is carried out on the judgment matrix. If CR ≤ 1.0, the judgment matrix passes the consistency test [19].
The eigenvector (, , …, ) after the normalization of the judgment matrix constitutes an unweighted hypermatrix W under the Pi criterion, whose column vector is the risk element in Ri (Ri1, Ri2, …, Rini) for risk elements in Rj (Rj1, Rj2, …, Rjnj) impact ranking vector.
Note: A key component of ANP is the Supermatrix, which is a partitioned matrix that captures all the pairwise influence relationships within the network of risk factors.
3.1.3. Construct the Weighted Supermatrix
On the basis of unweighted supermatrix and Pi criterion, the risk factor set Ri (i = 1, 2, …, N) for the set of risk factors Rj (j = 1, 2, …, N) importance judgment matrix, that is, the weighted matrix is obtained by comparing the indirect dominance degree of the risk factor set Ri according to its influence on the risk factor set Rj, as shown in Table 10. Since there are m criteria, there are m such supermatrices, and they are all non-negative matrices [20].
Table 10.
The importance judgment matrix for Ri with respect to Rj under the Pi criterion.
The ordering vector corresponding to the group of elements independent of Rj has a component of 0, thus obtaining the weight matrix C.
Weighting the elements of the hypermatrix W gives = CW, and is the weighted hypermatrix whose column vectors sum to 1.
3.1.4. Construct Limit Supermatrix
The weighted super matrix is normalized, and then the limit super matrix W∞ is obtained, whose column vector is the weight vector W′ of risk factor Rini.
3.1.5. Determine the Total Weight of Risk Indicators
Using criteria (P1, P2, …, Pm) repeats the above process and then synthesizes the weight of elements under each criterion to obtain the total weight of risk factors.
3.2. Determination of Evaluation Criteria and Whitening Weight Functions
To comprehensively assess the overall risk level of the project, we employed Gray Clustering Analysis. “clustering” refers to the process of classifying the project’s risk profile into predefined categories (e.g., Low, Medium, High) based on its gray relational degree to each category. The core of this method is the construction of whitening weight functions, which mathematically define the membership of a quantitative value to a specific qualitative risk category. Essentially, these functions describe how “belonging” a certain score is to a “High Risk” or “Low Risk” group, handling the ambiguity inherent in such classifications. Therefore, the gray clustering evaluation belongs to a kind of fuzzy evaluation.
In this study, the project risk level is divided into 5 levels, which are “very low”, “lower”, “medium”, “higher” and “very high” according to the probability of risk occurrence, loss severity and controllability from low to high. The value range of the risk measure is expressed by the interval number [0, 10] [21], and its review set and evaluation criteria are shown in Table 11.
Table 11.
Risk evaluation sets and evaluation standards of project.
The rationality of gray class classification directly affects the accuracy of risk assessment for EPC-based prefabricated construction projects. Based on the unique characteristics of these projects, the gray classes are categorized into five levels: Very Low, Low, Medium, High, and Very High, with corresponding values of 1, 3, 5, 7, and 9, respectively. Building upon previous studies and considering the specific risk characteristics of EPC-based prefabricated construction, this study develops whitening weight functions for each gray class, as shown in Table 12. These functions enable quantitative risk assessment by defining the degree of membership of a given risk factor within each gray category.
Table 12.
Whiteness weight function of risk assessment.
3.3. Calculation of Grey Evaluation Coefficients and Weight Matrix
3.3.1. Establishing the Sample Matrix
A panel of 15 seasoned industry experts was invited to conduct the pairwise comparisons. This sample size aligns with the established practice in multi-criteria decision-making (MCDM) research, where the validity stems from the high caliber of the experts rather than the cohort’s size. All selected experts were from general contracting enterprises, with an average of over 15 years of professional experience and specific expertise in prefabricated EPC projects. The scoring criteria are defined as follows: The scoring range is 0–9, where 1, 3, 5, 7, and 9 represent risk levels Very Low, Low, Medium, High, and Very High, respectively, while 2, 4, 6, and 8 indicate intermediate levels between the predefined categories. Based on expert evaluations, a sample matrix is constructed to facilitate further analysis.
3.3.2. Calculation of Gray Evaluation Coefficients
yije is used to represent the gray evaluation coefficient of class e evaluation gray, then:
where t is the number of experts.
By synthesizing the five gray values, the total gray evaluation coefficient yij was obtained.
3.3.3. Calculation of the Gray Evaluation Weight Matrix
Cije is used to represent the gray evaluation power of category e evaluation grey [22], then:
In this paper, the gray class is determined into 5 grades, and the evaluation weights of each gray class are synthesized to obtain the gray evaluation weight vector Cij = (Cij1, Cij2, Cij3, Cij4, Cij5), and then the gray evaluation weight matrix C is obtained [23].
3.4. Multi-Level Fuzzy Comprehensive Evaluation
Firstly, the gray evaluation weight matrix Ci is evaluated comprehensively. Multiply the weight vector Hi of the 2-level index layer with its corresponding gray evaluation matrix Ci, and the evaluation result is represented by Bi [24], then:
The gray evaluation weight matrix B of the 2-level index layer is obtained.
Secondly, the gray evaluation weight matrix B is evaluated comprehensively. Product the weight vector S of the first-level index layer with its corresponding grey evaluation matrix B, S = (s1, s2, …, si), the evaluation result is represented by A [25]; then:
Finally, the 5 grades divided by gray are assigned according to “gray level”, and the value vector of gray grade is represented by U, that is, U = (9, 7, 5, 3, 1), and the gray comprehensive evaluation value is obtained [26]:
The calculated result corresponds to the evaluation level to determine the risk level of the project.
4. Empirical Analysis
To validate the rationality and effectiveness of the constructed gray fuzzy comprehensive evaluation model, Project A was selected as a case study. This project involves the construction of a new middle school in Chengdu, Southwest China. Project A has a total investment of 200 million CNY, with a site area of 30,521.04 m2 and a total floor area exceeding 40,000 m2. It utilizes prefabricated construction with a prefabrication ratio exceeding 33%. The structural system adopts a prefabricated frame structure combined with partially cast-in situ beams and slabs, with main prefabricated components including composite beams and composite slabs. The project employs the EPC turnkey model under a lump-sum contract, with a planned total duration of 24 months.
The selection of this case was guided by its representativeness in Southwest China. Project A is a public building utilizing precast concrete structure under the EPC model, with its floor area, investment scale, and technical requirements ranking medium to high among similar projects in the region, ensuring strong typicality. This makes the research findings highly relevant for future analogous projects. Furthermore, the research team maintained close collaboration with the general contractor, enabling access to comprehensive data across the entire project lifecycle—from decision-making and design to production and construction—and facilitating interviews and surveys with core management personnel. This cooperation robustly guaranteed the authenticity, comprehensiveness, and depth of the case data. Given the large-scale construction and the complex risk landscape, the ANP–Gray Clustering Analysis model was applied to determine the risk level of this project.
4.1. Construction of the Risk Indicator System
Based on the literature analysis method and case study method, a list of risk factors was initially identified. To further refine this list, a questionnaire survey was conducted, inviting professionals from relevant organizations to evaluate and filter the risk indicators. The collected data was analyzed using SPSS 22.0 statistical software, which helped eliminate relatively insignificant risk factors, thereby refining the final risk factor list. The constructed risk indicator system is presented in Table 5.
4.2. Determination of Risk Indicator Weights
Using Table 7, which illustrates the independence, dependence, and feedback relationships among risk factors, the SuperDecisions 3.2 software was employed to construct a risk network diagram for EPC-based prefabricated construction projects using ANP, as shown in Figure 2.
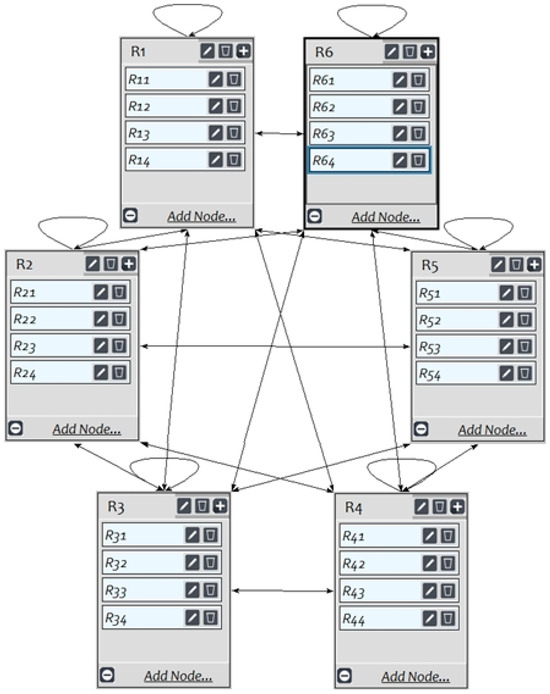
Figure 2.
Risk network diagram based on ANP.
After establishing the ANP network structure, the SuperDecisions 3.2 software automatically generated the pairwise comparison judgment matrices for risk factors. A questionnaire survey was conducted with industry experts, who provided evaluations using the indirect dominance comparison method based on the 1–9 scale method (as shown in Table 8). The pairwise comparison judgment matrices for both primary and secondary risk indicators are depicted in Figure 3 and Figure 4. In total, this study constructed six pairwise comparison matrices for primary indicators and 24 matrices for secondary indicators.
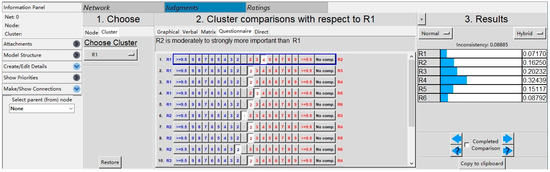
Figure 3.
Pairwise comparison judgment matrix and consistency test under R1.
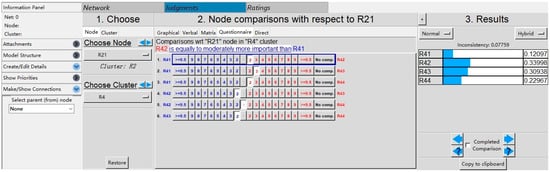
Figure 4.
Pairwise comparison judgment matrix and consistency test under R21.
Since expert evaluations involve subjectivity, it was necessary to conduct a consistency test on the risk factor comparison matrices. Upon inputting the importance relationship matrices, the SuperDecisions 3.2 software automatically calculated the consistency ratio (CR). Based on Equations (1) and (2), the matrices were tested for consistency, and if CR ≤ 0.1, the judgment matrix was deemed to have passed the consistency test. Any matrix with a CR value exceeding the threshold of 0.1 was deemed inconsistent and was returned to the respective expert for revision until the CR criterion was met. This process guaranteed the logical reliability of all expert judgments utilized in the model.
In the ANP network of this study, the three control criteria—Probability (P), Severity (S), and Controllability (C)—together with the risk clusters and risk indicators in the network layer, form an interactive feedback system. In SuperDecisions 3.2, the relative importance of the control criteria is not derived from an independent comparison matrix. Instead, pairwise comparisons involving the control criteria and all other elements in the network are incorporated together. Through the synthesis of the weighted supermatrix and the calculation of its limit, the global weights of all elements—including the control criteria—relative to the overall goal are ultimately determined. Additionally, the software performs consistency checks on all input pairwise comparison matrices, including those involving the control criteria.
Using SuperDecisions 3.2, the unweighted supermatrix, weighted supermatrix, and limit matrix for the ANP risk indicator system were generated, and the weights of risk indicators were determined. The impact of each risk factor on EPC-based prefabricated construction risk was analyzed based on these weights, as shown in Table 12.
From Table 13, the weight vector S for the overall risk R in EPC-based prefabricated construction projects and the weight vectors H1, H2, H3, H4, H5, and H6 for each primary risk category are as follows:
S = (0.081, 0.165, 0.113, 0.350, 0.176, 0.115)
H1 = (0.217, 0.343, 0.192, 0.248)
H2 = (0.125, 0.283, 0.434, 0.159)
H3 = (0.210, 0.304, 0.318, 0.168)
H4 = (0.261, 0.247, 0.260, 0.232)
H5 = (0.047, 0.253, 0.419, 0.281)
H6 = (0.110, 0.423, 0.127, 0.340
Table 13.
Risk index weights of prefabricated buildings in EPC mode based on ANP.
4.3. Determination of Evaluation Gray Categories and Whitening Weight Functions
4.3.1. Establishing the Risk Evaluation Sample Matrix
A subgroup of 15 experts from the original panel was invited to participate in a questionnaire survey. Selected for their geographical proximity to and deep familiarity with the case project, these experts assessed the risk level of Project A based on pre-established risk assessment grading criteria. The risk levels were classified into five categories, ranging from “Very Low” to “Very High”, based on three key criteria: risk occurrence probability, severity of loss, and controllability. The risk measurement scale is represented by an interval range of [0, 10], as detailed in Table 11.
Upon collection of the expert ratings, a statistical consistency check was performed using the Coefficient of Variation (CV). The CV, calculated as the ratio of the standard deviation to the mean (CV = Standard Deviation/Mean), quantifies the relative dispersion of the scores for a given risk indicator. A high CV value signifies significant divergence in expert opinions. Any risk indicator with a CV value exceeding the pre-defined threshold of 0.5 across the 15 experts was flagged for review. In such instances, the divergent scores were referred back to the respective experts for re-evaluation, allowing them to confirm or revise their initial judgments based on group feedback. This iterative process continued until all CV values fell below the 0.5 threshold, thereby ensuring a satisfactory level of consensus and data stability for subsequent analysis. Based on the finalized data, a sample matrix for risk assessment of prefabricated construction projects under the EPC model was constructed. For further details, please refer to Table 14.
Table 14.
Risk index evaluation table of prefabricated buildings in EPC mode.
4.3.2. Calculation of Gray Evaluation Coefficient
Taking the second-level indicator R11 as an example, the expert evaluation scores were substituted into the corresponding gray whitening weight functions, and the calculated results are presented in Table 15. The whitening weight functions for each gray category are detailed in Table 11.
Table 15.
Gray evaluation coefficient and weight vector calculation results of index R11.
According to Formula (3), calculated risk indexes R11 corresponding to five gray evaluation coefficients are 5.0000, 6.4286, 8.6000, 10.3333, and 2.0000, respectively.
According to Formula (4), the total gray evaluation coefficient yij = 32.3619 was calculated.
4.3.3. Calculation of Gray Evaluation Weight Matrix
According to Formula (5), the evaluation weights of each gray category are integrated to obtain the gray evaluation weight vector C11 = (0.1545, 0.1986, 0.2657, 0.3193, 0.0618) corresponding to the risk index R11.
Similarly, the gray evaluation weight vector of other risk indicators can be calculated. Finally, the gray evaluation weight matrix C1 corresponding to the first level index R1 is obtained.
Similarly, the gray evaluation weight matrices C2, C3, C4, C5 and C6 corresponding to the first-level indicators R2, R3, R4, R5 and R6 can be calculated using the above calculation method.
4.4. Multi-Level Fuzzy Comprehensive Evaluation
4.4.1. Comprehensive Evaluation of First-Level Indicators
Given the weight vectors H1, H2, H3, H4, H5, H6 of the six first-level indicators and the corresponding gray evaluation weight matrix C1, C2, C3, C4, C5, C6, the gray evaluation weight vectors B1, B2, B3, B4, B5, B6 corresponding to the six first-level indicators can be calculated according to Formulas (6).
B1 = H1 × C1 = (0.160, 0.205, 0.264, 0.300, 0.070)
B2 = H2 × C2 = (0.147, 0.190, 0.239, 0.307, 0.117)
B3 = H3 × C3 = (0.160, 0.199, 0.260, 0.303, 0.077)
B4 = H4 × C4 = (0.164, 0.209, 0.254, 0.277, 0.096)
B5 = H5 × C5 = (0.147, 0.189, 0.253, 0.328, 0.083)
B6 = H6 × C6 = (0.159, 0.198, 0.254, 0.300, 0.089)
Then the gray evaluation weight vector B corresponding to EPC prefabricated construction project risk R is:
4.4.2. Comprehensive Evaluation of Project Risk
Given that the weight vector of risk R of EPC prefabricated construction projects is H and the corresponding gray evaluation weight vector B, the final comprehensive evaluation weight vector A can be calculated according to Formula (7).
A = S × B = (0.157, 0.200, 0.253, 0.298, 0.092)
4.4.3. Calculation of Gray Comprehensive Evaluation Value
The five gray grades are assigned based on the “gray level”, and the gray grade value vector is represented as U, where U = (9, 7, 5, 3, 1). Using Formula (8), the comprehensive risk evaluation value for EPC prefabricated construction projects is computed as follows:
G = A × UT = (0.157, 0.200, 0.253, 0.298, 0.092) × (9, 7, 5, 3, 1) T = 5.062
Following the same approach, the risk evaluation values corresponding to the six primary indicators were calculated as follows:
G1 = B1 × UT = (0.160, 0.205, 0.264, 0.300, 0.070) × (9, 7, 5, 3, 1)T = 5.168
G2 = B2 × UT = (0.147, 0.190, 0.239, 0.307, 0.117) × (9, 7, 5, 3, 1)T = 4.885
G3 = B3 × UT = (0.160, 0.199, 0.260, 0.303, 0.077) × (9, 7, 5, 3, 1)T = 5.124
G4 = B4 × UT = (0.164, 0.209, 0.254, 0.277, 0.096) × (9, 7, 5, 3, 1)T = 5.138
G5 = B5 × UT = (0.147, 0.189, 0.253, 0.328, 0.083) × (9, 7, 5, 3, 1)T = 4.979
G6 = B6 × UT = (0.159, 0.198, 0.254, 0.300, 0.089) × (9, 7, 5, 3, 1)T = 5.077
4.5. Analysis of Evaluation Results and Discussions
According to Table 11, the comprehensive risk evaluation value G of Project A was mapped against the risk evaluation set and standard criteria for EPC-based prefabricated construction projects. The evaluation value was found to be 5.072, placing Project A in the “Moderate” risk level. The comprehensive evaluation value G = 5.072 is a precise and continuous scalar output derived from the synthesis of ANP weights and gray clustering calculations. This value unambiguously falls within the pre-defined “medium risk” interval. The assigned risk level is an objective outcome resulting from the sensitive model’s precise computation and clear discrimination of the project’s risk characteristic data. It reflects the project’s authentic state, where the overall risk profile is neither at the safe extreme nor at the critical danger extreme.
To determine the risk severity of primary indicators, the corresponding risk evaluation values (G1, G2, G3, G4, G5, and G6) were ranked from highest to lowest. The ranking results indicate that the risk levels of the primary indicators are as follows, in descending order: Design Risk, Management Risk, Construction Risk, Other Risks, Economic Risk, and Procurement Risk. The results revealed that management and design risks received the highest weights in the overall risk assessment. The results reveal that management and design risks carry the highest weights in the overall risk assessment, a finding that aligns strongly with the outcomes of several recent studies [10,11,12]. Together, these sources consistently highlight that in the complex context of prefabricated EPC projects—regardless of regional or project-specific variations—robust management capability and front-end design quality remain critical for effective risk control.
5. Conclusions
5.1. Research Contribution
This study systematically identified and evaluated the risks associated with EPC-based prefabricated construction projects through an integrated approach combining literature analysis and case studies. By incorporating the Analytic Network Process (ANP) and Gray Clustering Analysis, a comprehensive risk evaluation model was developed to determine indicator weights and assess project risk levels more objectively. The results indicate that design risk and management risk exert the greatest influence on overall project performance, underscoring the need for enhanced coordination and control during these critical stages. The case analysis of Project A demonstrates that the project falls within a moderate risk level, suggesting that the current risk management framework remains effective and well-balanced. Furthermore, the proposed ANP–Gray Clustering model and the lifecycle-based risk evaluation index system were proven to be scientifically robust and practically applicable. Beyond improving the accuracy of EPC project risk assessment, the model contributes to promoting construction management by supporting resource-efficient planning, reducing potential waste, and enhancing the resilience of prefabricated building systems. These findings provide valuable guidance for general contractors in Southwest China and serve as a reference for risk management in other construction contexts. The contribution of this study lies in its advancement beyond qualitative identification. It employs network analysis to uncover the complex dependencies and feedback relationships among these risk factors—for instance, how design changes directly impact procurement and construction costs. Furthermore, it utilizes gray clustering to establish a complete quantitative pathway from risk identification to level assessment. Consequently, the primary theoretical contribution of this research is the proposal of an integrated methodological framework that systematically captures the inherent complexity of prefabricated building EPC projects while effectively addressing uncertainties in the evaluation process.
5.2. Research Limitations
This study has several limitations that also point to productive avenues for future research.
- While this study provides a validated risk assessment model for prefabricated EPC projects, it is important to acknowledge that the specific risk priorities and absolute indicator weights derived from it are shaped by the regional context of the case study—including local construction practices, regulatory environments, and market conditions in Southwest China. Therefore, the direct extrapolation of numerical results to other regions is not recommended without appropriate localization.
- The primary contribution of this research lies not in these context-specific numerical outcomes, but in the development of the methodological framework itself. The core value of the model resides in its transferable structure and process, which can be adapted to context-specific risk assessments—for example, by recalibrating the ANP pairwise comparisons using local expert data—before being applied effectively in new settings.
- Its main objective is to develop and preliminarily validate an integrated ANP–Gray Clustering risk assessment model. Due to scope and length constraints, the paper does not extend into specific risk mitigation strategies or detailed decision-support scenarios based on the evaluation results.
- The regional focus of the case study may restrict the direct generalizability of the quantitative findings. The validation relies primarily on a single case (Project A), which limits the broader applicability of the findings.
- The ANP model depends on subjective expert judgments, meaning the resulting weights are influenced by the composition of the expert panel. Although the use of SuperDecisions software ensured internal consistency, the model remains sensitive to the initial inputs, and a formal sensitivity analysis was beyond the scope of this study.
5.3. Research Prospects
Future research is encouraged to pursue the following directions:
- Use the risk priorities identified by this model as a basis for developing targeted risk response measures. Construct detailed decision-support scenario libraries for different project types—such as public buildings and residential complexes—to simulate how the model’s outputs can support optimal decision-making under constraints like budget limitations and tight schedules.
- Apply and test the model in other countries or regions with mature prefabrication industries to verify its robustness. Cross-validation across projects of varying types, scales, and geographical locations (e.g., comparing large-scale public works with residential projects, or coastal versus inland cases) would help distinguish universal risk factors from context-dependent ones.
- Implement sensitivity analysis techniques, such as systematically varying key weights to observe changes in risk priorities, to identify the most influential criteria and verify the stability of the assessment results.
- Integrate the model into live project management information systems. By incorporating dynamic, real-time data—such as schedule deviations, cost overrun rates, and quality inspection reports—as direct inputs, the framework could enable online risk monitoring and early warning, significantly enhancing its practical utility for operational decision-support.
- Carry out longitudinal research that tracks multiple projects from decision-making through delivery to analyze the dynamic evolution of risk factors over the project lifecycle.
- Enhance the model by incorporating real-time project performance data (e.g., schedule and cost deviation rates) to develop data-driven risk early-warning systems, or integrate Bayesian networks to combine objective data with expert judgment, thereby reducing reliance on purely subjective inputs.
5.4. Research Implications
Based on the most critical risk categories identified by the model, we propose the following specific implications for different stakeholders:
For EPC General Contractors:
- Front-load resources and focus on design and management interfaces: Given the exceptionally high weights of “design risk” and “management risk”, contractors should prioritize allocating their best human and technical resources to the project’s front-end phase.
- Establish a cross-functional integrated task force to bring together design, procurement, production, and construction teams early in the process.
- Invest in a BIM-based collaborative management platform to mitigate interface errors and design change risks at the source.
- Incorporate medium-high and high-risk indicators, identified through gray clustering, into mandatory checklists at key project decision points, and develop specific contingency plans to achieve differentiated and refined focused control.
For Project Owners:
- Explicitly encourage or require general contractors to adopt such systematic risk assessment tools in tendering and contracts.
- Incorporate this requirement as one of the evaluation criteria for assessing contractors’ risk management capabilities, thereby selecting partners with stronger risk control competencies.
For Policy Makers:
- Leverage the risk indicator system from this study to develop or refine standard contract templates and risk management guidelines specifically for prefabricated building EPC projects.
- Guide the industry toward establishing standardized risk control processes.
Author Contributions
Conceptualization, C.S.; methodology, C.S.; software, C.S.; validation, S.A.S.Z. and C.S.; formal analysis, C.S.; investigation, C.S.; resources, C.S.; data curation, C.S.; writing—original draft preparation, C.S.; writing—review and editing, C.S.; visualization, C.S.; supervision, S.A.S.Z. and C.S. All authors have read and agreed to the published version of the manuscript.
Funding
This research received no external funding.
Data Availability Statement
The data presented in the study are included in the article; further inquiries can be directed to the corresponding author.
Conflicts of Interest
The authors declare no conflicts of interest.
References
- Chai, S.; Liu, M.; Zhang, Z.; Li, S. Study on Risk Identification and Key Risks of Prefabricated Building Supply Chain Based on Grounded Theory. E3S Web Conf. 2021, 275, 03076. [Google Scholar] [CrossRef]
- Pervez, H.; Ali, Y.; Pamucar, D.; Garai-Fodor, M.; Csiszárik-Kocsir, Á. Evaluation of critical risk factors in the implementation of modular construction. PLoS ONE 2022, 17, e0272448. [Google Scholar] [CrossRef] [PubMed]
- Shen, Y.; Xu, M.; Lin, Y.; Cui, C.; Shi, X.; Liu, Y. Safety Risk Management of Prefabricated Building Construction Based on Ontology Technology in the BIM Environment. Buildings 2022, 12, 765. [Google Scholar] [CrossRef]
- Wuni, I.Y.; Shen, G.Q.; Saka, A.B. Computing the severities of critical onsite assembly risk factors for modular integrated construction projects. Eng. Constr. Archit. Manag. 2023, 30, 1864–1882. [Google Scholar] [CrossRef]
- Li, A.; Jing, L. Research Hotspot Analysis of EPC Pattern Based on CiteSpace in China. E3S Web Conf. 2021, 253, 02046. [Google Scholar] [CrossRef]
- Wu, Y. Summary of Research on Contract Risk Management of EPC General Contracting Project—Based on VOSviewer Knowledge Graph Analysis. In Proceedings of the 25th International Symposium on Advancement of Construction Management and Real Estate, Wuhan, China, 28–29 November 2020; Springer: Singapore, 2021. [Google Scholar]
- Wang, T.; Wang, Y.; Shen, W.; Tang, W. Risk management of international EPCprojects through partnering. J. Tsinghua Univ. 2022, 62, 242–249. [Google Scholar]
- Fan, C.; Binchao, D.; Yin, Y. Hierarchical structure and transfer mechanism to assess the scheduling-related risk in construction of prefabricated buildings: An integrated ISM–MICMAC approach. Eng. Constr. Archit. Manag. 2023, 30, 2991–3013. [Google Scholar] [CrossRef]
- Cao, P.; Lei, X. Evaluating Risk in Prefabricated Building Construction under EPC Contracting Using Structural Equation Modeling: A Case Study of Shaanxi Province, China. Buildings 2023, 13, 1465. [Google Scholar] [CrossRef]
- Xia, M.; Zhao, L.; Zhao, L. A Comprehensive Risk-Assessment Method for Prefabricated Buildings Using EPC: A Case Study from China. Sustainability 2022, 14, 1910. [Google Scholar] [CrossRef]
- Li, E. Research on Communication and Coordination Mechanisms in Project Management. Eng. Technol. Innov. 2025, 1. (In Chinese) [Google Scholar]
- Yang, Y.; Wang, Z. Research on Cost Influencing Factors in the Design Phase of Prefabricated Buildings Based on Fuzzy DEMATEL-ISM. J. Eng. Manag. Gongcheng Guanli Xuebao 2023, 37. (In Chinese) [Google Scholar]
- Almquist, Y.B.; Kvart, S.; Brännström, L. A Practical Guide to Quantitative Methods with SPSS; Stockholm University: Stockholm, Sweden, 2020. [Google Scholar]
- Saaty, T.L. Decision Making with Dependence and Feedback: The Analytic Network Process; RWS Publications: Pittsburgh, PA, USA, 1996. [Google Scholar]
- Deng, J. Control problems of grey systems. Syst. Control. Lett. 1982, 1, 288–294. [Google Scholar] [CrossRef]
- Wang, J.; You, V.; You Liu, F.; Zhang, W.; Yang, D. Risk assessment of urban rail transit PPP project based on improved entropy weight and grey fuzzy theory. Tunn. Constr. 2018, 38, 732–739. (In Chinese) [Google Scholar]
- Zhao, X.; Chen, L.; Pan, W.; Lu, Q. AHP-ANP–fuzzy integral integrated network for evaluating performance of innovative business models for sustainable building. J. Constr. Eng. 2017, 143, 04017054. [Google Scholar] [CrossRef]
- Saaty, T.L. Decision making with the analytic hierarchy process. Int. J. Serv. Sci. 2008, 1, 83–98. [Google Scholar] [CrossRef]
- Fei, L. D-ANP: A multiple criteria decision making method for supplier selection. Appl. Intell. 2020, 50, 2537–2554. [Google Scholar] [CrossRef]
- Orrin, C.; Guoqing, L. Linking Disjoint Supermatrices and Criteria Clusters. J. Multi-Criteria Decis. Anal. 2016, 23, 139–159. [Google Scholar] [CrossRef]
- ANSI/PMI 99-001-2008; A Guide to the Project Management Body of Knowledge. Project Management Institute, Inc.: Newtown Square, PA, USA, 2008.
- Liu, S.; Yang, Y.; Xie, N.; Forrest, J. New progress of grey system theory in the new millennium. Grey Syst. Theory Appl. 2016, 6, 2–31. [Google Scholar] [CrossRef]
- Javanmardi, E.; Liu, S. Exploring grey systems theory-based methods and applications in analyzing socio-economic systems. Sustainability 2019, 11, 4192. [Google Scholar] [CrossRef]
- Zhou, Z.; Li, S.; Li, L.; Shi, S.; Xu, Z. An optimal classification method for risk assessment of water inrush in karst tunnels based on grey system theory. Geomech. Eng. 2015, 8, 631–647. [Google Scholar] [CrossRef]
- Feng, Y.; Zhu, W.; Hong, L.; Li, Y.; Tang, S. Application of fuzzy clustering based on improved whitening weight function in vocational education evaluation. In Proceedings of the 2023 4th International Conference on Computer Science and Management Technology, Xi’an, China, 13–15 October 2023. [Google Scholar]
- Nowak, M.; Mierzwiak, R.; Butlewski, M. Occupational risk assessment with grey system theory. Cent. Eur. J. Oper. Res. 2020, 28, 717–732. [Google Scholar] [CrossRef]

Disclaimer/Publisher’s Note: The statements, opinions and data contained in all publications are solely those of the individual author(s) and contributor(s) and not of MDPI and/or the editor(s). MDPI and/or the editor(s) disclaim responsibility for any injury to people or property resulting from any ideas, methods, instructions or products referred to in the content. |
© 2025 by the authors. Licensee MDPI, Basel, Switzerland. This article is an open access article distributed under the terms and conditions of the Creative Commons Attribution (CC BY) license (https://creativecommons.org/licenses/by/4.0/).