


Abstract
Quasi in situ observations of the early stage of secondary recrystallization in Fe-3.25 wt.% Si high-permeability grain-oriented silicon steel indicate that large matrix grains locally impede the migration of secondary recrystallized grain boundaries. A critical grain-size criterion for identifying potential pinning grains is proposed, and a kinetic model incorporating the matrix grain-size distribution is developed. For the abnormal grain tracked at 1000 °C, the measured grain-size increment over 100 s was approximately 60 μm; the proposed pinning model predicted 47 μm, whereas the weighted-average model predicted 171 μm. Model calculations further suggest that matrix grain-size dispersion, pinning force, grain size, and relative grain-boundary energy jointly affect the early-stage growth of Goss grains. These results provide a framework for interpreting early secondary-recrystallization kinetics, while broader experimental validation is still required before the predicted parameter combinations can be used for process control.
1. Introduction
Grain-oriented silicon steel is the main material used to manufacture power transformer cores and plays an extremely important role in the efficiency, energy saving, and safety of power transmission and distribution systems. The production process of grain-oriented silicon steel is complex and has a narrow processing window; it is therefore regarded as an “artwork” among steel products. The core of this process is the formation of a single Goss ({110}<001>) texture through secondary recrystallization. The degree of completion of secondary recrystallization and the orientation deviation angle of the Goss texture are key indicators determining the performance of grain-oriented silicon steel products. The secondary recrystallization process of grain-oriented silicon steel not only exhibits the characteristics of conventional abnormal grain growth, but also has a strong orientation-selective function, making it a typical material for studying orientation-dependent secondary recrystallization behavior.
The mechanism of secondary recrystallization of Goss grains in grain-oriented silicon steel has mainly been analyzed from the perspectives of grain size and grain boundaries. Rios [1,2] proposed that abnormal growth can occur only when grain size acts together with grain boundary mobility or local pinning-force factors. The main theories of abnormal-growth grain boundaries include the coincidence site lattice (CSL) grain boundary model and the high-energy grain boundary model. Shimizu and Harase [3] found a high frequency of CSL grain boundaries around Goss grains. Because ordinary grain boundaries are more strongly pinned by inhibitors than CSL grain boundaries, CSL grain boundaries exhibit higher mobility. Yoshitomi et al. [4] indicated that Goss grains acquire a high growth rate at high temperature owing to the migration advantage of Σ9 grain boundaries. Kumano et al. [5,6] investigated the role of CSL grain boundaries in CGO and Hi-B steels and found that Σ5 grain boundaries play an important role in CGO steel with a lower secondary recrystallization temperature, whereas Σ9 grain boundaries play the major role in Hi-B steel with a higher secondary recrystallization temperature.
Gubernatorov et al. [7] related grain boundary mobility to relative grain boundary energy, showing that a disordered grain boundary structure increases the grain boundary energy of high-angle grain boundaries. Based on the above theory, Hayakawa et al. [8] proposed the high-energy grain boundary model. The grain boundaries between Goss grains and matrix grains have a high fraction of 20–45° misorientations, which is the main factor responsible for the preferential secondary recrystallization of Goss grains. Rajmohan et al. [9], combining simulation calculations and experimental statistics, proposed that secondary recrystallization of Goss grains requires more than 30% of the grain boundaries to have high mobility. High-energy grain boundaries satisfy this condition, whereas Σ5 and Σ9 grain boundaries account for only 1–2%. No unified view has yet been reached regarding grain boundary models for secondary recrystallization [10,11]. In fact, at relatively high secondary recrystallization temperatures, the boundary between Goss grains and the main matrix texture component {111}<112> is a near-Σ9 grain boundary, which has characteristics of both CSL and high-energy grain boundaries.
Ushigami et al. [12,13] incorporated grain size, grain-boundary character, and pinning-force factors into a grain-growth kinetic model to describe secondary recrystallization under the influence of multiple factors. Experiments and simulations of early abnormal growth have shown that nonuniform grain-boundary mobility [14] and selective dissolution of second-phase particles associated with differences in grain-boundary energy [15] can produce grain-boundary bulging. Phase-field simulations have further emphasized the coupled roles of precipitate pinning, grain-boundary energy anisotropy, and matrix microstructure evolution during abnormal grain growth [16]. Crystal-plasticity-based analysis has addressed the formation of Goss-oriented regions during prior deformation and shear banding [17]. These approaches resolve spatial evolution or deformation-induced orientation development, but they do not directly quantify how the statistical population of large matrix grains obstructs an already growing Goss grain during the early stage of secondary recrystallization. Etter et al. [18] reported, based on experimental statistics, that anisotropic Goss-grain growth is more likely to result from obstruction by large matrix grains than solely from differences in grain-boundary mobility. Abbruzzese et al. [19] considered the primary-recrystallized grain-size distribution using a weighted-average statistical model, which is more suitable when sensitivity to individual local obstacles decreases during the middle and later stages. However, weighted averaging suppresses the dispersion of the primary-recrystallized grain-size distribution and therefore cannot explicitly represent the local obstruction produced by its large-grain tail.
The unresolved issue addressed here is therefore how the dispersion of the primary-recrystallized grain-size distribution, particularly its large-grain tail, modifies the local growth rate and critical growth condition at the early stage of secondary recrystallization. In this work, Fe-3.25 wt.% Si high-permeability grain-oriented silicon steel was used to examine the interaction between abnormally growing grains and large matrix grains. A kinetic model incorporating the grain-size distribution was constructed and compared with a weighted-average model. The analysis is intended to describe early-stage behavior under the investigated material and annealing condition, rather than to establish a universally validated process-control law.
2. Materials and Methods
Industrial Fe-3.25 wt.% Si high-permeability grain-oriented silicon steel was used, and its chemical composition is listed in Table 1. The specimens were heated from 850 to 1000 °C at 15 °C/h under a protective atmosphere with an H2:N2 volume ratio of 3:1. After each annealing step, the specimens were cooled to room temperature under the same protective atmosphere before EBSD characterization. Before the first EBSD measurement, the specimens were ground and mechanically polished, followed by chemical polishing in a solution containing 2.5 mL HF, 50 mL H2O2, and 1 g oxalic acid. For subsequent interrupted annealing steps, the specimens were returned to the furnace at 1000 °C for 100 s, cooled under the protective atmosphere, cleaned only with anhydrous ethanol, and dried; no further mechanical or chemical polishing was performed. Two observation protocols were used. Microstructures at the specified annealing stages were characterized using separate representative fields and therefore do not constitute continuous tracking of an individual grain. In contrast, the quasi-in-situ experiment relocated the same abnormal grain and its surrounding microstructure before and after an additional 100 s hold at 1000 °C. EBSD measurements were performed using a JSM-7001F (JEOL Ltd., Tokyo, Japan) field-emission scanning electron microscope at an accelerating voltage of 20 kV, a working distance of 15 mm, and a step size of 1.5 μm. Multiple mutually independent regions at different specimen positions were scanned, and more than 3000 grains were analyzed for the matrix grain-size distribution. EBSD data were processed using HKL Channel 5 software (Version 5.12). A minimum misorientation of 5° was used for grain reconstruction; boundaries with misorientations of 5–15° were classified as low-angle grain boundaries and those with misorientations ≥15° as high-angle grain boundaries. Grain size was expressed as the two-dimensional equivalent circle diameter (ECD), and texture components were defined using a tolerance of 15° from the corresponding ideal orientations. For the quasi in situ comparison, the same physical region was relocated using macroscopic specimen coordinates. The retained records do not specify the individual map areas, the exact number of fields, or a physical fiducial-marker procedure. Because the interrupted sequence necessarily included cooling, specimen transfer, reheating, and coordinate-based relocation, these observations are interpreted as quasi in situ rather than uninterrupted in situ measurements.
Table 1.
Chemical composition of the experimental grain-oriented silicon steel (mass fraction).
3. Microstructural Characteristics at the Early Stage of Secondary Recrystallization
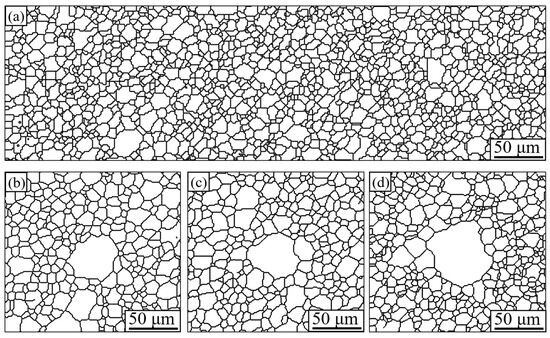
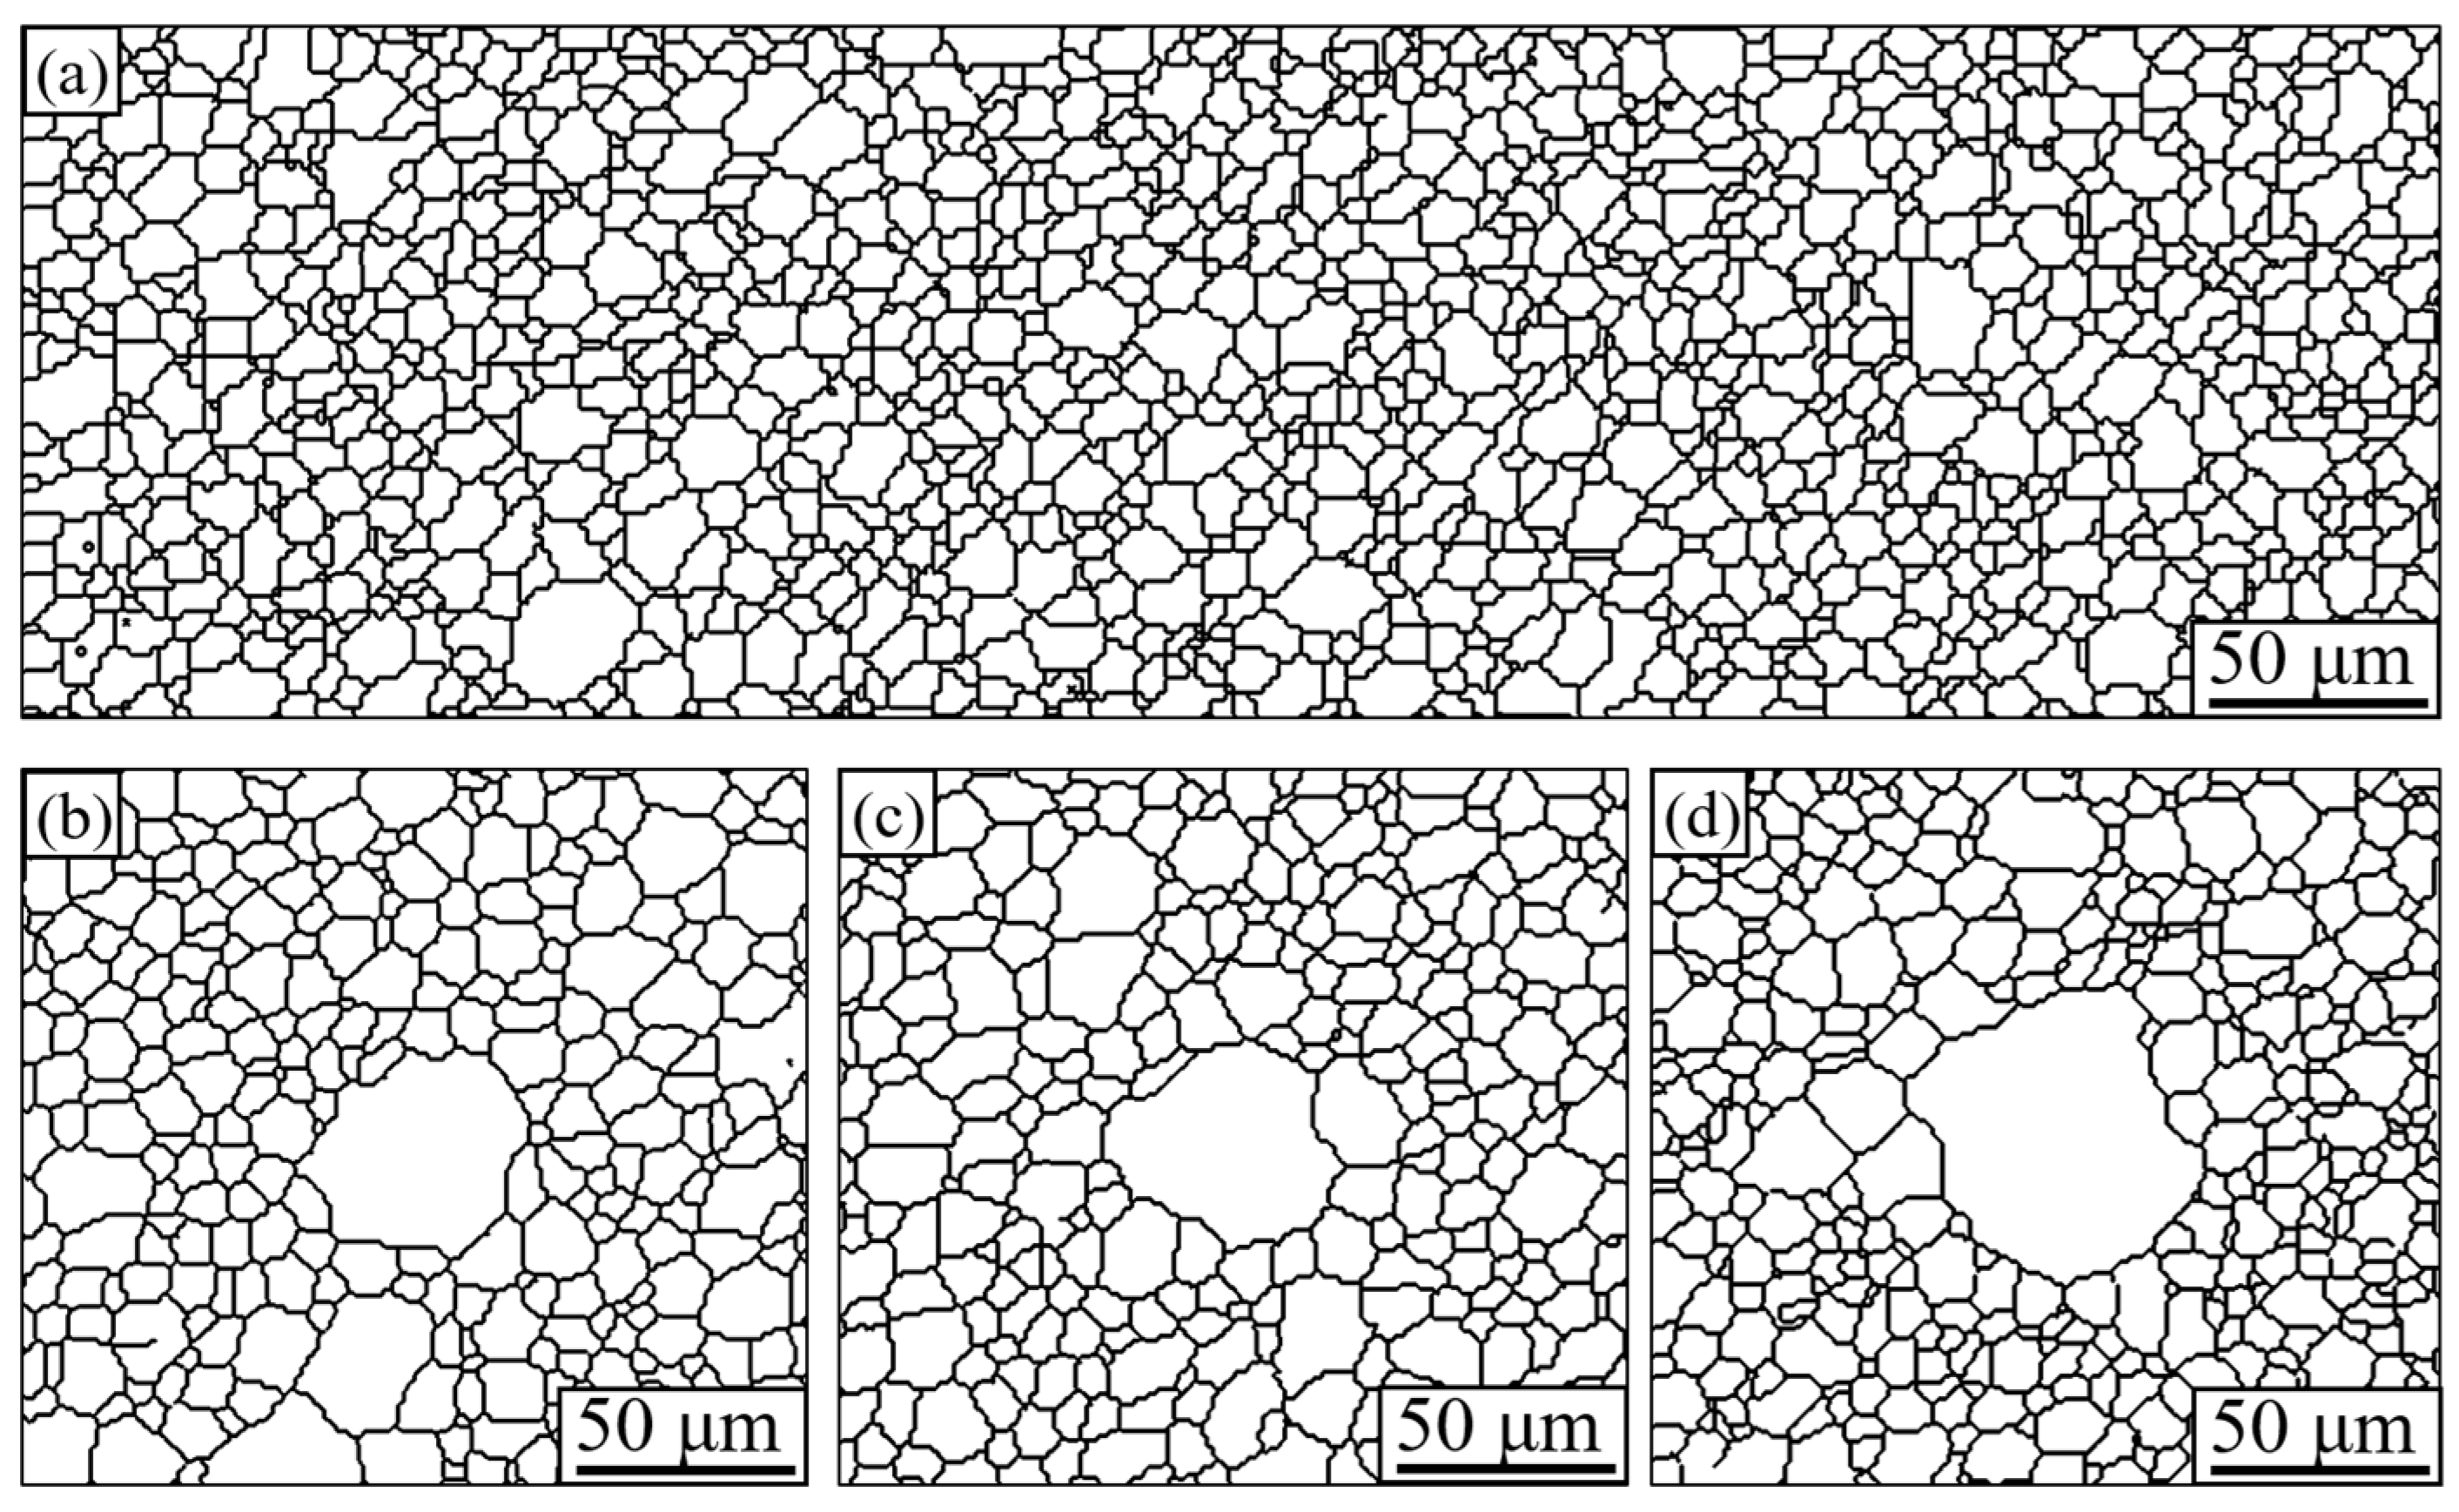
Figure 1 shows the microstructures before the occurrence and during the nucleation stage of secondary recrystallization. It can be seen that before secondary recrystallization, the matrix was in a relatively uniform distribution state. The average grain size Dc was 12 μm, the standard deviation c was 5 μm, and the maximum grain size Dmax was approximately 30 μm. After further slow heating to the starting temperature of secondary recrystallization (TSR = 1000 °C) and holding for 100 s, individual grains began to grow abnormally, reaching sizes greater than 50 μm.
Figure 1.
TD-RD grain-boundary maps during slow heating to 1000 °C: (a) before the onset of secondary recrystallization; (b–d) representative fields after holding at 1000 °C for 100 s. Black lines delineate grain boundaries and all scale bars are 50 μm. The panels illustrate general microstructural evolution and are not continuous observations of the same field.
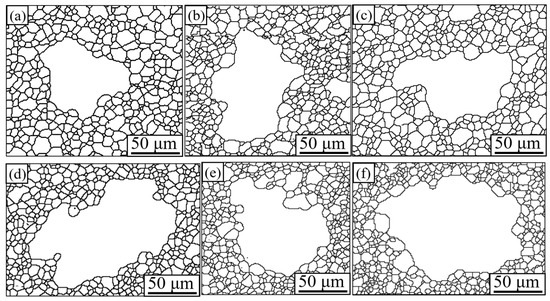
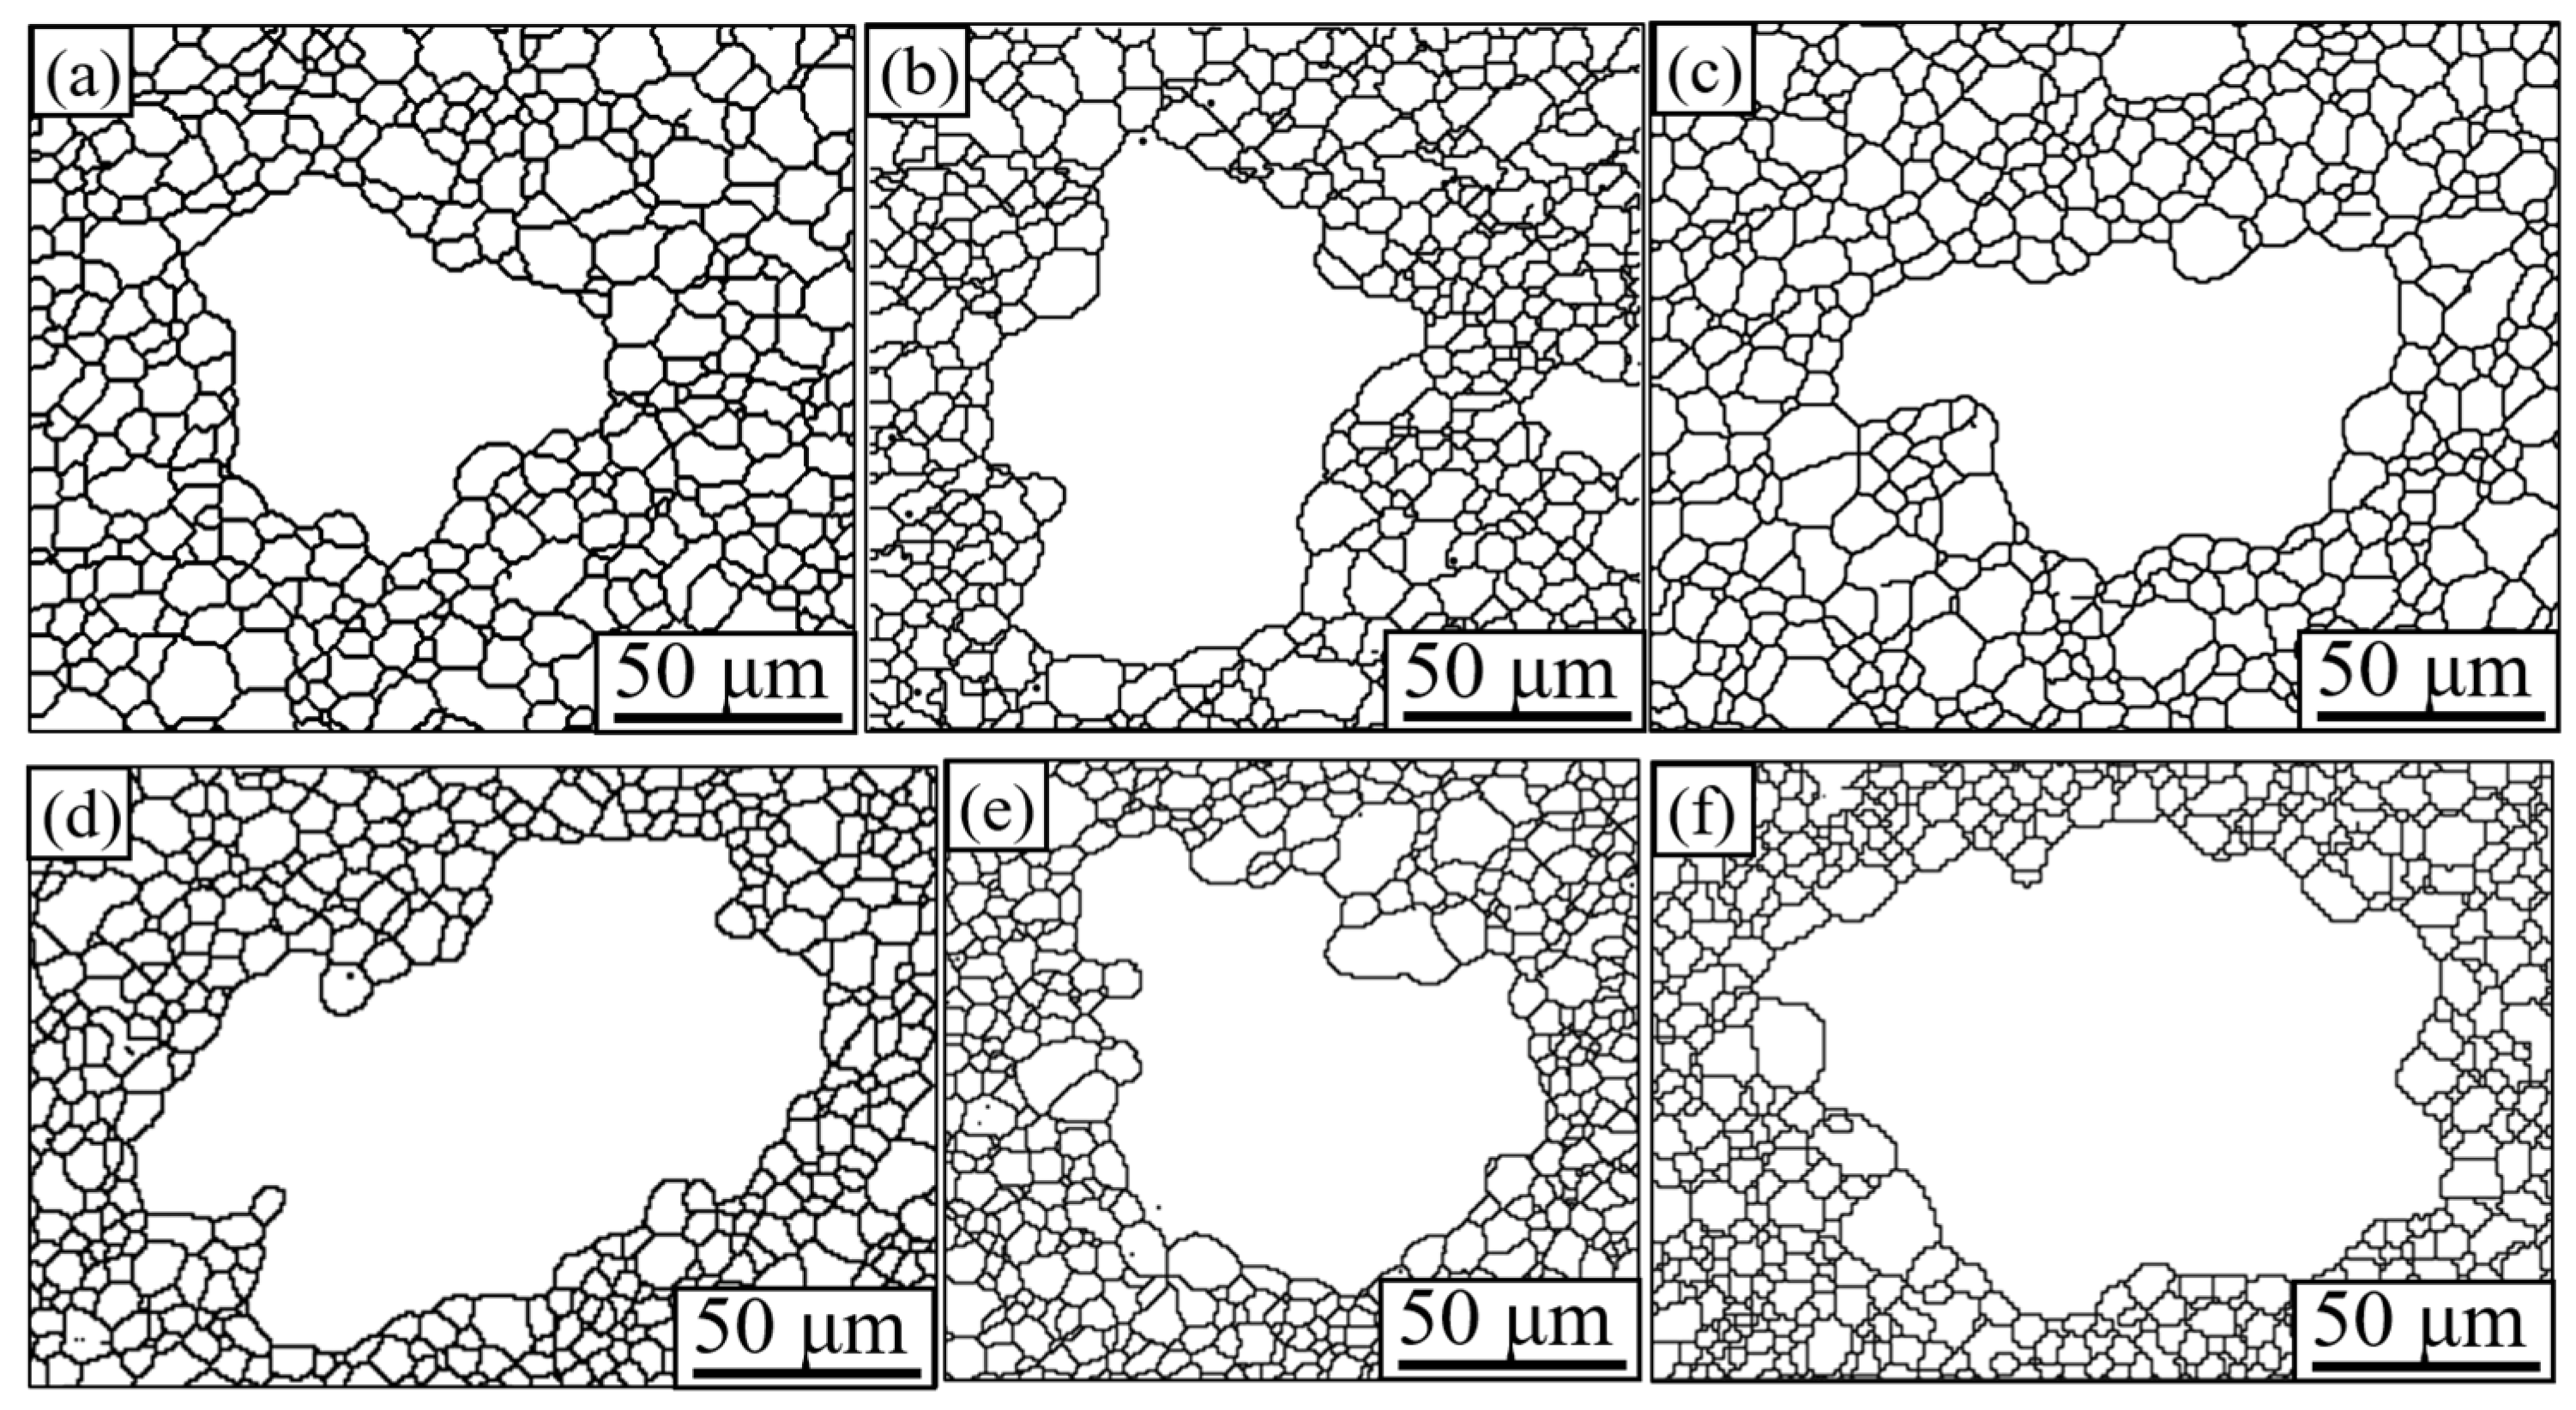
Figure 2 shows the microstructures after the holding time at 1000 °C was extended to 200 s and 300 s. The average sizes of the secondary recrystallized grains increased to approximately 100 μm and 200 μm, respectively, and the grains exhibited anisotropic morphologies, indicating certain differences in growth rates along different directions. In Figure 2, the secondary recrystallized grains are in contact with matrix grains of different sizes. Small matrix grains can be rapidly engulfed, whereas large matrix grains can be engulfed only slowly or even with difficulty. This indicates that large matrix grains effectively pin the secondary recrystallization process, causing local grain boundary bulging into peninsula-like shapes and affecting the abnormal growth rate and even whether the process can continue. The matrix grain size distribution is therefore a key factor, especially at the early stage of secondary recrystallization.
Figure 2.
Representative TD-RD grain-boundary maps during secondary recrystallization at 1000 °C after holding for (a–c) 200 s and (d–f) 300 s. Black lines delineate grain boundaries and all scale bars are 50 μm. Large matrix grains locally obstruct the migrating boundaries of secondary recrystallized grains.
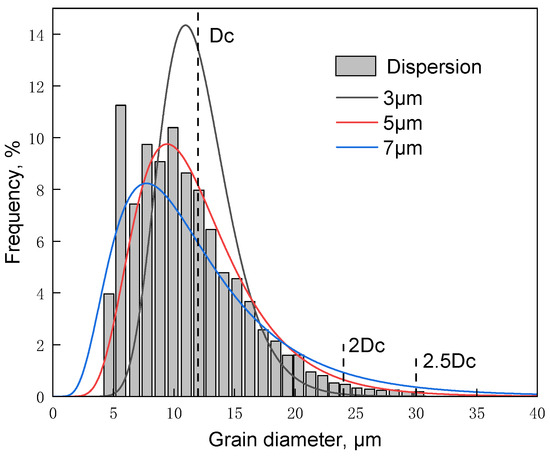
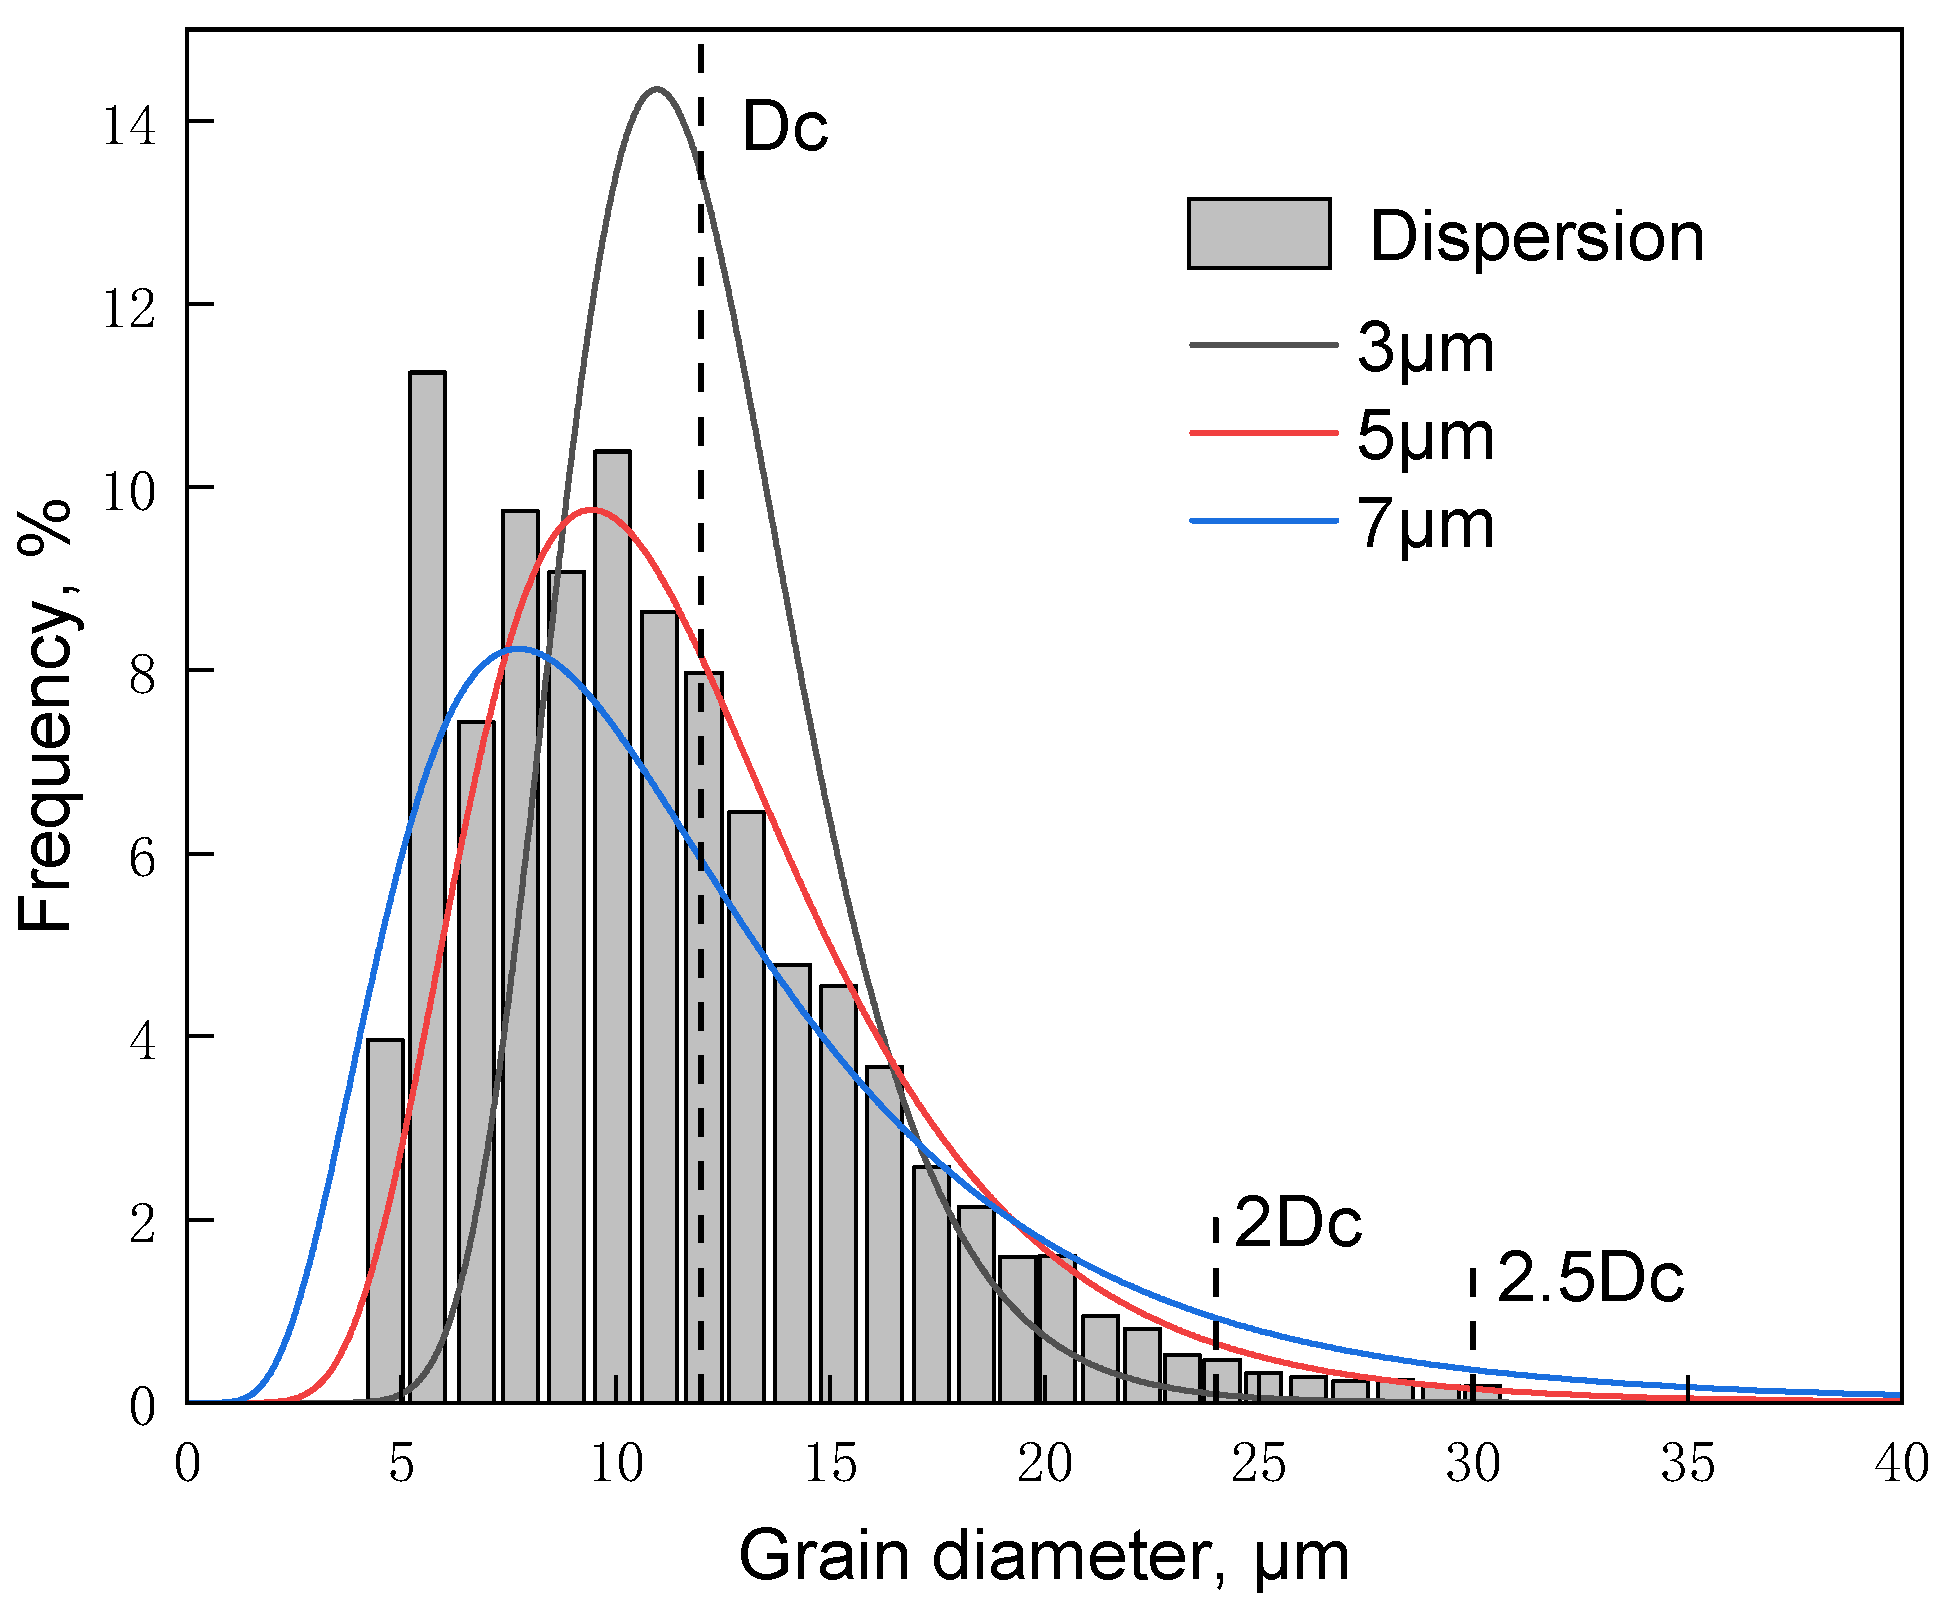
The histogram in Figure 3 shows the measured matrix grain-size distribution before secondary recrystallization. Here, Dc denotes the mean two-dimensional equivalent circle diameter, Rc = Dc/2 is the corresponding mean radius used in the analytical equations, and c denotes the standard deviation of the diameter distribution. A lognormal representation was adopted because grain size is positive and the measured distribution is right-skewed. With Dc = 12 μm and c = 5 μm, the corresponding curve reproduces the approximate peak position and frequency of the measured histogram. The same functional form was then used for parametric distributions with c = 3 and 7 μm. Increasing c increases the calculated fractions in both the large- and small-grain tails. This use of the lognormal function is a conditional parametric representation, not a statistical selection against Weibull or gamma alternatives. Those alternatives may change the calculated tail fraction and hence the predicted number of pinning grains. The experimental-method record specifies that the histogram combined more than 3000 grains from multiple independent regions, but the original grain-level dataset, individual map areas, exact field count, and uncertainty estimates for Dc and c are not available. Consequently, confidence intervals and a statistically discriminating comparison among distribution families cannot be reconstructed.
Figure 3.
Matrix grain-size histogram measured before secondary recrystallization from more than 3000 grains in multiple independent regions, with lognormal distributions calculated for Dc = 12 μm and c = 3, 5, and 7 μm. The c = 5 μm curve represents the measured distribution; c = 3 and 7 μm are parametric sensitivity cases. Grain-level uncertainty and confidence-interval data are unavailable.
4. Grain-Pinning Mechanism and Kinetic Modeling of Secondary Recrystallization
4.1. Interaction Between Abnormally Growing Grains and Pinning Grains
During grain-boundary migration, second-phase particles can pin the boundary, and the boundary segment between adjacent particles develops a bulged morphology with a corresponding decrease in its local radius of curvature [20,21]. As a result, the migration rate decreases and migration may eventually cease. Only after the pinning particles coarsen or dissolve can this restriction be removed and the local radius of curvature recover. By analogy, large matrix grains can exert a local pinning effect at the front of an abnormally growing grain, with boundary bulging occurring between adjacent potential pinning grains.
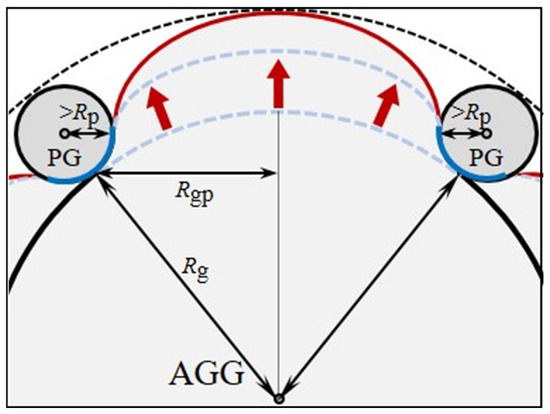
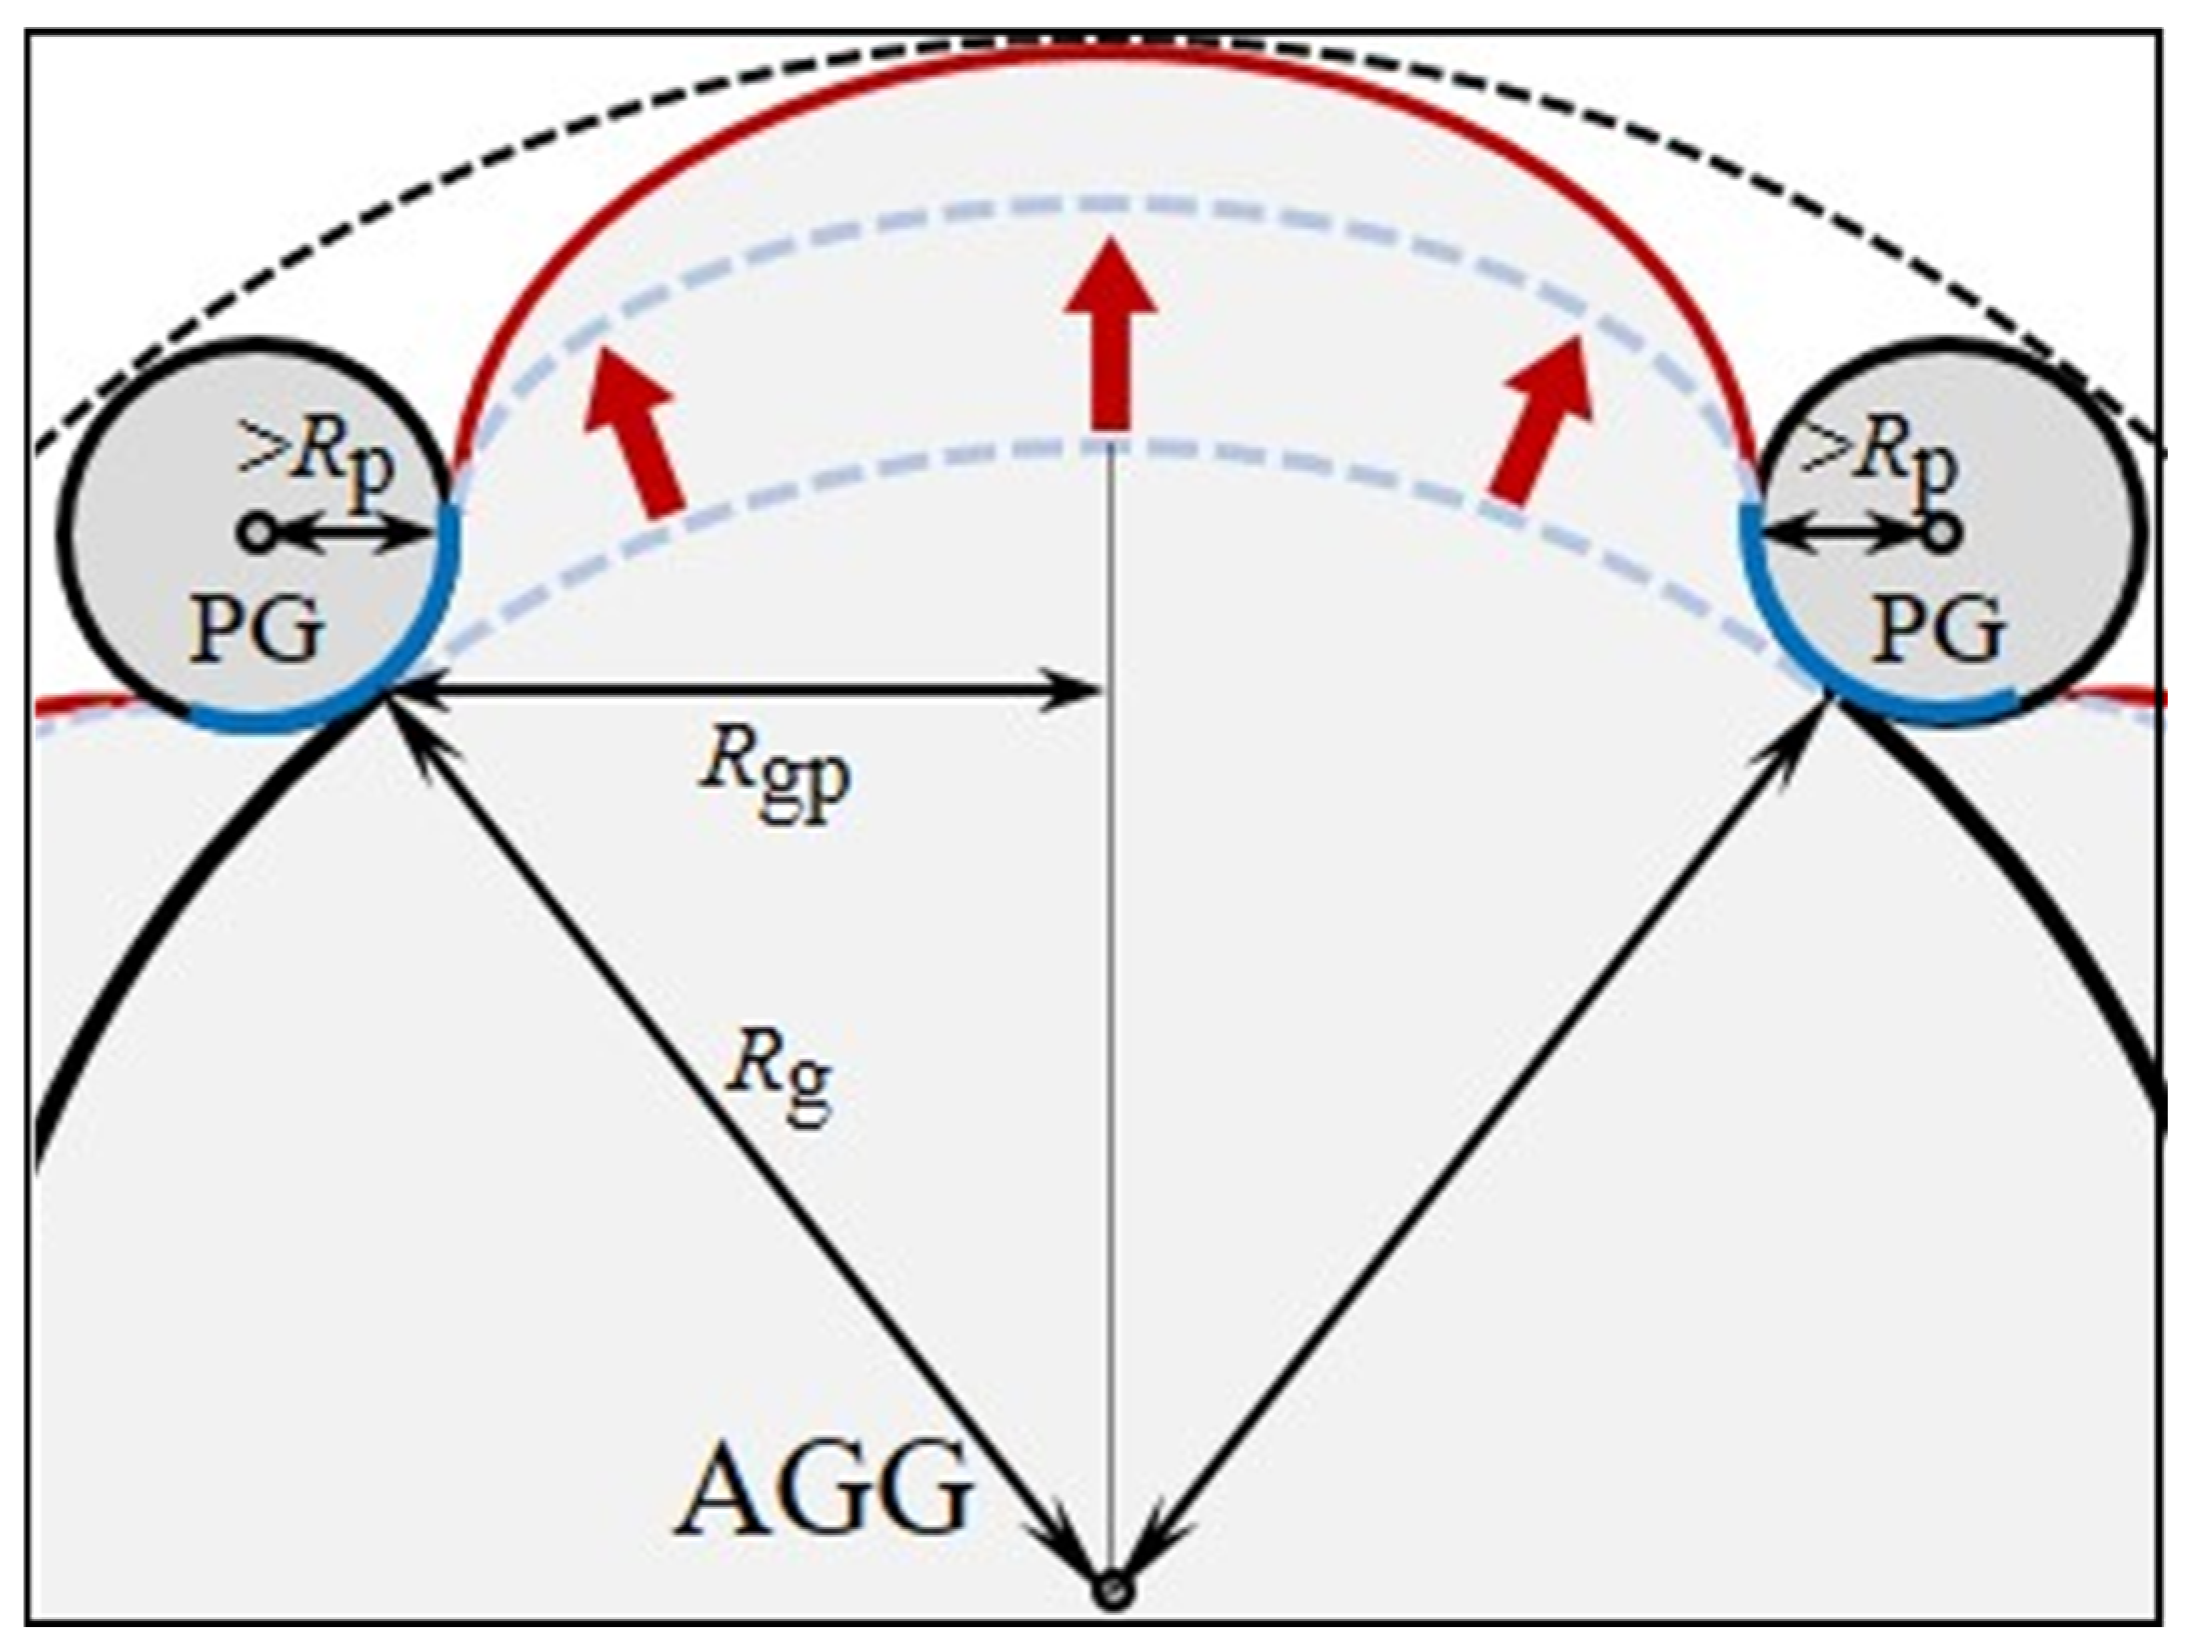
The grain-pinning effect can be characterized by the schematic diagram in Figure 4. The equivalent radius of the abnormally growing grain (AGG) is Rg, and the equivalent radius of the pinning grain (PG) must be greater than the critical value (Rp). During grain boundary bulging, the local radius of curvature gradually decreases from Rg. If the number of pinning grains increases, the abnormal growth process may even tend to stop. After the radius of curvature of the bulged grain boundary decreases to the minimum value (Rgp), further bulging causes the radius of curvature to increase.
Figure 4.
Schematic diagram of grain-boundary migration under the grain-pinning effect. The black dashed curve represents the reference boundary in the absence of local pinning; the light-blue dashed curves indicate intermediate boundary positions during bulging; the red curve represents the locally bulged boundary; and the blue segments indicate the boundary regions interacting with the pinning grains.
During local grain boundary bulging under the influence of grain pinning, the abnormally growing grain simultaneously engulfs pinning grains. The competition between these two processes determines whether the matrix grain exerts a pinning effect. Rajmohan et al. [22] proposed a geometric relationship describing grain boundary morphology: if the ratio of the grain boundary bulge height (Grain Bulge Height, GBH) on both sides of the matrix grain to the grain chord length (Grain Chord Length, GCL) of the grain boundary segment inside the matrix grain during engulfment is >0.5, the matrix grain is considered to hinder the abnormal growth process.
Although the grain boundaries on both sides of a pinning grain move forward by bulging, overcoming the pinning grain usually still relies on completion of the engulfment process. Thereafter, the grain boundary region that performs engulfment gradually catches up with the bulged grain boundary region. If an individual engulfment process cannot proceed or proceeds at an excessively low rate, the bulged grain boundaries on both sides can contact and merge, thereby bypassing the pinning grain, which then becomes an island grain inside the abnormally growing grain.
4.2. Kinetic Model of Secondary Recrystallization Considering Grain Pinning
Ushigami et al. proposed a secondary recrystallization kinetics model incorporating the effect of grain pinning, as shown in Equation (1).
where Rc is the mean matrix-grain radius corresponding to the measured mean diameter Dc; Rg is the equivalent radius of the abnormally growing grain; m is the grain-boundary mobility; γ is the average matrix grain-boundary energy; α is a geometric factor; Z is the Zener factor characterizing the pinning-force level; and e is the relative grain-boundary energy coefficient, defined as the ratio of the boundary energy of the abnormally growing grain to the average matrix grain-boundary energy. Thus, e represents the effect of the orientation relationship between the abnormally growing grain and the matrix grains. The dimensionless combinations kg = Rg/Rc and kZ = ZRc are used consistently below. To distinguish among the measured, defined, calculated, and unavailable quantities, the model inputs and their status are summarized in Table 2.
Table 2.
Model inputs explicitly specified in the retained analysis and the status of unavailable quantities.
As indicated in Table 2, the separate numerical values of α, m, γ and the effective Z used in the original absolute-rate calculation were not retained and were therefore not reconstructed. The dimensionless kZ range was used only for the subsequent sensitivity analysis and should not be interpreted as an experimentally calibrated material parameter. The engulfment rate of an abnormally growing grain (Rg) for a pinning grain with a radius of Rp can be expressed by Equation (2).
The migration rate vsg of the bulged grain boundary between pinning grains can be expressed by Equation (3).
Rgp is related to the size of the abnormally growing grain and the fraction of pinning grains. For a grain-size distribution f(D), grains larger than a critical diameter Dp are treated as potential pinning grains, and their fraction F(Dp) is expressed by Equation (4).
According to topological studies [23], in a matrix with an average grain radius of Rc, the number n of matrix grains around an abnormally growing grain with a radius of Rg can be approximately calculated using Equation (5).
where kg is the relative grain size coefficient, kg = Rg/Rc. Combining Equations (4) and (5), the number np of pinning grains above Dp around an abnormally growing grain can be expressed by Equation (6).
The radius of curvature Rgp of the locally bulged grain boundary can be expressed by Equation (7).
The model assumes that grains of different sizes are randomly distributed and that the pinning grains encountered along the boundary of an abnormally growing grain can be represented by an equal-spacing mean-field approximation. This approximation converts the calculated number of pinning grains into the characteristic angle θ used in Equation (7). It neglects clustering, local texture correlations, and variations in the spacing of individual obstacles.
In summary, the characteristic curvature radius Rgp of the locally bulged boundary between adjacent pinning grains is given by Equation (9). The EBSD measurements used to estimate grain sizes and neighbor counts are two-dimensional sections, whereas the actual grains and migrating boundaries are three-dimensional. The calculation therefore treats two-dimensional equivalent radii and neighbor statistics as mean-field proxies for their three-dimensional counterparts. Sectioning and stereological effects may bias both the apparent size and the apparent number of pinning grains; consequently, the calculated critical sizes and growth rates should be interpreted as approximate trends rather than exact three-dimensional predictions.
4.3. Critical Size of Pinning Grains
Whether amatrix grain of radius Ri acts as a pinning grain is evaluated by comparing two competing timescales. The engulfment time is ts = 2Ri/vs, where vs is the rate at which the abnormal grain consumes the matrix grain. The bulging time is tb = 2Ri/vb, where vb is the migration rate of the boundary segments on both sides of the matrix grain. Their ratio, ts/tb = vb/vs, measures whether lateral boundary bulging develops substantially before engulfment is completed. Following the geometric obstruction criterion of Rajmohan and Szpunar [20], GBH/GCL > 0.5 is represented here by the operational approximation ts/tb > 2. This threshold is a model idealization rather than a universal constant and depends on the assumed boundary geometry.
At ts/tb = 2, the matrix-grain radius is defined as the critical pinning radius Rp. Substitution of the engulfment and bulging rates from Equations (2) and (3), followed by use of the geometrical relation for Rgp in Equation (9), gives Equations (10) and (11). Grains with Ri > Rp are classified as potential pinning grains within this model. The criterion applies to the early-stage, isolated-obstacle geometry represented in Figure 4; it does not explicitly describe clustered obstacles, boundary impingement, or evolving inhibitor particles.
Equation (11) shows that the critical pinning radius Rp (Dp = 2Rp) is jointly determined by the characteristic bulging radius Rgp, the abnormal-grain radius Rg, the average matrix-grain radius Rc, the pinning force Z, and the relative grain-boundary energy coefficient e. Maazi et al. [24] reported a related critical-size concept for island grains formed after secondary recrystallization, in which the critical size depends on the size and volume fraction of second-phase particles.
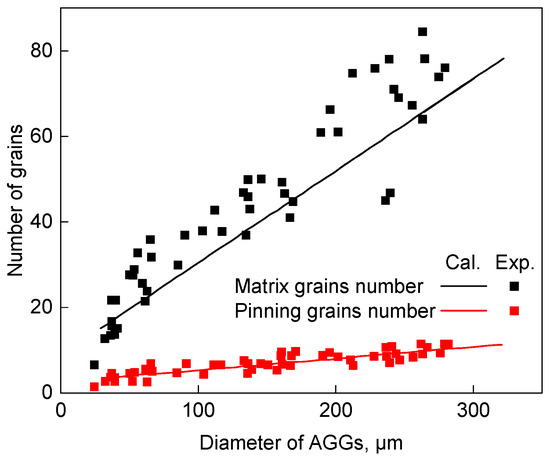
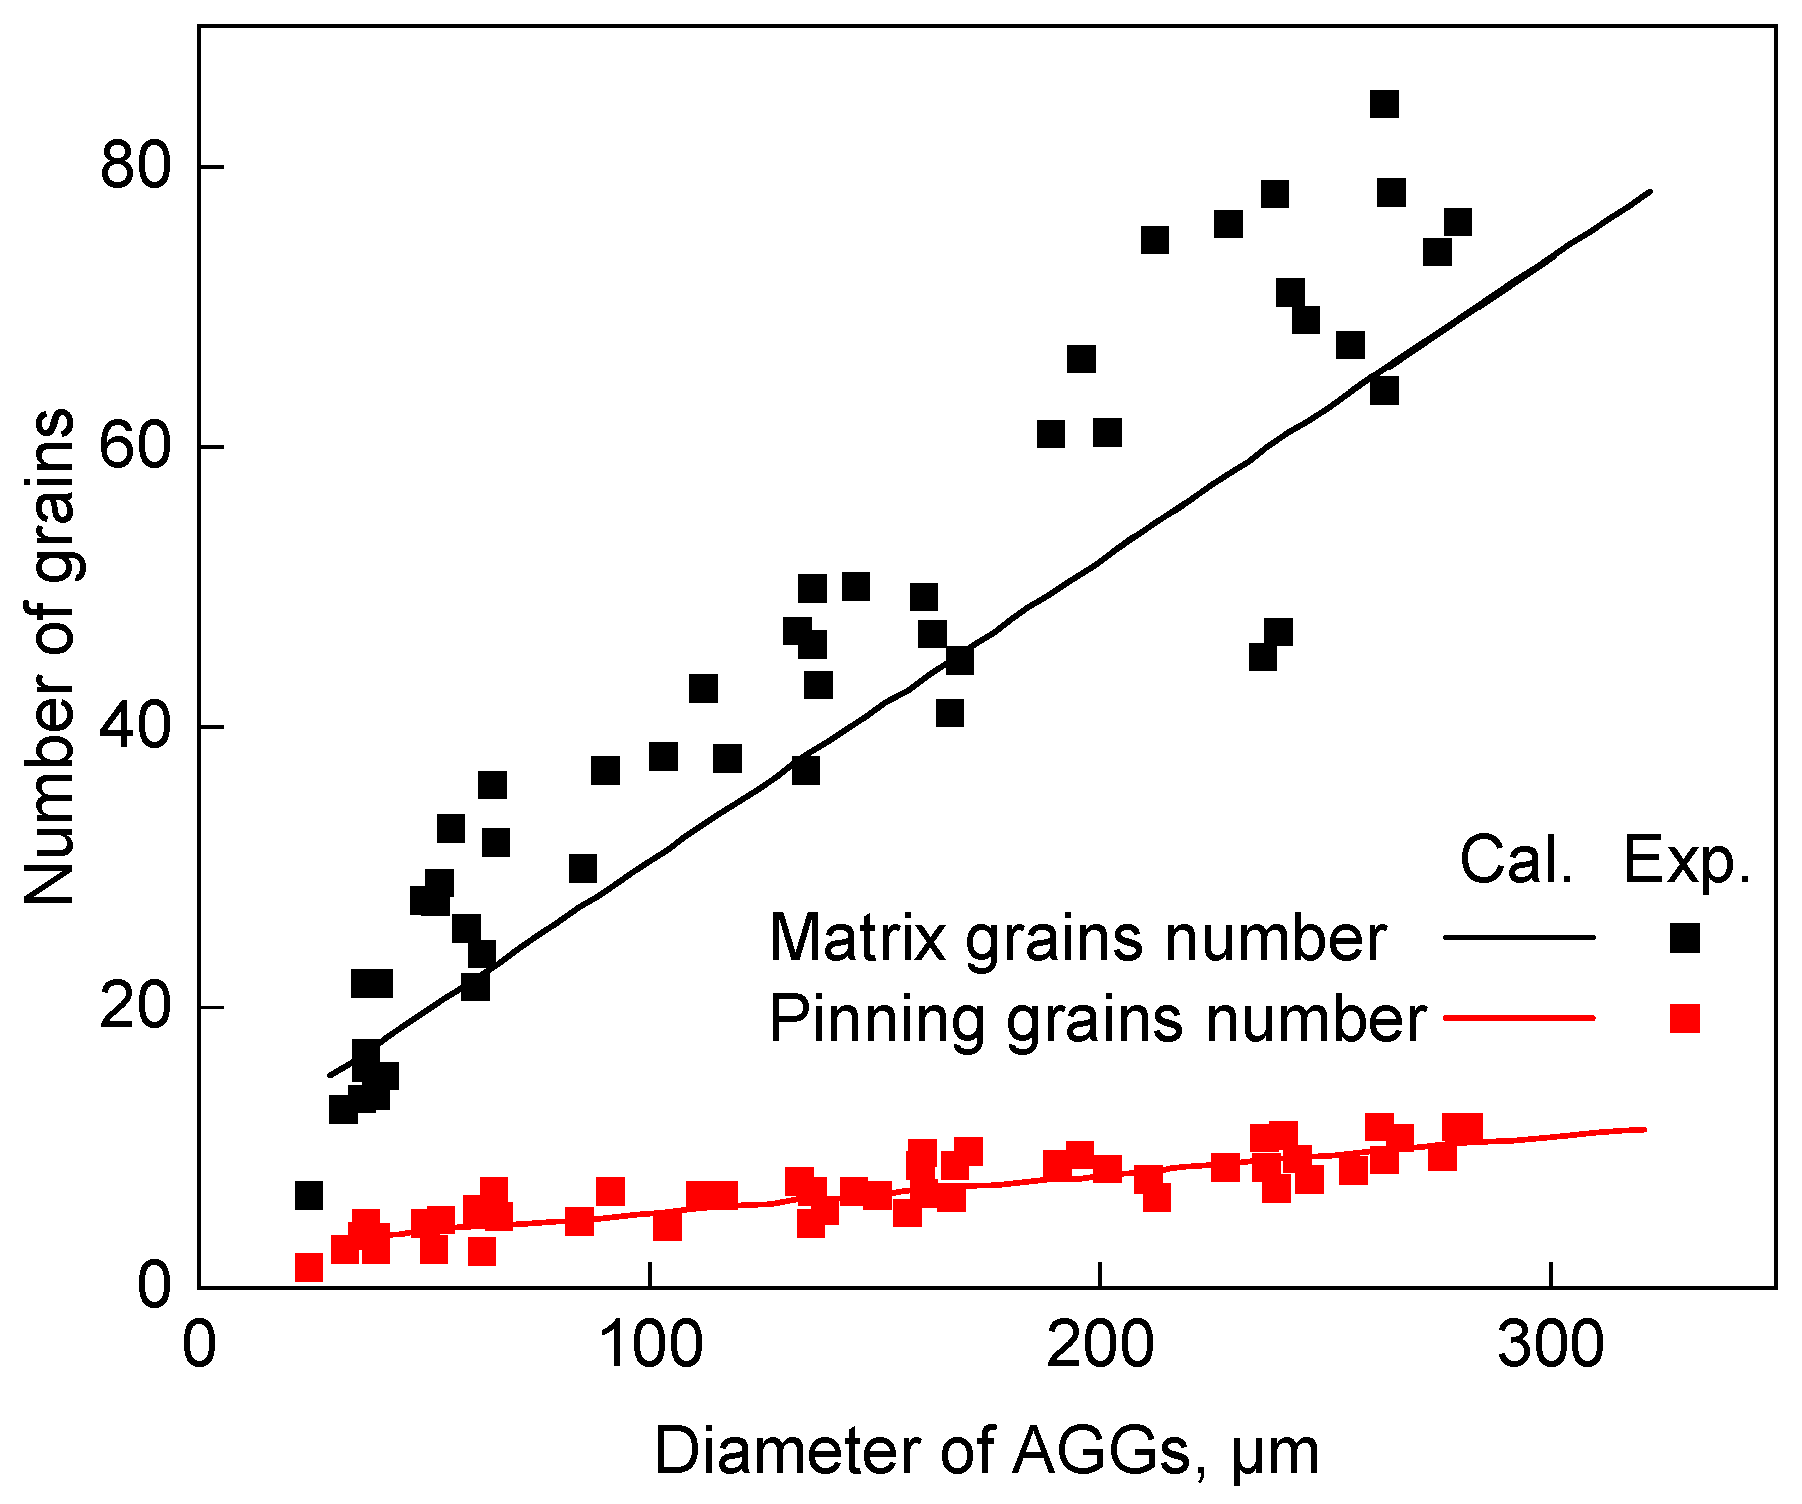
The source record describes several tens of abnormally growing grains spanning different sizes. For each available two-dimensional observation, surrounding matrix grains were counted, and grains satisfying Ri > Rp according to Equation (11) were classified as potential pinning grains. These counts were compared with Equations (5) and (6) in Figure 5. In contrast to the >3000-grains dataset used for the overall matrix size distribution, Figure 5 comparison is case-based: the exact number of independent fields and abnormal-grain cases, the repeat structure, and case-level uncertainty were not retained. It is therefore treated as descriptive support rather than statistically independent validation.
Figure 5.
Numbers of surrounding matrix grains and potential pinning grains obtained from the available two-dimensional observations and model calculations. Solid curves represent Equations (5) and (6); symbols represent observed cases, with potential pinning grains classified by Ri > Rp from Equation (11). The source record describes several tens of abnormal grains, but an exact independent sample count and repeat-level uncertainty are unavailable; error bars cannot therefore be reconstructed.
4.4. Critical Condition for Secondary Recrystallization Considering Grain Pinning
The abnormal grain growth criterion can be characterized by Equation (12). Abnormal grain growth occurs when C > 0.
This criterion requires the radii and growth rates of the abnormally growing grain and the average matrix grain. Rios [25] expressed the growth rate of the average grain radius Rc as Equation (13).
where kZ = ZRc is the pinning-force coefficient. Substitution of the weighted-average growth-rate expression, the pinning-grain model in Equations (2) and (3), and Equation (13) into Equation (12) gives the secondary-recrystallization indices C1 and C2 in Equations (14) and (15), respectively. C1 > 0 or C2 > 0 indicates that abnormal growth is permitted by the corresponding model.
where kg = Rg/Rc is the relative grain-size coefficient. The critical conditions in both models depend on kg, the relative grain-boundary energy coefficient e, and the pinning-force coefficient kZ. The distinguishing term in C2 is Rc/Rp, which represents the obstruction by the large-grain tail of the distribution. Because Rc/Rp < 1, C2 > 0 is more restrictive than C1 > 0 under otherwise identical parameters. The weighted-average expression C1 does not explicitly retain the dispersion of the grain-size distribution.
4.5. Case-Based Comparison of the Secondary-Recrystallization Kinetic Models
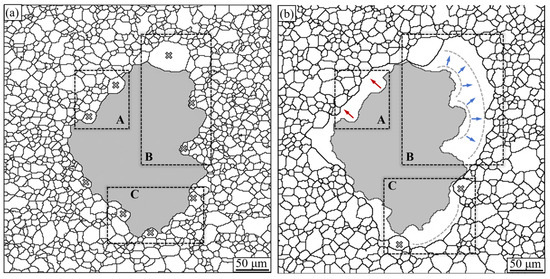
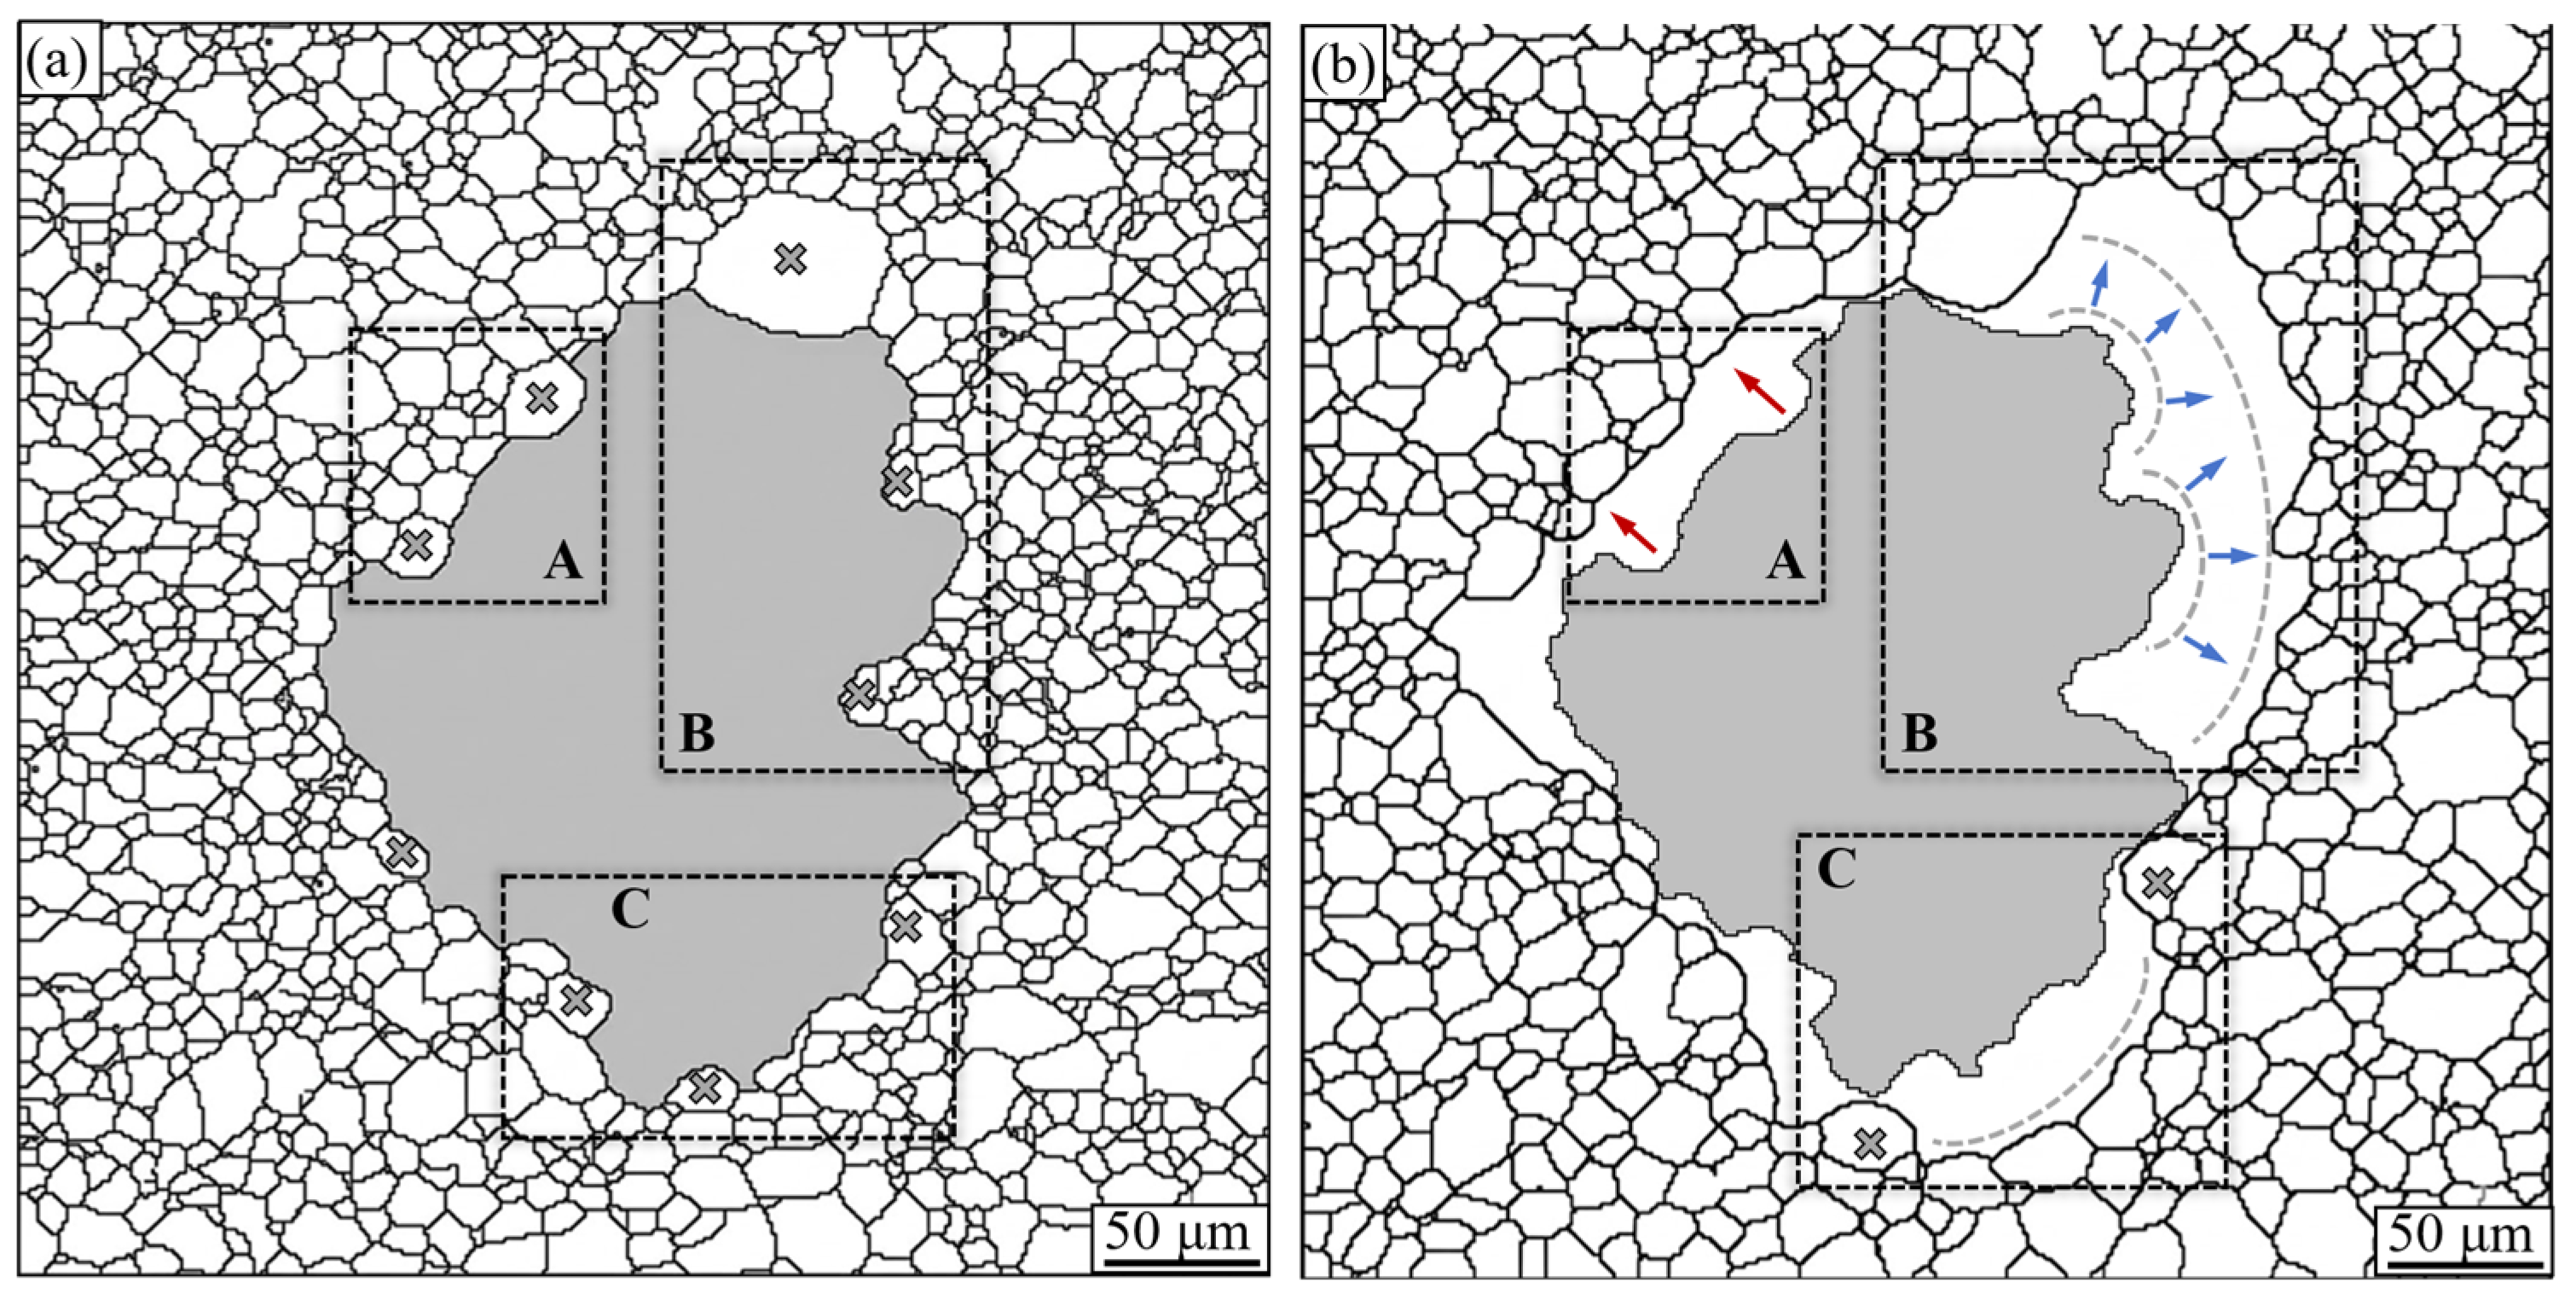
Figure 6 shows quasiinsitu observations of the same abnormal grain before and after an additional 100 s hold at 1000 °C. At the first observation, the grain had an equivalent size of approximately 220 μm and exhibited an anisotropic boundary morphology. Matrix grains marked with × satisfy the model-based size condition for potential pinning grains, and local bulging is visible between several of these grains. Differences in bulging morphology at different boundary positions indicate different stages in the competition between engulfment and lateral boundary migration.
Figure 6.
Quasiinsitu TD-RD grain-boundary maps of the same abnormal grain and its surrounding matrix: (a) after slow heating to 1000 °C; (b) after a further 100 s hold at 1000 °C. In (b), the shaded region reproduces the grain morphology in (a), and the outer boundary shows the later state. The × symbols identify matrix grains satisfying the model-based critical-size condition; dashed boxes A–C identify the boundary segments discussed in the text, and arrows mark representative directions of local boundary migration. Scale bars are 50 μm.
After further holding for 100 s, the secondary recrystallized grain grew to approximately 280 μm. In the region marked A, the original two pinning grains were engulfed and the grain boundary continued to move forward. In region B, the two pinning grains were completely engulfed after holding, and the front of the abnormally growing grain encountered new pinning grains. In region C, some pinning grains remained pinned, and new pinning grains also appeared at the grain boundary front.
Using the grain-pinning model and the size convention of the original calculation, the nominal growth rate for this secondary recrystallized grain was approximately 0.47 μm/s, corresponding to a calculated size increment of 47 μm over 100 s. The measured equivalent grain size increased from approximately 220 to 280 μm, giving a nominal increment of approximately 60 μm. Under the same parameter set, the weighted-average model predicted an increment of 171 μm. The pinning-model value is therefore closer to this single measured increment, but the comparison does not constitute an uncertainty-based or statistically independent validation.
5. Kinetic Analysis and Multi-Factor Matching of Secondary Recrystallization
5.1. Growth Rate Considering the Grain-Pinning Effect
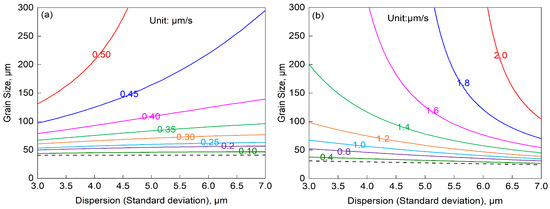
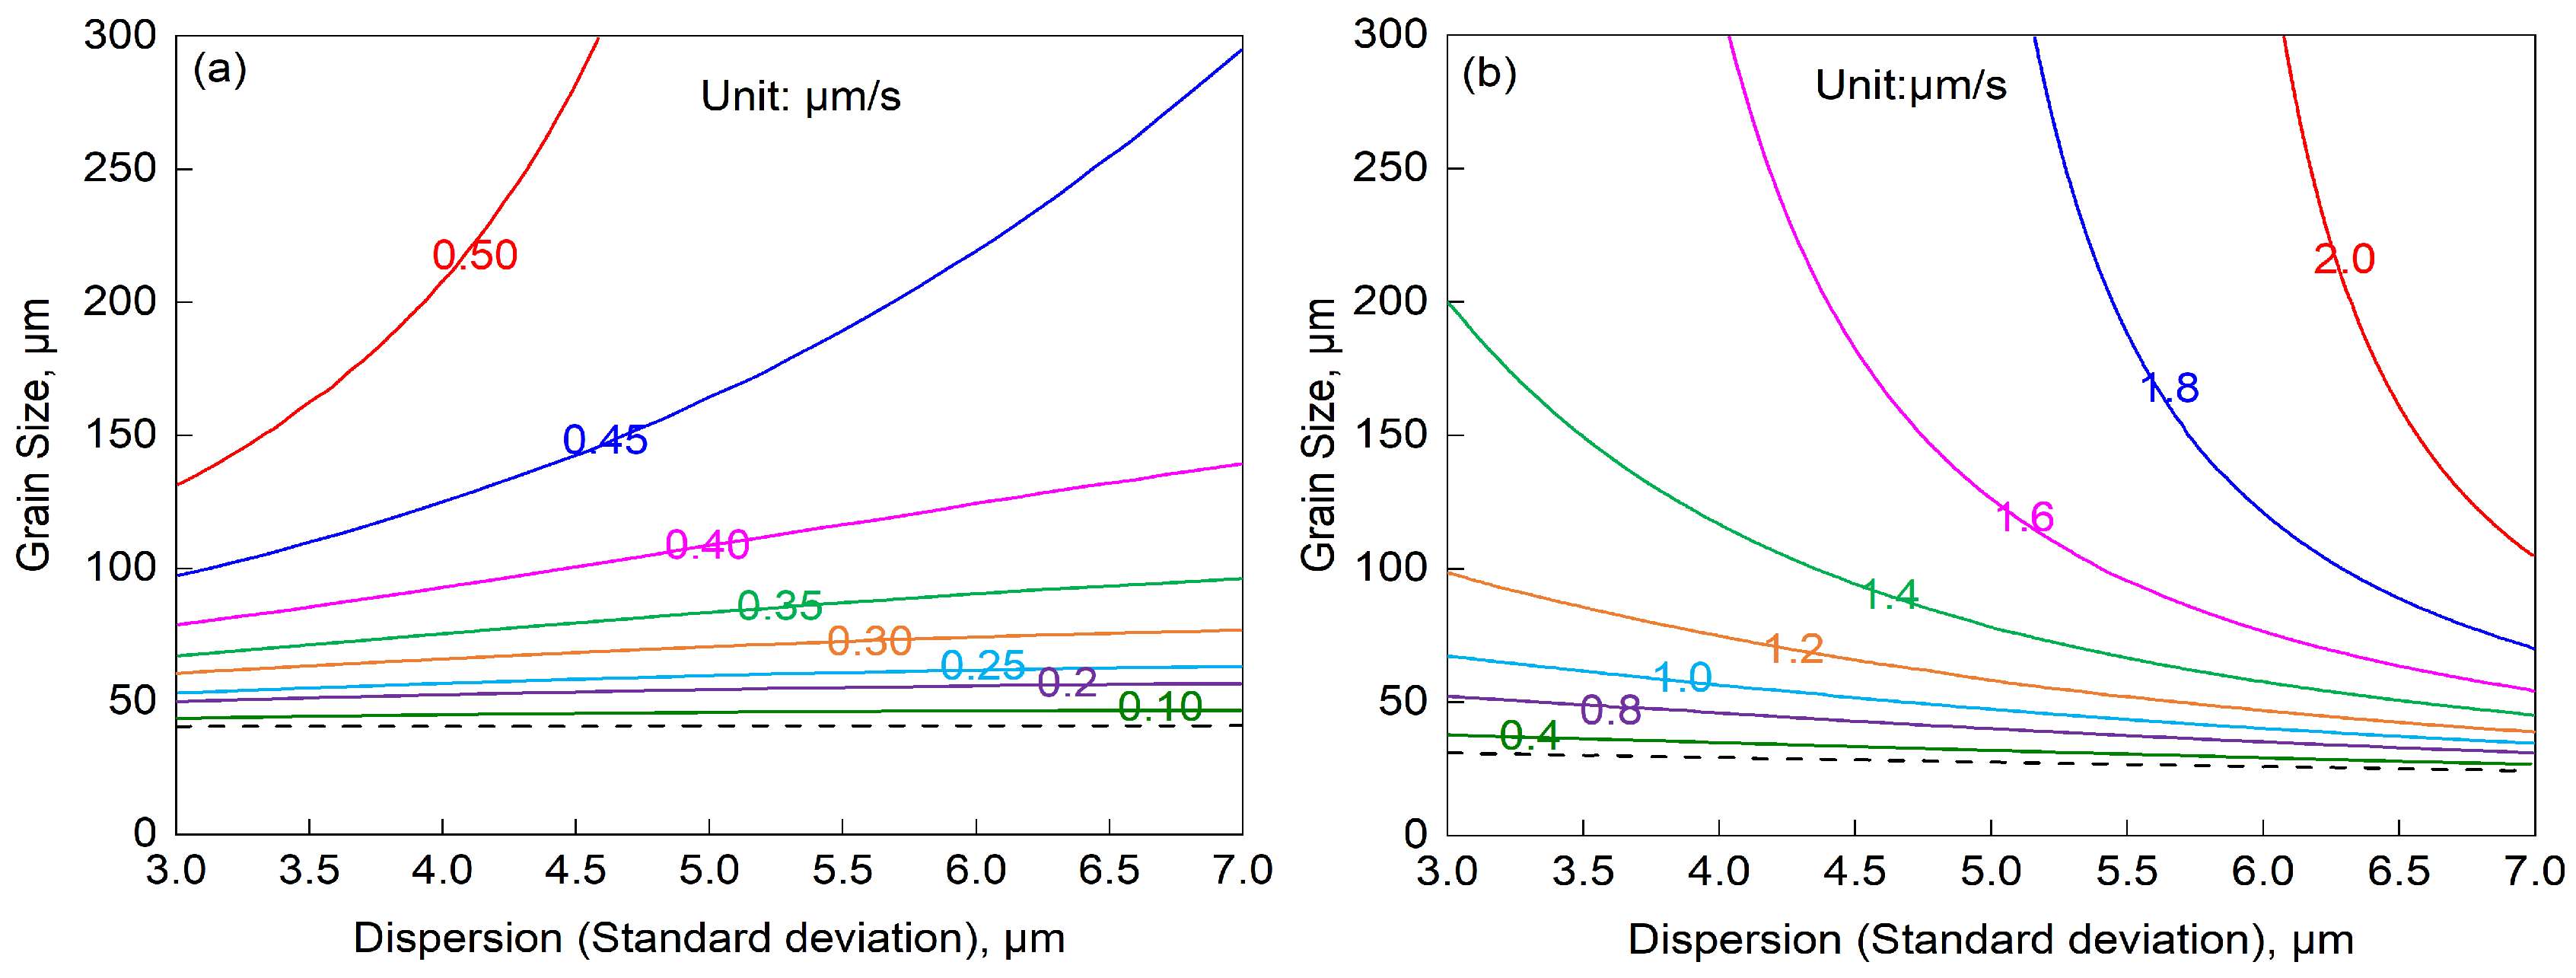
According to the grain-pinning model and the critical-size expression, dispersion of the matrix grain-size distribution is a sensitive model input. For distributions with Dc = 12 μm and c = 3, 5, and 7 μm, growth rates at TSR = 1000 °C were calculated to examine the effect of matrix dispersion, as shown in Figure 7a. For comparison, Figure 7b presents the weighted-average-model calculations under the same parameter set.
Figure 7.
Calculated grain-growth-rate contours as a function of matrix grain-size dispersion during annealing at 1000 °C: (a) grain-pinning model; (b) weighted-average model. Numerical labels on the colored contours give the calculated growth rate in μm/s. The black dashed curves denote the corresponding critical growth conditions; growth is permitted in the regions above the dashed curves.
The two models differ both in the critical boundary and in their dependence on matrix grain-size dispersion. Their growth rates must therefore be compared at identical parameter coordinates rather than through a general statement that either model always predicts a higher rate. At the specific parameter point used for Figure 6 case comparison, the grain-pinning model predicts the smaller nominal increment (47 μm), whereas the weighted-average model predicts 171 μm; the former is closer to the measured increment of approximately 60 μm.
In the weighted-average kinetic model, grains with sizes < 2Dc can have growth capability, and the critical grain size for growth tends to decrease gradually as matrix dispersion increases. By comparison, when grain pinning is considered, only grains with sizes > 2.5Dc can grow, and the critical size shows a slight increasing trend with increasing matrix dispersion. According to the weighted-average kinetic model, when stable second-phase particles are present, only large grains (>2Dc) can undergo grain growth [26]. In the matrix microstructure shown in Figure 1, grains larger than 2Dc account for approximately 1.5%, and abnormal growth of these large grains would reduce microstructural uniformity. However, the microstructure before secondary recrystallization in Figure 1a is stable. In Figure 1, grains larger than 2.5Dc account for approximately 1‰. According to the grain-pinning kinetic model, these grains can only grow slowly at the early stage of abnormal growth, which is consistent with the microstructural state before secondary recrystallization.
As matrix grain-size dispersion increases, the growth rate calculated using the grain-pinning model decreases, whereas that calculated using the weighted-average model increases. At the same Dc, the fractions of both large and small grains increase with dispersion; consequently, the two models respond differently to the two distribution tails. The weighted-average model is more sensitive to the increasing fraction of small grains and does not retain the local obstruction associated with individual large grains. It can therefore provide a reasonable description when large grains are insufficient to produce appreciable local pinning. The grain-pinning model retains both the promoting contribution of small grains and the obstructing contribution of the large-grain tail. Under the present assumptions, this gives a more explicit description of early-stage local obstruction, but the available observations are insufficient to establish generally superior predictive accuracy.
5.2. Multi-Factor Matching Considering Grain Pinning
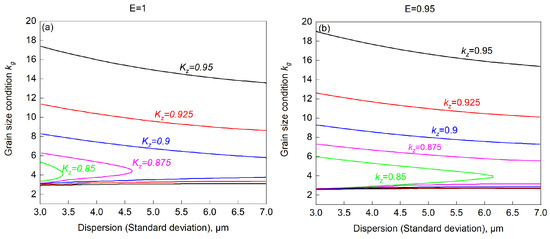
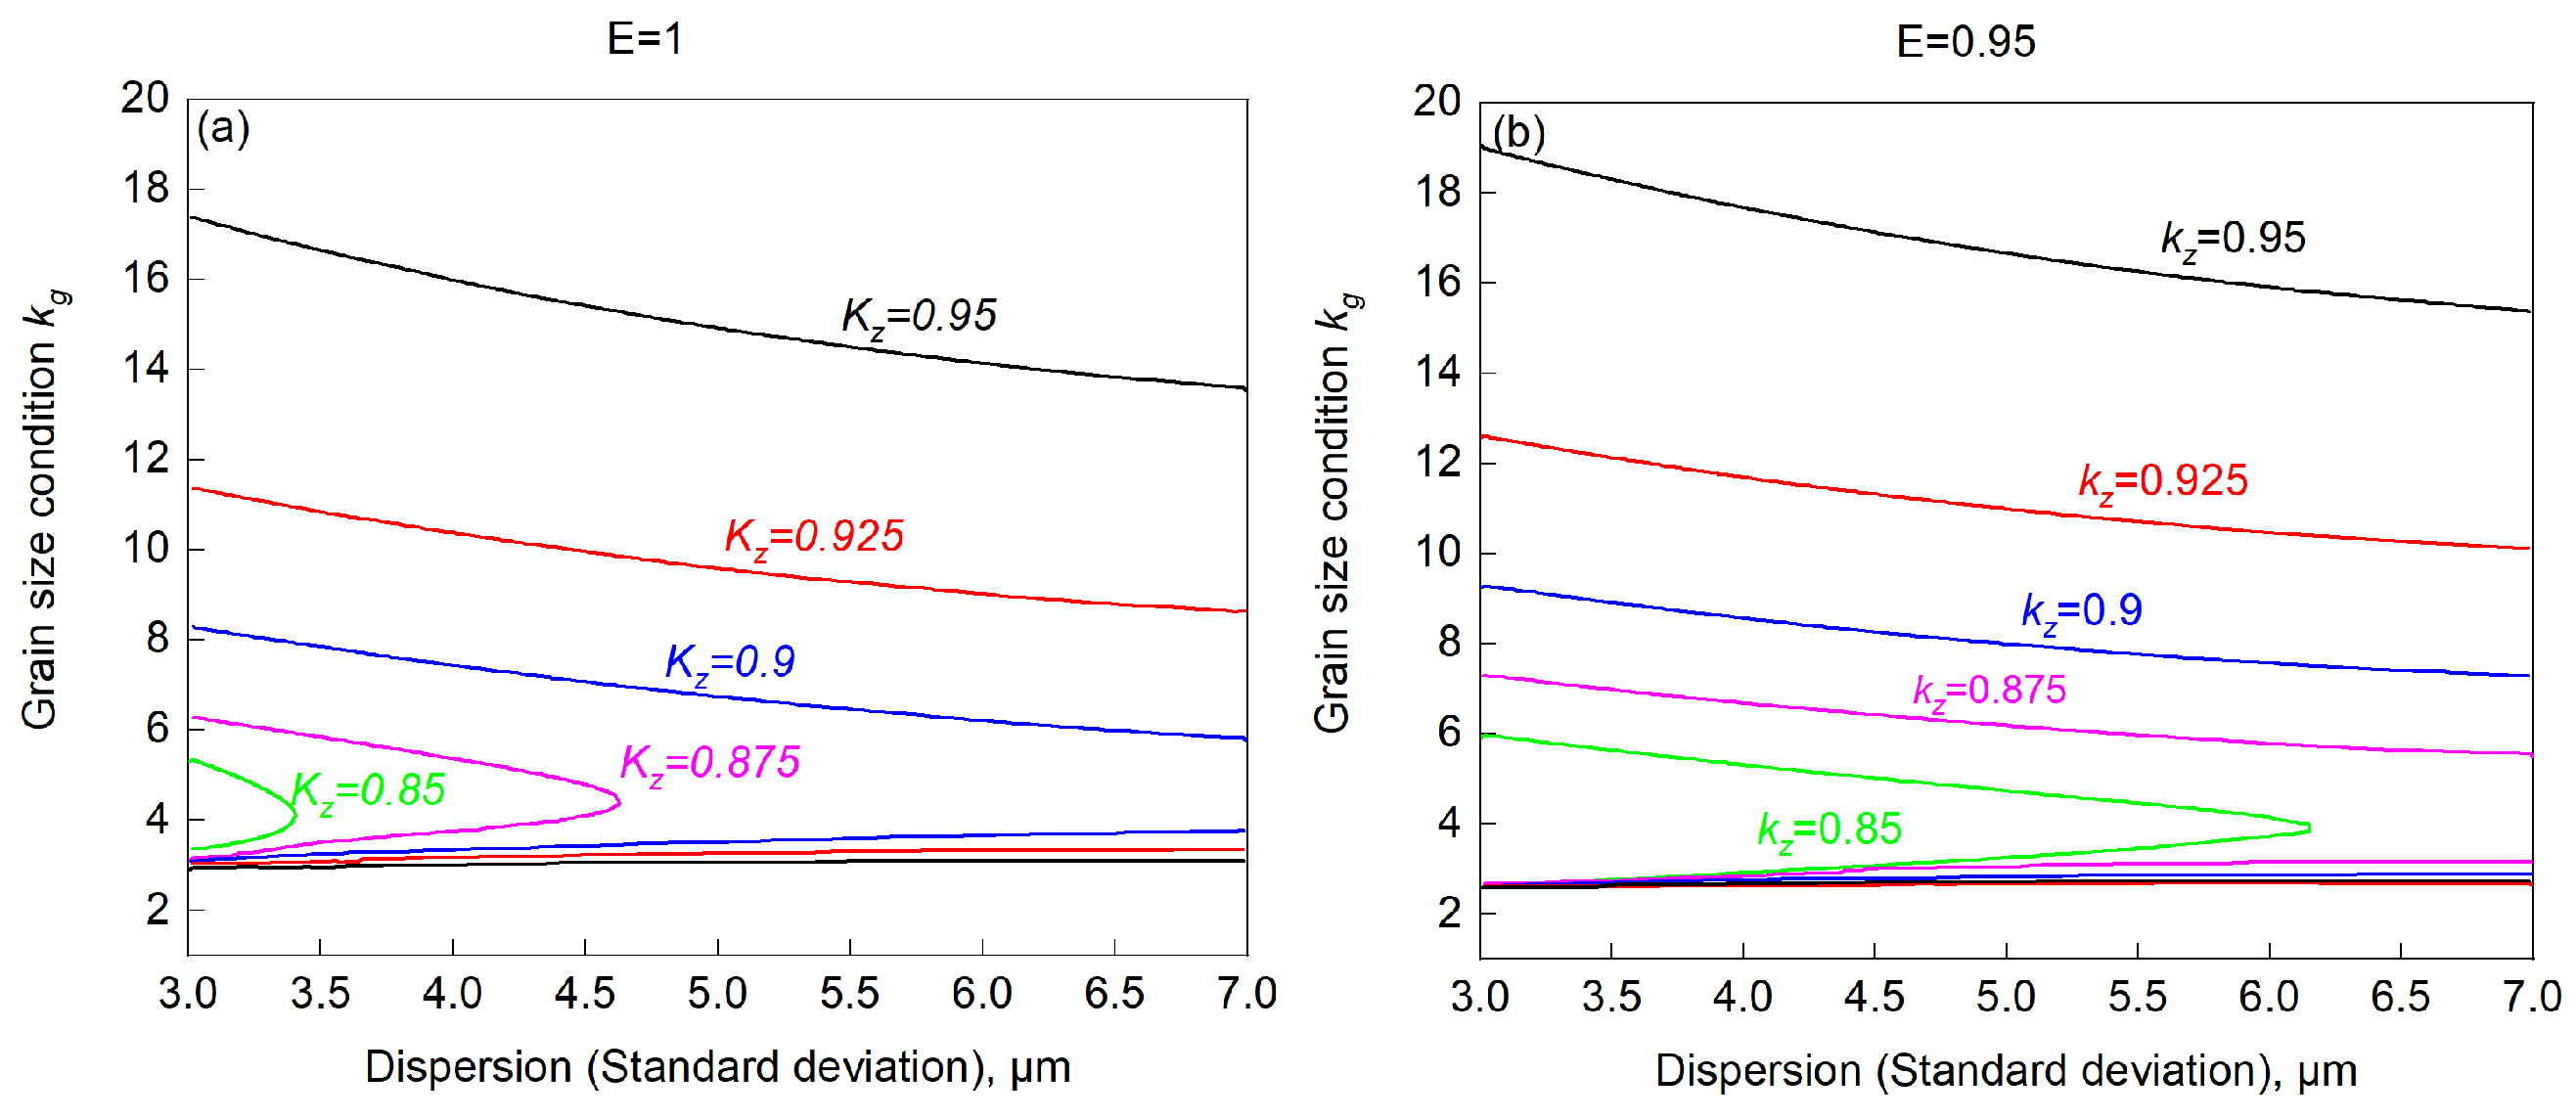
Using the C2 expression, the model-derived dependence of the secondary-recrystallization condition on multiple parameters can be examined. Figure 8 gives the calculated critical conditions for Dc = 12 μm. The plotted dimensionless pinning-force coefficients are kZ = 0.85, 0.875, 0.900, 0.925, and 0.950. This interval was selected in the original analysis as a sensitivity sweep across different effective pinning levels and is not an experimentally calibrated range for the present steel. For each kZ, the region enclosed by the two branches of the same color satisfies C2 > 0; points outside that region satisfy C2 < 0.
Figure 8.
Model-derived critical conditions for secondary recrystallization as a function of matrix grain-size dispersion: (a) e = 1; (b) e = 0.95. Each colored pair corresponds to one dimensionless kZ value (0.85, 0.875, 0.900, 0.925, or 0.950); the region enclosed by the paired branches satisfies C2 > 0. The e = 0.95 panel is a representative sensitivity case. These regions are model predictions rather than experimentally established processing windows.
Figure 8a shows the model-derived critical condition for abnormal growth of randomly oriented grains (e = 1). Whether secondary recrystallization is predicted to occur is sensitive to the matrix grain-size dispersion. When kZ = 0.85, the model permits abnormal growth only at relatively small dispersion. When kZ = 0.9, increasing c from 4 to 6 μm raises the calculated critical abnormal-grain size from approximately 3Dc to 3.5Dc. As kZ increases further, the calculated dependence on dispersion weakens and the critical size approaches approximately 2.5Dc.
The relative grain-boundary energy coefficient for a boundary-energy advantage is e < 1. Figure 8b uses e = 0.95 to represent a modest 5% boundary-energy advantage as a sensitivity case, not a value fitted to or independently measured in the present experiments. Relative to the reference case e = 1 in Figure 8a, the calculation predicts a broader C2 > 0 region for the same kZ and matrix dispersion. At high dispersion, the lower critical size approaches approximately 2Dc in the e = 0.95 scenario, compared with approximately 2.5Dc for e = 1, and the calculated upper limit of kg is higher. These differences are model predictions about the possible effect of a modest grain-boundary-energy advantage.
The calculations suggest that matrix grain-size dispersion may interact with pinning force, relative grain-boundary energy, and initial grain size to modify the predicted C2 > 0 region. The relative shift between Figure 8a and Figure 8b suggests that a lower e may permit abnormal growth over a wider range of model coordinates, but no processing window is established by the present experiments. The e = 0.95 case and the plotted kZ sweep are representative model inputs rather than independently calibrated parameters for this steel. The calculations further assume a lognormal matrix distribution, constant effective kZ and e, random and equally spaced pinning grains in a mean-field sense, and an early-stage geometry before extensive grain impingement. Evolution of inhibitor particles, temperature-dependent grain-boundary mobility, spatial clustering, and later-stage texture evolution are not explicitly included. Validation is limited to one Fe-3.25 wt.% Si high-permeability steel and one annealing condition; application to conventional GO steel, other Hi-B steels, different temperatures or heating rates, and later stages requires additional experiments.
5.3. Limitations and Scope
The experimental validation is limited to one Fe-3.25 wt.% Si high-permeability steel and one interrupted annealing schedule. Although more than 3000 grains from multiple independent regions were included in the matrix grain-size distribution, the original grain-level dataset, individual EBSD map areas, exact number of fields, independent repeat experiments, and repeat-level uncertainty are unavailable. Error bars, confidence intervals, alternative-distribution fitting, and a statistical repeatability assessment therefore cannot be reconstructed. Figure 5 comparison is likewise case-based because the exact independent sample count and scatter were not retained. Cooling, specimen transfer, reheating, and coordinate-based relocation may also affect the quasi in situ comparison, even though no repolishing was performed between the two Figure 6 observations.
The model uses two-dimensional ECD values, neighbor counts, and boundary sections as mean-field proxies for an inherently three-dimensional process. It assumes a lognormal matrix distribution, random and equally spaced potential pinning grains, constant effective kZ and e, and an early-stage geometry before extensive impingement. Spatial clustering, three-dimensional connectivity, local texture correlations, evolving inhibitor particles, temperature-dependent grain-boundary mobility, and later-stage texture evolution are not explicitly resolved. The separate numerical values and sources of α, m, γ, and Z used in the original absolute-rate calculation are not retained; e = 0.95 and kZ = 0.85–0.95 are therefore presented only as model sensitivity cases, not independently calibrated material constants.
Accordingly, the numerical proximity between the pinning-model prediction and the single tracked-grain increment should not be interpreted as a general accuracy metric. Application to conventional GO steels, other Hi-B compositions, different temperatures or heating rates, alternative grain-size distributions, and middle or late stages of secondary recrystallization requires new experiments with independent repeats, retained EBSD metadata and grain-level data, uncertainty analysis, and independently documented model parameters.
6. Conclusions
- (1)
- Direct quasi in situ observation of an abnormal grain at 1000 °C showed local boundary bulging and delayed engulfment in the vicinity of large matrix grains. Within the available two-dimensional fields, these observations support the interpretation that large matrix grains can act as local obstacles during the early stage of secondary recrystallization.
- (2)
- Based on this observation, a critical-size criterion and a kinetic model incorporating the large-grain tail of the matrix grain-size distribution were developed. For the single tracked grain, the grain-pinning model gave a nominal 47 μm increment over 100 s, closer to the approximately 60 μm measured increment than the 171 μm obtained from the weighted-average model under the same parameter set. This numerical proximity is case-based because independent repeatability and uncertainty statistics are unavailable.
- (3)
- Model calculations predict that grain-size dispersion interacts with pinning force, relative grain-boundary energy, and initial grain size to modify the early-stage abnormal-growth condition. These trends are hypotheses for future testing, not a validated route for industrial control. Repeated experiments, complete uncertainty statistics, independently documented model parameters, additional steels and annealing schedules, alternative size distributions, and later growth stages remain necessary for validation.
Author Contributions
Conceptualization, F.Z. and H.Z.; methodology, Y.X., Z.X., H.Z. and Y.S.; validation, Y.X., Z.X. and H.Z.; formal analysis, Y.X., Z.X. and H.Z.; investigation, Y.X., Z.X. and H.Z.; resources, F.Z. and Y.S.; data curation, Z.X. and H.Z.; writing—original draft preparation, H.Z.; writing—review and editing, F.Z., Y.X., Z.X. and Y.S.; visualization, H.Z.; supervision, F.Z.; project administration, F.Z. All authors have read and agreed to the published version of the manuscript.
Funding
This research was funded by the National Natural Science Foundation of China, grant number 52371022.
Data Availability Statement
The original contributions presented in this study are included in the article. Further inquiries can be directed to the corresponding author.
Conflicts of Interest
The authors declare no conflicts of interest. The funders had no role in the design of the study; in the collection, analyses, or interpretation of data; in the writing of the manuscript; or in the decision to publish the results.
References
- Rios, P.R. Abnormal grain growth development from uniform grain size distributions. Acta Mater. 1997, 45, 1785–1789. [Google Scholar] [CrossRef] [Scilit]
- Rios, P.R. Abnormal grain growth development from uniform grain size distributions due to a mobility advantage. Scr. Mater. 1998, 38, 1359–1364. [Google Scholar] [CrossRef] [Scilit]
- Shimizu, R.; Harase, J. Coincidence grain boundary and texture evolution in Fe-3% Si. Acta Metall. 1989, 37, 1241–1249. [Google Scholar] [CrossRef] [Scilit]
- Yoshitomi, Y.; Ushigami, Y.; Harase, J.; Nakayama, T.; Masui, H.; Takahashi, N. Coincidence grain boundary and role of primary recrystallized grain growth on secondary recrystallization texture evolution in Fe-3% Si alloy. Acta Metall. Mater. 1994, 42, 2593–2602. [Google Scholar] [CrossRef] [Scilit]
- Kumano, T.; Haratani, T.; Ushigami, Y. The relationship between primary and secondary recrystallization texture of grain-oriented silicon steel. ISIJ Int. 2002, 42, 440–449. [Google Scholar] [CrossRef] [Scilit]
- Kumano, T.; Ushigami, Y. Grain boundary characteristics of isolated grains in conventional grain-oriented silicon steel. ISIJ Int. 2007, 47, 890–897. [Google Scholar] [CrossRef] [Scilit][Green Version]
- Gubernatorov, V.V.; Sokolov, B.K.; Sbitnev, A.K. On texture formation in metals during recrystallization. I. Texture effect on grain growth relative rate. Phys. Met. Metallogr. 1996, 81, 261–267. [Google Scholar]
- Hayakawa, Y.; Szpunar, J.A. The role of grain boundary character distribution in secondary recrystallization of electrical steels. Acta Mater. 1997, 45, 1285–1295. [Google Scholar] [CrossRef] [Scilit]
- Rajmohan, N.; Szpunar, J.A.; Hayakawa, Y. Role of fractions of mobile grain boundaries in secondary recrystallization of Fe-Si steels. Acta Mater. 1999, 47, 2999–3008. [Google Scholar] [CrossRef] [Scilit]
- Morawiec, A. Grain misorientations in theories of abnormal grain growth in silicon steel. Scr. Mater. 2000, 43, 275–278. [Google Scholar] [CrossRef] [Scilit]
- Yilmaz, C.; Poul, M.; Lahn, L.; Raabe, D.; Zaefferer, S. Dislocation-assisted particle dissolution: A new hypothesis for abnormal growth of Goss grains in grain-oriented electrical steels. Acta Mater. 2023, 258, 119170. [Google Scholar] [CrossRef] [Scilit]
- Ushigami, Y. Theoretical analysis and computer simulation of secondary recrystallization in grain-oriented silicon steel. Nippon Steel Tech. Rep. 2013, 102, 25–30. [Google Scholar]
- Ushigami, Y.; Arira, Y.; Ushioda, K. Orientation selectivity of secondary recrystallization in grain-oriented silicon steel. Mater. Sci. Forum 2013, 753, 337–340. [Google Scholar] [CrossRef] [Scilit]
- DeCost, B.L.; Holm, E.A. Phenomenology of abnormal grain growth in systems with nonuniform grain boundary mobility. Metall. Mater. Trans. A 2017, 48, 2771–2780. [Google Scholar] [CrossRef] [Scilit]
- De, P.S.; Vadlamani, S.S.; Vedantam, S. Role of grain boundary energy on particle-dissolution-induced abnormal grain growth. Scr. Mater. 2024, 247, 116098. [Google Scholar] [CrossRef] [Scilit]
- Ko, K.J.; Cha, P.R.; Srolovitz, D.J.; Hwang, N.M. Abnormal grain growth induced by sub-boundary-enhanced solid-state wetting: Analysis by phase-field model simulations. Acta Mater. 2009, 57, 838–845. [Google Scholar] [CrossRef] [Scilit]
- Jain, V.; Modak, P.; Patra, S.; Ghosh, A. Origin of Goss texture in grain-oriented electrical steel: Role of shear bands. Materialia 2022, 22, 101398. [Google Scholar] [CrossRef] [Scilit]
- Etter, A.L.; Baudin, T.; Penelle, R. Influence of the Goss grain environment during secondary recrystallisation of conventional grain-oriented Fe-3% Si steels. Scr. Mater. 2002, 47, 725–730. [Google Scholar] [CrossRef] [Scilit]
- Abbruzzese, G.; Lücke, K. A theory of texture-controlled grain growth—I. Derivation and general discussion of the model. Acta Metall. 1986, 34, 905–914. [Google Scholar] [CrossRef] [Scilit]
- Nes, E.; Ryum, N.; Hunderi, O. On the Zener drag. Acta Metall. 1985, 33, 11–22. [Google Scholar] [CrossRef] [Scilit]
- Wang, N.; Wen, Y.; Chen, L.Q. Pinning force from multiple second-phase particles in grain growth. Comput. Mater. Sci. 2014, 93, 81–85. [Google Scholar] [CrossRef] [Scilit]
- Rajmohan, N.; Szpunar, J.A. An analytical method for characterizing grain boundaries around growing Goss grains during secondary recrystallization. Scr. Mater. 2001, 44, 2387–2392. [Google Scholar] [CrossRef] [Scilit]
- Lücke, K.; Brandt, R.; Abbruzzese, G. Normal and abnormal grain growth as transient phenomena. Interface Sci. 1998, 6, 67–76. [Google Scholar] [CrossRef] [Scilit]
- Maazi, N.; Rouag, N.; Etter, A.L.; Penelle, R.; Baudin, T. Influence of neighbourhood on abnormal Goss grain growth in Fe-3% Si steels: Formation of island grains in the large growing grain. Scr. Mater. 2006, 55, 641–644. [Google Scholar] [CrossRef] [Scilit]
- Rios, P.R. Abnormal grain growth development from uniform grain size distributions in the presence of stable particles. Scr. Mater. 1998, 39, 1725–1730. [Google Scholar] [CrossRef] [Scilit]
- Dana, Z.; Rios, P.R. On the topology and size advantage of potentially abnormal grains. Comput. Mater. Sci. 2018, 153, 382–391. [Google Scholar] [CrossRef] [Scilit]

Disclaimer/Publisher’s Note: The statements, opinions and data contained in all publications are solely those of the individual author(s) and contributor(s) and not of MDPI and/or the editor(s). MDPI and/or the editor(s) disclaim responsibility for any injury to people or property resulting from any ideas, methods, instructions or products referred to in the content. |
© 2026 by the authors. Licensee MDPI, Basel, Switzerland. This article is an open access article distributed under the terms and conditions of the Creative Commons Attribution (CC BY) license.